Embed Size (px)
Citation preview
Olympic Dam Expansion Supplementary Environmental Impact Statement 20101
APPENDIX J
SOCIAL ENVIRONMENT
CONTENTS
J1 Social management framework
J2 Andamooka social impact assessment
J3 Health data

Olympic Dam Expansion Supplementary Environmental Impact Statement 20101
Social management framework
APPENDIX J1
OLYMPIC DAM EXPANSION
SUPPLEMENTARY EIS
Draft Social Management Framework April 2011

COPYRIGHT BHP Billiton Olympic Dam Corporation Pty Ltd (BHP Billiton) is the sole owner of the intellectual property contained in any documentation bearing its name. All materials, including internet pages, documents and online graphics, audio and video, are protected by copyright law.
Apart from any fair dealing for the purposes of private study, research, criticism or review as permitted under the provisions of the Copyright Act 1968, no part of this document may be reproduced, transmitted in any form or re-used for any commercial purposes whatsoever without the prior written permission of BHP Billiton.
© 2011 BHP Billiton Olympic Dam Corporation Pty Ltd. All rights reserved.
NOTE:
This draft Social Management Framework has been prepared as information to support the Environmental Impact Statement for the proposed Olympic Dam Expansion Project, and is not to be relied on as final or definitive. It will continue to be developed and will be subject to change.
Draft Social Management Framework P 2 of 34 April 2011 Supplementary EIS
CONTENTS
1 INTRODUCTION 4 1.1 Purpose 4 1.2 Scope 4 1.3 Background - social impact assessment 5 1.4 Social management plan and framework 6 1.5 Responsibilities 6 1.6 Related documents 9 1.7 Definitions 9
2 LEGAL AND OTHER REQUIREMENTS 10 2.1 BHP Billiton documents and standards 10 2.2 Roxby Downs (Indenture Ratification) Act 10
3 OBJECTIVES AND ASSESSMENT CRITERIA 11
4 MONITORING AND REPORTING 14 4.1 Monitoring program 14 4.2 Reporting 15
5 APPENDICES 15 Appendix 1: Extent of potential social effects from the expansion of Olympic Dam 16 Appendix 2: Social Management Partnership Draft Terms of Reference 18 Appendix 3: Draft social indicators 19 Appendix 3.1: Community relations and community education 19 Appendix 3.2: Crime and anti-social behaviour 20 Appendix 3.3: Roxby Downs Draft Master Plan (Housing) 20 Appendix 3.4: Roxby Downs Draft Master Plan (Social services) 22 Appendix 3.5: Access and disturbance (desalination plant, visual amenity and
traffic and transport) 22 Appendix 3.6: Employment and training 24 Appendix 3.7: Economic development 25 Appendix 4: Community relations and community education activity plan 26
Draft Social Management Framework P 3 of 34 April 2011 Supplementary EIS
1 INTRODUCTION
1.1 Purpose
The Social Management Framework outlines how BHP Billiton and the South Australian Government, in collaboration with other stakeholders, would monitor, respond to, and report on, changes in social conditions as a result of the expansion of Olympic Dam. It provides a framework to maximise the social benefits and minimise the social impacts in Roxby Downs, Andamooka and other relevant communities. The Social Management Framework is provided as an appendix to the Olympic Dam Expansion Supplementary EIS for the purposes of discussion with the South Australian Government. The framework will be a ‘live’ document, updated and refined as necessary following discussions and commitments by both BHP Billiton and the State Government.
The Social Management Framework is intended to:
• ensure the effective, timely and consistent delivery of commitments, management actions/controls and other management measures by BHP Billiton and the South Australian Government during the construction, operation and closure of an expanded Olympic Dam
• identify a broad set of social indicators to measure and monitor the social effects of the expansion of Olympic Dam, including performance against social goals and outcomes, and trend indicators to help identify and assess emerging social issues and areas for further action by BHP Billiton, the State Government and other relevant stakeholders
• ensure social management arrangements adapt to changes in the social dynamics over time, and allow for strategies and actions to be proactively developed and implemented
• provide for reporting on the implementation and performance of the social management actions and the social effects from the expansion.
1.2 Scope
The Social Management Framework:
• Addresses the broad social effects identified in the social impact assessment undertaken for, and documented in, the Olympic Dam Expansion Draft EIS and Supplementary EIS, and other key effects or changes in social conditions that may emerge during the subsequent design, construction, operation and closure of Olympic Dam. It includes the social impact of constructing, operating and decommissioning off-site infrastructure, and effects that are statewide or have a long-term consequence for local or regional communities.
• Includes the expanded Olympic Dam construction and operational workforce (including on-site and off-site employees and contractors) and local, regional and statewide communities, landholders and businesses who may be affected by the expansion. This specifically includes:
the local communities of Roxby Downs, Andamooka and Woomera
regional communities close to infrastructure and transport corridors, including Port Augusta,
Point Lowly and Whyalla
other stakeholders who are directly affected by the expansion of Olympic Dam.
• Focuses on the construction phase of the expansion, recognising that the impacts associated with these activities may differ between communities and at different times. This is particularly so with the construction of off-site infrastructure and the transport of goods and materials.
• Includes the development of a Social Management Plan, which details:
the social goals, outcomes and indicators for the expansion of Olympic Dam, to which
BHP Billiton contributes either directly or indirectly
the delivery of commitments, controls/management actions and other social management
measures
Draft Social Management Framework P 4 of 34 April 2011 Supplementary EIS
the mechanisms for communicating and consulting with affected communities and stakeholders
contingency plans to respond to any unplanned escalation of social impacts or the realisation of
predicted social risks
the arrangements for updating and reviewing the Plan.
• Addresses the creation of a Social Management Partnership involving BHP Billiton, the South Australian Government and the community, to provide for joint or additional actions as appropriate in response to emerging social issues and requirements.
• Details the arrangements for monitoring and reporting on social goals, outcomes, indicators and management measures.
1.3 Background – social impact assessment
The Olympic Dam Expansion Draft EIS identified the potential social effects (both positive and negative) that may arise from the construction and operation of an expanded Olympic Dam. These effects relate to:
• the supply of labour for the expansion, new employment and business opportunities (direct and indirect), recruiting, retaining and training the workforce, skills shortages, competition for labour and labour drawdown
• crime and anti-social behaviour, and the fear of crime, that may arise from the larger population and a large, predominantly male, construction workforce
• the supply, choice and affordability of housing to meet increased and diverse demands
• the provision of social services and infrastructure to meet increased and diverse demands
• social character and well-being, including changes to community identity as a result of population growth, greater numbers of long distance commuters (LDCs) and overseas workers, a large construction workforce, the critical mass required to support different lifestyles, cultures, services and opportunities, and community participation and engagement
• access, disturbance and delays from increased road traffic, and effects on landholder amenity from constructing and operating off-site infrastructure.
The social impacts and benefits from the expansion of Olympic Dam are likely to be wide-ranging, and would vary across time and place. BHP Billiton has committed to a number of controls and management actions, in addition to existing management measures, to maximise the benefits and minimise the adverse impacts of the expansion. Appendix 1 outlines the broad social effects identified in the EIS, the predicted residual impacts (after management measures have been implemented) and the area (location) of potential impact or benefit. This information has been used to guide the development of indicators for future management attention.
While the Draft EIS identified and categorised the broad social effects predicted to arise from the expansion of Olympic Dam, it also noted the challenges of predicting social effects in general and specifically for the 40-year timeframe of the expansion. In addition, responsibility for some social matters lies outside of the authority of BHP Billiton, and cannot therefore be directly managed or controlled by BHP Billiton. To deal with these challenges, BHP Billiton committed to developing a Social Management Plan, including a set of indicators to monitor the social effects over time and place. The Draft EIS (Section 19.5.7) also indicated that the results of this monitoring would be publicly reported.
BHP Billiton recognises that some social issues may require other parties to act and, to this end, has proposed a Social Management Partnership between BHP Billiton, the South Australian Government and the community. In this respect, government and the community are key stakeholders in ensuring the full benefits of the expansion project can be realised, and the adverse impacts minimised.
Draft Social Management Framework P 5 of 34 April 2011 Supplementary EIS
Draft Social Management Framework P 6 of 34 April 2011 Supplementary EIS
1.4 Social management plan and framework
The Social Management Framework is a broad framework, within which the Social Management Plan and Social Management Partnership would be established. The relationship between the Social Management Plan and partnership and monitoring and reporting arrangements is illustrated in Figure 1.
The Plan forms part of the Olympic Dam Environmental Management System and provides information and direction on how specific social effects would be controlled and monitored. Specifically, the Plan:
• documents the social goals and desired outcomes for communities affected by the expansion and ongoing operations of Olympic Dam
• establishes programs for consulting and communicating with the community and other stakeholders on issues and opportunities arising from the expansion of Olympic Dam
• outlines how social commitments, controls and management actions and other management measures would be delivered by BHP Billiton and the South Australian Government to address potential impacts and risks
• details the social indicators that would be used to monitor progress towards goals and outcomes (key performance indicators), and changes in social conditions (trend indicators)
• provides a mechanism for adjusting social management measures and/or delivering new strategies and actions in response to emerging issues and/or changed social or project conditions.
A broad range of social indicators would be monitored, including effects that lie beyond the direct or sole control or responsibility of BHP Billiton, which other stakeholders, particularly the South Australian Government, can influence or contribute to. The review of performance outcomes would monitor progress towards social goals, and identify changes in social conditions that required action either by BHP Billiton, the State Government and/or other stakeholders, to maximise social benefits and reduce adverse impacts.
Lead and lag indicators would be used to monitor impacts: ‘lead’ indicators can provide early warning of unanticipated or emerging issues and offer an opportunity to respond or intervene before changes occur or become unacceptable; ‘lag’ indicators provide information on impacts and outcomes over time.
If an issue or concern arose that was within BHP Billiton’s sole control and/or responsibilities, it would review, refine, upgrade or implement new management measures as appropriate. Where an issue was not within BHP Billiton’s sole control, or joint action was required, a proposed course of action would be referred to the Social Management Partnership for consideration and funding. The Social Management Partnership would provide the forum for BHP Billiton, the South Australian Government and other key stakeholders to discuss and respond to the social effects of the expansion of Olympic Dam, and would focus on those effects that were outside the authority and control of BHP Billiton or were the joint responsibility of BHP Billiton, the South Australian Government and/or other stakeholders (see Appendix 2 for Draft Terms of Reference for the Social Management Partnership).
Reporting on the Social Management Plan and Social Management Framework would occur within BHP Billiton, to the State Government and key stakeholders through the Social Management Partnership, and to the community through public environmental reporting (as detailed in Section 4.2).
1.5 Responsibilities
BHP Billiton’s responsibilities for the Social Management Framework can be summarised as follows:
• develop and update the Social Management Plan
• deliver the commitments and management measures outlined in the Plan as being of direct responsibility to BHP Billiton
• collect and collate data on indicators for which it is responsible
• monitor and report on the implementation of management actions and controls, performance against social goals and outcomes, and trend indicators
• chair meetings and provide administrative support for the Social Management Partnership.
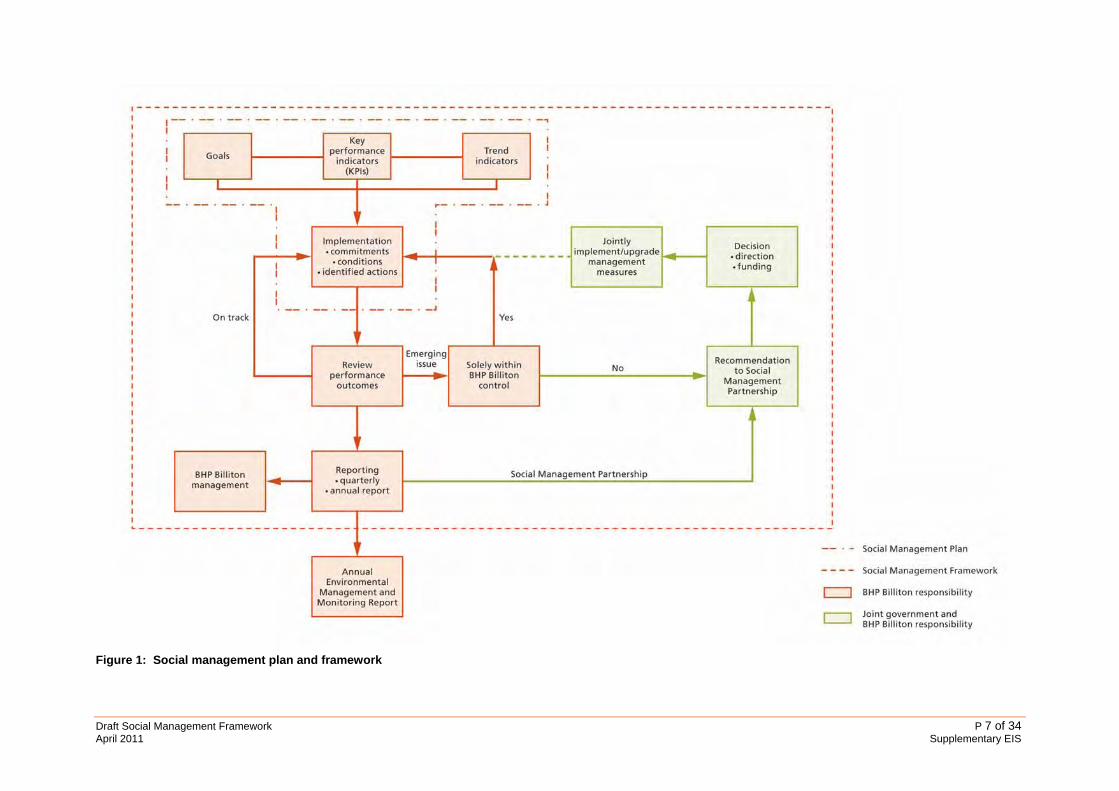
Figure 1: Social management plan and framework
Draft Social Management Framework P 7 of 34 April 2011 Supplementary EIS

Table 1 shows the roles and responsibilities of BHP Billiton personnel for the implementation and maintenance of the Social Management Framework.
Table 1: Roles and responsibilities
Position Accountability/functions
External Affairs Department, Olympic Dam Manage, support and monitor the implementation of the Social Management Plan Lead the annual review and update process Manage research on emerging issues and proposed actions Manage monitoring and reporting, including data collection on performance and trend indicators Manage engagement with local stakeholders
Vice-President External Affairs, BHP Billiton Adelaide
Lead the creation and operation of the Social Management Partnership Ensure reporting on the Social Management Framework complies with corporate requirements Manage engagement with government
It is proposed that the South Australian Government and other key stakeholders would be involved in the Social Management Framework as follows:
• participate in and chair the Social Management Partnership
• deliver the commitments and management measures outlined in the Social Management Plan as being of direct responsibility to the State Government
• implement actions that contribute to the achievement of social goals as determined via the Social Management Partnership
• provide and analyse data on indicators for which it is responsible.
Draft Terms of Reference for the Social Management Partnership, including roles, responsibilities and membership, have been prepared for discussion with the South Australian Government, and are outlined in Appendix 2. It is proposed that three representatives would be sought from the South Australian Government. It is also proposed that two representatives of the Roxby Downs community would be invited to participate on the Social Management Partnership, including a nominee of the Roxby Downs Community Board and the Administrator of the Roxby Downs Council. BHP Billiton would also have three representatives on the partnership.
South Australian Government departments, which may be involved in the Social Management Framework either directly or indirectly, through their participation in the Social Management Partnership, the provision and analysis of data, and/or contribution to achieving social goals, include:
• Department of Premier and Cabinet
• Department of Trade and Economic Development
• Outback Communities Authority
• SA Police
• Department of Planning and Local Government
• Department of Health
• Department for Families and Communities
• Department of Education and Children’s Services
• Department of Further Education, Employment, Science and Technology.
Arrangements relating to the Social Management Framework and Social Management Partnership will be subject to further discussion with the South Australian Government.
Draft Social Management Framework P 8 of 34 April 2011 Supplementary EIS
1.6 Related documents
Related existing and/or new environmental management plans that deal with community and workplace interactions include:
• Aboriginal Engagement Plan
• Dust Management Plan
• HSEC Management Plan
• Industry Participation Plan (Port of Darwin)
• Marine Blasting Management Plan
• Marine Transport Management Plan
• Noise Management Plan
• Off-site Traffic Management Plan
• Radiation Management Plan
• Rehabilitation and Closure Plan
• Risk Management and Cyclone Response Plan
• Radioactive Materials Transport Plan
• Trench Management Plan
• Security Management/Operations Plan.
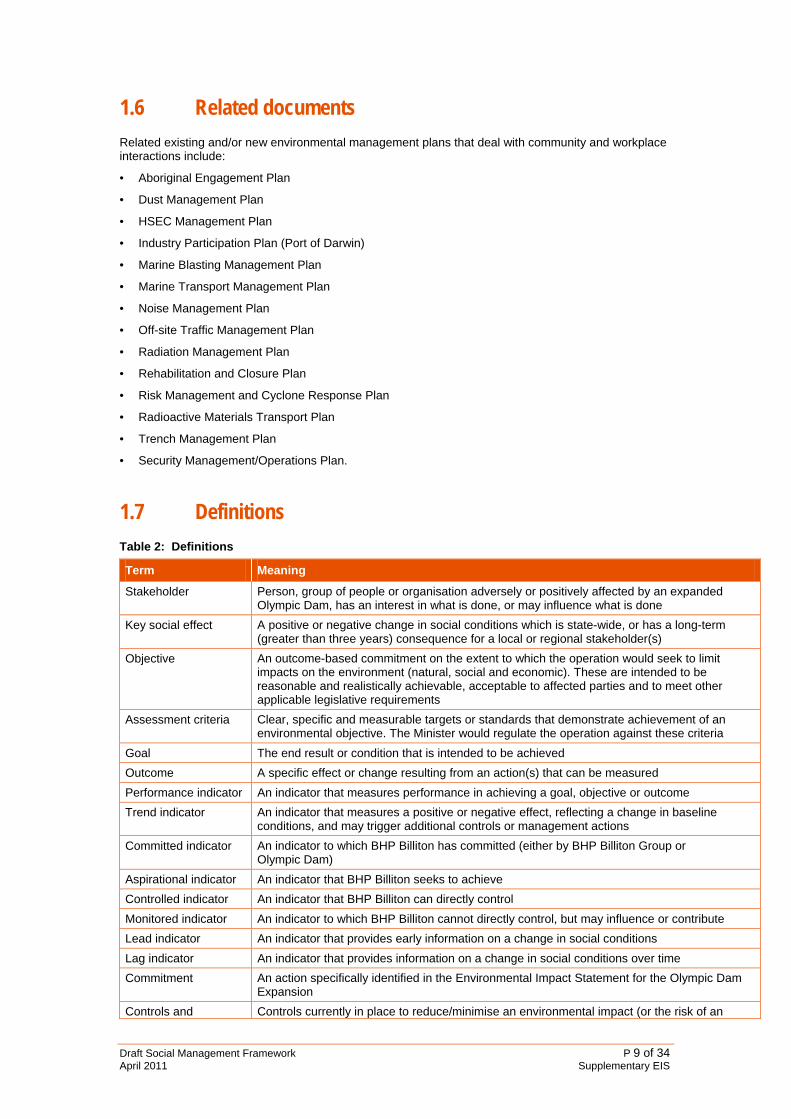
1.7 Definitions
Table 2: Definitions
Term Meaning
Stakeholder Person, group of people or organisation adversely or positively affected by an expanded Olympic Dam, has an interest in what is done, or may influence what is done
Key social effect A positive or negative change in social conditions which is state-wide, or has a long-term (greater than three years) consequence for a local or regional stakeholder(s)
Objective An outcome-based commitment on the extent to which the operation would seek to limit impacts on the environment (natural, social and economic). These are intended to be reasonable and realistically achievable, acceptable to affected parties and to meet other applicable legislative requirements
Assessment criteria Clear, specific and measurable targets or standards that demonstrate achievement of an environmental objective. The Minister would regulate the operation against these criteria
Goal The end result or condition that is intended to be achieved
Outcome A specific effect or change resulting from an action(s) that can be measured
Performance indicator An indicator that measures performance in achieving a goal, objective or outcome
Trend indicator An indicator that measures a positive or negative effect, reflecting a change in baseline conditions, and may trigger additional controls or management actions
Committed indicator An indicator to which BHP Billiton has committed (either by BHP Billiton Group or Olympic Dam)
Aspirational indicator An indicator that BHP Billiton seeks to achieve
Controlled indicator An indicator that BHP Billiton can directly control
Monitored indicator An indicator to which BHP Billiton cannot directly control, but may influence or contribute
Lead indicator An indicator that provides early information on a change in social conditions
Lag indicator An indicator that provides information on a change in social conditions over time
Commitment An action specifically identified in the Environmental Impact Statement for the Olympic Dam Expansion
Controls and Controls currently in place to reduce/minimise an environmental impact (or the risk of an
Draft Social Management Framework P 9 of 34 April 2011 Supplementary EIS
Draft Social Management Framework P 10 of 34 April 2011 Supplementary EIS
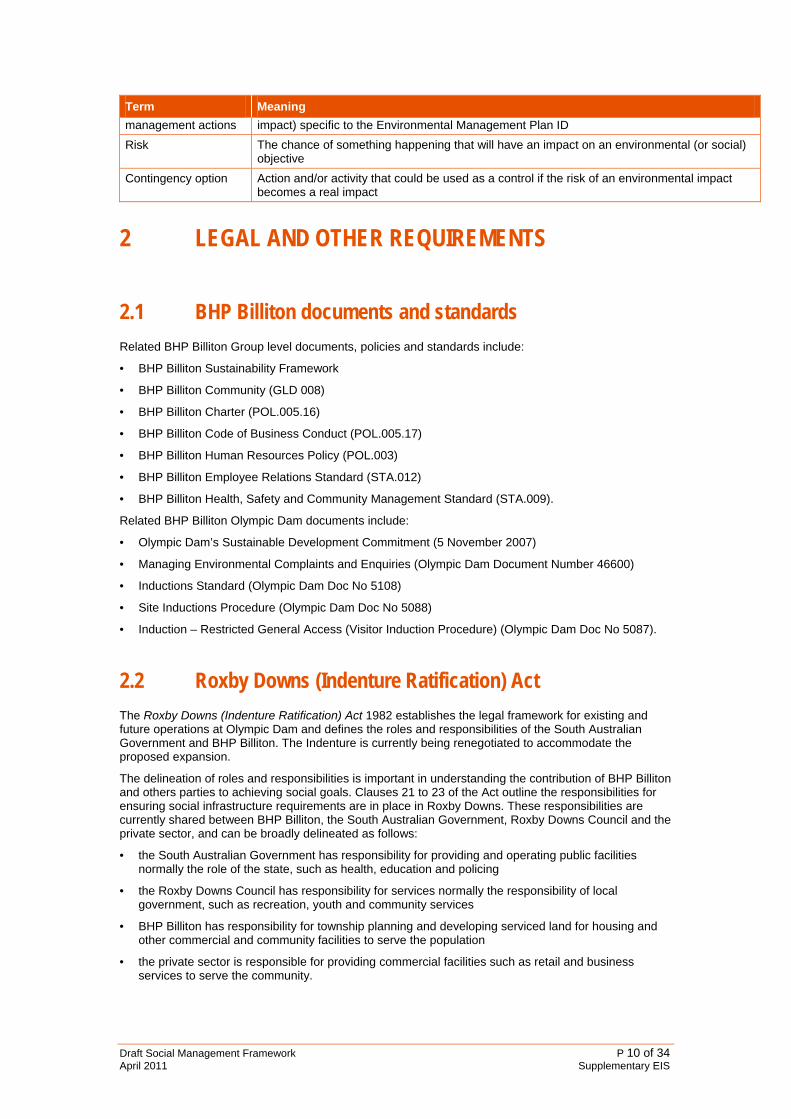
Term Meaning
management actions impact) specific to the Environmental Management Plan ID
Risk The chance of something happening that will have an impact on an environmental (or social) objective
Contingency option Action and/or activity that could be used as a control if the risk of an environmental impact becomes a real impact
2 LEGAL AND OTHER REQUIREMENTS
2.1 BHP Billiton documents and standards
Related BHP Billiton Group level documents, policies and standards include:
• BHP Billiton Sustainability Framework
• BHP Billiton Community (GLD 008)
• BHP Billiton Charter (POL.005.16)
• BHP Billiton Code of Business Conduct (POL.005.17)
• BHP Billiton Human Resources Policy (POL.003)
• BHP Billiton Employee Relations Standard (STA.012)
• BHP Billiton Health, Safety and Community Management Standard (STA.009).
Related BHP Billiton Olympic Dam documents include:
• Olympic Dam’s Sustainable Development Commitment (5 November 2007)
• Managing Environmental Complaints and Enquiries (Olympic Dam Document Number 46600)
• Inductions Standard (Olympic Dam Doc No 5108)
• Site Inductions Procedure (Olympic Dam Doc No 5088)
• Induction – Restricted General Access (Visitor Induction Procedure) (Olympic Dam Doc No 5087).
2.2 Roxby Downs (Indenture Ratification) Act
The Roxby Downs (Indenture Ratification) Act 1982 establishes the legal framework for existing and future operations at Olympic Dam and defines the roles and responsibilities of the South Australian Government and BHP Billiton. The Indenture is currently being renegotiated to accommodate the proposed expansion.
The delineation of roles and responsibilities is important in understanding the contribution of BHP Billiton and others parties to achieving social goals. Clauses 21 to 23 of the Act outline the responsibilities for ensuring social infrastructure requirements are in place in Roxby Downs. These responsibilities are currently shared between BHP Billiton, the South Australian Government, Roxby Downs Council and the private sector, and can be broadly delineated as follows:
• the South Australian Government has responsibility for providing and operating public facilities normally the role of the state, such as health, education and policing
• the Roxby Downs Council has responsibility for services normally the responsibility of local government, such as recreation, youth and community services
• BHP Billiton has responsibility for township planning and developing serviced land for housing and other commercial and community facilities to serve the population
• the private sector is responsible for providing commercial facilities such as retail and business services to serve the community.

Draft Social Management Framework P 11 of 34 April 2011 Supplementary EIS
3 OBJECTIVES AND ASSESSMENT CRITERIA
Table 3 outlines the overarching objectives and assessment criteria for addressing potential social effects identified in the Olympic Dam Expansion Draft EIS. These objectives are expanded in Table 4, which provides the basis for developing the Social Management Plan.
Table 3: Objectives and assessment criteria
Employment and accommodation of people
Objective Assessment criteria
Community interactions Communities in which BHP Billiton operates value our citizenship
Community concerns are tracked and all reasonable complaints are addressed
Workplace interactions Olympic Dam is a safe and valued place of employment
Health, Safety, Environment and Community incidents are tracked and significant incidents are addressed
In this respect, the commitments, controls/management actions, existing and other social management measures outlined in the Olympic Dam Environmental Management Program (ID 5 Employment and Accommodation of People; ID 5.1 Community Interactions and ID 5.2 Workplace Interactions) deal with these social effects and would contribute to achieving social goals.
In many instances, responsibility for achieving social goals lies outside the direct or sole responsibility, control or authority of BHP Billiton. Those goals (and associated performance indicators) for which BHP Billiton has direct or sole control can be described as ‘controlled’ and can be distinguished from those goals which are outside BHP Billiton’s direct control – although BHP Billiton may contribute to these goals and monitor the outcomes (i.e. outcomes would be ‘monitored’). In addition, some indicators should be considered ‘aspirational’ (i.e. are indicators that BHP Billiton would seek to achieve). Wherever possible, indicators for controlled effects are based on BHP Billiton business planning processes or reflect commitments in the Draft EIS or Supplementary EIS (i.e. are ‘committed’ indicators).
In other cases, indicators for monitored effects are based on other relevant planning documents (for example, South Australia’s Strategic Plan or the State of the Outback Report), and benchmarking studies, or may require further analysis and review.
A list of draft indicators that could potentially be included in the Social Management Plan is provided in Appendix 3. This list is indicative, and has been prepared for the purposes of discussion with the South Australian Government. It also includes indicators for which the South Australian Government or other stakeholders may be responsible, which will be subject to further discussion with the relevant parties. Additional indicators may also be collected by BHP Billiton, the State Government, or other parties and used for internal planning, where responsibility for actions or outcomes rests solely with those parties.
In addition, the Plan should be seen as a ‘live’ document, and would be updated and refined over time. As such, new indicators may be identified over time, and incorporated into the Social Management Plan, in response to new or emerging issues. The indicators identified in Appendix 3 do not therefore represent the final list of indicators that would be included in, and monitored, as part of the Social Management Plan.
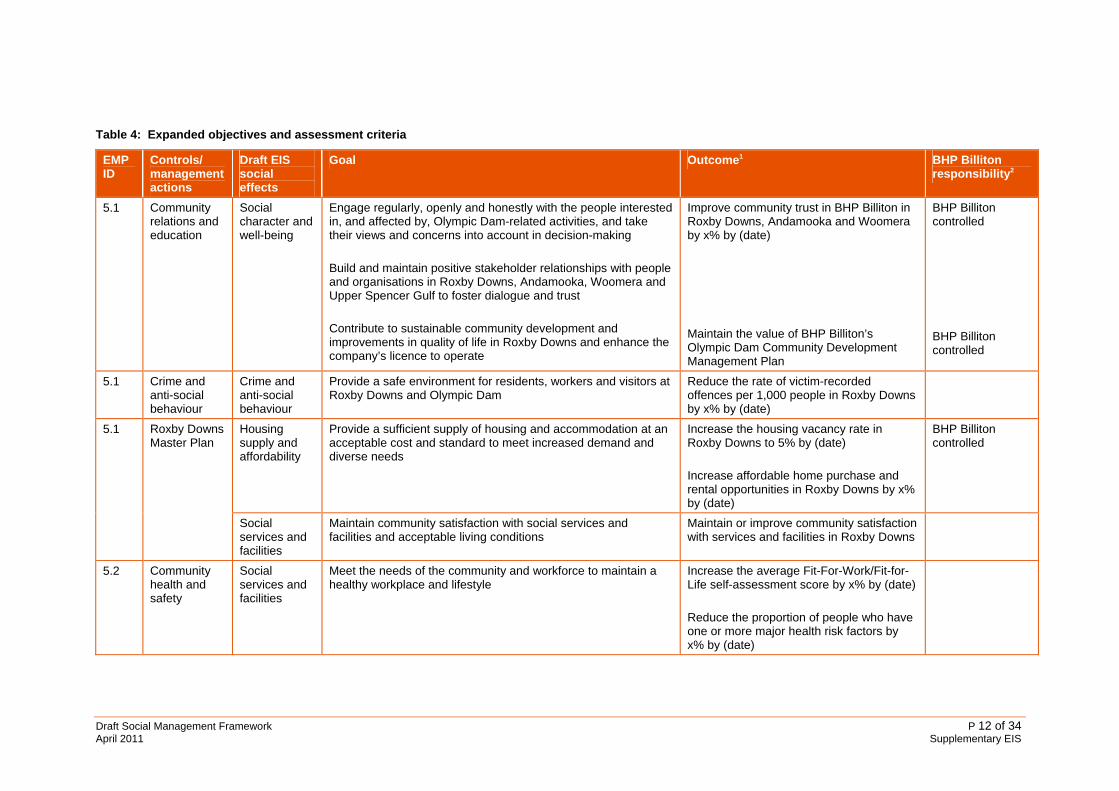
Table 4: Expanded objectives and assessment criteria
EMP ID
Controls/ management actions
Draft EIS social effects
Goal Outcome1 BHP Billiton responsibility2
5.1 Community relations and education
Social character and well-being
Engage regularly, openly and honestly with the people interested in, and affected by, Olympic Dam-related activities, and take their views and concerns into account in decision-making Build and maintain positive stakeholder relationships with people and organisations in Roxby Downs, Andamooka, Woomera and Upper Spencer Gulf to foster dialogue and trust Contribute to sustainable community development and improvements in quality of life in Roxby Downs and enhance the company’s licence to operate
Improve community trust in BHP Billiton in Roxby Downs, Andamooka and Woomera by x% by (date) Maintain the value of BHP Billiton’s Olympic Dam Community Development Management Plan
BHP Billiton controlled BHP Billiton controlled
5.1 Crime and anti-social behaviour
Crime and anti-social behaviour
Provide a safe environment for residents, workers and visitors at Roxby Downs and Olympic Dam
Reduce the rate of victim-recorded offences per 1,000 people in Roxby Downs by x% by (date)
Housing supply and affordability
Provide a sufficient supply of housing and accommodation at an acceptable cost and standard to meet increased demand and diverse needs
Increase the housing vacancy rate in Roxby Downs to 5% by (date) Increase affordable home purchase and rental opportunities in Roxby Downs by x% by (date)
BHP Billiton controlled
5.1 Roxby Downs Master Plan
Social services and facilities
Maintain community satisfaction with social services and facilities and acceptable living conditions
Maintain or improve community satisfaction with services and facilities in Roxby Downs
5.2 Community health and safety
Social services and facilities
Meet the needs of the community and workforce to maintain a healthy workplace and lifestyle
Increase the average Fit-For-Work/Fit-for-Life self-assessment score by x% by (date) Reduce the proportion of people who have one or more major health risk factors by x% by (date)
Draft Social Management Framework P 12 of 34 April 2011 Supplementary EIS
Draft Social Management Framework P 13 of 34 April 2011 Supplementary EIS
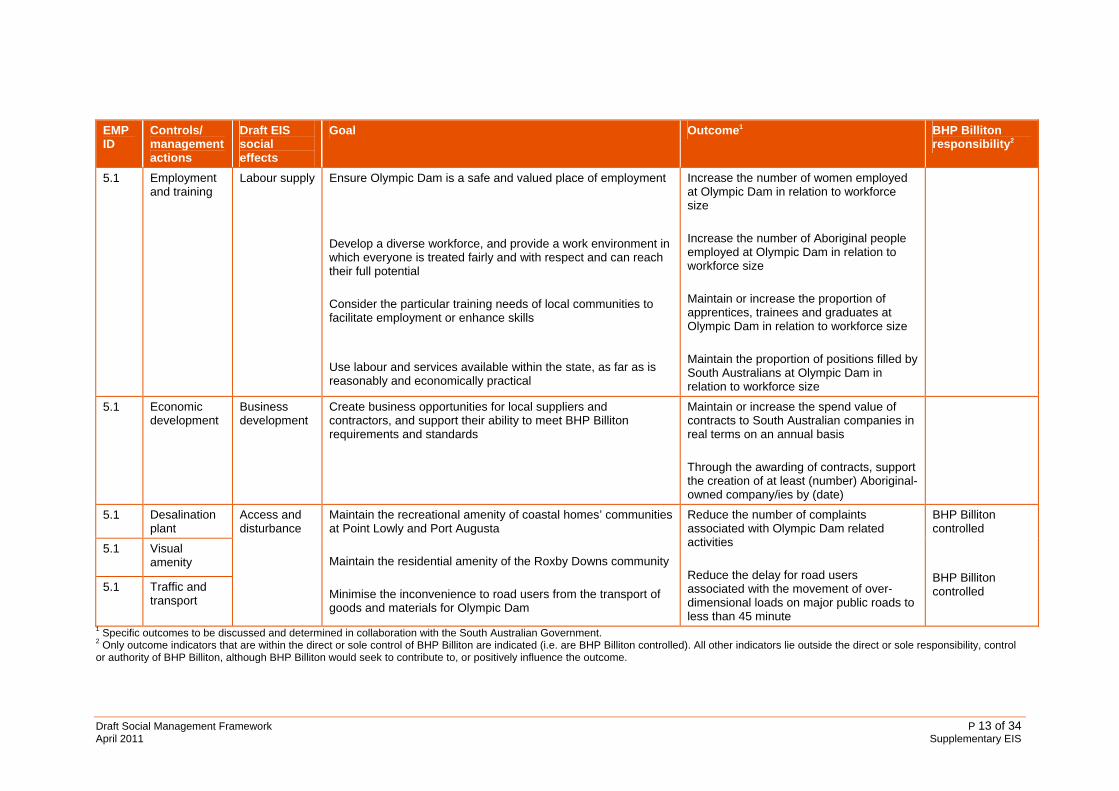
EMP ID
Controls/ management actions
Draft EIS social effects
Goal Outcome1 BHP Billiton responsibility2
5.1 Employment and training
Labour supply Ensure Olympic Dam is a safe and valued place of employment Develop a diverse workforce, and provide a work environment in which everyone is treated fairly and with respect and can reach their full potential Consider the particular training needs of local communities to facilitate employment or enhance skills Use labour and services available within the state, as far as is reasonably and economically practical
Increase the number of women employed at Olympic Dam in relation to workforce size Increase the number of Aboriginal people employed at Olympic Dam in relation to workforce size Maintain or increase the proportion of apprentices, trainees and graduates at Olympic Dam in relation to workforce size Maintain the proportion of positions filled by South Australians at Olympic Dam in relation to workforce size
5.1 Economic development
Business development
Create business opportunities for local suppliers and contractors, and support their ability to meet BHP Billiton requirements and standards
Maintain or increase the spend value of contracts to South Australian companies in real terms on an annual basis Through the awarding of contracts, support the creation of at least (number) Aboriginal-owned company/ies by (date)
5.1 Desalination plant
5.1 Visual amenity
5.1 Traffic and transport
Access and disturbance
Maintain the recreational amenity of coastal homes’ communities at Point Lowly and Port Augusta Maintain the residential amenity of the Roxby Downs community Minimise the inconvenience to road users from the transport of goods and materials for Olympic Dam
Reduce the number of complaints associated with Olympic Dam related activities Reduce the delay for road users associated with the movement of over-dimensional loads on major public roads to less than 45 minute
BHP Billiton controlled BHP Billiton controlled
1 Specific outcomes to be discussed and determined in collaboration with the South Australian Government. 2 Only outcome indicators that are within the direct or sole control of BHP Billiton are indicated (i.e. are BHP Billiton controlled). All other indicators lie outside the direct or sole responsibility, control or authority of BHP Billiton, although BHP Billiton would seek to contribute to, or positively influence the outcome.

The indicators identified in Appendix 3 have been selected to track potential impacts and issues identified in the Draft EIS, community and stakeholder consultation, previous experiences and other sources. Multiple (rather than single) indicators are used to deal with different aspects and ensure validity. Indicators draw on both qualitative and quantitative data from BHP Billiton and other external sources (including government agencies, Roxby Downs Council and other sources). In identifying indicators, every effort has been made to ensure baseline data is currently available, and simple to understand and interpret. Where data is not available, BHP Billiton may develop this data (in collaboration with other parties as appropriate), for example, through community or workforce surveys.
Social Management Activity Plans would be developed to provide further detail on how specific social effects would be controlled and monitored and would include:
• social goals and outcomes
• key performance indicators (KPIs)
• trend indicators
• existing management measures and activities
• commitments, controls/management actions and other management measures
• risk items and contingency options (if required)
• details of actions, responsibility and timeframes for implementing management measures.
An example of a Social Management Activity Plan for Community Relations and Community Education is contained in Appendix 4.
The goals, outcomes, indicators and management measures outlined in the Social Management Plan would be reviewed annually by BHP Billiton in collaboration with the State Government throughout all phases of the expansion project, including ongoing design, construction, operation and closure, and may be further refined or amended as part of the process of continual improvement.
All changes and additional actions made following the annual review would be documented in the Social Management Plan (and associated activity plans). In addition, new strategies, actions and initiatives undertaken by BHP Billiton in response to emerging issues, outside the annual review process, would also be incorporated into the Social Management Plan.
4 MONITORING AND REPORTING
4.1 Monitoring program
Monitoring is an essential component of the Social Management Framework. The monitoring program would be managed by BHP Billiton in order to:
• implement the commitments, conditions and other identified actions
• assess progress and performance in achieving social goals and outcomes
• identify trends or variations in conditions to provide an early warning of unanticipated or emerging issues or to help understand the basis or source of an issue
• measure changes in social conditions that may require action by BHP Billiton, government or other stakeholders.
To achieve these multiple purposes, both ‘lead’ and ‘lag’ indicators would be monitored. Lead indicators would provide information on changes in social conditions at an early stage, and may trigger additional mitigation measures to address an emerging issue. These indicators would be monitored more frequently than lag indicators, and are identified in the Activity Plans in Appendix 3.
Three types of monitoring would be undertaken:
• annual monitoring of progress towards social goals and outcomes (as measured by key performance indicators)
• regular/routine monitoring of trend indicators by BHP Billiton. The frequency of monitoring would be determined by the source and availability of data, and would depend on the willingness of other organisations to contribute and/or analyse data for monitoring purposes. In general, indicators
Draft Social Management Framework P 14 of 34 April 2011 Supplementary EIS
designated as ‘lead’ indicators would be monitored more frequently, while ‘lag’ indicators would be monitored less frequently
• opportunistic (periodic) monitoring of specific topics, where an issue of particular interest emerged or a suitable opportunity arose.
Implementation details for the monitoring program, including the frequency, source, scope and method of data collection, would be confirmed following further consultation.
4.2 Reporting
Quarterly or six-monthly reports would be provided to BHP Billiton’s management and the Social Management Partnership (at least initially during the construction period) on:
• progress made on implementing commitments, controls/management actions and other identified actions
• results of monitoring (selected key performance and trend indicators)
• modifications to controls/management actions and/or implementation of new management measures.
Not all indicators would be publicly reported or discussed through the Social Management Partnership. Indicators that would inform joint planning and decision-making by BHP Billiton, the South Australian Government and other stakeholders or which measure progress towards goals and outcomes would be reported through the Social Management Partnership.
Summary information on the Social Management Framework would also be published in the annual Environmental Management and Monitoring Report and would include:
• key actions taken by BHP Billiton to implement commitments and management measures
• progress towards achieving goals and outcomes (as measured by key performance indicators)
• recommendations provided to, and key decisions and actions arising from, the Social Management Partnership.
5 APPENDICES
The appendices that support this Social Management Framework are as follows:
Appendix 1: Extent of potential social effects from the expansion of Olympic Dam
Appendix 2: Social Management Partnership Draft Terms of Reference
Appendix 3: Draft social indicators
Appendix 3.1: Community relations and community education
Appendix 3.2: Crime and anti-social behaviour
Appendix 3.3: Roxby Downs Draft Master Plan (Housing)
Appendix 3.4: Roxby Downs Draft Master Plan (Social services)
Appendix 3.5: Access and disturbance (Desalination plant, visual amenity, and traffic and transport)
Appendix 3.6: Employment and training
Appendix 3.7: Economic development
Appendix 4: Community relations and community education activity plan
Draft Social Management Framework P 15 of 34 April 2011 Supplementary EIS
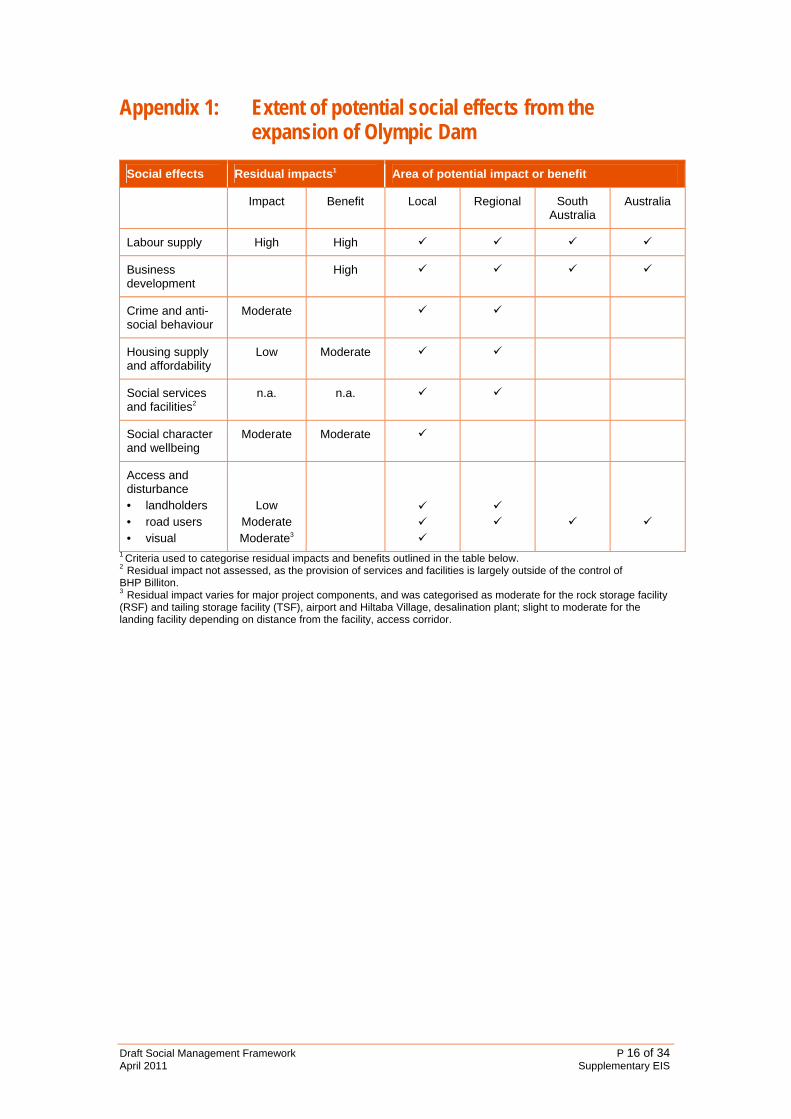
Appendix 1: Extent of potential social effects from the expansion of Olympic Dam
Social effects Residual impacts1 Area of potential impact or benefit
Impact Benefit Local Regional South Australia
Australia
Labour supply High High
Business development
High
Crime and anti-social behaviour
Moderate
Housing supply and affordability
Low Moderate
Social services and facilities2
n.a. n.a.
Social character and wellbeing
Moderate Moderate
Access and disturbance • landholders • road users • visual
Low
Moderate Moderate3
1 Criteria used to categorise residual impacts and benefits outlined in the table below. 2 Residual impact not assessed, as the provision of services and facilities is largely outside of the control of BHP Billiton. 3 Residual impact varies for major project components, and was categorised as moderate for the rock storage facility (RSF) and tailing storage facility (TSF), airport and Hiltaba Village, desalination plant; slight to moderate for the landing facility depending on distance from the facility, access corridor.
Draft Social Management Framework P 16 of 34 April 2011 Supplementary EIS
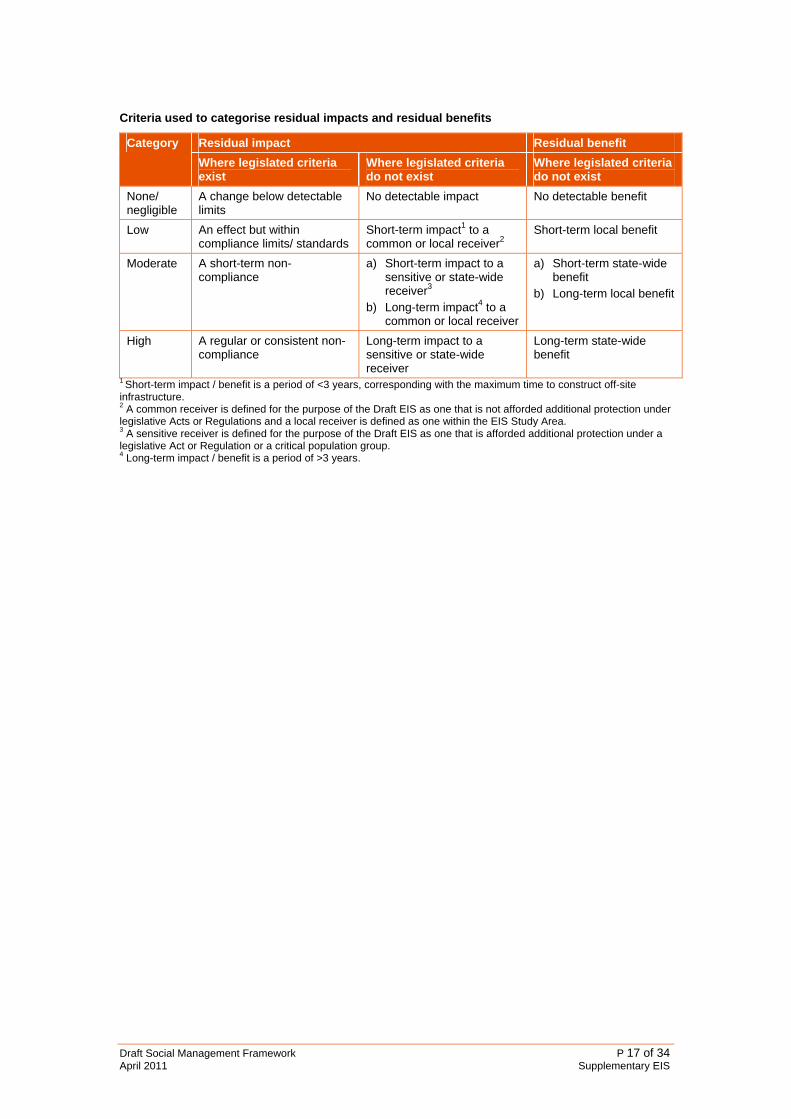
Criteria used to categorise residual impacts and residual benefits
Residual impact Residual benefit Category
Where legislated criteria exist
Where legislated criteria do not exist
Where legislated criteria do not exist
None/ negligible
A change below detectable limits
No detectable impact No detectable benefit
Low An effect but within compliance limits/ standards
Short-term impact1 to a common or local receiver2
Short-term local benefit
Moderate A short-term non-compliance
a) Short-term impact to a sensitive or state-wide receiver3
b) Long-term impact4 to a common or local receiver
a) Short-term state-wide benefit
b) Long-term local benefit
High A regular or consistent non-compliance
Long-term impact to a sensitive or state-wide receiver
Long-term state-wide benefit
1 Short-term impact / benefit is a period of <3 years, corresponding with the maximum time to construct off-site infrastructure. 2 A common receiver is defined for the purpose of the Draft EIS as one that is not afforded additional protection under legislative Acts or Regulations and a local receiver is defined as one within the EIS Study Area. 3 A sensitive receiver is defined for the purpose of the Draft EIS as one that is afforded additional protection under a legislative Act or Regulation or a critical population group. 4 Long-term impact / benefit is a period of >3 years.
Draft Social Management Framework P 17 of 34 April 2011 Supplementary EIS
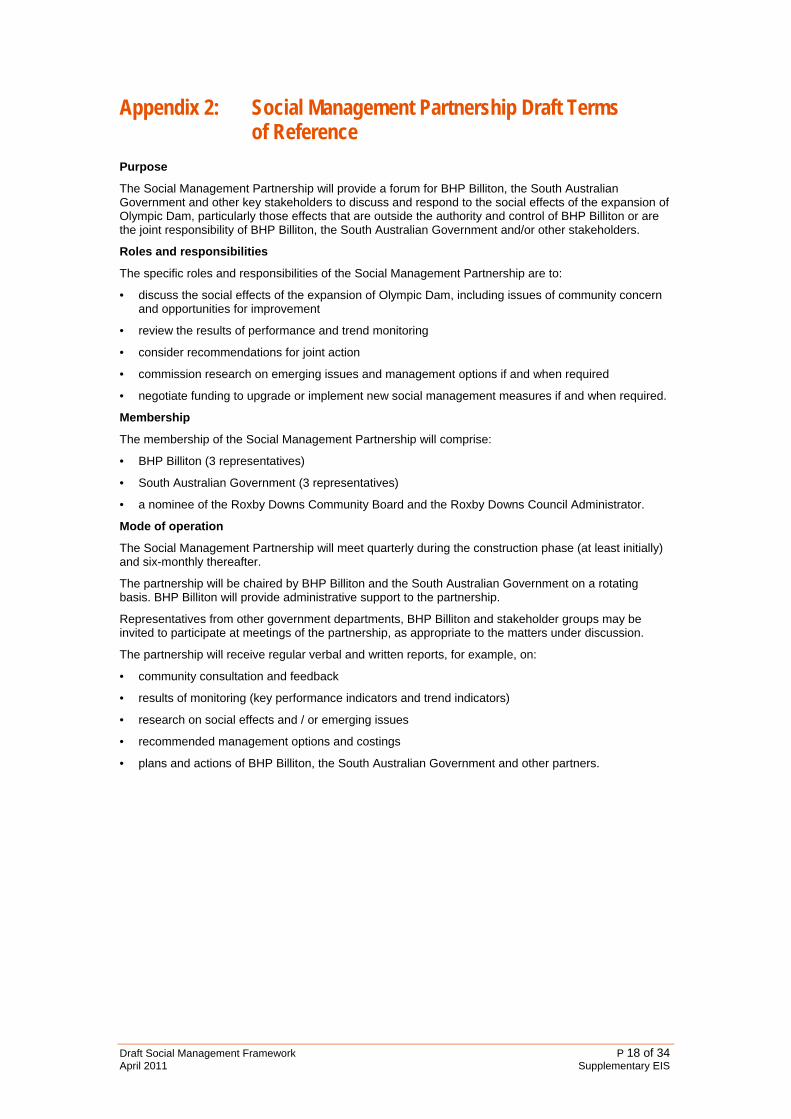
Appendix 2: Social Management Partnership Draft Terms of Reference
Purpose
The Social Management Partnership will provide a forum for BHP Billiton, the South Australian Government and other key stakeholders to discuss and respond to the social effects of the expansion of Olympic Dam, particularly those effects that are outside the authority and control of BHP Billiton or are the joint responsibility of BHP Billiton, the South Australian Government and/or other stakeholders.
Roles and responsibilities
The specific roles and responsibilities of the Social Management Partnership are to:
• discuss the social effects of the expansion of Olympic Dam, including issues of community concern and opportunities for improvement
• review the results of performance and trend monitoring
• consider recommendations for joint action
• commission research on emerging issues and management options if and when required
• negotiate funding to upgrade or implement new social management measures if and when required.
Membership
The membership of the Social Management Partnership will comprise:
• BHP Billiton (3 representatives)
• South Australian Government (3 representatives)
• a nominee of the Roxby Downs Community Board and the Roxby Downs Council Administrator.
Mode of operation
The Social Management Partnership will meet quarterly during the construction phase (at least initially) and six-monthly thereafter.
The partnership will be chaired by BHP Billiton and the South Australian Government on a rotating basis. BHP Billiton will provide administrative support to the partnership.
Representatives from other government departments, BHP Billiton and stakeholder groups may be invited to participate at meetings of the partnership, as appropriate to the matters under discussion.
The partnership will receive regular verbal and written reports, for example, on:
• community consultation and feedback
• results of monitoring (key performance indicators and trend indicators)
• research on social effects and / or emerging issues
• recommended management options and costings
• plans and actions of BHP Billiton, the South Australian Government and other partners.
Draft Social Management Framework P 18 of 34 April 2011 Supplementary EIS

Appendix 3: Draft social indicators
Appendix 3.1: Community relations and community education
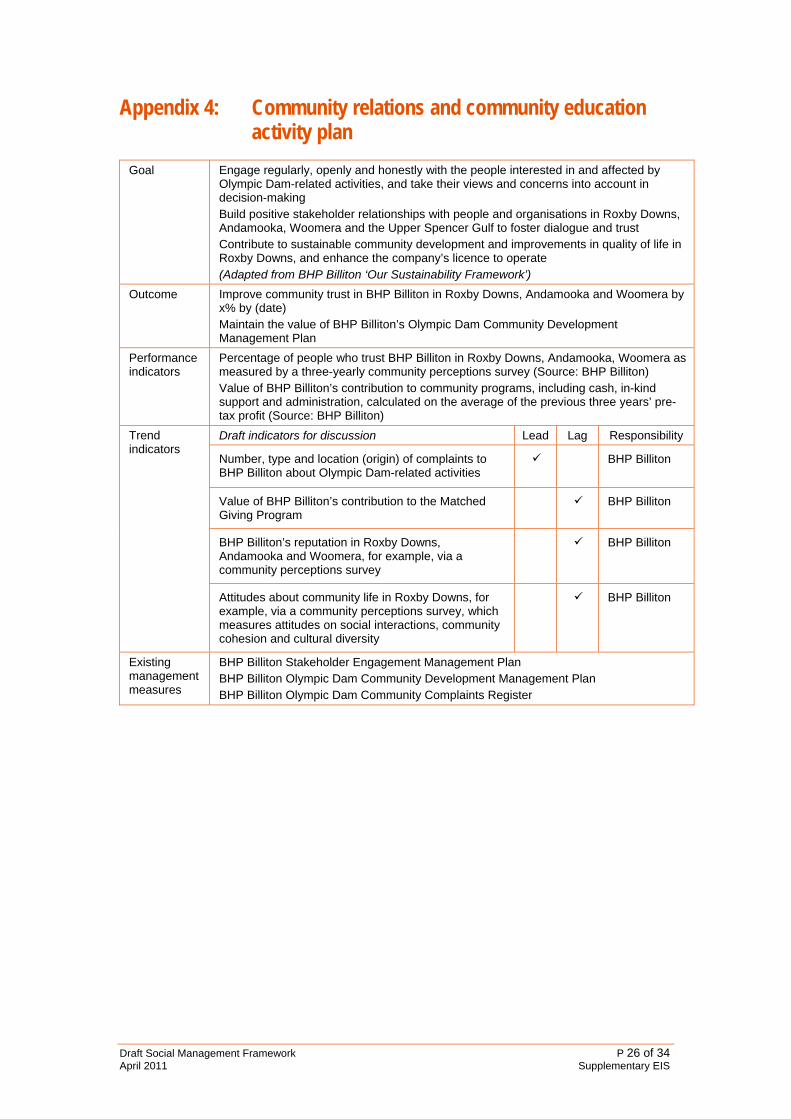
Goal Engage regularly, openly and honestly with the people interested in and affected by Olympic Dam-related activities, and take their views and concerns into account in decision-making Build positive stakeholder relationships with people and organisations in Roxby Downs, Andamooka, Woomera and the Upper Spencer Gulf to foster dialogue and trust Contribute to sustainable community development and improvements in quality of life in Roxby Downs, and enhance the company’s licence to operate (Adapted from BHP Billiton ‘Our Sustainability Framework’)
Outcome Improve community trust in BHP Billiton in Roxby Downs, Andamooka and Woomera by x% by (date) Maintain the value of BHP Billiton’s Olympic Dam Community Development Management Plan
Performance indicators
Percentage of people who trust BHP Billiton in Roxby Downs, Andamooka, Woomera as measured by a three-yearly community perceptions survey (Source: BHP Billiton) Value of BHP Billiton’s contribution to community programs, including cash, in-kind support and administration, calculated on the average of the previous three years’ pre-tax profit (Source: BHP Billiton)
Draft indicators for discussion Lead Lag Responsibility
Number, type and location (origin) of complaints to BHP Billiton about Olympic Dam-related activities
BHP Billiton
Value of BHP Billiton’s contribution to the Matched Giving Program
BHP Billiton
BHP Billiton’s reputation in Roxby Downs, Andamooka and Woomera, for example, as measured by a community perceptions survey
BHP Billiton
Trend indicators
Attitudes about community life in Roxby Downs, for example, as measured by a community perceptions survey on social interactions, community cohesion and cultural diversity
BHP Billiton
Draft Social Management Framework P 19 of 34 April 2011 Supplementary EIS
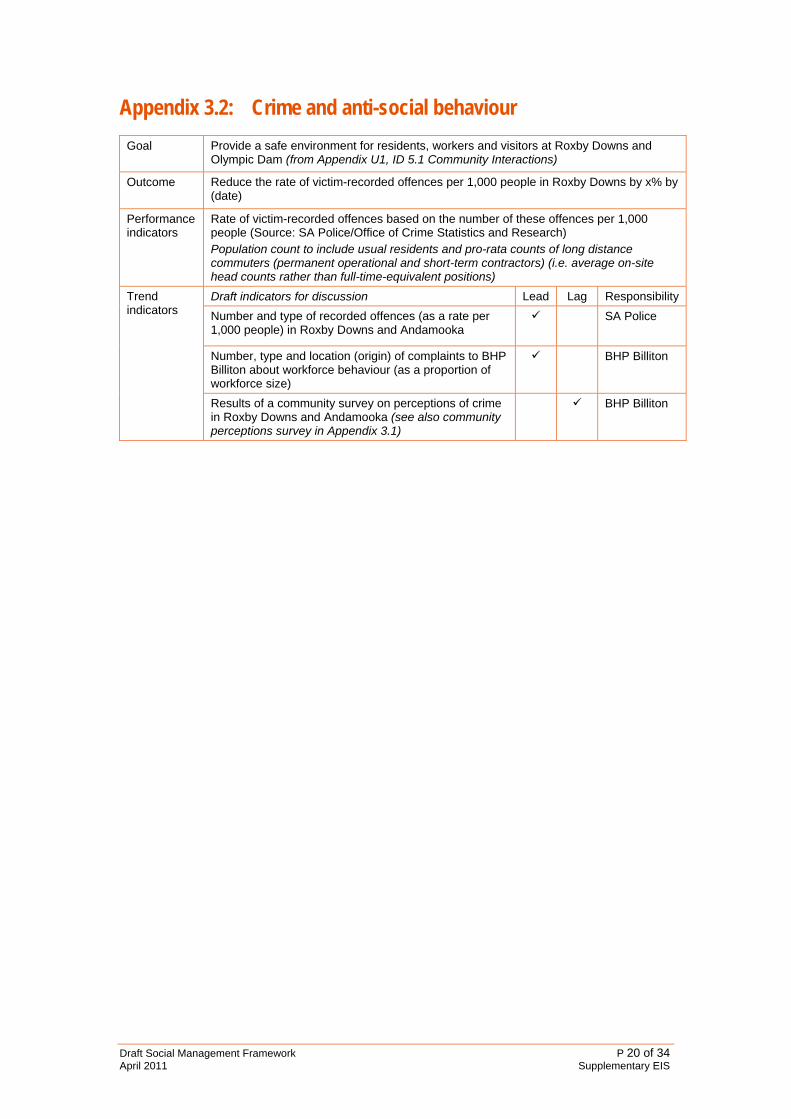
Appendix 3.2: Crime and anti-social behaviour
Goal Provide a safe environment for residents, workers and visitors at Roxby Downs and Olympic Dam (from Appendix U1, ID 5.1 Community Interactions)
Outcome Reduce the rate of victim-recorded offences per 1,000 people in Roxby Downs by x% by (date)
Performance indicators
Rate of victim-recorded offences based on the number of these offences per 1,000 people (Source: SA Police/Office of Crime Statistics and Research) Population count to include usual residents and pro-rata counts of long distance commuters (permanent operational and short-term contractors) (i.e. average on-site head counts rather than full-time-equivalent positions)
Draft indicators for discussion Lead Lag Responsibility
Number and type of recorded offences (as a rate per 1,000 people) in Roxby Downs and Andamooka
SA Police
Number, type and location (origin) of complaints to BHP Billiton about workforce behaviour (as a proportion of workforce size)
BHP Billiton
Trend indicators
Results of a community survey on perceptions of crime in Roxby Downs and Andamooka (see also community perceptions survey in Appendix 3.1)
BHP Billiton
Draft Social Management Framework P 20 of 34 April 2011 Supplementary EIS
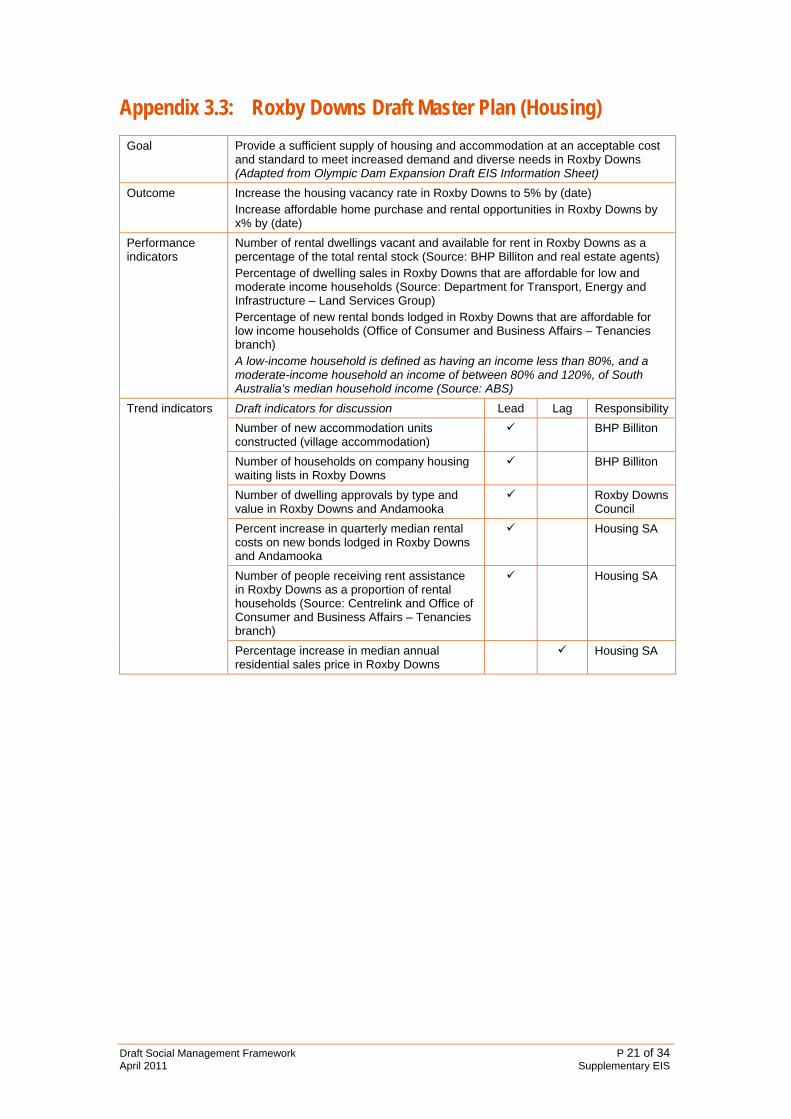
Appendix 3.3: Roxby Downs Draft Master Plan (Housing)
Goal Provide a sufficient supply of housing and accommodation at an acceptable cost and standard to meet increased demand and diverse needs in Roxby Downs (Adapted from Olympic Dam Expansion Draft EIS Information Sheet)
Outcome Increase the housing vacancy rate in Roxby Downs to 5% by (date) Increase affordable home purchase and rental opportunities in Roxby Downs by x% by (date)
Performance indicators
Number of rental dwellings vacant and available for rent in Roxby Downs as a percentage of the total rental stock (Source: BHP Billiton and real estate agents) Percentage of dwelling sales in Roxby Downs that are affordable for low and moderate income households (Source: Department for Transport, Energy and Infrastructure – Land Services Group) Percentage of new rental bonds lodged in Roxby Downs that are affordable for low income households (Office of Consumer and Business Affairs – Tenancies branch) A low-income household is defined as having an income less than 80%, and a moderate-income household an income of between 80% and 120%, of South Australia’s median household income (Source: ABS)
Draft indicators for discussion Lead Lag Responsibility
Number of new accommodation units constructed (village accommodation)
BHP Billiton
Number of households on company housing waiting lists in Roxby Downs
BHP Billiton
Number of dwelling approvals by type and value in Roxby Downs and Andamooka
Roxby Downs Council
Percent increase in quarterly median rental costs on new bonds lodged in Roxby Downs and Andamooka
Housing SA
Number of people receiving rent assistance in Roxby Downs as a proportion of rental households (Source: Centrelink and Office of Consumer and Business Affairs – Tenancies branch)
Housing SA
Trend indicators
Percentage increase in median annual residential sales price in Roxby Downs
Housing SA
Draft Social Management Framework P 21 of 34 April 2011 Supplementary EIS
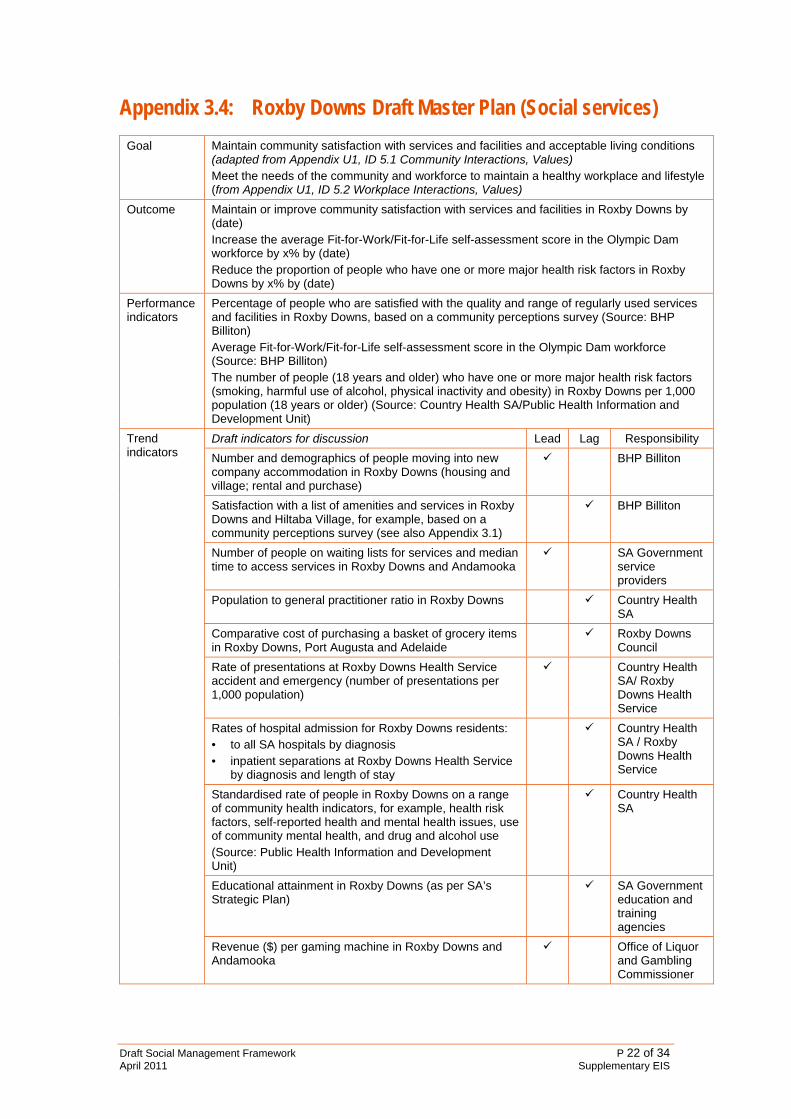
Appendix 3.4: Roxby Downs Draft Master Plan (Social services)
Goal Maintain community satisfaction with services and facilities and acceptable living conditions (adapted from Appendix U1, ID 5.1 Community Interactions, Values) Meet the needs of the community and workforce to maintain a healthy workplace and lifestyle (from Appendix U1, ID 5.2 Workplace Interactions, Values)
Outcome Maintain or improve community satisfaction with services and facilities in Roxby Downs by (date) Increase the average Fit-for-Work/Fit-for-Life self-assessment score in the Olympic Dam workforce by x% by (date) Reduce the proportion of people who have one or more major health risk factors in Roxby Downs by x% by (date)
Performance indicators
Percentage of people who are satisfied with the quality and range of regularly used services and facilities in Roxby Downs, based on a community perceptions survey (Source: BHP Billiton) Average Fit-for-Work/Fit-for-Life self-assessment score in the Olympic Dam workforce (Source: BHP Billiton) The number of people (18 years and older) who have one or more major health risk factors (smoking, harmful use of alcohol, physical inactivity and obesity) in Roxby Downs per 1,000 population (18 years or older) (Source: Country Health SA/Public Health Information and Development Unit)
Draft indicators for discussion Lead Lag Responsibility
Number and demographics of people moving into new company accommodation in Roxby Downs (housing and village; rental and purchase)
BHP Billiton
Satisfaction with a list of amenities and services in Roxby Downs and Hiltaba Village, for example, based on a community perceptions survey (see also Appendix 3.1)
BHP Billiton
Number of people on waiting lists for services and median time to access services in Roxby Downs and Andamooka
SA Government service providers
Population to general practitioner ratio in Roxby Downs Country Health SA
Comparative cost of purchasing a basket of grocery items in Roxby Downs, Port Augusta and Adelaide
Roxby Downs Council
Rate of presentations at Roxby Downs Health Service accident and emergency (number of presentations per 1,000 population)
Country Health SA/ Roxby Downs Health Service
Rates of hospital admission for Roxby Downs residents: • to all SA hospitals by diagnosis • inpatient separations at Roxby Downs Health Service
by diagnosis and length of stay
Country Health SA / Roxby Downs Health Service
Standardised rate of people in Roxby Downs on a range of community health indicators, for example, health risk factors, self-reported health and mental health issues, use of community mental health, and drug and alcohol use (Source: Public Health Information and Development Unit)
Country Health SA
Educational attainment in Roxby Downs (as per SA’s Strategic Plan)
SA Government education and training agencies
Trend indicators
Revenue ($) per gaming machine in Roxby Downs and Andamooka
Office of Liquor and Gambling Commissioner
Draft Social Management Framework P 22 of 34 April 2011 Supplementary EIS
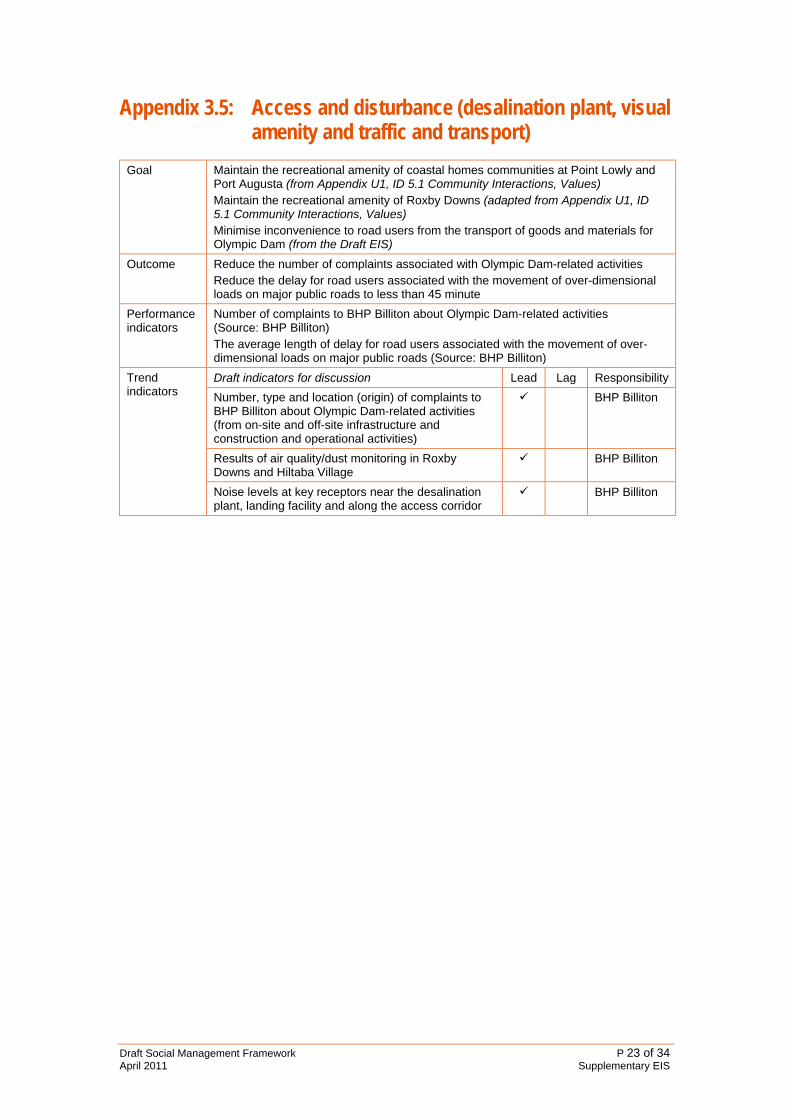
Appendix 3.5: Access and disturbance (desalination plant, visual amenity and traffic and transport)
Goal Maintain the recreational amenity of coastal homes communities at Point Lowly and Port Augusta (from Appendix U1, ID 5.1 Community Interactions, Values) Maintain the recreational amenity of Roxby Downs (adapted from Appendix U1, ID 5.1 Community Interactions, Values) Minimise inconvenience to road users from the transport of goods and materials for Olympic Dam (from the Draft EIS)
Outcome Reduce the number of complaints associated with Olympic Dam-related activities Reduce the delay for road users associated with the movement of over-dimensional loads on major public roads to less than 45 minute
Performance indicators
Number of complaints to BHP Billiton about Olympic Dam-related activities (Source: BHP Billiton) The average length of delay for road users associated with the movement of over-dimensional loads on major public roads (Source: BHP Billiton)
Draft indicators for discussion Lead Lag Responsibility
Number, type and location (origin) of complaints to BHP Billiton about Olympic Dam-related activities (from on-site and off-site infrastructure and construction and operational activities)
BHP Billiton
Results of air quality/dust monitoring in Roxby Downs and Hiltaba Village
BHP Billiton
Trend indicators
Noise levels at key receptors near the desalination plant, landing facility and along the access corridor
BHP Billiton
Draft Social Management Framework P 23 of 34 April 2011 Supplementary EIS
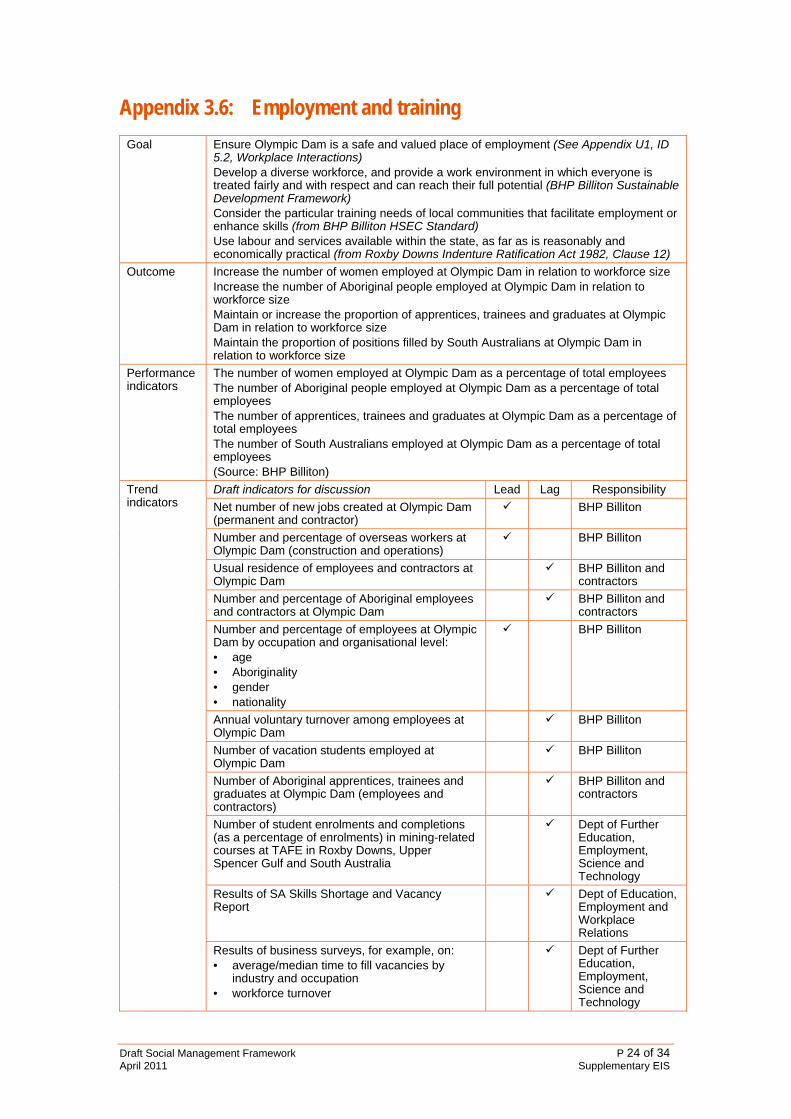
Appendix 3.6: Employment and training
Goal Ensure Olympic Dam is a safe and valued place of employment (See Appendix U1, ID 5.2, Workplace Interactions) Develop a diverse workforce, and provide a work environment in which everyone is treated fairly and with respect and can reach their full potential (BHP Billiton Sustainable Development Framework) Consider the particular training needs of local communities that facilitate employment or enhance skills (from BHP Billiton HSEC Standard) Use labour and services available within the state, as far as is reasonably and economically practical (from Roxby Downs Indenture Ratification Act 1982, Clause 12)
Outcome Increase the number of women employed at Olympic Dam in relation to workforce size Increase the number of Aboriginal people employed at Olympic Dam in relation to workforce size Maintain or increase the proportion of apprentices, trainees and graduates at Olympic Dam in relation to workforce size Maintain the proportion of positions filled by South Australians at Olympic Dam in relation to workforce size
Performance indicators
The number of women employed at Olympic Dam as a percentage of total employees The number of Aboriginal people employed at Olympic Dam as a percentage of total employees The number of apprentices, trainees and graduates at Olympic Dam as a percentage of total employees The number of South Australians employed at Olympic Dam as a percentage of total employees (Source: BHP Billiton)
Draft indicators for discussion Lead Lag Responsibility
Net number of new jobs created at Olympic Dam (permanent and contractor)
BHP Billiton
Number and percentage of overseas workers at Olympic Dam (construction and operations)
BHP Billiton
Usual residence of employees and contractors at Olympic Dam
BHP Billiton and contractors
Number and percentage of Aboriginal employees and contractors at Olympic Dam
BHP Billiton and contractors
Number and percentage of employees at Olympic Dam by occupation and organisational level: • age • Aboriginality • gender • nationality
BHP Billiton
Annual voluntary turnover among employees at Olympic Dam
BHP Billiton
Number of vacation students employed at Olympic Dam
BHP Billiton
Number of Aboriginal apprentices, trainees and graduates at Olympic Dam (employees and contractors)
BHP Billiton and contractors
Number of student enrolments and completions (as a percentage of enrolments) in mining-related courses at TAFE in Roxby Downs, Upper Spencer Gulf and South Australia
Dept of Further Education, Employment, Science and Technology
Results of SA Skills Shortage and Vacancy Report
Dept of Education, Employment and Workplace Relations
Trend indicators
Results of business surveys, for example, on: • average/median time to fill vacancies by
industry and occupation • workforce turnover
Dept of Further Education, Employment, Science and Technology
Draft Social Management Framework P 24 of 34 April 2011 Supplementary EIS

Appendix 3.7: Economic development
Goal Create business opportunities for local suppliers and contractors, and support their ability to fulfil BHP Billiton requirements and standards (BHP Billiton HSEC Standard)
Outcome Maintain or increase the spend value of contracts to South Australian companies in real terms on an annual basis Through the awarding of contracts, support the creation of at least (number) Aboriginal owned company/ies by (date)
Performance indicators
Number and spend value ($) of contracts to South Australian companies as a proportion of total spend on Olympic Dam-related activities (Source: BHP Billiton) Number of contracts awarded to Aboriginal-owned companies on Olympic Dam-related activities (Source: BHP Billiton)
Draft indicators for discussion Lead Lag Responsibility
Take up of land for industrial and commercial purposes in Roxby Downs
BHP Billiton
Business entries and exits in Roxby Downs (see also ABS National Regional Profile)
Roxby Downs Council
Trend indicators
Number of businesses in the northern region by statistical local area, industry, employees and annual turnover (see ABS Business Demography Cat no 8165.0)
SA Dept of Trade and Economic Development
Draft Social Management Framework P 25 of 34 April 2011 Supplementary EIS
Draft Social Management Framework P 26 of 34 April 2011 Supplementary EIS
Appendix 4: Community relations and community education activity plan
Goal Engage regularly, openly and honestly with the people interested in and affected by Olympic Dam-related activities, and take their views and concerns into account in decision-making Build positive stakeholder relationships with people and organisations in Roxby Downs, Andamooka, Woomera and the Upper Spencer Gulf to foster dialogue and trust Contribute to sustainable community development and improvements in quality of life in Roxby Downs, and enhance the company’s licence to operate (Adapted from BHP Billiton ‘Our Sustainability Framework’)
Outcome Improve community trust in BHP Billiton in Roxby Downs, Andamooka and Woomera by x% by (date) Maintain the value of BHP Billiton’s Olympic Dam Community Development Management Plan
Performance indicators
Percentage of people who trust BHP Billiton in Roxby Downs, Andamooka, Woomera as measured by a three-yearly community perceptions survey (Source: BHP Billiton) Value of BHP Billiton’s contribution to community programs, including cash, in-kind support and administration, calculated on the average of the previous three years’ pre-tax profit (Source: BHP Billiton)
Draft indicators for discussion Lead Lag Responsibility
Number, type and location (origin) of complaints to BHP Billiton about Olympic Dam-related activities
BHP Billiton
Value of BHP Billiton’s contribution to the Matched Giving Program
BHP Billiton
BHP Billiton’s reputation in Roxby Downs, Andamooka and Woomera, for example, via a community perceptions survey
BHP Billiton
Trend indicators
Attitudes about community life in Roxby Downs, for example, via a community perceptions survey, which measures attitudes on social interactions, community cohesion and cultural diversity
BHP Billiton
Existing management measures
BHP Billiton Stakeholder Engagement Management Plan BHP Billiton Olympic Dam Community Development Management Plan BHP Billiton Olympic Dam Community Complaints Register

Controls/Management Actions Actions Responsibility Timeframe
See Olympic Dam Expansion EIS Commitments
Continue consultation with affected parties and stakeholders on the proposed expansion throughout the project construction phase
BHP Billiton
Implement consultation activities that address the specific needs of different stakeholders and to respond to community issues as the project progresses
BHP Billiton
Record stakeholder engagement activities, responses to concerns and complaints, outcomes, agreements and commitments
BHP Billiton
Implement a dedicated communications program to the broader community, to provide information about the project’s progression through the construction and execution phases
BHP Billiton
1. BHP Billiton commits to ongoing community consultation with affected parties on the proposed expansion. Interaction with the many stakeholders who have already been consulted as part of the project planning phase would continue throughout the project construction, execution and decommissioning phases, including: • the Australian, South Australian, Northern
Territory and local governments • local communities • pastoralists and landholders (Draft EIS 7.4 and Supplementary EIS 21.5.3)
Review and update the Stakeholder Engagement Management Plan annually
BHP Billiton
As above BHP Billiton 2. A program of ongoing consultation with stakeholders would be undertaken to address community issues associated with the landing facility. This consultation would continue throughout the project construction, execution and decommissioning phases (Supplementary EIS 7.3)
(See also Access and Disturbance)
Develop and implement a communication plan about construction and operational activities at Port Augusta
BHP Billiton and Port Augusta Council
3. BHP Billiton would promote social and community cohesion within Hiltaba Village and Roxby Downs and aim to proactively manage the interactions and relationships between residents and the construction workforce to deliver positive and sustainable social and economic outcomes (Supplementary EIS 21.5.3 and 21.8)
(See also Crime and Anti-social Behaviour)
Undertake consultation with the community and workforce and develop strategies to achieve positive interactions and relationships between residents in nearby townships, the construction workforce and the permanent LDC workforce
BHP Billiton and Roxby Downs Council
Draft Social Management Framework P 27 of 34 April 2011 Supplementary EIS
Draft Social Management Framework P 28 of 34 April 2011 Supplementary EIS
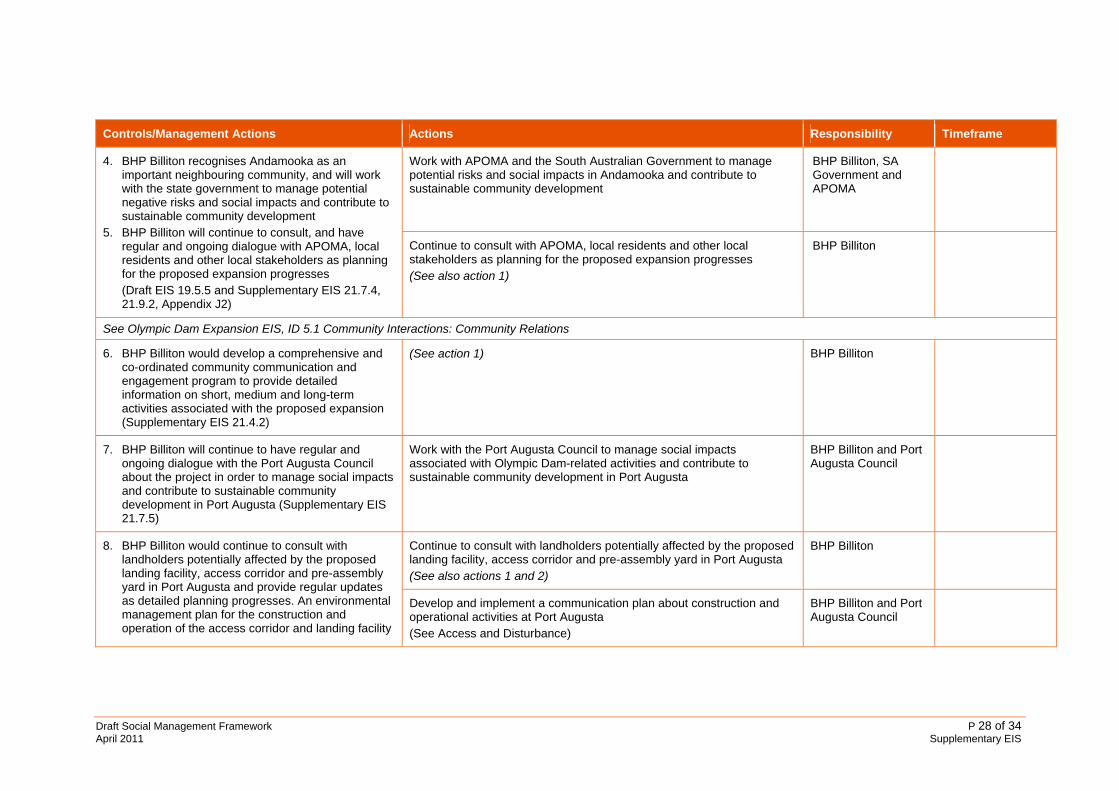
Controls/Management Actions Actions Responsibility Timeframe
Work with APOMA and the South Australian Government to manage potential risks and social impacts in Andamooka and contribute to sustainable community development
BHP Billiton, SA Government and APOMA
4. BHP Billiton recognises Andamooka as an important neighbouring community, and will work with the state government to manage potential negative risks and social impacts and contribute to sustainable community development
5. BHP Billiton will continue to consult, and have regular and ongoing dialogue with APOMA, local residents and other local stakeholders as planning for the proposed expansion progresses (Draft EIS 19.5.5 and Supplementary EIS 21.7.4, 21.9.2, Appendix J2)
Continue to consult with APOMA, local residents and other local stakeholders as planning for the proposed expansion progresses (See also action 1)
BHP Billiton
See Olympic Dam Expansion EIS, ID 5.1 Community Interactions: Community Relations
6. BHP Billiton would develop a comprehensive and co-ordinated community communication and engagement program to provide detailed information on short, medium and long-term activities associated with the proposed expansion (Supplementary EIS 21.4.2)
(See action 1) BHP Billiton
7. BHP Billiton will continue to have regular and ongoing dialogue with the Port Augusta Council about the project in order to manage social impacts and contribute to sustainable community development in Port Augusta (Supplementary EIS 21.7.5)
Work with the Port Augusta Council to manage social impacts associated with Olympic Dam-related activities and contribute to sustainable community development in Port Augusta
BHP Billiton and Port Augusta Council
Continue to consult with landholders potentially affected by the proposed landing facility, access corridor and pre-assembly yard in Port Augusta (See also actions 1 and 2)
BHP Billiton 8. BHP Billiton would continue to consult with landholders potentially affected by the proposed landing facility, access corridor and pre-assembly yard in Port Augusta and provide regular updates as detailed planning progresses. An environmental management plan for the construction and operation of the access corridor and landing facility
Develop and implement a communication plan about construction and operational activities at Port Augusta (See Access and Disturbance)
BHP Billiton and Port Augusta Council
Draft Social Management Framework P 29 of 34 April 2011 Supplementary EIS
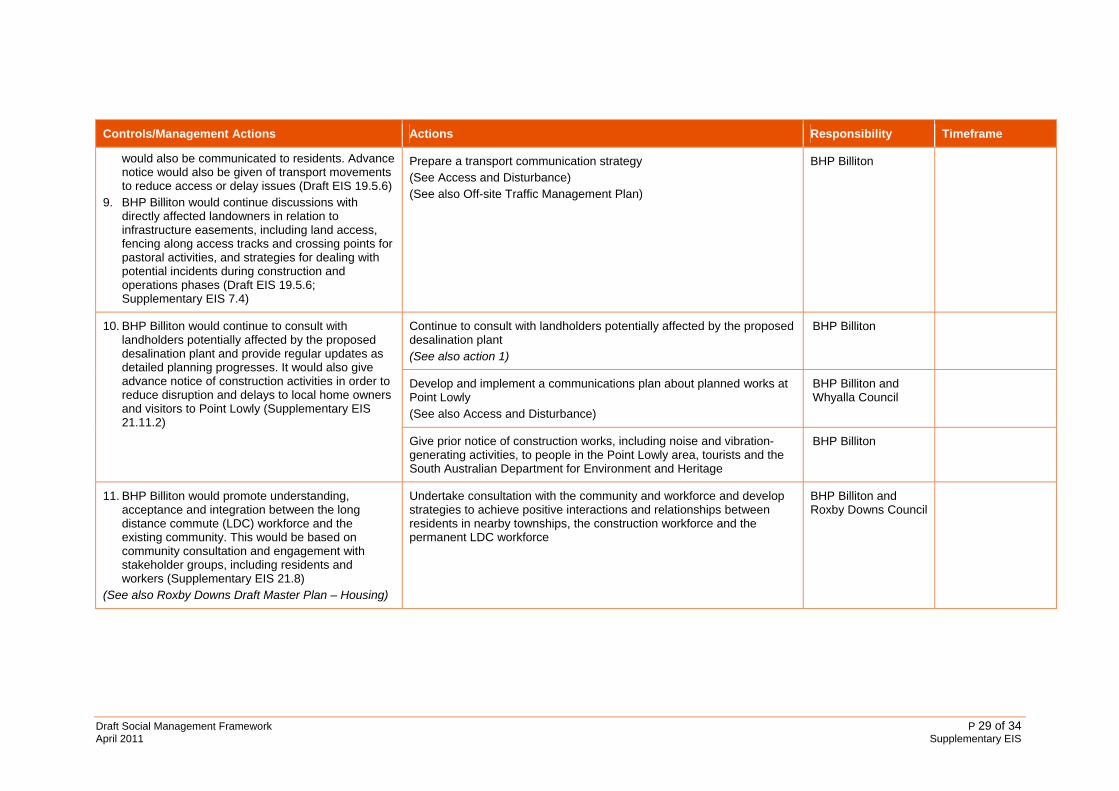
Controls/Management Actions Actions Responsibility Timeframe
would also be communicated to residents. Advance notice would also be given of transport movements to reduce access or delay issues (Draft EIS 19.5.6)
9. BHP Billiton would continue discussions with directly affected landowners in relation to infrastructure easements, including land access, fencing along access tracks and crossing points for pastoral activities, and strategies for dealing with potential incidents during construction and operations phases (Draft EIS 19.5.6; Supplementary EIS 7.4)
Prepare a transport communication strategy (See Access and Disturbance) (See also Off-site Traffic Management Plan)
BHP Billiton
Continue to consult with landholders potentially affected by the proposed desalination plant (See also action 1)
BHP Billiton
Develop and implement a communications plan about planned works at Point Lowly (See also Access and Disturbance)
BHP Billiton and Whyalla Council
10. BHP Billiton would continue to consult with landholders potentially affected by the proposed desalination plant and provide regular updates as detailed planning progresses. It would also give advance notice of construction activities in order to reduce disruption and delays to local home owners and visitors to Point Lowly (Supplementary EIS 21.11.2)
Give prior notice of construction works, including noise and vibration-generating activities, to people in the Point Lowly area, tourists and the South Australian Department for Environment and Heritage
BHP Billiton
11. BHP Billiton would promote understanding, acceptance and integration between the long distance commute (LDC) workforce and the existing community. This would be based on community consultation and engagement with stakeholder groups, including residents and workers (Supplementary EIS 21.8)
(See also Roxby Downs Draft Master Plan – Housing)
Undertake consultation with the community and workforce and develop strategies to achieve positive interactions and relationships between residents in nearby townships, the construction workforce and the permanent LDC workforce
BHP Billiton and Roxby Downs Council

Draft Social Management Framework P 30 of 34 April 2011 Supplementary EIS
Controls/Management Actions Actions Responsibility Timeframe
See Olympic Dam Expansion EIS, ID 5.1 Community Interactions: Roxby Downs Master Plan
Continue to consult with local residents and other local stakeholders in Roxby Downs and Andamooka throughout the project planning, construction, execution and decommissioning phases (See also action 1)
BHP Billiton
Work with Roxby Downs Council, Roxby Downs Health Services and the community to develop and implement a new residents’ program and other community-building activities
Roxby Downs Council, Roxby Downs Health Services and BHP Billiton
Provide all employees with information about, and access to, BHP Billiton’s Matched Giving Program
BHP Billiton
Update the Community Development Management Plan annually BHP Billiton
Undertake a community perception and workforce survey every three years
BHP Billiton and Roxby Downs Council
Prepare and distribute education programs and information on cultural diversity to employees, new and existing residents of Roxby Downs, and workers accommodated at Hiltaba Village (See Crime and Anti-Social Behaviour)
BHP Billiton and Roxby Downs Council
12. BHP Billiton would promote community identity and cohesion in Roxby Downs by (Draft EIS 19.5.5): • holding regular community forums on the
expansion project in Roxby Downs and Andamooka
• working with the council to provide an ongoing and proactive new residents’ program and community-building activities to facilitate positive cultural and social interaction
• implementing education programs promoting responsible social and environmental behaviours and ethics
Work with Roxby Downs Council and community organisations to develop and implement an education program promoting responsible social and environmental behaviours and ethics
Roxby Downs Council, in collaboration with BHP Billiton

Draft Social Management Framework P 31 of 34 April 2011 Supplementary EIS
Controls/Management Actions Actions Responsibility Timeframe
See Olympic Dam Expansion EIS, ID 5.1 Community Interactions: Community Education
Develop a management plan with the Roxby Downs Council and other stakeholders to minimise the environmental impact of recreational activities around Roxby Downs
Roxby Downs Council and BHP Billiton
Include information about potential damage to Aboriginal heritage sites from off-road vehicles in new employee and contractor education programs
BHP Billiton
Encourage the use of existing designated recreational driving areas (such as the motocross track, go-kart track and Roxby Raceway/Speedway - the dirt circuit car club)
Roxby Downs Council
Continue to implement education, training and awareness programs for BHP Billiton employees and contractors via inductions
BHP Billiton
Inform new residents of Roxby Downs and Hiltaba Village about appropriate recreational sites, opportunities and practices
Roxby Downs Council and BHP Billiton
Work with community groups to increase community support for better management of recreational activities in the vicinity of Roxby Downs
Roxby Downs Council, in collaboration with BHP Billiton
Investigate the feasibility of establishing and signposting four-wheel-drive and motorbike circuits near Roxby Downs
Roxby Downs Council, in collaboration with BHP Billiton
Continue discussions with government to ensure sufficient resources are available to monitor inappropriate off-road driving, and closing off and rehabilitating inappropriate tracks
BHP Billiton and SA Government
13. BHP Billiton would implement a management plan to minimise the environmental impact of recreational activities around Roxby Downs (Draft EIS 15.5.11)
14. BHP Billiton would work with local law enforcement agencies and the community to seek to manage off-road driving (Supplementary EIS 21.11.3)
15. BHP Billiton would implement an active education program promoting responsible social and environmental behaviour and ethics for all employees, contractors and residents on a range of social considerations, including care for the environment, and incorporating guidelines relating to recreational driving on pastoral or BHP Billiton land (Supplementary EIS 21.11.3)
Implement education strategies which address outdoor ethics and principles for the appropriate management of natural areas
Roxby Downs Council, in collaboration with BHP Billiton
Draft Social Management Framework P 32 of 34 April 2011 Supplementary EIS
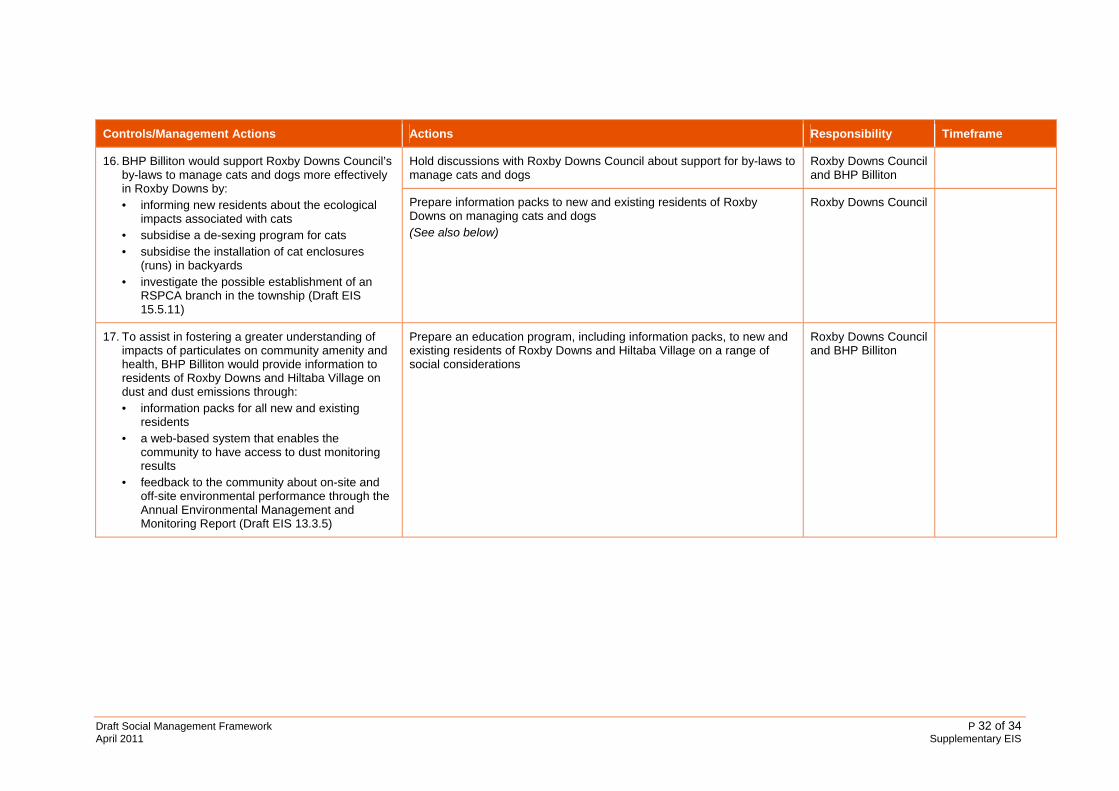
Controls/Management Actions Actions Responsibility Timeframe
Hold discussions with Roxby Downs Council about support for by-laws to manage cats and dogs
Roxby Downs Council and BHP Billiton
16. BHP Billiton would support Roxby Downs Council’s by-laws to manage cats and dogs more effectively in Roxby Downs by: • informing new residents about the ecological
impacts associated with cats • subsidise a de-sexing program for cats • subsidise the installation of cat enclosures
(runs) in backyards • investigate the possible establishment of an
RSPCA branch in the township (Draft EIS 15.5.11)
Prepare information packs to new and existing residents of Roxby Downs on managing cats and dogs (See also below)
Roxby Downs Council
17. To assist in fostering a greater understanding of impacts of particulates on community amenity and health, BHP Billiton would provide information to residents of Roxby Downs and Hiltaba Village on dust and dust emissions through: • information packs for all new and existing
residents • a web-based system that enables the
community to have access to dust monitoring results
• feedback to the community about on-site and off-site environmental performance through the Annual Environmental Management and Monitoring Report (Draft EIS 13.3.5)
Prepare an education program, including information packs, to new and existing residents of Roxby Downs and Hiltaba Village on a range of social considerations
Roxby Downs Council and BHP Billiton
Draft Social Management Framework P 33 of 34 April 2011 Supplementary EIS
Controls/Management Actions Actions Responsibility Timeframe
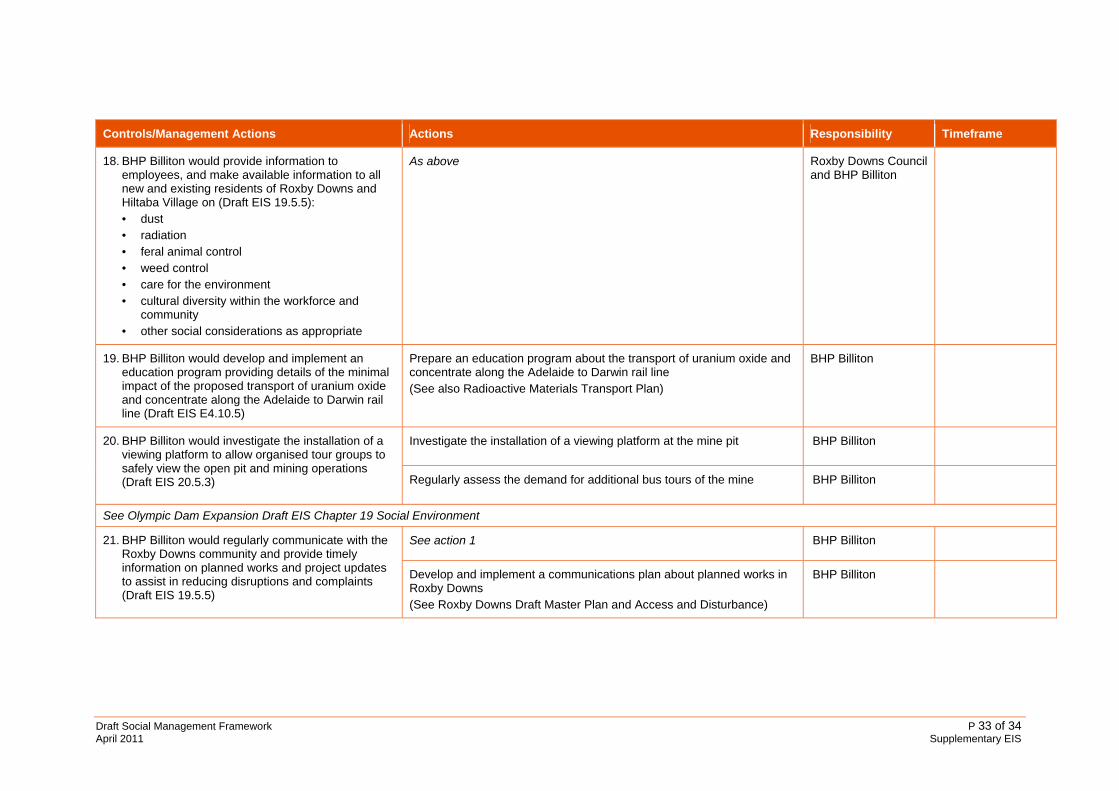
18. BHP Billiton would provide information to employees, and make available information to all new and existing residents of Roxby Downs and Hiltaba Village on (Draft EIS 19.5.5): • dust • radiation • feral animal control • weed control • care for the environment • cultural diversity within the workforce and
community • other social considerations as appropriate
As above Roxby Downs Council and BHP Billiton
19. BHP Billiton would develop and implement an education program providing details of the minimal impact of the proposed transport of uranium oxide and concentrate along the Adelaide to Darwin rail line (Draft EIS E4.10.5)
Prepare an education program about the transport of uranium oxide and concentrate along the Adelaide to Darwin rail line (See also Radioactive Materials Transport Plan)
BHP Billiton
Investigate the installation of a viewing platform at the mine pit BHP Billiton 20. BHP Billiton would investigate the installation of a viewing platform to allow organised tour groups to safely view the open pit and mining operations (Draft EIS 20.5.3) Regularly assess the demand for additional bus tours of the mine BHP Billiton
See Olympic Dam Expansion Draft EIS Chapter 19 Social Environment
See action 1 BHP Billiton 21. BHP Billiton would regularly communicate with the Roxby Downs community and provide timely information on planned works and project updates to assist in reducing disruptions and complaints (Draft EIS 19.5.5)
Develop and implement a communications plan about planned works in Roxby Downs (See Roxby Downs Draft Master Plan and Access and Disturbance)
BHP Billiton

Draft Social Management Framework P 34 of 34 April 2011 Supplementary EIS
Risk items (Draft EIS 26.3 and Appendix U) Contingency options Responsibility Timeframe
A. Indiscriminate off-road driving at Hiltaba Village and Roxby Downs due to inadequate resident awareness, inadequate education and training of workers and/or failure to provide adequate alternative activities; failure of management systems
Include information about off-road driving in new employee and contractor education programs; refer to SA Police (See also EMP ID 1.1 Land disturbance)
Roxby Downs Council, BHP Billiton and SA Police
B. Indiscriminate off-road driving along linear infrastructure leading to damage of aboriginal heritage sites due to inadequate education and training of workers; failure of management systems
Include information about potential damage to Aboriginal heritage sites from off-road vehicles in new employee and contractor education programs; refer to SA Police (See also EMP ID 1.1 Land disturbance)
Roxby Downs Council, SA Police and BHP Billiton
C. Collecting and fossicking of fossils due to inadequate resident awareness and/or failure to provide adequate alternative recreational activities at Hiltaba Village and Roxby Downs
Include information about fossils in new employee and contractor education programs; refer to local authorities (See also EMP ID 1.1 Land disturbance)
Roxby Downs Council, BHP Billiton and SA Department of Environment and Natural Resources
D. Public outcry over rail transport of uranium oxide and concentrate due to public failure to understand actual risks of such transport
Include new/additional public information and education program BHP Billiton
E. Public concern due to expansion of Roxby Downs and Hiltaba Village
Revise social management plan to address concerns Provide for joint or additional actions though the Social Management Partnership
BHP Billiton and SA Government
Olympic Dam Expansion Supplementary Environmental Impact Statement 20101
Andamooka social impact assessment
APPENDIX J2

BHP BILLITON PROPOSED OLYMPIC DAM MINE EXPANSION
ANDAMOOKA - SOCIAL IMPACT ASSESSMENT
May 2009
Report prepared by Margaret Heylen for ARUP HLA
Margaret Heylen Social Planning and Community Engagement 14 Penola Road, Algate SA 5154 Telephone: 08 8339 1506 Mobile: 0419 818166

Andamooka – Social Impact Assessment
BHP BILLITON PROPOSED OLYMPIC DAM MINE EXPANSION
ANDAMOOKA - SOCIAL IMPACT ASSESSMENT
May 2009
Contents
1. Purpose of the Study 1 2. Assessment Methods 1 3. Existing Social Environment 2
3.1 Introduction 2 3.2 Character and culture of Andamooka 2 3.3 Population and demographic profile 3 3.4 Governance, and planning and development 6
3.4.1 Review of governance arrangements 7 3.4.2 Development Plan Amendment Report 7
3.5 Education, employment and labour 8 3.6 Housing and accommodation 11 3.7 Community facilities, infrastructure and services 13
3.7.1 Facilities and infrastructure 13 3.7.2 Community services 14 3.7.3 Health services 15 3.7.4 Education and child care services 15 3.7.5 BHP Billiton Community Development Program 16 3.7.6 Police and justice services 17 3.7.7 Emergency services 17
3.8 Transport, access and mobility 18 4. Key social and community issues for impact assessment 18
4.1 Trends and experiences in Andamooka since 1996 19 4.1.1 Socio-demographic changes 19 4.1.2 Population growth and housing 21 4.1.3 Governance arrangements 22 4.1.4 Changes in character and identity 22
4.2 Employment and business opportunities 23 4.3 Community and social services 24 4.4 Crime and anti-social behaviour 25 4.5 community safety, health and amenity 26
4.5.1 Increased traffic volumes 26 4.5.2 Airport location 27 4.5.3 Dust and air-borne contamination 27
4.6 Experiences from mining activities elsewhere 28 5. Findings from the social impact assessment for Andamooka 30
5.1 Growth and Development 30 5.2 Employment and business opportunities 32 5.3 Character and identity 33 5.4 Community and social services 34 5.5 Crime and anti-social behaviour 35
6. Cumulative effects 36 References and bibliography
37
Appendix A: Socio-demographic characteristics of Andamooka and South Australia
39
Prepared by Margaret Heylen, Social Planning Consultant, for ARUP HLA 1

Andamooka – Social Impact Assessment
Prepared by Margaret Heylen, Social Planning Consultant, for ARUP HLA 2
1. PURPOSE OF THE STUDY The purpose of the study is to supplement the information contained in the Draft EIS on the potential beneficial and adverse social impacts on Andamooka from the construction and operation phases of the proposed Olympic Dam mine expansion. This study: • describes the existing demography, character, governance arrangements and
services in Andamooka • outlines the key social issues and community concerns associated with the
proposed expansion • presents the findings of a social impact assessment, with particular reference to:
o social character o employment and business opportunities o housing and accommodation o community facilities, infrastructure and services o crime and anti-social behaviour o community health and wellbeing.
2. ASSESSMENT METHODS The methods used in this study are based on the principles and guidelines adopted for the Draft EIS.1 The study predominantly involved desktop research and a review of the extensive social research and benchmarking undertaking for the Draft EIS, with a focus on further exploring the data and specific impacts on Andamooka. Additional investigations undertaken for the study included: • a review of public reports and literature of relevance to Andamooka, including
community plans, government reports, media articles, and literature on the social impacts of other mining developments
• a review of reports on community consultation undertaken in Andamooka for the Draft EIS and other purposes, including for the review of governance arrangements undertaken by the Outback Areas Community Development Trust in 2007 (Heylen 2007)
• a review of existing governance and planning arrangements, and proposed future arrangements affecting Andamooka as an-out-of council area, including the Land Not Within a Council PAR (Planning SA July 2008) and Outback Communities (Administration and Management) Bill 2009
• social research to review the impacts in Andamooka reported in the previous expansion of Olympic Dam, including a review of socio-demographic characteristics and changes over the last three census based on ABS statistics
• a site visit to Andamooka and consultation with key stakeholders to update information in the Draft EIS and to assess the potential impacts as a result of the proposed expansion. This included consultations with the following agencies: • Outback Areas Community Development Trust (OACDT) • Andamooka Progress and Opal Miners Association (APOMA) • Andamooka Primary School and Rural Children’s Centre • Frontier Services – Andamooka Community Support Services and
Andamooka Community Health Services.
1 Principles and guidelines adapted from the International Association for Impact Assessment (Vanclay 2003) and the International Finance Corporation (2003)
Andamooka – Social Impact Assessment
Prepared by Margaret Heylen, Social Planning Consultant, for ARUP HLA 3
Identifying the key social and community issues for impact assessment has been informed by: • an understanding of the existing social environment, reported in Section 3 • an analysis of changes in demography since the last Olympic Dam expansion in
the late 1990s (refer 4.1 Changes in demography since 1996), based a review of ABS data from the 1996, 2001 and 2006 census in Andamooka and South Australia (see also Appendix A)
• a review of the impacts and issues reported by residents, service providers and the local media in Andamooka during and since the previous expansion (refer 4.1.2 Changes in the character of Andamooka)
• the outcomes of community consultation on the proposed expansion of Olympic Dam and possible impacts, as referred to in Draft EIS, Chapter 19 Social Environment, Section 19.5 Impact assessment and management; and during a subsequent site visit in April 2009 (refer 4.3 Community consultation outcomes)
• a review of literature relating to major mining projects in Australia and the impact on local communities (refer 4.4 Experiences from mining activities elsewhere).
3. EXISTING SOCIAL ENVIRONMENT 3.1 Introduction Andamooka is situated approximately 600 kilometers north of Adelaide and 33 kilometers east of the township of Roxby Downs. It has grown from the scattered mine camps that set up following the discovery of opal in the late 1920s. Today, the settlement of Andamooka sits within a precious stones field that occupies 220 square kilometers within and excised from the surrounding Andamooka pastoral lease. 3.2 Character and culture of Andamooka2 The unique character, culture and layout of Andamooka derives from its opal mining heritage dating back to the late 1920s. The outback settlement sprawls either side of a creek bed, along which can be found some original, well-maintained, State Heritage listed cottages and semi-dug-outs that date back to 1931. These first homes established the pattern for underground living at Andamooka as an escape from the summer heat. Elsewhere in the town, facades that often appear ramshackle lead to underground homes that are spacious, comfortable and sometimes even opulent. There are a number of other historic sites, such as the opal mining “dumps” and the opal fields surrounding the town. The stones that are sought after range from matrix opals, which are unique to the area, to world class opals. These gems have attracted many fossickers from around the world, resulting in a diverse multicultural society living in the isolated town of Andamooka. Andamooka comprises a mixture of predominantly single-storey, low density detached dwellings, and small-scale retail, businesses servicing local residents, business operators and tourists. Tourism is important to the economy of the town, which is actively promoted as a unique destination where visitors can watch skilled opal cutters at work, take a tour of the town and heritage cottages, and learn about the history and folklore of the area.
2 Much of the information recorded in Section 3.2 has been sourced from the Outback Areas Community Development Trust, refer website <www.oacdt.sa.gov.au>

Andamooka – Social Impact Assessment
Prepared by Margaret Heylen, Social Planning Consultant, for ARUP HLA 4
Tourist facilities include motel-style accommodation at the hotel, a bed and breakfast facility, caravan park and a camping ground; as well as every day access to fuel, a post office, and a public internet centre. 3.3 Population and demographic profile
The population of Andamooka has fluctuated over the years, with 526 residents and 80 visitors counted at the 2006 census (ABS 2007a). The population also varies seasonally, and APOMA estimates it rises to approximately 1,000 people in the cooler winter months. The lack of precision in population estimates is likely to be a product of the extreme summer heat and the irregular lifestyle of people who come to Andamooka to mine opals or who prefer an unregulated existence.
Historically, opal mining has been the main source of income in the town but since the early 2000s there has been a decrease in residents involved in opal mining activity (estimated currently to be 10-15% of the population3), and an increase in the number of residents who have work associated with Olympic Dam or work in Roxby Downs.
ABS census data shows high population growth between the 2001 and 2006 censuses (14.3% population increase) and a further large increase reported since then. In late 2008, APOMA estimated the population to be around 800 people4, while Planning SA estimated the population to be over 900 people, including temporary workers (Planning SA 2008). APOMA report that the population in Andamooka has decreased since late 2008.
Planning SA (2006) has forecast continuing population increases based on increased mining activity in the area, particularly at the Olympic Dam mine site. Table 1 provides summary data from the 2006 census for Andamooka compared to Roxby Downs, the Northern Statistical Division and South Australia (taken from the Draft EIS, Chapter 19 Social Environment, Section 19.3.3).
3 APOMA estimate during consultation in April 2009 4 APOMA media statements: Adelaide Advertiser 25/11/2008, page 42
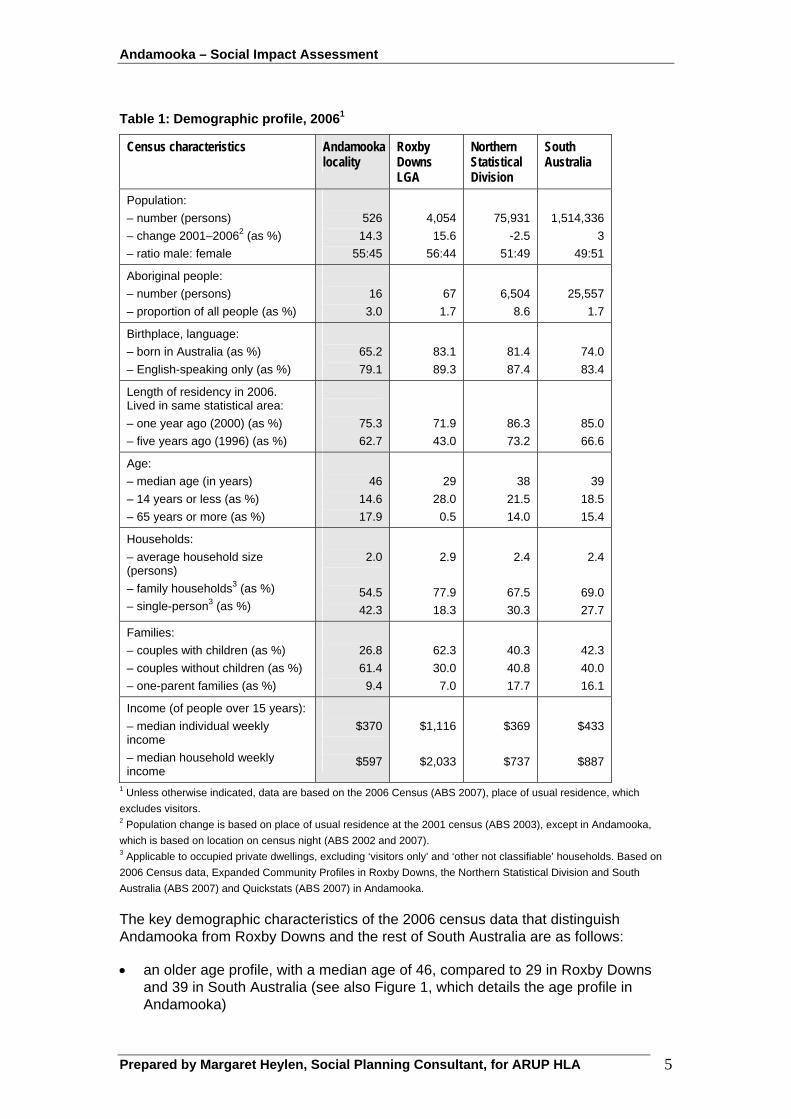
Andamooka – Social Impact Assessment
Table 1: Demographic profile, 20061
Census characteristics Andamooka locality
Roxby Downs LGA
Northern Statistical Division
South Australia
Population:
– number (persons)
– change 2001–20062 (as %)
– ratio male: female
526
14.3
55:45
4,054
15.6
56:44
75,931
-2.5
51:49
1,514,336
3
49:51
Aboriginal people:
– number (persons)
– proportion of all people (as %)
16
3.0
67
1.7
6,504
8.6
25,557
1.7
Birthplace, language:
– born in Australia (as %)
– English-speaking only (as %)
65.2
79.1
83.1
89.3
81.4
87.4
74.0
83.4
Length of residency in 2006. Lived in same statistical area:
– one year ago (2000) (as %)
– five years ago (1996) (as %)
75.3
62.7
71.9
43.0
86.3
73.2
85.0
66.6
Age:
– median age (in years)
– 14 years or less (as %)
– 65 years or more (as %)
46
14.6
17.9
29
28.0
0.5
38
21.5
14.0
39
18.5
15.4
Households:
– average household size (persons)
– family households3 (as %)
– single-person3 (as %)
2.0
54.5
42.3
2.9
77.9
18.3
2.4
67.5
30.3
2.4
69.0
27.7
Families:
– couples with children (as %)
– couples without children (as %)
– one-parent families (as %)
26.8
61.4
9.4
62.3
30.0
7.0
40.3
40.8
17.7
42.3
40.0
16.1
Income (of people over 15 years):
– median individual weekly income
– median household weekly income
$370
$597
$1,116
$2,033
$369
$737
$433
$887
1 Unless otherwise indicated, data are based on the 2006 Census (ABS 2007), place of usual residence, which
excludes visitors. 2 Population change is based on place of usual residence at the 2001 census (ABS 2003), except in Andamooka,
which is based on location on census night (ABS 2002 and 2007). 3 Applicable to occupied private dwellings, excluding ‘visitors only’ and ‘other not classifiable’ households. Based on
2006 Census data, Expanded Community Profiles in Roxby Downs, the Northern Statistical Division and South
Australia (ABS 2007) and Quickstats (ABS 2007) in Andamooka.
The key demographic characteristics of the 2006 census data that distinguish Andamooka from Roxby Downs and the rest of South Australia are as follows:
• an older age profile, with a median age of 46, compared to 29 in Roxby Downs and 39 in South Australia (see also Figure 1, which details the age profile in Andamooka)
Prepared by Margaret Heylen, Social Planning Consultant, for ARUP HLA 5
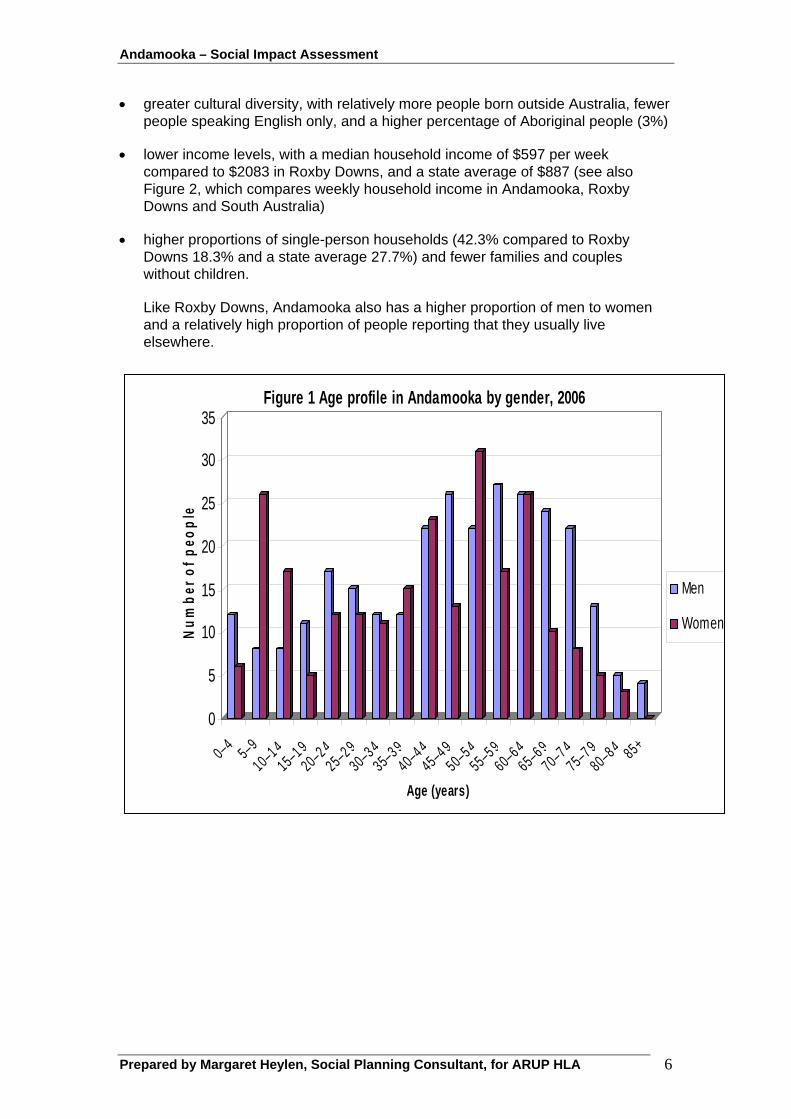
Andamooka – Social Impact Assessment
• greater cultural diversity, with relatively more people born outside Australia, fewer people speaking English only, and a higher percentage of Aboriginal people (3%)
• lower income levels, with a median household income of $597 per week compared to $2083 in Roxby Downs, and a state average of $887 (see also Figure 2, which compares weekly household income in Andamooka, Roxby Downs and South Australia)
• higher proportions of single-person households (42.3% compared to Roxby Downs 18.3% and a state average 27.7%) and fewer families and couples without children.
Like Roxby Downs, Andamooka also has a higher proportion of men to women and a relatively high proportion of people reporting that they usually live elsewhere.
0
5
10
15
20
25
30
35
Nu
mb
er o
f p
eop
le
0–45–9
10–1 415–1 9
20–2 425–2 9
30–3 435–3 9
40–4 445–4 9
50–5 455–5 9
60–6 465–6 9
70–7 475–7 9
80–8 4 85+
Age (years)
Figure 1 Age profile in Andamooka by gender, 2006
Men
Women
Prepared by Margaret Heylen, Social Planning Consultant, for ARUP HLA 6

Andamooka – Social Impact Assessment
0
2
4
6
8
10
12
14
16
18
20
Percentage
Negativ
e/nil
1–149
150–24
9
250–34
9
350–49
9
500–64
9
650–79
9
800–99
9
1,000
–1,19
9
1,200
–1,39
9
1,400
–1,69
9
1,700
–1,99
9
2,000
–2,49
9
2,500
–2,99
9
3,000
or m
ore
Income ($)
Figure 2 Weekly household income: Andamooka, Roxby Downs and South Australia, 2006
Andamooka Roxby Downs South Australia
3.4 Governance, planning and development Andamooka is the most populous settlement in the State’s out-of-councils area. The town facilities and infrastructure are largely maintained and managed by Andamooka Progress and Opal Miners Association (APOMA) with funding and administrative support provided through the Outback Areas Community Development Trust (OACDT), a statutory authority established by the SA Government. APOMA has over 50 members and is currently run by a committee of eleven elected volunteers. An increase in development activity in Andamooka, together with the introduction of greater regulatory controls for infrastructure management, has led APOMA to raise concerns over the past several years about their capacity to control orderly development, to manage town affairs, and to maintain town facilities and infrastructure under the current governance arrangements. There has also been concern about the effective management of effluent/waste water disposal within the township. The SA Government’s responses to the issues raised by APOMA (and elsewhere in outback areas) have been to undertake a review of governance arrangements, and to prepare a Development Plan Amendment Report. The key elements of these initiatives are summarized as follows.
Prepared by Margaret Heylen, Social Planning Consultant, for ARUP HLA 7

Andamooka – Social Impact Assessment
Prepared by Margaret Heylen, Social Planning Consultant, for ARUP HLA 8
3.4.1 Review of governance arrangements A review of the OACDT legislation commenced in late 2007, and culminated in the drafting of the Outback Communities (Administration and Management) Bill 2009. The Bill was released for consultation in February 2009 and introduced to South Australian Parliament in early April 2009. The Bill proposes the establishment of an Outback Communities Authority, which would replace the OACDT, and new governance arrangements for all “lands not within a Council Area”, which includes Andamooka. The features of the proposed new framework which are relevant to the issues raised in Andamooka include: • strengthened powers to manage development and regulate matters such as
rubbish collection, litter, abandoned vehicles, and hazards including animals causing a nuisance
• allowing for the creation of an asset sustainability levy (applicable to all properties) and a community contribution where requested by the local community, to better maintain local infrastructure
• increased requirements for community consultation between OACDT, managing bodies and communities about infrastructure, service planning and community management, including the development of 5 year strategic plans and annual business plans for the local community
• increased support from OACDT to community association volunteers, including administrative, professional and advisory services.
3.4.2 Development Plan Amendment Report A Plan Amendment Report (PAR) 5 for Andamooka came into effect on 3 July 2008, under the terms of the Development Act 1993 (SA). The PAR deals with the specific issue of waste water disposal in Andamooka, and land division controls within a defined Policy Area. The Andamooka PAR introduced Andamooka Policy Area 1 (encompassing the existing Andamooka township boundary) where a new site area for land division applies to ensure new development has the capacity to accommodate suitable on-site wastewater disposal facilities. The objectives of the Policy Area 1 allow for: • small-scale settlement activities, consisting of services and facilities to meet the
needs of the remote community and visitors; and • development that contributes to the desired character of the policy area. New development is to be of a scale and form that protects and maintains the area’s unique remote and rugged qualities, with single-storey, low density detached dwellings allowed in the residential areas. Development is not to compromise viewscapes from the town centre and at the entrances to the town. The following forms of development, consistent with the desired character, are envisaged in the Policy Area: • detached dwellings • small scale retail and service activities.
Dwellings or other forms of accommodation are to be limited to a detached dwelling on an allotment of not less than 1200 square metres connected to: • an approved Community Wastewater Management System; or
5 Planning SA Land not Within a Council Area Eyre, Far North, Riverland and Whyalla – Remote Area Zone PAR 3 July 2008

Andamooka – Social Impact Assessment
• an approved on-site waste control system; and • the town’s reticulated electrical power supply or have independent power
generation that complies with the conditions set out in the PAR. The town centre will continue to be the focus for small commercial and civic activities, such as cafes, hotels, restaurants, offices, tourist facilities and shops, along the main street. Large-scale commercial development will be accommodated to the south-west of the town centre along the southern entrance road, while light industry will locate within the White Dam Road precinct. 3.5 Education, employment and labour
Data from the 2006 census shows Andamooka has relatively low education levels compared to Roxby Downs and South Australia (see Table 2), with lower proportions of the population in Andamooka attending an educational institution; having completed Year 12 (see Figure 3); or having completed a tertiary education.
Table 2: Educational attainment, 20061
Education Andamooka locality
Roxby Downs LGA
Northern Statistical Division
South Australia
Attending an educational institution (all people) (as %)
27.9
33.5
30.0
29.5
Completed Year 12 (people aged 15+ years) (as %)
24.0 40.8 24.9 38.3
Completed a tertiary education (people aged 15+ years) (as %)2
44.7 56.1 43.2 48.3
1 Based on 2006 census data (ABS 2007), place of usual residence. 2 Includes people whose level of tertiary education was not stated or inadequately stated.
As shown in Table 3, Andamooka has a relatively low labour force participation rate (which is reflected in its older age profile) and relatively high unemployment.
Table 3: Labour force participation 20061, 2
Andamooka
locality Roxby Downs LGA
Northern Statistical Division
South Australia
Labour force participation
49.9 82.0 55.6 59.0
Unemployment 11.1 2.3 6.4 3.5
1 Based on 2006 census data (ABS 2007), place of usual residence, as a per cent of people over 15 years of
age. 2 Excludes not stated and overseas visitors.
Prepared by Margaret Heylen, Social Planning Consultant, for ARUP HLA 9

Andamooka – Social Impact Assessment
Prepared by Margaret Heylen, Social Planning Consultant, for ARUP HLA 10
Figure 3 Level of schooling completed in Andamooka, Roxby Downs and South Australia, 2006
0 5 10 15 20 25 30 35 40 45
Year 12
Year 11
Year 10
Year 9
Year 8
Did not attend school
Percentage
Andamooka South Australia Roxby Dow ns
Mining is the dominant industry, followed by construction, accommodation and food services, administrative and support services and manufacturing (see Table 4).
Technicians and trades workers, machinery operators and drivers, and labourers make up over 60% of the workforce, with higher proportions of people employed in these occupations compared to South Australia and fewer professionals and managers (see Table 5).
BHP Billiton records show 220 residents in Andamooka are employed (including contractors) at Olympic Dam6. Further information on the existing workforce employed at Olympic Dam and future requirements for the construction and operation phase of the proposed expansion are discussed in detail in the Draft EIS, Chapter 19, Social Environment - Section 19.3.4 Employment and Labour, and Section 19.5.1 Labour supply. Table 4 Employment by industry, 2006
Industry type
Andamooka Locality
Roxby Downs LGA
Northern Statistical Division
South Australia
Mining 24.8 48.6 6.9 0.9
Construction 10.2 8.2 5.8 6.7
Administrative and support services
7.8 6.2 3.3 3.4
Accommodation and food services
10.2 5.4 7.0 5.9
Retail trade 6.3 5.1 11.1 11.8
6 Data reported from Olympic Dam office in August 2008.
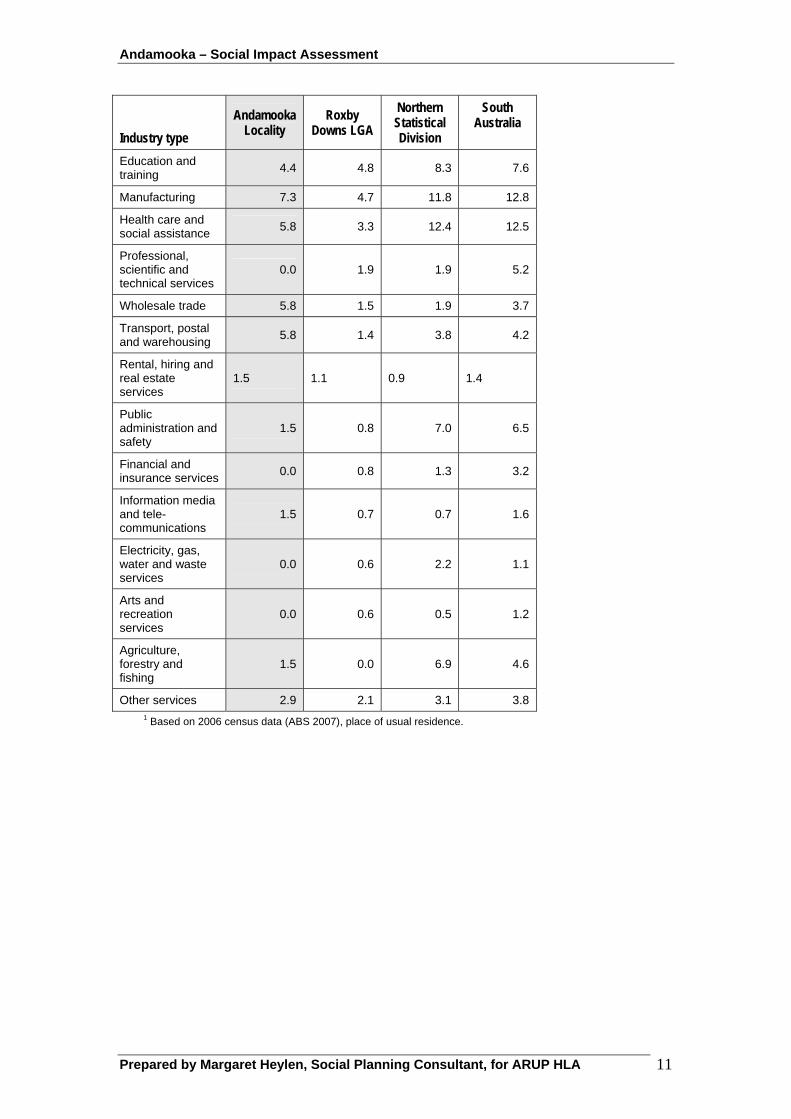
Andamooka – Social Impact Assessment
Prepared by Margaret Heylen, Social Planning Consultant, for ARUP HLA 11
Industry type
Andamooka Locality
Roxby Downs LGA
Northern Statistical Division
South Australia
Education and training
4.4 4.8 8.3 7.6
Manufacturing 7.3 4.7 11.8 12.8
Health care and social assistance
5.8 3.3 12.4 12.5
Professional, scientific and technical services
0.0 1.9 1.9 5.2
Wholesale trade 5.8 1.5 1.9 3.7
Transport, postal and warehousing
5.8 1.4 3.8 4.2
Rental, hiring and real estate services
1.5 1.1 0.9 1.4
Public administration and safety
1.5 0.8 7.0 6.5
Financial and insurance services
0.0 0.8 1.3 3.2
Information media and tele-communications
1.5 0.7 0.7 1.6
Electricity, gas, water and waste services
0.0 0.6 2.2 1.1
Arts and recreation services
0.0 0.6 0.5 1.2
Agriculture, forestry and fishing
1.5 0.0 6.9 4.6
Other services 2.9 2.1 3.1 3.8 1 Based on 2006 census data (ABS 2007), place of usual residence.
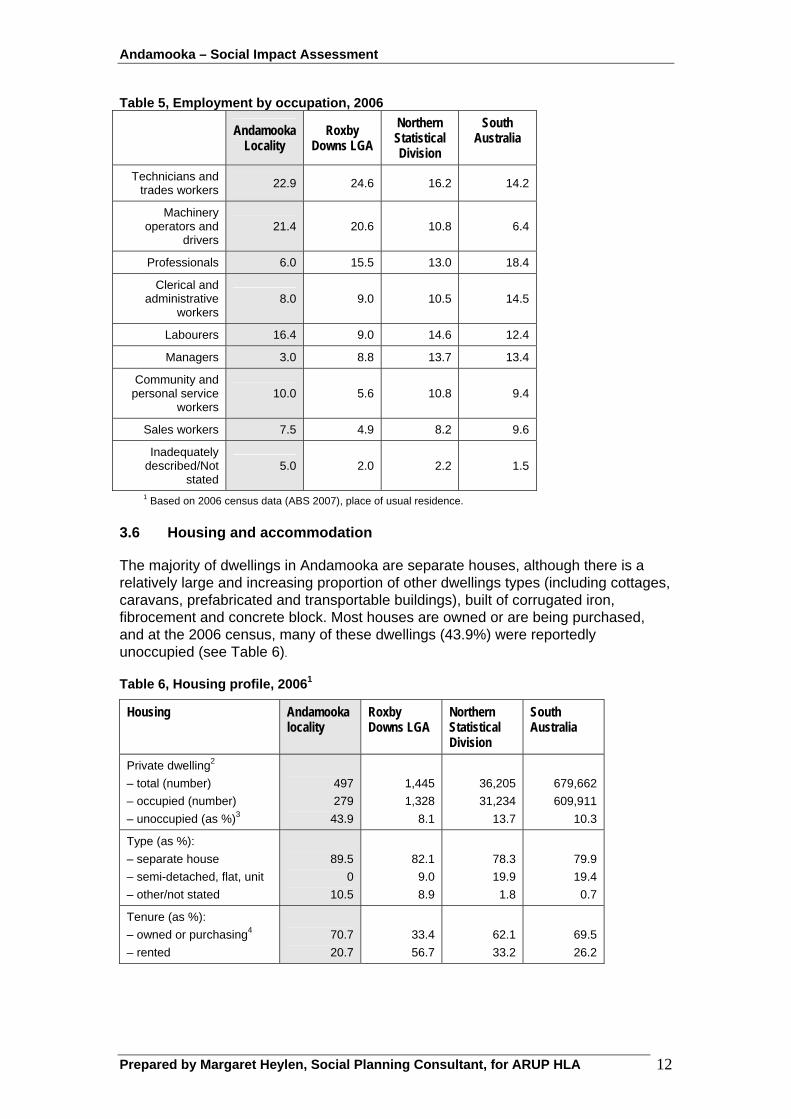
Andamooka – Social Impact Assessment
Table 5, Employment by occupation, 2006
Andamooka Locality
Roxby Downs LGA
Northern Statistical Division
South Australia
Technicians and trades workers
22.9 24.6 16.2 14.2
Machinery operators and
drivers 21.4 20.6 10.8 6.4
Professionals 6.0 15.5 13.0 18.4
Clerical and administrative
workers 8.0 9.0 10.5 14.5
Labourers 16.4 9.0 14.6 12.4
Managers 3.0 8.8 13.7 13.4
Community and personal service
workers 10.0 5.6 10.8 9.4
Sales workers 7.5 4.9 8.2 9.6
Inadequately described/Not
stated 5.0 2.0 2.2 1.5
1 Based on 2006 census data (ABS 2007), place of usual residence.
3.6 Housing and accommodation
The majority of dwellings in Andamooka are separate houses, although there is a relatively large and increasing proportion of other dwellings types (including cottages, caravans, prefabricated and transportable buildings), built of corrugated iron, fibrocement and concrete block. Most houses are owned or are being purchased, and at the 2006 census, many of these dwellings (43.9%) were reportedly unoccupied (see Table 6).
Table 6, Housing profile, 20061
Housing Andamooka locality
Roxby Downs LGA
Northern Statistical Division
South Australia
Private dwelling2
– total (number)
– occupied (number)
– unoccupied (as %)3
497
279
43.9
1,445
1,328
8.1
36,205
31,234
13.7
679,662
609,911
10.3
Type (as %):
– separate house
– semi-detached, flat, unit
– other/not stated
89.5
0
10.5
82.1
9.0
8.9
78.3
19.9
1.8
79.9
19.4
0.7
Tenure (as %):
– owned or purchasing4
– rented
70.7
20.7
33.4
56.7
62.1
33.2
69.5
26.2
Prepared by Margaret Heylen, Social Planning Consultant, for ARUP HLA 12
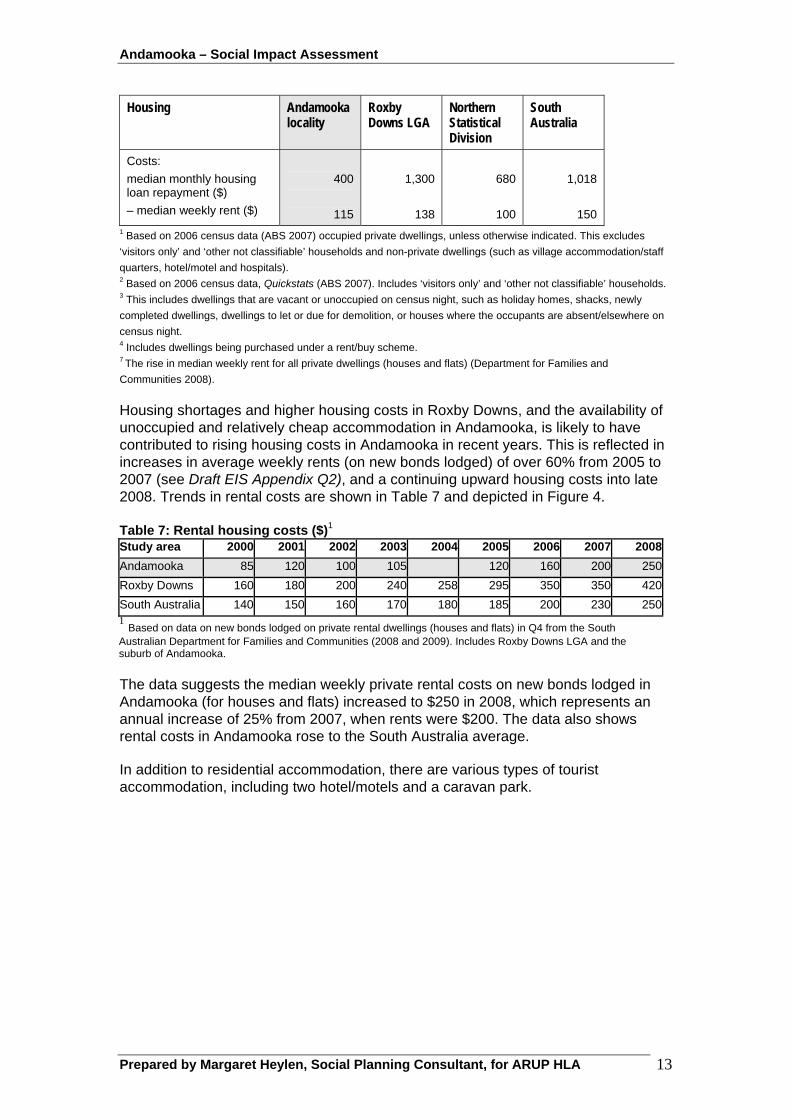
Andamooka – Social Impact Assessment
Prepared by Margaret Heylen, Social Planning Consultant, for ARUP HLA 13
Housing Andamooka locality
Roxby Downs LGA
Northern Statistical Division
South Australia
Costs:
median monthly housing loan repayment ($)
– median weekly rent ($)
400
115
1,300
138
680
100
1,018
150 1 Based on 2006 census data (ABS 2007) occupied private dwellings, unless otherwise indicated. This excludes
‘visitors only’ and ‘other not classifiable’ households and non-private dwellings (such as village accommodation/staff
quarters, hotel/motel and hospitals). 2 Based on 2006 census data, Quickstats (ABS 2007). Includes ‘visitors only’ and ‘other not classifiable’ households. 3 This includes dwellings that are vacant or unoccupied on census night, such as holiday homes, shacks, newly
completed dwellings, dwellings to let or due for demolition, or houses where the occupants are absent/elsewhere on
census night. 4 Includes dwellings being purchased under a rent/buy scheme. 7 The rise in median weekly rent for all private dwellings (houses and flats) (Department for Families and
Communities 2008).
Housing shortages and higher housing costs in Roxby Downs, and the availability of unoccupied and relatively cheap accommodation in Andamooka, is likely to have contributed to rising housing costs in Andamooka in recent years. This is reflected in increases in average weekly rents (on new bonds lodged) of over 60% from 2005 to 2007 (see Draft EIS Appendix Q2), and a continuing upward housing costs into late 2008. Trends in rental costs are shown in Table 7 and depicted in Figure 4.
Table 7: Rental housing costs ($)1 Study area 2000 2001 2002 2003 2004 2005 2006 2007 2008
Andamooka 85 120 100 105 120 160 200 250
Roxby Downs 160 180 200 240 258 295 350 350 420
South Australia 140 150 160 170 180 185 200 230 2501 Based on data on new bonds lodged on private rental dwellings (houses and flats) in Q4 from the South Australian Department for Families and Communities (2008 and 2009). Includes Roxby Downs LGA and the suburb of Andamooka.
The data suggests the median weekly private rental costs on new bonds lodged in Andamooka (for houses and flats) increased to $250 in 2008, which represents an annual increase of 25% from 2007, when rents were $200. The data also shows rental costs in Andamooka rose to the South Australia average.
In addition to residential accommodation, there are various types of tourist accommodation, including two hotel/motels and a caravan park.

Andamooka – Social Impact Assessment
Prepared by Margaret Heylen, Social Planning Consultant, for ARUP HLA 14
Figure 4 Rental housing costs
0
50
100
150
200
250
300
350
400
450
2000 2001 2002 2003 2004 2005 2006 2007 2008
Med
ian
wee
kly
ren
tal
($)
Andamooka Roxby Downs LGA South Australia
3.7 Community facilities, infrastructure, and services 3.7.1 Facilities and infrastructure APOMA manages and maintains a number of services and infrastructure (typically provided elsewhere by local government) through agreement with, and funding and administrative support from the OACDT, as summarized in Table 8.7 Table 8: Facilities and infrastructure managed by APOMA Service/Infrastructure Capacity/other issues Water – via pipeline and through agreement with BHP Billiton to town boundary. Trucked to privately owned storage tanks as required
Agreement for supply of 35 megalitres per annum Current use: 24 megalitres per annum Approved development applications will use extra capacity if they proceed
Waste management and recycling depot
The existing facility does not comply with EPA guidelines. OACDT is funding a study with the objective of upgrading the facility to comply with EPA guidelines
TV transmission – broadcasting infrastructure
Existing infrastructure is ageing and outdated. A review of options to upgrade to a digital system, with support from OACDT, is in progress
Community transport – 12 seater bus
Managed by volunteers and used for sport and recreation activities and visits to elsewhere in the region
Airstrip Aerodrome is in poor condition and is no longer inspected8
Recreational facilities – multi use sport court, swimming pool (shared facility with Andamooka Primary School)
The community bus transports young people to sporting events in Roxby Downs and is used for Girl Guide events
Public toilets Cemetery
7 Information provided during consultations with OACDT and APOMA in August 2007 and updated in April 2009 8 Based on comments from Department for Transport, Energy and Infrastructure in October 2008
Andamooka – Social Impact Assessment
Other infrastructure arrangements in Andamooka are as follows. • Waste/effluent disposal is the responsibility of individual property owners, via
septic tank or envirocycle systems. Since the operation of the PAR, disposal arrangements have been subject to development approval conditions set out in the PAR.
• electricity is provided through a private supplier, the facility being currently near or at capacity
• heritage conservation and preservation projects have been undertaken with the support of grant funding from BHP Billiton and local volunteers.
The context of a growing population, increased development activity, and higher level of environmental management controls and standards have exacerbated APOMA’s reported difficulties in managing town affairs.
3.7.2 Community services Many of the community and social support services in Andamooka are provided by the Andamooka Community Support Service, a subsidiary of Frontier Services (a national agency of the Uniting Church). The service operates the Home and Community Care Program, co-ordinating and brokering in-home, social support and respite care services to frail aged, younger people with a disability and their carers. The service is co-located with the Andamooka Community Health Service and is staffed by one full time practitioner in Andamooka and 6-7 casuals working on roster.
The client profile represents a large percentage of elderly clients. The service is currently managing the demand for services with some capacity for growth. Service needs and capacity are continually under review by Frontier Services. The Rural Children’s Centre based at the Andamooka Primary School (see also Section 3.7.4 Education and child care services) has recently been established by the Department of Education and Childrens Services and is becoming an important focus for family and children support services in Andamooka and linking with services in Roxby Downs. Future plans for these services offer an expansion of community support services in Andamooka, and include: • a focus on the Rural Children’s Centre as a regional resource, including
collaborative links with the Roxby Downs School and family support services in Roxby Downs
• the construction of a federally funded community space at the school as a shared school and community facility
• the potential development of a respite facility by Frontier Services, and a “Community Shed” program through the proposed shared community facility at the school.
Other community services in Andamooka include a post office (which is an agency for various banks and credit unions) and a supermarket. In addition to services provided in Andamooka, residents have access to a range of family and community services, government agencies, and educational and recreational options in Roxby Downs (discussed in the Draft EIS, Chapter 19 Social Environment, Section 19.3 Existing Environment).
Prepared by Margaret Heylen, Social Planning Consultant, for ARUP HLA 15

Andamooka – Social Impact Assessment
There is no emergency accommodation or a Safe House in Andamooka or Roxby Downs. Domestic violence victims are generally re-located to Port Augusta although in some limited circumstances informal arrangements have been made for emergency and short term accommodation in Roxby Downs or Andamooka. 3.7.3 Health services
Primary health care services are provided by Frontier Services through the Andamooka Community Health Service, which is open from 9 am to noon, and 2 pm to 5 pm weekdays (except Wednesday afternoon). The service is staffed by two remote area nurse practitioners on call (on roster) 24 hours a day, 7 days a week. The service provides a health clinic, community health, education, and an emergency para-medical service.
Frontier Services also operates a troop carrier ambulance in Andamooka. The Royal Flying Doctor Service, based at Port Augusta, provides phone support for medical advice. Acute/emergency care is accessed through the Roxby Downs Health Service and Hospital, and given the close proximity of this service by road there is limited call upon the Royal Flying Doctor Service.
A child and youth health nurse visits monthly from the Roxby Downs Health Service to provide health screening and parent education.
Other general and specialist health services are co-ordinated for Andamooka residents through Roxby Downs Health Service, including outreach services from the Port Augusta Hospital and Regional Health Service. Frontier Services is a member of the Roxby Downs Health Forum which comprises representatives from government and non-government agencies service providers. The forum was established to increase collaboration between agencies and to enhance planning for health and community services in the region.
3.7.4 Education and child care services
Education and family support services are provided from the Andamooka Primary School and Rural Children’s Centre, which includes a library and resource centre, swimming pool and multi-use sports court. Services are provided to families with young children, birth to year 6.
The Rural Children’s Centre is increasingly providing a critical link to social infrastructure in Andamooka and has become the focus of working “across schools” with Roxby Downs. The centre provides long day care, parenting programs, family support co-ordination, links to community services, support groups and counselling. There are currently 10 families using the service, including a few from Roxby Downs. Funding is tentative and service needs and programs are continually under review.
Eleven children currently attend the Andamooka Kindergarten, including 2 children with high needs from Roxby Downs, whose parents prefer the Andamooka environment with access to the Rural Children’s Centre programs.
Fourteen children currently attend the Andamooka Primary School, year 1 to year 5. It has capacity for 40 children.
Prepared by Margaret Heylen, Social Planning Consultant, for ARUP HLA 16
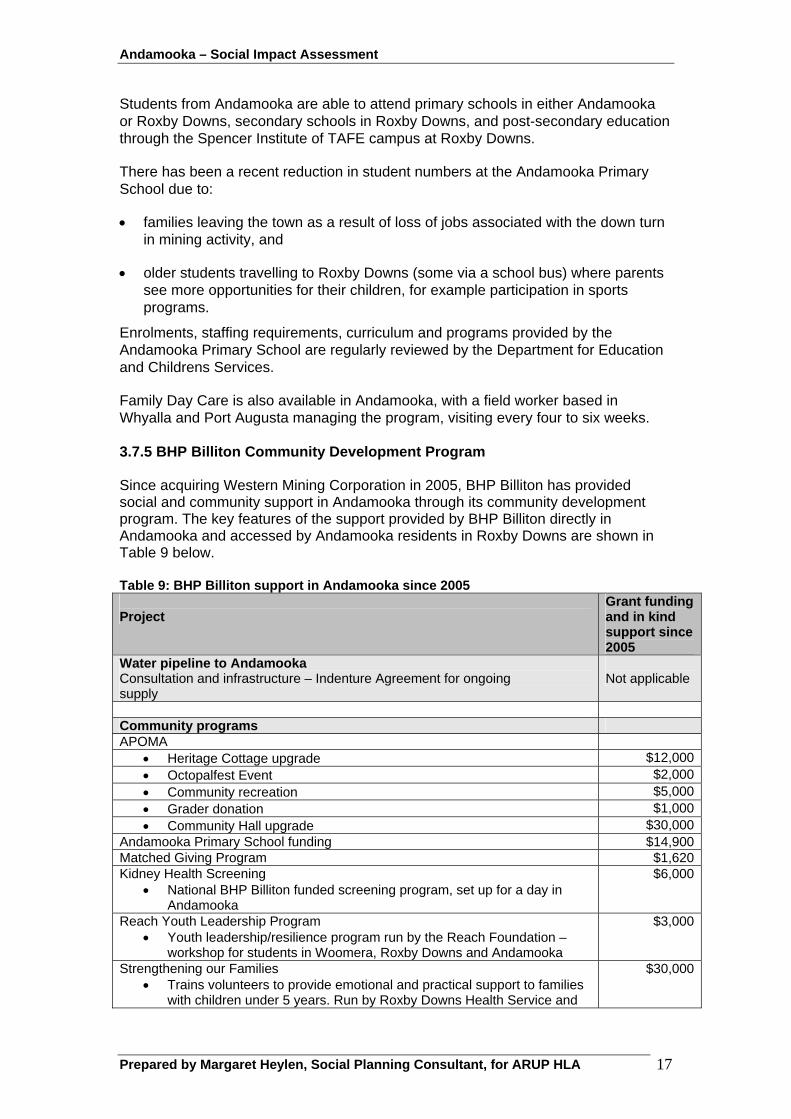
Andamooka – Social Impact Assessment
Students from Andamooka are able to attend primary schools in either Andamooka or Roxby Downs, secondary schools in Roxby Downs, and post-secondary education through the Spencer Institute of TAFE campus at Roxby Downs.
There has been a recent reduction in student numbers at the Andamooka Primary School due to:
• families leaving the town as a result of loss of jobs associated with the down turn in mining activity, and
• older students travelling to Roxby Downs (some via a school bus) where parents see more opportunities for their children, for example participation in sports programs.
Enrolments, staffing requirements, curriculum and programs provided by the Andamooka Primary School are regularly reviewed by the Department for Education and Childrens Services.
Family Day Care is also available in Andamooka, with a field worker based in Whyalla and Port Augusta managing the program, visiting every four to six weeks. 3.7.5 BHP Billiton Community Development Program Since acquiring Western Mining Corporation in 2005, BHP Billiton has provided social and community support in Andamooka through its community development program. The key features of the support provided by BHP Billiton directly in Andamooka and accessed by Andamooka residents in Roxby Downs are shown in Table 9 below. Table 9: BHP Billiton support in Andamooka since 2005 Project
Grant funding and in kind support since 2005
Water pipeline to Andamooka Consultation and infrastructure – Indenture Agreement for ongoing supply
Not applicable
Community programs APOMA
• Heritage Cottage upgrade $12,000• Octopalfest Event $2,000• Community recreation $5,000• Grader donation $1,000• Community Hall upgrade $30,000
Andamooka Primary School funding $14,900Matched Giving Program $1,620Kidney Health Screening
• National BHP Billiton funded screening program, set up for a day in Andamooka
$6,000
Reach Youth Leadership Program • Youth leadership/resilience program run by the Reach Foundation –
workshop for students in Woomera, Roxby Downs and Andamooka
$3,000
Strengthening our Families • Trains volunteers to provide emotional and practical support to families
with children under 5 years. Run by Roxby Downs Health Service and
$30,000
Prepared by Margaret Heylen, Social Planning Consultant, for ARUP HLA 17
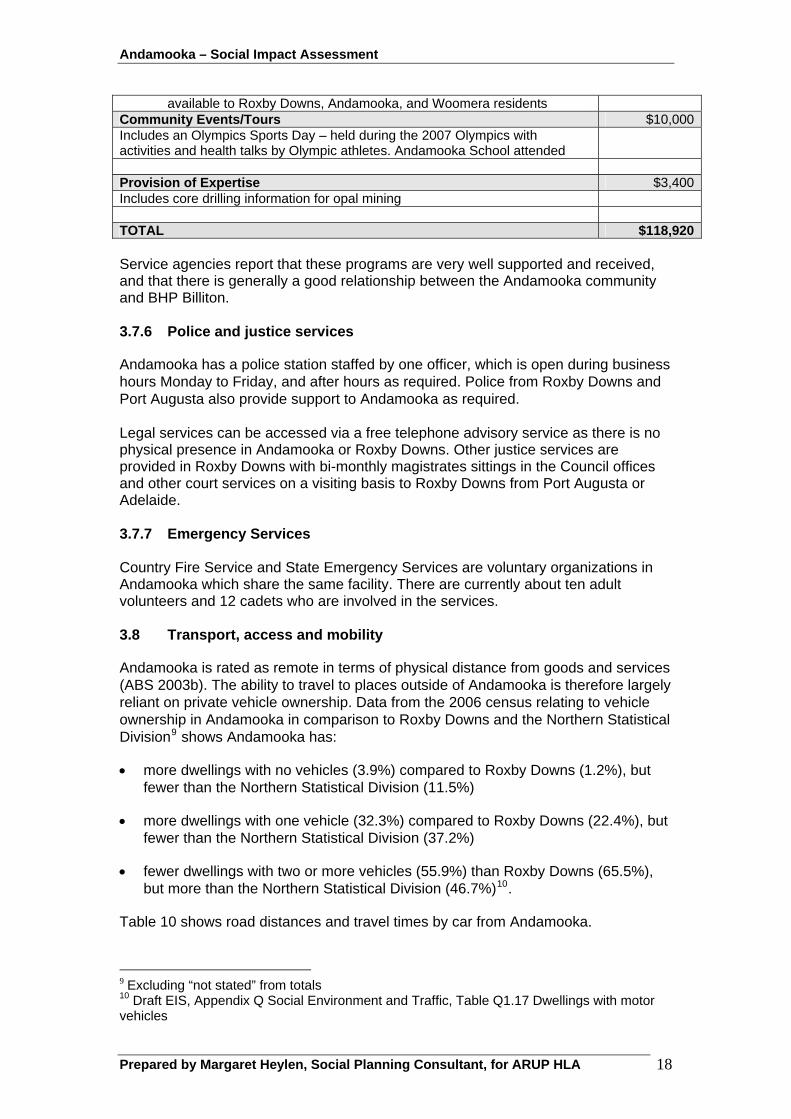
Andamooka – Social Impact Assessment
Prepared by Margaret Heylen, Social Planning Consultant, for ARUP HLA 18
available to Roxby Downs, Andamooka, and Woomera residents Community Events/Tours $10,000Includes an Olympics Sports Day – held during the 2007 Olympics with activities and health talks by Olympic athletes. Andamooka School attended
Provision of Expertise $3,400Includes core drilling information for opal mining
TOTAL $118,920 Service agencies report that these programs are very well supported and received, and that there is generally a good relationship between the Andamooka community and BHP Billiton. 3.7.6 Police and justice services
Andamooka has a police station staffed by one officer, which is open during business hours Monday to Friday, and after hours as required. Police from Roxby Downs and Port Augusta also provide support to Andamooka as required. Legal services can be accessed via a free telephone advisory service as there is no physical presence in Andamooka or Roxby Downs. Other justice services are provided in Roxby Downs with bi-monthly magistrates sittings in the Council offices and other court services on a visiting basis to Roxby Downs from Port Augusta or Adelaide. 3.7.7 Emergency Services Country Fire Service and State Emergency Services are voluntary organizations in Andamooka which share the same facility. There are currently about ten adult volunteers and 12 cadets who are involved in the services. 3.8 Transport, access and mobility
Andamooka is rated as remote in terms of physical distance from goods and services (ABS 2003b). The ability to travel to places outside of Andamooka is therefore largely reliant on private vehicle ownership. Data from the 2006 census relating to vehicle ownership in Andamooka in comparison to Roxby Downs and the Northern Statistical Division9 shows Andamooka has:
• more dwellings with no vehicles (3.9%) compared to Roxby Downs (1.2%), but fewer than the Northern Statistical Division (11.5%)
• more dwellings with one vehicle (32.3%) compared to Roxby Downs (22.4%), but fewer than the Northern Statistical Division (37.2%)
• fewer dwellings with two or more vehicles (55.9%) than Roxby Downs (65.5%), but more than the Northern Statistical Division (46.7%)10.
Table 10 shows road distances and travel times by car from Andamooka.
9 Excluding “not stated” from totals 10 Draft EIS, Appendix Q Social Environment and Traffic, Table Q1.17 Dwellings with motor vehicles
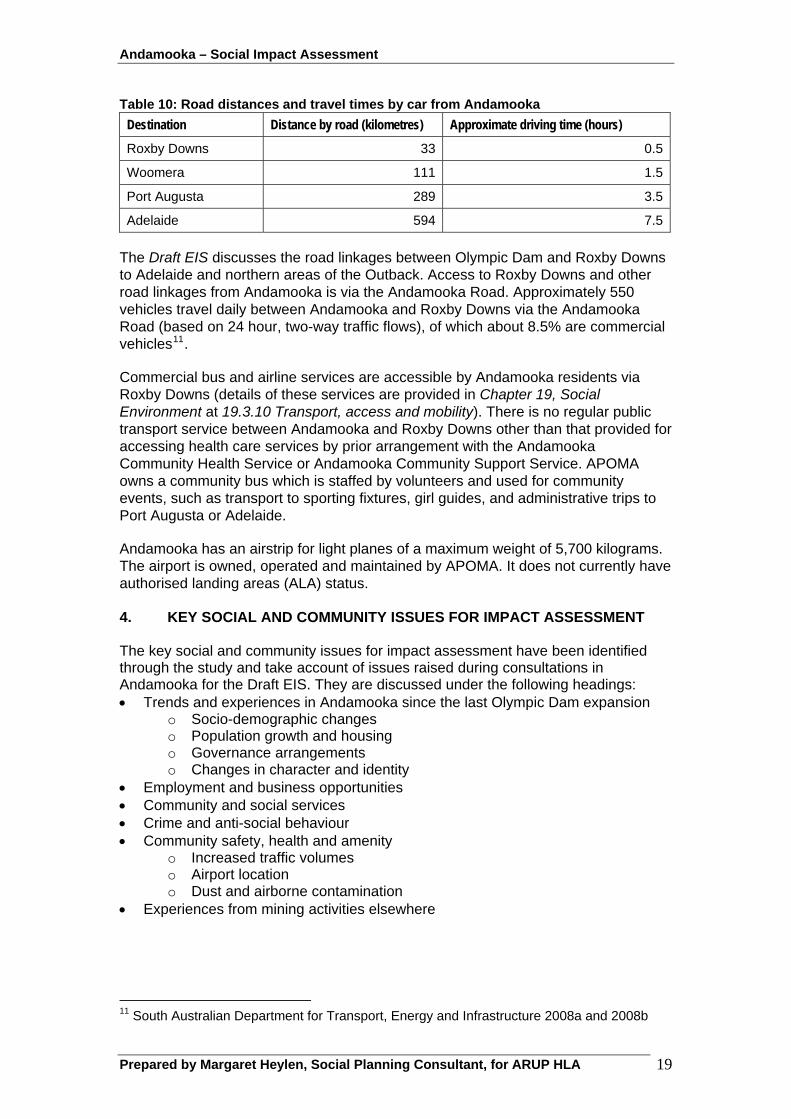
Andamooka – Social Impact Assessment
Prepared by Margaret Heylen, Social Planning Consultant, for ARUP HLA 19
Table 10: Road distances and travel times by car from Andamooka
Destination Distance by road (kilometres) Approximate driving time (hours)
Roxby Downs 33 0.5
Woomera 111 1.5
Port Augusta 289 3.5
Adelaide 594 7.5
The Draft EIS discusses the road linkages between Olympic Dam and Roxby Downs to Adelaide and northern areas of the Outback. Access to Roxby Downs and other road linkages from Andamooka is via the Andamooka Road. Approximately 550 vehicles travel daily between Andamooka and Roxby Downs via the Andamooka Road (based on 24 hour, two-way traffic flows), of which about 8.5% are commercial vehicles11.
Commercial bus and airline services are accessible by Andamooka residents via Roxby Downs (details of these services are provided in Chapter 19, Social Environment at 19.3.10 Transport, access and mobility). There is no regular public transport service between Andamooka and Roxby Downs other than that provided for accessing health care services by prior arrangement with the Andamooka Community Health Service or Andamooka Community Support Service. APOMA owns a community bus which is staffed by volunteers and used for community events, such as transport to sporting fixtures, girl guides, and administrative trips to Port Augusta or Adelaide.
Andamooka has an airstrip for light planes of a maximum weight of 5,700 kilograms. The airport is owned, operated and maintained by APOMA. It does not currently have authorised landing areas (ALA) status. 4. KEY SOCIAL AND COMMUNITY ISSUES FOR IMPACT ASSESSMENT The key social and community issues for impact assessment have been identified through the study and take account of issues raised during consultations in Andamooka for the Draft EIS. They are discussed under the following headings: • Trends and experiences in Andamooka since the last Olympic Dam expansion
o Socio-demographic changes o Population growth and housing o Governance arrangements o Changes in character and identity
• Employment and business opportunities • Community and social services • Crime and anti-social behaviour • Community safety, health and amenity
o Increased traffic volumes o Airport location o Dust and airborne contamination
• Experiences from mining activities elsewhere
11 South Australian Department for Transport, Energy and Infrastructure 2008a and 2008b

Andamooka – Social Impact Assessment
4.1 Trends in Andamooka relevant to the last Olympic Dam expansion 4.1.1 Socio-demographic changes The socio-demographic characteristics and changes in Andamooka have been compared with South Australia at the 1996, 2001 and 2006 census (see the table at Appendix A). In summary, this suggests that despite a small population decline in Andamooka between 1996 and 2001, there was an increase in the proportion of young single men and lone person households; and people working in lower and semi-skilled occupations. The proportion of people living in ‘other’ dwellings types (such as caravans or transportable buildings) and non-residential accommodation (such as hotels); and renting or purchasing a dwelling, also increased in 2001. The key features of the changes in Andamooka over the three censuses, compared to South Australia, are as follows: • There was a small decline in the total population of Andamooka between 1996
and 2001, and a subsequent increase between 2001 and 2006, with a continuing upward trend to 2008, at which time the estimated population was around 800 (Planning SA and APOMA).
• The median age of people in Andamooka decreased between 1996 and 2001
(from 46 to 44 years), with a subsequent increase in 2006 (to 48 years). • The proportion of women in Andamooka decreased at the 2001 census and
increased in 2006 (see also Figure 5).
Figure 5 Male female ratio in Andamooka: 1996, 2001 and 2006
58.5 59.956.5
41.5 40.1 43.5
0
10
20
30
40
50
60
70
1996 2001 2006
Pe
rcn
tag
e
Male Female
• There has been a continuing upward trend in the number of people who are separated or divorced in Andamooka from 19.6% in 1996, 22.1% in 2001, and 25.9% in 2006, compared to a state average of 11.5% over the three census periods.
• The proportion of lone person households increased in Andamooka between 1996 and 2001, but has subsequently declined, as has the proportion of households with children. There has been a steady increase in the proportion of
Prepared by Margaret Heylen, Social Planning Consultant, for ARUP HLA 20
Andamooka – Social Impact Assessment
couple households without children in Andamooka and South Australia across censuses.
• There was a decline in the proportion of managers, professionals, associated
professionals and tradespeople living in Andamooka between 1996 and 2001, and an increase in the proportion of labourers, clerical workers and intermediate production and transport workers.
• There was an increase in the proportion of people employed in trade (wholesale
and retail), accommodation and food services, and manufacturing in Andamooka between 1996 and 2001.
• There was an increase in the proportion of people counted in non-private
dwellings (i.e. in communal or transitory type of accommodation) in Andamooka across censuses, with the largest increases between 2001 and 2006 (although the proportion remains relatively low compared to South Australia). There was also a decline in the proportion of separate houses and a relatively large increase in other dwellings types (such as caravans) in Andamooka in 2001, a trend which has continued. While home ownership remains high in Andamooka compared to South Australia, the proportion of people who are purchasing a house, or renting, has continued to rise across censuses. Housing costs have also risen across censuses, but remain lower in Andamooka than in South Australia.
• Average household size increased in Andamooka between the 1996 and 2001
census (from 2.0 to 2.8) and decreased at the 2006 census (2.0), which may reflect the greater numbers of people in non-residential or other dwelling types in Andamooka in 2001. Household size has been relatively constant in South Australia (at about 2.4) across censuses.
• there is greater population stability in Andamooka compared to South Australia, that is, in the proportions of people reporting they lived at the same address 5 years ago. This suggests greater long term residency, and possibly reflects the older age profile.
4.1.2 Population growth and housing BHP Billiton has not specifically sought accommodation for its construction and/or operational workforce in Andamooka in the past, nor does it intend to do so in the future. BHP Billiton plans to accommodate the workforce for the expansion through three key mechanisms: • residential housing in Roxby Downs • camp accommodation in Roxby Downs for the permanent (operational) long
distance commute workforce • camp accommodation at Hiltaba Village for the construction workforce. Despite these intentions, and depending on the availability and cost of housing in Roxby Downs, some workers, including contractors and people employed in allied and service industries on lower incomes, may choose to live in Andamooka because of the lower housing costs or lifestyle.
Prepared by Margaret Heylen, Social Planning Consultant, for ARUP HLA 21
Andamooka – Social Impact Assessment
Prepared by Margaret Heylen, Social Planning Consultant, for ARUP HLA 22
The shortages and high cost of housing in Roxby Downs in recent years has seen an overflow of people to Andamooka. This demand has resulted in a doubling of average weekly rental costs between 2005 and 200812 (refer 3.5 Housing and Accommodation). Since that time, the downturn in mining activity has seen the pressure on housing and accommodation reduce in both Roxby Downs and Andamooka. In response to rising demand, and driven by speculation about future growth, over 90 applications for accommodation units (both large unit style and smaller group dwellings) were received by the Development Assessment Commission over a six month period in 2007 (Planning SA 2008). APOMA report that development approvals to date include: • 94 motel style units at the hotel (minor earth works only completed to date) • separate applications for 90 motel style units, 88 motel style units, 15 single units,
and 33 single units on 3 allotments. It is understood that many of these applications and other applications which are yet to be approved have been made with the view to increasing the land value and on-selling in future. One of the most pressing concerns has been the management of waste water, which is the responsibility of individual property owners, as there is no communal or town disposal system. APOMA is responsible for dealing with development applications and enforcing relevant regulatory standards, although it has found it difficult at times to enforce regulatory controls as it has no legislative authority to do so. 4.1.3 Governance arrangements The capacity to control development and manage town affairs and infrastructure in the face of growing development pressures has been raised by APOMA as an issue. The review of governance arrangements by the SA Government and the establishment of a new Outback Communities Authority are initiatives intended to provide an improved governance framework for Andamooka, and other outback areas. It is envisaged that APOMA will be established similar to a Local Government Committee as provided for in Section 41 of the Local Government Act, with delegated authority from the OACDT. This will allow specific policies to be developed to meet local needs, and will require the development of a strategic plan and annual business plan in consultation with the community. Initially, it is expected that an asset/infrastructure register will be prepared by OACDT to determine a levy for maintaining infrastructure across all outback areas, including Andamooka. Provision is also made in the new arrangements for local community authorities, such as APOMA, to impose a charge for services and/or use of facilities. Implementation arrangements are yet to be determined, but this will require local community agreement. It is also proposed that APOMA will have order making powers which will assist in enforcing regulatory controls, and that OACDT will provide administrative, professional and business support to enable APOMA to meet the new strategic and business planning. 12 Refer 3.5 Housing and Accommodation
Andamooka – Social Impact Assessment
Prepared by Margaret Heylen, Social Planning Consultant, for ARUP HLA 23
4.1.4 Changes in character and identity Longer term residents talk about Andamooka as once being a place where people could come and go, and be free to do their own thing in their own time in any way that suited them.
“The layout of Andamooka is unique and unlike any other mining town in Australia. Until recently, there has been no council or town planning rules, a feature liked by many residents. The main street is the only sealed road……..there are no street names or lighting to identify where you are, giving you a wonderful town maze (Andamooka Community Plan, 2002).”13.
The unique and isolated environment has fostered a strong culture of self-help and survival and historically town affairs have been managed by volunteers, without a requirement for legislatively prescribed transparency and accountability measures. However, the rapid growth and development activity has placed pressure on town infrastructure, and triggered stronger development controls and a review of governance arrangements by the SA Government. This new regime has meant the end of the unregulated way of life in Andamooka. Residents have observed the changing nature of the town’s character and identity, which they attribute to: • the influx of people from “out of town” who have more money and different
expectations about infrastructure and services • a more regulated planning and development environment • an impending structured ‘local government’ type framework for managing town
affairs • increased vandalism and break-ins14 • a diminishing interest in volunteering in community governance, activities
projects. Active community involvement in local economic, social and cultural life influences quality of life and creates an environment which encourages and empowers new community leaders.15 The proportion of community volunteering in Andamooka (19.4%) is less compared to Roxby Downs (22.38%) and for South Australia as a whole (20.38%). However, the proportion of women in Andamooka who participate is higher in Andamooka (30.30%), compared to Roxby Downs (27.85%) and for South Australia as a whole (22.4%)16. Whilst the introduction of stronger regulatory controls and a more structured governance framework is an inevitable consequence of broader community and government expectations for transparency and accountability, evidence from the literature review of other mining projects supports the impact on small town dynamics, character and identity due to increased mining activity. BHP Billiton have provided on-going support in Andamooka through grants and in-kind contributions as part of its community development program for heritage preservation and cultural events, and it is intended that this support will continue.
13 Collins Anderson Management (February 2002) Andamooka Community Plan 14 Andamooka Community Plan 2002, page 17 15 Salvaris M 2000 ‘Community and Social Indicators: How citizens can measure progress” 16 ABS 2006 census – Voluntary Work for an Organization or Group
Andamooka – Social Impact Assessment
Prepared by Margaret Heylen, Social Planning Consultant, for ARUP HLA 24
4.2 Employment and business opportunities New employment and business opportunities have emerged in Andamooka since the previous Olympic Dam mine expansion, including speculative development projects referred to in 4.1.2 Population growth and housing. Employment opportunities will continue to emerge as a result of the proposed expansion of the Olympic Dam mine. As identified in Section 3.5, Andamooka has: • an older population • a relatively high proportion of people from non-English speaking backgrounds,
with over 10% who speak a language other than English at home • around 45% of the population over 15 years old who have not completed higher
than Year 10, with around 13% having only completed Year 8 • relatively low labour force participation rate • high levels of unemployment, particularly among women17. The characteristics of an older, less educated, more culturally and linguistically diverse population and high levels of unemployed women may require specific attention to bring benefits to people in Andamooka18. To address these issues, it is proposed that BHP Billiton develop training, workforce recruitment and retention programs that target specific groups such as young people, women and Aboriginal people19. Census data from the late 1990s expansion showed an increase in people in Andamooka employed in trade (wholesale and retail) accommodation and food services, property and business and manufacturing. New employment and business opportunities are also likely to include contract for service arrangements, and new service industries. The international significance of the proposed expanded Olympic Dam mine has the potential for generating increased tourism in the region20. This could also have a flow on effect for tourism in Andamooka, through increased tourism associated with the unique Andamooka experience and Aboriginal tourism based on arts, culture and heritage. 4.3 Community and social services A number of community services are available in Andamooka (see Section 3.7) Residents in Andamooka also access some social and community services from Roxby Downs, including many of the more specialized family and community support services, and outreach programs from Roxby Downs or Port Augusta. Of note, the current demographic features of the Andamooka community which distinguish it from Roxby Downs and elsewhere in South Australia, are its: • older age profile
17 ABS Census 2006 Table Q1.27 Unemployment by age and sex, 2006 Draft EIS Appendix Q 18 ABS 2006 Census data 19 See Draft EIS Chapter 17, Aboriginal Cultural Heritage, for information on the Olympic Dam Agreement and Heritage Management Protocol 20 Whilst Andamooka continues to be promoted as a tourist destination for those interested in opal mining, there is now only a small proportion of the population involved in opal mining activities.20
Andamooka – Social Impact Assessment
Prepared by Margaret Heylen, Social Planning Consultant, for ARUP HLA 25
• greater cultural diversity, with more residents from culturally and linguistically diverse backgrounds
• high percentage of Aboriginal people • fewer families with young children • lower income levels • high proportion of men to women. Service providers in Andamooka expect an increase in demand for services associated with a predicted larger population of lower skilled, low income, single, divorced or separated men, and due to social isolation as a result of people living away from family and social support networks. Concern is heightened by pending development approvals for motel-style units, which could be occupied by over 300 people (assuming single occupancy). These population characteristics indicate a potential for increased need for services associated with alcohol and drug abuse, violence, mental health issues and associated risks to women and young men in Andamooka. The potential risks are supported by the experiences from the previous expansion of the Olympic Dam mine (refer 4.4 Crime and anti-social behaviour), and the literature review from other mining projects elsewhere21. Community service providers report that the lack of access to emergency and safe accommodation for young people or domestic violence victims, limits the options for crisis response by police or other service providers. BHP Billiton provides grant funding and in-kind support for a range of community development programs in Andamooka through its Community Development Program. This support has been well received and appreciated, and there appears to be good relationships between the Andamooka community and BHB Billiton in general. BHP Billiton has indicated its intention to continue to provide support through this program. Other benefits which have flowed on to Andamooka since the early 2000s reported by service providers are: • securing a water supply through agreement with BHP BILLITON • the availability of home and community care services and programs through
Frontier Services • changes in programs at the school through the Rural Children’s Centre, which
have increased access to family and social support services in Andamooka. 4.4 Crime and anti-social behaviour The most vivid memories of the impacts in Andamooka during the previous Olympic Dam mine expansion relate to anti-social behaviour associated with the predominantly male workforce. The geographic isolation of Andamooka, and its frontier settlement character made it an attractive destination away from the regulated camp environment and a full time police presence in Roxby Downs. It is reported that the resulting anti-social behaviour
21 Refer 4.4 Experiences from mining activities elsewhere
Andamooka – Social Impact Assessment
Prepared by Margaret Heylen, Social Planning Consultant, for ARUP HLA 26
created tensions within the town, and triggered increased incidence of assault, domestic violence, sexual assault, and relationship stress and breakups.22 Reports from those who were living or working in Andamooka at the time (including a police officer) referred to prostitution, availability of illicit drugs, and strip shows, morning and night. It is understood that an establishment was set up in 1998 in Andamooka known as “Blondie’s” which according to locals, is alleged to have been an operating brothel. This appears to be supported by their ongoing advertising in the Northern Sun newspaper – “Unforgettable Ladies at Unbelievable Prices”.23 During the consultations in Andamooka for the Draft EIS, APOMA, community service agencies and residents expressed concern about the possibility of this history being repeated during the construction phase of the proposed expansion, and in particular the potential for flow on effects such as: • young women at risk of being attracted by men with money to spend, and
engaging in anti-social and risk taking behaviours • a greater number of street fights and assaults • vulnerable local youth drawn into risk taking and anti-social behaviours • increased calls for emergency responses to deal with crisis. This concern is heightened by • the proposed location of Hiltaba Village to house construction workers, on the
Andamooka Road • the limited police presence in Andamooka • the remote location and isolation from Roxby Downs (where there will be a large
police presence) • the “frontier settlement” nature of the town • if accommodation privileges at Hiltaba Village are withdrawn, workers may seek
accommodation in Andamooka (where they may still be able to commute to work at Roxby Downs or Olympic Dam or other sites nearby).
The desk top review and benchmarking studies undertaken for the Draft EIS point to several factors relevant to the potential impact on Andamooka that may increase the potential for crime and fear of crime associated with the proposed expansion (see Chapter 19, 19.5.2, and Appendix Q4 Crime and Anti-Social Behaviour). These factors include: • the large number of young, single male construction workers, potentially
engaging in anti-social and unsafe behaviours • alcohol and substance misuse • population turnover and the presence of “strangers” • increased opportunities for vandalism and theft from building sites • young people and ‘at risk groups’ engaging in potentially unsafe and anti-social
behaviours. To address these issues, BHP Billiton plans to construct Hiltaba Village to a high-quality, with a range of on-site entertainment, dining halls and taverns, recreation and sports facilities and attractive amenity. The construction workforce will be encouraged to remain at Hiltaba for social and recreational activities. The location of
22 The claims are supported in part by communications with APOMA and articles between April 1998 and February 1999 which appeared in Northern Sun Newspaper (renamed the Roxby Downs Sun in 2003) 23 APOMA Meeting Report June 2006 – Referred to in consultations with Y Mooney

Andamooka – Social Impact Assessment
Prepared by Margaret Heylen, Social Planning Consultant, for ARUP HLA 27
the new airport opposite Hiltaba Village will facilitate easy access into and out of the village. Behaviour management strategies will also be put in place including a requirement for workers accommodated at Hiltaba Village to sign an agreement to comply with village rules, which would cover behavioural expectations, illegal activities and drugs, and the right for BHP Billiton to remove accommodation privileges for non-compliance. 4.5 Community safety, health and amenity In addition to concerns about crime and anti-social behaviour discussed in 4.4 Crime and anti-social behaviour, the following issues were raised by residents and key stakeholders during consultations undertaken for the EIS. 4.5.1 Increased traffic volumes There will be an increase in traffic along Andamooka Road due to the location of Hiltaba Village and the new airport (17 kilometres from Andamooka), and long haul heavy vehicles at the intersection of the Bypass/Andamooka Road intersection. The Draft EIS, Chapter 22, Health and Safety, at Section 22.6.9 General Transport and Safety, discusses the general safety impacts of transport, and state and national road safety data and initiatives. The effects of increased road traffic volumes on road users are discussed in Chapter 19 at Section 19.5.6 Access and disturbance. A detailed Traffic Impact Assessment (TIA) is also contained in Appendix Q7. This showed there would be no change to the Level of Service24 on Andamooka Road, during peak construction and ongoing operations at Olympic Dam, which would remain ‘free-flowing’. The TIA also assessed the operation of the Heavy Vehicle Bypass / Andamooka Road intersection and concluded there would be no adverse impacts on this intersection as a result of the expansion of Olympic Dam. Further studies are currently being undertaken on traffic impacts, including the movements along Andamooka Road into Roxby Down via Axehead Road. 4.5.2 Airport location Concerns were raised during consultations in Andamooka about the noise impact from the airport, in particular, associated with night flights. The Draft EIS Chapter 14 Noise and Vibration, assessed noise associated with the proposed airport.
The proposed airport would be located about 17 km from Roxby Downs and Andamooka, and about one kilometre from Hiltaba Village. The airport would accommodate class 4C aircraft, such as Boeing 737 and Airbus A320 class jet aircraft. It is estimated that about five class 4C flights would occur each day. Additional scheduled flights, including night flights, would also be likely, particularly during the construction phase.
24 The Level of Service measures road operating conditions from A to F, with A representing free-flow conditions through to F which represents ‘forced flow’ conditions (i.e. heavily congested)
Andamooka – Social Impact Assessment
The 65 dB(A)Lmax noise contour, which represents the applicable limit for airport operational noise, is shown in Figure 14.6 in the Draft EIS. This shows that all sensitive receivers, including Andamooka, are located outside the contour for the applicable noise limit. 4.5.3 Dust and air-borne contamination Concerns were raised during consultations in Andamooka about the health effects associated with dust and airborne contamination, particularly given the reliance on rainwater collection and storage. The Draft EIS Chapter 13 deals with Greenhouse Gas and Air Quality where reference is made to the impact on Andamooka of airborne emissions, as follows.
“The township of Andamooka is some 30 km from the existing operation and would be about 20–25 km from the nearest proposed airborne emission source. This was found to be at a distance beyond which the predicted impacts from the proposed expansion were so low as to be considered negligible, with an annual average PM10 particulate concentration of less than 2 µg/m3 “.
It is expected however, that a dust haze over the mine site will be visible in the region from a distance, depending on prevailing winds and weather conditions. There will be a series of air quality monitors installed through the region, including at Hiltaba Village. Operational controls will also be implemented via a dust management system to cope with occasionally severe dusting conditions, which may result in PM10 exceedances at Roxby Downs or Hiltaba Village. Other community health issues have been identified in the Draft EIS Chapter 19, Social Environment. Chapter 22 Health and Safety discusses public exposure to radiation and airborne contamination. This chapter concludes that exposures to members of the public at the closest receptor (Roxby Downs) would increase compared to current levels, but would remain almost one-sixth of the international public dose limit. Exposure at Andamooka would be less than at Roxby Downs (given its greater distance from mine operations), and as such, public exposure is expected to be minimal. 4.6 Experiences from mining activities elsewhere It is generally accepted that there can be positive economic impacts from mining due to greater employment and business opportunities. A literature review was undertaken to explore beyond these benefits and to review the potential social impacts on mining townships and local communities (see also Appendix Q8, Social Impacts and Lessons from other Mining Developments in the Draft EIS). The following précis captures the essence of the literature reviewed and assists in identifying the potential social impacts for Andamooka relating to the proposed expansion of the Olympic Dam mine. Topic Précis of literature review Workforce behaviours and
The nature of work in remote work sites can present challenges, with employee stress, long hours, boredom and shift work identified as
Prepared by Margaret Heylen, Social Planning Consultant, for ARUP HLA 28

Andamooka – Social Impact Assessment
Prepared by Margaret Heylen, Social Planning Consultant, for ARUP HLA 29
substance misuse 25 (see also Appendix Q4, Crime and Anti-Social Behaviour) in the Draft EIS)
contributing to substance abuse. There are many facets of substance abuse associated with remote area work sites, with a trickle down effect into families and communities. Enforcement of disciplinary action is required to change and eliminate anti-social behaviour, but in a climate of labour shortage, disciplinary action can be compromised. (For example, a company desperately in need of workers undertook drug tests, found positive results and dismissed employees. The same employees were hired again two weeks later because of the inability to recruit others and the need to keep within expected delivery time frames.)
Housing 26 27 28
(see also Appendix Q2, Housing costs, and Appendix Q7, Employment and training, in the Draft EIS)
There needs to be an adequate supply of affordable housing for those who are on lower or more variable incomes than that of mining company employees. Contract workers are generally not housed by the mining company, and therefore turn to the private rental market to meet their housing needs. The increased cost of housing, and lack of housing choices, can lead to greater numbers of LDC workers, not necessarily as the preferred option. This can result in dislocation of families, separation from support networks, lack of social connectedness, and poses risks to mental health and drug and alcohol abuse. A lack of accessible and affordable housing can have flow on effects for young people (who may not have options to enable them to make the natural progression to independent living). In mining towns, seeking assistance or ending a violent relationship is challenged by the lack of safe alternative accommodation options, remoteness, distance from family supports, and the cost of relocation. Some companies have progressively developed tri-sector relationships with government and non-government organizations to ensure access to a “Safe House” option.
Communication and consultation (see also Appendix Q8, Social Impacts and Lessons from other Mining Developments in the Draft EIS)29
There remains a perception that mining companies in general do not do enough by way of communication, consultation, impact assessment and community contributions to progress mining development. Lessons learned from other mining projects highlight the importance of:
• understanding and acknowledging peoples’ perceptions of potential impacts and dealing openly and transparently with community, in order to build strong relationships between industries and host communities
• good communication and providing access to information of relevance and concern to the community on new developments
• companies allowing community input into decision making related to the management of impacts, beyond progressing mine development.
25 Northern British Columbia Business Council on Substance Abuse: Barton Sylvia S, Aspects of the effect of substance use on health, wellness and safety of employees and families in northern remote work sites 26 Centrelink: Scheltens, M and Morris Y. Homelessness in high income mining towns and the opportunity for big business to play a part 27 ABC Online Housing gloom in mining boom: Central Queesnland 28 Australasian Journal of Regional Studies, Vol.13, No l2, 2007 Lessons from the Social and Economic Impacts of the Mining boom in the Bowen Basin 2004-2006 29 Draft EIS, Q8 – Social Impacts and Lessons from other mining developments
Andamooka – Social Impact Assessment
Prepared by Margaret Heylen, Social Planning Consultant, for ARUP HLA 30
The key social impacts for Andamooka relevant to the proposed expansion of the Olympic Dam mine relate to the following: • Growth and Development
o Town infrastructure o Governance arrangements o Housing and accommodation
• Employment and business opportunities • Character and identity • Community and social services • Crime and anti-social behaviour. The predicted adverse impacts and benefits and opportunities for Andamooka are discussed in Section 5, which follows. Community safety, health and amenity issues raised during the consultations undertaken for the Draft EIS as discussed in brief in section 4.5 have been reviewed and reported on elsewhere in the EIS as indicated in that section. 5. FINDINGS FROM THE SOCIAL IMPACT ASSESSMENT FOR
ANDAMOOKA BHP Billiton is committed to understanding impacts and, where required, managing relevant impacts in collaboration with the SA Government. Maintaining the amenity and social fabric of local communities is a project planning, design and operation management objective (see Draft EIS 19.4.1 Environmental values). The predicted adverse impacts and benefits and opportunities for Andamooka are set out in this section to enable consideration for strategies to address potential social impacts where required. 5.1 Growth and Development Assumptions for the Impact Assessment Based on estimates of the current population who live in Andamooka and work at Olympic Dam (approximately 220 people) a doubling of the workforce at Olympic Dam could see a commensurate increase in the population of Andamooka to over 400 workers associated with Olympic Dam. This assumption is based on the following evidence: • Planning SA (2006) forecast continued population increase based on mining activity at
the Olympic Dam mine site • Since 2006, there has been a rapid increased in the Andamooka population, which is
largely attributed to the shortage of housing in Roxby Downs and the availability of cheaper housing options in Andamooka
• The lower cost of housing in Andamooka has attracted contractors and workers in industries that support mining activities and/or associated service industries.
• The potential for these trends to continue is further supported by the speculative development applications in Andamooka over recent years, with development applications approved to date for over 300 predominantly single motel style units (see 5.1.3 Housing and accommodation)30.
Predicted adverse impacts Predicted benefits and opportunities 5.1.1 Town Infrastructure
The 2008 PAR has provided the opportunity for more orderly and sustainable
30 APOMA report during consultation based on Planning SA data
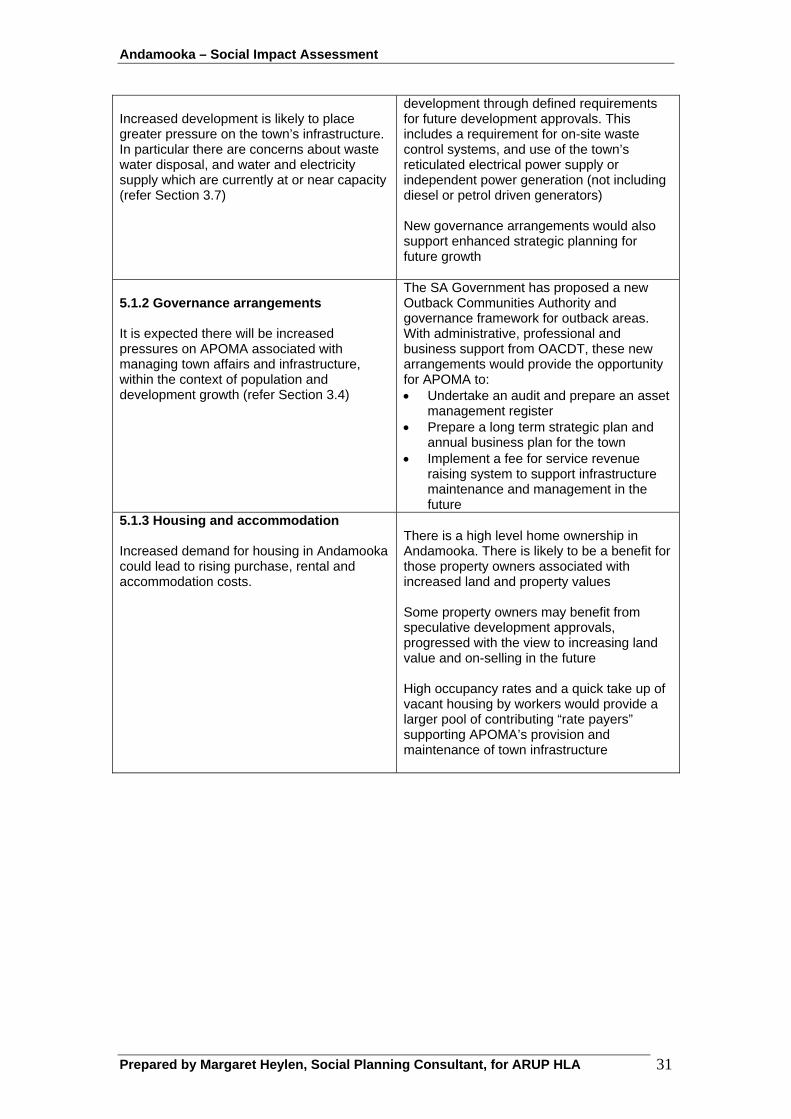
Andamooka – Social Impact Assessment
Increased development is likely to place greater pressure on the town’s infrastructure. In particular there are concerns about waste water disposal, and water and electricity supply which are currently at or near capacity (refer Section 3.7)
development through defined requirements for future development approvals. This includes a requirement for on-site waste control systems, and use of the town’s reticulated electrical power supply or independent power generation (not including diesel or petrol driven generators) New governance arrangements would also support enhanced strategic planning for future growth
5.1.2 Governance arrangements It is expected there will be increased pressures on APOMA associated with managing town affairs and infrastructure, within the context of population and development growth (refer Section 3.4)
The SA Government has proposed a new Outback Communities Authority and governance framework for outback areas. With administrative, professional and business support from OACDT, these new arrangements would provide the opportunity for APOMA to: • Undertake an audit and prepare an asset
management register • Prepare a long term strategic plan and
annual business plan for the town • Implement a fee for service revenue
raising system to support infrastructure maintenance and management in the future
5.1.3 Housing and accommodation Increased demand for housing in Andamooka could lead to rising purchase, rental and accommodation costs.
There is a high level home ownership in Andamooka. There is likely to be a benefit for those property owners associated with increased land and property values Some property owners may benefit from speculative development approvals, progressed with the view to increasing land value and on-selling in the future High occupancy rates and a quick take up of vacant housing by workers would provide a larger pool of contributing “rate payers” supporting APOMA’s provision and maintenance of town infrastructure
Prepared by Margaret Heylen, Social Planning Consultant, for ARUP HLA 31
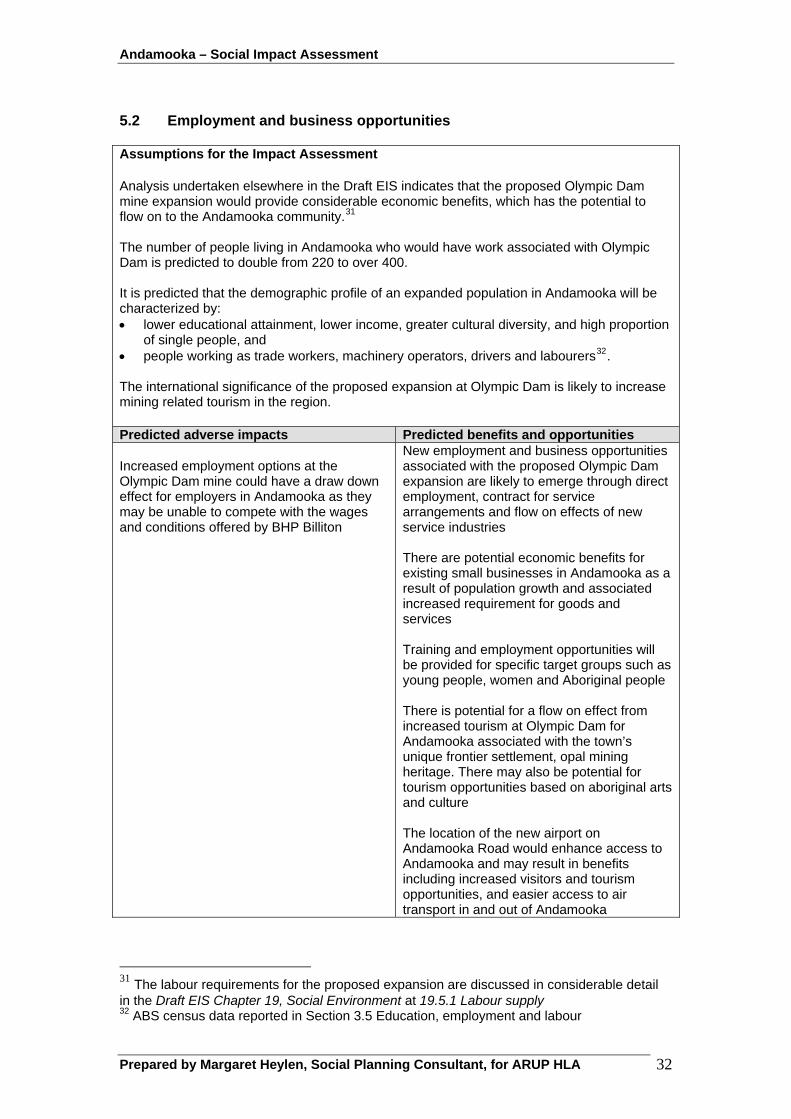
Andamooka – Social Impact Assessment
Prepared by Margaret Heylen, Social Planning Consultant, for ARUP HLA 32
5.2 Employment and business opportunities Assumptions for the Impact Assessment Analysis undertaken elsewhere in the Draft EIS indicates that the proposed Olympic Dam mine expansion would provide considerable economic benefits, which has the potential to flow on to the Andamooka community.31 The number of people living in Andamooka who would have work associated with Olympic Dam is predicted to double from 220 to over 400. It is predicted that the demographic profile of an expanded population in Andamooka will be characterized by: • lower educational attainment, lower income, greater cultural diversity, and high proportion
of single people, and • people working as trade workers, machinery operators, drivers and labourers32. The international significance of the proposed expansion at Olympic Dam is likely to increase mining related tourism in the region. Predicted adverse impacts Predicted benefits and opportunities Increased employment options at the Olympic Dam mine could have a draw down effect for employers in Andamooka as they may be unable to compete with the wages and conditions offered by BHP Billiton
New employment and business opportunities associated with the proposed Olympic Dam expansion are likely to emerge through direct employment, contract for service arrangements and flow on effects of new service industries There are potential economic benefits for existing small businesses in Andamooka as a result of population growth and associated increased requirement for goods and services Training and employment opportunities will be provided for specific target groups such as young people, women and Aboriginal people There is potential for a flow on effect from increased tourism at Olympic Dam for Andamooka associated with the town’s unique frontier settlement, opal mining heritage. There may also be potential for tourism opportunities based on aboriginal arts and culture The location of the new airport on Andamooka Road would enhance access to Andamooka and may result in benefits including increased visitors and tourism opportunities, and easier access to air transport in and out of Andamooka
31 The labour requirements for the proposed expansion are discussed in considerable detail in the Draft EIS Chapter 19, Social Environment at 19.5.1 Labour supply 32 ABS census data reported in Section 3.5 Education, employment and labour
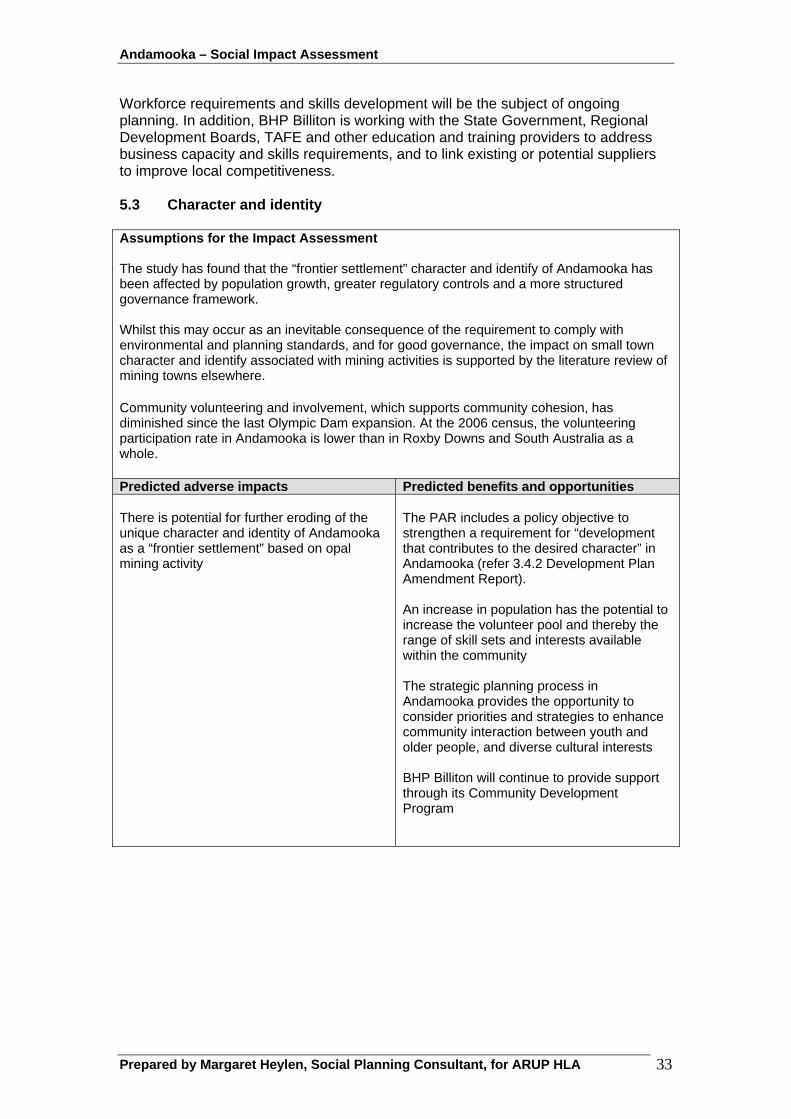
Andamooka – Social Impact Assessment
Workforce requirements and skills development will be the subject of ongoing planning. In addition, BHP Billiton is working with the State Government, Regional Development Boards, TAFE and other education and training providers to address business capacity and skills requirements, and to link existing or potential suppliers to improve local competitiveness. 5.3 Character and identity Assumptions for the Impact Assessment The study has found that the “frontier settlement” character and identify of Andamooka has been affected by population growth, greater regulatory controls and a more structured governance framework. Whilst this may occur as an inevitable consequence of the requirement to comply with environmental and planning standards, and for good governance, the impact on small town character and identify associated with mining activities is supported by the literature review of mining towns elsewhere. Community volunteering and involvement, which supports community cohesion, has diminished since the last Olympic Dam expansion. At the 2006 census, the volunteering participation rate in Andamooka is lower than in Roxby Downs and South Australia as a whole. Predicted adverse impacts Predicted benefits and opportunities There is potential for further eroding of the unique character and identity of Andamooka as a “frontier settlement” based on opal mining activity
The PAR includes a policy objective to strengthen a requirement for “development that contributes to the desired character” in Andamooka (refer 3.4.2 Development Plan Amendment Report). An increase in population has the potential to increase the volunteer pool and thereby the range of skill sets and interests available within the community The strategic planning process in Andamooka provides the opportunity to consider priorities and strategies to enhance community interaction between youth and older people, and diverse cultural interests BHP Billiton will continue to provide support through its Community Development Program
Prepared by Margaret Heylen, Social Planning Consultant, for ARUP HLA 33
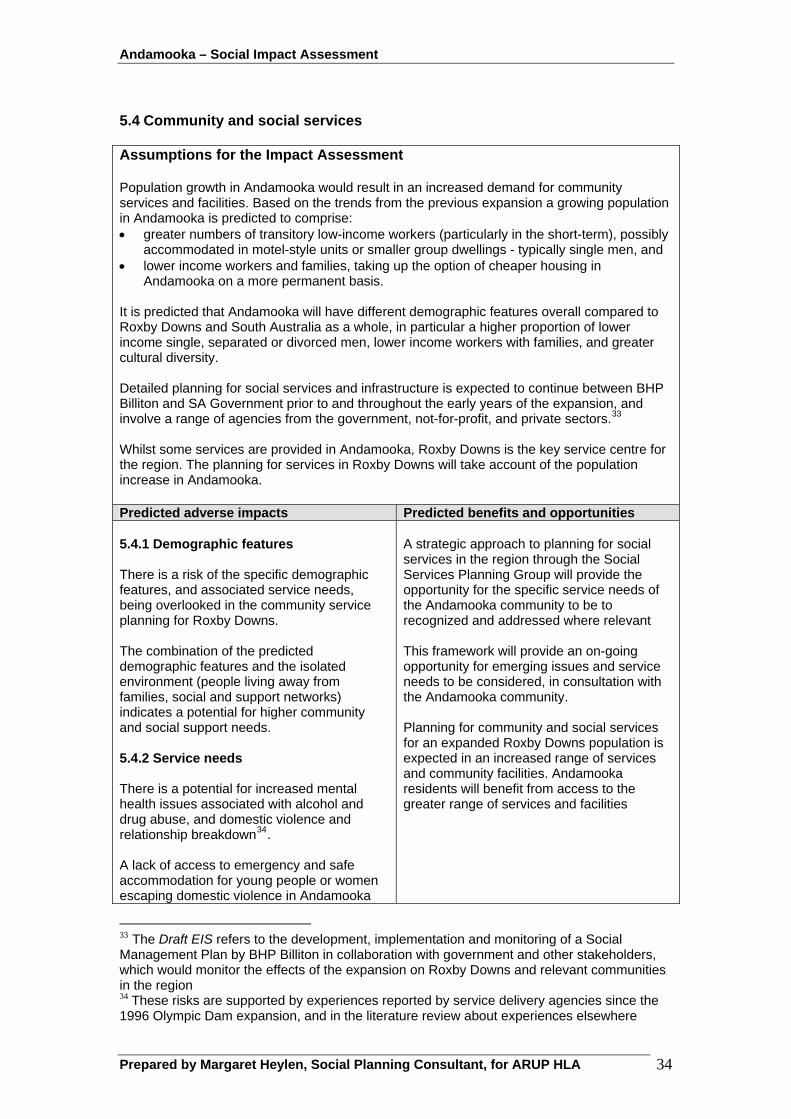
Andamooka – Social Impact Assessment
Prepared by Margaret Heylen, Social Planning Consultant, for ARUP HLA 34
5.4 Community and social services Assumptions for the Impact Assessment Population growth in Andamooka would result in an increased demand for community services and facilities. Based on the trends from the previous expansion a growing population in Andamooka is predicted to comprise: • greater numbers of transitory low-income workers (particularly in the short-term), possibly
accommodated in motel-style units or smaller group dwellings - typically single men, and • lower income workers and families, taking up the option of cheaper housing in
Andamooka on a more permanent basis. It is predicted that Andamooka will have different demographic features overall compared to Roxby Downs and South Australia as a whole, in particular a higher proportion of lower income single, separated or divorced men, lower income workers with families, and greater cultural diversity. Detailed planning for social services and infrastructure is expected to continue between BHP Billiton and SA Government prior to and throughout the early years of the expansion, and involve a range of agencies from the government, not-for-profit, and private sectors.33 Whilst some services are provided in Andamooka, Roxby Downs is the key service centre for the region. The planning for services in Roxby Downs will take account of the population increase in Andamooka. Predicted adverse impacts Predicted benefits and opportunities 5.4.1 Demographic features There is a risk of the specific demographic features, and associated service needs, being overlooked in the community service planning for Roxby Downs. The combination of the predicted demographic features and the isolated environment (people living away from families, social and support networks) indicates a potential for higher community and social support needs. 5.4.2 Service needs There is a potential for increased mental health issues associated with alcohol and drug abuse, and domestic violence and relationship breakdown34. A lack of access to emergency and safe accommodation for young people or women escaping domestic violence in Andamooka
A strategic approach to planning for social services in the region through the Social Services Planning Group will provide the opportunity for the specific service needs of the Andamooka community to be to recognized and addressed where relevant This framework will provide an on-going opportunity for emerging issues and service needs to be considered, in consultation with the Andamooka community. Planning for community and social services for an expanded Roxby Downs population is expected in an increased range of services and community facilities. Andamooka residents will benefit from access to the greater range of services and facilities
33 The Draft EIS refers to the development, implementation and monitoring of a Social Management Plan by BHP Billiton in collaboration with government and other stakeholders, which would monitor the effects of the expansion on Roxby Downs and relevant communities in the region 34 These risks are supported by experiences reported by service delivery agencies since the 1996 Olympic Dam expansion, and in the literature review about experiences elsewhere
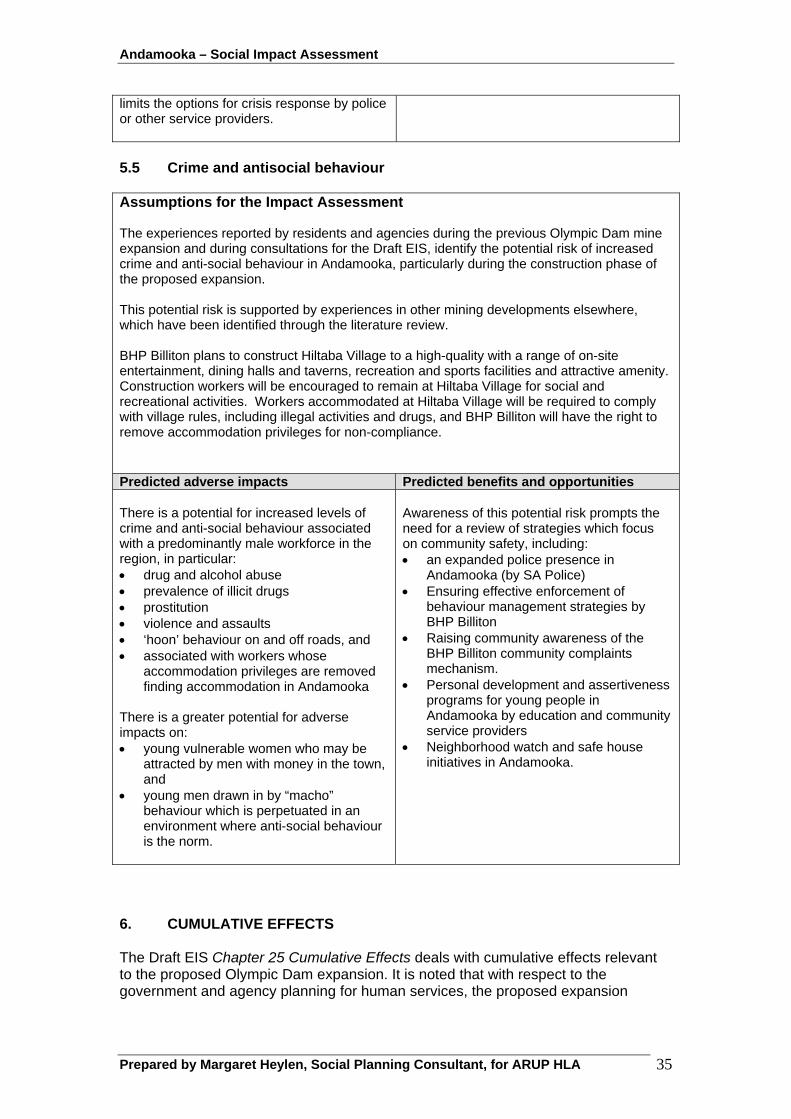
Andamooka – Social Impact Assessment
limits the options for crisis response by police or other service providers. 5.5 Crime and antisocial behaviour Assumptions for the Impact Assessment The experiences reported by residents and agencies during the previous Olympic Dam mine expansion and during consultations for the Draft EIS, identify the potential risk of increased crime and anti-social behaviour in Andamooka, particularly during the construction phase of the proposed expansion. This potential risk is supported by experiences in other mining developments elsewhere, which have been identified through the literature review. BHP Billiton plans to construct Hiltaba Village to a high-quality with a range of on-site entertainment, dining halls and taverns, recreation and sports facilities and attractive amenity. Construction workers will be encouraged to remain at Hiltaba Village for social and recreational activities. Workers accommodated at Hiltaba Village will be required to comply with village rules, including illegal activities and drugs, and BHP Billiton will have the right to remove accommodation privileges for non-compliance. Predicted adverse impacts Predicted benefits and opportunities There is a potential for increased levels of crime and anti-social behaviour associated with a predominantly male workforce in the region, in particular: • drug and alcohol abuse • prevalence of illicit drugs • prostitution • violence and assaults • ‘hoon’ behaviour on and off roads, and • associated with workers whose
accommodation privileges are removed finding accommodation in Andamooka
There is a greater potential for adverse impacts on: • young vulnerable women who may be
attracted by men with money in the town, and
• young men drawn in by “macho” behaviour which is perpetuated in an environment where anti-social behaviour is the norm.
Awareness of this potential risk prompts the need for a review of strategies which focus on community safety, including: • an expanded police presence in
Andamooka (by SA Police) • Ensuring effective enforcement of
behaviour management strategies by BHP Billiton
• Raising community awareness of the BHP Billiton community complaints mechanism.
• Personal development and assertiveness programs for young people in Andamooka by education and community service providers
• Neighborhood watch and safe house initiatives in Andamooka.
6. CUMULATIVE EFFECTS The Draft EIS Chapter 25 Cumulative Effects deals with cumulative effects relevant to the proposed Olympic Dam expansion. It is noted that with respect to the government and agency planning for human services, the proposed expansion
Prepared by Margaret Heylen, Social Planning Consultant, for ARUP HLA 35
Andamooka – Social Impact Assessment
provides the opportunity to address current concerns and maximise social benefits for the affected communities. The Andamooka Social Impact Assessment Study has explored and identified the potential and likely social effects on Andamooka, with specific reference to future growth and development, employment and business opportunities, crime and anti-social behaviour, access to community services, and community safety, health and amenity. The research undertaken for the social impact assessment did not suggest any other factors or projects which may result in a cumulative effect on Andamooka.
Prepared by Margaret Heylen, Social Planning Consultant, for ARUP HLA 36

Andamooka – Social Impact Assessment
Prepared by Margaret Heylen, Social Planning Consultant, for ARUP HLA 37
REFERENCES AND BIBLIOGRAPHY Australian Bureau of Census and Statistics, Census of Population and Housing
2001 Census, Community Profile Series, Usual Residents Profile, Cat. no. 2004.0 2001 Census Community Profile Series, Basic Community Profile, Cat. no. 2001.0 2006 Census, Basic Community Profile, Cat. no. 2001.0 2006 Census, Community Profile Series, Place of Enumeration Profile, Cat. no. 2004.0 2006 Census, Community Profile Series, Expanded Community Profile, Cat. no. 2005.0 2006 Census, QuickStats.
ABC Online
Housing gloom in mining boom: Central Queensland
APOMA – Prepared by Collins Anderson Management
Andamooka Community Plan 2002
ARUP – HLA Draft EIS – Olympic Mine Expansion Chapters, Appendices, working documents and reports
Australasian Journal of Regional Studies, Vol.13, No l2, 2007 2004-2006
Lessons from the Social and Economic Impacts of the Mining boom in the Bowen Basin
Scheltens, M and Morris Y.
Homelessness in high income mining towns and the opportunity for big business to play a part
Department for Families and Communities
Private Rental Quarterly Median Rent Reports
Freeleagus, Peter Mayor of Belyando Shire
Coal and Community –Living with the boom
Goud, Heylen and Carnegie A Guide to Social Planning for Local Government in South Australia, 2002
Northern British Columbia Business Council on Substance Abuse: Barton Sylvia S
Aspects of the effect of substance use on health, wellness and safety of employees and families in northern remote work sites.
Outback Areas Community Development Trust
State of the Outback Report 2006 Website: <www.oacdt.sa.gov.au> Communities – Andamooka
Outback Areas Community Development Trust - Prepared by Margaret Heylen Consulting
Governance Review – Community Consultation Report, August 2007
Planning SA Land not Within a Council Area Eyre, far North, Riverland and Whyalla Development Plans Land not Within a Council Area Consolidation and Better Development Plan (BDF) Conversion Development Plan Amendment by the Minister 3 July 2008 (Remote Area Zone)
Planning SA Land not within a Council Area Eyre, Far North, Riverland and Whyalla Development Plans - Extract Development Act 1993 July 2008
Rolfe J, Ivanova G, Lockie S Assessing the Social and Economic Impacts of Coal Mining on Communities in Bowen Basin: Summary
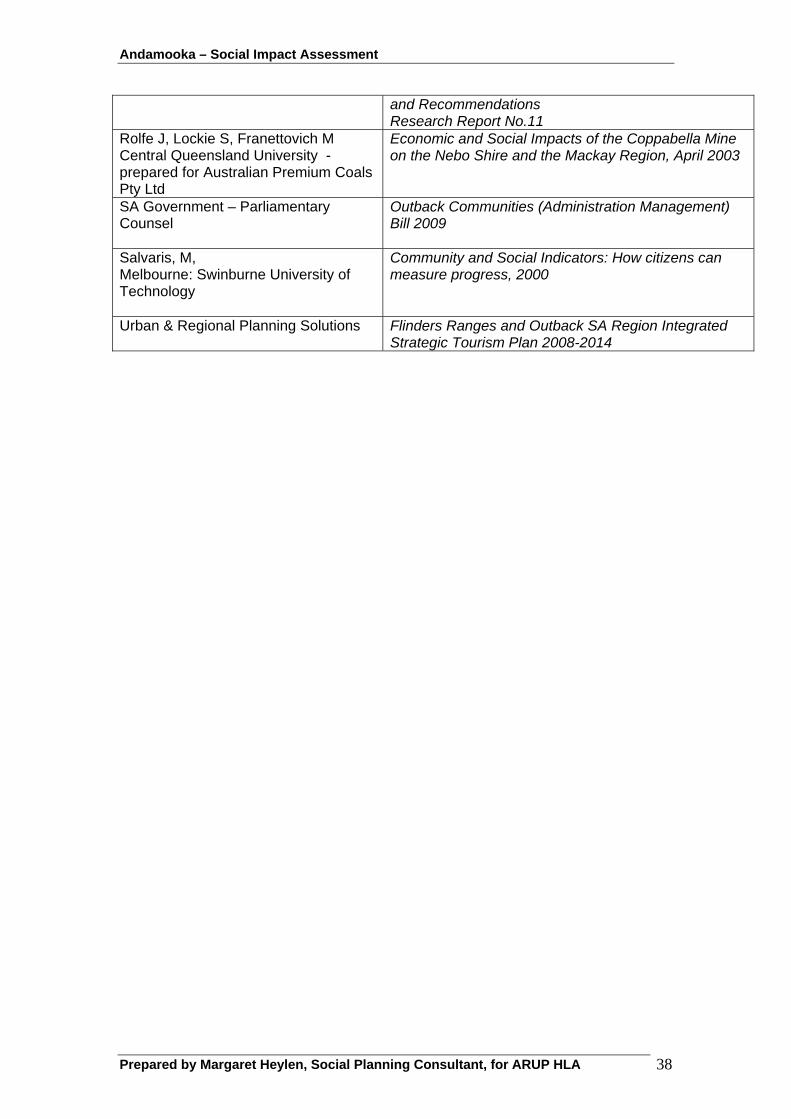
Andamooka – Social Impact Assessment
and Recommendations Research Report No.11
Rolfe J, Lockie S, Franettovich M Central Queensland University - prepared for Australian Premium Coals Pty Ltd
Economic and Social Impacts of the Coppabella Mine on the Nebo Shire and the Mackay Region, April 2003
SA Government – Parliamentary Counsel
Outback Communities (Administration Management) Bill 2009
Salvaris, M, Melbourne: Swinburne University of Technology
Community and Social Indicators: How citizens can measure progress, 2000
Urban & Regional Planning Solutions Flinders Ranges and Outback SA Region Integrated Strategic Tourism Plan 2008-2014
Prepared by Margaret Heylen, Social Planning Consultant, for ARUP HLA 38

Andamooka – Social Impact Assessment
Prepared by Margaret Heylen, Social Planning Consultant, for ARUP HLA 39
Appendix A: Socio-demographic characteristics of Andamooka and South Australia35 The attached table highlights the key socio-demographic characteristics and changes in Andamooka and South Australia at the 1996, 2001 and 2006 census36. The key features of this analysis in Andamooka are summarized as follows:
• Population declines between 1996 and 2001 (-1.6%), but high population growth between 2001 and 2006 (14.5%). This compares to steady population growth in South Australia across censuses (2.7% and 2.8%).
• A greater proportion of people counted at home in 2001 (91.6%) than in 1996 (86.1%)
and fewer in 2006 (85.5%). The proportion of people counted at home in South Australia was relatively constant across censuses (about 95%). Related to this, the proportion of visitors declined at the 2001 census in Andamooka, and increased at the 2006 census, but has remained consistently higher than South Australia across censuses.
• An increase in the proportion of men between 1996 and 2001, followed by a relatively
large decline from 2001 to 2006 (to about 56.5%). The proportion of men to women has been relatively constant in South Australia (about 49%), and consistently lower than Andamooka across censuses.
• A relatively large increases in the Aboriginal population across censuses (from 0.6%
in 1996 to 1.8% in 2001 and 3.3% in 2006), compared to a slight increase in South Australia.
• An increase in the proportion of Australian born people, and people speaking English
only across censuses, although the proportion of overseas born remains relatively high in Andamooka compared to South Australia.
• A decrease in the median age of people at the 2001 census (from 46 to 44 years),
with the median age increasing again in 2006 (to 48 years). At the 2001 census, the proportion of people under 4 years and 65 years and older increased in Andamooka, with declines in the proportion of people aged between 15 years and 64 years. The median age of South Australian has increased across censuses (from 35 to 38 years) but remains significantly lower than Andamooka.
• Relatively low labor force participation across censuses (between 46% and 55%, with
the highest recorded in 2006), compared to South Australia (at about 59%).
• Relatively high unemployment compared to South Australia, although this has steadily declined across censuses.
• Relatively low (but increasing) weekly individual and household incomes compared to
South Australia across censuses.
• Fewer people married, or never married, and more separated compared to South Australia across censuses.
• Fewer families with children and lone parent families, and more couples without
children and lone person households compared to South Australia across censuses. While the proportion of couples without children and lone person households increased in Andamooka by 2001, this was followed by large declines in lone person households, and continued growth in couples without children by 2006.
35 Prepared by Rose Bowey. 36 Based on place of enumeration population counts (i.e. location on census night, rather than usual residence population counts).
Andamooka – Social Impact Assessment
Prepared by Margaret Heylen, Social Planning Consultant, for ARUP HLA 40
• A more stable population stability compared to South Australia, with a greater proportion of people living at the same address 5 years ago, and larger increases in this proportion across censuses, in Andamooka.
• Larger increases in the proportion of people enumerated in non-private dwellings
across census (with the largest increases between 2001 and 2006), although the proportions are lower in comparison to South Australia.
• An increase in average household size at the 2001 census (from 2.0 to 2.8) and a
decrease at the 2006 census (2.0). This has been relatively constant in South Australia (about 2.4) across censuses.
• A relatively high proportion of unoccupied dwellings across censuses (over 40% in
Andamooka compared to about 10% in South Australia), with the greatest proportion recorded in 2006 (44%).
• A relatively high proportion of separate houses (about 90%) and other dwellings
(between 1.7% and 6.3%) compared to South Australia (with about 77% separate houses and 1% other dwellings). The proportion of separate houses has declined steadily in Andamooka, and increased in South Australia across censuses, with a relatively large increase in other dwellings recorded in Andamooka in 2001.
• A high (but declining) proportion of fully-owned dwellings across censuses compared
to South Australia, and an increase in the proportion of dwellings being purchased and rented.
• Relatively low median monthly housing repayments and median weekly rents
compared to South Australia across censuses, although rents had risen sharply in Andamooka by 2006.
• Fewer dwellings with no vehicles and more dwellings with three or more vehicles than
South Australia across censuses, with the largest increases in dwellings with three or more vehicles in 2001 in both Andamooka and South Australia. By 2006, the proportion of dwellings with two vehicles had increased in Andamooka (to similar levels as South Australia), while the proportion of dwellings, with none, one or three vehicles had declined.
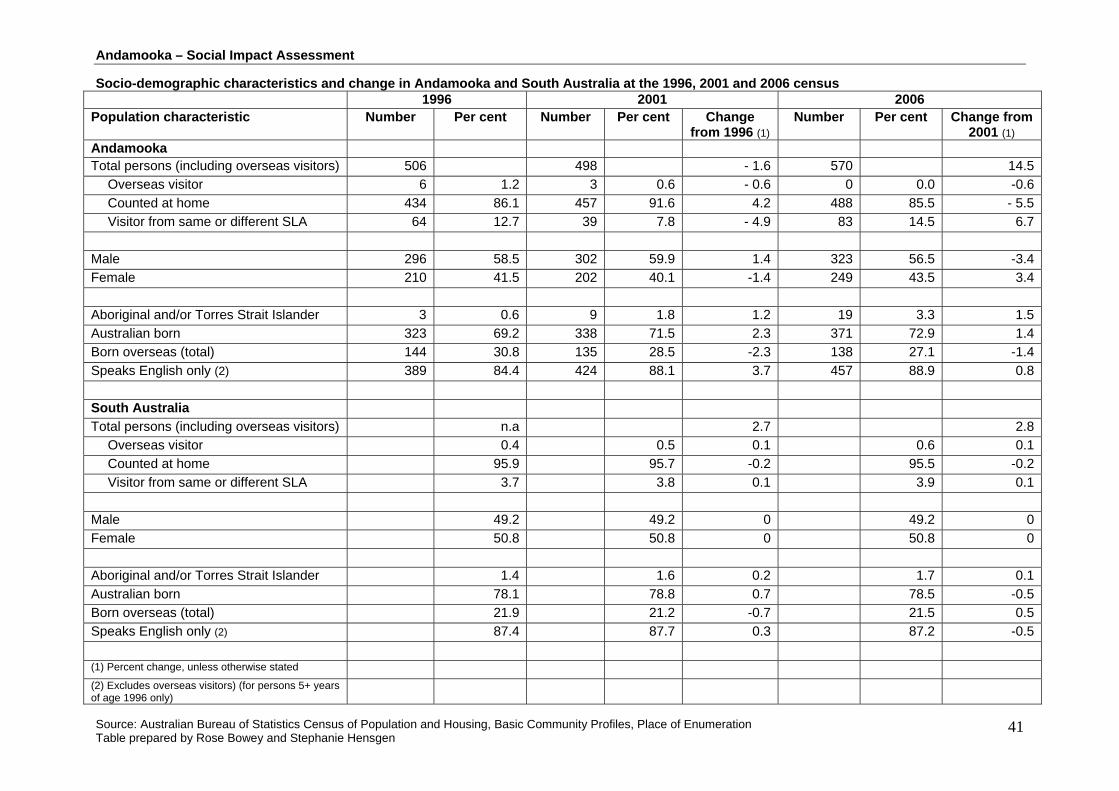
Andamooka – Social Impact Assessment
Socio-demographic characteristics and change in Andamooka and South Australia at the 1996, 2001 and 2006 census 1996 2001 2006 Population characteristic Number Per cent Number Per cent Change
from 1996 (1) Number Per cent Change from
2001 (1) Andamooka Total persons (including overseas visitors) 506 498 - 1.6 570 14.5
Overseas visitor 6 1.2 3 0.6 - 0.6 0 0.0 -0.6
Counted at home 434 86.1 457 91.6 4.2 488 85.5 - 5.5
Visitor from same or different SLA 64 12.7 39 7.8 - 4.9 83 14.5 6.7
Male 296 58.5 302 59.9 1.4 323 56.5 -3.4
Female 210 41.5 202 40.1 -1.4 249 43.5 3.4
Aboriginal and/or Torres Strait Islander 3 0.6 9 1.8 1.2 19 3.3 1.5
Australian born 323 69.2 338 71.5 2.3 371 72.9 1.4
Born overseas (total) 144 30.8 135 28.5 -2.3 138 27.1 -1.4
Speaks English only (2) 389 84.4 424 88.1 3.7 457 88.9 0.8
South Australia
Total persons (including overseas visitors) n.a 2.7 2.8
Overseas visitor 0.4 0.5 0.1 0.6 0.1
Counted at home 95.9 95.7 -0.2 95.5 -0.2
Visitor from same or different SLA 3.7 3.8 0.1 3.9 0.1
Male 49.2 49.2 0 49.2 0
Female 50.8 50.8 0 50.8 0
Aboriginal and/or Torres Strait Islander 1.4 1.6 0.2 1.7 0.1
Australian born 78.1 78.8 0.7 78.5 -0.5
Born overseas (total) 21.9 21.2 -0.7 21.5 0.5
Speaks English only (2) 87.4 87.7 0.3 87.2 -0.5
(1) Percent change, unless otherwise stated (2) Excludes overseas visitors) (for persons 5+ years of age 1996 only)
Source: Australian Bureau of Statistics Census of Population and Housing, Basic Community Profiles, Place of Enumeration Table prepared by Rose Bowey and Stephanie Hensgen
41
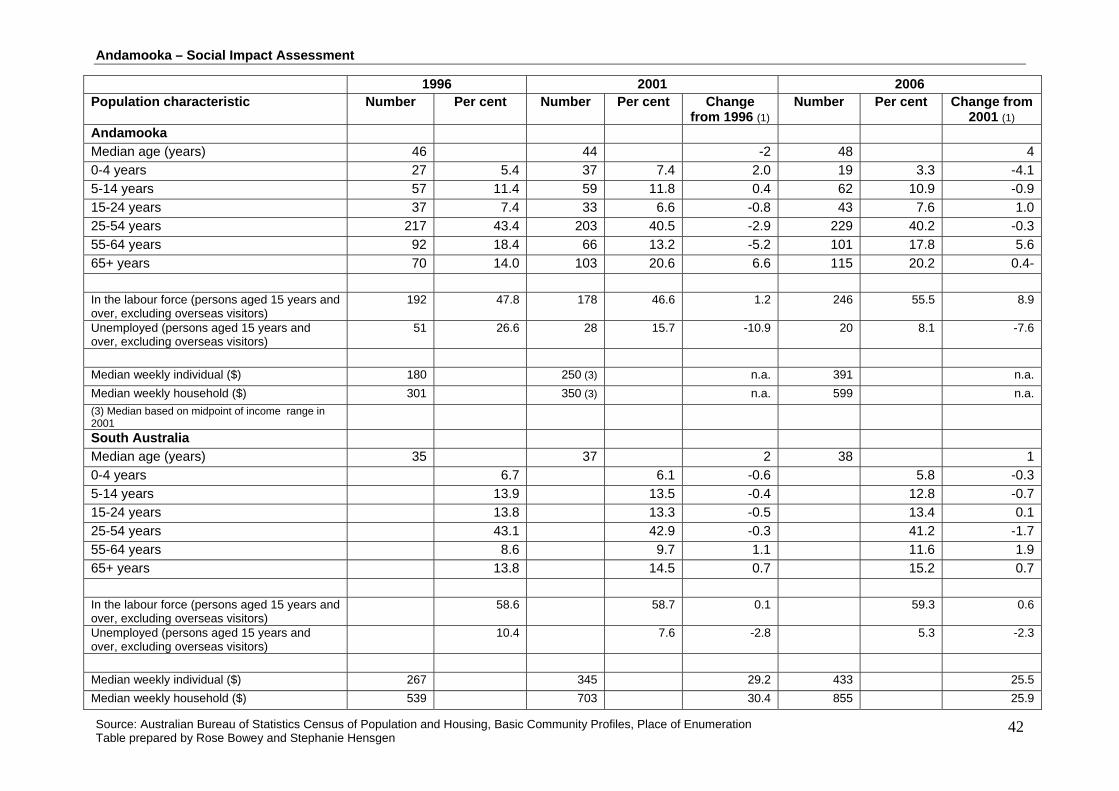
Andamooka – Social Impact Assessment
1996 2001 2006 Population characteristic Number Per cent Number Per cent Change
from 1996 (1) Number Per cent Change from
2001 (1) Andamooka
Median age (years) 46 44 -2 48 4
0-4 years 27 5.4 37 7.4 2.0 19 3.3 -4.1
5-14 years 57 11.4 59 11.8 0.4 62 10.9 -0.9
15-24 years 37 7.4 33 6.6 -0.8 43 7.6 1.0
25-54 years 217 43.4 203 40.5 -2.9 229 40.2 -0.3
55-64 years 92 18.4 66 13.2 -5.2 101 17.8 5.6
65+ years 70 14.0 103 20.6 6.6 115 20.2 0.4-
In the labour force (persons aged 15 years and over, excluding overseas visitors)
192 47.8 178 46.6 1.2 246 55.5 8.9
Unemployed (persons aged 15 years and over, excluding overseas visitors)
51 26.6 28 15.7 -10.9 20 8.1 -7.6
Median weekly individual ($) 180 250 (3) n.a. 391 n.a.
Median weekly household ($) 301 350 (3) n.a. 599 n.a.
(3) Median based on midpoint of income range in 2001
South Australia
Median age (years) 35 37 2 38 1
0-4 years 6.7 6.1 -0.6 5.8 -0.3
5-14 years 13.9 13.5 -0.4 12.8 -0.7
15-24 years 13.8 13.3 -0.5 13.4 0.1
25-54 years 43.1 42.9 -0.3 41.2 -1.7
55-64 years 8.6 9.7 1.1 11.6 1.9
65+ years 13.8 14.5 0.7 15.2 0.7
In the labour force (persons aged 15 years and over, excluding overseas visitors)
58.6 58.7 0.1 59.3 0.6
Unemployed (persons aged 15 years and over, excluding overseas visitors)
10.4 7.6 -2.8 5.3 -2.3
Median weekly individual ($) 267 345 29.2 433 25.5
Median weekly household ($) 539 703 30.4 855 25.9
Source: Australian Bureau of Statistics Census of Population and Housing, Basic Community Profiles, Place of Enumeration Table prepared by Rose Bowey and Stephanie Hensgen
42
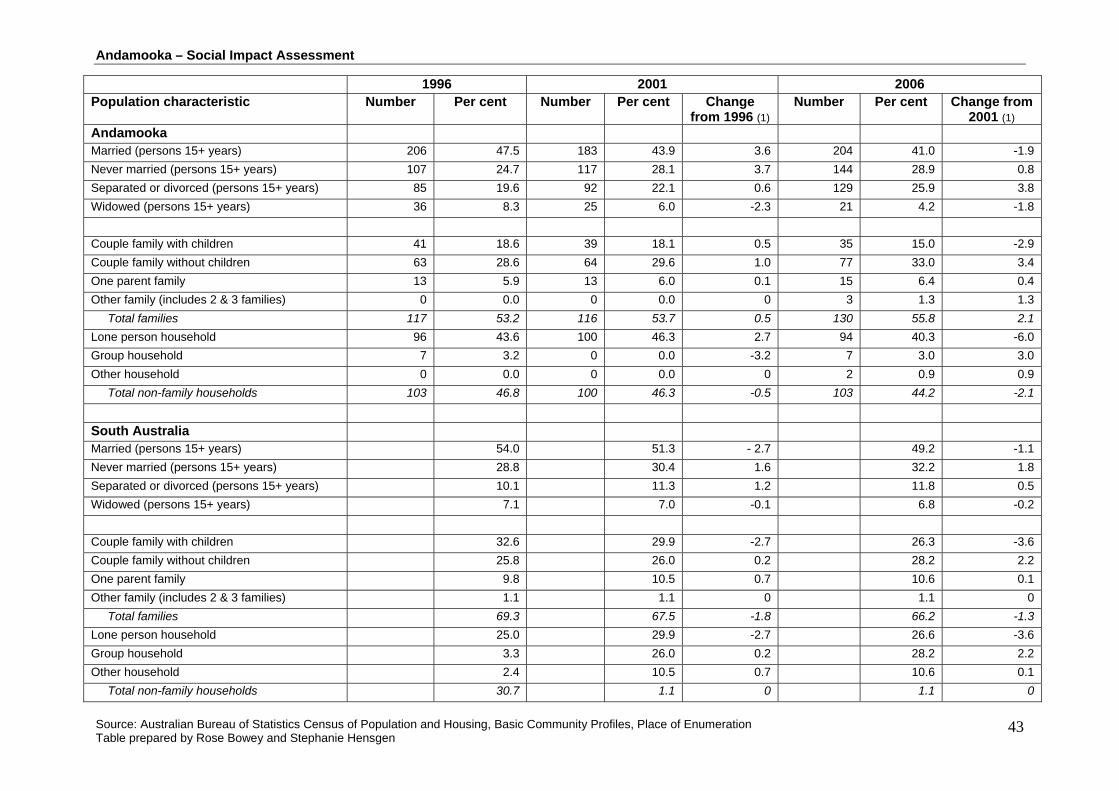
Andamooka – Social Impact Assessment
1996 2001 2006 Population characteristic Number Per cent Number Per cent Change
from 1996 (1) Number Per cent Change from
2001 (1) Andamooka Married (persons 15+ years) 206 47.5 183 43.9 3.6 204 41.0 -1.9
Never married (persons 15+ years) 107 24.7 117 28.1 3.7 144 28.9 0.8
Separated or divorced (persons 15+ years) 85 19.6 92 22.1 0.6 129 25.9 3.8
Widowed (persons 15+ years) 36 8.3 25 6.0 -2.3 21 4.2 -1.8
Couple family with children 41 18.6 39 18.1 0.5 35 15.0 -2.9
Couple family without children 63 28.6 64 29.6 1.0 77 33.0 3.4
One parent family 13 5.9 13 6.0 0.1 15 6.4 0.4
Other family (includes 2 & 3 families) 0 0.0 0 0.0 0 3 1.3 1.3
Total families 117 53.2 116 53.7 0.5 130 55.8 2.1
Lone person household 96 43.6 100 46.3 2.7 94 40.3 -6.0
Group household 7 3.2 0 0.0 -3.2 7 3.0 3.0
Other household 0 0.0 0 0.0 0 2 0.9 0.9
Total non-family households 103 46.8 100 46.3 -0.5 103 44.2 -2.1
South Australia Married (persons 15+ years) 54.0 51.3 - 2.7 49.2 -1.1
Never married (persons 15+ years) 28.8 30.4 1.6 32.2 1.8
Separated or divorced (persons 15+ years) 10.1 11.3 1.2 11.8 0.5
Widowed (persons 15+ years) 7.1 7.0 -0.1 6.8 -0.2
Couple family with children 32.6 29.9 -2.7 26.3 -3.6
Couple family without children 25.8 26.0 0.2 28.2 2.2
One parent family 9.8 10.5 0.7 10.6 0.1
Other family (includes 2 & 3 families) 1.1 1.1 0 1.1 0
Total families 69.3 67.5 -1.8 66.2 -1.3
Lone person household 25.0 29.9 -2.7 26.6 -3.6
Group household 3.3 26.0 0.2 28.2 2.2
Other household 2.4 10.5 0.7 10.6 0.1
Total non-family households 30.7 1.1 0 1.1 0
Source: Australian Bureau of Statistics Census of Population and Housing, Basic Community Profiles, Place of Enumeration Table prepared by Rose Bowey and Stephanie Hensgen
43
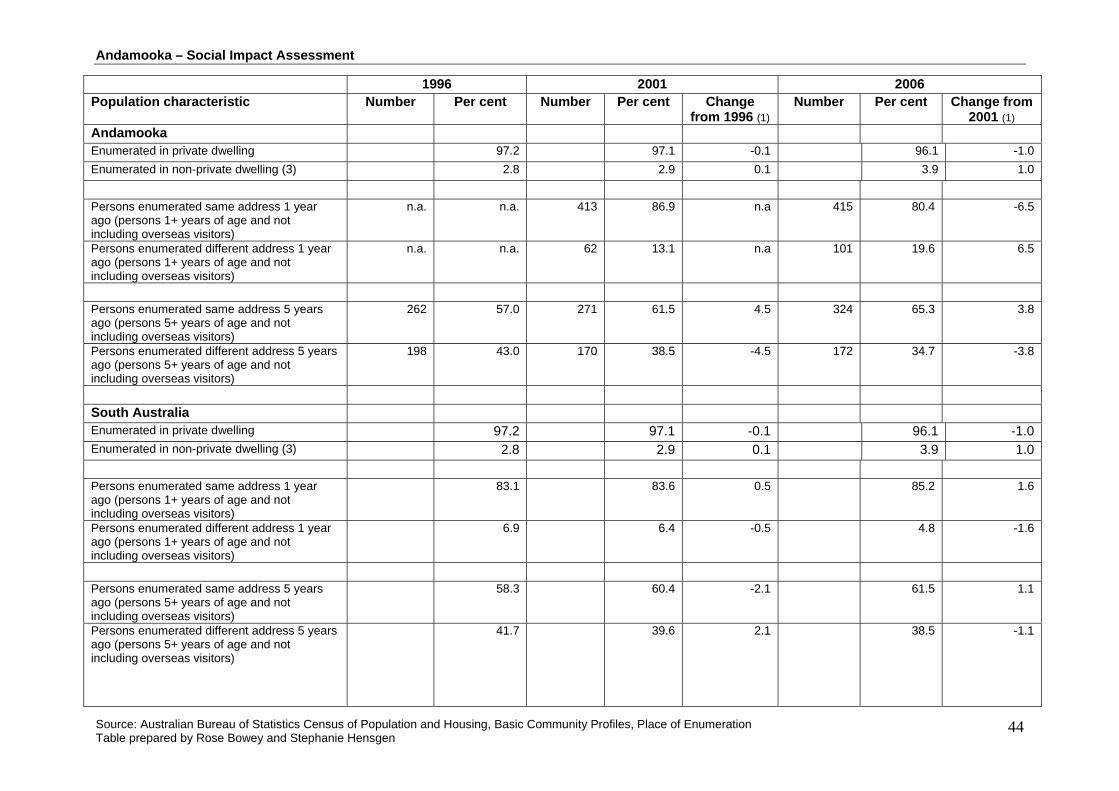
Andamooka – Social Impact Assessment
1996 2001 2006 Population characteristic Number Per cent Number Per cent Change
from 1996 (1) Number Per cent Change from
2001 (1) Andamooka Enumerated in private dwelling 97.2 97.1 -0.1 96.1 -1.0
Enumerated in non-private dwelling (3) 2.8 2.9 0.1 3.9 1.0
Persons enumerated same address 1 year ago (persons 1+ years of age and not including overseas visitors)
n.a. n.a. 413 86.9 n.a 415 80.4 -6.5
Persons enumerated different address 1 year ago (persons 1+ years of age and not including overseas visitors)
n.a. n.a. 62 13.1 n.a 101 19.6 6.5
Persons enumerated same address 5 years ago (persons 5+ years of age and not including overseas visitors)
262 57.0 271 61.5 4.5 324 65.3 3.8
Persons enumerated different address 5 years ago (persons 5+ years of age and not including overseas visitors)
198 43.0 170 38.5 -4.5 172 34.7 -3.8
South Australia Enumerated in private dwelling 97.2 97.1 -0.1 96.1 -1.0 Enumerated in non-private dwelling (3) 2.8 2.9 0.1 3.9 1.0
Persons enumerated same address 1 year ago (persons 1+ years of age and not including overseas visitors)
83.1 83.6 0.5 85.2 1.6
Persons enumerated different address 1 year ago (persons 1+ years of age and not including overseas visitors)
6.9 6.4 -0.5 4.8 -1.6
Persons enumerated same address 5 years ago (persons 5+ years of age and not including overseas visitors)
58.3 60.4 -2.1 61.5 1.1
Persons enumerated different address 5 years ago (persons 5+ years of age and not including overseas visitors)
41.7 39.6 2.1 38.5 -1.1
Source: Australian Bureau of Statistics Census of Population and Housing, Basic Community Profiles, Place of Enumeration Table prepared by Rose Bowey and Stephanie Hensgen
44
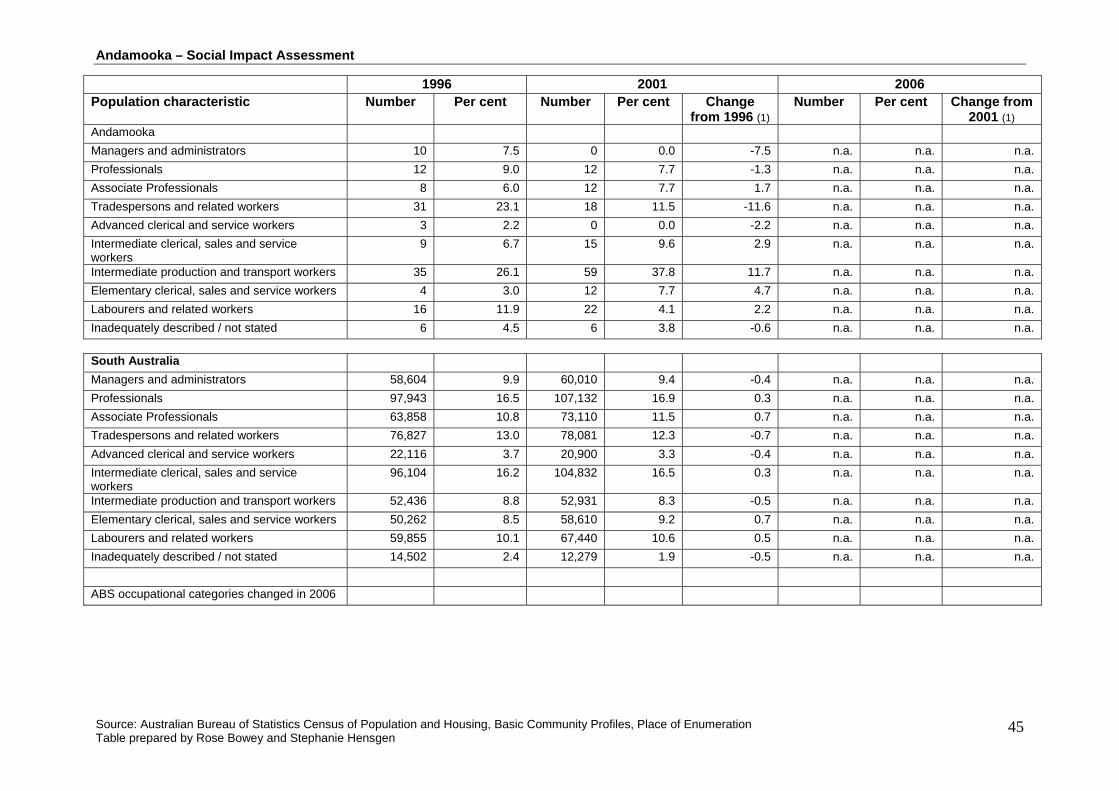
Andamooka – Social Impact Assessment
1996 2001 2006 Population characteristic Number Per cent Number Per cent Change
from 1996 (1) Number Per cent Change from
2001 (1) Andamooka
Managers and administrators 10 7.5 0 0.0 -7.5 n.a. n.a. n.a.
Professionals 12 9.0 12 7.7 -1.3 n.a. n.a. n.a.
Associate Professionals 8 6.0 12 7.7 1.7 n.a. n.a. n.a.
Tradespersons and related workers 31 23.1 18 11.5 -11.6 n.a. n.a. n.a.
Advanced clerical and service workers 3 2.2 0 0.0 -2.2 n.a. n.a. n.a.
Intermediate clerical, sales and service workers
9 6.7 15 9.6 2.9 n.a. n.a. n.a.
Intermediate production and transport workers 35 26.1 59 37.8 11.7 n.a. n.a. n.a.
Elementary clerical, sales and service workers 4 3.0 12 7.7 4.7 n.a. n.a. n.a.
Labourers and related workers 16 11.9 22 4.1 2.2 n.a. n.a. n.a.
Inadequately described / not stated 6 4.5 6 3.8 -0.6 n.a. n.a. n.a.
South Australia
Managers and administrators 58,604 9.9 60,010 9.4 -0.4 n.a. n.a. n.a.
Professionals 97,943 16.5 107,132 16.9 0.3 n.a. n.a. n.a.
Associate Professionals 63,858 10.8 73,110 11.5 0.7 n.a. n.a. n.a.
Tradespersons and related workers 76,827 13.0 78,081 12.3 -0.7 n.a. n.a. n.a.
Advanced clerical and service workers 22,116 3.7 20,900 3.3 -0.4 n.a. n.a. n.a.
Intermediate clerical, sales and service workers
96,104 16.2 104,832 16.5 0.3 n.a. n.a. n.a.
Intermediate production and transport workers 52,436 8.8 52,931 8.3 -0.5 n.a. n.a. n.a.
Elementary clerical, sales and service workers 50,262 8.5 58,610 9.2 0.7 n.a. n.a. n.a.
Labourers and related workers 59,855 10.1 67,440 10.6 0.5 n.a. n.a. n.a.
Inadequately described / not stated 14,502 2.4 12,279 1.9 -0.5 n.a. n.a. n.a.
ABS occupational categories changed in 2006
Source: Australian Bureau of Statistics Census of Population and Housing, Basic Community Profiles, Place of Enumeration Table prepared by Rose Bowey and Stephanie Hensgen
45
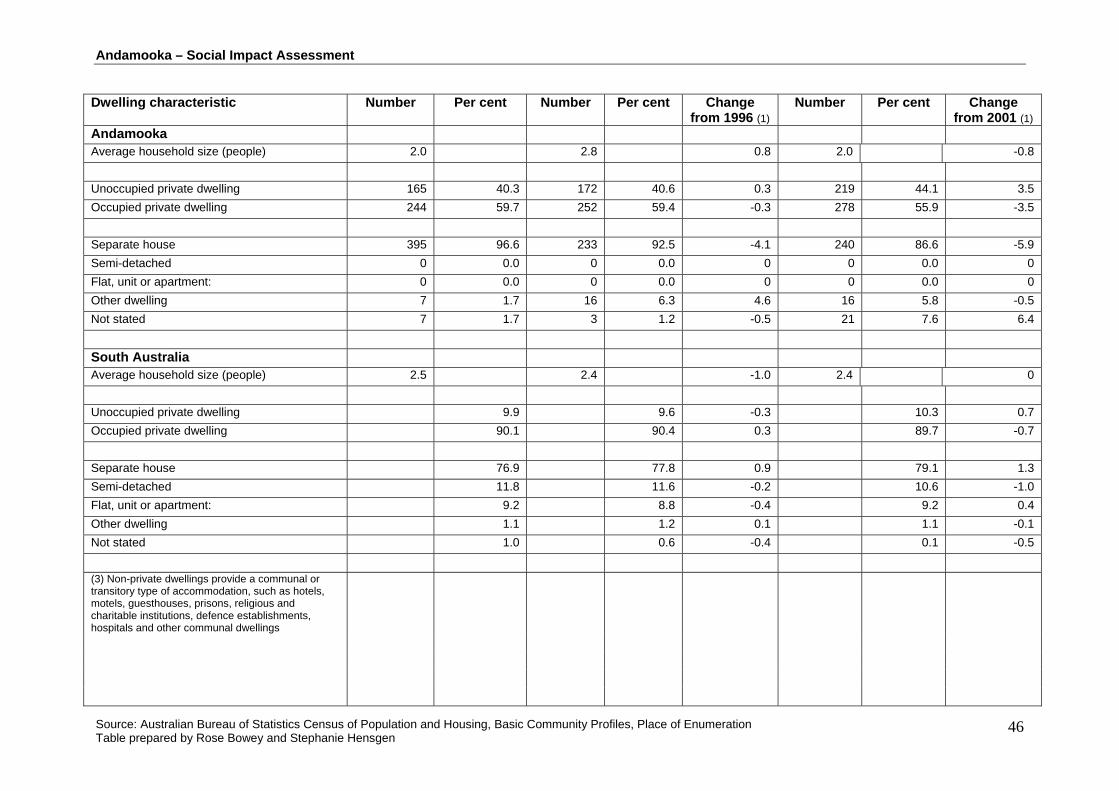
Andamooka – Social Impact Assessment
Dwelling characteristic Number Per cent Number Per cent Change
from 1996 (1) Number Per cent Change
from 2001 (1) Andamooka
Average household size (people) 2.0 2.8 0.8 2.0 -0.8
Unoccupied private dwelling 165 40.3 172 40.6 0.3 219 44.1 3.5
Occupied private dwelling 244 59.7 252 59.4 -0.3 278 55.9 -3.5
Separate house 395 96.6 233 92.5 -4.1 240 86.6 -5.9
Semi-detached 0 0.0 0 0.0 0 0 0.0 0
Flat, unit or apartment: 0 0.0 0 0.0 0 0 0.0 0
Other dwelling 7 1.7 16 6.3 4.6 16 5.8 -0.5
Not stated 7 1.7 3 1.2 -0.5 21 7.6 6.4
South Australia Average household size (people) 2.5 2.4 -1.0 2.4 0
Unoccupied private dwelling 9.9 9.6 -0.3 10.3 0.7
Occupied private dwelling 90.1 90.4 0.3 89.7 -0.7
Separate house 76.9 77.8 0.9 79.1 1.3
Semi-detached 11.8 11.6 -0.2 10.6 -1.0
Flat, unit or apartment: 9.2 8.8 -0.4 9.2 0.4
Other dwelling 1.1 1.2 0.1 1.1 -0.1
Not stated 1.0 0.6 -0.4 0.1 -0.5
(3) Non-private dwellings provide a communal or transitory type of accommodation, such as hotels, motels, guesthouses, prisons, religious and charitable institutions, defence establishments, hospitals and other communal dwellings
Source: Australian Bureau of Statistics Census of Population and Housing, Basic Community Profiles, Place of Enumeration Table prepared by Rose Bowey and Stephanie Hensgen
46
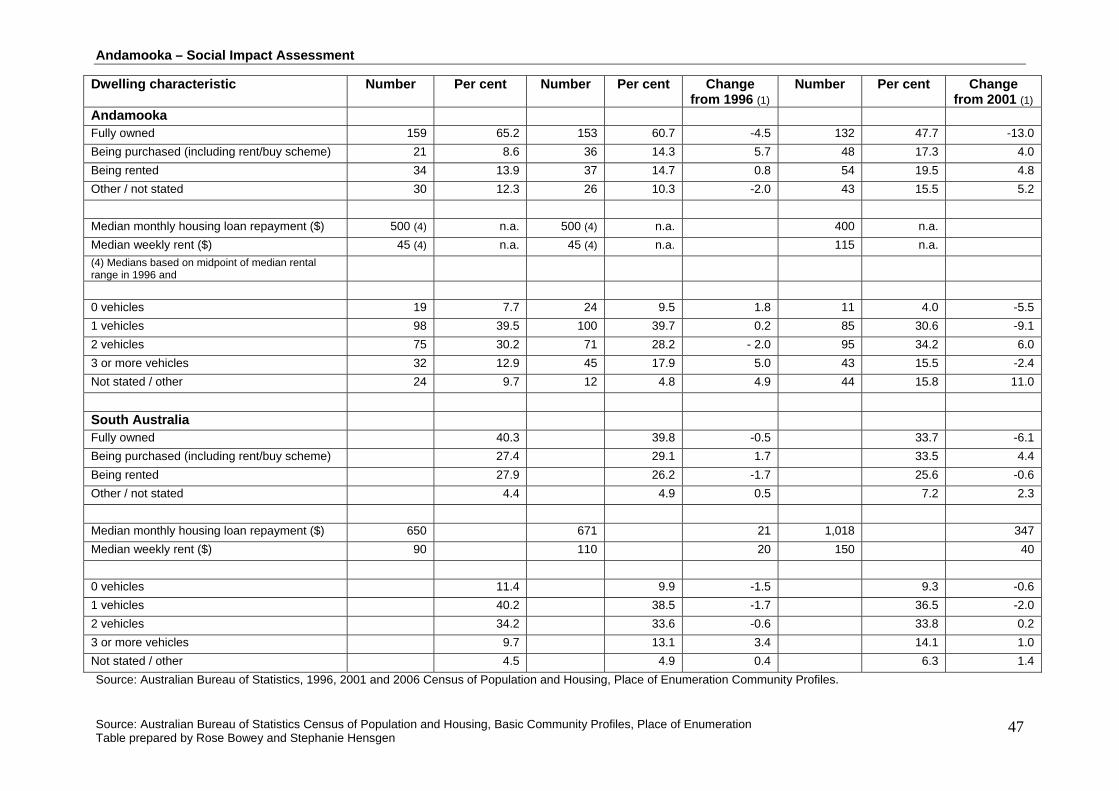
Andamooka – Social Impact Assessment
Dwelling characteristic Number Per cent Number Per cent Change from 1996 (1)
Number Per cent Change from 2001 (1)
Andamooka Fully owned 159 65.2 153 60.7 -4.5 132 47.7 -13.0
Being purchased (including rent/buy scheme) 21 8.6 36 14.3 5.7 48 17.3 4.0
Being rented 34 13.9 37 14.7 0.8 54 19.5 4.8
Other / not stated 30 12.3 26 10.3 -2.0 43 15.5 5.2
Median monthly housing loan repayment ($) 500 (4) n.a. 500 (4) n.a. 400 n.a. Median weekly rent ($) 45 (4) n.a. 45 (4) n.a. 115 n.a. (4) Medians based on midpoint of median rental range in 1996 and
0 vehicles 19 7.7 24 9.5 1.8 11 4.0 -5.5
1 vehicles 98 39.5 100 39.7 0.2 85 30.6 -9.1
2 vehicles 75 30.2 71 28.2 - 2.0 95 34.2 6.0
3 or more vehicles 32 12.9 45 17.9 5.0 43 15.5 -2.4
Not stated / other 24 9.7 12 4.8 4.9 44 15.8 11.0
South Australia Fully owned 40.3 39.8 -0.5 33.7 -6.1
Being purchased (including rent/buy scheme) 27.4 29.1 1.7 33.5 4.4
Being rented 27.9 26.2 -1.7 25.6 -0.6
Other / not stated 4.4 4.9 0.5 7.2 2.3
Median monthly housing loan repayment ($) 650 671 21 1,018 347
Median weekly rent ($) 90 110 20 150 40
0 vehicles 11.4 9.9 -1.5 9.3 -0.6
1 vehicles 40.2 38.5 -1.7 36.5 -2.0
2 vehicles 34.2 33.6 -0.6 33.8 0.2
3 or more vehicles 9.7 13.1 3.4 14.1 1.0
Not stated / other 4.5 4.9 0.4 6.3 1.4
Source: Australian Bureau of Statistics, 1996, 2001 and 2006 Census of Population and Housing, Place of Enumeration Community Profiles.
Source: Australian Bureau of Statistics Census of Population and Housing, Basic Community Profiles, Place of Enumeration Table prepared by Rose Bowey and Stephanie Hensgen
47

Health data
APPENDIX J3
This appendix supplements Chapter 21, Social Environment, of the Supplementary EIS by providing health data for Roxby Downs
compared to country South Australia, South Australia, Australia and other comparable Australian mining communities.
J3.1 HEALTH INDICATORS
Data on health indicators is sourced from the Public Health Information Development Unit, University of Adelaide website, accessed
in June 2010, and includes tables on:
• health risk factors in Roxby Downs, country South Australia and South Australia in 2006 (Table J3.1)
• hospital admissions and use of services in Roxby Downs, country South Australia and South Australia in 2006 (Table J3.2)
• health risk factors and self-reported health in Roxby Downs, country South Australia, South Australia, Australia and comparable
mining communities in 2004–2005 (Table J3.3)
• mental health indicators in Roxby Downs, country South Australia, South Australia, Australia and comparable mining
communities in 2004–2005 (Table J3.4).
The information is based on either indirect age-standardised rates (per 1,000 people or per 100,000 as indicated) or indirect
age-standardised ratios, which show the number in an area compared with the number expected. Age-standardised ratios are used
where comparisons between areas are likely to be affected by variations in the age profile. Differences in age-standardised ratios
therefore reflect the incidence of factors other than age. The age-standard ratio is set at 100 (for either South Australia or
Australia), to enable comparisons to be made across areas. A higher-standard ratio means the area has a higher incidence; a
lower-standard ratio means the area has a lower incidence. For example, a score of 110 means the area is 10% higher than
South Australia (or Australia) on that indicator; a score of 85 means the area is 15% lower.
Data for areas is based on Australian Bureau of Statistics geographical boundaries for:
• the statistical local area (SLA) for Roxby Downs, which is the same as the local government area and covers the municipality
of Roxby Downs
• country South Australia, which excludes the Adelaide Statistical Division and Gawler Local Government Area
• local government areas for mining communities that are comparable to Roxby Downs
• totals for South Australia and Australia as a whole.
The criteria used to select comparable mining communities are similar to those used in Appendix Q6 of the Draft EIS (i.e. a large
proportion of the population was employed in mining, lived in a remote or very remote location and had a similar demography
in 2006), but does not exclude areas because of population size or the number of towns in the area (refer Appendix Q6 of the
Draft EIS for details). The areas that were previously selected for benchmarking in the Draft EIS are shaded in Tables J3.3 and J3.4
and include Peak Downs and Belyando shires. Broadsound, Roebourne and Port Hedland have also been included for benchmarking
in the Supplementary EIS as these areas have a high compatibility with Roxby Downs based on employment in mining, remoteness
and demographic characteristics. Health data is not available for Nhulunbuy, Weipa and Ashburton SLAs, which were included for
benchmarking in the Draft EIS.

Table J3.1: Health risk factors in Roxby Downs, country South Australia and South Australia, 20061
Indicators Measurement2 Roxby Downs Country South Australia South Australia
Estimated number of male current smokers, 18+ years
Rate 284 305 272
Ratio 104 112 100
Estimated number of female current smokers, 18+ years
Rate 185 228 207
Ratio 89 110 100
Estimated number of overweight (not obese) males, 15+ years
Rate 547 381 391
Ratio 140 97 100
Estimated number of obese males, 15+ years Rate 256 202 176
Ratio 145 115 100
Estimated number of overweight (not obese) females, 15+ years
Rate 275 253 251
Ratio 110 101 100
Estimated number of obese females, 15+ years
Rate 191 166 150
Ratio 128 110 100
Prevalence of selected chronic disease, mental and behavioural problems – males
Rate 62 98 95
Ratio 65 103 100
Prevalence of selected chronic disease, mental and behavioural problems – females
Rate 115 115 116
Ratio 98 99 100
Prevalence of selected chronic disease, mood (affective) problems – males
Rate 18 47 48
Ratio 37 103 100
Prevalence of selected chronic disease, mood (affective) problems – females
Rate 55 69 72
Ratio 76 95 100
Source: Public Health Information Development Unit 20091 For the statistical local area of Roxby Downs (which is the same as the local government area and covers the entire municipality). Country South Australia excludes Gawler. 2 Information is based on indirectly age-standardised rates (per 1,000 people) and indirectly age-standardised ratios. Standardised ratios are used to compare areas which may be affected by variations in the age profile. The age-standard ratio for South Australia is set at 100 for comparative purposes. A higher-standard ratio means the area has a higher incidence. A lower-standard ratio means the area has a lower incidence. For example, a score of 110 means the area is 10% higher than South Australia on that indicator; a score of 85 means the area is 15% lower.

Table J3.2: Hospital admissions and use of services in Roxby Downs, country South Australia and South Australia, 20061
Indicators Measurement2 Roxby Downs Country South Australia South Australia
Total male hospital admissions Rate 23,510 30,460 30,582
Ratio 77 100 100
Total female hospital admissions Rate 29,998 36,780 35,541
Ratio 84 103 100
Respiratory admissions – males Rate 1,550 2,240 2,142
Ratio 72 105 100
Respiratory admissions – females Rate 838 2,253 2,018
Ratio 42 110 100
Injuries, poisoning and other causes of admissions – males
Rate 3,515 3,353 2,524
Ratio 139 133 100
Injuries, poisoning and other causes of admissions – females
Rate 1,712 2,332 2,067
Ratio 83 113 100
Mental and behavioural admissions – males Rate 285 1,284 1,070
Ratio 27 120 100
Mental and behavioural admissions – females
Rate 417 1,372 1,169
Ratio 36 117 100
Potentially avoidable hospital admissions – males
Rate 3,007 3,708 3,423
Ratio 88 108 100
Potentially avoidable hospital admissions – females
Rate 3,772 4,045 3,423
Ratio 110 118 100
Potentially avoidable hospital admissions for diabetes – males
Rate 1,328 9,995 947
Ratio 140 105 100
Potentially avoidable hospital admissions for diabetes – females
Rate 229 840 716
Ratio 32 117 100
Community mental health services – males Rate 284 1,097 1,147
Ratio 25 96 100
Community mental health services – females Rate 1,236 1,112 1,062
Ratio 116 105 100
Child and adolescent mental health services – males
Rate 7,203 2,933 2,036
Ratio 354 144 100
Child and adolescent mental health services – females
Rate 9,646 2,516 1,621
Ratio 595 155 100
Source: Public Health Information Development Unit 20091 For the statistical local area of Roxby Downs (which is the same as the local government area and covers the entire municipality). Country South Australia excludes Gawler.2 Indirectly age-standardised rates (per 100,000 people) and indirectly age-standardised ratios for South Australia.
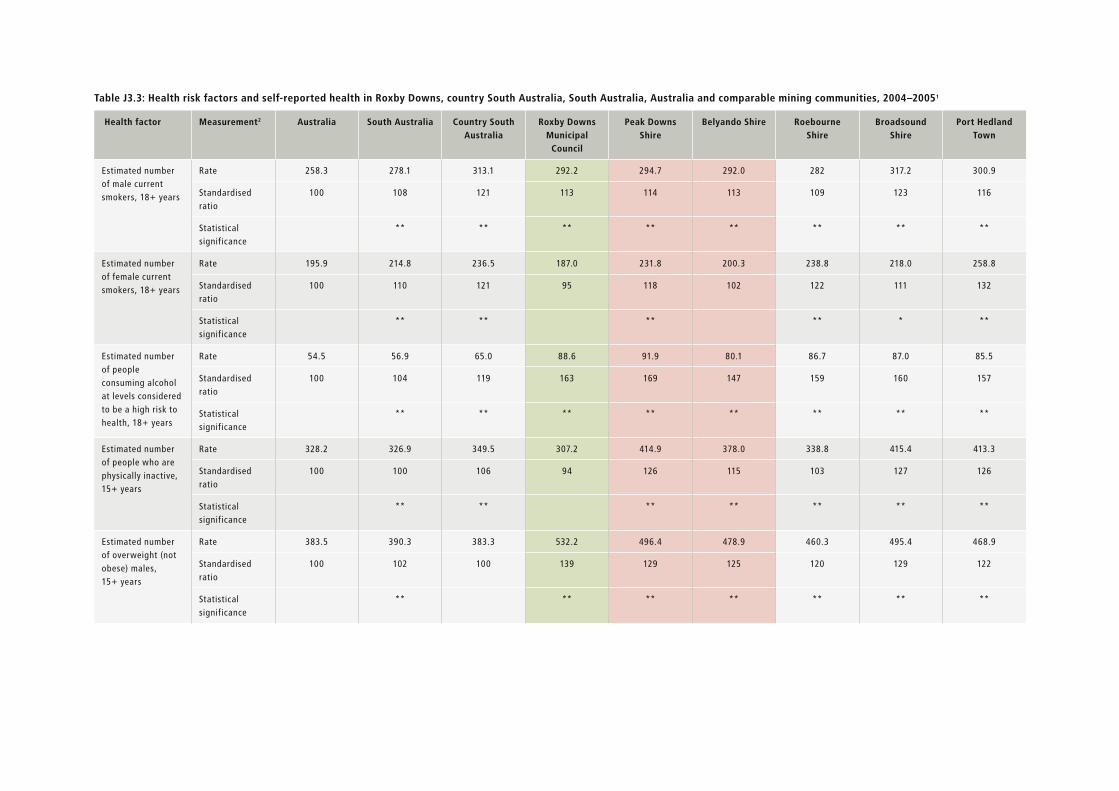
Health factor Measurement2 Australia South Australia Country South Australia
Roxby Downs Municipal
Council
Peak Downs Shire
Belyando Shire Roebourne Shire
Broadsound Shire
Port Hedland Town
Estimated number of male current smokers, 18+ years
Rate 258.3 278.1 313.1 292.2 294.7 292.0 282 317.2 300.9
Standardised ratio
100 108 121 113 114 113 109 123 116
Statistical significance
** ** ** ** ** ** ** **
Estimated number of female current smokers, 18+ years
Rate 195.9 214.8 236.5 187.0 231.8 200.3 238.8 218.0 258.8
Standardised ratio
100 110 121 95 118 102 122 111 132
Statistical significance
** ** ** ** * **
Estimated number of people consuming alcohol at levels considered to be a high risk to health, 18+ years
Rate 54.5 56.9 65.0 88.6 91.9 80.1 86.7 87.0 85.5
Standardised ratio
100 104 119 163 169 147 159 160 157
Statistical significance
** ** ** ** ** ** ** **
Estimated number of people who are physically inactive, 15+ years
Rate 328.2 326.9 349.5 307.2 414.9 378.0 338.8 415.4 413.3
Standardised ratio
100 100 106 94 126 115 103 127 126
Statistical significance
** ** ** ** ** ** **
Estimated number of overweight (not obese) males, 15+ years
Rate 383.5 390.3 383.3 532.2 496.4 478.9 460.3 495.4 468.9
Standardised ratio
100 102 100 139 129 125 120 129 122
Statistical significance
** ** ** ** ** ** **
Table J3.3: Health risk factors and self-reported health in Roxby Downs, country South Australia, South Australia, Australia and comparable mining communities, 2004–20051
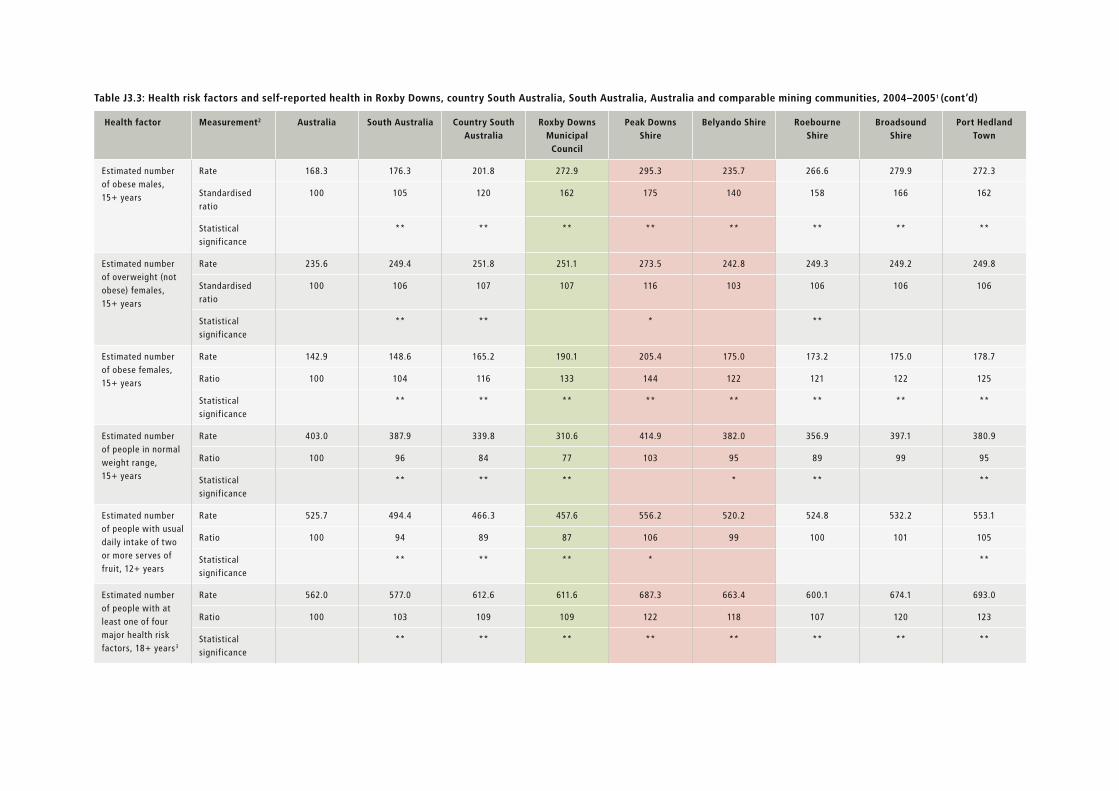
Health factor Measurement2 Australia South Australia Country South Australia
Roxby Downs Municipal
Council
Peak Downs Shire
Belyando Shire Roebourne Shire
Broadsound Shire
Port Hedland Town
Estimated number of obese males, 15+ years
Rate 168.3 176.3 201.8 272.9 295.3 235.7 266.6 279.9 272.3
Standardised ratio
100 105 120 162 175 140 158 166 162
Statistical significance
** ** ** ** ** ** ** **
Estimated number of overweight (not obese) females, 15+ years
Rate 235.6 249.4 251.8 251.1 273.5 242.8 249.3 249.2 249.8
Standardised ratio
100 106 107 107 116 103 106 106 106
Statistical significance
** ** * **
Estimated number of obese females, 15+ years
Rate 142.9 148.6 165.2 190.1 205.4 175.0 173.2 175.0 178.7
Ratio 100 104 116 133 144 122 121 122 125
Statistical significance
** ** ** ** ** ** ** **
Estimated number of people in normal weight range, 15+ years
Rate 403.0 387.9 339.8 310.6 414.9 382.0 356.9 397.1 380.9
Ratio 100 96 84 77 103 95 89 99 95
Statistical significance
** ** ** * ** **
Estimated number of people with usual daily intake of two or more serves of fruit, 12+ years
Rate 525.7 494.4 466.3 457.6 556.2 520.2 524.8 532.2 553.1
Ratio 100 94 89 87 106 99 100 101 105
Statistical significance
** ** ** * **
Estimated number of people with at least one of four major health risk factors, 18+ years3
Rate 562.0 577.0 612.6 611.6 687.3 663.4 600.1 674.1 693.0
Ratio 100 103 109 109 122 118 107 120 123
Statistical significance
** ** ** ** ** ** ** **
Table J3.3: Health risk factors and self-reported health in Roxby Downs, country South Australia, South Australia, Australia and comparable mining communities, 2004–20051 (cont’d)
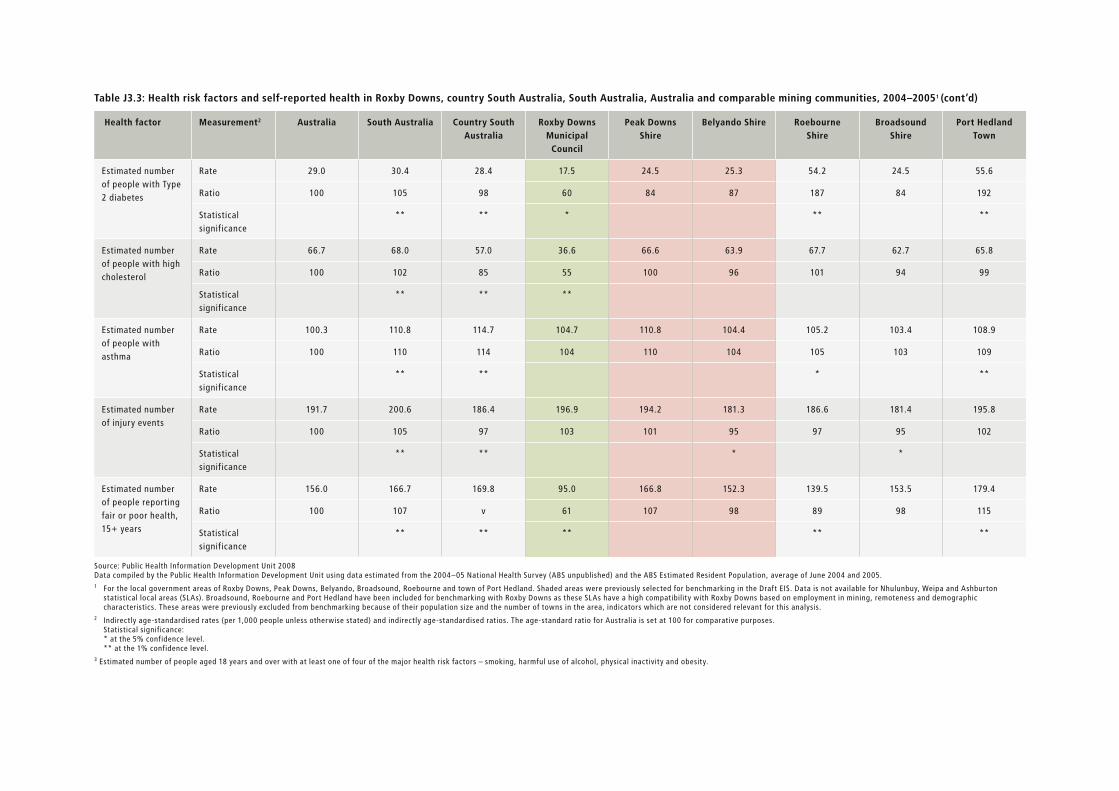
Health factor Measurement2 Australia South Australia Country South Australia
Roxby Downs Municipal
Council
Peak Downs Shire
Belyando Shire Roebourne Shire
Broadsound Shire
Port Hedland Town
Estimated number of people with Type 2 diabetes
Rate 29.0 30.4 28.4 17.5 24.5 25.3 54.2 24.5 55.6
Ratio 100 105 98 60 84 87 187 84 192
Statistical significance
** ** * ** **
Estimated number of people with high cholesterol
Rate 66.7 68.0 57.0 36.6 66.6 63.9 67.7 62.7 65.8
Ratio 100 102 85 55 100 96 101 94 99
Statistical significance
** ** **
Estimated number of people with asthma
Rate 100.3 110.8 114.7 104.7 110.8 104.4 105.2 103.4 108.9
Ratio 100 110 114 104 110 104 105 103 109
Statistical significance
** ** * **
Estimated number of injury events
Rate 191.7 200.6 186.4 196.9 194.2 181.3 186.6 181.4 195.8
Ratio 100 105 97 103 101 95 97 95 102
Statistical significance
** ** * *
Estimated number of people reporting fair or poor health, 15+ years
Rate 156.0 166.7 169.8 95.0 166.8 152.3 139.5 153.5 179.4
Ratio 100 107 v 61 107 98 89 98 115
Statistical significance
** ** ** ** **
Source: Public Health Information Development Unit 2008Data compiled by the Public Health Information Development Unit using data estimated from the 2004–05 National Health Survey (ABS unpublished) and the ABS Estimated Resident Population, average of June 2004 and 2005.1 For the local government areas of Roxby Downs, Peak Downs, Belyando, Broadsound, Roebourne and town of Port Hedland. Shaded areas were previously selected for benchmarking in the Draft EIS. Data is not available for Nhulunbuy, Weipa and Ashburton statistical local areas (SLAs). Broadsound, Roebourne and Port Hedland have been included for benchmarking with Roxby Downs as these SLAs have a high compatibility with Roxby Downs based on employment in mining, remoteness and demographic characteristics. These areas were previously excluded from benchmarking because of their population size and the number of towns in the area, indicators which are not considered relevant for this analysis. 2 Indirectly age-standardised rates (per 1,000 people unless otherwise stated) and indirectly age-standardised ratios. The age-standard ratio for Australia is set at 100 for comparative purposes. Statistical significance: * at the 5% confidence level. ** at the 1% confidence level.3 Estimated number of people aged 18 years and over with at least one of four of the major health risk factors – smoking, harmful use of alcohol, physical inactivity and obesity.
Table J3.3: Health risk factors and self-reported health in Roxby Downs, country South Australia, South Australia, Australia and comparable mining communities, 2004–20051 (cont’d)

Table J3.4: Mental health indicators in Roxby Downs, country South Australia, South Australia, Australia and comparable mining communities, 2004–20051
Health factor Measurement2 Australia South Australia Country South Australia
Roxby Downs Municipal Council
Peak Downs Shire
Belyando Shire Roebourne Shire
Broadsound Shire
Port Hedland Town
Estimated number of people with high or very high psychological distress levels (K10), 18+ years3
Rate 127 133.9 122.0 52.3 108.7 99.1 85.2 101.8 109.9
Ratio 100 105 96 41 86 78 67 80 87
Statistical significance
** ** ** ** ** ** ** **
Estimated number of males with mental and behavioural problems
Rate 98.7 94.6 98.4 17.4 106.5 101.7 83.8 97.4 93.5
Ratio 100 96 100 60 108 103 85 99 95
Statistical significance
** * **
Estimated number of males with mood (affective) problems4
Rate 41.7 47.1 46.5 36.6 24.9 23.4 25.0 22.4 30.1
Ratio 100 113 111 55 60 56 60 54 72
Statistical significance
** ** ** ** ** ** ** **
Estimated number of females with mental and behavioural problems
Rate 114 116.2 114.9 62.0 136.6 130.0 129.0 128.0 137.6
Ratio 100 104 103 63 123 117 116 115 123
Statistical significance
** ** ** ** ** ** * **
Estimated number of females with mood (affective) problems4
Rate 63.0 71.8 69.8 18.1 63.1 61.3 64.3 60.4 69.0
Ratio 100 114 111 43 100 97 102 96 109
Statistical significance
** ** ** *
Source: Public Health Information Development Unit 2008Data compiled by the Public Health Information Development Unit using data estimated from the 2004–05 National Health Survey (ABS unpublished) and the ABS Estimated Resident Population, average of June 2004 and 2005.1 For the local government areas of Roxby Downs, Peak Downs, Belyando, Broadsound, Roebourne and the town of Port Hedland. Data is not available for Nhulunbuy, Weipa and Ashburton SLAs. Shaded areas were previously selected for benchmarking in the Draft EIS.2 Indirectly age-standardised rates (per 1,000 people unless otherwise stated) and indirectly age-standardised ratios. The age-standard ratio for Australia is set at 100 for comparative purposes. Statistical significance:* at the 5% confidence level.** at the 1% confidence level.3 As measured by the Kessler 10 (K10) scale. The K10 scale measures non-specific psychological distress.4 Mood disorders (also known as affective disorders) include depression, dysthymia and bipolar affective disorder.

J3.2 REFERENCES
Public Health Information Development Unit 2008, ‘A Social Health Atlas of Australia (Third Edition), 2008 [online]’, viewed
May 2010, <http://www.publichealth.gov.au/data_online/aust_sla_online_2008/Australia_sla_data_2008.xls?bcsi_
scan_5ABA6609AA6FE06C=0&bcsi_scan_filename=Australia_sla_data_2008.xls>.
Public Health Information Development Unit 2009, ‘Men’s Health Atlas, South Australia 2009’, viewed June 2010, <http://www.
publichealth.gov.au/data_online/sa_mens_health_2009/mens_health_data_online.xls>.