Embed Size (px)
Citation preview

APPENDIX H.14
SALDS (CP‐OP‐13, CENTRAL PLATEAU)
EVALUATION UNIT SUMMARY TEMPLATE
Hanford Site-wide Risk Review Project Final Report – August 31 2018 http://www.cresp.org/hanford/

H.14_CP‐OP‐13_SALDS_10‐12‐17 H.14‐ii
This page intentionally left blank.
Hanford Site-wide Risk Review Project Final Report – August 31 2018 http://www.cresp.org/hanford/

H.14_CP‐OP‐13_SALDS_10‐12‐17 H.14‐iii
TABLE OF CONTENTS
Part I. Executive Summary ............................................................................................................................ 1
EU Location ............................................................................................................................................... 1 Related EUs ............................................................................................................................................... 1 Primary Contaminants, Contaminated Media and Wastes ...................................................................... 1 Brief Narrative Description ....................................................................................................................... 1 Summary Tables of Risks and Potential Impacts to Receptors ................................................................. 2 Support for Risk and Impact Ratings for each Population or Resource Human Health............................ 5
Part II. Administrative Information ............................................................................................................... 8
OU and/or TSDF Designation(s) ................................................................................................................ 8 Common name(s) for EU ........................................................................................................................... 8 Key Words ................................................................................................................................................. 8 Regulatory Status: (RCRA, CERCLA, ROD in disposition table for many) .................................................. 9 Risk Review Evaluation Information ....................................................................................................... 10
Part III. Summary Description ..................................................................................................................... 10
Designated future land use ..................................................................................................................... 10 Primary EU Source Components ............................................................................................................. 10 Location and Layout Maps ...................................................................................................................... 11
Part IV. Unit Description and History .......................................................................................................... 22
EU Former/Current Use(s) ...................................................................................................................... 22 Operating Facilities ................................................................................................................................. 23 Legacy Source Sites ................................................................................................................................. 29 Groundwater Plumes .............................................................................................................................. 29 D&D of Inactive Facilities ........................................................................................................................ 29 Ecological Resources Setting ................................................................................................................... 29 Cultural Resources Setting ...................................................................................................................... 30
Part V. Waste and Contamination Inventory .............................................................................................. 30
Contamination within Primary EU Source Components ......................................................................... 30
Part VI. Potential Risk/Impact Pathways and Events .................................................................................. 42
Current Conceptual Model ..................................................................................................................... 42 Populations and Resources Currently at Risk or Potentially Impacted ................................................... 43 Cleanup Approaches and End‐State Conceptual Model ......................................................................... 46 Populations and Resources at Risk or Potentially Impacted During or as a Consequence of Cleanup Actions..................................................................................................................................................... 46 Additional Risks and Potential Impacts if Cleanup is Delayed ................................................................ 48 Near‐Term, Post‐Cleanup Status, Risks and Potential Impacts............................................................... 48 Populations and Resources at Risk or Potentially Impacted After Cleanup Actions (from residual contaminant inventory or long‐term activities) ...................................................................................... 49 Long‐Term, Post‐Cleanup Status – Inventories and Risks and Potential Impact Pathways .................... 50
Part VII. Supplemental Information and Considerations ............................................................................ 50
Bibliography ................................................................................................................................................ 51
Hanford Site-wide Risk Review Project Final Report – August 31 2018 http://www.cresp.org/hanford/

H.14_CP‐OP‐13_SALDS_10‐12‐17 H.14‐iv
TABLE OF FIGURES
Figure H.14‐1. Framework Steps for Characterizing an EU for Groundwater Threats ................................. 7
Figure H.14‐2. CP‐OP‐13 (SALDS) Site Location Map .................................................................................. 12
Figure H.14‐3. SALDS Highlighted Location in relation to ETF and LERF (TEDF not shown) ....................... 13
Figure H.14‐4. Conceptual Model Diagram of SALDS Operational Effects ................................................. 14
Figure H.14‐5. Location of Monitoring Wells near SALDS .......................................................................... 16
Figure H.14‐6. Inferred Groundwater Flow Direction Map ........................................................................ 18
Figure H.14‐7. Water Table Map and Interpreted Groundwater Flow Directions in the SALDS Area, March 2014 ..................................................................................................................................... 19
Figure H.14‐8. Hanford Site‐wide tritium plumes in 1980 and 2005 .......................................................... 20
Figure H.14‐9. Tritium Concentration Contour Map .................................................................................. 21
Figure H.14‐10. Monthly and Cumulative Discharge Volumes for SALDS from Inception through July 2014 ............................................................................................................................................. 36
Figure H.14‐11. Monthly and Cumulative Tritium Activity Discharged to SALDS from Inception through July 2014 (**NOTE: Activity listed in this figure has NOT been adjusted for decay). ......... 38
Hanford Site-wide Risk Review Project Final Report – August 31 2018 http://www.cresp.org/hanford/

H.14_CP‐OP‐13_SALDS_10‐12‐17 H.14‐v
TABLE OF TABLES
Table H.14‐1. Risk Rating Summary (for Human Health, unmitigated nuclear safety basis indicated, mitigated basis indicated in parentheses (e.g., “High” (Low)). ............................................. 4
Table H.14‐2. Primary Contaminant Groups used in the Risk Review Project ............................................. 6
Table H.14‐3. Area of Containment Plumes at Levels above Drinking Water Standards (square kilometers) ........................................................................................................................... 22
Table H.14‐4. Tritium Decay versus Storage Time ...................................................................................... 24
Table H.14‐5. Thermoluminescent Dosimeter Results (2013 and 2014) ................................................... 25
Table H.14‐6. SALDS Inventory ................................................................................................................... 34
Table H.14‐7. Inventory of Primary Contaminants (a) .................................................................................. 39
Table H.14‐8. Inventory of Primary Contaminants (cont)(a) ........................................................................ 39
Table H.14‐9. Inventory of Primary Contaminants (cont)(a) ........................................................................ 40
Table H.14‐10. Summary of the Evaluation of Current Threats to Groundwater as a Protected Resource from Saturated Zone (SZ) and Remaining Vadose Zone (VZ) Contamination associated with the Evaluation Unit .............................................................................................................. 41
Table H.14‐11. Summary of Populations and Resources at Risk or Potentially Impacted after Cleanup. .. 49
Hanford Site-wide Risk Review Project Final Report – August 31 2018 http://www.cresp.org/hanford/

H.14_CP‐OP‐13_SALDS_10‐12‐17 H.14‐1
PART I. EXECUTIVE SUMMARY
EU LOCATION
600 Area (north of the 200W Area)
RELATED EUS
ETF&LERF (CP‐OP‐11), TEDF (CP‐OP‐12)
PRIMARY CONTAMINANTS, CONTAMINATED MEDIA AND WASTES
Tritium1
BRIEF NARRATIVE DESCRIPTION
The State‐Approved Land Disposal Site (SALDS) is one of the four primary facilities for processing and disposing of Hanford liquid waste. The other three are the Effluent Treatment Facility (ETF), Liquid Effluent Retention Facility (LERF), and the Treated Effluent Disposal Facility (TEDF). SALDS is also known as the 616‐A Crib.2
SALDS receives treated liquid discharge from the ETF with permissible levels of tritium for disposal via infiltration through the soils to the groundwater. Treated effluent is pumped to SALDS from the ETF verification tanks where the effluent is sampled prior to transfer to confirm the effluent meets delisting requirements of under 40 CFR 261, Table 2, 70 FR 44496. Treated effluent discharged at SALDS is considered a delisted waste; i.e., is no longer a listed, dangerous waste subject to the hazardous waste management requirements of RCRA. Treated effluent is discharged under Washington State Waste approved Water Discharge Permit Number ST‐4500. 1
Currently, the chosen alternative for handling tritium in the ETF effluent is to discharge this water to the subsurface and allow the tritium to decay into non‐radioactive helium before it reaches the Columbia River. Although it might be desirable to have an alternative process that could actively separate tritium from water in the environment, costs would be prohibitive. Therefore, at this time, discharge to the subsurface is the only cost effective method to handle tritium in feed to the ETF.3
The SALDS location was selected to avoid potential mobilization of contaminates from historical disposal practices, as well as to give groundwater a long travel time to the Columbia River. Since tritium is present in the effluent, a long travel time to the Columbia River gives the tritium time to decay before it reaches the river. SALDS employs a series of groundwater monitoring wells to keep track of the tritium
1 RPP‐RPT‐58275, Rev 0, pg. E‐1
2 DOE/RL‐2014‐52, Rev. 0, pg. 5.24
3 DOE/RL‐2014‐10, Rev. 0, pg. 1‐1
Hanford Site-wide Risk Review Project Final Report – August 31 2018 http://www.cresp.org/hanford/
H.14_CP‐OP‐13_SALDS_10‐12‐17 H.14‐2
plume, and annually submits a Tritium Tracking and Groundwater Monitoring Plan to the Washington State Department of Ecology as required by the monitoring plan.4
SUMMARY TABLES OF RISKS AND POTENTIAL IMPACTS TO RECEPTORS
Table H.14‐1 provides a summary of nuclear and industrial safety related risks to humans and impacts to important physical Hanford site resources.
Human Health
A Facility Worker is deemed to be an individual located anywhere within the physical boundaries or immediate areas around the outside the facility; a Co‐located Person is an individual located 100 meters from the facility boundary; and Public is an individual located at the closest point on the Hanford Site boundary not subject to DOE access control. The nuclear related risks to humans are based on unmitigated (unprotected or controlled conditions) dose exposures expressed in a range of from “low” to “high” according to the consequence levels. The estimated mitigated exposure that takes engineered and administrative controls and protections into consideration, when this information is available, is shown in parentheses within Table H.14‐1, “IS” denotes insufficient information is available to provide a rating.
No data are presently available to provide an estimate of human health risks; however, due to the nature of the material present at this facility and the nature of the operations, it could be assumed that the human health hazards and risks are low.
Groundwater and Columbia River
Direct impacts to groundwater resources and the Columbia River have been rated based on available information for the current status and estimates for future time periods. These impacts are also expressed in a range of from Not Discernible (ND) to Very High.
Ecological Resources5
The risk ratings are based on the degree of physical disruption (and potential additional exposure to contaminants) in the current status and as a potential result of remediation options.
Cultural Resources5
No risk ratings are provided for Cultural Resources. The Table identifies the three overlapping Cultural Resource landscapes that have been evaluated: Native American (approximately 10,000 years ago to the present); Pre‐Hanford Era (1805 to 1943) and Manhattan/Cold War Era (1943 to 1990); and provides initial information on whether an impact (both direct and indirect) is KNOWN (presence of cultural resources established), UNKNOWN (uncertainty about presence of cultural resources), or NONE (no cultural resources present) based on written or oral documentation gathered on the entire EU and
4 Pg. 1 of Washington State Department of Ecology (2014). Fact Sheet for State Waste Discharge Permit ST0004500 ‐ Effluent Treatment Facility and State Approved Land Disposal Site (URL: http://www.ecy.wa.gov/programs/nwp/permitting/HDWP/Rev/8c/Draft/9_8_14/ETF/fact.pdf): 33 pages.
5 References throughout this Evaluation Unit Summary Template supporting analyses related to Ecological Resources and/or Cultural Resources may be found in Appendices J and K, respectively. Refer to the specific EU when searching for the reference.
Hanford Site-wide Risk Review Project Final Report – August 31 2018 http://www.cresp.org/hanford/

H.14_CP‐OP‐13_SALDS_10‐12‐17 H.14‐3
buffer area. Direct impacts include but are not limited to physical destruction (all or part) or alteration such as diminished integrity. Indirect impacts include but are not limited to the introduction of visual, atmospheric, or audible elements that diminish the cultural resource’s significant historic features. Impacts to Cultural Resources as a result of proposed future cleanup activities will be evaluated in depth under Section 106 of the National Historic Preservation Act (16 USC 470, et. seq.) during the planning for remedial action.
Hanford Site-wide Risk Review Project Final Report – August 31 2018 http://www.cresp.org/hanford/

H.14_CP‐OP‐13_SALDS_10‐12‐17 H.14‐4
Table H.14‐1. Risk Rating Summary (for Human Health, unmitigated nuclear safety basis indicated, mitigated basis indicated in parentheses (e.g., “High” (Low)).
Population or Resource
Evaluation Time Period
Active Cleanup (to 2064)
Current Condition: Stabilization & Deactivation
From Cleanup Actions: Final D&D(a)
Human
Health Facility Worker S&D: Not Discernible (ND)
(ND) Proposed method: IS(e)
Co‐located Person S&D: ND (ND)
Proposed method: IS
Public S&D: ND (ND)
Proposed method: IS
Environmental
Groundwater(b) A&B: ND C: Medium (H‐3) Overall: Medium (H‐3)
A&B: ND C: Medium (H‐3) Overall: Medium (H‐3)
Columbia River(c) ND ND
Ecological Resources(d) ND ND to Low
Social
Cultural Resources(d)
Native American Direct: Unknown Indirect: Known Historic Pre‐Hanford Direct: Unknown Indirect: Unknown Manhattan/Cold War Direct: None Indirect: Known
Native American Direct: Unknown Indirect: Known Historic Pre‐Hanford Direct: Unknown Indirect: Unknown Manhattan/Cold War Direct: None Indirect: Known
a. Proposed method: Dependent on D&D Methods yet to be determined. (Unknown)
b. Threat to groundwater from Group A and B primary contaminants (PCs) (Table 6‐1, CRESP 2015) is Not Discernible (ND) because there are no Group A and B plumes or vadose zone inventories associated with this EU (because of the nature of the material handled). However, there is a current tritium (H‐3) plume (Group C PC) of 0.20 km2 linked to the SALDS (DOE/RL‐2016‐09, Rev. 0) that would translate to a Medium rating based on plume area not groundwater threat metric (GTM) as indicated in Figure H.14‐1 (CRESP 2015); this is the maximum rating given to a Group C PC. Despite the very large impact of decay on tritium activity (that would result in a +99.9% decrease in current activity), the rating is not changed for the Active Cleanup Period because SALDS is an operating facility where additional tritium will be discharged during the evaluation period.
c. There is no plume from SALDS that currently intersects the Columbia River, nor one expected in the next 150 years, and thus no threat to the Columbia River during the evaluation period.
d. For both Ecological and Cultural Resources, see Appendices J and K, respectively, for a complete description of Ecological Field Assessments and literature review for Cultural Resources. Ecological ratings are described in Table 4‐11 of the Final Report.
e. Insufficient information
Hanford Site-wide Risk Review Project Final Report – August 31 2018 http://www.cresp.org/hanford/

H.14_CP‐OP‐13_SALDS_10‐12‐17 H.14‐5
SUPPORT FOR RISK AND IMPACT RATINGS FOR EACH POPULATION OR RESOURCE HUMAN HEALTH
Current
Human Health: The SALDS is not considered a Nuclear Facility or even a “Less than Category 3 Nuclear Facility (commonly referred to as a “Radiological Facility”). SALDS only poses standard industrial hazards (e.g., noise, common slips, trips, and falls) but is not analyzed within the Liquid Waste and Fuel Storage (LWFS), Industrial Hygiene Baseline Hazard Assessment (IHBHA) [HNF‐10555, Rev 6].6 No data are presently available to provide an estimate of human health risks; however, due to the nature of the material present at this facility and the nature of the operations, it could be assumed that the human health hazards and risks are Not Discernible (ND).
Groundwater and Columbia River: There are no Group A or B contaminants with reported inventories (Table H.14‐7 through Table H.14‐9) for the SALDS. Tritium (H‐3) discharges associated with the SALDS are sources for current a plume involving a Group C primary contaminant (PC) as shown below in Table H.14‐2 (CRESP 2015). Using the algorithm shown in Figure H.14‐1 (CRESP 2015), the tritium (H‐3) plume of 0.20 km2 (DOE/RL‐2016‐09, Rev. 0) translates to a current rating of Medium. The remaining vadose zone inventory for tritium (H‐3) of less than 170 Ci as described in Part V (Table H.14‐7)7, which acts as a continuing source for the tritium plume that is currently not being treated in the 200 West Pump and Treat Facility (DOE/RL‐2016‐09, Rev. 0), would not translate to a significant groundwater threat because the rating would already be Low (assuming an evaluation equivalent to a Group A or B contaminant) and +99.9% decay would occur over the 150‐year period under consideration. However, SALDS is an operation facility that will again be discharging tritium (H‐3) into the environment in the future. Thus the current rating for tritium (H‐3) is not changed for the Active Cleanup Period to account for uncertainties in the amount and timing of these discharges to SALDS and when closure will occur.
There currently is no plume from the SALDS intersecting the Columbia River nor one expected (to exceed the drinking water standard) in the next 150 years. Thus ratings for the Columbia River are Not Discernible (ND).
6 Gasper, J. J. (2013). Liquid Waste and Fuel Storage (LWFS), Industrial Hygiene Baseline Hazard Assessment (IHBHA), CH2M HILL Plateau Remediation Company. HNF‐10555, Revision 6: 47 pages.
7 The saturated zone inventory has not been subtracted from the discharged inventory where typically the impact is not large (Appendix D.1).
Hanford Site-wide Risk Review Project Final Report – August 31 2018 http://www.cresp.org/hanford/

H.14_CP‐OP‐13_SALDS_10‐12‐17 H.14‐6
Table H.14‐2. Primary Contaminant Groups used in the Risk Review Project8
8 Taken from the Interim Report Appendix D.1., Table. D.1‐1 on pg. D.1‐2
Hanford Site-wide Risk Review Project Final Report – August 31 2018 http://www.cresp.org/hanford/

H.14_CP‐OP‐13_SALDS_10‐12‐17 H.14‐7
Figure H.14‐1. Framework Steps for Characterizing an EU for Groundwater Threats9
Risks and Potential Impacts from Selected or Potential Cleanup Approaches
No cleanup decisions have been made for the Remaining Liquid Waste Disposal Facilities.
Ecological Resources
Current
0% of EU and 17% of the buffer area are level 3 or higher resources. EU is small, isolated, and surrounded by level 2 resources (formerly burned area).
Risks and Potential Impacts from Selected or Potential Cleanup Approaches
Uncertainties in the remediation activities make it difficult to predict the extent and magnitude of impacts to the EU and buffer. However, even with soil excavation, the removal of soil and subsurface contamination is not likely to degrade the resources further.
9 Taken from the Interim Report Appendix D.1., Figure. D.1‐1 on pg. D.1‐4
Hanford Site-wide Risk Review Project Final Report – August 31 2018 http://www.cresp.org/hanford/

H.14_CP‐OP‐13_SALDS_10‐12‐17 H.14‐8
Cultural Resources
Current
The central portion of the EU has been heavily disturbed. Most of the EU has been inventoried for cultural resources. Geomorphology indicates a low potential to contain intact archaeological resources on the surface and/or subsurface. Traditional cultural places are visible from EU. One archaeological isolate is located within 500 meters of the EU.
The National Register eligible Manhattan Project/Cold War Era significant resource located within 500 meters of the EU will be demolished, but they have already been mitigated.
Risks and Potential Impacts from Selected or Potential Cleanup Approaches
Archaeological investigations and monitoring may need to occur prior to remediation. The geomorphology indicates a moderate potential for intact archaeological resources. Remediation disturbance may result in impacts to archaeological resources if they are present in the subsurface. No cleanup decisions have been selected, however the potential range of impacts could include: Temporary indirect effects during remediation; Permanent indirect effects are possible if contamination remains after remediation and from capping.
The National Register eligible Manhattan Project/Cold War Era significant resource located within 500 meters of the EU will be demolished, but they have already been mitigated.
Considerations for Timing of the Cleanup Actions
No cleanup decisions have been made for the Remaining Liquid Waste Disposal Facilities.
Near‐Term, Post‐Cleanup Risks and Potential Impacts
No cleanup decisions have been made for the Remaining Liquid Waste Disposal Facilities.
PART II. ADMINISTRATIVE INFORMATION
OU AND/OR TSDF DESIGNATION(S)
Not Applicable
COMMON NAME(S) FOR EU
State‐Approved Land Disposal Site (SALDS)
KEY WORDS
Non‐dangerous liquid waste, non‐RCRA facility, tritium
Hanford Site-wide Risk Review Project Final Report – August 31 2018 http://www.cresp.org/hanford/

H.14_CP‐OP‐13_SALDS_10‐12‐17 H.14‐9
REGULATORY STATUS: (RCRA, CERCLA, ROD IN DISPOSITION TABLE FOR MANY)
Regulatory basis
40 CFR 261, Table 2, 70 FR 4449610
40 CFR 141, "National Primary Drinking Water Regulations," 11
DOE Order 5400.5 Chg 2, 1993, Radiation Protection of the Public and the Environment, U.S. Department of Energy, Washington, D.C. 12
State of Washington Water Pollution Control Law Chapter 90.48 Revised Code of Washington, as amended13
Washington State Department of Ecology (2014). State Waste Discharge Permit Number ST0004500. (URL: http://www.ecy.wa.gov/programs/nwp/permitting/WWD/PDF/ST4500/ST0004500.pdf): 23 pages.
Applicable regulatory documentation
Halgren, D. L. (2015). Liquid Waste Processing Facilities Waste Acceptance Criteria CH2M HILL Plateau Remediation Company. HNF‐3172, Revision 7: 43 pages.
Results of Tritium Tracking and Groundwater Monitoring at the Hanford Site 200 Area State Approved Land Disposal Site (published every fiscal year as part of reporting requirements by the Waste Water State Discharge Permit ST0004500)
Evaluation of Tritium Removal and Mitigation Technologies for Wastewater Treatment (published in accordance with Tri‐Party Agreement Milestone M‐026‐07C)
Applicable Consent Decree or TPA milestones
TPA Milestone M‐026‐07C14: Submit to EPA and Ecology an evaluation of development status of tritium treatment technology that would be pertinent to the cleanup and management of Tritiated Waste Water (e.g., the 242‐A Evaporator Process Condensate Liquid Effluent) and tritium contaminated groundwater at the Hanford site. 15
10 RPP‐RPT‐58275, Rev 0, pg. 20 11 DOE/RL‐2014‐10, Rev. 0, pg. iii
12 DOE/RL‐2014‐10, Rev. 0, pg. iii
13 Washington State Department of Ecology (2014). State Waste Discharge Permit Number ST0004500. (URL: http://www.ecy.wa.gov/programs/nwp/permitting/WWD/PDF/ST4500/ST0004500.pdf): 23 pages.
14 DOE/RL‐2014‐10, Rev. 0, pg. iii states that the TPA milestone number is “TPA Milestone M‐026‐07C” but this identification number does not match the latest work schedule milestone number within [Hanford.gov 2016] reference that lists “M‐026‐07D”. Hanford.gov (2016). Appendix D: WORK SCHEDULE MILESTONES AND TARGET DATES INCLUDING DESIGNATION OF LEAD REGULATORY AGENCY (Current as of January 13, 2016). (URL: http://www.hanford.gov/files.cfm/ap‐App‐D.pdf): 33 pages.
15 Pg. D‐10 of Hanford.gov (2016). Appendix D: WORK SCHEDULE MILESTONES AND TARGET DATES INCLUDING DESIGNATION OF LEAD REGULATORY AGENCY (Current as of January 13, 2016). (URL: http://www.hanford.gov/files.cfm/ap‐App‐D.pdf): 33 pages. The milestone was completed for 2014. The process required interface and input from the CHPRC Soil and Groundwater organization. Additionally, annual
Hanford Site-wide Risk Review Project Final Report – August 31 2018 http://www.cresp.org/hanford/

H.14_CP‐OP‐13_SALDS_10‐12‐17 H.14‐10
RISK REVIEW EVALUATION INFORMATION
Completed
March 10, 2017
Evaluated by
Bethany Burkhardt and Steve Krahn
Ratings/Impacts Reviewed by
Henry Mayer
PART III. SUMMARY DESCRIPTION
The current land use of the 600 North Area is Industrial at the DOE Hanford Site.
DESIGNATED FUTURE LAND USE
The designated future use of the 600 North area of the SALDS location is categorized as the Conservation (Mining) land use16.
PRIMARY EU SOURCE COMPONENTS
Groundwater Plumes
The saturated zone beneath the SALDS has an elevated level of tritium (H‐3) with vadose zone contamination (Table H.14‐7) acting as a continuing source of groundwater contamination (DOE/RL‐2016‐09, Rev. 0). The 200 West Area plumes are described in detail in the CP‐GW‐2 EU (Appendix D.6). Monitoring and treatment of groundwater is being conducted within the 200‐ZP GWIA (in the 200 West P&T facility), which are described as part of the CP‐GW‐2 EU (Appendix D.6). However, the 200 West P&T System is not treating the tritium plume associated with the SALDS (DOE/RL‐2016‐09, Rev. 0).
Operating Facilities
SALDS receives treated liquid discharge from the ETF with permissible levels of tritium for disposal via infiltration through the soils to the groundwater. Treated effluent is pumped to SALDS from the ETF verification tanks where the effluent is sampled prior to transfer to confirm the effluent meets delisting requirements of under 40 CFR 261, Table 2, 70 FR 44496. Treated effluent discharged at SALDS is considered a delisted waste; i.e., is no longer a listed, dangerous waste subject to the hazardous waste management requirements of RCRA. Treated effluent is discharged under Washington State Waste approved Water Discharge Permit Number ST‐4500. 1
commitment C‐026‐07 requires reviewing the M‐026‐07 report to determine if new technologies are available. The report review is transmitted to the regulator by letter and is due annually except in years when M‐026‐07 is due [RPP‐RPT‐58275, Rev 0, pg. 26].
16 DOE‐EIS‐0222 CLUP‐EIS Summary document, Figure S‐10 on page 45/131
Hanford Site-wide Risk Review Project Final Report – August 31 2018 http://www.cresp.org/hanford/

H.14_CP‐OP‐13_SALDS_10‐12‐17 H.14‐11
Currently, the chosen alternative for handling tritium in the ETF effluent is to discharge this water to the subsurface and allow the tritium to decay into non‐radioactive helium before it reaches the Columbia River. Although it might be desirable to have an alternative process that could actively separate tritium from water in the environment, costs would be prohibitive. Therefore, at this time, discharge to the subsurface is the only cost effective method to handle tritium in feed to the ETF.17
The SALDS location was selected to avoid potential mobilization of contaminates from historical disposal practices, as well as to give groundwater a long travel time to the Columbia River. Since tritium is present in the effluent, a long travel time to the Columbia River gives the tritium time to decay before it reaches the river. SALDS employs a series of groundwater monitoring wells to keep track of the tritium plume, and annually submits a Tritium Tracking and Groundwater Monitoring Plan to the Washington State Department of Ecology as required by the monitoring plan.18
LOCATION AND LAYOUT MAPS
The SALDS, located in the 600 North Area (just north of the 200W Area), as shown in Figure H.14‐2 and Figure H.14‐3.
17 DOE/RL‐2014‐10, Rev. 0, pg. 1‐1
18 Pg. 1 of Washington State Department of Ecology (2014). Fact Sheet for State Waste Discharge Permit ST0004500 ‐ Effluent Treatment Facility and State Approved Land Disposal Site (URL: http://www.ecy.wa.gov/programs/nwp/permitting/HDWP/Rev/8c/Draft/9_8_14/ETF/fact.pdf): 33 pages.
Hanford Site-wide Risk Review Project Final Report – August 31 2018 http://www.cresp.org/hanford/

H.14_CP‐OP‐13_SALDS_10‐12‐17 H.14‐12
Figure H.14‐2. CP‐OP‐13 (SALDS) Site Location Map
Hanford Site-wide Risk Review Project Final Report – August 31 2018 http://www.cresp.org/hanford/

H.14_CP‐OP‐13_SALDS_10‐12‐17 H.14‐13
Figure H.14‐3. SALDS Highlighted Location in relation to ETF and LERF (TEDF not shown)19
The effluent infiltration gallery (SALDS) is located just north of the 200 West Area and is underlain by sediments that are geologically young. The sediments are composed of the Ringold Formation, the “Plio‐Pleistocene unit” and early “Palouse” soil, and the overlying Hanford formation. A thin, discontinuous veneer of dune sand overlies the Hanford formation at the slope gently to the south beneath the SALDS (as shown in Figure H.14‐4, below).
The Hanford formation is approximately 7 meters (23 feet) thick and is mostly highly permeable gravel with a sandy matrix between gravel clasts. Minor amounts of silt also occur throughout the formation. The Hanford formation thickens southward in the vicinity of the SALDS.
The strata known as the Plio‐Pleistocene unit and the early "Palouse" soil collectively consist of calcium carbonate cemented silt, sand, and gravel, and silt and sand without calcium carbonate cement. Calcium carbonate lenses (local pockets) also occur within these units. The thickness of these combined units beneath the infiltration gallery is approximately 13 meters (42 feet).
Beneath the SALDS, the Ringold Formation consists of three primary sedimentary units that total approximately 119 meters (390 feet) in thickness. From bottom to top, these units are:
19 RPP‐RPT‐58275, Rev 0, Figure 2‐21, pg. 19
Hanford Site-wide Risk Review Project Final Report – August 31 2018 http://www.cresp.org/hanford/

H.14_CP‐OP‐13_SALDS_10‐12‐17 H.14‐14
The Ringold unit A, consisting of a mixture of sand and gravel, measuring 18 meters (60 feet) thick;
The Ringold unit E, consisting of gravel mixed with both sand and silt, interbedded with sand layers, and 95 meters (312 feet) thick; and
The "upper Ringold" unit, which is predominantly sand and is 5.5 meters (18 feet) thick.
Ringold units A and E are similar in many respects and may be difficult to distinguish using borehole information. A north‐south trending permeable, subsurface channel is present in the vicinity of SALDS, although the exact location and boundaries of the channel are not well known.20
Figure H.14‐4. Conceptual Model Diagram of SALDS Operational Effects21
20 Pgs. 8 and 9 of the Washington State Department of Ecology (2014). Fact Sheet for State Waste Discharge Permit ST0004500 ‐ Effluent Treatment Facility and State Approved Land Disposal Site (URL: http://www.ecy.wa.gov/programs/nwp/permitting/HDWP/Rev/8c/Draft/9_8_14/ETF/fact.pdf): 33 pages.
Hanford Site-wide Risk Review Project Final Report – August 31 2018 http://www.cresp.org/hanford/

H.14_CP‐OP‐13_SALDS_10‐12‐17 H.14‐15
Three groundwater monitoring wells were installed along the northeastern and southern edges of the facility (as shown in Figure H.14‐5, below). The two wells northeast of the facility are downgradient wells: one of these wells monitors groundwater at the water table (699‐48‐77D); the other well monitors groundwater deeper in the aquifer (699‐48‐77C). The well at the southern end of the facility (699‐48‐77A) was originally intended as an upgradient well that monitors the aquifer at the water table. The plume from the SALDS discharge has reached this well, making all three wells downgradient wells. The uppermost aquifer occurs within the Ringold units A and E beneath the facility.22
Tritium originating from the SALDS was first detected in groundwater in July 1996 in well 699‐48‐77A, a well originally intended to serve as an upgradient background well, and which is most distant from the facility in the original SALDS network. Tritium appeared in wells closer to the facility at a later time. The probable reasons for this circumstance are related to hydrogeologic peculiarities beneath the facility. 23
Water level monitoring shows declining regional groundwater levels, and water levels in wells 699‐48‐77A and 699‐48‐77D have been approaching their screened levels for several years. In March 2012, Ecology granted the Permittee approval to discontinue sampling of wells 699‐48‐77A and 699‐48‐77D once they could no longer produce representative data. Well 699‐48‐77A stopped producing representative data after August 2011. The permittee will continue to monitor Well 699‐48‐77C, as well as the effluent from the verification tanks at ETF.24
21 SGW‐58210, Rev 0, Figure 1‐2, pg. 1‐5
22 Pgs. 8 and 9 of the Washington State Department of Ecology (2014). Fact Sheet for State Waste Discharge Permit ST0004500 ‐ Effluent Treatment Facility and State Approved Land Disposal Site (URL: http://www.ecy.wa.gov/programs/nwp/permitting/HDWP/Rev/8c/Draft/9_8_14/ETF/fact.pdf): 33 pages.
23 PNNL‐14898, pg. 1.3 (pg. 11 of 87 of the PDF)
24 Pgs. 8 and 9 of the Washington State Department of Ecology (2014). Fact Sheet for State Waste Discharge Permit ST0004500 ‐ Effluent Treatment Facility and State Approved Land Disposal Site (URL: http://www.ecy.wa.gov/programs/nwp/permitting/HDWP/Rev/8c/Draft/9_8_14/ETF/fact.pdf): 33 pages.
Hanford Site-wide Risk Review Project Final Report – August 31 2018 http://www.cresp.org/hanford/

H.14_CP‐OP‐13_SALDS_10‐12‐17 H.14‐16
Figure H.14‐5. Location of Monitoring Wells near SALDS25
The hydraulic gradient beneath the facility is about 0.004 ft/ft. Groundwater flows in a north‐northeasterly direction at a low velocity, as shown below in Figure H.14‐6 and Figure H.14‐7. Groundwater samples were taken from well 699‐48‐77A before the start of discharge, over a period of eight quarters. Results of numerical modeling of groundwater flow suggest travel times of approximately 100 years from the facility to the Columbia River. 26
25 PNNL‐14898, Figure 1, pg. 1.2 (pg. 11 of 87 of the PDF)
26 Pgs. 8 and 9 of the Washington State Department of Ecology (2014). Fact Sheet for State Waste Discharge Permit ST0004500 ‐ Effluent Treatment Facility and State Approved Land Disposal Site (URL: http://www.ecy.wa.gov/programs/nwp/permitting/HDWP/Rev/8c/Draft/9_8_14/ETF/fact.pdf): 33 pages.
Hanford Site-wide Risk Review Project Final Report – August 31 2018 http://www.cresp.org/hanford/
H.14_CP‐OP‐13_SALDS_10‐12‐17 H.14‐17
The average annual precipitation at the Hanford Site is 6.3 inches. Minor local variations occur. Most of the precipitation occurs during the winter, with nearly half of the annual amount occurring from November through February. Snowfall accounts for about 38 percent of all precipitation. Days with greater than 0.51 inch of precipitation occur less than 1 percent of the year. These semiarid conditions mitigate the development of groundwater contamination plumes. Projections are that the probable maximum flood on the Columbia River would not encroach within three miles of the SALDS.27
27 Pgs. 8 and 9 of the Washington State Department of Ecology (2014). Fact Sheet for State Waste Discharge Permit ST0004500 ‐ Effluent Treatment Facility and State Approved Land Disposal Site (URL: http://www.ecy.wa.gov/programs/nwp/permitting/HDWP/Rev/8c/Draft/9_8_14/ETF/fact.pdf): 33 pages.
Hanford Site-wide Risk Review Project Final Report – August 31 2018 http://www.cresp.org/hanford/

H.14_CP‐OP‐13_SALDS_10‐12‐17 H.14‐18
Figure H.14‐6. Inferred Groundwater Flow Direction Map28
28 PNNL‐15670, pg. xii (pg. 10 of 621 of the PDF)
Hanford Site-wide Risk Review Project Final Report – August 31 2018 http://www.cresp.org/hanford/

H.14_CP‐OP‐13_SALDS_10‐12‐17 H.14‐19
Figure H.14‐7. Water Table Map and Interpreted Groundwater Flow Directions in the SALDS Area, March 201429
29 SGW‐58210, Rev 0, Figure 2‐1, pg. 2‐3 [2004 H‐3 and GW Tracking report]
Hanford Site-wide Risk Review Project Final Report – August 31 2018 http://www.cresp.org/hanford/

H.14_CP‐OP‐13_SALDS_10‐12‐17 H.14‐20
Figure H.14‐8 shows site‐wide tritium plumes in the upper part of the unconfined aquifer in 1980 and 2005. Concentrations are zero for SALDS (left figure) because SALDS began operations in 1995. In 2005, it is evident that SALDS had been operating for 10 years with a small blue area slightly north of the 200 West Area. The contour map of tritium concentrations in 2006 over the Hanford site are shown in Figure H.14‐9 and shows more detail of the gradient of concentrations between 20,000 and 80,000 pCi/L,
Figure H.14‐8. Hanford Site‐wide tritium plumes in 1980 and 200530
30 PNNL‐15670, Report pg. xxviii (Pg. 26 of 621 of the PDF)
Hanford Site-wide Risk Review Project Final Report – August 31 2018 http://www.cresp.org/hanford/

H.14_CP‐OP‐13_SALDS_10‐12‐17 H.14‐21
Figure H.14‐9. Tritium Concentration Contour Map31
31 PNNL‐15670, Report pg. xiv (Pg. 12 of 621 of the PDF)
Hanford Site-wide Risk Review Project Final Report – August 31 2018 http://www.cresp.org/hanford/

H.14_CP‐OP‐13_SALDS_10‐12‐17 H.14‐22
Of the radionuclide plumes, tritium and iodine‐129 have the largest areas with concentrations above drinking water standards (see Table H.14‐3, below). Only tritium is discharged into the subsurface at SALDS. SALDS is not responsible for the dominant tritium plumes (as shown in Figure H.14‐8 and Figure H.14‐9). The dominant plumes had sources in the 200 East Area and extend toward the east and southeast. Extensive tritium and plumes are also present in 200 West Area from other Hanford site operations. 32
Table H.14‐3. Area of Containment Plumes at Levels above Drinking Water Standards (square kilometers)33
PART IV. UNIT DESCRIPTION AND HISTORY
EU FORMER/CURRENT USE(S)
The State‐Approved Land Disposal Site (SALDS) is one of the four primary facilities for processing and disposing of Hanford liquid waste. The other three are the Effluent Treatment Facility (ETF), Liquid Effluent Retention Facility (LERF), and the Treated Effluent Disposal Facility (TEDF). SALDS receives
32 PNNL‐15670, Report pg. xiii (Pg. 11 of 621 of the PDF) 33 PNNL‐15670, Report pg. xvii (Pg. 15 of 621 of the PDF)
Hanford Site-wide Risk Review Project Final Report – August 31 2018 http://www.cresp.org/hanford/
H.14_CP‐OP‐13_SALDS_10‐12‐17 H.14‐23
treated liquid discharge from the ETF with permissible levels of tritium for disposal via infiltration through the soils to the groundwater. SALDS has been operational since December 1995. 34
OPERATING FACILITIES
1. Processes that produced the radioactive material and waste contained in the facility
No processes or activities conducted at SALDS produced the liquid waste being discharged at the facility.
SALDS receives treated liquid discharge from the ETF with permissible levels of tritium for disposal via infiltration through the soils to the groundwater. Treated effluent is pumped to SALDS from the ETF verification tanks where the effluent is sampled prior to transfer to confirm the effluent meets delisting requirements of under 40 CFR 261, Table 2, 70 FR 44496. Treated effluent discharged at SALDS is considered a delisted waste; i.e., is no longer a listed, dangerous waste subject to the hazardous waste management requirements of RCRA. Treated effluent is discharged under Washington State Waste approved Water Discharge Permit Number ST‐4500.1
It should be noted that ETF has not operated since January 2014 due to a major failure of the evaporator heat exchanger. Replacement of the heat exchanger is expected to keep the facility shut down until late 2015.35 This halt of ETF operations is evidenced by the ceased discharges at SALDS36 (see Part V, Figure H.14‐10).
2. Primary radioactive and non‐radioactive constituents that are considered risk drivers
Tritium at levels exceeding water quality standards is allowed at SALDS with requirements for tracking tritium plume movement, and a number of monitoring wells testing water level and water quality.
SALDS receives treated liquid discharge from the ETF with permissible levels of tritium for disposal via infiltration through the soils to the groundwater. Treated effluent is pumped to SALDS from the ETF verification tanks where the effluent is sampled prior to transfer to confirm the effluent meets delisting requirements of under 40 CFR 261, Table 2, 70 FR 44496. Treated effluent discharged at SALDS is considered a delisted waste; i.e., is no longer a listed, dangerous waste subject to the hazardous waste management requirements of RCRA. Treated effluent is discharged under Washington State Waste approved Water Discharge Permit Number ST‐4500. 1
Water level monitoring shows declining regional groundwater levels, and water levels and tritium concentration samples are no longer representative of actual concentrations.
The hydraulic gradient beneath the facility is about 0.004 ft/ft. Groundwater flows in a north‐northeasterly direction at a low velocity. Groundwater samples were taken from well 699‐48‐77A before the start of discharge, over a period of eight quarters. Results of numerical modeling of groundwater flow suggest travel times of approximately 100 years from the facility to the Columbia River.
The average annual precipitation at the Hanford Site is 6.3 inches. Minor local variations occur. Most of the precipitation occurs during the winter, with nearly half of the annual amount occurring from November through February. Snowfall accounts for about 38 percent of all precipitation. Days with greater than 0.51 inch of precipitation occur less than 1 percent of the year. These semiarid conditions
34 RPP‐RPT‐58275, Rev 0, pg. 58 35 SGW‐58210, Rev 0, pg. iii
36 DOE‐RL‐2014‐52, pg. 5.25
Hanford Site-wide Risk Review Project Final Report – August 31 2018 http://www.cresp.org/hanford/

H.14_CP‐OP‐13_SALDS_10‐12‐17 H.14‐24
mitigate the development of groundwater contamination plumes. Projections are that the probable maximum flood on the Columbia River would not encroach within three miles of the SALDS.37
3. Containers or storage measures are used for radioactive materials at the facility
Transfer pipes from the Effluent Treatment Facility (ETF) carrying treated liquid effluent (non‐hazardous/non‐RCRA liquid waste).
4. Classification of radioactive material and waste contained or stored within the facility
Municipal liquid waste (non‐hazardous/non‐RCRA liquid waste)
5. Average and maximum occupational radiation doses incurred at the facility
No information is available on measured worker doses or likely exposure rates due to SALDS operations. Tritium (H‐3) is the only hazard source of concern present at SALDS but the harmful mode of exposure is via ingestion, which is unlikely for the worker at the site. Intake from groundwater for a member of the public is unlikely since the groundwater flow travel time is estimated to be 100 years to the Columbia River. By the time that 100 years pass, the tritium hazard source will have decayed over 8 half‐lives, leaving only less than 1% of the original radioactivity since tritium decays to stable, non‐radioactive helium. The 12.3 year half‐life of tritium allows storage to be considered as a mitigation method. Reduction of tritium content versus storage time is illustrated, below:
Table H.14‐4. Tritium Decay versus Storage Time38
Storage Time Tritium Reduction (%) Decontamination Factor (DF)
41 years 90 10
81 years 99 100
122 years 99.9 1,000
The radiation emitted by tritium is a beta particle that is emitted by tritium and is considered to be very weak, having an average kinetic energy of 6 keV. As a result, these particular beta particles can only travel about 6 mm in air before they lose their ability to cause ionizations. In tissue, tritium’s beta particle is so weak that it cannot penetrate the typical thickness of the dead layer of skin that exists on the outside of the human body. For this reason, the beta particle emitted by tritium is generally only considered to be hazardous if a significant quantity of tritium is, or has the potential to be, taken into the body.39 Once tritium enters the body, it disperses quickly and is uniformly distributed throughout the soft tissues. Half of the tritium is excreted within approximately 10 days after exposure. About 10
37 Pgs. 8 and 9 of the Washington State Department of Ecology (2014). Fact Sheet for State Waste Discharge Permit ST0004500 ‐ Effluent Treatment Facility and State Approved Land Disposal Site (URL: http://www.ecy.wa.gov/programs/nwp/permitting/HDWP/Rev/8c/Draft/9_8_14/ETF/fact.pdf): 33 pages.
38 DOE/RL‐2014‐10, Rev. 0, Table 3, pg. 3‐15
39 Health Physics Society (HPS) (2011). Tritium Fact Sheet (URL: http://hps.org/documents/tritium_fact_sheet.pdf): 5 pages.
Hanford Site-wide Risk Review Project Final Report – August 31 2018 http://www.cresp.org/hanford/
H.14_CP‐OP‐13_SALDS_10‐12‐17 H.14‐25
percent of the dose from any tritium exposure comes from the small fraction of the exposure that the body retains as organically bound tritium.40
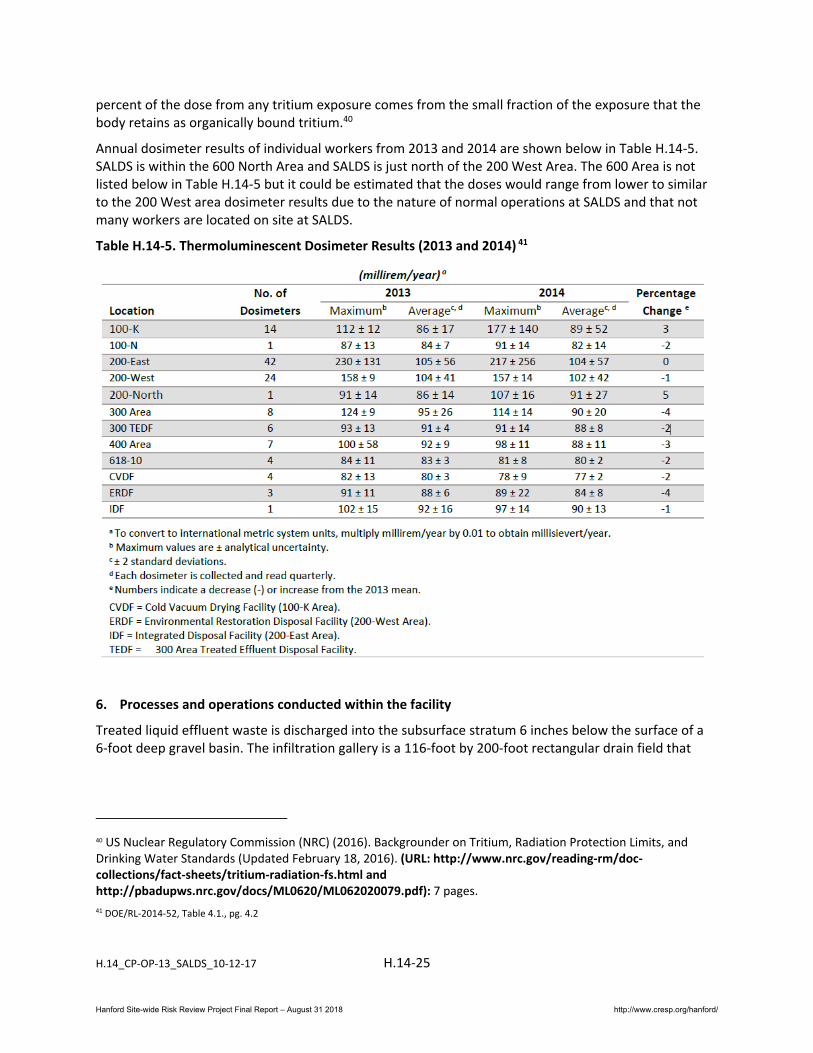
Annual dosimeter results of individual workers from 2013 and 2014 are shown below in Table H.14‐5. SALDS is within the 600 North Area and SALDS is just north of the 200 West Area. The 600 Area is not listed below in Table H.14‐5 but it could be estimated that the doses would range from lower to similar to the 200 West area dosimeter results due to the nature of normal operations at SALDS and that not many workers are located on site at SALDS.
Table H.14‐5. Thermoluminescent Dosimeter Results (2013 and 2014) 41
6. Processes and operations conducted within the facility
Treated liquid effluent waste is discharged into the subsurface stratum 6 inches below the surface of a 6‐foot deep gravel basin. The infiltration gallery is a 116‐foot by 200‐foot rectangular drain field that
40 US Nuclear Regulatory Commission (NRC) (2016). Backgrounder on Tritium, Radiation Protection Limits, and Drinking Water Standards (Updated February 18, 2016). (URL: http://www.nrc.gov/reading‐rm/doc‐collections/fact‐sheets/tritium‐radiation‐fs.html and http://pbadupws.nrc.gov/docs/ML0620/ML062020079.pdf): 7 pages.
41 DOE/RL‐2014‐52, Table 4.1., pg. 4.2
Hanford Site-wide Risk Review Project Final Report – August 31 2018 http://www.cresp.org/hanford/

H.14_CP‐OP‐13_SALDS_10‐12‐17 H.14‐26
contains four‐inch diameter porous pipe laterals extending from an 8‐inch diameter header at 6‐foot intervals.42
The flows or waste loads for the permitted facility must not exceed the following design criteria under WAC 173‐216‐110 (4):43
Maximum Daily Discharge Flow 670,000 gallons per day
Maximum Average Monthly Discharge Flow 250,000 gallons per day
The wastewater discharge permit issued by the State of Washington describes the required monitoring and sampling procedures, listed below, but focus on the task of tracking tritium discharges and subsequent subsurface movement in plumes and how might groundwater be impacted.
Tritium Tracking and Groundwater Monitoring:44
According to the approved Tritium Tracking and Groundwater Monitoring Plan on file with the Washington State Department of Ecology:
The Permittee shall report tritium sampling results for each fiscal year to Ecology at least annually, by November 30th of the following fiscal year.
The Permittee shall have plans for updating and maintaining the computer model(s) that predict the travel time of the tritium plume created by this discharge and also predict the concentration of the tritium plume at the area of the plume's discharge to the Columbia River. Model update(s) and reports to Ecology should occur at least once per permit cycle and within six (6) months of detection of the tritium plume from the ETF discharge in a new monitoring well. The plan should include the proposed reporting format, e.g., maps, tables, etc.
The Permittee shall sample Wells 699‐48‐77C (and 699‐48‐77D until it no longer produces representative data) at least once per calendar quarter for the constituents listed in Section S2.B of this permit. These sample results shall be reported in the quarterly Discharge Monitoring Reports (DMRs) per the requirement of Section S3.
The Permittee must submit proposed revisions or modifications to the Tritium Tracking and Groundwater Monitoring Plan to Ecology for review and approval at least 30 days prior to implementation. Once approved, the Permittee must comply with any plan modifications.
Other reports and submissions that are required by the Ecology approved Tritium Tracking and Groundwater Monitoring Plan shall be submitted to Ecology per the schedule included in the plan.
Monitoring Requirements: 45
42 Pg. 8 of Department of Ecology State of Washington (2014). Fact Sheet for State Waste Discharge Permit ST0004500 ‐ Effluent Treatment Facility and State Approved Land Disposal Site (URL: http://www.ecy.wa.gov/programs/nwp/permitting/HDWP/Rev/8c/Draft/9_8_14/ETF/fact.pdf): 33 pages
43 State Waste Discharge Permit Number ST0004500 pg. 17 of 23 of the PDF, also listed in the 2014 State Discharge permit fact sheet from 2014 within Table 4 “Design criteria for wastewater treatment facility” on page 14.
44 Pg. 20 of Washington State Department of Ecology (2014). Fact Sheet for State Waste Discharge Permit ST0004500 ‐ Effluent Treatment Facility and State Approved Land Disposal Site
Hanford Site-wide Risk Review Project Final Report – August 31 2018 http://www.cresp.org/hanford/

H.14_CP‐OP‐13_SALDS_10‐12‐17 H.14‐27
Ecology requires monitoring, recording, and reporting (WAC 173‐216‐110) to verify that the treatment process functions correctly, the discharge meets groundwater criteria and that the discharge complies with the permit’s effluent limits. If a facility uses a contract laboratory to monitor wastewater, it must ensure that the laboratory uses the methods and meets or exceeds the method detection levels required by the permit. The permit describes when facilities may use alternative methods. It also describes what to do in certain situations when the laboratory encounters matrix effects. When a facility uses an alternative method as allowed by the permit, it must report the test method, DL, and QL on the discharge monitoring report or in the required report.
Lab Accreditation: Ecology requires that facilities must use a laboratory registered or accredited under the provisions of chapter 173‐50 WAC, Accreditation of Environmental Laboratories, to prepare all monitoring data (with the exception of certain parameters). Ecology has accredited the laboratory used by this facility for the parameters listed in Table 5 and Table 7 of this fact sheet.
Wastewater Monitoring: Ecology details the proposed monitoring schedule under Special Condition S2 and S3. Specified monitoring frequencies take into account the quantity and variability of the discharge, the treatment method, past compliance, significance of pollutants, and cost of monitoring.
Groundwater Monitoring: Ecology requires groundwater monitoring at the site in accordance with the Ground Water Quality Standards, chapter 173‐200 WAC. See Table 9 for groundwater monitoring requirements. However, water level monitoring shows declining regional groundwater levels, water levels in wells 699‐48‐77A and 699‐48‐77D have been approaching their screened levels for several years. In March 2012, Ecology granted the Permittee approval to discontinue sampling of wells 699‐48‐77A and 699‐48‐77D once these wells could no longer produce representative data. Well 699‐48‐77A stopped producing representative data after August 2011. The permittee will continue to monitor Well 699‐48‐77C for a limited list of parameters. All other groundwater parameters will now be monitored at the verification tanks. This process is more protective of the environment because verification tank effluent that does not meet permit limits will not be discharged to SALDS; it will be rerouted through the treatment process.
Other Conditions under the State Discharge Permit:
Reporting and Record Keeping: Ecology based Special Condition S3 on its authority to specify any appropriate reporting and recordkeeping requirements to prevent and control waste discharges (WAC 173‐216‐110).
Operations and Maintenance: Ecology requires dischargers to take all reasonable steps to properly operate and maintain their wastewater treatment system in accordance with state regulations (WAC 173‐240‐080 and WAC 173‐216‐110). The facility has prepared an operation and maintenance (O&M) manual for the wastewater facility. Implementation of the procedures
45 Pg. 18 of Washington State Department of Ecology (2014). Fact Sheet for State Waste Discharge Permit ST0004500 ‐ Effluent Treatment Facility and State Approved Land Disposal Site (URL: http://www.ecy.wa.gov/programs/nwp/permitting/HDWP/Rev/8c/Draft/9_8_14/ETF/fact.pdf): 33 pages
Hanford Site-wide Risk Review Project Final Report – August 31 2018 http://www.cresp.org/hanford/

H.14_CP‐OP‐13_SALDS_10‐12‐17 H.14‐28
in the operation and maintenance manual ensures the facility’s compliance with the terms and limits in the permit and ensures the facility provides AKART46 to the waste stream.
Spill Plan: This facility stores a quantity of chemicals on‐site that have the potential to cause water pollution if accidentally released. Ecology can require a facility to develop best management plans to prevent this accidental release [Section 402(a)(1) of the Federal Water Pollution Control Act (FWPCA) and RCW 90.48.080]. USDOE developed a plan for preventing the accidental release of pollutants to state waters and for minimizing damages if such a spill occurs.
Comparison of Effluent Limits with the Previous Permit Issued on August 1, 2000:47
Ecology has determined that groundwater monitoring at SALDS may not be representative of the discharge from the ETF verification tanks. The 200 West Pump & Treat injection wells are in close proximity to the SALDS monitoring wells. The water from the pump and treat facility is directly influencing the groundwater at SALDS. Therefore, the compliance point for most of the groundwater parameters have been moved to the effluent from the ETF verification tanks. Monitoring effluent at the verification tank is more protective of the environment. If a parameter exceeds a limit at the verification tank, the water is not discharged to SALDS. It is rerouted back through the ETF for additional treatment. However, the tritium plume in the groundwater still needs to be tracked. In order to track the tritium plume, Ecology will continue to require monitoring of the groundwater wells at SALDS for tritium. Monitoring of pH, conductivity, temperature, and water level will also be required
7. Process flow of material into and out of the facility
SALDS accepts treated effluent from ETF through a series of underground transfer pipes. The effluent is then discharged via infiltration through the soils to the groundwater.48
8. Potential effects of potential delays on the processes, operations, and radioactive materials in the facility
None
9. Other facilities or processes that are involved in the flow of radioactive material into and out of the facility
See Question 7, above.
10. Shipping of material
See Question 7, above.
46 The acronym for “all known, available, and reasonable methods of prevention, control and treatment.” AKART is a technology‐based approach to limiting pollutants from wastewater discharges, which requires an engineering judgment and an economic judgment. AKART must be applied to all wastes and contaminants prior to entry into waters of the state in accordance with RCW 90.48.010 and 520, WAC 173‐200‐030(2)(c)(ii), and WAC 173‐216‐110(1)(a). [Pg. 25 of Washington State Department of Ecology (2014). Fact Sheet for State Waste Discharge Permit ST0004500 ‐ Effluent Treatment Facility and State Approved Land Disposal Site (URL: http://www.ecy.wa.gov/programs/nwp/permitting/HDWP/Rev/8c/Draft/9_8_14/ETF/fact.pdf): 33 pages.]
47 Pg. 18 of Washington State Department of Ecology (2014). Fact Sheet for State Waste Discharge Permit ST0004500 ‐ Effluent Treatment Facility and State Approved Land Disposal Site (URL: http://www.ecy.wa.gov/programs/nwp/permitting/HDWP/Rev/8c/Draft/9_8_14/ETF/fact.pdf): 33 pages
48 RPP‐RPT‐58275, Rev 0, pg. 19
Hanford Site-wide Risk Review Project Final Report – August 31 2018 http://www.cresp.org/hanford/

H.14_CP‐OP‐13_SALDS_10‐12‐17 H.14‐29
11. Infrastructure considered a part of the facility
SALDS effluent infiltration gallery is a 116‐foot by 200‐foot rectangular drain field located north of 200W. Four‐inch diameter porous pipe laterals extend from an 8‐inch diameter header at 6‐foot intervals. The drain field pipes are 6 inches below the surface of a 6‐foot deep gravel basin. ETF effluent from the verification tanks is routed to SALDS through an approximately 6‐ mile long 8‐inch diameter PVC pipe. The transfer line includes vacuum relief and sectioning valves.49 The gravel basin is then covered by a layer of native soil at least 12 inches deep.50
LEGACY SOURCE SITES
Not applicable
GROUNDWATER PLUMES
The SALDS is the source of the tritium (H‐3) plume in the saturated zone beneath the facility (DOE/RL‐2016‐09, Rev. 0). Monitoring and treatment of groundwater is being conducted within the 200‐ZP GWIA (using the 200 West P&T facility); however, the tritium plume beneath SALDS is not being actively treated.
D&D OF INACTIVE FACILITIES
Not applicable
ECOLOGICAL RESOURCES SETTING
Landscape Evaluation and Resource Classification
Within the SALDS EU, the waste site, access roads to it and a nearby well pad are bare ground classified as resource level 0. Surrounding the 1.5 acres of bare ground is just over 1 acre of resource level 1, and beyond this area, habitat is classified as a level 2 resource, although it includes patches of big sagebrush among the native and introduced grasses. One hundred percent of the habitat within the EU is classified as level 2 or below (Appendix J, Table J.109).
The amount and proximity of biological resources surrounding the SALDS EU were examined within the adjacent landscape buffer area, which extends 1102 feet (336 m) from the geometric center of the EU. Nearly 81% of the buffer area is classified as a level 2 resource and over 85% of the combined EU and buffer area is characterized as level 2 or lower (Appendix J, Table J.109). However, areas classified as level 2 include patches of sagebrush and other native vegetation.
Field Survey
Survey of the SALDS EU in August 2015 indicated the waste site had not been sprayed with herbicides recently, and a scattering of Russian thistle (Salsola tragus) was growing on the otherwise bare ground
49 RPP‐RPT‐58275, Rev 0, pg. 58
50 Pg. 8 of Department of Ecology State of Washington (2014). Fact Sheet for State Waste Discharge Permit ST0004500 ‐ Effluent Treatment Facility and State Approved Land Disposal Site (URL: http://www.ecy.wa.gov/programs/nwp/permitting/HDWP/Rev/8c/Draft/9_8_14/ETF/fact.pdf): 33 pages
Hanford Site-wide Risk Review Project Final Report – August 31 2018 http://www.cresp.org/hanford/

H.14_CP‐OP‐13_SALDS_10‐12‐17 H.14‐30
(Appendix J, Table J.108). Toward the north and west edges of the EU, a band of Russian thistle and native grass occurs with increasing plant density away from the waste site. The west side of the EU has been revegetated with native grasses and shrubs including Sandberg’s bluegrass (Poa secunda), bluebunch wheatgrass (Psuedoroegneria spicata), sagebrush (Artemisia tridentata), and gray rabbitbrush (Ericameria nauseosa) (Appendix J, Table J.108). Field data records at the end of this EU description in Appendix J provide lists of plant and animals species observed during the survey.
CULTURAL RESOURCES SETTING
Most of the CP‐OP‐13, SALDS EU has been inventoried for archaeological resources. To date, no archaeological resources have been observed or recorded with the surveyed portions of the EU. It is unknown if an NHPA Section 106 review has been completed specifically for the remediation of the CP‐OP‐13, SALDS EU. No additional buildings and/or Traditional Cultural Properties (TCPs) are currently known to exist within the EU
A segment of the National Register‐eligible Hanford Site Plant Railroad, a contributing property within the Manhattan Project and Cold War Era Historic District (with documentation required) is located within 500 meters of the CP‐OP‐13, SALDS EU. In accordance with the Hanford Site Manhattan Project and Cold War Era Historic District Treatment Plan (DOE/RL‐97‐56) (DOE‐RL 1998), all documentation requirements have been completed for this property.
Historic maps and aerial imagery indicate that the area was largely undeveloped, suggesting a low potential for archaeological resources associated with the Pre‐Hanford Early Settlers/Farming Landscape to be present within the EU. Geomorphology indicates a low potential for the presence of Native American Precontact and Ethnographic cultural resources to be present within the EU boundary. A review of recent aerial imagery of the area indicates that portions of the EU, specifically around the perimeter of the EU, remain relatively undisturbed. Resources, if present, would likely be limited to these areas of intact or undisturbed soils.
Because of the potential for intact archaeological deposits within portions of the CP‐OP‐13, SALDS EU, it may be appropriate to conduct surface (and possibly subsurface) archaeological investigations in these areas prior to initiating any remediation activities. Indirect effects are always possible when TCPs are known to be located in the general vicinity. Consultation with Hanford Tribes (Confederated Bands of the Yakama Nation, Wanapum, Confederated Tribes of the Umatilla Indian Reservation, and the Nez Perce) and other groups who may have an interest in the areas (e.g. East Benton Historical Society, Prosser Cemetery Association, Franklin County Historical Society, the Reach, and the B‐Reactor Museum Association) may need to occur. Consultation with Hanford Tribes may also be necessary to provide input on indirect effects to both recorded and potential unrecorded TCPs in the area and other cultural resource issues of concern.
PART V. WASTE AND CONTAMINATION INVENTORY
CONTAMINATION WITHIN PRIMARY EU SOURCE COMPONENTS
Vadose Zone Contamination
The reported inventories for the SALDS (Table H.14‐7 through Table H.14‐9) are associated with an operating facility and represent waste discharged to the vadose zone. No inventories are reported for
Hanford Site-wide Risk Review Project Final Report – August 31 2018 http://www.cresp.org/hanford/

H.14_CP‐OP‐13_SALDS_10‐12‐17 H.14‐31
Group A and B primary contaminants (PCs) and thus the risks and potential impacts related to these contaminants will be Not Discernible (ND) for all periods.
There is a reported inventory for tritium (H‐3) (Table H.14‐7), which is a Group C PC (CRESP 2015). Using the algorithm defined in the Methodology Report (2015), the current plume area of 0.20 km2 (DOE/RL‐2016‐09, Rev. 0) translates to a current rating of Medium, which is the maximum rating that can be ascribed to a Group C PC. Despite not being a Group A or B PC, the groundwater threat metric (GTM) was estimated from the discharged inventory (decay corrected to 2016) of 174.9 Ci and drinking water standard of 20,000 pCi/L; the resulting maximum GTM (assuming no treatment or volatilization and ignoring the saturated zone inventory) is (CRESP 2015):
1 , ,
174.9Ci20,000pCi/L
1 10 1000
8.7 10
where
• M is activity, C concentration, porosity, bulk density, partition coefficient • Superscript (L or S) indicates phase or Total (Tot) • Subscript WQS indicates the water quality standard
The maximum GTM of 8.7 (in million m3) would correspond to a Low rating (Table 6‐3, CRESP 2015) if tritium was a Group A or B PC. The impact of radioactive decay would diminish the plume to the point (if no additional contamination was added to SALDS) that after 150 years (and more than 12 half‐lives) that any plume from the contamination already in SALDS would likely be decayed and dispersed to the point of not being detectable. However, because SALDS is an operating facility, after the ETF is restarted and additions are again made to SALDS, there will be additional contamination that could increase the vadose (or saturated) zone inventory and represent an increased threat to groundwater. It is assumed that any such additions would not drive the plume to be significantly smaller than the current area or would drive the vadose zone threat an order of magnitude higher (when decay corrected). Thus the current rating of Medium related to the current plume area would be maintained through the Active Cleanup period and would be made Low afterwards to account for uncertainties in the evaluation.
Groundwater Plumes
There are no Group A or B primary contaminant (PC) plumes in the vicinity of SALDS and thus no corresponding threats to groundwater. The tritium (H‐3) groundwater plume (for a Group C PC) in the vicinity of SALDS is sourced from past discharges to SALDS. The current tritium (H‐3) plume area corresponds to a Medium rating (CRESP 2015).
Impact of Recharge Rate and Radioactive Decay on Groundwater Ratings
As described above, radioactive decay will have a profound impact on the tritium (H‐3) plume and vadose zone inventory over the 150‐year period in question (i.e., 12+ half‐lives). This information is used as the basis for the current rating (Medium) based on plume area for a Group C primary contaminant (PC) to not be increased during the Active Cleanup period as additional tritium is discharged to the SALDS. However, because SALDS operations will close during this period, it is predicted that decay will
Hanford Site-wide Risk Review Project Final Report – August 31 2018 http://www.cresp.org/hanford/

H.14_CP‐OP‐13_SALDS_10‐12‐17 H.14‐32
cause both the vadose and saturated zone inventories to be decreased to very low levels by the end of the Active Cleanup period; this would result in a Low rating to account for uncertainties in the evaluation, including closure of SALDS activities. There are also no covers or other measures to decrease recharge in the area so this will not have an impact on ratings. Thus the ratings for the Active and Near‐term Post‐Cleanup periods would be Medium and Low, respectively, for these periods.
Columbia River
There are no current plumes from SALDS intersecting the Columbia River nor any predicted to do so in the 150‐year evaluation period; thus ratings are Not Discernible (ND).
Operating Facilities
SALDS began operations in late 1995 and continues to this day (while noting that SALDS operations paused in January 2014 through May 201651 due to the ETF shutdown) resulting with about 19 years of operations before the ETF shutdown. Discharges from May 2016 to the end of 2016 are unknown. Results of numerical modeling of groundwater flow suggest travel times of approximately 100 years from the facility to the Columbia River.52 Hence, it could be assumed that the plume of tritium has not traveled far from the SALDS discharge field (infiltration gallery) and the 19+ years of discharged tritium is still within the SALDS boundary and can be summed to calculate the total inventory on site.
Discharges from the SALDS are listed in Table H.14‐6 by date, volume, and concentration of tritium. The annual average tritium concentration may be misleading because tritiated water comes from sources with widely different concentrations and volumes. To account for this, the weighted averages are used for a number of years’ data (denoted with an asterisk in Table 4). Typically, groundwater treated at the ETF contains <50,000 pCi/L, while K‐Basin and 242‐A Evaporator wastewater treated at the ETF has much higher tritium contamination (<600,000 pCi/L since 2009).53
Inventory values were not available within the Tritium treatment report [DOE/RL‐2014‐10, Rev 0] for the year of 2014 or 2015. However the inventory for year 2014 can be estimated from the Tritium Tracking report [SGW‐58210, Rev 0] from figures reproduced as Figure H.14‐10 and Figure H.14‐11) and has been added to Table H.14‐6. For the year 2015, the inventory can be estimated as negligible since ETF has been shut down since February 2014 due to a major failure of the evaporator heat exchanger (reboiler). Replacement of the heat exchanger is expected to keep ETF shutdown until late 2015.54
Tritium radioactivity levels discharged to SALDS are shown in Table H.14‐6 but have not been adjusted to account for radioactive decay within the original reports. Radioactive decay has been accounted for in this paper and the equation of finding remaining radioactivity is: A = A0*e‐rt
Where: A = activity at current year of 2016 [Ci] A0 = activity at reported year [Ci] r = decay rate [yr‐1] = ln(2) / t1/2
51 Hanford (2016). Effluent Treatment Facility Restarts Operations. The Hanford Forward: page 18.
52 Pg. 9 of Washington State Department of Ecology (2014). Fact Sheet for State Waste Discharge Permit ST0004500 ‐ Effluent Treatment Facility and State Approved Land Disposal Site (URL: http://www.ecy.wa.gov/programs/nwp/permitting/HDWP/Rev/8c/Draft/9_8_14/ETF/fact.pdf): 33 pages.
53 DOE/RL‐2014‐10, Rev 0, pg. 3‐15 and 3‐16
54 SGW‐58210, Rev0, pg. 1‐7
Hanford Site-wide Risk Review Project Final Report – August 31 2018 http://www.cresp.org/hanford/

H.14_CP‐OP‐13_SALDS_10‐12‐17 H.14‐33
t1/2 = half‐life [yr] = 12.3 years for tritium t = time that has passed between A0 and A (t = 2016 – A0)
The total tritium inventory discharged via the SALDS facility from inception to current day (2016) was estimated to be 174.9 Ci (shown below in Table H.14‐6).
Hanford Site-wide Risk Review Project Final Report – August 31 2018 http://www.cresp.org/hanford/

H.14_CP‐OP‐13_SALDS_10‐12‐17 H.14‐34
Table H.14‐6. SALDS Inventory55
Calendar Year
Discharged Volume (L)
Discharged Volume (gal)
Average Tritium Concentration
(pCi/L)
TritiumRadioactivity
(Ci)
Years passed to current year (2016)
Decay Corrected Activity to year 2016
(Ci)
% remaining accounting for decay (12.3 yr half‐
life of tritium)
1995 2,237,000 591,000 6,200,000 14 21 4.3 31%
1996 28,630,000 7,564,000 7,500,000 215 20 69.7 32%
1997 57,769,000 15,263,000 610,000 35 19 12.0 34%
1998 107,199,000 28,322,000 290,000 32 18 11.6 36%
1999 87,313.00 23,068,000 100,000 9 17 3.5 38%
2000 91,315,000 24,125,000 230,000 21 16 8.5 41%
2001 98,117.00 25,923,000 630 0.1 15 0.0 43%
2002 83,540,000 22,071,000 102,000 9 14 4.1 45%
2003 95,655,000 25,880,000 51 5 13 2.4 48%
2004 106,976.00 28,254,000 134,000* 15 12 7.6 51%
2005 22,986,000 6,071,000 102,000* 2 11 1.1 54%
2006 18,144,000 4,792,000 1,110,000* 20 10 11.4 57%
2007 32,997,000 8,686,000 883,000* 29 9 17.5 60%
2008 67,748,000 17,899,000 7,000* 1 8 0.6 64%
2009 82,642,000 21,834,000 7,400* 1 7 0.7 67%
2010 71,389,000 18,861,000 85,600* 7 6 5.0 71%
2011 75,168,000 19,859,000 18,000* 1 5 0.8 75%
2012 35,786,000 9,455,000 90,300* 4 4 3.2 80%
2013 30,422,000 8,037,000 361,000* 11 3 9.3 84%
2014 (Jan)**
5,000,000 1,320,860
‐‐ 2 2 1.8 89%
Estimated Total tritium radioactivity remaining as of 2016 (Ci) 174.9 Ci
55 DOE/RL‐2014‐10, Rev 0, Table 4, pg. 3‐16 was the source information for years 1995‐2013. * denote weighted averages used within the DOE/RL‐2014‐10 Rev 0 report. ** denotes that year 2014 (January only) was estimated by using SGW‐58210, Rev 0, Figure 1‐5 on pg. 1‐9 for the January 2014 tritium inventory.
Hanford Site-wide Risk Review Project Final Report – August 31 2018 http://www.cresp.org/hanford/

H.14_CP‐OP‐13_SALDS_10‐12‐17 H.14‐35
The SALDS effluent infiltration gallery (i.e., 619‐A Crib) is a 35 m by 61 m (116 ft by 200 ft) rectangular drain field with 10.2 cm (4 in.) diameter porous pipe laterals coming from a 20.3 cm (8 in.) diameter header at 1.8 m (6 ft) intervals. The drain field pipes are 15 cm (6 in.) below the surface of a 1.8 m (6 ft) deep gravel basin. The gravel basin is covered by at least 30 cm (12 in.) of natural, compacted cover soil. Discharge of tritium‐laden water to SALDS began in December 1995, with 220 Ci of tritium discharged in the first 7 months (which amounted to approximately 51 percent of the total activity discharged to date). Discharge volumes until FY 2004 were about 80 million L (21 million gal) each year. Discharges between March 2005 and August 2007 were sporadic and included intermittent campaigns to treat 242‐A evaporator process condensate and K Basins project waste streams, both of which supplied much of the tritium recently discharged to SALDS. Discharge volumes increased in September 2007 when ETF began treating wastewater from the interim action P&T system at the T Tank Farm; however, the tritium activity in this stream was low. Because the final action P&T system for the 200‐ZP‐1 OU began operating during July 2012, the interim action P&T system was shut down on June 5, 2012. The final action system has its own treatment plant and returns water to the aquifer using injection wells, so ETF/SALDS does not receive wastewater from this system.56
56 SGW‐58210, Rev0, pg. 1‐7
Hanford Site-wide Risk Review Project Final Report – August 31 2018 http://www.cresp.org/hanford/

H.14_CP‐OP‐13_SALDS_10‐12‐17 H.14‐36
Figure H.14‐10. Monthly and Cumulative Discharge Volumes for SALDS from Inception through July 201457
57 SGW‐58210, Rev 0, Figure 1‐4, pg. 1‐8
Hanford Site-wide Risk Review Project Final Report – August 31 2018 http://www.cresp.org/hanford/

H.14_CP‐OP‐13_SALDS_10‐12‐17 H.14‐37
Figure H.14‐11 shows the monthly and cumulative activity of tritium discharged to SALDS (not corrected for radioactive decay). Recent discharge activities are relatively small compared to historical discharges. This reflects the relatively low concentration of tritium in the waste streams currently being treated compared to historical discharges.58
58 SGW‐58210, Rev 0, Figure 1‐5, pg. 1‐9
Hanford Site-wide Risk Review Project Final Report – August 31 2018 http://www.cresp.org/hanford/

H.14_CP‐OP‐13_SALDS_10‐12‐17 H.14‐38
Figure H.14‐11. Monthly and Cumulative Tritium Activity Discharged to SALDS from Inception through July 201459 (**NOTE: Activity listed in this figure has NOT been adjusted for decay).
59 SGW‐58210, Rev 0, Figure 1‐5, pg. 1‐9
Hanford Site-wide Risk Review Project Final Report – August 31 2018 http://www.cresp.org/hanford/

H.14_CP‐OP‐13_SALDS_10‐12‐17 H.14‐39
Table H.14‐7. Inventory of Primary Contaminants (a)
WIDS Description Decay Date
Ref(b) Am‐241 (Ci)
C‐14 (Ci)
Cl‐36 (Ci)
Co‐60 (Ci)
Cs‐137 (Ci)
Eu‐152 (Ci)
Eu‐154 (Ci)
H‐3 (Ci)
I‐129 (Ci)
All Sum NR NR NR NR NR NR NR 175 NR
600‐292‐PL
Ancillary Equipment
See note c. NR NR NR NR NR NR NR NR(c) NR
600‐211 Other 2016 DOE and SWG
NR NR NR NR NR NR NR 175 NR
a. NR = Not reported for indicated EU
b. DOE and SWG = DOE/RL‐2014‐10, Rev 0, Table 4, pg 3‐16 and SGW‐58210 Rev 0, Figure 1‐5, pg 1‐9
c. Pipeline carried only ETF effluent destined for SALDS. Assumed negligible tritium in pipeline.
Table H.14‐8. Inventory of Primary Contaminants (cont)(a)
WIDS Description Decay Date Ref(b) Ni‐59 (Ci) Ni‐63 (Ci) Pu (total) (Ci) Sr‐90 (Ci) Tc‐99 (Ci) U (total) (Ci)
All Sum NR NR NR NR NR NR
600‐292‐PL Ancillary Equipment See note c. NR NR NR NR NR NR
600‐211 Other 2016 DOE and SWG NR NR NR NR NR NR
a. NR = Not reported for indicated EU
b. DOE and SWG = DOE/RL‐2014‐10, Rev 0, Table 4, pg 3‐16 and SGW‐58210 Rev 0, Figure 1‐5, pg 1‐9
c. Pipeline carried only ETF effluent destined for SALDS. Assumed negligible tritium in pipeline.
Hanford Site-wide Risk Review Project Final Report – August 31 2018 http://www.cresp.org/hanford/

H.14_CP‐OP‐13_SALDS_10‐12‐17 H.14‐40
Table H.14‐9. Inventory of Primary Contaminants (cont)(a)
WIDS Description Ref(b) CCl4 (kg) CN (kg) Cr (kg) Cr‐VI (kg) Hg (kg) NO3 (kg) Pb (kg) TBP (kg) TCE (kg) U (total) (kg)
All Sum NR NR NR NR NR NR NR NR NR NR
600‐292‐PL Ancillary Equipment See note c. NR NR NR NR NR NR NR NR NR NR
600‐211 Other DOE and SWG NR NR NR NR NR NR NR NR NR NR
a. NR = Not present at significant quantities for indicated EU
b. DOE and SWG = DOE/RL‐2014‐10, Rev 0, Table 4, pg 3‐16 and SGW‐58210 Rev 0, Figure 1‐5, pg 1‐9
c. Pipeline carried only ETF effluent destined for SALDS. Assumed negligible tritium in pipeline.
Hanford Site-wide Risk Review Project Final Report – August 31 2018 http://www.cresp.org/hanford/

H.14_CP‐OP‐13_SALDS_10‐12‐17 H.14‐41
Table H.14‐10. Summary of the Evaluation of Current Threats to Groundwater as a Protected Resource from Saturated Zone (SZ) and Remaining Vadose Zone (VZ) Contamination associated with the Evaluation Unit
PC
Group
WQS
Porositya
Kd (mL/g)a
ρ (kg/L)a
VZ SourceMSource
SZ TotalMSZ
Treatedc
MTreat VZ RemainingMTot
VZ GTM(Mm3)
VZ Ratingd
C‐14 A 2000 pCi/L 0.23 0 1.84 ‐‐‐ ‐‐‐ ‐‐‐ ‐‐‐ ‐‐‐ ND
I‐129 A 1 pCi/L 0.23 0.2 1.84 ‐‐‐ ‐‐‐ ‐‐‐ ‐‐‐ ‐‐‐ ND
Sr‐90 B 8 pCi/L 0.23 22 1.84 ‐‐‐ ‐‐‐ ‐‐‐ ‐‐‐ ‐‐‐ ND
Tc‐99 A 900 pCi/L 0.23 0 1.84 ‐‐‐ ‐‐‐ ‐‐‐ ‐‐‐ ‐‐‐ ND
CCl4 A 5 μg/L 0.23 0 1.84 ‐‐‐ ‐‐‐ ‐‐‐ ‐‐‐ ‐‐‐ ND
Cr B 100 μg/L 0.23 0 1.84 ‐‐‐ ‐‐‐ ‐‐‐ ‐‐‐ ‐‐‐ ND
Cr‐VI A 48 μg/Lb 0.23 0 1.84 ‐‐‐ ‐‐‐ ‐‐‐ ‐‐‐ ‐‐‐ ND
TCE B 5 μg/L 0.23 2 1.84 ‐‐‐ ‐‐‐ ‐‐‐ ‐‐‐ ‐‐‐ ND
U(tot) B 30 μg/L 0.23 0.8 1.84 ‐‐‐ ‐‐‐ ‐‐‐ ‐‐‐ ‐‐‐ ND
a. Parameters obtained from the analysis provided in Attachment 6‐1 to Methodology Report (CRESP 2015).
b. “Model Toxics Control Act—Cleanup” (WAC 173‑340) Method B groundwater cleanup level for hexavalent chromium.
c. Treatment amounts from the 2015 Hanford Annual Groundwater Report (DOE/RL‐2016‐09, Rev. 0).
d. Groundwater Threat Metric rating based on Table 6‐3, Methodology Report (CRESP 2015).
Hanford Site-wide Risk Review Project Final Report – August 31 2018 http://www.cresp.org/hanford/

H.14_CP‐OP‐13_SALDS_10‐12‐17 H.14‐42
PART VI. POTENTIAL RISK/IMPACT PATHWAYS AND EVENTS
CURRENT CONCEPTUAL MODEL
Pathways and Barriers
1. What nuclear and non‐nuclear safety accident scenarios dominate risk at the facility? What are
the response times associated with each postulated scenario?
There are no accident scenarios analyzed for the SALDS facility due to the non‐hazardous/non‐RCRA material handled and disposed of at this site. The liquid waste disposed at the SALDS site meets criteria of the clean water act with only the exception of tritium. Tritium concentrations discharged at higher levels of 20,000 pCi/L are authorized given that the mitigation method selected is by storage in slow moving groundwater to allow extended time for decay before the water reaches the site boundary. By this method, tritium in the SALDS is isolated from the general environment and human contact until it has decayed to acceptable levels.60 Concentrations of tritium in Hanford groundwater continue to decline as a result of natural decay and dispersion. Tritium decays with a 12.3 year half‐life into helium61.
The SALDS is not considered a Nuclear Facility or even a “Less than Category 3 Nuclear Facility (commonly referred to as a “Radiological Facility”). SALDS only poses standard industrial hazards (e.g., noise, common slips, trips, and falls) but is not analyzed within the Liquid Waste and Fuel Storage (LWFS), Industrial Hygiene Baseline Hazard Assessment (IHBHA) [HNF‐10555, Rev 6].62 No data are presently available to provide an estimate of human health risks
2. What are the active safety class and safety significant systems and controls?
None (not applicable)
3. What are the passive safety class and safety significant systems and controls?
None (not applicable)
4. What are the current barriers to release or dispersion of contamination from the primary facility?
What is the integrity of each of these barriers? Are there completed pathways to receptors or are
such pathways likely to be completed during the evaluation period?
Tritium concentrations discharged at higher levels of 20,000 pCi/L are authorized given that the mitigation method selected is by storage in slow moving groundwater to allow extended time for decay before the water reaches the site boundary. By this method, tritium in the SALDS is isolated from the general environment and human contact until it has decayed to acceptable levels.63
5. What forms of initiating events may lead to degradation or failure of each of the barriers?
Information not available/not applicable.
6. What are the primary pathways and populations or resources at risk from this source?
60 DOE/RL‐2014, Rev0, pg. iii
61 DOE/RL‐2014, Rev0, pg. 1‐1
62 Gasper, J. J. (2013). Liquid Waste and Fuel Storage (LWFS), Industrial Hygiene Baseline Hazard Assessment (IHBHA), CH2M HILL Plateau Remediation Company. HNF‐10555, Revision 6: 47 pages.
63 DOE/RL‐2014, Rev0, pg. iii
Hanford Site-wide Risk Review Project Final Report – August 31 2018 http://www.cresp.org/hanford/

H.14_CP‐OP‐13_SALDS_10‐12‐17 H.14‐43
Ingestion of recently discharged tritiated groundwater (tritiated water that has had time to decay would be not a risk to the public).
7. What is the time frame from each of the initiating events to human exposure or impacts to
resources?
Tritium (H‐3) is the only hazard source of concern present at SALDS but the harmful mode of exposure is via ingestion, which is unlikely for the worker at the site. Intake from groundwater for a member of the public is unlikely since the groundwater flow travel time is estimated to be 100 years to the Columbia River. By the time that 100 years pass, the tritium hazard source will have decayed over 8 half‐lives, leaving only less than 1% of the original radioactivity since tritium decays to stable, non‐radioactive helium. The 12.3 year half‐life of tritium allows storage to be considered as a mitigation method.
8. Are there current on‐going releases to the environment or receptors?
Yes, there are authorized ongoing discharges to the environment but likelihood of reaching a potential human receptor and causing harm is low.
POPULATIONS AND RESOURCES CURRENTLY AT RISK OR POTENTIALLY IMPACTED
Facility Worker
The SALDS is not considered a Nuclear Facility or even a “Less than Category 3 Nuclear Facility (commonly referred to as a “Radiological Facility”). SALDS only poses standard industrial hazards (e.g., noise, common slips, trips, and falls) but is not analyzed within the Liquid Waste and Fuel Storage (LWFS), Industrial Hygiene Baseline Hazard Assessment (IHBHA)[HNF‐10555, Rev 6].64 No data are presently available to provide an estimate of human health risks; however, due to the nature of the material present at this facility and the nature of the operations, it could be assumed that the human health hazards and risks are low.
SALDS discharges sanitary/municipal liquid waste with elevated concentrations of tritium. There is no upper limit discussed in the waste water discharge permit but the permit does require reporting of concentrations and volumetric discharges in the "tritium tracking annual reports" (see bibliography at the end of this EU summary template).
The information in the DOE Handbook on Tritium Handling and Safe Storage [DOE‐HNDBK‐1129‐2008] and also within the 2014 Hanford Sitewide Environmental Report [DOE‐RL‐2014‐52] are based on 40 CFR 141.66. The dose conversion factors for ingestion of 2 liters of tritiated water with concentrations of 20,000 pCi/L will produce a dose of 4 mrem. 65 Evaluating historical discharges from SALDS, the highest concentration was discharged in years 1995 and 1996 with 6,200,000 pCi/L and 7,500,000 pCi/L concentrations, respectively. Using the dose conversion factors found in the DOE Handbook, this would equate to around 1,240 mrem and 1,500 mrem (1.24 rem and 1.5 rem) for 1995 and 1996 discharges at SALDS. Subsequent years to 2014 have concentrations orders of magnitudes lower than the 1995 and 1996 concentrations; thus potential human health impacts are low. 66
64 Gasper, J. J. (2013). Liquid Waste and Fuel Storage (LWFS), Industrial Hygiene Baseline Hazard Assessment (IHBHA), CH2M HILL Plateau Remediation Company. HNF‐10555, Revision 6: 47 pages.
65 DOE‐HDBK‐1129‐2208, pg. 25 and DOE‐RL‐2014‐52, pg. 7.3 and https://www.law.cornell.edu/cfr/text/40/141.66
66 The current National Primary Drinking Water Regulation (NPDWR) for beta‐ and photon‐emitting radionuclides is 4 millirem (mrem) per year. The maximum contaminant level (MCL) for tritium in drinking water systems, used to
Hanford Site-wide Risk Review Project Final Report – August 31 2018 http://www.cresp.org/hanford/

H.14_CP‐OP‐13_SALDS_10‐12‐17 H.14‐44
Co‐Located Person (CP)
See discussion above for the Facility Worker.
Public
See discussion above for the Facility Worker.
Groundwater
Table H.14‐10 indicates that there are no risks to groundwater from Group A and B primary contaminants from SALDS; thus ratings for these are Not Discernible (ND). However, there is a current tritium (H‐3) plume associated with sources in SALDS that translates to a current groundwater threat rating of Medium (because plume area is greater than 0.1 km2 (CRESP 2015)).
Monitoring and treatment of groundwater is being conducted within the 200‐ZP GWIA (using the 200 West P&T facility), which is described as part of the CP‐GW‐2 EU (Appendix D.6). However, the tritium plume associated with SALDS is not being treated.
Columbia River
As described in Appendix D.6 (CP‐GW‐2 EU) and Part V, no plumes from the 200 West Area (that includes SALDS) currently intersect the Columbia River, thus current ratings for all contaminants for the benthic, riparian, and free‐flowing ecology are ND.
Ecological Resources
Summary of Ecological Review:
100% of the SALDS EU is characterized as level 2 or below.
Level 2 habitats are contiguous with level 2 and level 3 habitats outside the EU. Because the total acreage is only 6.1 acres, the loss of all habitat within the EU is not expected to significantly impact wildlife or habitat connectivity to the surrounding areas.
More than 13% of the combined EU and buffer area is classified as level 3 resources that are contiguous with similar habitat extending across the Hanford Site.
Cultural Resources
The CP‐OP‐13, SALDS (State‐Approved Land Disposal Site) EU is located in the 600 Area of the Hanford Site, just north of the 200 West Area. Most of the EU has been inventoried for cultural resources under two previous survey efforts including, HCRC# 90‐200‐010 (Gard and Chatters 1990) and HCRC# 2002‐600‐012b (Prendergast and Stapp 2002). It is unknown if an NHPA Section 106 review has been completed specifically for the remediation of the CP‐OP‐13, SALDS EU. While the central portion of the site has been disturbed from SALDS installation and operations, pockets of undisturbed areas do appear around the margins of the EU, suggesting a moderate potential for intact surface and subsurface archaeological resources.
demonstrate compliance with the 4 mrem/year level regulatory criterion as determined by the EPA (40 CFR Part 141) is 20,000 pCi/L (740 Bq/L). [DOE‐HDBK‐1129‐2208, pg. 25].
Hanford Site-wide Risk Review Project Final Report – August 31 2018 http://www.cresp.org/hanford/

H.14_CP‐OP‐13_SALDS_10‐12‐17 H.14‐45
Archaeological sites, buildings and Traditional Cultural Properties (TCPs) located within the EU67
No archaeological sites/isolates, buildings and/or Traditional Cultural Properties (TCPs) are currently known to exist within the EU.
Archaeological sites, buildings and TCPs located within 500 meters of the EU
A segment of the National Register‐eligible Hanford Site Plant Railroad, a contributing property within the Manhattan Project and Cold War Era Historic District, with documentation required, is located within 500 meters of the SALDS EU. In accordance with the Hanford Site Manhattan Project and Cold War Era Historic District Treatment Plan (DOE/RL‐97‐56) (DOE‐RL 1998), all documentation requirements have been completed for this property.
No additional archaeological sites/isolates, buildings and/or Traditional Cultural Properties (TCPs) are currently known to exist within 500 meters of the EU.
Closest Recorded TCP
There are 2 recorded TCPs associated with the Native American Precontact and Ethnographic Landscape that are visible from the CP‐OP‐13, SALDS EU.
67 Traditional cultural property has been defined by the National Park Service as “a property, a place, that is eligible for inclusion on the National Register of Historic Places because of its association with cultural practices and beliefs that are (a) rooted in the history of a community, and (b) are important to maintaining the continuity of that community’s traditional beliefs and practices” (Parker & King 1998).
Hanford Site-wide Risk Review Project Final Report – August 31 2018 http://www.cresp.org/hanford/

H.14_CP‐OP‐13_SALDS_10‐12‐17 H.14‐46
CLEANUP APPROACHES AND END‐STATE CONCEPTUAL MODEL
Selected or Potential Cleanup Approaches
No cleanup decisions have been made for the Remaining Liquid Waste Disposal Facilities.
Contaminant Inventory Remaining at the Conclusion of Planned Active Cleanup Period
No cleanup decisions have been made for the Remaining Liquid Waste Disposal Facilities.
Risks and Potential Impacts Associated with Cleanup
No cleanup decisions have been made for the Remaining Liquid Waste Disposal Facilities.
POPULATIONS AND RESOURCES AT RISK OR POTENTIALLY IMPACTED DURING OR AS A
CONSEQUENCE OF CLEANUP ACTIONS
Facility Worker
No cleanup decisions have been made for the Remaining Liquid Waste Disposal Facilities.
Co‐located Person
No cleanup decisions have been made for the Remaining Liquid Waste Disposal Facilities.
Public
No cleanup decisions have been made for the Remaining Liquid Waste Disposal Facilities.
Groundwater
No cleanup decisions have been made for the Remaining Liquid Waste Disposal Facilities. However, as described in Part V, there will be a continuing impact during this period to groundwater (as a protected resource) from tritium (H‐3) from SALDS. These impacts are described in more detail in Appendix G.6 for the CP‐GW‐2 EU.
Furthermore, there are contaminant sources (legacy source sites) in the vadose zone that pose continuing risk to groundwater (via the vadose zone). The vadose zone (VZ) GTM values for the Group A and B primary contaminants for the SALDS translate to ratings of Not Discernible because there are no reported inventories and Medium for tritium (Group C PC) based on plume size and a continuing source (SALDS) of tritium (H‐3) contamination. As indicated in Part V, radioactive decay will profoundly impact the tritium (H‐3) in both the vadose and saturated zones by the end of the Active Cleanup period. These ratings correspond to an overall rating of Medium and Low for both the Active and Near‐term, Post‐Cleanup periods, respectively.
The 200 West Area P&T system in the 200‐ZP GWIA is assumed to be operational during this evaluation period, which will be treating groundwater contamination in the 200 West Area although it is not currently treating the tritium (H‐3) plume associated with SALDS.
It is considered unlikely that additional groundwater resources would be impacted as a result of either interim remedial actions or expected final closure activities (that are not covered in the Ecological or Cultural Resources results).
Hanford Site-wide Risk Review Project Final Report – August 31 2018 http://www.cresp.org/hanford/

H.14_CP‐OP‐13_SALDS_10‐12‐17 H.14‐47
Columbia River
No cleanup decisions have been made for the Remaining Liquid Waste Disposal Facilities. However, as described in Part V, impacts to the Columbia River benthic, riparian, and free‐flowing ecology for the Active Cleanup and Near‐term, Post Cleanup periods are rated as Not Discernible (ND). Additional information on groundwater plumes and potential threats associated with sources including those from the SALDS are described in Appendix G.6 for the CP‐GW‐2 EU (200‐ZP GWIA).
It is considered unlikely that additional benthic or riparian resources would be impacted as a result of either interim remedial actions (e.g., pump and treat) or final closure activities (that are not covered in the Ecological or Cultural Resources results).
Ecological Resources
Remove, Treat and Dispose of waste involves personnel through the target (remediation) area, car and pickup truck traffic through the non‐target and target (remediation) area, truck, heavy equipment (including drill rigs) traffic on roads through the non‐target and target area, caps (and other containment), soil removal and contamination in the soil, vegetation control, and irrigation (for revegetation) will cause the following disturbance from remediation activities: Carry seeds or propagules (pieces of vegetation or other biological parts that can grow and/or reproduce) on tires of vehicles or blowing from heavy equipment; injure or kill vegetation or small invertebrates or small animals; vehicle traffic can make paths, compact soil, scare or displace animals, can impact animal behavior or reproductive success; affect animal dispersion and habitat use (e.g., some birds avoid nesting near roads because of song masking); displacement of animals from near roads due to increased noise or other disturbances; and heavy equipment may permanently destroy areas of the site with intense activity. Soil removal can cause more severe effects because of blowing soil (and seeds). During remediation, radionuclides or other contaminants could be released or spilled on the surface, and depending upon the type and quantity, could have adverse effects on the plants and animals on‐site. Use of non‐specific herbicides for vegetation control results in some mortality of native vegetation (especially native forbes), and allows exotic species to move in; it may change species composition of native communities, but it also could make it easier for native species to move in; improved methods could yield positive results. Irrigation requires a system of pumps and water, resulting in physical disturbance; repeated irrigation from the same locations could result in some soil compaction, which can decrease plant growth in those areas, decrease abundance and diversity of soil invertebrates, and prevent fossorial snakes or mammals from using the area. Alternatively, barriers could be the remediation option and involves personnel car and pickup truck traffic through the non‐target and target (remediation) area, truck and heavy equipment traffic on roads through the non‐target and target area, dust suppression, and irrigation (for revegetation) will cause the following disturbance from remediation activities: Carry seeds or propagules (pieces of vegetation or other biological parts that can grow and/or reproduce) on person (boots, clothes, equipment) or tires of vehicles or blowing from heavy equipment; injure vegetation or small invertebrates or small animals (e.g., insects, snakes); make paths or compact soil; scare or displace animals. Caps and other containment can cause compaction, which can decrease plant growth in those areas, decrease abundance and diversity of soil invertebrates, and prevent fossorial snakes or mammals from using the area. Destruction of soil invertebrates at depths of pits. Potential bringing up of dormant seeds from soil layers; disruption of ground‐living small mammals and hibernation sites of snakes and other animals on‐site of containment; often disrupts local aquatic environment and drainage; often non‐native plants used on caps (which can become exotic/alien adjacent to the containment site). Additional water from dust suppression could lead to more diverse and abundant vegetation in areas that receive water, which could encourage invasion of exotic species; the latter could displace native plant communities; excessive dust suppression activities
Hanford Site-wide Risk Review Project Final Report – August 31 2018 http://www.cresp.org/hanford/

H.14_CP‐OP‐13_SALDS_10‐12‐17 H.14‐48
could lead to compaction, which can decrease plant growth in those areas, decrease abundance and diversity of soil invertebrates, and prevent fossorial snakes or mammals from using the area. Irrigation requires a system of pumps and water, resulting in physical disturbance; repeated irrigation from the same locations could result in some soil compaction, which can decrease plant growth in those areas, decrease abundance and diversity of soil invertebrates, and prevent fossorial snakes or mammals from using the area. These effects will be higher in the EU itself.
Cultural Resources
Potential direct effects are possible from personnel, car, pick‐up, truck and heavy equipment traffic/use through both target (remediation) and non‐target areas during active cleanup. These activities may inadvertently expose resources close to the surface. Additionally, traffic through these areas may lead to the introduction of invasive species and/or a decrease in the presence of native plants used for medicinal or tribal religious purposes. Heavy equipment use for remedial activities (such as RTD of all contaminated soils) may lead to an alteration of the landscape, and the act of soil removal may destroy resources; if resources are not destroyed, then, soil removal may disturb or adversely affect resources. Utilization of caps, barriers and/or other containments may destroy resources located close to the surface. If resources are not destroyed, containments may disturb or adversely affect resources. Lastly, during remediation, radionuclides or other contamination released or spilled on the surface could have long‐term effects if the contamination remains and resources become contaminated and/or plants having cultural importance to Tribes do no recolonize or thrive.
Potential indirect effects are possible from personnel traffic through target (remediation) areas as well as car, pick‐up, truck and heavy equipment traffic/use through both target (remediation) and non‐target areas. It is possible that these activities may decrease viewshed values and/or impact viewshed through the introduction of increased dust, the creation of trails, etc. Heavy equipment use for remedial actions/soil removal and the utilization of caps and/or other containments could potentially cause alterations to the landscape and impacts to viewsheds. Lastly, during remediation, radionuclides or other contamination released or spilled on the surface could have long‐term effects if the contamination remains and resources become contaminated and/or plants having cultural importance to Tribes do no recolonize or thrive.
ADDITIONAL RISKS AND POTENTIAL IMPACTS IF CLEANUP IS DELAYED
No cleanup decisions have been made for the Remaining Liquid Waste Disposal Facilities.
NEAR‐TERM, POST‐CLEANUP STATUS, RISKS AND POTENTIAL IMPACTS
No cleanup decisions have been made for the Remaining Liquid Waste Disposal Facilities.
Hanford Site-wide Risk Review Project Final Report – August 31 2018 http://www.cresp.org/hanford/
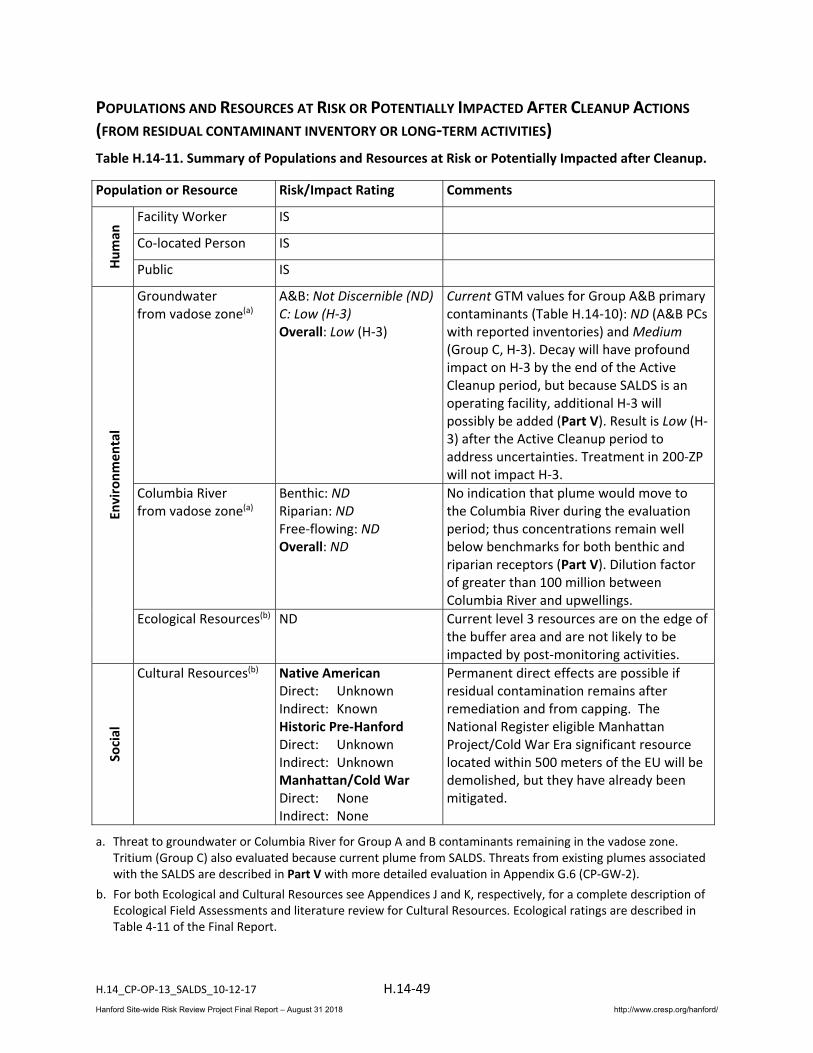
H.14_CP‐OP‐13_SALDS_10‐12‐17 H.14‐49
POPULATIONS AND RESOURCES AT RISK OR POTENTIALLY IMPACTED AFTER CLEANUP ACTIONS (FROM RESIDUAL CONTAMINANT INVENTORY OR LONG‐TERM ACTIVITIES)
Table H.14‐11. Summary of Populations and Resources at Risk or Potentially Impacted after Cleanup.
Population or Resource Risk/Impact Rating Comments
Human
Facility Worker IS
Co‐located Person IS
Public IS
Environmental
Groundwater from vadose zone(a)
A&B: Not Discernible (ND) C: Low (H‐3) Overall: Low (H‐3)
Current GTM values for Group A&B primary contaminants (Table H.14‐10): ND (A&B PCs with reported inventories) and Medium (Group C, H‐3). Decay will have profound impact on H‐3 by the end of the Active Cleanup period, but because SALDS is an operating facility, additional H‐3 will possibly be added (Part V). Result is Low (H‐3) after the Active Cleanup period to address uncertainties. Treatment in 200‐ZP will not impact H‐3.
Columbia River from vadose zone(a)
Benthic: ND Riparian: ND Free‐flowing: ND Overall: ND
No indication that plume would move to the Columbia River during the evaluation period; thus concentrations remain well below benchmarks for both benthic and riparian receptors (Part V). Dilution factor of greater than 100 million between Columbia River and upwellings.
Ecological Resources(b) ND Current level 3 resources are on the edge of the buffer area and are not likely to be impacted by post‐monitoring activities.
Social
Cultural Resources(b) Native American Direct: Unknown Indirect: Known Historic Pre‐Hanford Direct: Unknown Indirect: Unknown Manhattan/Cold War Direct: None Indirect: None
Permanent direct effects are possible if residual contamination remains after remediation and from capping. The National Register eligible Manhattan Project/Cold War Era significant resource located within 500 meters of the EU will be demolished, but they have already been mitigated.
a. Threat to groundwater or Columbia River for Group A and B contaminants remaining in the vadose zone. Tritium (Group C) also evaluated because current plume from SALDS. Threats from existing plumes associated with the SALDS are described in Part V with more detailed evaluation in Appendix G.6 (CP‐GW‐2).
b. For both Ecological and Cultural Resources see Appendices J and K, respectively, for a complete description of Ecological Field Assessments and literature review for Cultural Resources. Ecological ratings are described in Table 4‐11 of the Final Report.
Hanford Site-wide Risk Review Project Final Report – August 31 2018 http://www.cresp.org/hanford/

H.14_CP‐OP‐13_SALDS_10‐12‐17 H.14‐50
LONG‐TERM, POST‐CLEANUP STATUS – INVENTORIES AND RISKS AND POTENTIAL IMPACT
PATHWAYS
No cleanup decisions have been made for the Remaining Liquid Waste Disposal Facilities.
PART VII. SUPPLEMENTAL INFORMATION AND CONSIDERATIONS
Not applicable
Hanford Site-wide Risk Review Project Final Report – August 31 2018 http://www.cresp.org/hanford/

H.14_CP‐OP‐13_SALDS_10‐12‐17 H.14‐51
BIBLIOGRAPHY
Barnett, D. B. (1999). Results of Tritium Tracking and Groundwater Monitoring at the Hanford Site 200 Area State‐ Approved Land Disposal Site— Fiscal Year 1999, Pacific Northwest National Laboratory (PNNL),. PNNL‐13058 (URL: https://www.osti.gov/scitech/servlets/purl/13876): 29 pages.
Barnett, D. B. (2000). Results of Tritium Tracking and Groundwater Monitoring at the Hanford Site 200 Area State‐ Approved Land Disposal Site— Fiscal Year 2000, Pacific Northwest National Laboratory (PNNL),. PNNL‐13329 (URL: https://www.osti.gov/scitech/servlets/purl/763381): 37 pages.
Barnett, D. B. and J. T. Rieger (2001). Results of Tritium Tracking and Groundwater Monitoring at the Hanford Site 200 Area State‐Approved Land Disposal Site— Fiscal Year 2001, Pacific Northwest National Laboratory (PNNL). PNNL‐13689 (URL: http://www.pnl.gov/main/publications/external/technical_reports/pnnl‐13689.pdf): 32 pages.
Barnett, D. B. and J. T. Rieger (2002). Results of Tritium Tracking and Groundwater Monitoring at the Hanford Site 200 Area State‐ Approved Land Disposal Site— Fiscal Year 2002, Pacific Northwest National Laboratory (PNNL),. PNNL‐14038 (URL: http://www.pnl.gov/main/publications/external/technical_reports/PNNL‐14038.pdf): 42 pages.
Barnett, D. B., J. T. Rieger and E. C. Thornton (2003). Results of Tritium Tracking and Groundwater Monitoring at the Hanford Site 200 Area State‐ Approved Land Disposal Site— Fiscal Year 2003 Pacific Northwest National Laboratory (PNNL),. PNNL‐14449 (URL: http://www.pnl.gov/main/publications/external/technical_reports/PNNL‐14449.pdf): 43 pages.
Barnett, D. B., M. P. Bergeron and E. J. Freeman (2004). Results of Groundwater Modeling for Tritium Tracking at the Hanford Site 200 Area State‐Approved Land Disposal Site – 2004, Pacific Northwest National Laboratory (PNNL). PNNL‐14898 (URL: http://www.pnl.gov/main/publications/external/technical_reports/PNNL‐14898.pdf): 87 pages.
Caron, M. E. (2008). Results of Tritium Tracking and Groundwater Monitoring at the Hanford Site 200 Area State Approved Land Disposal Site, Fiscal Year 2008, GRAM Inc. SGW‐38802, Revision 0 (URL: http://www.osti.gov/scitech/servlets/purl/943300): 57 pages.
CRESP 2015. Methodology for the Hanford Site‐Wide Risk Review Project, Consortium for Risk Evaluation with Stakeholder Participation (CRESP), Nashville, Tennessee. Available at: http://www.cresp.org/hanford/.
DOE/RL‐2016‐09, Rev. 0, Hanford Site Groundwater Monitoring Report for 2015, Rev 0, U.S. Department of Energy, Richland Operations Office, Richland, Washington. Available at: http://higrv.hanford.gov/Hanford_Reports_2015/Hanford_GW_Report/
Freeman, E. J., M. J. Tonkin and M. E. Caron (2010). Results of Tritium Tracking and Groundwater Monitoring at the Hanford Site 200 Area State Approved Land Disposal Site, Fiscal Year 2010. CH2M HILL Plateau Remediation Company, S. S. Papadopulos and Associates, GRAM Inc. SGW‐47923, Revision 0 (URL: http://pdw.hanford.gov/arpir/pdf.cfm?accession=1011190085): 93 pages.
Gasper, J. J. (2013). Liquid Waste and Fuel Storage (LWFS), Industrial Hygiene Baseline Hazard Assessment (IHBHA), CH2M HILL Plateau Remediation Company. HNF‐10555, Revision 6: 47 pages.
Halgren, D. L. (2015). Liquid Waste Processing Facilities Waste Acceptance Criteria CH2M HILL Plateau Remediation Company. HNF‐3172, Revision 7: 43 pages.
Hanford Site-wide Risk Review Project Final Report – August 31 2018 http://www.cresp.org/hanford/

H.14_CP‐OP‐13_SALDS_10‐12‐17 H.14‐52
Hartman, M. J., L. F. Morasch, W. D. Webber, W. P. Clement, D. A. Myers, B. J. Dixon, D. B. Erb, G. G. Kelty, R. O. Mahood, B. B. Nelson‐Maki, S. W. Peterson, R. F. Raidl, V. J. Rohay, L. C. Swanson, S. J. Trent, D. A. S. John, R. L. Weiss, D. B. Barnett, C. J. Chou, P. E. Dresel, G. W. Gee, H. Hampt, D. G. Horton, J. M. Keller, J. W. Lindberg, J. P. McDonald, S. M. Narbutovskih, D. R. Newcomer, R. E. Peterson, J. T. Rieger, G. H. Seedahmed, R. J. Serne, D. S. Sklarew, R. M. Smith, D. L. Stewart, C. E. Strickland, M. D. Sweeney, C. J. Thompson, E. C. Thornton, A. L. Ward, M. D. White, B. A. Williams, Z. F. Zhang and L. Zhong (2006). Hanford Site Groundwater Monitoring for Fiscal Year 2005. PNNL‐15670 (URL: http://www.pnl.gov/main/publications/external/technical_reports/PNNL‐15670.pdf): 621 pages.
Indian Eyes LLC, E2 Consulting Engineers Inc. and Babcock Services Inc. (2014). Effluent Treatment Facility Transition Plan, Washington River Protection Solutions. RPP‐PLAN‐60073, Revision 0: 69 pages.
Lueck, K. J. and D. L. Halgren (2014). 2014 Evaluation of Tritium Removal and Mitigation Technologies for Wastewater Treatment, CH2M HILL Plateau Remediation Company. DOE/RL‐2014‐10, Revision 0 (URL: http://pdw.hanford.gov/arpir/pdf.cfm?accession=0086036): 40 pages.
Mann, F. M. (2010). RCRA Facility Investigation Report for Hanford Single‐Shell Tank Waste Management Tier 1 & 2, Department of Energy (DOE), Office of River Protection (ORP). DOE/ORP‐2008‐01, Revision 1 (REISSUE): 2011 pages.
McDonald, J. P., M. Karanovic and M. J. Tonkin (2011). Results of Tritium Tracking and Groundwater Monitoring at the Hanford Site 200 Area State Approved Land Disposal Site Fiscal Year 2011, CH2MHILL Plateau Remediation Company, S.S. Papadopulos and Associates Inc. SGW‐51085, Revision 0.
McDonald, J. P. and M. J. Tonkin (2012). Results of Tritium Tracking and Groundwater Monitoring at the Hanford Site 200 Area State Approved Land Disposal Site, Fiscal Year 2012, CH2M HILL Plateau Remediation Company, S. S. Papadopulos and Associates. SGW‐53569, Revision 0 (URL: http://pdw.hanford.gov/arpir/pdf.cfm?accession=1211290693): 66 pages.
McDonald, J. P., M. Karanovic and M. J. Tonkin (2013). Results of Tritium Tracking and Groundwater Monitoring at the Hanford Site 200 Area State Approved Land Disposal Site, Fiscal Year 2013, CH2M HILL Plateau Remediation Company, S. S. Papadopulos and Associates. SGW‐56060, Revision 0 (URL: http://pdw.hanford.gov/arpir/pdf.cfm?accession=0080439H): 58 pages.
McDonald, J. P. (2014). Results of Tritium Tracking and Groundwater Monitoring at the Hanford Site 200 Area State Approved Land Disposal Site, Fiscal Year 2014 CH2M HILL Plateau Remediation Company (CHPRC). SGW‐58210, Revision 0: 68 pages.
Smith, K. E. (2014). Effluent Treatment Facility Extent of Condition Report, Washington River Protection Solutions, Indian Eyes LLC, E2 Consulting Engineers Inc., Babcock Services, Inc. RPP‐RPT‐58275, Rev. 0: 171 pages.
US Department of Energy (DOE) (2009). Tritium Handling and Safe Storage. DOE‐HDBK‐1129‐2008 (URL: http://energy.gov/sites/prod/files/2013/06/f1/DOE‐HDBK‐1129‐2008.pdf): 343 pages.
Department of Energy (DOE) (2015). Hanford Site Environmental Report for Calendar Year 2014. DOE‐RL‐2014‐52, Revision 0 (URL: https://msa.hanford.gov/files.cfm/DOE‐RL‐2014‐52.pdf): 409 pages.
US Environmental Protection Agency (EPA) (1988). Federal Guidance Report No. 11: Limiting Values of Radionuclide Intake and Air Concentrations and Dose Conversions Factors for Inhalation, Submersion, and Ingestion. Oak Ridge, TN. EPA‐520/1‐88‐020 (URL: http://www.epa.gov/sites/production/files/2015‐05/documents/520‐1‐88‐020.pdf): 224 pages.
Hanford Site-wide Risk Review Project Final Report – August 31 2018 http://www.cresp.org/hanford/

H.14_CP‐OP‐13_SALDS_10‐12‐17 H.14‐53
US Nuclear Regulatory Commission (NRC) (2016). Backgrounder on Tritium, Radiation Protection Limits, and Drinking Water Standards (Updated February 18, 2016). (URL: http://www.nrc.gov/reading‐rm/doc‐collections/fact‐sheets/tritium‐radiation‐fs.html and http://pbadupws.nrc.gov/docs/ML0620/ML062020079.pdf): 7 pages.
Washington State Department of Ecology (2000). STATE WASTE DISCHARGE PERMIT NUMBER ST 4500. (URL: http://www.ecy.wa.gov/programs/nwp/pdf/4500dp.pdf): 25 pages.
Washington State Department of Ecology (2014). State Waste Discharge Permit Number ST0004500. (URL: http://www.ecy.wa.gov/programs/nwp/permitting/WWD/PDF/ST4500/ST0004500.pdf): 23 pages.
Washington State Department of Ecology (2000). Fact Sheet for State Waste Discharge Permit No. ST 4500. (URL: http://www.ecy.wa.gov/programs/nwp/pdf/4500dfs.pdf): 39 pages.
Washington State Department of Ecology (2014). Fact Sheet for State Waste Discharge Permit ST0004500 ‐ Effluent Treatment Facility and State Approved Land Disposal Site (URL: http://www.ecy.wa.gov/programs/nwp/permitting/HDWP/Rev/8c/Draft/9_8_14/ETF/fact.pdf): 33 pages.
Hanford Site-wide Risk Review Project Final Report – August 31 2018 http://www.cresp.org/hanford/