Embed Size (px)
Citation preview

PPM Plant Expansion Project 710.16002.00026
H
APPENDIX H: NOISE STUDY

Address: 480 Smuts Drive, Halfway Gardens | Postal: P O Box 5260, Halfway House, 1685 Tel: +27 (0)11 805 1940 | Fax: +27 (0)11 805 7010
www.airshed.co.za
Report compiled by:
Reneé von Gruenewaldt
Report No: 16SRL28N | Date: March 2019
Noise Specialist Study for the Pilanesberg Platinum Mine Plant Expansion Project
Project done for SLR Consulting (South Africa) (Pty) Ltd

Noise Specialist Study for the Pilanesberg Platinum Mine Plant Expansion Project
Report Number: 16SLR28N i
Report Details
Report Title Noise Specialist Study for the Pilanesberg Platinum Mine Plant Expansion Project
Client SLR Consulting (South Africa) (Pty) Ltd
Report Number 16SLR28N
Report Version Rev 0.4
Date March 2019
Prepared by Renee von Gruenewaldt, (Pr. Sci. Nat.), MSc (University of Pretoria)
Notice
Airshed Planning Professionals (Pty) Ltd is a consulting company located in Midrand, South Africa, specialising in all aspects of air quality, ranging from nearby neighbourhood concerns to regional air pollution impacts as well as noise impact assessments. The company originated in 1990 as Environmental Management Services, which amalgamated with its sister company, Matrix Environmental Consultants, in 2003.
Declaration Airshed is an independent consulting firm with no interest in the project other than to fulfil the contract between the client and the consultant for delivery of specialised services as stipulated in the terms of reference.
Copyright Warning
Unless otherwise noted, the copyright in all text and other matter (including the manner of presentation) is the exclusive property of Airshed Planning Professionals (Pty) Ltd. It is a criminal offence to reproduce and/or use, without written consent, any matter, technical procedure and/or technique contained in this document.
Revision Record
Version Date Comments
Rev 0 November 2018 For client review
Rev 0.1 January 2019 Incorporation of grammatical changes
Rev 0.2 February 2019 Update of NEMA regulation requirements
Rev 0.3 February 2019 Incorporation of comments from the client
Rev 0.4 March 2019 Process update

Noise Specialist Study for the Pilanesberg Platinum Mine Plant Expansion Project
Report Number: 16SLR28N ii
NEMA Regulation (2014), Appendix 6
NEMA Regulations (2014) (as amended) - Appendix 6 Relevant section in report
Details of the specialist who prepared the report Section 1.3
The expertise of that person to compile a specialist report including a
curriculum vitae
Section 1.3 and Appendix A
A declaration that the person is independent in a form as may be
specified by the competent authority
Report details (Executive Summary) and Section
1.3
An indication of the scope of, and the purpose for which, the report was
prepared
Section 1.2
An indication of the quality and age of base data used for the specialist
report
Section 3.3
A description of existing impacts on the site, cumulative impacts of the
proposed development and levels of acceptable change
Section 3.3 and Section 4.2
The duration date and season of the site investigation and the relevance
of the season to the outcome of the assessment
Section 3.3
A description of the methodology adopted in preparing the report or
carrying out the specialised process inclusive of equipment and
modelling used
Section 1.6
Details of an assessment of the specific identified sensitivity of the site
related to the proposed activity or activities and its associated structures
and infrastructure inclusive of a site plan identifying site alternatives
Section 4
An identification of any areas to be avoided, including buffers Not applicable
A map superimposing the activity including the associated structures
and infrastructure on the environmental sensitivities of the site including
areas to be avoided, including buffers;
Section 3.1
A description of any assumptions made and any uncertainties or gaps in
knowledge;
Section 1.7
A description of the findings and potential implications of such findings
on the impact of the proposed activity or activities
Section 4.2
Any mitigation measures for inclusion in the EMPr Section 5
Any conditions for inclusion in the environmental authorisation No comments received.
Any monitoring requirements for inclusion in the EMPr or environmental
authorisation
Section 5
A reasoned opinion as to whether the proposed activity or portions
thereof should be authorised and regarding the acceptability of the
proposed activity or activities
Section 7
If the opinion is that the proposed activity or portions thereof should be
authorised, any avoidance, management and mitigation measures that
should be included in the EMPr, and where applicable, the closure plan
Section 5
A description of any consultation process that was undertaken during
the course of preparing the specialist report
Not applicable.
A summary and copies of any comments received during any
consultation process and where applicable all responses thereto
Not applicable.
Any other information requested by the competent authority. Not applicable.

Noise Specialist Study for the Pilanesberg Platinum Mine Plant Expansion Project
Report Number: 16SLR28N iii
Glossary and Abbreviations
Airshed Airshed Planning Professionals (Pty) Ltd
ASG Atmospheric Studies Group
dB Descriptor that is used to indicate 10 times a logarithmic ratio of quantities that have the same units, in this case sound pressure.
dBA Descriptor that is used to indicate 10 times a logarithmic ratio of quantities that have the same units, in this case sound pressure that has been A-weighted to simulate human hearing.
Ci Correction for impulsiveness
Ct Correction for tonality
EAP Environmental Assessment Practitioner
EC European Commission
EHS Environmental, Health, and Safety (IFC)
Hz Frequency in Hertz
HV Heavy vehicle
IEC International Electro Technical Commission
IFC International Finance Corporation
ISO International Standards Organisation
Kn Noise propagation correction factor
K1 Noise propagation correction for geometrical divergence
K2 Noise propagation correction for atmospheric absorption
K3 Noise propagation correction for the effect of ground surface;
K4 Noise propagation correction for reflection from surfaces
K5 Noise propagation correction for screening by obstacles
kW Power in kilowatt
LAeq (T) The A-weighted equivalent sound pressure level, where T indicates the time over which the noise is averaged (calculated or measured) (in dBA)
LAIeq (T) The impulse corrected A-weighted equivalent sound pressure level, where T indicates the time over which the noise is averaged (calculated or measured) (in dBA)
LReq,d The LAeq rated for impulsive sound and tonality in accordance with SANS 10103 for the day-time period, i.e. from 06:00 to 22:00.
LReq,n The LAeq rated for impulsive sound and tonality in accordance with SANS 10103 for the night-time period, i.e. from 22:00 to 06:00.
LR,dn The LAeq rated for impulsive sound and tonality in accordance with SANS 10103 for the period of a day and night, i.e. 24 hours, and wherein the LReq,n has been weighted with 10dB in order to account for the additional disturbance caused by noise during the night.
LA90 The A-weighted 90% statistical noise level, i.e. the noise level that is exceeded during 90% of the measurement period. It is a very useful descriptor which provides an indication of what the LAeq could have been in the absence of noisy single events and is considered representative of background noise levels (LA90) (in dBA)
LAFmax The A-weighted maximum sound pressure level recorded during the measurement period
LAFmin The A-weighted minimum sound pressure level recorded during the measurement period
Noise Specialist Study for the Pilanesberg Platinum Mine Plant Expansion Project
Report Number: 16SLR28N iv
Lme Sound power level 25 m from a road, 4 above ground (in dBA)
LP Sound pressure level (in dB)
LPA A-weighted sound pressure level (in dBA)
LPZ Un-weighted sound pressure level (in dB)
Ltd Limited
LW Sound Power Level (in dB)
NEMAQA National Environment Management Air Quality Act
masl Meters above sea level
m2 Area in square meters
m/s Speed in meters per second
NLG Noise level guideline
NSR Noise sensitive receptor
p Pressure in Pa
Pa Pressure in Pascal
µPa Pressure in micro-pascal
pref Reference pressure, 20 μPa
Pty Proprietary
rpm Rotational speed in revolutions per minute
SABS South African Bureau of Standards
SANS South African National Standards
SLM Sound Level Meter
SoW Scope of Work
STRM Shuttle Radar Topography Mission
USGS United States Geological Survey
WG-AEN Working Group – Assessment of Environmental Noise (EC)
WHO World Health Organisation
% Percentage

Noise Specialist Study for the Pilanesberg Platinum Mine Plant Expansion Project
Report Number: 16SLR28N v
Executive Summary
Airshed Planning Professionals (Pty) Ltd (Airshed) was appointed by SLR Consulting (South Africa) (Pty) Ltd. to
conduct a Noise Impact Assessment (NIA) for the proposed plant expansion at the Pilanesberg Platinum Mines
(PPM) (hereafter referred to as the project). Current operations at the PPM include open pit mining on the farm
Tuschenkomst 135JP. Ore from the open pit operations is transported to the existing mineral processing facility
located on the farms Witkleifontein 136JP and Tuschenkomst 136JP for processing. Waste rock is stockpiled on
waste rock dumps. Tailings from the mineral processing facility are disposed of on the PPM tailings storage
facility on the farm Witkleifontein 136JP. Services and infrastructure exist to support the mining and mineral
processing activities.
The main objective of the noise specialist study was to determine the potential impact on the acoustic
environment and noise sensitive receptors (NSRs) as a result of the development of the project and recommend
suitable management and mitigation measures. To meet the above objective, the following tasks were included
in the Scope of Work (SoW):
1. A review of available technical project information.
2. A review of the legal requirements and applicable environmental noise guidelines.
3. A study of the receiving (baseline) acoustic environment, including:
a. The identification of NSRs from available maps and field observations;
b. A study of environmental noise attenuation potential by referring to available weather records,
land use and topography data sources; and
c. Determining representative baseline noise levels through the analysis of sampled
environmental noise levels obtained from surveys conducted in 13th and 14th October 2015.
4. An impact assessment, including:
a. The establishment of a source inventory for proposed activities.
b. Noise propagation simulations to determine environmental noise levels as a result of the
project.
c. The screening of simulated noise levels against environmental noise criteria.
5. The identification and recommendation of suitable mitigation measures and monitoring requirements.
6. The preparation of a comprehensive specialist noise impact assessment report.
In the assessment of simulated noise levels, reference was made to the South African National Standard (SANS)
10103 guidelines and the International Finance Corporation (IFC) guidelines.
The baseline acoustic environment was described in terms of the location of NSRs, the ability of the environment
to attenuate noise over long distances, as well as existing background and baseline noise levels. The following
was found:
The closest NSRs include the Black Rhino Game Reserve to the south and residential areas of
Mothabe to the north, Ngweding to the north east and Legkraal to the south east.
Atmospheric conditions are more conducive to noise attenuation during the day.
There are no natural terrain features that would provide acoustic shielding to the closest receptors.

Noise Specialist Study for the Pilanesberg Platinum Mine Plant Expansion Project
Report Number: 16SLR28N vi
Livestock, community activity, birds, insects and surrounding mining activities are the main contributors
to the acoustic environment of the area.
Noise from the project were calculated using default noise “emission factors” for heavy industrial, light industrial
and commercial areas, developed by the European Commission’s (EC) Working Group for the Assessment of
Exposure to Noise (WG-AEN) for their Good Practice Guide for Strategic Noise Mapping and the Production of
Associated Data on Noise Exposure (EC WG-AEN, 2006). The EC recommends using these factors when
information for a detailed source inventory is not available.
The source inventory, local meteorological conditions and information on local land use were used to populate
the noise propagation model (CadnaA, ISO 9613). The propagation of noise was calculated over an area of 11.3
km east-west by 11.1 km north-south. The area was divided into a grid matrix with a 20-m resolution and NSRs
were included as discrete receptors.
The main findings of the impact assessment are:
The noise levels from the project operations do not exceed the selected noise criteria at any of the
NSRs.
Construction and closure phase impacts are expected to me similar or slightly lower than simulated
noise impacts of the operational phase.
Based on the findings of the assessment, it is the specialist opinion that the project may be authorised.
Noise Specialist Study for the Pilanesberg Platinum Mine Plant Expansion Project
Report Number: 16SLR28N vii
Table of Contents
1 INTRODUCTION ................................................................................................................................................. 1
1.1 Study Objective ..................................................................................................................................... 1
1.2 Scope of Work ....................................................................................................................................... 3
1.3 Specialist Details ................................................................................................................................... 3
1.4 Description of Activities from a Noise Perspective ................................................................................ 4
1.5 Background to Environmental Noise and the Assessment Thereof ....................................................... 5
1.6 Approach and Methodology ................................................................................................................... 9
1.7 Limitations and Assumptions ............................................................................................................... 14
2 LEGAL REQUIREMENTS AND NOISE LEVEL GUIDELINES ................................................................................... 15
2.1 South African National Standards ........................................................................................................ 15
2.2 International Finance Corporation Guidelines on Environmental Noise .............................................. 16
2.3 Criteria Applied in This Assessment .................................................................................................... 16
3 DESCRIPTION OF THE RECEIVING ENVIRONMENT ............................................................................................. 17
3.1 Noise Sensitive Receptors .................................................................................................................. 17
3.2 Environmental Noise Propagation and Attenuation potential............................................................... 18
3.3 Baseline Noise Survey and Results..................................................................................................... 19
4 IMPACT ASSESSMENT .................................................................................................................................... 21
4.1 Noise Sources and Sound Power Levels ............................................................................................ 21
4.2 Noise Propagation and Simulated Noise Levels .................................................................................. 23
5 MANAGEMENT MEASURES ............................................................................................................................. 24
6 IMPACT SIGNIFICANCE RATING ....................................................................................................................... 25
7 CONCLUSION ................................................................................................................................................. 26
8 REFERENCES ................................................................................................................................................. 27
APPENDIX A – SPECIALIST CURRICULUM VITAE ....................................................................................................... 28
APPENDIX B – FIELDWORK LOG SHEETS ................................................................................................................. 34

Noise Specialist Study for the Pilanesberg Platinum Mine Plant Expansion Project
Report Number: 16SLR28N viii
List of Tables
Table 1: Sound level meter details ........................................................................................................................ 10
Table 2: Level differences for the presence of a tonal component ........................................................................ 11
Table 3: Typical rating levels for outdoor noise ..................................................................................................... 15
Table 4: IFC noise level guidelines ....................................................................................................................... 16
Table 5: Noise source inventory for the project ..................................................................................................... 21
Table 6: Octave band frequency spectra LW’s....................................................................................................... 22
Table 7: Summary of simulated noise levels (provided as dBA) due to the project and baseline noise
measurements at NSR within the study area ........................................................................................................ 23
Table 8: Significance rating for all phases due to unmitigated operations ............................................................ 25
Noise Specialist Study for the Pilanesberg Platinum Mine Plant Expansion Project
Report Number: 16SLR28N ix
List of Figures
Figure 1: Location of Plant Expansion Infrastructure (SLR, 2015) .......................................................................... 2
Figure 2: The decibel scale and typical noise levels (Brüel & Kjær Sound & Vibration Measurement A/S, 2000) .. 6
Figure 3: A-weighting curve .................................................................................................................................... 7
Figure 4: Study area, project location, and the location of NSRs .......................................................................... 17
Figure 5: Day- and night-time wind field (2013 to 2015) ....................................................................................... 18
Figure 6: Day-time survey broadband results ....................................................................................................... 20
Figure 7: Night-time survey broadband results ..................................................................................................... 20
Figure 8: Log sheet for Site 1 ................................................................................................................................ 34
Figure 9: Log sheet for Site 2 ................................................................................................................................ 35
Figure 10: Log sheet for Site 3 .............................................................................................................................. 36
Figure 11: Log sheet for Site 4 .............................................................................................................................. 37

Noise Specialist Study for the Pilanesberg Platinum Mine Plant Expansion Project
Report Number: 16SLR28N 1
1 Introduction
Airshed Planning Professionals (Pty) Ltd (Airshed) was appointed by SLR Consulting (South Africa) (Pty) Ltd. to
conduct a Noise Impact Assessment (NIA) for the proposed plant expansion at the Pilanesberg Platinum Mines
(PPM) (hereafter referred to as the project). Current operations at the PPM include open pit mining on the farm
Tuschenkomst 135JP. Ore from the open pit operations is transported to the existing mineral processing facility
located on the farms Witkleifontein 136JP and Tuschenkomst 136JP for processing. Waste rock is stockpiled on
waste rock dumps. Tailings from the mineral processing facility are disposed of on the PPM tailings storage
facility on the farm Witkleifontein 136JP. Services and infrastructure exist to support the mining and mineral
processing activities.
PPM proposes to expand the existing mineral processing facilities to incorporate:
a hydrometallurgical plant for the extraction of PGMs and base metals;
a UG2 milling and flotation circuit to process ore from the Sedibelo Platinum Mine (SPM) operation.
In addition, the following is planned:
upgrading of the existing sewage treatment plant; and
relocation of the waste storage and handling facility from inside the plant to an area outside the plant.
Furthermore, a number of community-based initiatives have been established at the mine. These have been
included in this report at the request of the DMR. They include:
an aggregate crusher and brick making project;
nursery;
vegetable garden and composting area;
car wash.
1.1 Study Objective
The main objective of the noise specialist study was to determine the potential impact on the acoustic
environment and noise sensitive receptors (NSRs) as a result of the project and recommend suitable
management and mitigation measures.

Noise Specialist Study for the Pilanesberg Platinum Mine Plant Expansion Project
Report Number: 16SLR28N 2
Figure 1: Location of Plant Expansion Infrastructure

Noise Specialist Study for the Pilanesberg Platinum Mine Plant Expansion Project
Report Number: 16SLR28N 3
1.2 Scope of Work
To meet the above objective, the following tasks were included in the Scope of Work (SoW):
1. A review of available technical project information.
2. A review of the legal requirements and applicable environmental noise guidelines.
3. A study of the receiving (baseline) acoustic environment, including:
a. The identification of NSRs from available maps and field observations;
b. A study of environmental noise attenuation potential by referring to available weather records,
land use and topography data sources; and
c. Determining representative baseline noise levels through the analysis of sampled
environmental noise levels obtained from surveys conducted in 13th and 14th October 2015.
4. An impact assessment, including:
a. The establishment of a source inventory for proposed activities.
b. Noise propagation simulations to determine environmental noise levels as a result of the
project.
c. The screening of simulated noise levels against environmental noise criteria.
5. The identification and recommendation of suitable mitigation measures and monitoring requirements.
6. The preparation of a comprehensive specialist noise impact assessment report.
1.3 Specialist Details
1.3.1 Specialist Details
Airshed is an independent consulting firm with no interest in the project other than to fulfil the contract between
the client and the consultant for delivery of specialised services as stipulated in the terms of reference.
1.3.2 Competency Profile of Specialist
Reneé von Gruenewaldt is a Registered Professional Natural Scientist (Registration Number 400304/07) with the
South African Council for Natural Scientific Professions (SACNASP) and a member of the National Association
for Clean Air (NACA).
Following the completion of her bachelor’s degree in atmospheric sciences in 2000 and honours degree (with
distinction) with specialisation in Environmental Analysis and Management in 2001 at the University of Pretoria,
her experience in air pollution started when she joined Environmental Management Services (now Airshed
Planning Professionals) in 2002. Reneé von Gruenewaldt later completed her Master’s Degree (with distinction)
in Meteorology at the University of Pretoria in 2009.
Reneé von Gruenewaldt became partner of Airshed Planning Professionals in September 2006. Airshed
Planning Professionals is a technical and scientific consultancy providing scientific, engineering and strategic air
pollution impact assessment and management services and policy support to assist clients in addressing a wide
variety of air pollution related risks and air quality management challenges.

Noise Specialist Study for the Pilanesberg Platinum Mine Plant Expansion Project
Report Number: 16SLR28N 4
She has extensive experience on the various components of air quality management including emissions
quantification for a range of source types, simulations using a range of dispersion models, impacts assessment
and health risk screening assessments. Reneé has been the principal air quality specialist and manager on
several Air Quality Impact Assessment between 2006 to present and Noise Assessment projects between 2015
and present and her project experience range over various countries in Africa, providing her with an inclusive
knowledge base of international legislation and requirements pertaining to air quality.
A comprehensive curriculum vitae of Reneé von Gruenewaldt is provided in Appendix A.
1.4 Description of Activities from a Noise Perspective
PPM proposes to expand the existing mineral processing facilities to incorporate:
a hydrometallurgical plant for the extraction of PGMs and base metals;
a UG2 milling and flotation circuit to process ore from the Sedibelo Platinum Mine (SPM) operation.
In addition, the following is planned:
upgrading of the existing sewage treatment plant; and
relocation of the waste storage and handling facility from inside the plant to an area outside the plant.
Furthermore, a number of community-based initiatives have been established at the mine. They include:
an aggregate crusher and brick making project;
nursery;
vegetable garden and composting area;
car wash.
The project consists of components that are added to the existing plant. The project components are similar to
those that already exist on site.
Construction phase activities will include bulk earthworks (for the establishment of the processing plant and
infrastructure), as well as metal and concrete works for the erection of the processing plant and other
infrastructure. Access to site will be via the main access road.
Sound fields in an industrial setting such as an operational ore processing plant, are usually complex due to the
participation of many sources: propagation through air (air-borne noise), propagation through solids (structure-
borne noise), diffraction at the machinery boundaries, reflection from the floor, wall, ceiling and machinery
surface, absorption on the surfaces, etc. High noise levels can therefore be present near operating machinery.
The project components will include conveyors; electric motors; fans; pumps, piping etc. For a given machine,
the sound pressure levels depend on the part of the total mechanical or electrical energy that is transformed into
acoustical energy. Piping and pumping noise associated with tailings disposal are usually very localised and not
considered significant.

Noise Specialist Study for the Pilanesberg Platinum Mine Plant Expansion Project
Report Number: 16SLR28N 5
Decommissioning for this project would fall within the overall decommissioning of the plant and involve the same
activities of dismantling and removal of equipment, demolishing building structures, removal of related waste
from the site, etc. Very little information regarding the decommissioning phase was available for consideration,
from a noise perspective it is however likely to be similar in character and impact to the construction phase.
1.5 Background to Environmental Noise and the Assessment Thereof
Before more details regarding the approach and methodology adopted in the assessment is given, the reader is
provided with some background, definitions and conventions used in the measurement, calculation and
assessment of environmental noise.
Noise is generally defined as unwanted sound transmitted through a compressible medium such as air. Sound in
turn, is defined as any pressure variation that the ear can detect. Human response to noise is complex and
highly variable as it is subjective rather than objective.
A direct application of linear scales (in pascal (Pa)) to the measurement and calculation of sound pressure leads
to large and unwieldy numbers. And, as the ear responds logarithmically rather than linearly to stimuli, it is more
practical to express acoustic parameters as a logarithmic ratio of the measured value to a reference value. This
logarithmic ratio is called a decibel or dB. The advantage of using dB can be clearly seen in Figure 2. Here, the
linear scale with its large numbers is converted into a manageable scale from 0 dB at the threshold of hearing
(20 micro-pascals (μPa)) to 130 dB at the threshold of pain (~100 Pa) (Brüel & Kjær Sound & Vibration
Measurement A/S, 2000).
As explained, noise is reported in dB. “dB” is the descriptor that is used to indicate 10 times a logarithmic ratio of
quantities that have the same units, in this case sound pressure. The relationship between sound pressure and
sound pressure level is illustrated in this equation.
𝐿𝑝 = 20 ∙ log10 (𝑝
𝑝𝑟𝑒𝑓)
Where:
Lp is the sound pressure level in dB;
p is the actual sound pressure in Pa; and
pref is the reference sound pressure (pref in air is 20 µPa).

Noise Specialist Study for the Pilanesberg Platinum Mine Plant Expansion Project
Report Number: 16SLR28N 6
Figure 2: The decibel scale and typical noise levels (Brüel & Kjær Sound & Vibration Measurement A/S, 2000)
1.5.1 Perception of Sound
Sound has already been defined as any pressure variation that can be detected by the human ear. The number
of pressure variations per second is referred to as the frequency of sound and is measured in hertz (Hz). The
hearing frequency of a young, healthy person ranges between 20 Hz and 20 000 Hz.
In terms of LP, audible sound ranges from the threshold of hearing at 0 dB to the pain threshold of 130 dB and
above. Even though an increase in sound pressure level of 6 dB represents a doubling in sound pressure, an
increase of 8 to 10 dB is required before the sound subjectively appears to be significantly louder. Similarly, the
smallest perceptible change is about 1 dB (Brüel & Kjær Sound & Vibration Measurement A/S, 2000).
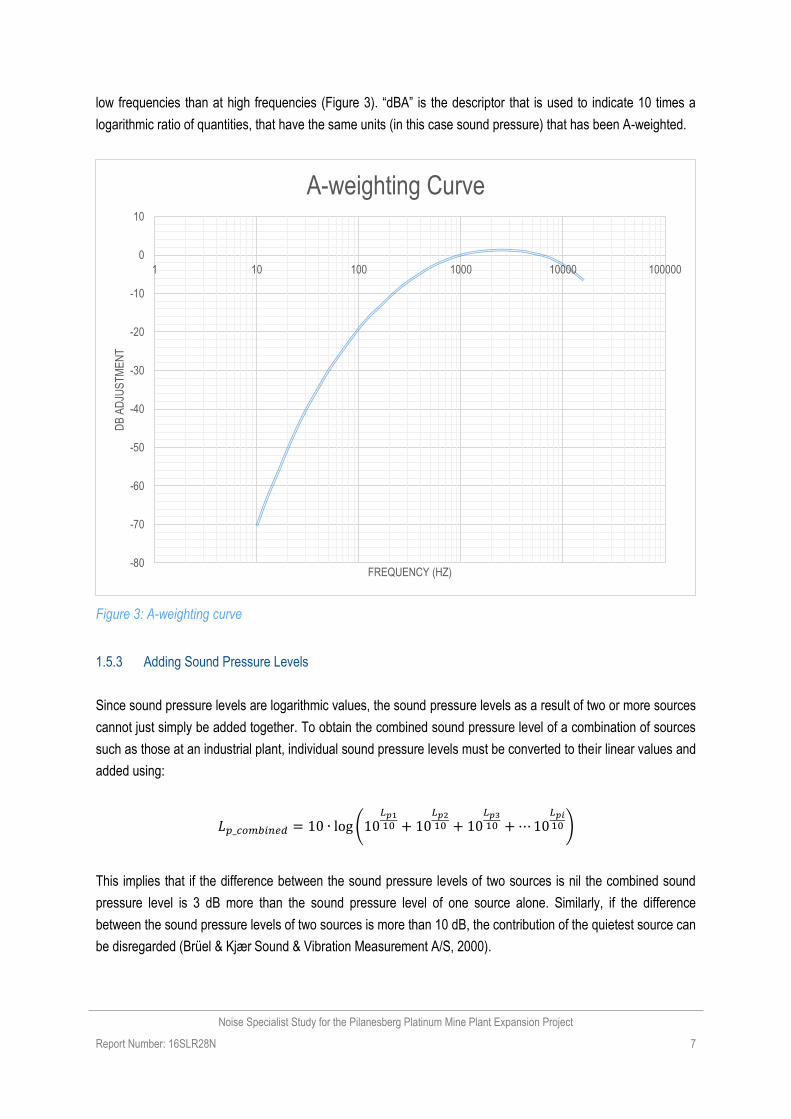
1.5.2 Frequency Weighting
Since human hearing is not equally sensitive to all frequencies, a ‘filter’ has been developed to simulate human
hearing. The ‘A-weighting’ filter simulates the human hearing characteristic, which is less sensitive to sounds at
Noise Specialist Study for the Pilanesberg Platinum Mine Plant Expansion Project
Report Number: 16SLR28N 7
low frequencies than at high frequencies (Figure 3). “dBA” is the descriptor that is used to indicate 10 times a
logarithmic ratio of quantities, that have the same units (in this case sound pressure) that has been A-weighted.
Figure 3: A-weighting curve
1.5.3 Adding Sound Pressure Levels
Since sound pressure levels are logarithmic values, the sound pressure levels as a result of two or more sources
cannot just simply be added together. To obtain the combined sound pressure level of a combination of sources
such as those at an industrial plant, individual sound pressure levels must be converted to their linear values and
added using:
𝐿𝑝_𝑐𝑜𝑚𝑏𝑖𝑛𝑒𝑑 = 10 ∙ log (10𝐿𝑝110 + 10
𝐿𝑝210 + 10
𝐿𝑝310 +⋯10
𝐿𝑝𝑖10)
This implies that if the difference between the sound pressure levels of two sources is nil the combined sound
pressure level is 3 dB more than the sound pressure level of one source alone. Similarly, if the difference
between the sound pressure levels of two sources is more than 10 dB, the contribution of the quietest source can
be disregarded (Brüel & Kjær Sound & Vibration Measurement A/S, 2000).
-80
-70
-60
-50
-40
-30
-20
-10
0
10
1 10 100 1000 10000 100000
DB
AD
JUS
TM
EN
T
FREQUENCY (HZ)
A-weighting Curve
Noise Specialist Study for the Pilanesberg Platinum Mine Plant Expansion Project
Report Number: 16SLR28N 8
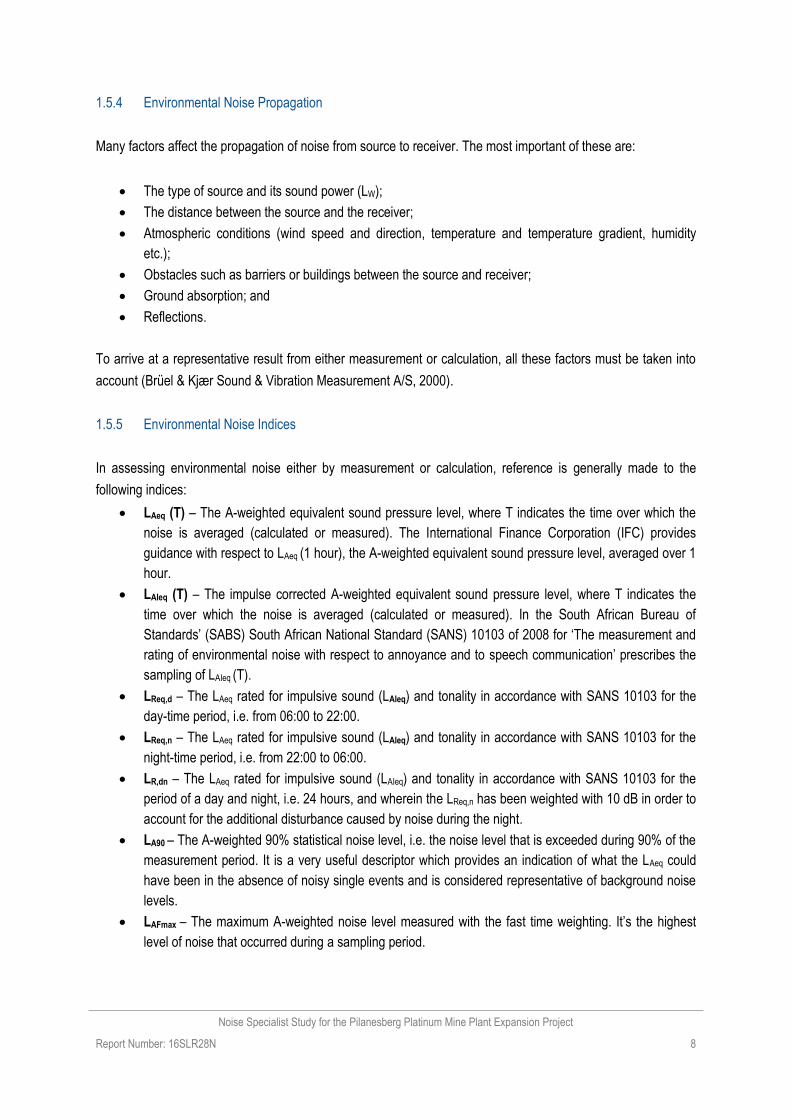
1.5.4 Environmental Noise Propagation
Many factors affect the propagation of noise from source to receiver. The most important of these are:
The type of source and its sound power (LW);
The distance between the source and the receiver;
Atmospheric conditions (wind speed and direction, temperature and temperature gradient, humidity
etc.);
Obstacles such as barriers or buildings between the source and receiver;
Ground absorption; and
Reflections.
To arrive at a representative result from either measurement or calculation, all these factors must be taken into
account (Brüel & Kjær Sound & Vibration Measurement A/S, 2000).
1.5.5 Environmental Noise Indices
In assessing environmental noise either by measurement or calculation, reference is generally made to the
following indices:
LAeq (T) – The A-weighted equivalent sound pressure level, where T indicates the time over which the
noise is averaged (calculated or measured). The International Finance Corporation (IFC) provides
guidance with respect to LAeq (1 hour), the A-weighted equivalent sound pressure level, averaged over 1
hour.
LAIeq (T) – The impulse corrected A-weighted equivalent sound pressure level, where T indicates the
time over which the noise is averaged (calculated or measured). In the South African Bureau of
Standards’ (SABS) South African National Standard (SANS) 10103 of 2008 for ‘The measurement and
rating of environmental noise with respect to annoyance and to speech communication’ prescribes the
sampling of LAIeq (T).
LReq,d – The LAeq rated for impulsive sound (LAIeq) and tonality in accordance with SANS 10103 for the
day-time period, i.e. from 06:00 to 22:00.
LReq,n – The LAeq rated for impulsive sound (LAIeq) and tonality in accordance with SANS 10103 for the
night-time period, i.e. from 22:00 to 06:00.
LR,dn – The LAeq rated for impulsive sound (LAIeq) and tonality in accordance with SANS 10103 for the
period of a day and night, i.e. 24 hours, and wherein the LReq,n has been weighted with 10 dB in order to
account for the additional disturbance caused by noise during the night.
LA90 – The A-weighted 90% statistical noise level, i.e. the noise level that is exceeded during 90% of the
measurement period. It is a very useful descriptor which provides an indication of what the LAeq could
have been in the absence of noisy single events and is considered representative of background noise
levels.
LAFmax – The maximum A-weighted noise level measured with the fast time weighting. It’s the highest
level of noise that occurred during a sampling period.

Noise Specialist Study for the Pilanesberg Platinum Mine Plant Expansion Project
Report Number: 16SLR28N 9
1.6 Approach and Methodology
The assessment included a study of the legal requirements pertaining to environmental noise impacts, a study of
the physical environment of the area surrounding the project and the analyses of existing noise levels in the
area. The impact assessment focused on the estimation of sound power levels (LW’s) (noise ‘emissions’) and
sound pressure levels (LP’s) (noise impacts) associated with the operational phase. The findings of the
assessment components informed recommendations of management measures, including mitigation and
monitoring. Individual aspects of the noise impact assessment methodology are discussed in more detail below.
1.6.1 Information Review
An information requirements list was submitted to SLR Consulting at the onset of the project. In response to the
request, the following information was supplied:
Project and site layout maps; and
A basic process description.
1.6.2 Review of Assessment Criteria
In South Africa, provision is made for the regulation of noise under the National Environmental Management Air
Quality Act (NEMAQA) (Act. 39 of 2004) but environmental noise limits have yet to be set. It is believed that
when published, national criteria will make extensive reference to SANS 10103 of 2008 ‘The measurement and
rating of environmental noise with respect to annoyance and to speech communication’. This standard has been
widely applied in South Africa and is frequently used by local authorities when investigating noise complaints.
These guidelines, which are in line with those published by the IFC in their General EHS Guidelines and World
Health Organisation (WHO) Guidelines for Community Noise, were considered in the assessment.
1.6.3 Study of the Receiving Environment
NSRs generally include private residences, community buildings such as schools, hospitals and any publicly
accessible areas outside an industrial facility’s property. Homesteads and residential areas which were included
in the assessment as NSRs were identified from available maps and satellite imagery and confirmed during the
site visit conducted.
The ability of the environment to attenuate noise as it travels through the air was studied by considering local
meteorology, land use and terrain. Atmospheric attenuation potential was described based on MM5
meteorological data for the period 2013 to 2015. Data from this time period is still considered relevant to the
study as the meteorological conditions within the study area have not shown any significant historical changes.
Readily available terrain data was obtained from the United States Geological Survey (USGS) web site
(https://earthexplorer.usgs.gov/). A study was made of Shuttle Radar Topography Mission (STRM) 1 arc-sec
data.

Noise Specialist Study for the Pilanesberg Platinum Mine Plant Expansion Project
Report Number: 16SLR28N 10
1.6.4 Noise Survey
The extent of noise impacts as a result of an intruding noise depends largely on existing noise levels in an area.
Higher ambient noise levels will result in less noticeable noise impacts and a smaller impact area. The opposite
also holds true. Increases in noise will be more noticeable in areas with low ambient noise levels. The data from
a baseline noise surveys conducted on 13 and 14 October 2015 was studied to determine current noise levels
within the area. The mine and plant as well as the community-based aggregate and brick-making projects were
active at the mine at the time of the sampling.
The survey methodology, which closely followed guidance provided by the IFC (2007) and SANS 10103 (2008),
is summarised below:
The survey was designed and conducted by a trained specialist.
Sampling was carried out using a Type 1 sound level meter (SLM) that meet all appropriate
International Electrotechnical Commission (IEC) standards and is subject to calibration by an accredited
laboratory. Equipment details are included in Table 1.
The acoustic sensitivity of the SLM was tested with a portable acoustic calibrator before and after each
sampling session.
Samples, 20 minutes in duration, representative and sufficient for statistical analysis were taken with the
use of the portable SLM capable of logging data continuously over the sampling time period. Samples
representative of the day- and night-time acoustic environment were taken. SANS 10103 defines day-
time as between 06:00 and 22:00 and night-time between 22:00 and 06:00 (SANS 10103, 2008).
LAIeq (T), LAeq (T); LAFmax; LAFmin; L90 and 3rd octave frequency spectra were recorded.
The SLM was located approximately 1.5 m above the ground and no closer than 3 m to any reflecting
surface.
SANS 10103 states that one must ensure (as far as possible) that the measurements are not affected
by the residual noise and extraneous influences, e.g. wind, electrical interference and any other non-
acoustic interference, and that the instrument is operated under the conditions specified by the
manufacturer.
A detailed log and record were kept. Records included site details, weather conditions during sampling
and observations made regarding the acoustic environment of each site.
Table 1: Sound level meter details
Equipment Serial Number Purpose
Brüel & Kjær Type 2250 Lite SLM S/N 2731851 Attended 20-minute sampling.
Brüel & Kjær Type 4950 ½” Pre-polarized microphone
S/N 2709293 Attended 20-minute sampling.
SVANTEK SV33 Class 1 Acoustic Calibrator
S/N 57649 Testing of the acoustic sensitivity
before and after each daily sampling session.
Kestrel 4000 Pocket Weather Tracker S/N 559432 Determining wind speed, temperature
and humidity during sampling.

Noise Specialist Study for the Pilanesberg Platinum Mine Plant Expansion Project
Report Number: 16SLR28N 11
SANS 10103 (2008) prescribes the method for the calculation of the equivalent continuous rating level (LReq,T)
from measurement data. LReq,T is the equivalent continuous A-weighted sound pressure level (LAeq,T) during a
specified time interval, plus specified adjustments for tonal character, impulsiveness of the sound and the time of
day; and derived from the applicable equation:
𝐿𝑅𝑒𝑞,𝑇 = 𝐿𝐴𝑒𝑞,𝑇 + 𝐶𝑖 + 𝐶𝑡 + 𝐾𝑛
Where
LReq,T is the equivalent continuous rating level;
LAeq,T is the equivalent continuous A-weighted sound pressure level, in decibels;
Ci is the impulse correction;
Ct is the correction for tonal character; and
Kn is the adjustment for the time of day (or night), 0 dB for daytime and +10 dB for night-time.
Instrumentation used in this survey are capable of integrating while using the I-time (impulse) weighting and
LAIeq,T directly measured. When using LAIeq,T, only the tonal character correction and time of day adjustment need
to be applied to derive LReq,T. For this assessment, the LReq,T was conservatively assumed from the LAeq,T.
If audible tones such as whines, whistles, hums, and music, are present as determined by the procedure given
hereafter (e.g. if the noise contains discernible pitch), then Ct = +5 dBA may be used. If audible tones are not
present, then Ct = 0 should be used.
The presence of tones can be determined as follows (SANS 10103, 2008): Using a one-third octave band filter,
which complies with the requirements of IEC 61260, the time average sound pressure level in the one-third
octave band that contains the tone to be investigated as well as the time average one-third octave band sound
pressure level in the adjacent bands to the one that contains the tone frequency should be measured. The
difference between the time average sound pressure levels in the two adjacent one-third octave bands should be
determined with the time average sound pressure level of the one-third octave band that contains the tone
frequency. A level difference between the one-third octave band that contains the tone frequency and the two
adjacent one-third octave bands should exceed the limits given in Table 2 to indicate the presence of a tonal
component.
NOTE: the adjustment for tonality was not applied for this assessment.
Table 2: Level differences for the presence of a tonal component
Centre frequencies of 3rd octave bands (Hz) Minimum 3rd octave band LP difference (dB)
25 to 125 15
160 to 400 8
500 to 10 000 5
The equivalent continuous day/night rating level can be calculated using the following equation:

Noise Specialist Study for the Pilanesberg Platinum Mine Plant Expansion Project
Report Number: 16SLR28N 12
𝐿𝑅,𝑑𝑛 = ⌊(𝑑
24)10𝐿𝑅𝑒𝑞,𝑑 10⁄ + (
24 − 𝑑
24) 10(𝐿𝑅𝑒𝑞,𝑛+𝑘𝑛) 10⁄ ⌋
Where
LR,dn is the equivalent continuous day/night rating level;
D is the duration of the day-time reference time period (06:00 to 22:00);
LReq,d is the equivalent continuous rating level determined for the day-time reference time period (06:00
to 22:00);
LReq,n is the equivalent continuous rating level determined for the night-time reference time period (22:00
to 06:00); and
Kn is the adjustment 10 dB that should be added to the night-time equivalent continuous rating level.
1.6.5 Source Inventory
As detailed information on the equipment for the expansion was not available, source noise levels were
calculated using default noise “emission factors” for heavy industrial, light industrial and commercial areas,
developed by the European Commission’s (EC) Working Group for the Assessment of Exposure to Noise (WG-
AEN) for their Good Practice Guide for Strategic Noise Mapping and the Production of Associated Data on Noise
Exposure (EC WG-AEN, 2006). The EC recommends using these factors when information for a detailed source
inventory is not available.
1.6.6 Noise Propagation Simulations
The propagation of noise from proposed activities was simulated with the DataKustic CadnaA software. Use was
made of the International Organisation for Standardization’s (ISO) 9613 module for outdoor noise propagation
from industrial noise sources.
1.6.6.1 ISO 9613
ISO 9613 specifies an engineering method for calculating the attenuation of sound during propagation outdoors
in order to predict the levels of environmental noise at a distance from a variety of sources. The method predicts
the equivalent continuous Α-weighted sound pressure level under meteorological conditions favourable to
propagation from sources of known sound emission. These conditions are for downwind propagation or,
equivalently, propagation under a well-developed moderate ground-based temperature inversion, such as
commonly occurs at night.
The method also predicts an average A-weighted sound pressure level. The average A-weighted sound pressure
level encompasses levels for a wide variety of meteorological conditions. The method specified in ISO 9613
consists specifically of octave-band algorithms (with nominal midband frequencies from 63 Hz to 8 kHz) for
calculating the attenuation of sound which originates from a point sound source, or an assembly of point sources.
The source (or sources) may be moving or stationary. Specific terms are provided in the algorithms for the
Noise Specialist Study for the Pilanesberg Platinum Mine Plant Expansion Project
Report Number: 16SLR28N 13
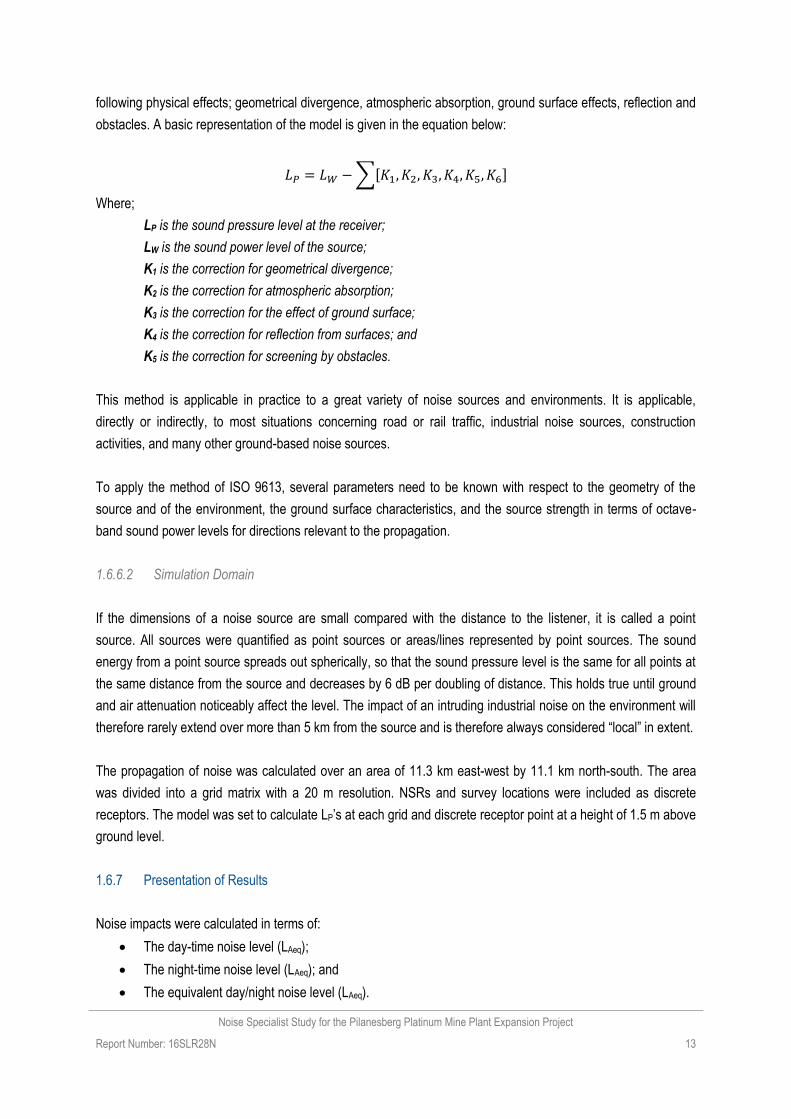
following physical effects; geometrical divergence, atmospheric absorption, ground surface effects, reflection and
obstacles. A basic representation of the model is given in the equation below:
𝐿𝑃 = 𝐿𝑊 −∑[𝐾1, 𝐾2, 𝐾3, 𝐾4, 𝐾5, 𝐾6]
Where;
LP is the sound pressure level at the receiver;
LW is the sound power level of the source;
K1 is the correction for geometrical divergence;
K2 is the correction for atmospheric absorption;
K3 is the correction for the effect of ground surface;
K4 is the correction for reflection from surfaces; and
K5 is the correction for screening by obstacles.
This method is applicable in practice to a great variety of noise sources and environments. It is applicable,
directly or indirectly, to most situations concerning road or rail traffic, industrial noise sources, construction
activities, and many other ground-based noise sources.
To apply the method of ISO 9613, several parameters need to be known with respect to the geometry of the
source and of the environment, the ground surface characteristics, and the source strength in terms of octave-
band sound power levels for directions relevant to the propagation.
1.6.6.2 Simulation Domain
If the dimensions of a noise source are small compared with the distance to the listener, it is called a point
source. All sources were quantified as point sources or areas/lines represented by point sources. The sound
energy from a point source spreads out spherically, so that the sound pressure level is the same for all points at
the same distance from the source and decreases by 6 dB per doubling of distance. This holds true until ground
and air attenuation noticeably affect the level. The impact of an intruding industrial noise on the environment will
therefore rarely extend over more than 5 km from the source and is therefore always considered “local” in extent.
The propagation of noise was calculated over an area of 11.3 km east-west by 11.1 km north-south. The area
was divided into a grid matrix with a 20 m resolution. NSRs and survey locations were included as discrete
receptors. The model was set to calculate LP’s at each grid and discrete receptor point at a height of 1.5 m above
ground level.
1.6.7 Presentation of Results
Noise impacts were calculated in terms of:
The day-time noise level (LAeq);
The night-time noise level (LAeq); and
The equivalent day/night noise level (LAeq).

Noise Specialist Study for the Pilanesberg Platinum Mine Plant Expansion Project
Report Number: 16SLR28N 14
Results are presented in table form at the NSRs within the modelling domain. Simulated noise levels were
assessed according to guidelines published in SANS 10103 and by the IFC. To assess annoyance at nearby
places of residence, the increase in noise levels above the baseline at NSRs were calculated and compared to
guidelines published in SANS 10103.
1.6.8 Recommendations of Management and Mitigation
The findings of the noise specialist study informed the recommendation of suitable noise management and
mitigation measures.
1.6.9 Impact Significance Assessment
The significance of environmental noise impacts was assessed according to the methodology adopted by SLR
Consulting and considered both an unmitigated and mitigated scenario.
1.7 Limitations and Assumptions
The following limitations and assumptions should be noted:
Estimates of sound power levels were limited to default noise “emission factors” for heavy industrial,
light industrial and commercial areas, developed by the European Commission’s (EC) Working Group
for the Assessment of Exposure to Noise (WG-AEN) for their Good Practice Guide for Strategic Noise
Mapping and the Production of Associated Data on Noise Exposure (EC WG-AEN, 2006). These default
noise levels were used in the absence of detailed source inventory.
All activities were assumed to be 24 hours per day, 7 days per week.
Although other existing sources of noise within the area were identified (such as existing mining
activities, community noise form residential areas, etc.), such sources were not quantified but were
taken into account during the survey.

Noise Specialist Study for the Pilanesberg Platinum Mine Plant Expansion Project
Report Number: 16SLR28N 15
2 Legal Requirements and Noise Level Guidelines
2.1 South African National Standards
SANS 10103 (2008) successfully addresses the manner in which environmental noise measurements are to be
taken and assessed in South Africa, and is fully aligned with the WHO guidelines for Community Noise (WHO,
1999). It should be noted that the values given in Table 3 are typical rating levels that it is recommended should
not be exceeded outdoors in the different districts specified. Outdoor ambient noise exceeding these levels will
be annoying to the community.
Table 3: Typical rating levels for outdoor noise
Type of district
Equivalent Continuous Rating Level (LReq,T) for Outdoor Noise
Day/night
LR,dn(c) (dBA)
Day-time
LReq,d(a) (dBA)
Night-time
LReq,n(b) (dBA)
Rural districts 45 45 35
Suburban districts with little road traffic 50 50 40
Urban districts 55 55 45
Urban districts with one or more of the following; business premises; and main roads.
60 60 50
Central business districts 65 65 55
Industrial districts 70 70 60
Notes
(a) LReq,d =The LAeq rated for impulsive sound and tonality in accordance with SANS 10103 for the day-time period, i.e. from 06:00
to 22:00.
(b) LReq,n =The LAeq rated for impulsive sound and tonality in accordance with SANS 10103 for the night-time period, i.e. from 22:00
to 06:00.
(c) LR,dn =The LAeq rated for impulsive sound and tonality in accordance with SANS 10103 for the period of a day and night, i.e. 24
hours, and wherein the LReq,n has been weighted with 10dB in order to account for the additional disturbance caused by noise
during the night.
SANS 10103 also provides a useful guideline for estimating community response to an increase in the general
ambient noise level caused by intruding noise. If Δ is the increase in noise level, the following criteria are of
relevance:
“ 0 dB: There will be no community reaction;
0 dB < 10 dB: There will be ‘little’ reaction with ‘sporadic complaints’;
5 dB < 15 dB: There will be a ‘medium’ reaction with ‘widespread complaints’. = 10 dB is
subjectively perceived as a doubling in the loudness of the noise;
10 dB < 20 dB: There will be a ‘strong’ reaction with ‘threats of community action’; and
15 dB < : There will be a ‘very strong’ reaction with ‘vigorous community action’.
The categories of community response overlap because the response of a community does not occur as a
stepwise function, but rather as a gradual change.

Noise Specialist Study for the Pilanesberg Platinum Mine Plant Expansion Project
Report Number: 16SLR28N 16
2.2 International Finance Corporation Guidelines on Environmental Noise
The IFC General Environmental Health and Safety Guidelines on noise address impacts of noise beyond the
property boundary of the facility under consideration and provides noise level guidelines.
The IFC states that noise impacts should not exceed the levels presented in Table 4, or result in a maximum
increase above background levels of 3 dBA at the nearest receptor location off-site (IFC, 2007). For a person
with average hearing acuity an increase of less than 3 dBA in the general ambient noise level is not detectable.
= 3 dBA is, therefore, a useful significance indicator for a noise impact.
It is further important to note that the IFC noise level guidelines for residential, institutional and educational
receptors correspond with the SANS 10103 guidelines for urban districts.
Table 4: IFC noise level guidelines
Area One Hour LAeq (dBA)
07:00 to 22:00
One Hour LAeq (dBA)
22:00 to 07:00
Industrial receptors 70 70
Residential, institutional and educational receptors 55 45
2.3 Criteria Applied in This Assessment
Reference is made to the IFC noise level guidelines for residential receptors (which is in line with the SANS
10103 rating for urban districts) and the increase in noise levels of 3 dBA above background levels.

Noise Specialist Study for the Pilanesberg Platinum Mine Plant Expansion Project
Report Number: 16SLR28N 17
3 Description of the Receiving Environment
This chapter provides details of the receiving acoustic environment which is described in terms of:
Local NSRs;
The local environmental noise propagation and attenuation potential; and
Current noise levels and the existing acoustic climate.
3.1 Noise Sensitive Receptors
NSRs generally include places of residence and areas where members of the public may be affected by noise
generated by the project activities. There are several potentially sensitive receptors within the project area, the
closest of which lie adjacent to the project boundary. All identified potential NSRs within the study area are
shown in Figure 4.
Figure 4: Study area, project location, and the location of NSRs
Noise Specialist Study for the Pilanesberg Platinum Mine Plant Expansion Project
Report Number: 16SLR28N 18
3.2 Environmental Noise Propagation and Attenuation potential
3.2.1 Atmospheric Absorption and Meteorology
Atmospheric absorption and meteorological conditions have already been mentioned with regards to their role in
the propagation on noise from a source to receiver (Section 1.5.4). The main meteorological parameters
affecting the propagation of noise include wind speed, wind direction and temperature. These along with other
parameters such as relative humidity, air pressure, solar radiation and cloud cover affect the stability of the
atmosphere and the ability of the atmosphere to absorb sound energy. Use is made of MM5 data recorded for
the period 2013 to 2015.
Wind speed increases with altitude. This results in the ‘bending’ of the path of sound to ‘focus’ it on the downwind
side and creating a ‘shadow’ on the upwind side of the source. Depending on the wind speed, the downwind
level may increase by a few dB but the upwind level can drop by more than 20 dB (Brüel & Kjær Sound &
Vibration Measurement A/S, 2000). It should be noted that at wind speeds of more than 5 m/s, ambient noise
levels are mostly dominated by wind generated noise.
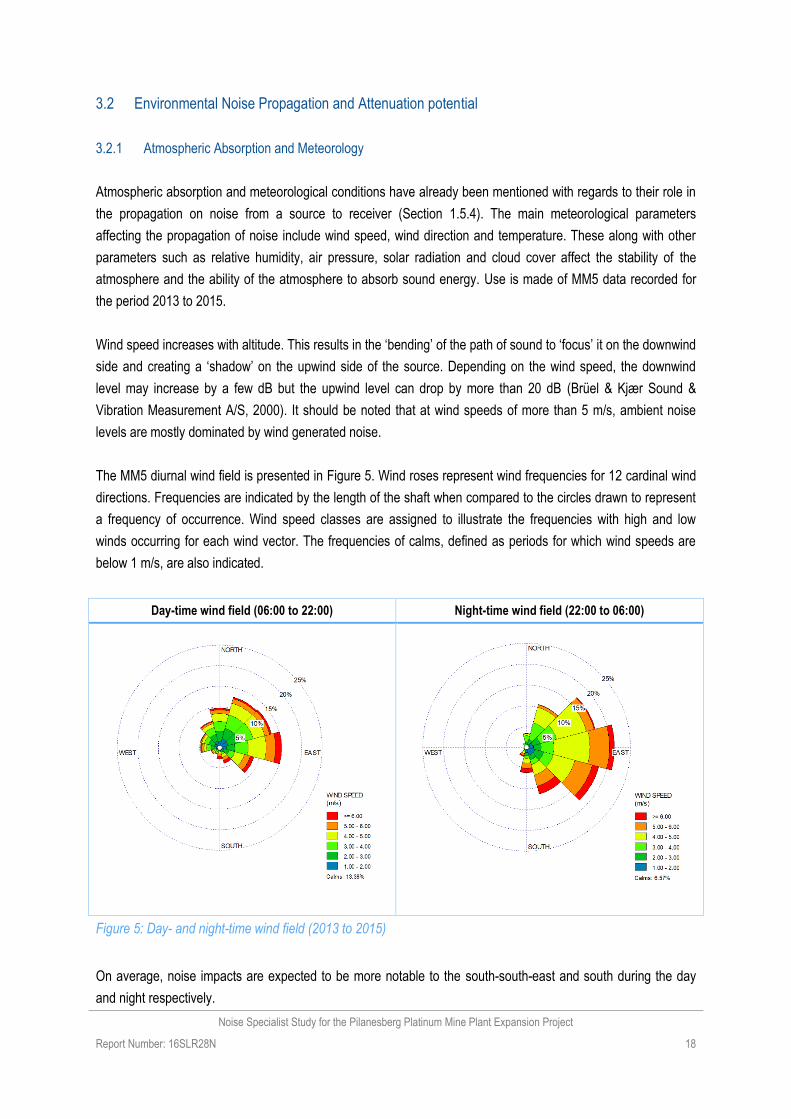
The MM5 diurnal wind field is presented in Figure 5. Wind roses represent wind frequencies for 12 cardinal wind
directions. Frequencies are indicated by the length of the shaft when compared to the circles drawn to represent
a frequency of occurrence. Wind speed classes are assigned to illustrate the frequencies with high and low
winds occurring for each wind vector. The frequencies of calms, defined as periods for which wind speeds are
below 1 m/s, are also indicated.
Day-time wind field (06:00 to 22:00) Night-time wind field (22:00 to 06:00)
Figure 5: Day- and night-time wind field (2013 to 2015)
On average, noise impacts are expected to be more notable to the south-south-east and south during the day
and night respectively.

Noise Specialist Study for the Pilanesberg Platinum Mine Plant Expansion Project
Report Number: 16SLR28N 19
Temperature gradients in the atmosphere create effects that are uniform in all directions from a source. On a
sunny day with no wind, temperature decreases with altitude and creates a ‘shadowing’ effect for sounds. On a
clear night, temperatures may increase with altitude thereby ‘focusing’ sound on the ground surface. Noise
impacts are therefore generally more notable during the night. CadnaA allows the input of the average
temperature and relative humidity. Use was made of 19°C and 60% in simulations, as obtained from the MM5
data set.
3.2.2 Terrain, Ground Absorption and Reflection
Noise reduction caused by a barrier (i.e. natural terrain, installed acoustic barrier, building) feature depends on
two factors namely the path difference of a sound wave as it travels over the barrier compared with direct
transmission to the receiver and the frequency content of the noise (Brüel & Kjær Sound & Vibration
Measurement A/S, 2000). Terrain data was included in the simulations.
Sound reflected by the ground interferes with the directly propagated sound. The effect of the ground is different
for acoustically hard (e.g., concrete or water), soft (e.g., grass, trees or vegetation) and mixed surfaces. Ground
attenuation is often calculated in frequency bands to take into account the frequency content of the noise source
and the type of ground between the source and the receiver (Brüel & Kjær Sound & Vibration Measurement A/S,
2000). Based on observations made during the visit to site, ground cover was found to be acoustically mixed,
that is, somewhat conducive to noise attenuation.
3.3 Baseline Noise Survey and Results
Day- and night-time noise measurements were conducted on 13 and 14 October 2015 at four locations shown in
Figure 4. No change to existing operations, to the specialist’s knowledge, has taken place from the time of the
survey to present. The baseline survey results should thus be representative of current levels. The Survey sites
were selected taking into consideration proposed activities, NSRs, accessibility and safety. Fieldwork log sheets
of the sampling sites and microphone placement are included in Appendix B.
It should be noted that the noise survey would capture all current noise sources in the area including the mining
activities of RMDC and community activities.
Recorded LA90, LAeq and LAIeq during the day and night are presented in Figure 6 and Figure 7 respectively.
During the day, the acoustic environment at all sites were influenced by birds and insects, some livestock (viz.
goats), and local community. During the night mining activities (specifically heavy mining vehicles) were audible
at Site 1 and Site 3.

Noise Specialist Study for the Pilanesberg Platinum Mine Plant Expansion Project
Report Number: 16SLR28N 20
Figure 6: Day-time survey broadband results
Figure 7: Night-time survey broadband results

Noise Specialist Study for the Pilanesberg Platinum Mine Plant Expansion Project
Report Number: 16SLR28N 21
4 Impact Assessment
The noise source inventory, noise propagation modelling and results are discussed in Section 4.1 and Section
4.2 respectively.
4.1 Noise Sources and Sound Power Levels
The complete source inventory for the project is included in Table 5. Octave band frequency spectra LW’s are
included in Table 6.
The reader is reminded of the non-linearity in the addition of LW’s. If the difference between the sound power
levels of two sources is nil the combined sound power level is 3 dB more than the sound pressure level of one
source alone. Similarly, if the difference between the sound power levels of two sources is more than 10 dB, the
contribution of the quietest source can be disregarded (Brüel & Kjær Sound & Vibration Measurement A/S,
2000).
Table 5: Noise source inventory for the project
Source Name Source type Equipment ID
Operating time, day and
night-time hours
LW (dB)
UG2 milling and flotation circuit Area HEAVYINDUSTRY 16 8 65
Hydrometallurgical plant Area HEAVYINDUSTRY 16 8 65
Support and services infrastructure Area LIGHTINDUSTRY 16 8 60
Aggregate crusher and brick making project
Area HEAVYINDUSTRY 16 8 65
Composting area, nursery, vegetable garden and car wash
Area LIGHTINDUSTRY 16 8 60

Noise Specialist Study for the Pilanesberg Platinum Mine Plant Expansion Project
Report Number: 16SLR28N 22
Table 6: Octave band frequency spectra LW’s
Equipment ID Equipment details Type
LW octave band frequency spectra (dB) LW
(dB) LWA
(dBA) Source
63 125 250 500 1000 2000 4000 8000
LIGHTINDUSTRY Default for Light Industry LW 26.8 36.9 44.4 49.8 53 54.2 54 51.9 60 62.5 EC WG-AEN (2006)
HEAVYINDUSTRY Default for Heavy Industry LW 31.8 41.9 49.4 54.8 58 59.2 59 56.9 65 67.5 EC WG-AEN (2006)

Noise Specialist Study for the Pilanesberg Platinum Mine Plant Expansion Project
Report Number: 16SLR28N 23
4.2 Noise Propagation and Simulated Noise Levels
The propagation of noise generated during the operational phase was calculated with CadnaA in accordance
with ISO 9613. Meteorological and site specific acoustic parameters as discussed in Section 3.2 along with
source data discussed in 4.1, were applied in the model.
Table 7 provides a summary of simulated noise levels at NSRs. The simulated equivalent continuous day-time
rating level (LReq,d) due to project operations of 55 dBA (guideline level) and equivalent continuous night-time
rating level (LReq,n) of 45 dBA (guideline level) is at the source. For a person with average hearing acuity an
increase of less than 3 dBA in the general ambient noise level is not detectable. According to SANS 10103
(2008); no reaction expected from the community for increased noise levels up to 1 dBA. With the approach
adopted for the assessment (detailed in Section 1.6), the predicted increase in noise levels are expected to result
in no reaction from the surrounding NSRs.
Table 7: Summary of simulated noise levels (provided as dBA) due to the project and baseline noise
measurements at NSR within the study area
Noise Sensitive Receptor
Baseline Noise Measurements Increase in Noise Levels Above Baseline (due to
Project Activities) (g)
Day Night Day Night
Ngweding (a) 35.8 37.7 0 0
Legkraal (a) 43.3 41.9 0 0
Black Rhino Game Reserve (b)
62.8 (e) 30.9 0 0
Mothlabe (a) 54.1 47.7 (d) 0 0
Notes:
(a) Residential/ educational NSR
(b) Ecological NSR
(c) Exceeds day-time IFC guideline of 55 dBA for residences
(d) Exceeds night-time IFC guideline of 45 dBA for residences
(e) Exceeds day-time SANS 10103 levels of 45 dBA for rural districts
(f) Exceeds night-time SANS 10103 levels of 35 dBA for rural districts
(g) Likely community response:
0 to 1 dBA – No reaction, increase not detectable
1 to 3 dBA – Increase just detectable to persons with average hearing acuity, annoyance unlikely.
3 to 5 dBA – There will be ‘little’ reaction with ‘sporadic complaints’.
5 to 10 dBA – There will be ‘little’ to ‘medium’ reaction with ‘sporadic’ to ‘widespread’ complaints.
10 to 15 dBA – There will be a ‘strong’ reaction with ‘threats of community action’.
> 15 dBA – There will be a ‘very strong’ reaction with ‘vigorous community action’.

Noise Specialist Study for the Pilanesberg Platinum Mine Plant Expansion Project
Report Number: 16SLR28N 24
5 Management Measures
In the quantification of noise emissions and simulation of noise levels as a result of the proposed project, it was
calculated that ambient noise evaluation criteria for human receptors will not be exceeded at NSRs. No reaction
can be expected from members of the community within this impact area. However, even with the best
mitigation, it is possible that people may hear the mining operation at night. Reverse alarms and other impulsive
sounds do have a nuisance effect and people may complain.
From a noise perspective, the project may proceed. It is recommended, however, that mitigation measures be
implemented to ensure minimal impacts on the surrounding environment.
For general activities, the following good engineering practice should be applied to all project phases:
All diesel-powered equipment and plant vehicles should be kept at a high level of maintenance. This
should particularly include the regular inspection and, if necessary, replacement of intake and exhaust
silencers. Any change in the noise emission characteristics of equipment should serve as trigger for
withdrawing it for maintenance.
Equipment with lower sound power levels must be selected. Vendors should be required to guarantee
optimised equipment design noise levels.
In managing noise specifically related to truck and vehicle traffic, efforts should be directed at:
o Minimising individual vehicle engine, transmission, and body noise/vibration. This is achieved
through the implementation of an equipment maintenance program.
o Maintain road surface regularly to avoid corrugations, potholes etc.
o Avoid unnecessary idling times.
o Minimising the need for trucks/equipment to reverse. This will reduce the frequency at which
disturbing but necessary reverse warnings will occur. Alternatives to the traditional reverse
‘beeper’ alarm such as a ‘self-adjusting’ or ‘smart’ alarm could be considered. These alarms
include a mechanism to detect the local noise level and automatically adjust the output of the
alarm is so that it is 5 to 10 dB above the noise level near the moving equipment. The
promotional material for some smart alarms does state that the ability to adjust the level of the
alarm is of advantage to those sites ‘with low ambient noise level’ (Burgess & McCarty, 2009).
o Limiting traffic to hours to between 06:00 and 18:00.
Where possible, other non-routine noisy activities such as construction, decommissioning, start-up and
maintenance, should be limited to day-time hours.
A noise complaints register must be kept.

Noise Specialist Study for the Pilanesberg Platinum Mine Plant Expansion Project
Report Number: 16SLR28N 25
6 Impact Significance Rating
The significance of environmental noise impacts was assessed according to the methodology adopted by SLR
Consulting. The noise impact significance for all phases on nearby NSRs is considered low (Table 8). No noise
impacts are expected post-closure. It must be noted that reverse alarms is exempt from an acoustical
assessment due to Government Notice R154 of 1992 (Noise Control Regulations) – Clause 7.(1) – “the emission
of sound is for the purposes of warning people of a dangerous situation”.
Table 8: Significance rating for all phases due to unmitigated operations
Activity Impact
Nature (Negative or
Positive Impact)
Probability Duration Scale Magnitude/
Severity Significance
Construction and Closure Phases - UG2 Milling and Flotation Circuit, and Kell Plant
Movement of vehicles on
site, earthworks, demolition of
buildings
Noise Impact Negative Possible Short term Localised Low Low
Operational Phase – UG2 Milling and Flotation Circuit and Kell plant
Stationary and mobile equipment
Noise Impact Negative Seldom/ Unlikely
Medium term Localised Low Low

Noise Specialist Study for the Pilanesberg Platinum Mine Plant Expansion Project
Report Number: 16SLR28N 26
7 Conclusion
Based on the findings of the assessment, it is the specialist opinion that the project may be authorised.

Noise Specialist Study for the Pilanesberg Platinum Mine Plant Expansion Project
Report Number: 16SLR28N 27
8 References
Aaberg, D., 2007. Generator Set Noise Sollutions: Controlling Unwanted Noise from On-site Power Systems, s.l.:
Cummins Power Generation Inc..
Aloui, M., Bleuzen, Y., Essefi, E. & Abbes, C., 2016. Ground Vibrations and Air Blast Effects Induced by Blasting
in Open Pit Mines: Case of Metlaoui Mining Basin, Southwestern Tunisia. Journal of Geology and Geophysics,
5(3).
Bruce, R. D. & Moritz, C. T., 1998. Sound Power Level Predictions for Industrial Machinery. In: M. J. Crocker, ed.
Handbook of Acoustics. Hoboken: John Whiley & Sons, Inc, pp. 863-872.
Brüel & Kjær Sound & Vibration Measurement A/S, 2000. www.bksv.com. [Online] Available at:
http://www.bksv.com [Accessed 14 October 2011].
Bugliarello, G., Alexandre, A., Barnes, J. & Wakstein, C., 1976. The impact of noise pollution | A socio-
technological introduction. s.l.:Pergamon Press.
Burgess, M. & McCarty, M., 2009. Review of Alternatives to 'Beeper' Alarms for Construction Equipment,
Canberra: University of New South Wales.
Earth Resources | Victoria State Government, 2015. Ground Vibration and Airblast Limits for Blasting in Mines
and Quarries. [Online] Available at: http://earthresources.vic.gov.au/earth-resources-regulation/licensing-and-
approvals/minerals/guidelines-and-codes-of-practice/ground-vibration-and-airblast-limits-for-blasting-in-mines-
and-quarries [Accessed 5 January 2018].
EC WG-AEN, 2006. Position Paper | Final Draft | Good Practice Guide for Strategic Noise Mapping and the
Production of Associated Data on Noise Exposure, Brussels: European Commission.
EXM, 2016. Background information document. Application for environmental authorisation and a water use
licence for the development of an opencast and underground coal mine near Bethal, Mpumalanga. s.l.:EXM
Advisory Services (Pty) Ltd.
IFC, 2007. General Environmental, Health and Safety Guidelines, s.l.: s.n.
SANS 10103, 2008. The measurement and rating of environmental noise with respect to annoyance and to
speech communication, Pretoria: Standards South Africa.
WHO, 1999. Guidelines to Community Noise. s.l.:s.n.

Noise Specialist Study for the Pilanesberg Platinum Mine Plant Expansion Project
Report Number: 16SLR28N 28
Appendix A – Specialist Curriculum Vitae

Noise Specialist Study for the Pilanesberg Platinum Mine Plant Expansion Project
Report Number: 16SLR28N 29

Noise Specialist Study for the Pilanesberg Platinum Mine Plant Expansion Project
Report Number: 16SLR28N 30

Noise Specialist Study for the Pilanesberg Platinum Mine Plant Expansion Project
Report Number: 16SLR28N 31

Noise Specialist Study for the Pilanesberg Platinum Mine Plant Expansion Project
Report Number: 16SLR28N 32

Noise Specialist Study for the Pilanesberg Platinum Mine Plant Expansion Project
Report Number: 16SLR28N 33
Noise Specialist Study for the Pilanesberg Platinum Mine Plant Expansion Project
Report Number: 16SLR28N 34
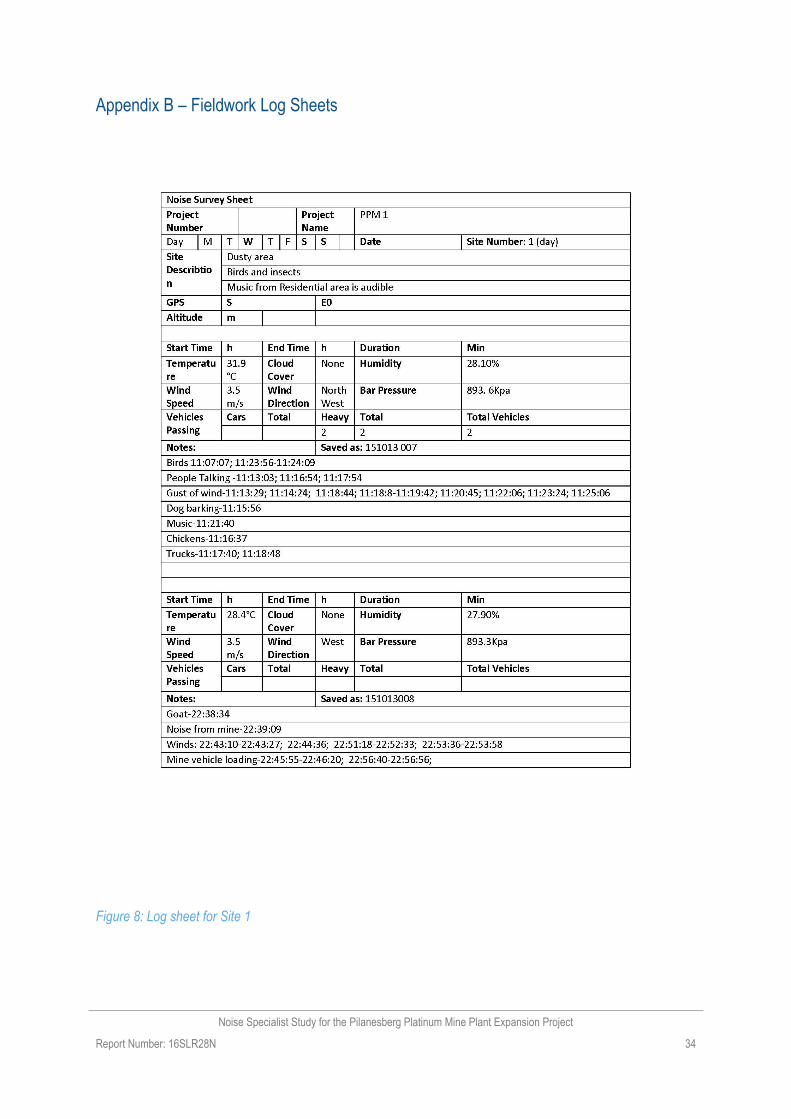
Appendix B – Fieldwork Log Sheets
Figure 8: Log sheet for Site 1

Noise Specialist Study for the Pilanesberg Platinum Mine Plant Expansion Project
Report Number: 16SLR28N 35
Figure 9: Log sheet for Site 2

Noise Specialist Study for the Pilanesberg Platinum Mine Plant Expansion Project
Report Number: 16SLR28N 36
Figure 10: Log sheet for Site 3

Noise Specialist Study for the Pilanesberg Platinum Mine Plant Expansion Project
Report Number: 16SLR28N 37
Figure 11: Log sheet for Site 4