Embed Size (px)
Citation preview

Appendix G. Cumulative Impacts Analysis

This page intentionally left blank.

Midwest Wind Energy Multi-Species HCP EIS Draft EIS G-1
April 2016
This appendix summarizes the research conducted to inform the cumulative impacts analysis (see
Chapter 5 of the Environmental Impact Statement [EIS]). The following tables provide regional and
state-specific information on the following trends: population shifts (increased urbanization and
suburbanization); agricultural trends concerning agricultural productivity and farmland values; and
economic growth (e.g., industrial, technological, and energy sectors including renewable energy).
The tables are presented in the following sequence:
Midwest Region at a glance
Illinois
Indiana
Iowa
Michigan
Minnesota
Missouri
Ohio
Wisconsin

U.S. Fish and Wildlife Service
Appendix G Cumulative Impacts Analysis
Midwest Wind Energy Multi-Species HCP EIS Revised Draft EIS G-2
April 2016
This page intentionally left blank.

U.S. Fish and Wildlife Service
Appendix G Cumulative Impacts Analysis
Midwest Wind Energy Multi-Species HCP EIS Draft EIS G-3
April 2016
Table G-1. Midwest Region at a Glance
Trend A – Population Shifts (urbanization/suburbanization)
Trend B – Agricultural Trends (productivity/value)
Trend C – Economic Growth (industry fueling growth)
Suburban Sprawl
The suburban share of overall metropolitan area growth averaged more than 100% in the Midwest (compared to 83.7% nationally) as a result of continuing population losses in several large cities.
Farmland Values Dipping
Midwest, U.S. continue to lose farms.
In 2012, nearly two-thirds of the Midwest’s farms had gross sales of less than $50,000, an indication that farming is not the primary income for many farm families; since 2007, the share of farmers with primary occupations off the farm grew from 49% to 51%. Only 6% of the Midwest’s farms (and 3.8% nationally) had gross sales of more than $1 million.
The cost of farmland continues to rise (up more than 20% year-over-year in the Midwest), as do expenses related to everything from equipment and fuel to feed and fertilizer. Link
There is an aging population of farmers, and principal farm operations with fewer than 10 years of experience fell to 42%.
Land valuations outpace crop prices (property tax squeeze). Link
Regional Transportation Plans
The Federal Railroad Administration’s (FRA’s) 3 million planning initiative for passenger rail in the Midwest. Link
The Midwest Interstate Passenger Rail Commission (MIPRC) recently received preliminary notification that its November 2014 application to the FRA for a multi-state planning project had been chosen as one of the two planning efforts, the Northeast Indiana Passenger Rail Association (NIPRA) and All Aboard Ohio advocacy groups announced in August. Link
Wind Energy Development
Wind energy facilities are being installed at a rapid rate; costs are plummeting; technologies advancing; creating lots of jobs Link1; Link2; Increase in business investment in wind energy. Link3
Obama Clean Power Plan
Goal of 20% Wind Energy by 2030. Link
American Wind Energy Association Q2 2015 Market Report. Link

U.S. Fish and Wildlife Service
Appendix G Cumulative Impacts Analysis
Midwest Wind Energy Multi-Species HCP EIS Draft EIS G-4
April 2016
Table G-2. Illinois
Trend A – Population Shifts (urbanization/suburbanization)
Trend B – Agricultural Trends (productivity/value)
Trend C – Economic Growth (industry fueling growth)
Chicago added population – suburbs still account for 85% of area’s population gain
Population increases in the Chicago area; businesses are leaving the suburbs for the city. Link
Cities with high rates of negative population growth 2000-2010: Chicago. Link
Cities with high rates of population growth 2000-2010: Joliet, Aurora, Eglin. Link
Development shifts are responsible for a much higher percentage of total sprawl: 100% in the large metropolitan areas of Chicago
o Socio – jobs, housing, demand for public services
o Land use – development
o Transportation – use of public transportation/cars
“ongoing weakness in farmland values”
State lost 2.3% of farms between 2007 and 2012
High cost of farmland (despite reduced interest rate programs). Link
Sprawling development threatens farmland map
Aerospace industry
President Obama launches manufacturing innovation institute in Chicago - Chicago based consortium of 73 companies, nonprofits, and universities are partnering with the federal government to launch new manufacturing innovation hubs. Link - Chicago headquartered consortium of businesses and universities that will concentrate on digital manufacturing and design technologies.
Chicago part of Midwest tech region “Silicon Prairie” – over $1 billion in venture capital invested in Chicago in 2014 – technology sector is poised for more growth. Link
U.S. Fish and Wildlife Service
Appendix G Cumulative Impacts Analysis
Midwest Wind Energy Multi-Species HCP EIS Draft EIS G-5
April 2016
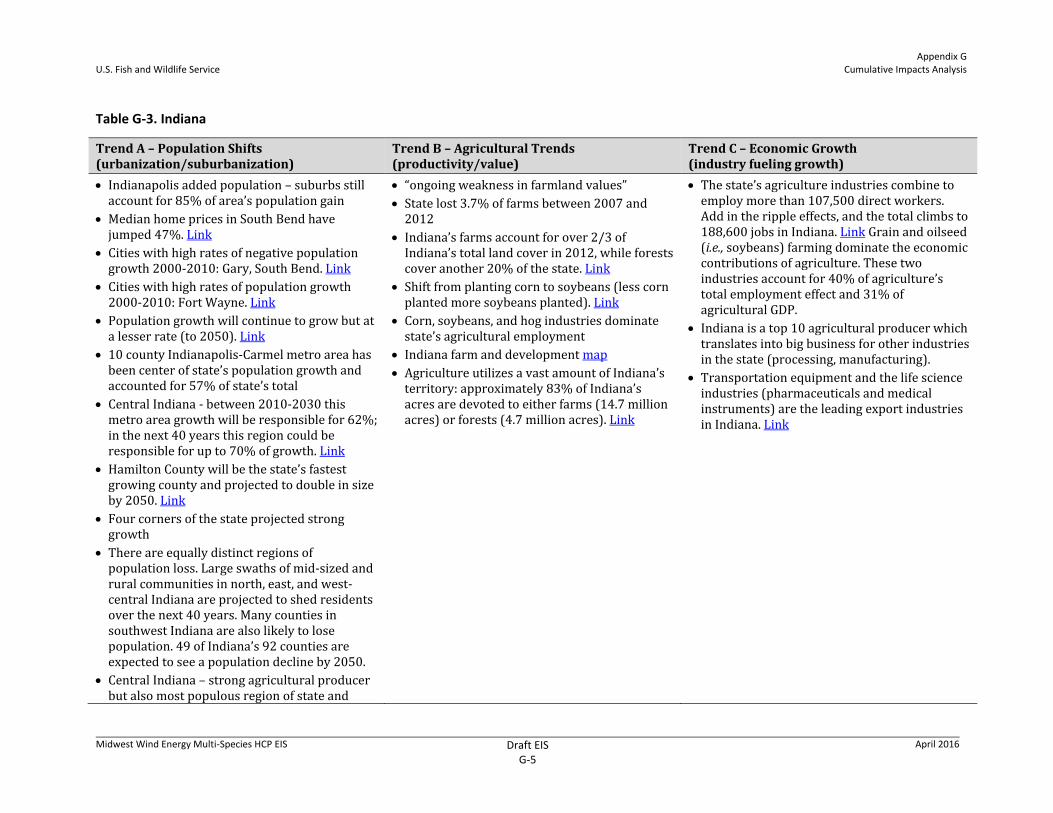
Table G-3. Indiana
Trend A – Population Shifts (urbanization/suburbanization)
Trend B – Agricultural Trends (productivity/value)
Trend C – Economic Growth (industry fueling growth)
Indianapolis added population – suburbs still account for 85% of area’s population gain
Median home prices in South Bend have jumped 47%. Link
Cities with high rates of negative population growth 2000-2010: Gary, South Bend. Link
Cities with high rates of population growth 2000-2010: Fort Wayne. Link
Population growth will continue to grow but at a lesser rate (to 2050). Link
10 county Indianapolis-Carmel metro area has been center of state’s population growth and accounted for 57% of state’s total
Central Indiana - between 2010-2030 this metro area growth will be responsible for 62%; in the next 40 years this region could be responsible for up to 70% of growth. Link
Hamilton County will be the state’s fastest growing county and projected to double in size by 2050. Link
Four corners of the state projected strong growth
There are equally distinct regions of population loss. Large swaths of mid-sized and rural communities in north, east, and west-central Indiana are projected to shed residents over the next 40 years. Many counties in southwest Indiana are also likely to lose population. 49 of Indiana’s 92 counties are expected to see a population decline by 2050.
Central Indiana – strong agricultural producer but also most populous region of state and
“ongoing weakness in farmland values”
State lost 3.7% of farms between 2007 and 2012
Indiana’s farms account for over 2/3 of Indiana’s total land cover in 2012, while forests cover another 20% of the state. Link
Shift from planting corn to soybeans (less corn planted more soybeans planted). Link
Corn, soybeans, and hog industries dominate state’s agricultural employment
Indiana farm and development map
Agriculture utilizes a vast amount of Indiana’s territory: approximately 83% of Indiana’s acres are devoted to either farms (14.7 million acres) or forests (4.7 million acres). Link
The state’s agriculture industries combine to employ more than 107,500 direct workers. Add in the ripple effects, and the total climbs to 188,600 jobs in Indiana. Link Grain and oilseed (i.e., soybeans) farming dominate the economic contributions of agriculture. These two industries account for 40% of agriculture’s total employment effect and 31% of agricultural GDP.
Indiana is a top 10 agricultural producer which translates into big business for other industries in the state (processing, manufacturing).
Transportation equipment and the life science industries (pharmaceuticals and medical instruments) are the leading export industries in Indiana. Link

U.S. Fish and Wildlife Service
Appendix G Cumulative Impacts Analysis
Midwest Wind Energy Multi-Species HCP EIS Draft EIS G-6
April 2016
Trend A – Population Shifts (urbanization/suburbanization)
Trend B – Agricultural Trends (productivity/value)
Trend C – Economic Growth (industry fueling growth)
economically diverse
Suburban counties of Indianapolis metro area net in-migration. Link

U.S. Fish and Wildlife Service
Appendix G Cumulative Impacts Analysis
Midwest Wind Energy Multi-Species HCP EIS Draft EIS G-7
April 2016
Table G-4. Iowa
Trend A – Population Shifts (urbanization/suburbanization)
Trend B – Agricultural Trends (productivity/value)
Trend C – Economic Growth (industry fueling growth)
Less sprawl around Des Moines (above national average)
Rural population decline; population growth occurring in urban and suburban areas (2000-2010)
Heavy reliance on agricultural is common to states experience greatest rural population loss
“ongoing weakness in farmland values”
State lost 4.6% of farms between 2007 and 2012
Farm and development map
Microsoft plans to build a $1.1 billion data center in West Des Moines
ITC Holdings' Winnco-to-Hazleton Transmission Line in Iowa: $480 million. The U.S. Midwest expects to see more than $2 billion in power transmission projects begin construction next year, according to Industrial Info's database, almost one-quarter of which can be attributed to ITC Holdings Corporation's ITC (Novi, Michigan), $480 million construction of a transmission line from the company's proposed, 345-kilovolt Winnco West Substation in Cedar Rapids, Iowa, to its existing Hazleton Substation in Buchanan County, Iowa. MidAmerican Energy Company (Des Moines, Iowa) also is involved in the development.
Des Moines major financial services hub with Principal Financial and Wells Fargo

U.S. Fish and Wildlife Service
Appendix G Cumulative Impacts Analysis
Midwest Wind Energy Multi-Species HCP EIS Draft EIS G-8
April 2016
Table G-5. Michigan
Trend A – Population Shifts (urbanization/suburbanization)
Trend B – Agricultural Trends (productivity/value)
Trend C – Economic Growth (industry fueling growth)
Higher sprawl around Detroit – Detroit job sprawl worst in US. Link
Net outgoing-incoming population (new trend). Link
Grand Rapids added population – suburbs still account for 85% of area’s population gain
Median home prices surged 75% in metro Lansing. Link
Cities with high rates of negative population growth 2000-2010: Detroit, Flint Link
Migration Patterns
Since the 1950s, the area of urban land in each of the Lake States has increased by more than twofold while population has risen by over 50%. Over the next 50 years, the Lake States population is projected to increase by about 6% to 8% every decade. Urban area is projected to increase by only 2% to 3% in Michigan. Although population is projected to increase at a slower rate in the future, urban expansion is expected to increase even less than past trends would imply. Link
State grants to businesses with agricultural and food production. Link; Link
There are about 10 million acres of farmland in Michigan and the state is home to 52,194 farms. The food and agriculture industry contributes $101.2 billion annually to the state’s economy. Michigan’s food and agriculture system is a large portion of this state’s workforce. Total employment resulting from this sector is 923,000 which accounts for about 22% of the state’s employment.
Farming on the edge map of farmland. Link
“ongoing weakness in farmland values” State lost 6.8% of farms between 2007-2012
Farm and development map
Has fastest growing economy in Midwest – project economy will continue to grow Link; Link (manufacturing strongest sector)
Automotive production - more suppliers are moving in to support the industry.
o Impacts: socio, land use, transportation, air
Michigan legislature passed new transportation plan in late 2014 (provide additional $1.2 billion for roads and bridges). Link
o Impacts: socio, land use, noise
DTE (largest developer of solar energy projects in State) implementing projects part of SolarCurrents – construct, operate and maintain solar array for 20 years – begins construction August 2015 in Romulus, Ypsilanti, and Ann Arbor – already began installing 10 megawatts of solar energy across 22 sites in Southeastern Michigan. Link 1 Link2 Link3 Link 4
Michigan’s largest utilities (DTE Energy and Consumers Energy) pledged to spend $10 billion on in-state services and raw materials for their operations (minimum of $1 billion annually). Link
o Impacts: energy resources, socioeconomics
o DTE receives license for new nuclear unit Link
Industrial growth – attracting new businesses/job creation – Michigan Strategic Fund, community improvement projects,

U.S. Fish and Wildlife Service
Appendix G Cumulative Impacts Analysis
Midwest Wind Energy Multi-Species HCP EIS Draft EIS G-9
April 2016
Trend A – Population Shifts (urbanization/suburbanization)
Trend B – Agricultural Trends (productivity/value)
Trend C – Economic Growth (industry fueling growth)
Chinese automobile investment in Detroit Link, Link; Expanded tech center Link (skilled jobs, automobile industry) - Nine companies to invest $146.3 million, create or retain 970 jobs. Link
Toyota shifts R&D base to Michigan. Link
YFS Automotive Systems investing $26.9 million in new manufacturing operations in Detroit. Link
President Obama launches manufacturing innovation institute in Detroit - Detroit-area based consortium of 60 companies, nonprofits, and universities are partnering with the federal government to launch new manufacturing innovation hubs. Link - Detroit-area headquartered consortium of businesses and universities, with a focus on lightweight and modern metals manufacturing.
One of the fastest growing states for technology jobs 2015. Link

U.S. Fish and Wildlife Service
Appendix G Cumulative Impacts Analysis
Midwest Wind Energy Multi-Species HCP EIS Draft EIS G-10
April 2016
Table G-6. Minnesota
Trend A – Population Shifts (urbanization/suburbanization)
Trend B – Agricultural Trends (productivity/value)
Trend C – Economic Growth (industry fueling growth)
Minneapolis-St. Paul added population – suburbs still account for 85% of area’s population gain
The Minneapolis-St. Paul metro area is home to 62% of the state’s population. Link
Median home prices in the Minneapolis-St. Paul area have increased 42%. Link
Cities with high rates of population growth 2000-2010: Rochester. Link
Since the 1950s, the area of urban land in each of the Lake States has increased by more than twofold while population has risen by over 50%. Over the next 50 years, the Lake States population is projected to increase by about 6% to 8% every decade. Urban area is projected to increase by 9% in Minnesota. Although population is projected to increase at a slower rate in the future, urban expansion is expected to increase even less than past trends would imply. Link
State lost 8.1% of farms between 2007 and 2012. Link
Businesses tied to agriculture and energy continue to report pullbacks in economic activity, and this is spilling over into the broader regional economy; “Sinking agriculture and energy commodity prices pushed supply managers’ expectations of future economic conditions lower for the month.” Link
Farm and development map
Antofagasta's Hydrometallurgical Plant in Ely, Minnesota: $547 million Antofagasta's construction of a hydrometallurgical plant, to be built on the site of a proposed copper and nickel mine.
o Air Quality – construction and operation; Socio – jobs, housing; Noise – construction noise
One of the fastest growing states for technology jobs 2015. Link
Healthcare industry
Minneapolis-St. Paul area serves as state’s economic hub, with companies such as Target, U.S. Bancorp, General Mills, 3M, and Medtronic headquartered there. Link
Central Minnesota is generating new jobs at a faster pace than anywhere in the state. Northeast and Southwest have had slowest job growth and rebound from recession. Link
Twin Cities Metro (largest economy) high concentration of jobs in company management, real estate, professional, scientific and technical services, finance and insurance. Link

U.S. Fish and Wildlife Service
Appendix G Cumulative Impacts Analysis
Midwest Wind Energy Multi-Species HCP EIS Draft EIS G-11
April 2016
Table G-7. Missouri
Trend A – Population Shifts (urbanization/suburbanization)
Trend B – Agricultural Trends (productivity/value)
Trend C – Economic Growth (industry fueling growth)
Less sprawl around Kansas City (above national average)
Kansas City added population – suburbs still account for 85% of area’s population gain
Metropolitan areas make up the largest portions of the state’s economy – St. Louis County and Jackson County make up 1/3 of the state’s economy in terms of employment, personal income, and population Link; rural areas important for tourism and agriculture
Map of population growth by county
Industry share of Missouri’s economy 2012 – natural resources (including agriculture and mining) make up 1.4% link and in 2013 it makes up 2.3%. Link
Businesses tied to agriculture and energy continue to report pullbacks in economic activity, and this is spilling over into the broader regional economy; “Sinking agriculture and energy commodity prices pushed supply managers’ expectations of future economic conditions lower for the month.” Link
Farm and development map
Boeing expanding St. Louis campus (hiring 700 workers)
o Socio: jobs, housing, public services
As of 2012, only two auto assembly plants in Missouri (St. Louis and Kansas City area). Link
Growth of professional, scientific, and technical services industries in St. Louis/Kansas City followed by administrative and support services and construction related activities – new business formations higher in urban areas. Link
Major industries: aerospace, food processing, chemicals, printing/publishing, electrical equipment, and beer
Monsanto based in St. Louis – state has growing science and biotechnology field

U.S. Fish and Wildlife Service
Appendix G Cumulative Impacts Analysis
Midwest Wind Energy Multi-Species HCP EIS Draft EIS G-12
April 2016
Table G-8. Ohio
Trend A – Population Shifts (urbanization/suburbanization)
Trend B – Agricultural Trends (productivity/value)
Trend C – Economic Growth (industry fueling growth)
Less sprawl in Cincinnati (above national average
More sprawl in Cleveland area
Columbus added population – suburbs still account for 85% of area’s population gain
Cleveland median home price climbed 25% in three years; Columbus climbed 28%
Increasingly urban electorate
Cities with high rates of negative population growth 2000-2010: Dayton, Cincinnati, Akron, Toledo Cleveland. Link
Nearly 80% of Ohioans live in metropolitan areas (31% live in four northeast metropolitan areas; 22% live in three southwest metropolitan areas; central Ohio which consists of the Columbus metropolitan area has 17% of the population). Link
Appalachian hills of southeastern Ohio is least densely populated area.
State lost 0.5% of farms between 2007 and 2012
In Ohio, and most other Midwestern states, farmland is appraised using a formula based on “current agricultural use value.” Based on factors such as commodity prices, soil productivity, rental rates, production expenses and interest rates, the state determines the income that a farmer can be expected to earn on his or her land. In 2015, crop prices (and thus farm incomes) have fallen, but property taxes are still being based on the record-high crop prices of a few years ago. The result is a real squeeze on rural landowners.
Sprawling development threatens farmland map
Aerospace industry, oil-shale production
Since Feb 2010 Ohio alone has added nearly 70,000 manufacturing jobs over that period. Link
America Makes in Youngstown, OH – tech initiative – Established in 2012 and based in Youngstown, Ohio, America Makes is the flagship Institute for the National Network for Manufacturing Innovation (NNMI) infrastructure of up to 45 Institutes to follow and is driven by the National Center for Defense Manufacturing and Machining (NCDMM) (part of President’s $500 million investment in manufacturing). Link
Manufacturing and financial services are largest sectors of Ohio’s economy
The resurgence of steel production in Ohio is due to rising demand for motor vehicles and the drilling boom in oil and gas industry. Companies in Ohio are shipping pipes and tubes to drilling operations here and in other states and countries. The effects have been particularly notable in northeastern Ohio. Link
Boom in shale development impacts Ohio’s steel industry by increased demand for pipes and tubes for extraction. Link

U.S. Fish and Wildlife Service
Appendix G Cumulative Impacts Analysis
Midwest Wind Energy Multi-Species HCP EIS Draft EIS G-13
April 2016
Table G-9. Wisconsin
Trend A – Population Shifts (urbanization/suburbanization)
Trend B – Agricultural Trends (productivity/value)
Trend C – Economic Growth (industry fueling growth)
Sprawl around Milwaukee
o Land use (fragmentation and sprawl), socio (taxes, services, housing prices), transportation
More urbanized areas of the state are projected to see additional households, while remote rural areas and older industrial communities are projected to lose households. Link
Impact of 2006 foreclosure crisis is “zombie houses” (abandoned homes and subdivisions). Wisconsin has its own version of zombie subdivisions called “ghost parcels.” Ghost parcels are located in almost all counties of Wisconsin – these parcels are theoretically available for development. Link
Since the 1950s, the area of urban land in each of the Lake States has increased by more than twofold while population has risen by over 50%. Over the next 50 years, the Lake States population is projected to increase by about 6% to 8% every decade. Urban area is projected to increase by only 2% to 3% in Wisconsin. Although population is projected to increase at a slower rate in the future, urban expansion is expected to increase even less than past trends would imply. Link
Aging rural population. Link
“ongoing weakness in farmland values”
State lost 11% of farms between 2007 and 2012
Agricultural experts are predicting decline in net farm income due to dairy prices which are expected to drop by at least $7 per hundredweight. Link
Rent paid for cropland is likely to experience some downward pressure as crop prices have declined. Seed costs are expected to continue to grow in 2015, but at a tempered rate. Reduced planting and lower commodity prices are expected, so seed supplies should be adequate for the demand. Link
Price of farm land 2015: as you go from the east, southeastern corner of the state to the farther west parts of the state, the prices of agricultural land go down. Likewise, as you go farther north the quality of the agricultural land gets a little bit poorer, you’ll see some lower prices as well. The most valuable land in the state is probably in the northeast corridor near Green Bay and Oshkosh, as well as down in the southeast as you would expect with the large population demands for land in that area as well. Link
Top five agricultural products: dairy products, beef cattle and calves, corn for grain, greenhouse and nursery products and soybeans. Dairy farming is leading agricultural activity. Link
Farm and development map
Mid-sized farms present the single largest
Biomed clusters (Madison)
The U.S. Army has awarded Oshkosh Corp. a contract that could be worth up to $30 billion and provide years of work to thousands of Wisconsin employees building a new type of armored truck in Oshkosh. Link
State giving millions to broadband providers to expand in rural areas. Link
Machinery and transportation equipment leading manufacturing products. Most important mined products are sand, gravel, and crushed stone. Link
Emerging bioenergy sector provides promise and a challenge for the future of rural Wisconsin. Link

U.S. Fish and Wildlife Service
Appendix G Cumulative Impacts Analysis
Midwest Wind Energy Multi-Species HCP EIS Draft EIS G-14
April 2016
Trend A – Population Shifts (urbanization/suburbanization)
Trend B – Agricultural Trends (productivity/value)
Trend C – Economic Growth (industry fueling growth)
challenge for production agriculture and show the largest statistical decline. Link
Number of small and large farms are increasing while midsized farms are declining. Link


![Active region loops: Hinode/EIS observations region loops: Hinode/EIS observations ... [A (b) G(N e,T e)] I ... loop_presentation_new_tripathi.ppt [Read-Only]](https://img.dokumen.tips/doc/110x75/5ac88c167f8b9acb7c8cd11d/active-region-loops-hinodeeis-region-loops-hinodeeis-observations-a-b.jpg)