Embed Size (px)
Citation preview

Appendix F 500-Year and 1000-Year Floodplain Analysis

MEMORANDUM
TO: Keith Dines Aligned Data Centers
DATE: September 30, 2016
FROM: Caitlin Gilmore, PE JOB#: ALGN.01.16 SUBJECT: San Tomas Aquino 500-year and 1000-year Floodplain Analysis
Summary The project is located in FEMA flood Zone X (Shaded) representing areas protected by inundation from the 100-year flood by a levee and Zone AH(23), which is an area of ponding with an established 100-year base flood elevation of 23 feet NAVD88 per Flood Insurance Rate Map (FIRM) panel 06085C0064H. The flood zones are a result of spills from San Tomas Aquino Creek. We understand it is the owner’s intent to place the proposed structures above the 500-year and 1000-year water surface elevations.
Schaaf & Wheeler developed an HEC-RAS model of San Tomas Aquino Creek coupled with a FLO2D overland flow model for the Santa Clara Valley Water District (SCVWD) under separate contract. The project’s limit of study was south (upstream) of Highway 101. The modeling and mapping was submitted to and approved by FEMA as meeting their standards for analysis and mapping in 2014. It has not yet been adopted as the effective FEMA FIRM, and there are no immediate plans to do so, but is the best available floodplain data for the creek upstream of Highway 101. Adjacent to the project site, the effective model for San Tomas Aquino is a steady state HEC-RAS model. The effective Flood Insurance Study (FIS), effective FIRM and new SCVWD HEC-RAS and FLO2D models reflect only the 100-year event. There is no published data regarding the 500- or 1000-year events. This analysis extrapolates the 100-year to the 500- and 1000-year storm events. The steady-state HEC-RAS model adjacent to the project site downstream of Highway 101 and the SCVWD unsteady HEC-RAS/FLO2D model were converted into one combined unsteady HEC-RAS5.0 model with two dimensional overland flow routing to estimate the 500- and 1000-year base flood elevations (BFEs) at the project site. Note that this study does not include a levee failure analysis for San Tomas Aquino Creek levees. All creek bank levees are assumed to hold, even if freeboard is not sufficient per FEMA LAMP (Levee Analysis and Mapping Approach) standards.
If the concrete median barrier on Highway 101 remains a barrier to flow, spill from San Tomas Aquino Creek would not reach the project site in a 1000-year flood event. If, however, it is very conservatively assumed that concrete barrier were to fail completely or be assumed not to exist, the highest water surface elevation (WSE) on the Site resulting from the analysis described herein would be 24.3 feet NAVD88. This represents approximately 1.3 feet of flooding on-site, with up to 4.5 feet of ponding in the rear (north) parking area based on existing ground elevations.
Schaaf & Wheeler CONSULTING CIVIL ENGINEERS
870 Market Street, Suite 1278San Francisco, CA 94102-2906
t. 415-433-4848f. 415-433-1029

Keith Dines, Aligned Data Centers September 30, 2016
Schaaf & Wheeler Page 2
Floodplain Analysis Methodology The following outlines the methodology for determining the 500-year and 1000-year return period hydrology and resulting floodplain mapping for the Aligned Data Center Project located at 2305 Mission College Boulevard.
Hydrology Hydrology involves the calculation and estimation of creek flow (or discharge or stormwater runoff) rates based on precipitation that occurs during a storm event with a certain recurrence interval (or return period). Flow hydrographs depend on the amount of precipitation that falls over a particular duration, the intensity of that precipitation, how that intensity is distributed over time (a rainfall pattern) and how saturated the watershed’s soils are at the beginning of the storm.
Hydrologic models developed by the SCVWD and previously submitted to FEMA in the HEC-HMS Hydraulic Modeling Software platform for the 100-year design storm have been modified to evaluate the 500-year and 1000-year design storms by rebalancing rainfall patterns to reflect local rainfall intensity-duration-frequency statistics and calibrate what is known as “Antecedent Moisture Condition” to the same flood frequency analysis previously used to produce the 100-year runoff estimates.
Rainfall Pattern Balancing One rainfall pattern is used in the HEC-HMS model for the 100-year hydrologic analysis. The pattern consists of a 24-hour rainfall distribution at 15 minute intervals and was developed for the entire Santa Clara Valley Water District (SCVWD) watershed. The rainfall pattern has the peak rainfall intensity at the center of the distribution (i.e. at 12 hours) as shown in Figure 1. The pattern was developed by SCVWD using average values of yearly peaks for all 40 SCVWD precipitation gage recorded data within the SCVWD watershed.
The 24-hour rainfall distribution is balanced to preserve local rainfall intensity-duration-frequency statistics based on the 2013 SCVWD regression equations for 500-year and 1000-year return periods. The resulting balanced rainfall patterns have been incorporated into the respective HEC-HMS models for analysis on the 500-year and 1000-year return periods based on the local Mean Annual Precipitation (MAP). Thus while the rainfall statistics for the 500-year and 1000-year return periods have not been evaluated by FEMA, the 500-year and 1000-year design storms used in this analysis are consistent with FEMA-approved methods and local rainfall statistics.

Keith Din
Schaaf &
AdjustedThe precipdepths wecalculate tstatistics.
AMC CaliSimilar to 0.2% (500for adjustAMC (I, IImust be ausing the that the Amodeled dacceptable
StatiSF 24SF 25
1 Santa Cla2, 2013.
nes, Aligned D
& Wheeler
d Rainfall Depitation depthere used to bathe 500-year The adjusted
libration the Saratoga0-year) and 0ing the AntecI, III) is a funadjusted for epreviously ca
AMC of 1.25 isdischarge este accuracy fo
Table 1: F
ion 4 5 ra Valley Wate
Data Centers
Figure 1: SC
epths h values wereack calculate and 1000-yea
d values were
a-San Tomas 0.1% (1000-ycedent Moistunction of groueach model simalibrated AMCs also appropimates are wi
or hydrologic m
FFA and HM
FFA 4700 6300
er District, Scha
CVWD 24-Ho
e also adjustethe mean anar precipitatio
e updated in t
Aquino Creekyear) flow rateure Condition nd moisture cmulation. The
C 1.25. It is deriate for the 5ithin 14 percemodeling.
S predicted0.2%
HMS 5391 6446
aaf & Wheeler
our Duration R
d for each nenual precipitaon depth valuhe respective
k Hydrology Res at gage sta(AMC) valuesconditions, vae HEC-HMS ouetermined for 500-year and ent of the floo
0.2% and 0
HMS/FFA1.14 1.02
r, Saratoga-San
Rainfall Distr
ew return peration (MAP). Tues using the e HEC-HMS m
Report1, the Fations SF 24 as for the HEC-arying under eutput is compr the 500-year1000-year re
od frequency
0.1% Flow R
A FFA 5000 7000
n Tomas Aquin
Se
ribution
iod. The 100-The MAP was2013 SCVWD
models.
lood Frequenand SF 25 are-HMS model seach event. Tpared to the Fr and 1000-yeeturn periods analysis. This
Rate Compa0.1%
HMS 5632 6796
no Creeks Hydr
eptember 30,
P
-year precipitas then used toD regression
ncy Analysis (Fe used as guidsimulation. ThTherefore, AMFFA results wear return pe(see Table 1)s is well withi
arison
HMS/FFA1.12 0.97
rology Report,
, 2016
Page 3
ation o
FFA) dance he
MC hen riods ) as n an
A
May

Keith Dines, Aligned Data Centers September 30, 2016
Schaaf & Wheeler Page 4
Hydraulics The unsteady RAS model developed for the San Tomas Aquino Flood Study is imported into HEC-RAS version 5.0.1 to model the 2-D overland flow. The model extends from Virginia Avenue at the upstream end to Highway 101 at the downstream end. An additional HEC-2 model covering the channel downstream of Highway 101 is georeferenced and added to the San Tomas Aquino Creek model. The vertical datum for the HEC-RAS analysis is feet NAVD 88.
Two-dimensional flow areas are added to the HEC-RAS model to facilitate overland flow mapping. Lateral structures at spill locations are also added along the bank stations which facilitate the transfer of excess channel flow between the 1-D channel reach and 2-D flow area. Weir coefficients for lateral structures are selected based upon guidance from the Army Corps of Engineers reference manual and are shown in Table 2.
Table 2: Weir Coefficients used for Lateral Structures Modeled Lateral Structure Type Description
Range of Weir Coefficients
Coefficient Used
Levee 3 feet higher or more above natural ground.
Broad crested weir shape. Flow over levee acts like weir flow.
1.5 – 2.2 n/a
Levee 1 to 3 feet elevated above ground.
Broad crested weir shape. Flow over levee acts like weir flow but submerged easily.
1.0 – 2.0 1.0
Natural high ground barrier 1 to 3 feet high.
Does not really act like a weir, but must flow over high ground to get into 2D or storage area.
0.5 – 1.0 n/a
Non-elevated overbank terrain.
Overland flow escaping the main channel. 0.1 – 0.5 0.2
Three plans are created to model the various return periods along San Tomas Aquino Creek. The developed plans and the corresponding geometry and flow files are shown in Table 3.
Table 3: HEC-RAS Project Files PLAN GEOMETRY FILE UNSTEADY FLOW FILE San Tomas 100 Year (.p02) San Tomas Creek (.g01) San Tomas 100 Year (.u02) San Tomas 500 Year (.p03) San Tomas Creek (.g01) San Tomas 500 Year (.u03) San Tomas 1000 Year (.p04) San Tomas Creek (.g01) San Tomas 1000 Year (.u04) Boundary Condition The downstream boundary condition at the established limit of study is the water surface elevation. One boundary condition is used for all three plans in Table 3. Water surface elevations at this location are based on the effective FIS model for San Tomas Aquino Creek between U.S. Highway 101 and San Francisco Bay. The HEC-2 model, obtained from the Santa Clara Valley Water District, is imported to HEC-RAS and modified only as needed to examine water surface profiles that result from changes in base flood discharges due to the revised hydrologic and upstream hydraulic analyses referenced herein. The

Keith Dines, Aligned Data Centers September 30, 2016
Schaaf & Wheeler Page 5
base hydrology has changed and discharges within the lower reaches of San Tomas Aquino Creek have changed due to upstream capacity restrictions and spill from the channel.
The effective FIS hydraulic model for San Tomas Aquino Creek uses the mean higher-high water tide elevation at San Francisco Bay as its downstream boundary condition. A coincident one-percent tide analysis has been performed to establish the downstream boundary at San Francisco Bay, thereby updating the study to be consistent with other recently completed flood hazard studies for watercourses tributary to San Francisco Bay.
A 19-year mean tide cycle has been established for San Francisco Bay and other geographical locations on the West Coast. This cycle represents average tide heights over a specific period known as the tidal epoch, which spans the 19 years it takes for every possible combination of relative positions for the sun, moon and earth to occur. A mixed tide cycle predominates on the West Coast of the United States. This cycle consists of two high tides (one higher than the other) and two low tides (one lower than the other) each lunar day.
Based on calculations for these relative celestial positions, it is possible to predict tides for any day of the year at any time of the day. Astronomic tides, created by the gravitational forces of the moon and sun acting on earth’s oceans, are provided in tide prediction calendars. The mean tide cycle is simply the long-term average of astronomic tides. Observed tides, on the other hand, are actual tidal elevations recorded by National Oceanic and Atmospheric Administration (NOAA) gaging stations located throughout coastal areas.
Traditionally, as is the case for the effective FIS model for San Tomas Aquino Creek, Mean Higher High Water (MHHW) has been used as the backwater condition where riverine (freshwater) runoff meets an estuarine (saltwater) body.
However, evidence shows that mean tide elevations are not necessarily an appropriate boundary condition during storm events and tide elevations in San Francisco Bay are elevated (relative to predicted tides) during periods of heavy rainfall. Furthermore, the relationship between coincident tides and maximum annual runoff can be quantified and used in the model, providing for a more statistically correct solution than an arbitrarily selected tide condition.
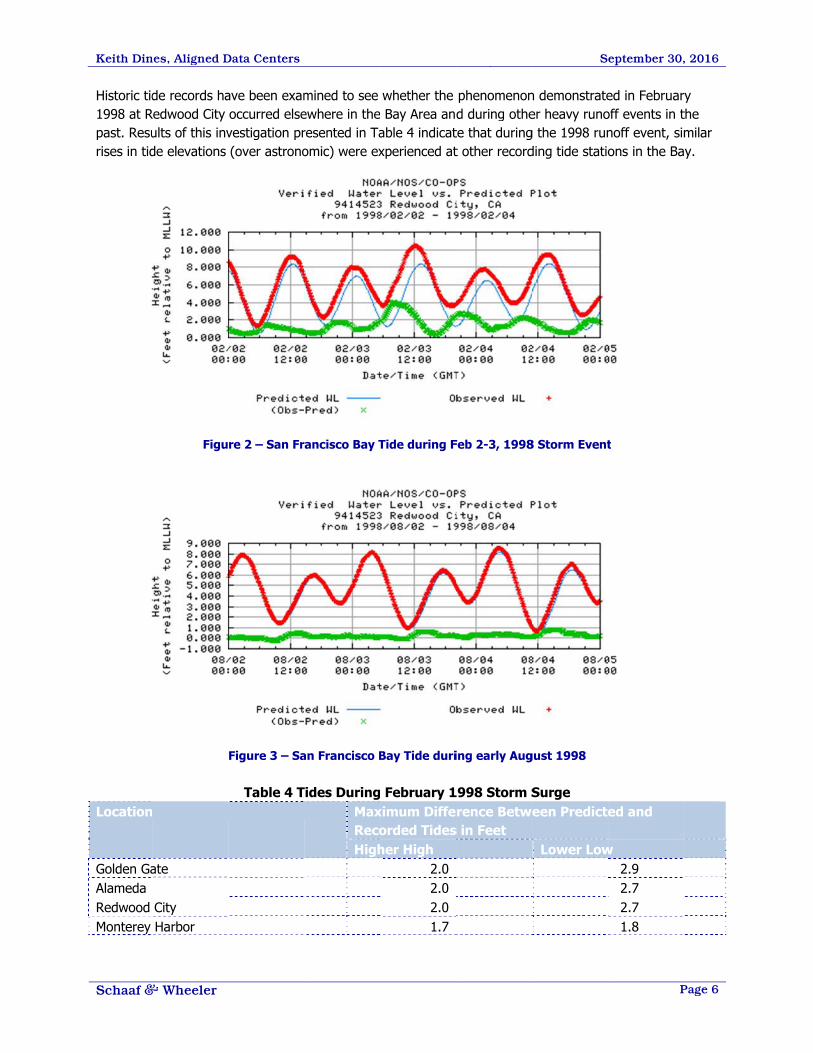
The El Niño storm of February 2-3, 1998 provided an ideal event for examining potential correlations between runoff events and tide action. While stream runoff as measured by local gages often approached historic recorded levels, observed tides in San Francisco Bay were substantially higher than predicted.
Figure 2 shows predicted and recorded tides in early February 1998 at Redwood City, which has the closest NOAA tide gage to San Tomas Aquino Creek. Recorded tides during the week of this runoff event were consistently higher (on the order of up to 4 feet) than the astronomic (predicted) tide heights due to storm surge. As a control, observed tide heights are compared to predicted tides six months later at the same station, using the same sets of data. Figure 3 shows tide elevations during early August 1998, when there is very close agreement between the predicted and the actual tides and no rainfall. Both figures present tides on the local Mean Lower Low Water (MLLW) datum.
Keith Din
Schaaf &
Historic tid1998 at Rpast. Resurises in tid
Location
Golden GaAlameda Redwood Monterey
nes, Aligned D
& Wheeler
de records haRedwood City ults of this invde elevations
Figu
ate
City Harbor
Data Centers
ave been examoccurred elsevestigation pr(over astrono
re 2 – San Fr
Figure 3 – Sa
Table 4 T
mined to see ewhere in theresented in Taomic) were ex
rancisco Bay T
an Francisco B
Tides DuringMaxRecoHigh
whether the Bay Area andable 4 indicatxperienced at
Tide during F
Bay Tide duri
February 1ximum Diffeorded Tidesher High
2.0 2.0 2.0 1.7
phenomenond during othete that duringt other record
Feb 2-3, 1998
ing early Aug
1998 Storm Srence Betwe
s in Feet
Se
n demonstrateer heavy runog the 1998 runding tide statio
8 Storm Event
gust 1998
Surge een Predicte
Lower Low
eptember 30,
P
ed in Februaryoff events in tnoff event, simons in the Ba
t
ed and
w 2.9 2.7 2.7 1.8
, 2016
Page 6
y the milar y.

Keith Dines, Aligned Data Centers September 30, 2016
Schaaf & Wheeler Page 7
The observed phenomenon presented in Table 4 is not strongly dependent upon tide gage location, particularly within San Francisco Bay, and is exhibited during many historic storm events. Data indicate that higher tides as observed during the February 1998 event are not an isolated incident; rather, higher than predicted tides can be expected during storm events that generate significant runoff. Increases in the data set between observed tides over predicted tides range from 0.3 foot to 2.0 feet for the higher high tide, and from 0.9 foot to 3.0 feet for the lower low tide.
From observed historical data, it appears that storm-related forces induce higher tides during rainfall events, and by extension, runoff events. This phenomenon may be due to a number of meteorological or hydrologic factors. NOAA refers to the term “inverse barometer effect”, and defines it as higher tides that are caused by lower barometric pressures associated with winter storm systems. References to “storm surges”, the meteorological effects of low barometric pressures and/or strong southerly winds, are also found in the literature.
The exact nature and cause of this phenomenon, however, are not as important as potential impacts to backwater conditions for San Tomas Aquino Creek. To model an appropriate San Francisco Bay tide for the one percent storm event, the higher-high tide elevation is adjusted based on the one-percent conditional probability of coincident occurrence with the annual maximum discharge of San Francisquito Creek at Stanford, which represents the closest USGS streamflow gaging location with sufficient length of record for analysis. This procedure is as described by Dixon (1986), whose hypothesis was that high tide events tend to occur the same day as flood flow events using conditional probability:
P(x,y) = P(x|y) P(y)
where P(x,y) is the probability of occurrence of x and y; P(x|y) is the probability of occurrence of x given y; P(y) is the probability of occurrence of y; x is tide elevation; and y is maximum annual peak discharge. Since we are interested only in annual maximum discharges, P(y) is one and the probability of joint occurrence, P(x,y), is equal to the probability of x given y.
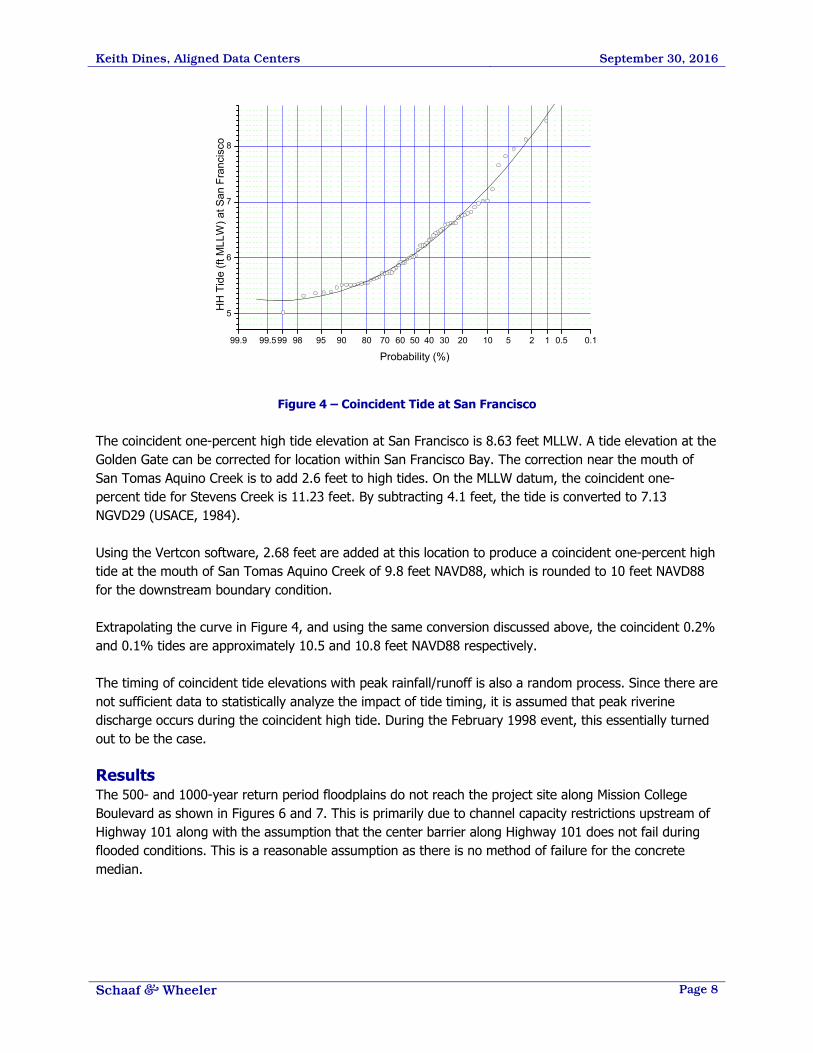
The Higher High tide is taken from a fitted probability curve using the median plotting position for every recorded tide extreme at San Francisco (Presidio/Golden Gate) that occurred within 24 hours of the recorded maximum annual discharge. Figure 4 shows the probability distribution on the MLLW datum.
Keith Dines, Aligned Data Centers September 30, 2016
Schaaf & Wheeler Page 8
Figure 4 – Coincident Tide at San Francisco
The coincident one-percent high tide elevation at San Francisco is 8.63 feet MLLW. A tide elevation at the Golden Gate can be corrected for location within San Francisco Bay. The correction near the mouth of San Tomas Aquino Creek is to add 2.6 feet to high tides. On the MLLW datum, the coincident one-percent tide for Stevens Creek is 11.23 feet. By subtracting 4.1 feet, the tide is converted to 7.13 NGVD29 (USACE, 1984).
Using the Vertcon software, 2.68 feet are added at this location to produce a coincident one-percent high tide at the mouth of San Tomas Aquino Creek of 9.8 feet NAVD88, which is rounded to 10 feet NAVD88 for the downstream boundary condition.
Extrapolating the curve in Figure 4, and using the same conversion discussed above, the coincident 0.2% and 0.1% tides are approximately 10.5 and 10.8 feet NAVD88 respectively.
The timing of coincident tide elevations with peak rainfall/runoff is also a random process. Since there are not sufficient data to statistically analyze the impact of tide timing, it is assumed that peak riverine discharge occurs during the coincident high tide. During the February 1998 event, this essentially turned out to be the case.
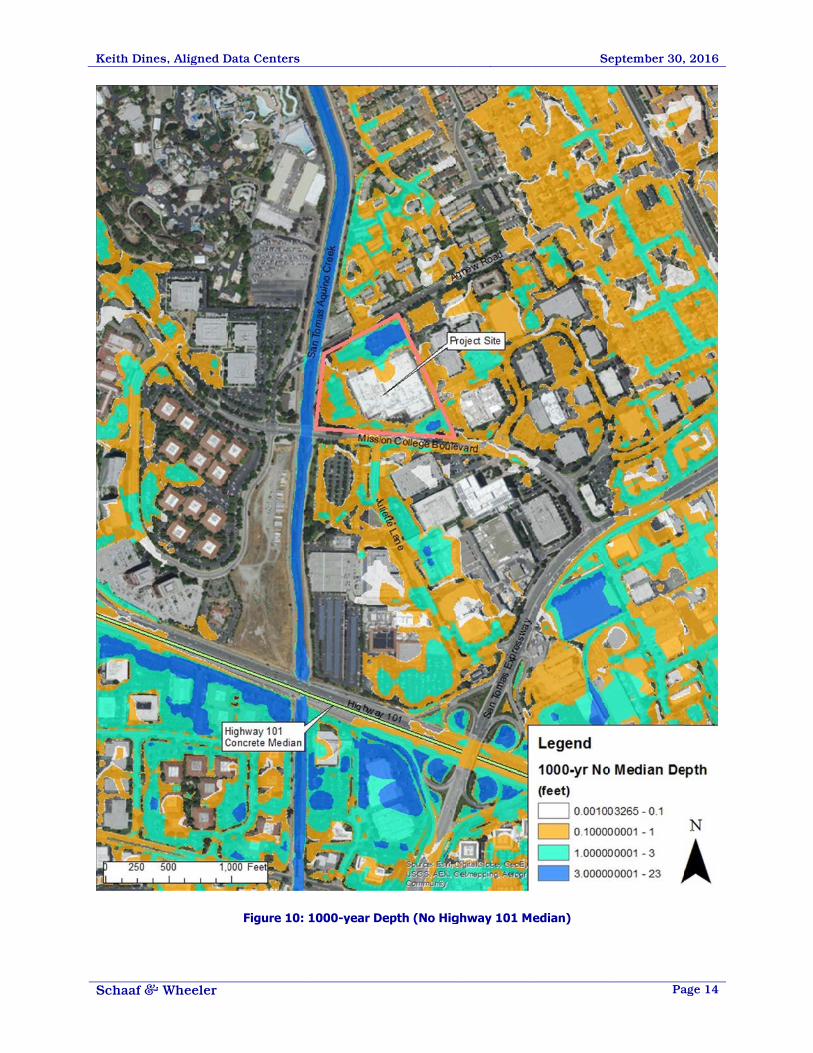
Results The 500- and 1000-year return period floodplains do not reach the project site along Mission College Boulevard as shown in Figures 6 and 7. This is primarily due to channel capacity restrictions upstream of Highway 101 along with the assumption that the center barrier along Highway 101 does not fail during flooded conditions. This is a reasonable assumption as there is no method of failure for the concrete median.
99.9 99.599 98 95 90 80 70 60 50 40 30 20 10 5 2 1 0.5 0.1
5
6
7
8
HH
Tid
e (ft
MLL
W) a
t San
Fra
ncis
co
Probability (%)

Keith Din
Schaaf &
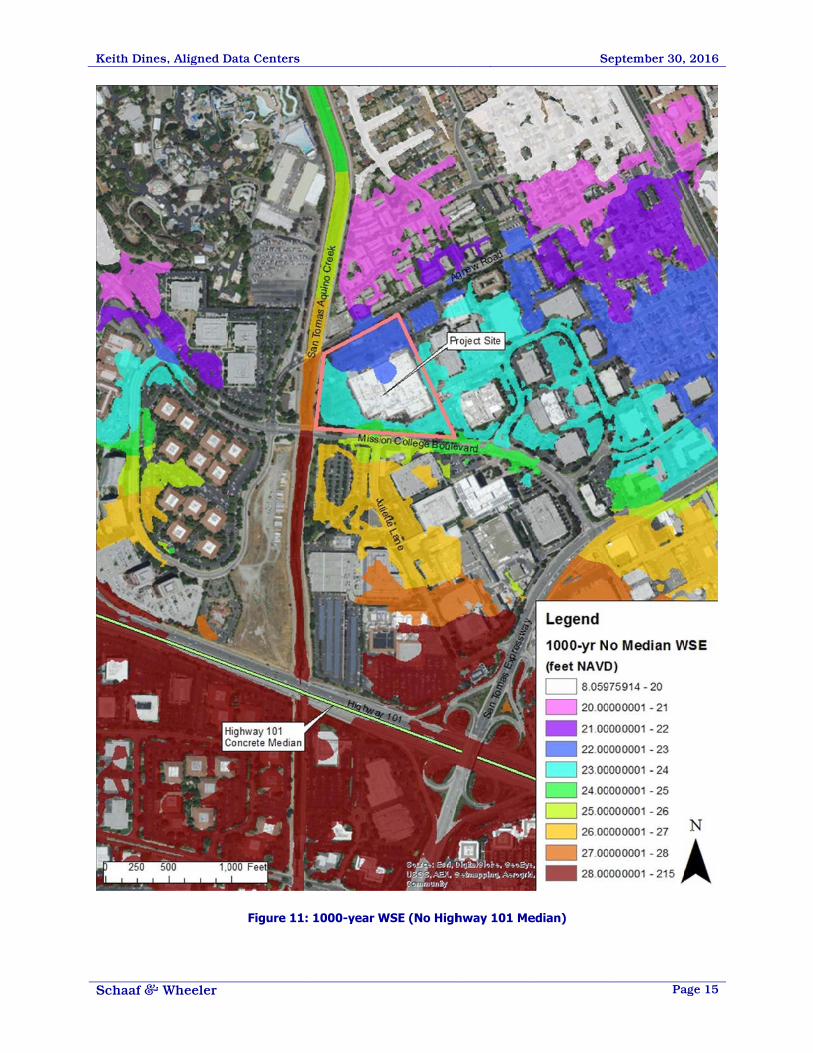
However, WSE resuthere is noWSE and
Table 5Return P
500-year 1000-year
Note that maxium w
The capacspills, evecontrolled
The projeelevation condition,
nes, Aligned D
& Wheeler
if the concrelts on-site as o method of fdepth are pre
: Maximum Period
r
this study aswater surface
city of the brien during the d by pump sta
ct site is well 10.8 feet NAV, as the site is
Data Centers
Fig
ete median onshown in Tabfailure per FEesented graph
Water SurfaWSE On-SiNAVD)
24.224.3
ssumes that thelevation con
dge at Highw500- and 100
ations with lim
above the tidVD88. Additios above tidal i
ure 5: Highw
n the centerlinble 5 results.
EMA Levee Anhically in Figu
ace Elevatioite (feet M
(f
2 3
he levee adjantained in the
way 101 limits 00-year eventmited capacity
dal flooding fronally, these rinfluence and
way 101 Concr
ne of HighwayNote, that th
nalysis and Maures 7-10.
on (WSE) wiMax Depth Ofeet)
4.5 4.6
cent to the Se channel is p
the creek flots. Additionally.
rom the Bay. results are nod capacity is re
rete Median
y 101 were tois is a very coapping Approa
ith Failed HiOn-Site W
AqLo(f
ite holds duriresented in T
ows such thaty, downstrea
The maximumot sensitive toestricted by H
Se
o fail (unlikelyonservative aach (LAMP) s
ighway 101 WSE In San T
quino Creekocation feet NAVD)
2727
ng all flood eTable 5.
t there are nom inflows int
m 0.1% tide o the downstreHighway 101.
eptember 30,
P
y), a maximumssumption as
standards. The
Median BarTomas k at Site
7.6 7.7
events. The
o downstreamo the creek a
is aproximateeam boundar
, 2016
Page 9
m s e
rrier
m are
ely ry

Keith Din
Schaaf &
nes, Aligned D
& Wheeler
Data Centers
Figure 6: 5
500-year Deppth (with Highway 101 Me
Se
edian)
eptember 30,
Pa
, 2016
age 10

Keith Din
Schaaf &
nes, Aligned D
& Wheeler
Data Centers
Figure 7: 1
1000-year Depth (with Higghway 101 M
Se
Median)
eptember 30,
Pa
, 2016
age 11

Keith Din
Schaaf &
nes, Aligned D
& Wheeler
Data Centers
Figure 8:
500-year Deepth (No Highhway 101 Med
Se
dian)
eptember 30,
Pa
, 2016
age 12

Keith Din
Schaaf &
nes, Aligned D
& Wheeler
Data Centers
Figure 9
: 500-year WWSE (No Highwway 101 Med
Se
dian)
eptember 30,
Pa
, 2016
age 13
Keith Din
Schaaf &
nes, Aligned D
& Wheeler
Data Centers
Figure 10:
1000-year DDepth (No Higghway 101 M
Se
edian)
eptember 30,
Pa
, 2016
age 14
Keith Din
Schaaf &
nes, Aligned D
& Wheeler
Data Centers
Figure 11: 1000-year WWSE (No Highhway 101 Me
Se
edian)
eptember 30,
Pa
, 2016
age 15