Embed Size (px)
Citation preview

Technical Memorandum January 2015 Channel Capacity Report
Appendix E
Technical Memorandum Subsidence Monitoring (2011-2013)
September 2014

September 2014
Technical Memorandum
Subsidence Monitoring 2011 - 2013

Table of Contents
1.0 Introduction .......................................................................................................................... 1
2.0 Monitoring Efforts ............................................................................................................... 1
2.1 Geodetic Control Network Survey (Reclamation) ........................................................... 1
2.2 Arroyo and TSR Canal Surveys (Reclamation) ............................................................... 2
2.3 Levee Surveys (DWR-SCRO) ......................................................................................... 2
3.0 Methods................................................................................................................................ 6
3.1 Datum ............................................................................................................................... 6
3.2 GPS and Total Station Surveys ........................................................................................ 6
3.3 Level Surveys ................................................................................................................... 7
4.0 Results .................................................................................................................................. 7
4.1 Geodetic Control Network Survey ................................................................................... 9
4.2 Arroyo and TSR Canal Surveys ..................................................................................... 11
4.3 Levee Crown Surveys .................................................................................................... 13
5.0 Future Monitoring .............................................................................................................. 14
6.0 References .......................................................................................................................... 15
List of Figures
Figure 1. Static GPS Network Diagram .......................................................................................... 3 Figure 2. Location map of Precise Levels along the Arroyo and Temple-Santa Rita Canals ........ 4 Figure 3. Longitudinal levee surveys within Reach 2A and Bypass ............................................. 5 Figure 4. Combined calculated subsidence rates ............................................................................ 8 Figure 5. Calculated annual subsidence rates from December 2011 to December 2013 ............. 10 Figure 6. Changes in elevation along the Arroyo and Temple-Santa Rita Canals ....................... 12
Appendix A - Exhibit Maps
List of Figures
Figure A.1. Annual Subsidence Rate Exhibit Map for December 2011 to July 2012 ................ A-2 Figure A.2. Annual Subsidence Rate Exhibit Map for July 2012 to December 2012 ................ A-3 Figure A.3. Annual Subsidence Rate Exhibit Map for December 2012 to July 2013 ................ A-4 Figure A.4. Annual Subsidence Rate Exhibit Map for July 2013 to December 2013 ................ A-5
September 2014

Appendix B - Levee Profiles
List of Figures
Figure B.1 Ground subsidence along the left levee in Reach 2A. .............................................. B-2 Figure B.2. Ground subsidence along the right levee in Reach 2A. ........................................... B-3 Figure B.3. Ground subsidence along the left levee in the Chowchilla Bypass. ........................ B-4 Figure B.4. Ground subsidence along the right levee in the Chowchilla Bypass. ...................... B-5 Figure B.5. Ground subsidence along the left levee in the Upper/Middle Eastside Bypasses. .. B-6 Figure B.6. Ground subsidence along the right levee in the Upper/Middle Eastside Bypasses . B-7 Figure B.7. Ground subsidence along the left levee in the Mariposa Bypass. ........................... B-8 Figure B.8. Ground subsidence along the right levee in the Mariposa Bypass. ......................... B-9
September 2014

Subsidence Monitoring
1.0 Introduction
This report summarizes the methods and results of the subsidence monitoring and levee surveys completed since 2011 by the Bureau of Reclamation, Mid–Pacific Region, Division of Design and Construction, Surveys and Mapping Branch (MP-220) and the California Department of Water Resources, South Central Region Office (DWR-SCRO) for the San Joaquin River Restoration Program (SJRRP). Although not summarized in this report, other agencies such as the U.S. Geological Survey (USGS) are also collecting subsidence data.
Previous surveys completed by RBF Consulting and DWR prior to 2011 indicated that there was significant subsidence occurring within the SJRRP Restoration Area. Reclamation, as part of their development of design criteria for site specific projects, decided to account for subsidence. Areas within the SJRRP most affected by ground subsidence include Reach 2B and Reach 4B, the Chowchilla, Eastside and Mariposa Bypasses, Sack Dam and the Arroyo Canal. Unfortunately there was not a lot of current data quantifying subsidence within the Central Valley. As a result, in 2011 Reclamation established the SJRRP Geodetic Control Network to start monitoring subsidence within the SJRRP Restoration Area.
The flood control bypasses that parallel the San Joaquin River and are part of the Lower San Joaquin River Flood Control Project are within the Restoration Area and have experienced significant subsidence, with localized areas showing more than 1 foot per year. Continued subsidence is expected to change channel slopes, which has the potential to affect channel hydraulics and therefore the ability of levees to maintain adequate freeboard and flow control structures to perform as designed; as well as change the sediment transport behavior in the channel. All of these factors have the potential to reduce the flow capacities of the flood and river systems. Because of the extreme subsidence, DWR-SCRO has collected levee survey data to help further refine the estimated annual rates along the levees of the flood bypasses.
This report summarizes the monitoring efforts, methods, and results of both Reclamation’s bi-annual surveys starting in 2011, and DWR’s levee surveys along the flood bypasses in 2012 and 2013.
2.0 Monitoring Efforts
There are three major monitoring efforts that are ongoing to support the SJRRP. Reclamation continues to conduct bi-annual monitoring of an established control network, and has completed just over one year of monthly monitoring along the Arroyo and Temple-Santa Rita Canals. DWR-SCRO completed two surveys to characterize the subsidence along the levees in the lower portion of Reach 2A and the Chowchilla, Middle Eastside and Mariposa Bypasses. The three different survey efforts are summarized below.
2.1 Geodetic Control Network Survey (Reclamation)
In 2011, Reclamation established the SJRRP Geodetic Control Network (Figure 1), using static GPS methods, to investigate subsidence within the SJRRP study area. To monitor the rate of subsidence over time, Reclamation conducts bi-annual surveys, in July and December, of the
-1- ARP/MM 8/21/14

Subsidence Monitoring
established network. The network is made up of National Geodetic Survey, Reclamation, USGS, California Department of Transportation, and DWR benchmarks and in 2011 originally contained approximately 60 control points, but over the last few years has expanded to over 85 points. The benchmark elevations are updated after each survey and are used by the SJRRP to study subsidence, as well as to provide more accurate horizontal and vertical control for other studies.
2.2 Arroyo and TSR Canal Surveys (Reclamation)
Beginning in May 2012 Reclamation began monitoring the Arroyo and Temple-Santa Rita (TSR) Canals to clarify localized subsidence near Sack Dam. To accomplish this, two precise leveling networks were established; Arroyo Canal starting at Sack Dam running approximately 6 miles westerly; and the Temple-Santa Rita Canal starting at Check Structure 1 on the Arroyo Canal running approximately 11 miles northerly (Figure 2). These level networks were surveyed monthly for just over a year. The next phase of the subsidence monitoring project has been shifted to the Henry Miller Reclamation District for any future monitoring surveys.
2.3 Levee Surveys (DWR-SCRO)
In 2012 and later in 2013, DWR-SCRO collected topographic ground elevations to help further refine the estimated annual rates in the lower 3 miles of Reach 2A, the Chowchilla Bypass (from the Chowchilla Bifurcation Control Structure to its confluence with the Fresno River), the Upper Eastside Bypass (from its confluence with the Fresno River to the Sand Slough Connector), the Middle Eastside Bypass (from the Sand Slough Connector to the Eastside Bypass Control Structure), and the Mariposa Bypass (Figure 3). This survey was completed to help further refine Reclamation's estimated annual subsidence rates along the flood bypasses. In addition to the above surveys, DWR also completed surveys in 2013 and 2014 of the levee and channel in the lower portion of Reach 3, Reach 4A, and the Middle Eastside Bypass; however, this data is considered preliminary and has not been finalized for public release at the time of the preparation of this report.
-2- ARP/MM 8/21/14

Subsidence Monitoring
Figure 1. Static GPS Network Diagram
-3- ARP/MM 8/21/14

Subsidence Monitoring
-4- 8/21/14 ARP/MM
Figure 2. Location map of precise levels along the Arroyo and Temple-Santa Rita Canals

Subsidence Monitoring
Figure 3. Longitudinal levee surveys within Reach 2A and Bypass survey completed in 2012 and 2013
-5- ARP/MM 8/21/14

Subsidence Monitoring
3.0 Methods
Details regarding the survey methods, data processing and adjustments used by Reclamation can be found in GPS Survey Report, San Joaquin River Restoration Project, Geodetic Network (Reclamation, 2011). Details regarding methods used by DWR-SCRO are summarized in Chowchilla Bypass and Reach 2A Topographic Survey Results (P&P, 2012a), Eastside Bypass Topographic Survey Results (P&P, 2012b), and Bypass Top of Levee Surveys Methods and Results (P&P, 2014).
3.1 Datum
The horizontal datum is NAD 1983 (2007), California Coordinate System of 1983, Zone 4, U. S. Survey Feet. The vertical datum is NAVD 1988. Geoid model Geoid03 was used to assist with the determination of orthometric elevations. Geoid09 was originally the intended geoid model. However, after analysis of the 2011 GPS observations, along with conversations with representatives of the National Geodetic Survey, it appears the validity of Geoid09 in this region is suspect. Based on that uncertainty, Geoid03 was selected as the geoid model for Reclamation’s monitoring program.
3.2 GPS and Total Station Surveys
Reclamation's surveys to establish and continue to monitor the SJRRP’s Geodetic Network was accomplished using five Trimble R8, GNSS capable, GPS receivers operating in the Fast Static mode. GPS observations are made during the daytime with sessions typically averaging about 30-45 minutes in duration. The horizontal accuracy for the network is +\- 2 centimeters. The vertical accuracy for this network is +\- 3 centimeters (Reclamation, 2011).
Secondary project control to locate features were surveyed by RTK GPS using either a traditional RTK base station setup on one of the static control stations or by utilizing a Virtual Reference Station (VRS) network. Redundant checks to at least two control stations as part of the static geodetic network were surveyed at the beginning and completion of each RTK session. This enabled the RTK data to be adjusted to the static control station values, which were held “fixed” for all RTK surveys. This allowed all GPS data to be put on the same datum / epoch and provided “sanity checks” for the data gathered using virtual base stations.
In addition to the Geodetic Network, other features surveyed include gage houses, local benchmarks and project monitored staff gages. Staff gages and features which were not able to be surveyed using RTK, due to vegetation or proximity to standing water, were surveyed using a Trimble 5601 reflectorless total station. All measurements were made in “standard” mode, which averages seven EDM returns for each measured point. Staff gages lying within the waterway of the San Joaquin River were also surveyed for elevations using this same method.
All of DWR-SCRO surveys were completed using the Leica SmartNet North America RTK GPS attached to fixed pole that was 1.8 or 2 meters long. Depending on the particular effort, three major location types and elevation data were collected: 1) control (for the purpose of tying into the existing Geodetic Network), 2) points of interest (structures, cross sections, gages), and 3)
-6- ARP/MM 8/21/14

Subsidence Monitoring
levee crowns (longitudinal surveys). Longitudinal surveys were completed by collecting observations along the crowns of the levees using a fixed pole mounted on an ATV. During this portion of the survey, the Leica controller was set to collect in automatic mode at a nominal 100 foot horizontal interval. The vertical accuracy of this type of data collection is expected to be about +\- 6 centimeters or better. The horizontal accuracy is about +\-1.5 centimeters or better.
3.3 Level Surveys
Reclamation's monitoring activities along the Arroyo and Temple-Santa Rita Canals were performed using a Leica DNA03 digital level rated to 0.3mm/Km, reading barcodes on Leica Invar level rods. Physical field notes were kept alongside electronic field notes as an independent verification of each digital level observation. All observations were made as a part of closed level loops, with a maximum closure of 0.006’ per mile.
4.0 Results
To provide a general estimate of the potential subsidence rates and trends within the Restoration and surrounding areas, Reclamation developed an exhibit map that combined data from various sources prior to the 2011 data collection effort, including Reclamation, USACE, and RBF (Figure 4). The map shows annual subsidence rates ranging from less than 0.02’ to more than 0.5’ per year. However, more recent surveys by Reclamation and DWR show from 2011 to 2013 that the rates have either stayed or have more than doubled in some areas.
-7- ARP/MM 8/21/14

Subsidence Monitoring
Figure 4. Combined calculated subsidence rates
-8- ARP/MM 8/21/14

Subsidence Monitoring
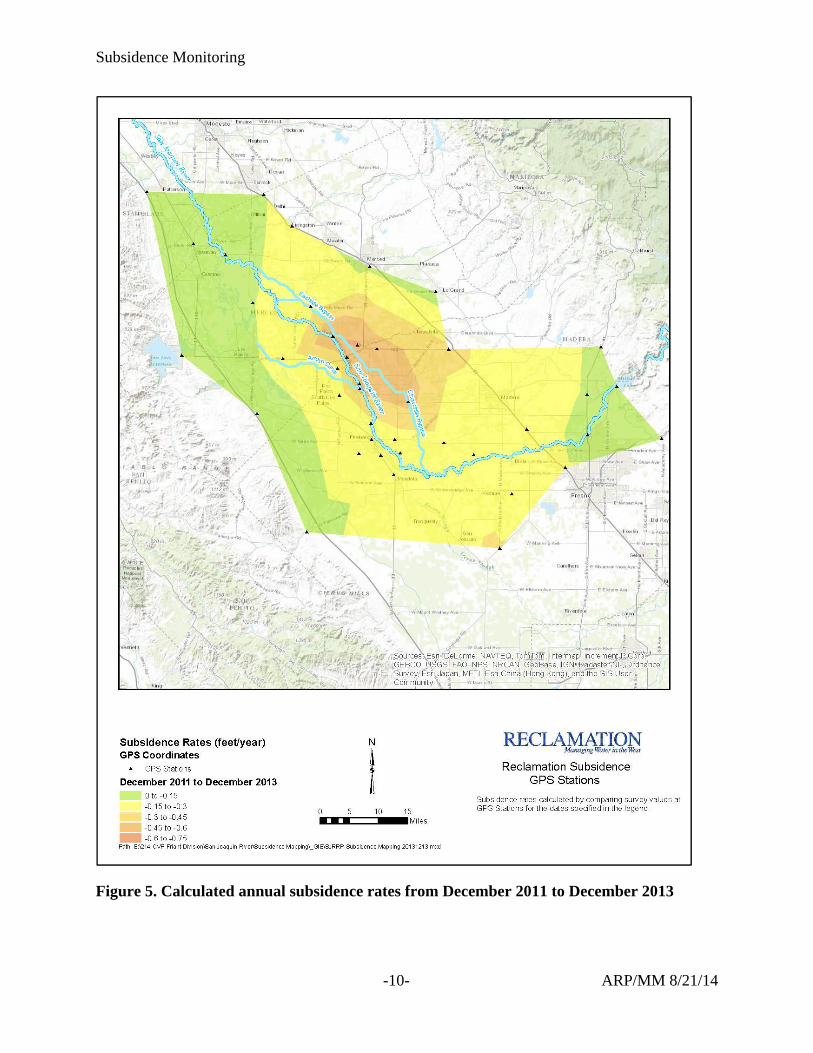
4.1 Geodetic Control Network Survey
After each survey, Reclamation prepares exhibit maps that compare the most recent data with the data from the previous survey, as well as from previous years. The exhibit maps give a good overall picture of the subsidence trends within the SJRRP Restoration Area. Figure 5 shows the calculated annual subsidence rates ranging from about 0.15 ft/year to 0.75 ft/year based on survey data collected in December 2011 and December 2013, and averaged over a two year period. The calculated annual subsidence rates vary with time, but in general, appear to either remain constant, or in some areas increase since the start of the surveys. Appendix A includes exhibit maps comparing the six month survey monitoring (calculated as annual subsidence rates) from December 2011 through December 2013. Table 1 summarizes the cumulative elevation differences for 2012 and 2013 for a select number of points within the area of subsidence since the start of the 2011 surveys.
-9- ARP/MM 8/21/14
Table 1.
Cumulative Elevation differences from 2011 at Select Control Points
Point ID December 2012 December 2013 T 987 CADWR -0.26 -0.53 W 990 CADWR -0.55 -1.16
RBF1057 -0.46 -1.21 DWR 158 Reset -0.25 -1.00
G 990 -0.37 -1.03 H 1235 Reset -0.33 -0.93
WES -0.31 -0.88 X 989 -0.08 -0.38
Fireport -0.07 -0.30
Subsidence Monitoring
Figure 5. Calculated annual subsidence rates from December 2011 to December 2013
-10- ARP/MM 8/21/14

Subsidence Monitoring
4.2 Arroyo and TSR Canal Surveys
Reclamation has monitored the Arroyo and Temple-Santa Rita (TSR) Canals by surveying regular monitoring points monthly from June of 2012 through June of 2013. The results of each survey were compared in Excel by calculating the relative change in elevation along the Arroyo and Temple-Santa Rita Canals in relation to the benchmark at Sack Dam (375 USE). The surveys are not directly tied to the ongoing SJRRP’s Geodetic Network surveys, but provide a relative change compared to the initial "baseline" survey. The survey results are shown in Figure 6.
-11- ARP/MM 8/21/14

Subsidence Monitoring
Figure 6. Survey results showing relative changes in elevation along the Arroyo and Temple-Santa Rita Canals
-12- ARP/MM 8/21/14
Subsidence Monitoring
4.3 Levee Crown Surveys
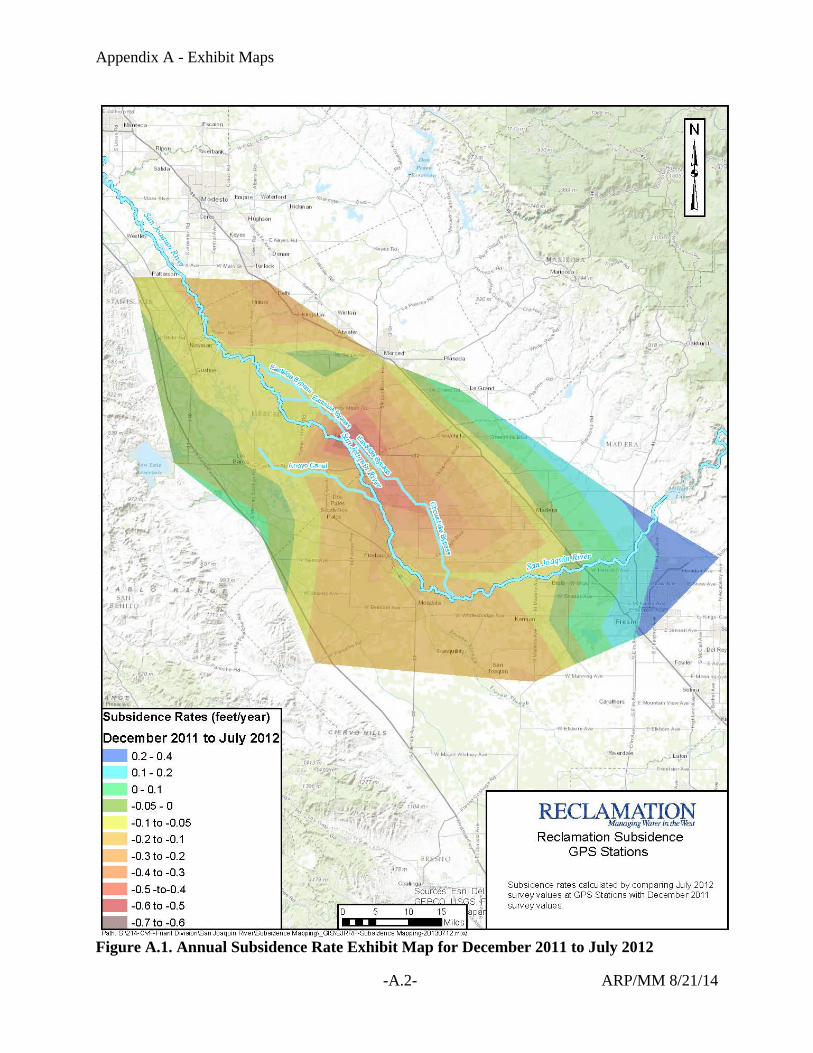
To better define, as well as confirm the overall subsidence trends shown in Reclamation's initial exhibit maps, in 2012 and again in 2013, DWR-SCRO collected elevation data along about 65 miles of bypass and Reach 2A levee crowns. Profiles showing the levee crown elevations from the 2008 LiDAR mapping completed by DWR and the 2012 and 2013 surveys are shown in Appendix B of this report. In general, the profiles show that subsidence is occurring at various rates along the bypasses from almost 6 ft in the Upper Eastside Bypass from 2008 to 2013 to less than 0.5' in Reach 2A and the lower portion of the Middle Eastside Bypass and Mariposa Bypass. In addition, a comparison of the DWR-SCRO survey data in some areas show that the ground during the 2012 surveys appears higher (up to about 0.5'), and to a lesser extent the 2013 survey than the LiDAR data. Some of these differences may be a result of physical changes to the levees (e.g., placement of material on top of the levees after the LiDAR surveys), data collection methods (GPS when compared to LiDAR), or the accuracy of the LiDAR data itself; but the specific source of these anomalies were not investigated (DWR-SCRO, 2013).
Table 1 summarizes the calculated annual subsidence rates at select structures for 2012 and 2013 when compared to the 2008 LiDAR, as well as the calculated differences between the 2012 and 2013 data. The calculated subsidence rates match reasonably well with the other data sources, including Reclamation's exhibit maps. However, the average annual calculated rates for the Geodetic Control Network surveys and the levee surveys can vary. This is because of the differences in the survey extent and location, data collection method (top of levee versus control points), and the overall density of points collected (100 – 300 ft intervals along the levees versus a single control point).
Table 2
Estimated Annual Subsidence Rates for Different Timeframes at Structures
Bridge Structure 2008 – 2012 2008 – 2013 2012 - 2013 rate, ft/year rate, ft/year rate, ft/year
Avenue 7 <0.1 <0.1 0.2 Avenue 12 <0.1 0.2 0.3 Avenue 14 0.4 0.4 0.5
Road 9 0.5 0.5 0.7 Triangle T 0.4 0.4 0.7
Avenue 18 1/2 0.3 0.4 0.9 Road 4 0.9 0.9 1.2
Avenue 21 0.5 0.6 0.9 Highway 152 0.5 0.6 0.9
W. Washington Road 0.3 0.4 0.8
The 2012 rates in Table 2, as well as those calculated along the levees were used to adjust the 1-D hydraulic models to complete an initial capacity study of the bypasses described in Evaluation of the Effect of Subsidence on Flow Capacity in the Chowchilla and Eastside Bypasses (DWR-
-13- ARP/MM 8/21/14

Subsidence Monitoring
SCRO, 2013). The study estimates that flow capacity in the bypasses has been reduced as a result of subsidence by up to 2,000 cfs since 2008.
5.0 Future Monitoring
Land subsidence monitoring within the SJRRP Restoration Area is important to support the development of design criteria for the site-specific projects, as well as to evaluate the potential impacts of subsidence on channel capacity. In 2012, the SJRRP formed a subsidence coordination workgroup to 1) help address and study the impacts of subsidence and 2) share information between landowners, local agencies, and the SJRRP. At the time of this report Reclamation is continuing the bi-annual monitoring of the Geodetic Control Network. It is unknown, at this time, how long that network will be surveyed. DWR-SCRO is also in the process of collecting additional survey data along the levees and main channel in Reach 3, Reach 4A and the Middle Eastside Bypass. This data will help with the development of the modeling tools necessary to assess the potential impacts of subsidence on channel capacity within the SJRRP Restoration Area. Because of subsidence experienced in the Restoration Area and the uncertainties on the rates of subsidence, additional LiDAR surveys will be collected in the latter part of 2014.
-14- ARP/MM 8/21/14

Subsidence Monitoring
6.0 References
Bureau of Reclamation, 2011. GPS Survey Report, San Joaquin River Restoration Project, Geodetic Network. Mid–Pacific Region, Division of Design & Construction Surveys & Mapping Branch, MP-220, December 2011.
CA Department of Water Resources, South Central Region Office, 2013. Evaluation of the Effect of Subsidence on Flow Capacity in the Chowchilla and Eastside Bypasses, 2013.
Provost & Pritchard Consulting Group, 2012a. Chowchilla Bypass and Reach 2A Topographic Survey Results. Prepared for California Dept. of Water Resources, November 2012.
______, 2012b. Eastside Bypass Topographic Survey Results. Prepared for California Dept. of Water Resources, October 2012.
______, 2014. Bypass Top of Levee Surveys Methods and Results. Prepared for California Dept. of Water Resources, January 2014.
-15- ARP/MM 8/21/14

APPENDIX A
EXHIBIT MAPS
-A.1- ARP/MM 8/21/14
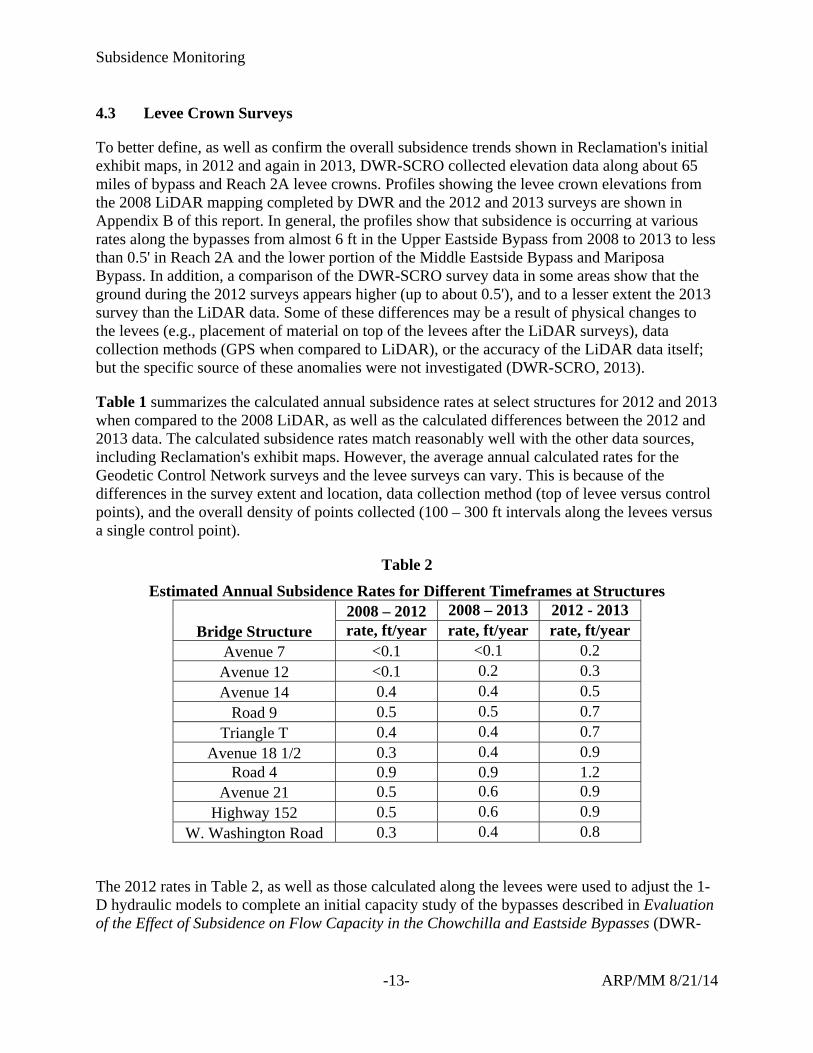
Appendix A - Exhibit Maps
Figure A.1. Annual Subsidence Rate Exhibit Map for December 2011 to July 2012
-A.2- ARP/MM 8/21/14

Appendix A - Exhibit Maps
Figure A.2. Annual Subsidence Rate Exhibit Map for July 2012 to December 2012
-A.3- ARP/MM 8/21/14

Appendix A - Exhibit Maps
Figure A.3. Annual Subsidence Rate Exhibit Map for December 2012 to July 2013
-A.4- ARP/MM 8/21/14

Appendix A - Exhibit Maps
Figure A.4. Annual Subsidence Rate Exhibit Map for July 2013 to December 2013
-A.5- ARP/MM 8/21/14

APPENDIX B
LEVEE PROFILES
-B.1- ARP/MM 8/21/14
Appendix B - Levee Profiles
Figure B.1 Ground subsidence along the left levee in Reach 2A upstream of the San Joaquin River Bifurcation Structure based on the 2012 and 2013 survey and 2008 LiDAR.
-B.2- ARP 8/21/14

Appendix B - Levee Profiles
Figure B.2. Ground subsidence along the right levee in Reach 2A upstream of the San Joaquin River Bifurcation Structure based on the 2012 and 2013 survey and 2008 LiDAR.
-B.3- ARP 8/21/14
Appendix B - Levee Profiles
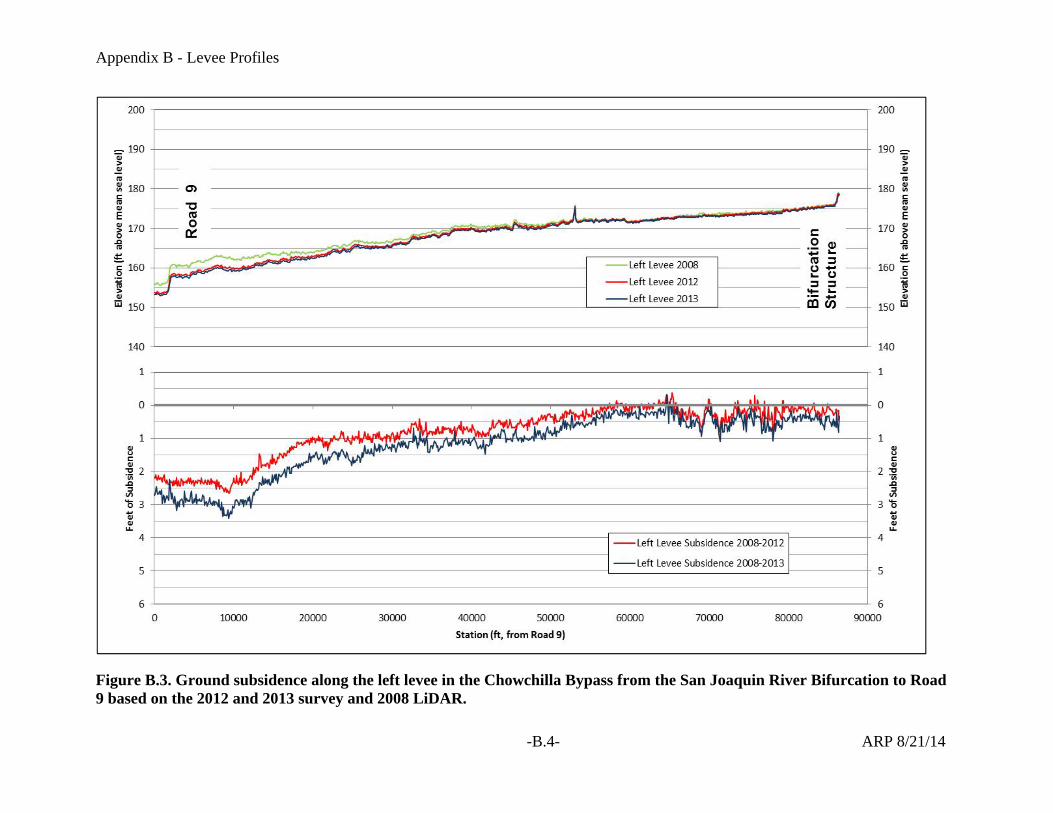
Figure B.3. Ground subsidence along the left levee in the Chowchilla Bypass from the San Joaquin River Bifurcation to Road 9 based on the 2012 and 2013 survey and 2008 LiDAR.
-B.4- ARP 8/21/14

Appendix B - Levee Profiles
Figure B.4. Ground subsidence along the right levee in the Chowchilla Bypass from the San Joaquin River Bifurcation to Road 9 based on the 2012 and 2013 survey and 2008 LiDAR.
-B.5- ARP 8/21/14

Appendix B - Levee Profiles
Figure B.5. Ground subsidence along the left levee in the Upper and Middle Eastside Bypasses from Road 9 to the Eastside Bypass Control Structure based on the 2012 and 2013 survey and 2008 LiDAR.
-B.6- ARP 8/21/14

Appendix B - Levee Profiles
Figure B.6. Ground subsidence along the right levee in the Upper and Middle Eastside Bypasses from Road 9 to the Eastside Bypass Control Structure based on the 2012 and 2013 survey and 2008 LiDAR.
-B.7- ARP 8/21/14

Appendix B - Levee Profiles
Figure B.7. Ground subsidence along the left levee in the Mariposa Bypass based on the 2012 and 2013 survey and 2008 LiDAR.
-B.8- ARP 8/21/14
Appendix B - Levee Profiles
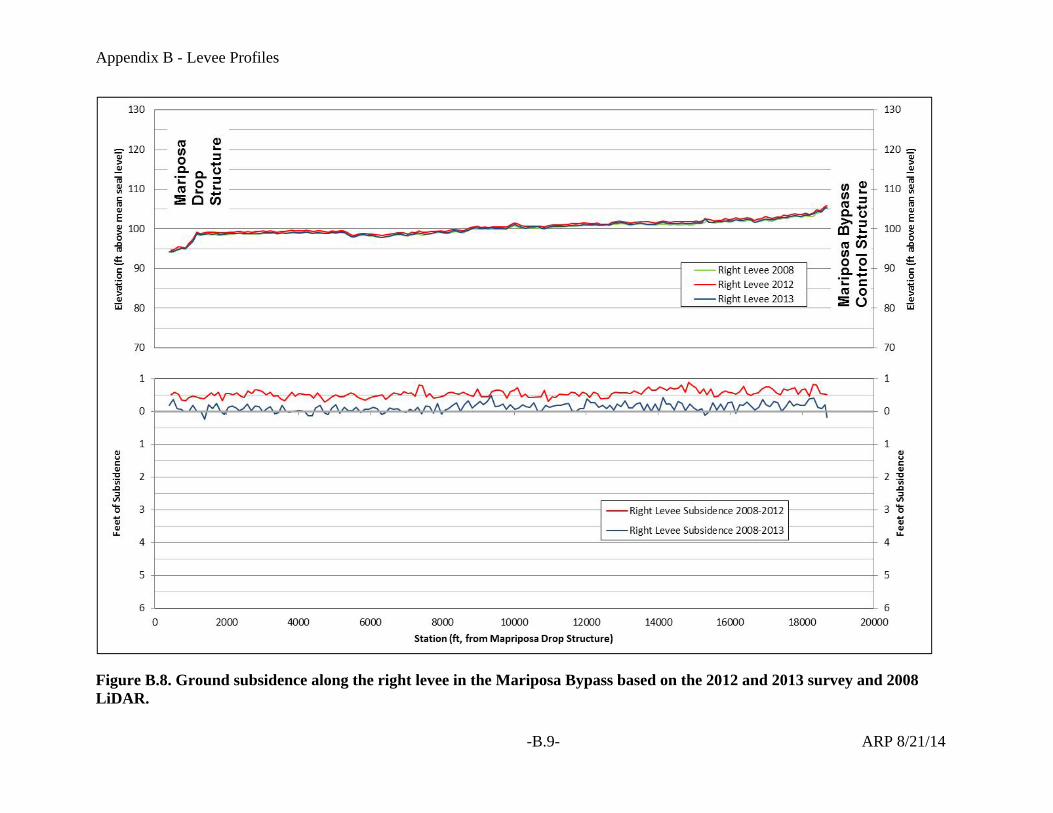
Figure B.8. Ground subsidence along the right levee in the Mariposa Bypass based on the 2012 and 2013 survey and 2008 LiDAR.
-B.9- ARP 8/21/14