Embed Size (px)
Citation preview

APPENDIX E
History and Projection of Traffic, Toll Revenues and Expenses and Review of Physical Conditions of the Facilities of Triborough Bridge and Tunnel Authority
Prepared for: Triborough Bridge and Tunnel Authority
Prepared by: Stantec Consulting Services, Inc.
April 30, 2019

HISTORY AND PROJECTION OF TRAFFIC, TOLL REVENUES AND EXPENSES AND REVIEW OF PHYSICAL CONDITIONS OF THE FACILITIES OF TRIBOROUGH BRIDGE AND TUNNEL AUTHORITY
i
TABLE OF CONTENTS Page
TRANSPORTATION INFRASTRUCTURE ............................................................................................................... 1 TBTA Facilities ........................................................................................................................................ 1 Metropolitan Area Arterial Network ................................................................................................. 4 Other Regional Toll Facilities .............................................................................................................. 4 Regional Public Transportation ......................................................................................................... 5 The Central Business District Tolling Program .................................................................................. 6
TOLL COLLECTION ON THE TBTA FACILITIES ................................................................................................... 6 Present and Proposed Toll Structures and Operation .................................................................. 6 Cashless Tolling System ..................................................................................................................... 13 TBTA’s Role in E-ZPass......................................................................................................................... 14 Cashless, Open Road Tolling (“Cashless Tolling”) ....................................................................... 16 Passenger Car Toll Rate Trends and Inflation ............................................................................... 16
HISTORICAL TRAFFIC, REVENUES AND EXPENSES AND ESTIMATED/BUDGETED NUMBERS FOR 2018 ...................................................................................................................................................... 19 Traffic and Toll Revenue, 2008 to 2018 .......................................................................................... 22 Traffic by Facility and Vehicle Class, 2018 .................................................................................... 25 Monthly Traffic, 2018 ......................................................................................................................... 26 Changes in Monthly Traffic, 2017 to 2018 ..................................................................................... 27 Operating Expenses, 2008 to 2018 ................................................................................................. 28
FACTORS AFFECTING TRAFFIC GROWTH ..................................................................................................... 31 Employment, Population, and Motor Vehicle Registrations ..................................................... 31 Fuel Availability and Prices .............................................................................................................. 41 Toll Increase Impacts, Collection Methods, and Elasticity ........................................................ 45 Availability of Capacity on TBTA Facilities .................................................................................... 47 TBTA and Regional Operational and Construction Impacts..................................................... 48 Summary of Assumptions and Conditions .................................................................................... 64
PROJECTED TRAFFIC, REVENUES, AND EXPENSES ....................................................................................... 66 Estimated Traffic and Toll Revenue, 2019 ..................................................................................... 66 Traffic and Toll Revenue at Current Tolls ....................................................................................... 68 Traffic and Toll Revenue with Assumed 2021 Toll Increase ........................................................ 68 Effects of Second Avenue Subway Construction in Forecast Years ....................................... 71 Effects of Cashless Tolling in Forecast Years ................................................................................. 71 Operating Expenses .......................................................................................................................... 71 Net Revenues from Toll Operations ................................................................................................ 72
REVIEW OF PHYSICAL CONDITIONS .............................................................................................................. 73 Post-Superstorm Sandy Reports, Capital Investments, and Rehabilitation ............................ 74 Inspection Reports, Flagged Conditions and Rehabilitation Projects ..................................... 75 Other System Wide Improvements ................................................................................................. 83 Long-Term Outlook for TBTA Facilities ............................................................................................. 84
CONCLUDING REMARKS ................................................................................................................................ 84

HISTORY AND PROJECTION OF TRAFFIC, TOLL REVENUES AND EXPENSES AND REVIEW OF PHYSICAL CONDITIONS OF THE FACILITIES OF TRIBOROUGH BRIDGE AND TUNNEL AUTHORITY
ii
LIST OF TABLES Page
Table 1 Current Toll Rates at TBTA Facilities, Effective Since March 31, 2019 ........................................ 8 Table 2 Year-End E-ZPass Participation Rates ............................................................................................ 14 Table 3 Historical Trends in Cash, TBM and E-ZPass Passenger Car Toll Rates ..................................... 18 Table 4 E-ZPass Passenger Toll Rates versus Consumer Price Index ....................................................... 19 Table 5 Annual Toll-Paying Traffic and Toll Revenue, 2008 to 2018 ....................................................... 23 Table 6 Summary of Annual Paid Traffic and Toll Revenue, 2008 to 2018............................................ 24 Table 7 Actual Changes in January - February Traffic, 2018 to 2019 .................................................... 25 Table 8 Traffic by Facility and Vehicle Class, 2018 .................................................................................... 26 Table 9 Monthly Traffic Variations, 2018 ...................................................................................................... 27 Table 10 Changes in Monthly Average Daily Traffic, 2017 to 2018 ....................................................... 28 Table 11 Historical Operating Expenses, 2008 to 2018 ............................................................................. 29 Table 12 Employment Trends ........................................................................................................................ 33 Table 13 Employment Projections ................................................................................................................ 34 Table 14 Labor Force(a) Conditions, 2010 & 2018 ...................................................................................... 35 Table 15 Housing Building Permits Issued within the City, 2015 - 2018 ................................................... 36 Table 16 Major Manhattan Office Buildings Under Construction in 2019 ............................................. 37 Table 17 Population Trends 1970 to 2017 .................................................................................................... 38 Table 18 Population Projections ................................................................................................................... 39 Table 19 Motor Vehicle Registrations .......................................................................................................... 40 Table 20 New York City Motor Vehicle Registrations, 2014 to 2018 ....................................................... 41 Table 21 Elasticity Factors .............................................................................................................................. 47 Table 22 Estimated Percent Change in Average Toll Rates and Traffic in 2021 ................................. 47 Table 23 Estimated Changes in Annual Traffic, 2018 to 2019 ................................................................. 67 Table 24 Estimated 2019 Toll-Paying Traffic and Toll Revenue ............................................................... 67 Table 25 Traffic and Toll Revenue Forecast, Constant Tolls ..................................................................... 69 Table 26 Traffic and Toll Revenue Forecast with Assumed 2021 Toll Increase .................................... 70 Table 27 Projected Operating Expenses .................................................................................................... 72 Table 28 Net Toll Revenue Forecast............................................................................................................. 73 Table 29 Opening Dates of TBTA Facilities .................................................................................................. 73 Table 30 Capital Investments by Facility, 1992 through 2018 ................................................................. 74 Table 31 Facility Inspection Firms .................................................................................................................. 77 Table 32 TBTA 2015-2019 Capital Program by Facility .............................................................................. 78
LIST OF FIGURES Page
Figure 1 TBTA Toll Facilities Location Map ..................................................................................................... 2 Figure 2A/2B Aggregated TBTA Facilities Paid Traffic and Toll Revenue, 1970 to 2018 ..................... 21 Figure 3A/3B New York City Gas Prices Compared to New York State VMT and TBTA Bridges and Tunnels Total Transactions .............................................................................................................................. 44

HISTORY AND PROJECTION OF TRAFFIC, TOLL REVENUES AND EXPENSES AND REVIEW OF PHYSICAL CONDITIONS OF THE FACILITIES OF TRIBOROUGH BRIDGE AND TUNNEL AUTHORITY
1
April 30, 2019 To the Triborough Bridge and Tunnel Authority:
In accordance with your request, Stantec Consulting Services Inc. (Stantec) conducted this annual study to develop projections of traffic, toll revenues, and expenses for the toll bridge and tunnel facilities operated by the Triborough Bridge and Tunnel Authority (TBTA), and to provide an overview of the physical conditions of each facility. We have reviewed the bridge and tunnel inspection reports provided by TBTA and discussed TBTA’s ongoing maintenance and capital programs with its engineering staff.
Our projections have taken into account: (1) the general physical condition of TBTA’s toll facilities; (2) traffic and toll revenue data, reflecting the 19 toll increases since 1972, including the most recent toll increase effective March 2019; (3) the impact of the E-ZPass electronic toll collection system; (4) the impact of systemwide Cashless Tolling implementation; (5) the toll structure; (6) planned and possible future toll increases; (7) economic, population, employment, and other demographic forecasts in the New York Metropolitan Area; (8) fuel availability and prices; (9) the traffic capacities of the bridges and tunnels and the existing roadway network that feeds the facilities in terms of the potential for future growth of peak versus non-peak period traffic; (10) current and programmed construction activities on TBTA’s facilities and the arterial highway network serving the New York Metropolitan Area, including the toll-free Harlem and East River bridges; and (11) mass transit network projects.
The effects of the Central Business District Tolling Program (described later in this report) have not been included in Stantec’s forecast. Since the program is still under development, there is not enough information available to make assumptions regarding any impacts on the TBTA facilities or projected revenues. However, such a program could have an observable impact on travel patterns and a tangible impact on TBTA revenue, none of which is reflected in this report.
In 2018, actual total toll revenues for the TBTA facilities were $1.965 billion, or 1.2 percent higher than our 2018 forecast of $1.942 billion and 2.8 percent higher than actual 2017 toll revenue. Total revenue traffic in 2018 was 322.3 million vehicles, which was 2.6 percent higher than our 2018 forecast of 314.2 million vehicles and 4.0 percent higher than actual 2017 traffic.
TRANSPORTATION INFRASTRUCTURE
The New York Metropolitan Area’s transportation infrastructure consists of an extensive network of highways, tunnels, and bridges (both tolled and toll-free), regional bus and commuter rail, and the New York City transit system.
TBTA Facilities
TBTA operates nine toll facilities within New York City (the “City”), consisting of seven bridges and two tunnels that provide vital links across the City’s rivers and bays. In 2018, these facilities carried 322.3 million total toll-paying vehicles and generated $1.965 billion in total toll revenue. The

HISTORY AND PROJECTION OF TRAFFIC, TOLL REVENUES AND EXPENSES AND REVIEW OF PHYSICAL CONDITIONS OF THE FACILITIES OF TRIBOROUGH BRIDGE AND TUNNEL AUTHORITY
2
locations of the facilities are shown in the context of the regional highway network on the following map.
Figure 1 TBTA Toll Facilities Location Map
HISTORY AND PROJECTION OF TRAFFIC, TOLL REVENUES AND EXPENSES AND REVIEW OF PHYSICAL CONDITIONS OF THE FACILITIES OF TRIBOROUGH BRIDGE AND TUNNEL AUTHORITY
3
The facilities are briefly described as follows:
Verrazzano-Narrows Bridge - a two-level suspension bridge that crosses the entrance to New York Harbor and connects Brooklyn and Staten Island, with seven lanes of traffic on the upper level, including a reversible HOV lane, and six lanes of traffic on the lower level. The fully reversible lane on the upper level was implemented in September 2017.
Robert F. Kennedy (RFK) Bridge (formerly the Triborough Bridge) - a three bridge structure with connecting viaducts or elevated expressways, which crosses the East River the Harlem River, and Bronx Kill connecting the boroughs of Queens, Manhattan, and the Bronx. Opened to traffic in 1936, it generally carries eight traffic lanes between Queens and the Bronx crossing Astoria Park, Wards Island and Randall’s Island. The bridge widens out to nine lanes over Astoria Park and Wards Island to provide dedicated exit lanes for Hoyt Avenue and Wards Island from the Queens bound roadway. The bridge also generally carries six traffic lanes between Randall’s Island and Manhattan. These three major crossings are interconnected by viaducts and the Randall’s Island Interchange, which facilitates traffic flow in two directions.
Bronx-Whitestone Bridge - a suspension bridge, with three lanes of traffic in each direction, which crosses the East River connecting the boroughs of Queens and the Bronx.
Throgs Neck Bridge - a suspension bridge with three lanes of traffic in each direction, which crosses the upper East River connecting the boroughs of Queens and the Bronx.
Queens Midtown Tunnel - a twin-tube tunnel with each tube carrying two lanes of traffic under the East River between the boroughs of Queens and Manhattan. During normal morning commuting hours, three lanes are operated inbound into Manhattan.
Hugh L. Carey Tunnel (formerly the Brooklyn-Battery Tunnel) - a twin-tube tunnel with each tube carrying two lanes of traffic under the East River connecting the southern tip of Manhattan with Brooklyn. During normal commuting hours, three lanes are operated in the peak traffic direction.
Henry Hudson Bridge - a two-level steel arch bridge with three southbound lanes on its lower deck and three northbound lanes on its upper deck, which crosses the Harlem River to connect the northern tip of Manhattan with the Spuyten Duyvil section of the Bronx.
Marine Parkway - Gil Hodges Memorial Bridge (Marine Parkway) - a four-lane crossing of the Rockaway Inlet that connects the Rockaway peninsula in Queens with Brooklyn.
Cross Bay Veterans Memorial Bridge (Cross Bay) - a precast post-tensioned concrete T-girder bridge connecting the Rockaway peninsula in Queens with the Queens mainland, via Broad Channel. The bridge has three lanes of traffic in each direction crossing Beach Channel in Jamaica Bay, dropping to two lanes to align with the Cashless Tolling gantries and Cross Bay Boulevard.
HISTORY AND PROJECTION OF TRAFFIC, TOLL REVENUES AND EXPENSES AND REVIEW OF PHYSICAL CONDITIONS OF THE FACILITIES OF TRIBOROUGH BRIDGE AND TUNNEL AUTHORITY
4
Metropolitan Area Arterial Network
The New York Metropolitan Area is served by an extensive network of highway facilities. Many of the bridges and tunnels operated by TBTA are links in the Interstate highway network, as these limited-access expressways pass through the City to serve both local and long-distance traffic. These regional facilities were also shown in Figure 1.
The Verrazzano-Narrows Bridge is adjacent to I-278 (Staten Island, Gowanus, and Brooklyn-Queens Expressways), which connects with the Hugh L. Carey Tunnel and the RFK Bridge. The Queens Midtown Tunnel joins I-495 (Long Island Expressway) with Manhattan. The RFK Bridge joins I-87 (Major Deegan Expressway) and I-278 (Bruckner Expressway) with I-278/Grand Central Parkway in Queens and the FDR and Harlem River Drives in Manhattan. The Bronx-Whitestone Bridge carries traffic between the Hutchinson River and Merritt Parkways and Long Island via I-678 (Whitestone and Van Wyck Expressways) and the Cross Island Parkway. The Throgs Neck Bridge carries traffic between I-95 (New England Thruway and George Washington Bridge) and Long Island via I-295. The Henry Hudson Bridge is part of the Henry Hudson Parkway (Route 9A), a major commuter route into Manhattan from the extensive parkway network in western Westchester County and beyond.
In addition to TBTA facilities and their expressway/parkway connections, the City’s toll-free East River bridges — Brooklyn, Manhattan, Williamsburg, and Ed Koch Queensboro — also connect Manhattan with Brooklyn and Queens; and nine toll-free bridges over the Harlem River connect Manhattan with the Bronx. Unlike the TBTA facilities, the approaches to these bridges are mostly surface arterials, such as Flatbush Avenue and Queens Boulevard. Only a few have expressway ramp connections (such as the Brooklyn-Queens Expressway connections to the Brooklyn, Manhattan, and Williamsburg Bridges). The Alexander Hamilton Bridge, as part of I-95, connects the Trans-Manhattan Expressway and the Cross Bronx Expressway.
Other Regional Toll Facilities
TBTA is one of a number of toll authorities that operate bridge, tunnel, and highway facilities in the New York Metropolitan Area. The agency whose facilities are geographically closest to TBTA’s bridges and tunnels is the Port Authority of New York and New Jersey (the “Port Authority”). The Port Authority’s George Washington Bridge is linked to the RFK, Bronx-Whitestone, and Throgs Neck Bridges via the expressway system in the Bronx, to the RFK Bridge via the Harlem River Drive in Manhattan, and to the Henry Hudson Bridge via the Henry Hudson Parkway in Manhattan, while the Bayonne Bridge, Goethals Bridge, and Outerbridge Crossing are linked to the Verrazzano-Narrows Bridge via the expressway system in Staten Island. Only motorists using the Port Authority’s two tunnels — Holland and Lincoln — must traverse surface streets (in Manhattan) to reach TBTA’s and the City’s East River crossings. The other toll authorities in the region and the toll facilities they operate are the New York State Thruway Authority’s (the “Thruway”) Governor Mario M. Cuomo Bridge (formerly Tappan Zee Bridge) and several Thruway sections, New York State Bridge Authority (five upstate Hudson River bridges), and the New Jersey Turnpike Authority (Garden State Parkway and New Jersey Turnpike).

HISTORY AND PROJECTION OF TRAFFIC, TOLL REVENUES AND EXPENSES AND REVIEW OF PHYSICAL CONDITIONS OF THE FACILITIES OF TRIBOROUGH BRIDGE AND TUNNEL AUTHORITY
5
The E-ZPass System
All of these authorities, together with many others outside of the New York Metropolitan Area, are linked through the E-ZPass Interagency Group (E-ZPass Group) originally designed to better serve just the regional traveler through a common electronic toll collection tag. To further expand its footprint, the E-ZPass Group streamlined its membership categories to align with the future needs of national interoperability. On March 8, 2018, a “Sponsored Affiliate” membership category was approved, replacing the National Affiliate, permitting public and private toll road operators to become interoperable with E-ZPass Group members by using equipment that is compatible with the E-ZPass system and allowing them to use a sponsoring Full Member’s customer service center for transaction processing. The E-ZPass Group is also conducting ongoing discussions about regional electronic toll interoperability with representatives of toll agencies in the Central, Southeastern, and Western states, exploring solutions that would allow the regions to process each other’s transactions. E-ZPass and its impact on the TBTA facilities are discussed further in this report.
Cashless Tolling in the Region
All nine of the TBTA’s bridges and tunnels are exclusively Cashless Tolling crossings. The Port Authority’s Bayonne Bridge and the Thruway’s Governor Mario M. Cuomo Bridge (formerly the Tappan Zee Bridge) and Grand Island Bridges are also cashless. Under Cashless Tolling, toll equipment is mounted on gantries, traditional toll plazas are demolished and roadways reconfigured so that traffic flows freely across the facilities. Tolls continue to be paid using E-ZPass tags which are mounted on vehicles (typically windshields) and associated with E-ZPass accounts; the gantry-based E-ZPass antennas read the on-board tags and tolls are electronically debited from the associated E-ZPass accounts. For vehicles without E-ZPass tags, license plate images are taken and matched with information from the applicable Department of Motor Vehicles (DMV) so that toll bills can be sent to registered owners under the authorities’ Tolls by Mail (TBM)program.
Regional Public Transportation
In addition to the TBTA facilities, most of the public transportation facilities within the City and the suburban counties north and east of the City are part of the Metropolitan Transportation Authority (MTA) system. These include the New York City Transit Authority and the Manhattan and Bronx Surface Transit Operating Authority (its subsidiary), MTA Bus Company, Staten Island Rapid Transit Operating Authority, Metro-North Commuter Railroad Company, and the Long Island Rail Road Company.
For those TBTA facilities directly serving Manhattan — Henry Hudson Bridge, RFK Bridge, Queens Midtown Tunnel, and Hugh L. Carey Tunnel — motorists can, for the most part, choose to use public transit as an alternative. For the outlying bridges, however, the choice is more difficult due to more limited availability of public transportation options or different trip characteristics (e.g., trip purpose, trip origin and destination).
HISTORY AND PROJECTION OF TRAFFIC, TOLL REVENUES AND EXPENSES AND REVIEW OF PHYSICAL CONDITIONS OF THE FACILITIES OF TRIBOROUGH BRIDGE AND TUNNEL AUTHORITY
6
The Central Business District Tolling Program
The New York State Fiscal Year 2019-2020 Enacted Budget establishes the Central Business District Tolling Program (“CBD Tolling Program”), the goals of which are to reduce traffic congestion in the Manhattan Central Business District, improve air quality, and provide a stable and reliable funding source for the repair and revitalization of the MTA’s public transportation systems.
TBTA is directed to establish the CBD Tolling Program. The program will operate in the Central Business District or “CBD”, defined as roadways, bridges, tunnels, approaches or ramps located within or entering into Manhattan south of and inclusive of 60th Street, not including the FDR Drive or the West Side Highway (which includes the Battery Park underpass and or any surface roadway portion of the Hugh L. Carey Tunnel that connects to West Street).
All capital and operating costs for the CBD Tolling Program will be funded by revenues generated from the program. The NYS Legislature has appropriated $100 million as an advance to the MTA for the capital project costs of the planning, design, acquisition and construction, required or expected to be required to implement the CBD Tolling Program’s infrastructure and collection system. No portion of the legislative appropriation will be available for expenditure until the MTA has entered into a repayment agreement with the NYS Director of Budget providing for repayment to the State of an amount equal to the amount disbursed from this appropriation and any associated financing costs. The agreement is currently being negotiated by the parties.
At this time, it is unclear how the CBD Tolling Program will affect both transactions and revenues for the nine TBTA bridges and tunnels. Since the date of activation, tolling structure, tolling rates, and possible credits have not yet been established, Stantec is unable to include the effects of the CBD Tolling Program on traffic patterns and TBTA revenues in its forecast. However, upon implementation of the CBD Tolling Program, there could be an observable impact on travel patterns and a tangible impact on TBTA revenue, none of which are reflected in this report.
TOLL COLLECTION ON THE TBTA FACILITIES
The nine TBTA toll facilities are broken down into four toll pricing structures: major crossings, minor crossings, Henry Hudson Bridge, and the Verrazzano-Narrows Bridge. The major crossings for this purpose include the RFK Bridge, Bronx-Whitestone Bridge, Throgs Neck Bridge, Queens Midtown Tunnel, and Hugh L. Carey Tunnel. The minor crossings are the Marine Parkway Bridge and Cross Bay Bridge. The Henry Hudson Bridge is the only facility limited to vehicles that are authorized to use parkways. The Verrazzano-Narrows Bridge is the only TBTA facility on which tolls are collected in one direction only.
Present and Proposed Toll Structures and Operation
The current toll structure, in place since the March 31, 2019 toll increase, is shown in Table 1. Tolls are determined using a basic rate as modified by variables specific to a number of factors, including:

HISTORY AND PROJECTION OF TRAFFIC, TOLL REVENUES AND EXPENSES AND REVIEW OF PHYSICAL CONDITIONS OF THE FACILITIES OF TRIBOROUGH BRIDGE AND TUNNEL AUTHORITY
7
• crossing used; • vehicle classification; • toll payment method; • place of residence; and • vehicle occupancy.
This study uses the phrase “Tolls by Mail” (TBM) to refer to crossing rates charged for the use of fare media other than E-ZPass by New York E-ZPass Customer Service Center (NYCSC) customers, historic cash customers through September 29, 2017, and current TBM customers. (see 21 NYCRR §1021.1). As presented in Table 1, E-ZPass toll rates apply only to customer tags issued by the NYCSC (this includes TBTA, the Port Authority, the Thruway, the Buffalo and Fort Erie Public Bridge Authority [Peace Bridge], and New York State Bridge Authority). TBM toll rates are charged to non-NYCSC E-ZPass customers (effective July 12, 2009), as well as to TBM customers at all nine TBTA facilities, reflecting the systemwide implementation of Cashless Tolling completed in 2017. Only NYCSC E-ZPass customers are eligible for the lower E-ZPass toll rates. Any motorist, regardless of residence, can obtain a NYCSC transponder.
Under the TBM program, license plate images for vehicles without E-ZPass tags are matched with information from the applicable DMV and a toll bill is mailed to the vehicle’s owner.

HISTORY AND PROJECTION OF TRAFFIC, TOLL REVENUES AND EXPENSES AND REVIEW OF PHYSICAL CONDITIONS OF THE FACILITIES OF TRIBOROUGH BRIDGE AND TUNNEL AUTHORITY
8
Table 1 Current Toll Rates at TBTA Facilities, Effective Since March 31, 2019
Classification
Verrazzano-Narrows Bridge(a)
RFK Bridge Bronx-Whitestone Bridge
Throgs Neck Bridge Queens Midtown Tunnel
Hugh L. Carey Tunnel
Henry Hudson Bridge
Marine Parkway- Gil Hodges Memorial
Bridge Cross Bay Veterans
Memorial Bridge
TBM E-ZPass(b) TBM E-ZPass(b) TBM E-ZPass(b) TBM E-ZPass(b) Two-axle vehicles, including: Passenger vehicles, SUVs, station wagons, self-propelled mobile homes, ambulances, hearses, vehicles with seating capacity of not more than 15 adult persons (including the driver) and trucks with maximum gross weight of 7,000 lbs. and under
$19.00 $12.24 $9.50 $6.12 $7.00 $2.80 $4.75 $2.29
Each additional axle costs 8.00 8.00 4.00 4.00 3.00 3.00 3.00 3.00 The following reduced rate prepaid charges are presently available for the two-axle vehicles referenced above:
Charge per crossing for E-Tokens 3.17(c) Charge per crossing for E-Tokens for registered Rockaway Peninsula/Broad Channel Residents using an eligible vehicle 2.05(c)
Registered Rockaway Residents using an eligible vehicle 1.49(d) Charge per crossing for registered Staten Island Residents using an eligible vehicle with three or more occupants (HOV) paying with E-Tickets 3.40(c)
Charge per crossing for E-Tokens for registered Staten Island Residents using an eligible vehicle through paying with E-Tokens 9.80(c)
Registered Staten Island Residents using an eligible vehicle taking 3 or more trips per month 6.88(e) Registered Staten Island Residents using an eligible vehicle taking less than 3 trips per month 7.26(f) All two-axle vehicles greater than 7,000 lbs. and buses (other than franchise buses and motor homes) 38.00 22.12 19.00 11.06
(g) (g)
9.50 5.53 3 Axle 62.58 36.24 31.29 18.12 15.65 9.06 4 Axle 78.24 46.32 39.12 23.16 19.56 11.58 5 Axle 102.82 60.38 51.41 30.19 25.71 15.10 6 Axle 118.48 70.46 59.24 35.23 29.62 17.62 7 Axle 147.52 84.52 73.76 42.26 36.88 21.13 Each additional axle above 7 22.36 14.12 11.18 7.06 5.59 3.53 Two-axle franchise buses 8.86 4.43 2.21 Three-axle franchise buses 10.52 5.26 2.77 Motorcycles 8.00 5.32 4.00 2.66 4.00 1.91 4.00 1.91 Notes: (a) Under the Verrazzano-Narrows Bridge one-way crossing charge collection program toll is collected only in the westbound direction in accordance with federal law. As discussed in this report, the MTA also has two toll rebate programs
at the Verrazzano-Narrows Bridge for eligible Staten Island residents and qualifying commercial vehicles using the same New York Customer Service Center (NYCSC) E-ZPass account. (b) E-ZPass crossing charges apply to NYCSC E-ZPass customers only; customers of other E-ZPass CSCs are charged the TBM toll. Any motorist, regardless of residence, can obtain a NYCSC transponder. (c) Tolls are charged per transaction for E-Tokens and E-tickets using a registered E-ZPass tag. (d) Effective April 1, 2012, eligible Rockaway Peninsula and Broad Channel residents using E-ZPass at the Cross Bay Bridge (CBB) receive a full rebate of the Rockaway Resident E-ZPass toll from the MTA. It is likely that the MTA will continue
the CBB rebate program at its current level only if there is sufficient funding to do so. Should there not be sufficient funding to continue the CBB rebate program at its current level, the rebate program would likely revert to the level that existed prior to April 1, 2012, where Rockaway Residents paid the Rockaway Resident E-ZPass toll for the first two trips and received the rebate only for subsequent trips taken during a calendar day using the same E-ZPass tag.
(e) After $1.38 rebate, effective toll is $5.50 per trip. (f) After $1.76 rebate, effective toll is $5.50 per trip. (g) Passage prohibited.

HISTORY AND PROJECTION OF TRAFFIC, TOLL REVENUES AND EXPENSES AND REVIEW OF PHYSICAL CONDITIONS OF THE FACILITIES OF TRIBOROUGH BRIDGE AND TUNNEL AUTHORITY
9
Passenger Car Tolls
As noted, TBTA crossings are separated into four categories for toll pricing structure purposes: major crossings, minor crossings, the Verrazzano-Narrows Bridge, and the Henry Hudson Bridge. The single trip passenger car TBM toll is $9.50 for the major crossings and $19.00 for the Verrazzano-Narrows Bridge. The minor crossing passenger car TBM toll is $4.75 on the Marine Parkway and Cross Bay Bridges, which is half the level ($9.50) of those on the major crossings. On the Henry Hudson Bridge, the passenger car toll is $7.00 for TBM customers. All tolls are collected in each direction except on the Verrazzano-Narrows Bridge where the round-trip tolls are collected only in the westbound (Staten Island-bound) direction in accordance with federal law.
Tolls for passenger cars are reduced by TBTA under the following programs: (1) NYCSC E-ZPass; (2) E-Tokens required by statute; (3) place of residence/crossing used; (4) place of residence/vehicle occupancy; and (5) some combination of the foregoing. The MTA also has toll rebate programs for certain eligible residents using NYCSC E-ZPass at the Cross Bay and Verrazzano-Narrows Bridges. MTA reimburses TBTA in full for these rebates with a combination of its own funds and New York State funds. It was announced in April 2019 that a portion of the Outer Borough Transportation Account, created in 2018 under Public Authorities Law Section 1270-i, would be used to provide rebates beginning in 2020 to Queens residents using the Cross Bay Bridge and Bronx residents crossing the Henry Hudson Bridge, as described in greater detail below under the heading, “Outer Borough Transportation Account Rebates.”
Open road, Cashless Tolling has been implemented at all TBTA crossings, enabling a free flow of traffic past overhead gantries with vehicle classification, license plate image cameras and E-ZPass sensors. For vehicles without an E-ZPass, a TBM invoice is sent to the vehicle’s registered owner. Under the current toll schedule, passenger cars equipped with a NYCSC E-ZPass receive a $3.38 reduction per trip at all major crossings and a $6.76 reduction at the Verrazzano-Narrows Bridge, where the round-trip toll is collected only in the westbound direction, and $2.46 reduction at the Cross Bay and Marine Parkway Bridges. On the Henry Hudson Bridge, passenger cars with a NYCSC E-ZPass receive a $4.20 reduction per trip. Passenger cars equipped with a transponder not issued by the NYCSC pay the same toll rate as TBM customers. Any motorist, regardless of residence, can obtain a NYCSC transponder.
Toll Discounts for Passenger Cars
TBTA provides toll discounts by means of resident E-Tokens and NYCSC E-ZPass to registered Rockaway Peninsula and Broad Channel residents (“Rockaway Residents”) on the Cross Bay and Marine Parkway Bridges and registered residents of Staten Island (“Staten Island Residents”) on the Verrazzano-Narrows Bridge. Under the current toll schedule, eligible Rockaway Residents paying with an E-Token using a registered E-ZPass tag receive a $1.58 reduction per trip at the Cross Bay and Marine Parkway Bridges. Rockaway Residents using a registered Rockaway Resident E-ZPass tag receive a $3.26 reduction per trip at the Cross Bay and Marine Parkway Bridges.
HISTORY AND PROJECTION OF TRAFFIC, TOLL REVENUES AND EXPENSES AND REVIEW OF PHYSICAL CONDITIONS OF THE FACILITIES OF TRIBOROUGH BRIDGE AND TUNNEL AUTHORITY
10
Eligible Staten Island Residents paying with an E-Token using a registered E-ZPass tag will receive a $9.20 reduction per trip at the Verrazzano-Narrows Bridge where the round-trip toll is collected only in the westbound direction. Staten Island Residents paying with a registered Staten Island Resident E-ZPass tag receive a $12.12 reduction per trip if they take three or more trips across the Verrazzano-Narrows Bridge per month and a $11.74 reduction per trip if they take one or two trips across the bridge per month. TBTA also provides a carpool toll discount by means of an E-Ticket Plan on the Verrazzano-Narrows Bridge to Staten Island Residents using registered vehicles with three or more passengers and a switchable High Occupancy Vehicle E-ZPass tag. Under the current toll schedule, eligible Staten Island Residents paying with an E-Ticket using a registered E-ZPass tag receive a $15.60 reduction per trip at the Verrazzano-Narrows Bridge.
Tolls for Vehicles over 7,000 Pounds
The toll charges for vehicles over 7,000 pounds are a function of number of axles as well as the crossing used. For the major crossings, the present TBM rate for these vehicles is $19.00 for two axles, increasing to $73.76 for a seven-axle vehicle (rates at the Verrazzano-Narrows Bridge are doubled since the toll is collected in the westbound direction only). These vehicles receive a reduction of approximately 42 percent with a NYCSC E-ZPass. Vehicles with more than seven axles pay a TBM rate of $11.18 for each additional axle over seven and a NYCSC E-ZPass rate of $7.06 for each additional axle over seven. Vehicles with three to six axles pay varying rates, which increase with the number of axles, as shown in Table 1.
For the minor crossings, the two-axle TBM rate for vehicles over 7,000 pounds is $9.50, increasing to $36.88 for a seven-axle vehicle. These vehicles presently receive approximately a 42 percent reduction with a NYCSC E-ZPass tag. Vehicles with three to six axles pay varying rates, which increase with the number of axles, as shown in Table 1. Vehicles with more than seven axles pay a TBM rate of $5.59 for each additional axle over seven and a NYCSC E-ZPass rate of $3.53 for each additional axle over seven. Commercial vehicles are not permitted on the Henry Hudson Bridge without a New York City Department of Transportation (NYCDOT) permit.
The MTA also has a partial toll rebate program for eligible NYCSC E-ZPass commercial customers at the Verrazzano-Narrows Bridge.
MTA's Toll Rebate Programs
Toll rebate programs have been and remain available for: (1) registered residents of Broad Channel and the Rockaway Peninsula (“Rockaway Residents”) for use of the Cross Bay Bridge; (2) Staten Island residents participating in the Staten Island Resident (“SIR”) E-ZPass discount program (the “SIR Rebate Program”) for use of the Verrazzano-Narrows Bridge; and (3) commercial vehicles participating in the Verrazzano-Narrows Bridge Commercial Rebate Program (“VNB Commercial Rebate Program”). In this section there is a discussion of the two new toll rebate programs announced in April 2019 for Queens residents over the Cross Bay Bridge and Bronx residents over the Henry Hudson Bridge. The MTA toll rebate programs are available only to residents with registered NYCSC E-ZPass tags, and to commercial vehicles with more than ten trips per month across the Verrazzano-Narrows Bridge using the same NYCSC E-ZPass account. These rebate

HISTORY AND PROJECTION OF TRAFFIC, TOLL REVENUES AND EXPENSES AND REVIEW OF PHYSICAL CONDITIONS OF THE FACILITIES OF TRIBOROUGH BRIDGE AND TUNNEL AUTHORITY
11
programs do not affect TBTA revenues since TBTA collects the full toll, with a portion paid by the motorist and the remainder paid by the MTA with a combination of its own funds and New York State funds.
Cross Bay Bridge Rebate Program
A toll rebate program for the benefit of E-ZPass customers who are Rockaway Residents was implemented by the MTA on January 1, 1998 for use on the Cross Bay Bridge. This program was modified during the period from July 23, 2010 to March 31, 2012, during which eligible Rockaway Residents were charged the reduced resident toll rate for the first two trips over the Cross Bay Bridge and only subsequent trips during the same calendar day using the same E-ZPass tag were eligible for the rebate. Effective April 1, 2012, the MTA has been using funds allocated by New York State to restore the rebate for tolls incurred on the first two trips made on the same day over the Cross Bay Bridge by eligible residents. In 2018 the MTA reimbursed the TBTA in the amount of approximately $5.4 million in toll rebates relating to the Cross Bay Bridge program. The TBTA estimates that the reimbursements in 2019 will total approximately $5.5 million.
Verrazzano-Narrows Bridge Rebate Programs
Since 2014, MTA has had two toll rebate programs at the Verrazzano-Narrows Bridge: the Staten Island Resident (“SIR”) Rebate Program, available for residents of Staten Island participating in the SIR E-ZPass toll discount plan, and the Verrazzano-Narrows Bridge Commercial Rebate Program (“VNB Commercial Rebate Program” and, together with the SIR Rebate Program, the “VNB Rebate Programs”), available for commercial vehicles making more than ten trips per month using the same New York Customer Service Center (“NYCSC”) E-ZPass account. Since they are partially funded by the State, the VNB Rebate Programs follow the State Fiscal Year.
The annualized cost of the 2018-2019 VNB Rebate Programs was approximately $20.8 million, $14 million of which was funded equally by the State and MTA, with the State’s contribution provided by appropriations to MTA. An additional $6.8 million in appropriations was provided by the State to MTA to keep the effective post-rebate SIR E-ZPass toll at $5.50 by providing a $0.98 rebate for Staten Island Residents with three or more trips per month and a $1.34 rebate for Staten Island Residents with less than three trips per month.
The projected annualized cost of the 2019-2020 VNB Rebate Programs is approximately $26.8 million, $14 million of which is funded equally by the State and MTA, with the State’s contribution provided by appropriations to MTA. An additional $12.8 million in appropriations is being provided by the State to MTA to keep the effective post-rebate SIR E-ZPass toll at $5.50 by providing a $1.38 rebate for Staten Island Residents with three or more trips per month and a $1.76 rebate for Staten Island Residents with less than three trips per month.
The money to fund a year’s estimated costs for the VNB Rebate Programs is transferred by MTA to TBTA prior to the implementation of the VNB Rebate Programs each year. The 2019-2020 VNB Rebate Programs will be implemented as specified herein only for such periods during which both (a) MTA’s total financial responsibility, net of State actions or available offsets, does not exceed
HISTORY AND PROJECTION OF TRAFFIC, TOLL REVENUES AND EXPENSES AND REVIEW OF PHYSICAL CONDITIONS OF THE FACILITIES OF TRIBOROUGH BRIDGE AND TUNNEL AUTHORITY
12
$7 million for the 2018-2019 VNB Rebate Programs and (b) the State provides (i) at least $7 million for the 2018-2019 VNB Rebate Programs and (ii) such additional funds as are necessary (currently estimated to be $12.8 million) to keep the effective post-rebate SIR E-ZPass toll at $5.50 by increasing the rebate to $1.38 for Staten Island Residents with three or more trips per month and to $1.76 for Staten Island Residents with less than three trips per month under the 2019-2020 SIR Rebate Program. MTA will apply the $12.8 million of additional funds provided by the State as necessary to provide these rebates.
If, as a result of unexpected toll transaction activity, TBTA estimates that such MTA and State funds allocated to MTA for the 2019-2020 VNB Rebate Programs, net of offsets, will be insufficient to fund the 2019-2020 VNB Commercial Rebate Program for the full program year, TBTA may reduce the rebate amount under such program to a percentage that is forecast to be payable in full for the remainder of the program year with the available funds. However, in the event that such MTA and State funds allocated to MTA for the 2019-2020 VNB Rebate Programs are fully depleted at any time during the 2019-2020 VNB Rebate Programs annual period, the 2019-2020 VNB Rebate Programs will cease and Staten Island residents will be charged the applicable resident discount toll and trucks and other commercial vehicles will be charged the applicable NYCSC E-ZPass toll for the Verrazzano-Narrows Bridge.
The VNB Rebate Programs will continue into future years provided that (a) MTA’s annual period contribution does not exceed $7 million, (b) the MTA Board approves a budget that includes MTA’s contribution to such program, and (c) the State provides to MTA funds sufficient for at least half the expenses of each continuing annual period.
Under the 2018-2019 SIR Rebate Program, MTA rebated $0.98 of the $6.48 SIR E-ZPass toll paid by Staten Island residents with three or more trips per month across the Verrazzano-Narrows Bridge, and $1.34 of the $6.84 SIR E-ZPass toll paid by Staten Island residents with one or two trips across the bridge. As a result of these MTA toll rebates, Staten Island residents paid an effective toll of $5.50 per trip. The 2018-2019 SIR Rebate Program was retroactive to April 1, 2018 and continued through March 31, 2019.
Under the 2019-2020 SIR Rebate Program, MTA will rebate $1.38 of the $6.88 SIR E-ZPass toll paid by Staten Island residents with three or more trips per month across the Verrazzano-Narrows Bridge, and $1.76 of the $7.26 SIR E-ZPass toll paid by Staten Island residents with one or two trips across the bridge. As a result of these MTA toll rebates, Staten Island residents will pay an effective toll of $5.50 per trip under the current SIR toll rates. The 2019-2020 SIR Rebate Program is retroactive to April 1, 2019 and will continue through March 31, 2020.
Under the 2018-2019 VNB Commercial Rebate Program, the rebate was 17.25 percent of the E-ZPass toll for trucks and other commercial vehicles with more than ten trips per month across the Verrazzano-Narrows Bridge, using the same NYCSC E-ZPass Account until January 2019, when the rebate was reduced because of insufficient funds. The 2018-2019 VNB Commercial Rebate Program was retroactive to April 1, 2018 and continued through March 31, 2019.

HISTORY AND PROJECTION OF TRAFFIC, TOLL REVENUES AND EXPENSES AND REVIEW OF PHYSICAL CONDITIONS OF THE FACILITIES OF TRIBOROUGH BRIDGE AND TUNNEL AUTHORITY
13
Under the 2019-2020 VNB Commercial Rebate Program, the initial rebate is 16.25 percent of the E-ZPass toll for trucks and other commercial vehicles with more than ten trips per month across the Verrazzano-Narrows Bridge, using the same NYCSC E-ZPass Account. Implementing a 16.25 percent rebate of the E-ZPass toll for trucks and other eligible commercial vehicles is expected to ensure that the $7 million allocated for the 2019-2020 VNB Commercial Rebate Program is sufficient to provide funding from April 1, 2019 through March 31, 2020. The 2019-2020 VNB Commercial Rebate Program is retroactive to April 1, 2019 and will continue through March 31, 2020.
Outer Borough Transportation Account Rebates
Cross Bay Bridge Rebate Program for Queens Residents
In April 2019, it was announced that the resident rebate program at the Cross Bay Bridge will be expanded to Queens residents starting in spring 2020. The expanded rebate will be funded by the MTA held Outer Borough Transportation Account funded with a portion of revenues from the 2018 Congestion Pricing Program. It will therefore not affect revenue projections for TBTA. As part of the program, Queens residents will be refunded the toll paid in its entirety. To be eligible for this program, one must have a valid E-ZPass tag mounted in the vehicle and a vehicle registered to a valid resident address in Queens. This program is only available to passenger vehicles. Vehicles used for commercial purposes will not be eligible.
Henry Hudson Bridge Rebate Program for Bronx Residents
Also announced in April 2019, a resident rebate program will be established for Bronx residents at the Henry Hudson Bridge starting in 2020. The necessary funding to create this program also utilizes the Outer Borough Transportation Account and will therefore not affect revenue projections for the TBTA. As part of the program, Bronx residents will be refunded the toll paid in its entirety. To be eligible for this program, one must have a valid E-ZPass tag mounted in the vehicle and a vehicle registered to a valid resident address in the Bronx. This program is only available to passenger vehicles. Vehicles used for commercial purposes will not be eligible.
Cashless Tolling System
The E-ZPass Electronic Toll Collection (ETC) system has been fully installed at all TBTA bridges and tunnels since December 1996. When a vehicle with an E-ZPass tag enters the toll payment area, an electronic reader identifies the tag code at the toll facility and the toll is deducted from the customer’s account. TBTA has over 5.7 million E-ZPass tags in use. As of December 2018, E-ZPass participation rates were 95.2 percent of toll-paying traffic TBTA-wide. The total number of active E-ZPass Group tags in use for all participating agencies as of December 31, 2017 was over 34 million.
With the introduction of E-ZPass at all TBTA crossings, toll plaza operations improved, and vehicle-hours of delay were reduced. This, in turn, led to even more motorists enrolling in E-ZPass. With the implementation of Cashless Tolling at all TBTA facilities by fall 2017 and the subsequent removal of

HISTORY AND PROJECTION OF TRAFFIC, TOLL REVENUES AND EXPENSES AND REVIEW OF PHYSICAL CONDITIONS OF THE FACILITIES OF TRIBOROUGH BRIDGE AND TUNNEL AUTHORITY
14
TBTA toll plazas, throughput capacity has increased to levels comparable to the capacity of a free-flowing lane of traffic (about 1,800 vehicles per hour).
Table 2 lists the year-end TBTA-wide E-ZPass participation rates starting in 2009, the thirteenth year since all nine crossings had E-ZPass in operation. Implementation of E-ZPass started in October 1995 on the Verrazzano-Narrows Bridge and was phased in gradually on the remaining crossings through December 1996. Also shown are the participation rates for each of the facilities for December 2018.
As Cashless Tolling was implemented, E-ZPass participation rates increased considerably at the facilities. Year-end TBTA-wide E-ZPass participation rates increased by 7.4 percent from 2016 to 2017, which is far greater than the 0.6 percent to 3.1 percent year-end over year-end increases experienced TBTA-wide over the previous 10-year period. While the greatest increase occurred in 2017, the year Cashless Tolling was activated on all TBTA facilities, in 2018, year-end TBTA-wide E-ZPass participation rates increased by 1.6 percent from 2017.
Table 2 Year-End E-ZPass Participation Rates
Year Year-End E-ZPass Participation Rates for all TBTA Facilities
2009 2010 2011 2012 2013 2014 2015 2016 2017 2018
Percent Participation
(All TBTA Facilities)
75.3% 77.1% 80.2% 81.5% 83.8% 84.5% 85.6% 86.2% 93.6% 95.2%
TBTA Facility Year-End TBTA E-ZPass Participation Rate by Facility (2018)
Throgs Neck
Bronx- Whitestone
Robert F. Kennedy
Queens Midtown
Hugh L. Carey
Verrazzano- Narrows
Henry Hudson
Marine Parkway
Cross Bay
Percent Participation 94.4% 93.7% 94.7% 96.0% 96.9% 96.0% 95.8% 97.0% 96.0%
Source: TBTA data.
TBTA’s Role in E-ZPass
TBTA was a founding member of the E-ZPass Interagency Group (E-ZPass Group). Originally comprised of toll authorities in Delaware, Pennsylvania, New Jersey, and New York, the E-ZPass Group now encompasses 29 toll agencies in 17 states, including five international border crossings. Since the inception of the E-ZPass Group more than 20 years ago, customers of the member E-ZPass Group agencies have been able to use their E-ZPass tags on any E-ZPass-equipped facility operated by another E-ZPass Group member. The E-ZPass Group processes over 3.1 billion toll transactions annually. As the E-ZPass Group has grown, the E-ZPass customer base has increased, which has helped increase usage of E-ZPass on TBTA facilities.
The transportation network includes, in addition to TBTA, the following agencies and bridges:
• The six interstate crossings of the Port Authority;
HISTORY AND PROJECTION OF TRAFFIC, TOLL REVENUES AND EXPENSES AND REVIEW OF PHYSICAL CONDITIONS OF THE FACILITIES OF TRIBOROUGH BRIDGE AND TUNNEL AUTHORITY
15
• New Jersey Turnpike and Garden State Parkway operated by the New Jersey Turnpike Authority;
• New York State Thruway including the Governor Mario M. Cuomo Bridge (formerly the Tappan Zee Bridge);
• The five bridges of the New York State Bridge Authority (from Bear Mountain northward);
• The Buffalo and Fort Erie Public Bridge Authority’s Peace Bridge;
• The Thousand Island Bridges of the Thousand Island Bridge Authority;
• The three bridges of the Niagara Falls Bridge Commission;
• The Atlantic City Expressway (operated by the South Jersey Transportation Authority);
• The four toll bridges between New Jersey and Pennsylvania operated by the Delaware River Port Authority;
• The seven toll bridges between New Jersey and Pennsylvania operated by the Delaware River Joint Toll Bridge Commission;
• The Delaware Memorial Bridge between New Jersey and Delaware operated by the Delaware River and Bay Authority; and
• The two toll bridges between New Jersey and Pennsylvania operated by the Burlington County Bridge Commission.
Also included are the toll facilities operated by the following agencies and companies across the United States:
• Central Florida Expressway Authority
• Delaware Department of Transportation
• Illinois State Toll Highway Authority
• Indiana Toll Road Concession Company, LLC
• Kentucky Public Transportation Infrastructure Authority
• Maine Turnpike Authority
• Massachusetts Department of Transportation
• Maryland Transportation Authority
• New Hampshire Department of Transportation
• North Carolina Turnpike Authority
• Ohio Turnpike and Infrastructure Commission
• The Pennsylvania Turnpike Commission
• Rhode Island Turnpike and Bridge Authority
• Skyway Concession Company (Chicago)
• Virginia Department of Transportation
• West Virginia Parkway Authority
With the exception of TBTA customers enrolled in the E-ZPass Pay Per Trip plan, all TBTA E-ZPass customers must pre-pay their E-ZPass accounts. These pre-payments are based on a customer’s E-ZPass usage at both TBTA and other E-ZPass Group member facilities. Through the E-ZPass Group system, TBTA and other member agencies transfer payments associated with inter-operability to each other on a routine basis. For 2018, TBTA transferred $1.0 billion to, and received $565.2 million from, other members within the E-ZPass Group.
HISTORY AND PROJECTION OF TRAFFIC, TOLL REVENUES AND EXPENSES AND REVIEW OF PHYSICAL CONDITIONS OF THE FACILITIES OF TRIBOROUGH BRIDGE AND TUNNEL AUTHORITY
16
Cashless, Open Road Tolling (“Cashless Tolling”)
TBTA completed full implementation of Cashless Tolling on September 30, 2017. Cashless Tolling eliminates traditional toll plazas by allowing tolls to be collected in a free-flow environment through E-ZPass sensors and license-plate cameras mounted on overhead gantries. Drivers without E-ZPass receive a “Tolls by Mail” invoice mailed to the vehicle’s registered owner.
In spring 2016, TBTA began asking the DMV to suspend the vehicle registrations of violators who fail to pay their tolls and violation fees or have them dismissed or transferred in response to violation notices for five toll violations within 18 months, in accordance with the initial DMV regulation for persistent or habitual toll violators. In January 2017, the DMV changed its regulation for persistent or habitual violators so that vehicle registrations can be suspended for three toll violations within five years and commercial vehicle registrations can be suspended for $200.00 or more in unpaid tolls within five years.
TBTA employs and develops measures to enhance collection and enforcement of tolls under the Cashless Tolling system. License plate recognition technology on gantries and in patrol vehicles is being used for the detection of persistent toll violators and toll violation enforcement. Additionally, TBTA issues exclusion orders barring the vehicles of out-of-state toll violators from TBTA facilities.
Passenger Car Toll Rate Trends and Inflation
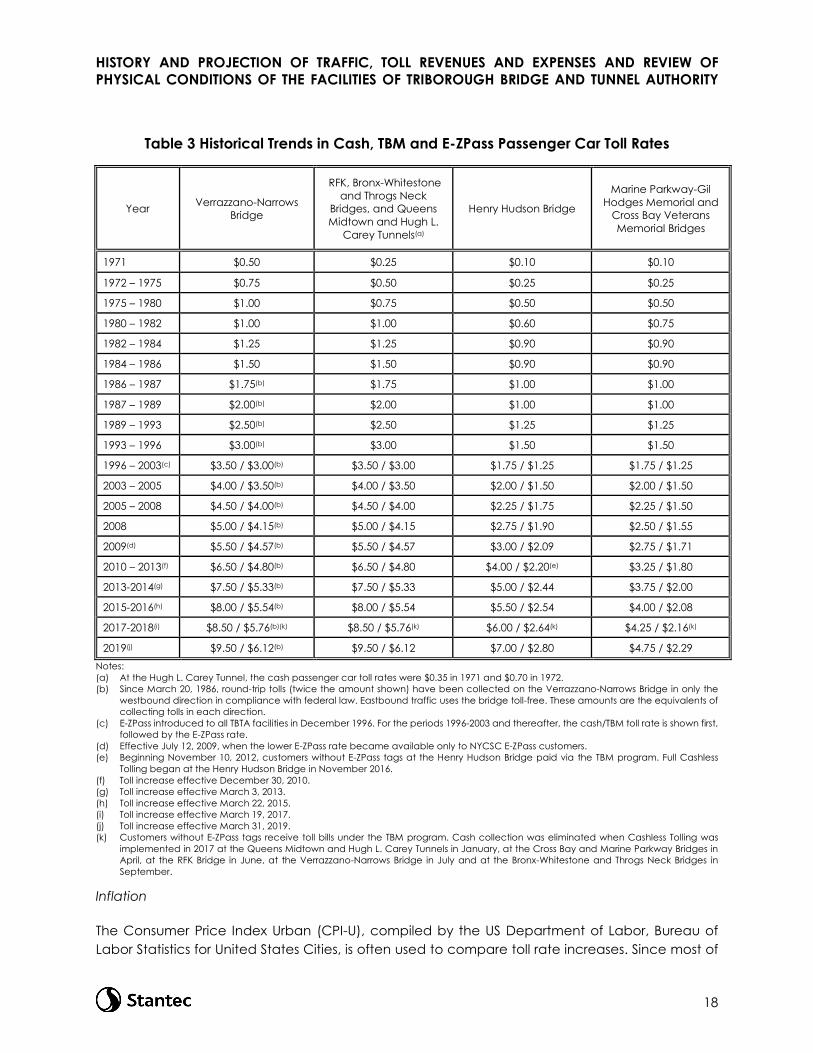
Since 1971, toll rates have been increased periodically on the TBTA facilities. Table 3 displays passenger car toll rates for the nine TBTA bridges and tunnels over the past 48 years. Tolls are shown for cash passenger car transactions from 1971 to implementation of Cashless Tolling at each facility and TBM transactions thereafter and for all E-ZPass transactions from 1996, when E-ZPass was introduced on the TBTA system, until July 12, 2009. Effective July 12, 2009, only NYCSC E-ZPass customers are eligible for the lower E-ZPass rate and non-NYCSC E-ZPass customers paid the TBM toll rate. Beginning in 2009, Table 3 shows the cash or TBM rate and the NYCSC E-ZPass rate on each of the TBTA’s facilities.
Passenger Car Toll Rate Trends
Since 1982, passenger car toll rates have been separated into four categories, as follows:
• Major crossings – RFK, Bronx-Whitestone, and Throgs Neck Bridges, and the Queens Midtown and Hugh L. Carey Tunnels;
• Minor crossings – Marine Parkway and Cross Bay Bridges; • Henry Hudson Bridge (treated as a minor crossing prior to the 2008 toll increase) – a crossing
restricted to passenger vehicles; and • Verrazzano-Narrows Bridge – a major crossing with one-way toll collection since 1986 in
accordance with federal law.
HISTORY AND PROJECTION OF TRAFFIC, TOLL REVENUES AND EXPENSES AND REVIEW OF PHYSICAL CONDITIONS OF THE FACILITIES OF TRIBOROUGH BRIDGE AND TUNNEL AUTHORITY
17
In general, tolls for vehicles over 7,000 pounds have also been adjusted upward whenever passenger car toll rates were increased. Notable exceptions occurred in 1987 and 1989 when these toll rates were not raised while there was a general increase for passenger cars.
Over the years, TBTA has implemented various resident toll discount programs at the Cross Bay, Marine Parkway, and Verrazzano-Narrows Bridges. The MTA also has toll rebate programs for certain eligible residents using NYCSC E-ZPass at the Cross Bay and Verrazzano-Narrows Bridges, as well as a toll rebate program for eligible NYCSC E-ZPass commercial customers at the Verrazzano-Narrows Bridge. While the rebate programs do not have an effect on revenues, due to MTA reimbursements as noted above, the toll discount programs have a negative effect on revenues, in part offset by a positive effect on traffic by attracting additional traffic to the facilities.
HISTORY AND PROJECTION OF TRAFFIC, TOLL REVENUES AND EXPENSES AND REVIEW OF PHYSICAL CONDITIONS OF THE FACILITIES OF TRIBOROUGH BRIDGE AND TUNNEL AUTHORITY
18
Table 3 Historical Trends in Cash, TBM and E-ZPass Passenger Car Toll Rates
Year Verrazzano-Narrows Bridge
RFK, Bronx-Whitestone and Throgs Neck
Bridges, and Queens Midtown and Hugh L.
Carey Tunnels(a)
Henry Hudson Bridge
Marine Parkway-Gil Hodges Memorial and
Cross Bay Veterans Memorial Bridges
1971 $0.50 $0.25 $0.10 $0.10
1972 – 1975 $0.75 $0.50 $0.25 $0.25
1975 – 1980 $1.00 $0.75 $0.50 $0.50
1980 – 1982 $1.00 $1.00 $0.60 $0.75
1982 – 1984 $1.25 $1.25 $0.90 $0.90
1984 – 1986 $1.50 $1.50 $0.90 $0.90
1986 – 1987 $1.75(b) $1.75 $1.00 $1.00
1987 – 1989 $2.00(b) $2.00 $1.00 $1.00
1989 – 1993 $2.50(b) $2.50 $1.25 $1.25
1993 – 1996 $3.00(b) $3.00 $1.50 $1.50
1996 – 2003(c) $3.50 / $3.00(b) $3.50 / $3.00 $1.75 / $1.25 $1.75 / $1.25
2003 – 2005 $4.00 / $3.50(b) $4.00 / $3.50 $2.00 / $1.50 $2.00 / $1.50
2005 – 2008 $4.50 / $4.00(b) $4.50 / $4.00 $2.25 / $1.75 $2.25 / $1.50
2008 $5.00 / $4.15(b) $5.00 / $4.15 $2.75 / $1.90 $2.50 / $1.55
2009(d) $5.50 / $4.57(b) $5.50 / $4.57 $3.00 / $2.09 $2.75 / $1.71
2010 – 2013(f) $6.50 / $4.80(b) $6.50 / $4.80 $4.00 / $2.20(e) $3.25 / $1.80
2013-2014(g) $7.50 / $5.33(b) $7.50 / $5.33 $5.00 / $2.44 $3.75 / $2.00
2015-2016(h) $8.00 / $5.54(b) $8.00 / $5.54 $5.50 / $2.54 $4.00 / $2.08
2017-2018(i) $8.50 / $5.76(b)(k) $8.50 / $5.76(k) $6.00 / $2.64(k) $4.25 / $2.16(k)
2019(j) $9.50 / $6.12(b) $9.50 / $6.12 $7.00 / $2.80 $4.75 / $2.29 Notes: (a) At the Hugh L. Carey Tunnel, the cash passenger car toll rates were $0.35 in 1971 and $0.70 in 1972. (b) Since March 20, 1986, round-trip tolls (twice the amount shown) have been collected on the Verrazzano-Narrows Bridge in only the
westbound direction in compliance with federal law. Eastbound traffic uses the bridge toll-free. These amounts are the equivalents of collecting tolls in each direction.
(c) E-ZPass introduced to all TBTA facilities in December 1996. For the periods 1996-2003 and thereafter, the cash/TBM toll rate is shown first, followed by the E-ZPass rate.
(d) Effective July 12, 2009, when the lower E-ZPass rate became available only to NYCSC E-ZPass customers. (e) Beginning November 10, 2012, customers without E-ZPass tags at the Henry Hudson Bridge paid via the TBM program. Full Cashless
Tolling began at the Henry Hudson Bridge in November 2016. (f) Toll increase effective December 30, 2010. (g) Toll increase effective March 3, 2013. (h) Toll increase effective March 22, 2015. (i) Toll increase effective March 19, 2017. (j) Toll increase effective March 31, 2019. (k) Customers without E-ZPass tags receive toll bills under the TBM program. Cash collection was eliminated when Cashless Tolling was
implemented in 2017 at the Queens Midtown and Hugh L. Carey Tunnels in January, at the Cross Bay and Marine Parkway Bridges in April, at the RFK Bridge in June, at the Verrazzano-Narrows Bridge in July and at the Bronx-Whitestone and Throgs Neck Bridges in September.
Inflation
The Consumer Price Index Urban (CPI-U), compiled by the US Department of Labor, Bureau of Labor Statistics for United States Cities, is often used to compare toll rate increases. Since most of

HISTORY AND PROJECTION OF TRAFFIC, TOLL REVENUES AND EXPENSES AND REVIEW OF PHYSICAL CONDITIONS OF THE FACILITIES OF TRIBOROUGH BRIDGE AND TUNNEL AUTHORITY
19
the transactions on TBTA facilities are made by customers using an E-ZPass tag registered with the NYCSC, we have compared cumulative CPI-U alongside the TBTA major crossing passenger car NYCSC E-ZPass toll rates. The comparison starts in 1996 when E-ZPass was instituted on TBTA facilities. As indicated in Table 4, TBTA E-ZPass tolls in March 2019 (after the March 31st toll increase) were 2.0 times higher than the 1996 E-ZPass toll rate while the CPI-U was 1.7 times higher than the 1996 level. If adjusted for changes in the CPI-U, current tolls are 1.2 times higher than the 1996 rate.
Table 4 E-ZPass Passenger Toll Rates versus Consumer Price Index
Year Consumer Price Index (a)
RFK, Bronx-Whitestone and Throgs Neck Bridges and Queens Midtown
and Hugh L. Carey Tunnels
Tolls Adjusted to 1982 - 1984 dollars(b)
1996(c) 166.90 3.00 1.80
2003 197.80 3.50 1.77
2005 212.70 4.00 1.88
2008 235.80 4.15 1.76
2009(d) 236.80 4.57 1.93
2010(e) 240.90 4.80 1.99
2013(f) 256.80 5.33 2.08
2015(g) 259.20 5.54 2.14
2017(h) 267.70 5.76 2.15
2019(i) 275.80 6.12 2.22
Ratio 2019/1996 1.65 2.04 1.23
Notes: (a) New York Metropolitan Statistical Area: New York–Northern New Jersey-Long Island, NY-NJ-CT-PA, All Urban Consumers, All
Items. Base period: 1982-1984 = 100.0. Not seasonally adjusted. Source: US Department of Labor, Bureau of Labor Statistics. (b) The current toll divided by the CPI and expressed in dollars. (c) E-ZPass introduced to all TBTA facilities in December 1996. (d) Effective July 12, 2009, when the lower E-ZPass rate became available only to NYCSC E-ZPass customers. (e) Effective December 30, 2010. (f) Effective March 3, 2013. (g) Effective March 22, 2015. (h) Effective March 19, 2017. (i) Effective March 31, 2019.
HISTORICAL TRAFFIC, REVENUES AND EXPENSES AND ESTIMATED/BUDGETED NUMBERS FOR 2018
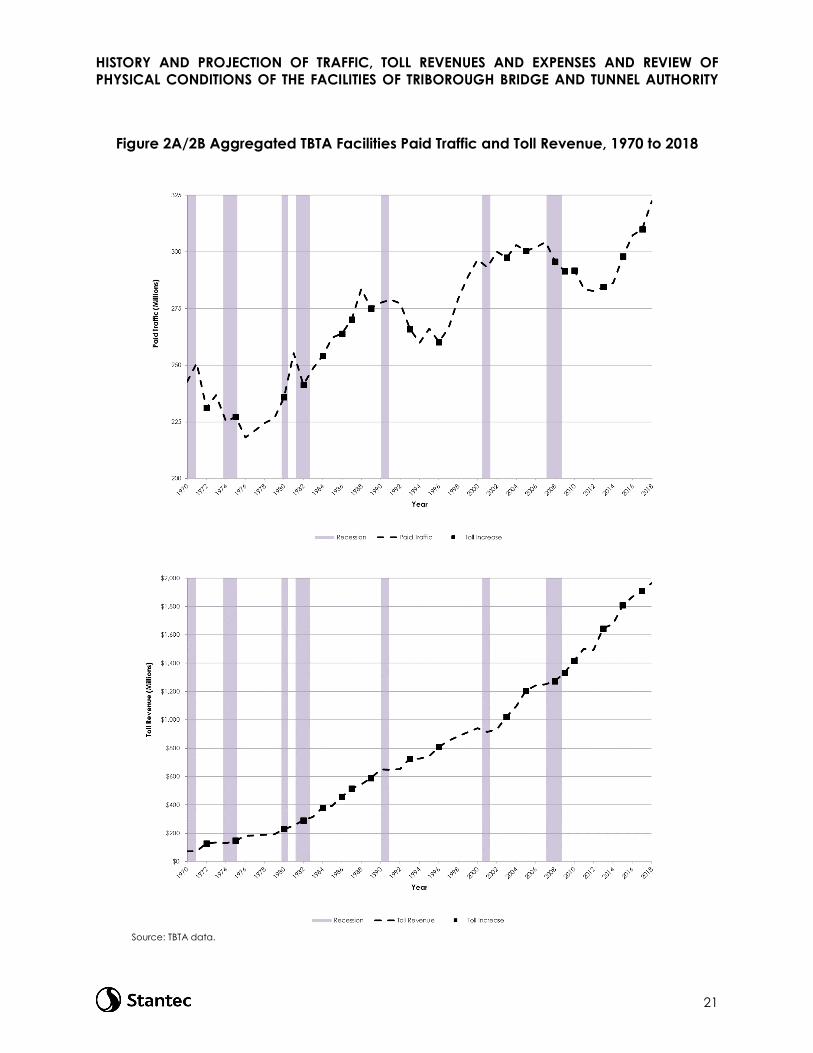
Historical traffic, toll revenues, and expenses were reviewed for the nine TBTA bridges and tunnels. Over the last 49 years, paid traffic volumes on the crossings have ranged from a low of 218 million in 1976 to a high of 322 million in 2018. As displayed in Figure 2A/2B, the growth of traffic and revenue has been affected by the region’s overall growth in population and employment, offset by the impact of 18 periodic toll increases (through the end of 2018 and represented by the boxes in the graph). By 2000, after 10 toll increases and 18 percent higher traffic volume, toll revenues had increased more than 13-fold, from $72 million to $941 million in 2000. Revenues declined to

HISTORY AND PROJECTION OF TRAFFIC, TOLL REVENUES AND EXPENSES AND REVIEW OF PHYSICAL CONDITIONS OF THE FACILITIES OF TRIBOROUGH BRIDGE AND TUNNEL AUTHORITY
20
$915 million in 2001 primarily due to the closures and restrictions on TBTA facilities following the September 11 terrorist attack on the World Trade Center and the regional decline in employment.
Toll increases in March 2008, July 2009, and December 2010 resulted in annual revenue increases through 2011. In 2012, toll revenues were $1.491 billion, $11 million less than the 2011 level of $1.502 billion, primarily due to temporary closures caused by Superstorm Sandy, partially offset by modest improvements in the regional and national economies. Toll revenues in 2013 increased to $1.645 billion primarily due to the rebound from Superstorm Sandy and the March 2013 toll increase. In 2014, total toll revenues for the TBTA facilities were $1.676 billion, 1.9 percent higher than 2013 toll revenues. That increase in toll revenue was attributed to a continuing modest economic recovery and the March 2013 toll increase. Toll revenues in 2015 were $1.809 billion (7.9 percent higher than 2014 toll revenues) primarily due to the March 2015 toll increase, generally overall favorable weather conditions, relatively low gas prices, and a continued modest recovery in the economy. In 2016, these conditions continued resulting in traffic reaching a then historical high of 307 million vehicles, which was a 3.2 percent increase from the previous year. Toll revenues in 2016 were $1.870 billion, 3.4 percent higher than 2015 toll revenues. In 2017, with a toll increase in March, traffic surpassed the 2016 historical high with 310 million vehicles, a 0.9 percent increase from the previous year. Toll revenues in 2017 were $1.912 billion, 2.2 percent higher than 2016 toll revenues. In 2018, traffic continued to surpass the historical high with 322 million vehicles, a 4.0 percent increase from the previous year. Toll revenues in 2018 were $1.965 billion, 2.8 percent higher than 2017 toll revenues.
Also note in Figure 2A/2B that, despite the periodic toll increases, the traffic trend is generally upward. Recessionary conditions in 2008 and 2009 led to a decrease in overall travel as unemployment rose and overall economic growth declined. Though the recession technically ended in 2009, the economy was slow to recover with several years of little to no growth. Tepid economic conditions, combined with toll increases in 2008, 2009, 2010, and 2011, led to continued modest declines in total transactions. Since 2012, as the economy began to show positive signs of growth, with increasing employment levels and decreases in gasoline prices, transaction growth has returned. Overall traffic at TBTA facilities continued to increase despite the periodic toll increases implemented in March 2013, March 2015, and March 2017.
Other noticeable declines in traffic have occurred during the fuel crises of the 1970s and during the economic recessions in the late 1980s, early 1990s, all periods of difficult and prolonged economic downturns.
HISTORY AND PROJECTION OF TRAFFIC, TOLL REVENUES AND EXPENSES AND REVIEW OF PHYSICAL CONDITIONS OF THE FACILITIES OF TRIBOROUGH BRIDGE AND TUNNEL AUTHORITY
21
Figure 2A/2B Aggregated TBTA Facilities Paid Traffic and Toll Revenue, 1970 to 2018
Source: TBTA data.
HISTORY AND PROJECTION OF TRAFFIC, TOLL REVENUES AND EXPENSES AND REVIEW OF PHYSICAL CONDITIONS OF THE FACILITIES OF TRIBOROUGH BRIDGE AND TUNNEL AUTHORITY
22
Traffic and Toll Revenue, 2008 to 2018
Table 5 lists the traffic and toll revenue recorded for each of the nine TBTA crossings for the most recent 11-year time period, 2008-2018. Total TBTA traffic and toll revenue are shown in Table 6. Within this 11-year period toll-paying traffic reached historic peaks three times, first in 2016 with 307 million crossings, again in 2017 with 310 million crossings, and most recently in 2018 with 322 million crossings.
The first toll increase within this most recent 11-year time period occurred on March 16, 2008. In general, the pattern historically has been that when toll rates are increased, traffic declines moderately and then traffic begins to rise until the next rate increase. However, the toll rate increase in 2008 was also accompanied by rising fuel prices through mid-2008 and the deteriorating economy, resulting in a 2.9 percent drop in traffic. In contrast, with gasoline prices dropping in the latter portion of 2008, traffic decreased only 1.5 percent between 2008 and 2009, even with a toll increase occurring in July 2009. The December 2010 toll increase was also in the midst of a slowly recovering economy and accelerating gasoline prices, resulting in a 2.8 percent decrease in traffic in 2011.
TBTA traffic following the March 2013, March 2015, and March 2017 toll increases has not followed the typical pattern outlined above. Lower gasoline prices, among other factors, resulted in a 0.7 percent increase in traffic following the March 2013 toll increase, a 4.0 percent increase in traffic following the March 2015 toll increase, and a 0.9 percent increase in traffic following the March 2017 toll increase. The six toll increases reflected in Table 5 and Table 6 in 2008, 2009, 2010, 2013, 2015, and 2017 are evident in the jump in average tolls in the years following the increase. The historical relationship between toll increases and its effects on TBTA traffic volumes is further discussed in the Toll Impacts and Elasticity section of this report.
The July 12, 2009 toll increase resulted in an overall increase in toll revenue from $1.274 billion in 2008 to $1.332 billion, an increase of 4.6 percent, while traffic decreased by 1.5 percent from 295.7 million to 291.4 million vehicles. Traffic grew by 0.1 percent in 2010 to 291.7 million vehicles and toll revenue grew 6.4 percent to $1.417 billion, primarily due to a full year’s impact of the July 2009 toll increase. The December 30, 2010 toll increase resulted in an overall increase in toll revenue from $1.417 billion in 2010 to $1.502 billion in 2011, an increase of 6.0 percent, while traffic decreased by 2.8 percent from 291.7 million to 283.5 million. The reduction in toll traffic was a result of severe winter weather, high gas prices, Tropical Storm Irene in August 2011 (tolls were not collected for approximately two days at the Marine Parkway, Cross Bay, Verrazzano-Narrows, Throgs Neck, and Bronx-Whitestone Bridges), decreased overall travel and the December 2010 increase in toll rates, among other factors.

HISTORY AND PROJECTION OF TRAFFIC, TOLL REVENUES AND EXPENSES AND REVIEW OF PHYSICAL CONDITIONS OF THE FACILITIES OF TRIBOROUGH BRIDGE AND TUNNEL AUTHORITY
23
Table 5 Annual Toll-Paying Traffic and Toll Revenue, 2008 to 2018 (000s)(a)
Year
Verrazzano-Narrows Bridge RFK Bridge Bronx-Whitestone Bridge
Traffic Revenue Average
Toll(c)
Traffic Revenue Average
Toll
Traffic Revenue Average
Toll Volume(b) Percent Change Volume Percent
Change Volume Percent Change
2008 68,884 -2.1 $278,906 $4.05 59,741 -4.4 $287,877 $4.82 42,803 1.0 $212,125 $4.96 2009 68,600 -0.4 295,901 4.31 59,449 -0.5 304,794 5.13 42,675 -0.3 225,224 5.28 2010 68,097 -0.7 312,873 4.59 60,107 1.1 326,103 5.43 41,050 -3.8 229,428 5.59 2011 66,020 -3.1 330,886 5.01 57,510 -4.3 339,791 5.91 37,643 -8.3 230,669 6.13 2012 65,626 -0.6 326,797 4.98 57,239 -0.5 336,781 5.88 39,478 4.9 240,236 6.09 2013 65,035 -0.9 352,370 5.42 58,224 1.7 376,769 6.47 39,558 0.2 264,174 6.68 2014 64,007 -1.6 345,466 5.40 59,902 2.9 393,622 6.57 38,488 -2.7 260,756 6.77 2015 66,215 3.5 372,347 5.62 62,227 3.9 422,756 6.79 42,062 9.3 294,022 6.99 2016 69,756 5.3 393,017 5.63 62,921 1.1 428,083 6.80 45,816 8.9 320,486 7.00 2017 71,922 3.1 416,459 5.79 63,810 1.4 437,335 6.85 46,023 0.5 327,320 7.11 2018 74,809 4.0 433,121 5.79 66,398 4.1 448,600 6.76 47,958 4.2 332,715 6.94
Year
Throgs Neck Bridge Hugh L. Carey Tunnel Queens Midtown Tunnel
Traffic Revenue Average
Toll
Traffic Revenue Average
Toll
Traffic Revenue Average
Toll Volume Percent Change Volume Percent
Change Volume Percent Change
2008 40,492 -3.4 $219,855 $5.43 16,899 -6.8 $73,590 $4.35 28,620 -2.6 $131,264 $4.59 2009 39,050 -3.6 222,825 5.71 15,899 -5.9 73,248 4.61 27,702 -3.2 134,927 4.87 2010 39,381 0.8 240,343 6.10 16,096 1.2 79,225 4.92 28,459 2.7 146,934 5.16 2011 40,391 2.6 266,307 6.59 16,570 2.9 87,879 5.30 28,481 0.1 158,668 5.57 2012 39,376 -2.5 260,468 6.61 15,902 -4.0 83,814 5.27 27,759 -2.5 153,825 5.54 2013 39,958 1.5 291,433 7.29 16,547 4.1 95,549 5.77 27,850 0.3 168,982 6.07 2014 40,840 2.2 302,110 7.40 16,940 2.4 99,135 5.85 28,998 4.1 178,631 6.16 2015 42,189 3.3 324,702 7.70 17,655 4.2 106,881 6.05 28,697 -1.0 182,382 6.36 2016 43,245 2.5 335,732 7.76 17,961 1.7 109,250 6.08 26,824 -6.5 171,121 6.38 2017 43,694 1.0 344,882 7.89 17,510 -2.5 105,649 6.03 25,065 -6.6 158,683 6.33 2018 44,347 1.5 344,565 7.77 18,799 7.4 113,395 6.03 27,552 9.9 173,021 6.28
Year
Henry Hudson Bridge Marine Parkway-Gil Hodges Memorial Bridge Cross Bay Veterans Memorial Bridge
Traffic Revenue Average
Toll
Traffic Revenue Average
Toll
Traffic Revenue Average
Toll Volume Percent Change Volume Percent
Change Volume Percent Change
2008 22,823 -5.4 $46,126 $2.02 7,829 -0.1 $12,019 $1.54 7,589 -1.2 $12,212 $1.61 2009 22,584 -1.0 49,581 2.20 7,876 0.6 12,921 1.64 7,548 -0.5 12,694 1.68 2010 23,058 2.1 54,452 2.36 7,838 -0.5 13,774 1.76 7,627 1.0 13,914 1.82 2011 22,185 -3.8 59,246 2.67 7,523 -4.0 14,003 1.86 7,148 -6.3 14,139 1.98 2012 21,939 -1.1 57,828 2.64 7,829 4.1 15,698 2.00 7,498 4.9 15,535 2.07 2013 21,830 -0.5 62,444 2.86 7,814 -0.2 16,633 2.13 7,712 2.9 16,840 2.18 2014 22,235 1.9 64,879 2.92 7,399 -5.3 15,578 2.11 7,553 -2.1 16,269 2.15 2015 23,194 4.3 71,388 3.08 7,753 4.8 16,906 2.18 7,954 5.3 17,517 2.20 2016 24,620 6.2 76,309 3.10 7,902 1.9 17,263 2.18 8,300 4.3 18,431 2.22 2017 25,555 3.8 85,424 3.34 7,977 1.0 17,451 2.19 8,441 1.7 18,655 2.21 2018 25,831 1.1 83,836 3.25 8,072 1.2 17,396 2.15 8,522 1.0 18,575 2.18
Source: TBTA data. Notes: (a) Toll rate increases occurred on March 16, 2008, July 12, 2009, December 30, 2010, March 3, 2013, March 22, 2015, and March 19, 2017. (b) Westbound toll traffic volume doubled, since traffic is not registered in the eastbound direction. (c) Average toll on basis of revenues divided by doubled westbound volume.

HISTORY AND PROJECTION OF TRAFFIC, TOLL REVENUES AND EXPENSES AND REVIEW OF PHYSICAL CONDITIONS OF THE FACILITIES OF TRIBOROUGH BRIDGE AND TUNNEL AUTHORITY
24
Table 6 Summary of Annual Paid Traffic and Toll Revenue, 2008 to 2018
Year Total Paying
Traffic Volume (000s)
Percent Change
Total Toll Revenue
(000s)
Percent Change
Average Toll
2008(a) 295,680 - $1,273,974 - $4.31
2009(a) 291,383 -1.5% 1,332,115 4.6% 4.57
2010(a) 291,714 0.1% 1,417,046 6.4% 4.86
2011 283,471 -2.8% 1,501,589 6.0% 5.30
2012 282,647 -0.3% 1,490,982 -0.7% 5.28
2013(a) 284,528 0.7% 1,645,193 10.3% 5.78
2014 286,361 0.6% 1,676,445 1.9% 5.85
2015(a) 297,946 4.0% 1,808,901 7.9% 6.07
2016 307,346 3.2% 1,869,693 3.4% 6.08
2017(a) 309,997 0.9% 1,911,857 2.3% 6.17
2018 322,290 4.0% 1,965,223 2.8% 6.10
Source: TBTA data. Notes: (a) Toll rate increases occurred on March 16, 2008, July 12, 2009, December 30, 2010,
March 3, 2013, March 22, 2015, and March 19, 2017.
In 2012, traffic volumes decreased by 0.3 percent to 282.6 million and toll revenues decreased 0.7 percent to $1.491 billion. The reduction in toll traffic and toll revenue is primarily due to Superstorm Sandy, which occurred on October 29, 2012 and resulted in travel restrictions on transportation facilities in the New York City area.
Traffic on the Bronx-Whitestone and Throgs Neck Bridges has been of similar magnitude over the years. These two bridges generally serve similar areas in the Bronx and Queens, and historically traffic has shifted back and forth to the crossing providing the better level of service, at times based on lane restrictions due to construction activity. Lane closures associated with deck replacement on the Bronx approach spans of the Bronx-Whitestone Bridge, which occurred for the most of 2010 and 2011 resulted in a reduction of travel lanes on the bridge. As a result, some motorists diverted onto the Throgs Neck Bridge in order to avoid congestion. This trend continued in 2013 and 2014 during the Queens approach span deck replacement project on the Bronx-Whitestone Bridge where a reduction in travel lanes on the bridge resulted in motorists again diverting to the Throgs Neck Bridge to avoid congestion.
The March 22, 2015 toll increase resulted in an overall increase in toll revenue from $1.676 billion in 2014 to $1.809 billion, an increase of 7.9 percent. The increase in traffic is attributed to a continuing modest economic recovery, generally overall favorable weather conditions, and relatively low gas prices, all of which appeared to offset the impacts associated with the toll increase.
HISTORY AND PROJECTION OF TRAFFIC, TOLL REVENUES AND EXPENSES AND REVIEW OF PHYSICAL CONDITIONS OF THE FACILITIES OF TRIBOROUGH BRIDGE AND TUNNEL AUTHORITY
25
In 2016, traffic volumes increased by 3.2 percent to 307.3 million vehicles. The increase in traffic is attributed to a continued modest recovery of the economy, favorable gas prices, and generally overall favorable weather conditions throughout the year. Another possible factor for the increase in year over year traffic is the substantial increase in housing construction activity throughout the City as developers were motivated to secure 421-a property tax exemptions before the program’s expiration in January 2016.
In 2017, traffic volumes increased by 0.9 percent to a new historical high of 310.0 million vehicles. Revenue grew by 2.3 percent from $1.870 billion in 2016 to $1.912 billion in 2017. The increase in traffic is attributed to continued growth of the economy and sustained favorable gasoline prices.
In 2018, traffic volumes increased by 4.0 percent to a new historical high of 322.3 million vehicles. Revenue grew by 2.8 percent from $1.912 billion in 2017 to $1.965 billion in 2018. The increase in traffic is attributed to continued growth of the economy and sustained favorable gasoline prices.
Preliminary results for January and February 2019 indicate that traffic on the TBTA facilities increased by 4.4 percent over the same period in 2018. This increase is attributed to the continued growth in the economy, a lack of snow storms compared to the previous year, the completion of major construction activity on both the Queens Midtown and Hugh L. Carey Tunnels, and continued lower gasoline prices in the City. Changes by facility are shown below in Table 7.
Table 7 Actual Changes in January - February Traffic, 2018 to 2019
Facility Actual Percent Change
January - February 2018 to 2019(a)
Throgs Neck Bridge 3.4%
Bronx-Whitestone Bridge 3.8%
RFK Bridge 1.2%
Queens Midtown Tunnel 17.4%
Hugh L. Carey Tunnel 9.2%
Verrazzano-Narrows Bridge 3.8%
Henry Hudson Bridge 2.0%
Marine Parkway-Gil Hodges Memorial Bridge 0.9%
Cross Bay Veterans Memorial Bridge 3.2%
Total 4.4% Notes:
(a) Based on preliminary actual data, subject to final audit.
Traffic by Facility and Vehicle Class, 2018
TBTA maintains traffic counts for each crossing in 14 categories, ranging from passenger cars to trucks with seven axles. Displayed in Table 8 are the 2018 traffic volumes by facility. Passenger cars totaled 298.8 million crossings and represented 92.7 percent of the total toll-paying vehicles (which has remained relatively constant over time). Of the TBTA facilities, the Verrazzano-Narrows Bridge

HISTORY AND PROJECTION OF TRAFFIC, TOLL REVENUES AND EXPENSES AND REVIEW OF PHYSICAL CONDITIONS OF THE FACILITIES OF TRIBOROUGH BRIDGE AND TUNNEL AUTHORITY
26
registered the highest toll-paying traffic volume of 74.8 million vehicles. The lowest toll-paying volume, 8.1 million vehicles, was recorded at the Marine Parkway Bridge.
Table 8 Traffic by Facility and Vehicle Class, 2018 (000s)(a,b)
Facility 1
Passenger Cars
2 Pass. Cars
w/one-axle
Trailer
3 Pass. Cars
w/two-axle
Trailer
4 Trucks 2 Axles
Franchise Buses 6
Trucks 3 Axles
7 Trucks 4 Axles 5
2 Axles 11
3 Axles
Throgs Neck Bridge 39,582 52 55 1,936 2 4 371 359 Bronx-Whitestone Bridge 44,572 19 15 1,729 44 112 367 236 RFK Bridge 60,970 28 20 3,533 20 284 670 175 Queens Midtown Tunnel 25,533 6 4 1,470 10 241 230 18 Hugh L. Carey Tunnel 17,396 3 2 619 2 495 192 22 Verrazzano-Narrows Bridge(c) 69,703 35 33 2,467 127 332 588 333 Henry Hudson Bridge(d) 25,528 6 3 242 0 0 5 1 Marine Parkway Bridge 7,708 3 2 280 19 1 26 5 Cross Bay Bridge 7,843 3 3 397 8 107 110 11 Total 298,836 156 137 12,672 233 1,576 2,559 1,161 Percent of Paid Vehicles 92.7% 0.0% 0.0% 3.9% 0.1% 0.5% 0.8% 0.4%
Facility 8
Trucks 5 Axles
9 Motor-cycles
12 Trucks 6 Axles
13 Trucks 7 Axles
14 Other
Vehicles
Total Toll-
Paying Vehicles
10 Non-
Revenue Vehicles(e)
Total Vehicles
Throgs Neck Bridge 1,810 64 81 29 2 44,347 176 44,523 Bronx-Whitestone Bridge 778 62 18 4 0 47,958 170 48,128 RFK Bridge 573 100 20 4 2 66,398 366 66,764 Queens Midtown Tunnel 8 32 0 0 0 27,552 128 27,680 Hugh L. Carey Tunnel 4 63 0 0 0 18,799 163 18,962 Verrazzano-Narrows Bridge(c) 1,016 134 34 4 2 74,809 297 75,106 Henry Hudson Bridge(d) 1 44 0 0 0 25,831 63 25,895 Marine Parkway Bridge 15 14 1 0 0 8,072 59 8,131 Cross Bay Bridge 16 22 1 1 0 8,522 59 8,582 Total 4,219 536 156 43 6 322,290 1,481 323,771 Percent of Paid Vehicles 1.3% 0.2% 0.0% 0.0% 0.0% 100.0%
Source: TBTA Notes: (a) Totals may not add due to rounding. (b) Based on preliminary actual data, subject to final audit. (c) Westbound traffic doubled, since traffic is not registered in the eastbound direction. (d) Truck passage prohibited except with NYCDOT permit. (e) Includes police, fire, and other emergency vehicles and TBTA vehicles.
Monthly Traffic, 2018
Monthly variations in traffic volumes on the nine crossings have been attributed to several factors historically, including severe weather, either winter or tropical storms, which result in lower volumes; and, conversely, traffic reaching its highest levels during the summer months when recreational travel peaks. Traffic volumes also typically decline or traffic growth slows in the aftermath of a toll increase. Furthermore, individual facilities can be affected by construction projects on the facility itself or its approaches, and on adjacent arterials or competing bridges. The limited number of

HISTORY AND PROJECTION OF TRAFFIC, TOLL REVENUES AND EXPENSES AND REVIEW OF PHYSICAL CONDITIONS OF THE FACILITIES OF TRIBOROUGH BRIDGE AND TUNNEL AUTHORITY
27
crossings in the region, however, largely sustains the overall demand for TBTA’s bridges and tunnels. In addition to these normal impacts, there are extraordinary events such as the effects of September 11th and Superstorm Sandy.
The data in Table 9 indicate that total traffic on the nine crossings in 2018 peaked in June. August was the second highest month in 2018. For the combined facilities, the monthly variations in 2018 ranged from 13 percent and 8 percent below the annual average daily traffic in January and February, respectively, to 8 percent and 7 percent above in June and August, respectively. This traffic mix is relatively stable, comprising a solid base of commuting, discretionary and commercial traffic.
Table 9 Monthly Traffic Variations, 2018
Month
Average Daily Toll-Paying Traffic(a) Ratio to AADT (c),
(d) Throgs Neck Bridge
Bronx-Whitestone
Bridge
RFK Bridge
Queens Midtown
Tunnel
Hugh L. Carey Tunnel
Verrazzano-Narrows Bridge(b)
Henry Hudson Bridge
Marine Pkwy
Bridge
Cross Bay
Bridge Total
January 103,993 114,153 159,132 62,881 44,533 182,045 60,543 18,151 20,113 765,543 0.87
February 109,923 120,535 170,227 68,256 48,145 190,720 64,842 18,989 20,602 812,239 0.92 March 113,180 122,578 176,873 67,578 47,604 192,749 66,535 19,640 21,411 828,148 0.94 April 122,079 131,950 186,818 71,397 51,560 203,560 73,373 20,712 22,520 883,969 1.00 May 126,747 134,993 189,861 74,850 53,037 207,341 76,146 23,038 24,533 910,547 1.03 June 131,073 141,903 195,731 76,375 54,676 221,867 76,976 26,307 26,652 951,561 1.08 July 130,712 137,763 187,363 77,200 50,266 211,849 71,291 27,714 27,184 921,343 1.04 August 130,998 141,480 193,121 81,719 53,244 218,927 72,505 26,537 25,988 944,519 1.07 September 125,380 135,521 187,156 80,410 52,153 207,443 71,895 22,152 23,728 905,838 1.03 October 123,555 135,057 185,116 83,661 55,992 210,505 74,504 21,189 23,357 912,937 1.03 November 121,717 131,349 178,548 81,878 53,759 204,803 71,171 20,586 22,344 886,155 1.00
December 117,971 128,873 172,547 79,184 52,956 206,857 69,224 20,117 21,546 869,276 0.98
AADT(d) 121,499 131,393 181,913 75,486 51,504 204,956 70,771 22,116 23,349 882,986 1.00 Notes: (a) Totals may not add due to rounding. (b) Westbound traffic doubled. (c) Annual Average Daily Traffic. (d) For total traffic on the nine crossings. The ratio to AADT is the quotient of a month’s AADT and the annual average for the year; e.g. a
ratio to AADT of 0.89 signifies that the monthly traffic is 11 percent below the AADT for 2018.
Changes in Monthly Traffic, 2017 to 2018
Table 10 lists the monthly average daily traffic changes that have occurred between 2017 and 2018.

HISTORY AND PROJECTION OF TRAFFIC, TOLL REVENUES AND EXPENSES AND REVIEW OF PHYSICAL CONDITIONS OF THE FACILITIES OF TRIBOROUGH BRIDGE AND TUNNEL AUTHORITY
28
Table 10 Changes in Monthly Average Daily Traffic, 2017 to 2018
Month
Percent Change Comparing 2017 Monthly Average Daily Traffic to 2018
Throgs Neck Bridge
Bronx-Whitestone
Bridge
RFK Bridge
Queens Midtown
Tunnel
Hugh L. Carey Tunnel
Verrazzano-Narrows
Bridge
Henry Hudson Bridge
Marine Pkwy
Bridge
Cross Bay
Bridge
January -2.2% 0.5% 2.9% 1.2% 0.3% 2.7% 1.0% 0.2% 0.3% February 1.3 4.1 8.8 6.1 3.9 5.9 3.3 5.8 3.0 March 0.9 1.1 11.4 3.3 -0.3 4.9 3.7 3.1 1.3 April -1.2 2.4 12.0 5.7 8.0 3.7 0.9 5.4 2.5 May 2.3 5.9 10.7 8.8 7.0 3.8 1.9 1.9 5.1 June 1.7 5.3 8.5 7.2 8.3 6.8 -0.1 -0.9 -1.8 July 3.0 5.1 1.3 9.3 7.0 4.7 0.7 1.2 0.5 August 3.3 6.2 0.8 7.8 5.0 4.8 -0.9 1.4 1.0 September 2.5 5.5 -1.3 13.1 6.0 1.2 -0.6 -5.1 -1.0 October 1.7 6.4 -0.4 18.7 15.6 3.8 1.2 2.1 1.8 November 0.0 3.4 -2.3 16.5 14.0 1.9 -1.1 -0.9 -0.4 December 3.9 3.8 -0.3 19.8 13.1 4.1 3.9 2.5 0.1 Annual 1.5 4.2 4.1 9.9 7.4 4.0 1.1 1.2 1.0
Major reasons for monthly traffic changes include:
• Continued modest economic expansion, including continued regional jobs growth; • Sustained lower gasoline prices throughout 2018; and • Continued traffic recovery after the conclusion of construction activities at and approaching
the Queens Midtown Tunnel and Hugh L. Carey Tunnel.
Operating Expenses, 2008 to 2018
Table 11 displays the historical operating expenses for the TBTA facilities from 2008 through 2018. TBTA divides operating expenses into two major categories: labor and non-labor. Labor includes salaries, overtime and fringe benefits, net of capital reimbursements. Major maintenance, some bridge painting, outside services, insurance, TBTA’s share of the New York E-ZPass Customer Service Center, and other non-personnel expenses are included in non-labor.
TBTA labor expenses increased from $207.3 million in 2008 to $243.1 million in 2018, an increase of $35.8 million. The increase was entirely due to higher actuarial assessments of pension commitments ($16.4 million) and increases in costs for fringe benefits including health and welfare benefits for current employees and retirees, workers' compensation, and others ($22.8 million). Payroll costs, including regular wages and overtime pay, declined by $3.4 million over this period. Year-end headcount in 2008 was 1,775, and it fell to 1,388 at year-end 2018. This was the result, over the eleven-year period shown, of numerous managerial initiatives aimed at achieving operational efficiencies, several MTA-wide workforce consolidation efforts, and headcount reductions achieved solely through attrition that were realized through the move to Cashless Tolling.

HISTORY AND PROJECTION OF TRAFFIC, TOLL REVENUES AND EXPENSES AND REVIEW OF PHYSICAL CONDITIONS OF THE FACILITIES OF TRIBOROUGH BRIDGE AND TUNNEL AUTHORITY
29
Table 11 Historical Operating Expenses, 2008 to 2018
Year Operating Expenses (000s)(a) Percent
Change Labor(b) Non-Labor(c) Total
2008 $207,305 $200,686 $407,991 -
2009 220,400 177,400 397,800 -2.5% 2010 209,499 173,950 383,449 -3.6%
2011 208,343 150,503 358,846 -6.4% 2012 220,576 157,463 378,039 5.3% 2013 220,692 188,804 409,496 8.3% 2014 238,528 205,224 443,752 8.4% 2015 235,099 217,660 452,759 2.0%
2016 243,436 221,418 464,854 2.7% 2017 248,347 241,838 490,185 5.4%
2018 243,115 258,150 501,265 2.3% Source: TBTA Notes:
(a) Totals may not add due to rounding. (b) Includes salaries, overtime and fringe benefits, net of capital reimbursements. (c) Non-labor includes the following categories: major maintenance and supplies, bridge
painting, outside services, insurance, power, leases and rentals and other expenses.
Non-labor expenses increased from $200.7 million in 2008 to $258.2 million in 2018. Most of this growth is attributable to back-office costs for administering E-ZPass toll collection, along with the introduction of TBM at the Henry Hudson Bridge in 2012 and the expansion of TBM to all facilities in 2017. Over this ten-year period, TBTA has been successful in negotiating lower unit costs for E-ZPass tags and has achieved contracted efficiency savings associated with running the NYCSC, which also administers the TBM program. However, the growth in overall transactions have driven up NYCSC expenses, credit/debit card transaction fees (which have also been impacted by higher E-ZPass and TBM tolls) and the costs of maintaining toll collection equipment. Expenses in other areas have generally grown at rates approximating CPI-U inflation.
The following is a brief discussion of the major year-to-year shifts in operating expenses.
Operating expenses in 2009 were $397.8 million, which was 2.5 percent below expenses in 2008. Labor expenses increased by 6.3 percent primarily due to wage inflation, contractual step-up increases and upward pension assessments. This rise in labor costs was offset by an 11.6 percent drop in non-labor expenses which was driven primarily by a one-time additional need in 2008 for major maintenance work that did not recur in 2009 and beyond. Total operating expenses in 2010 declined another 3.6 percent. TBTA undertook a major organizational assessment in 2010 that included staff reductions and the elimination of redundant or unnecessary organizational levels. These actions resulted in a 4.9 percent decline in labor expenses. Non-labor expenditures declined 1.9 percent primarily due to the capitalization of much of the bridge painting program. In 2011, total operating expenses decreased for the third year in a row. Expenses in 2011 decreased 6.4 percent from 2010, with the majority of the decrease attributed to reductions in non-labor expenses.

HISTORY AND PROJECTION OF TRAFFIC, TOLL REVENUES AND EXPENSES AND REVIEW OF PHYSICAL CONDITIONS OF THE FACILITIES OF TRIBOROUGH BRIDGE AND TUNNEL AUTHORITY
30
Total operating expenses for 2012 increased $19.2 million, or 5.3 percent from 2011 primarily due to the emergency response and facility restoration efforts associated with Superstorm Sandy totaling $11.7 million. In addition, pension costs were greater by $8.5 million due to a revised valuation by the New York City Office of the Actuary that included a drop in the assumed rate of investment return, from 8 percent to 7 percent, retroactive to July 2011.
Total operating expenses for 2013 increased $31.5 million, or 8.3 percent above 2012 primarily due to: $12.6 million in additional bond issuance costs associated with the implementation of Government Accounting Standards Bureau (GASB) 65, which requires that certain expenses that were previously allowed to be amortized over the life of the bonds must now be realized in full when incurred; $5.2 million in Superstorm Sandy restoration costs; $4.4 million in higher insurance premiums; additional credit/debit card fees of $2.7 million due to the March increase in E-ZPass tolls; and another $2.7 million in New York E-ZPass Customer Service Center costs stemming from account growth and the first full year of Cashless Tolling at the Henry Hudson Bridge.
Total operating expenses for 2014 increased $34.3 million, or 8.4 percent above 2013 primarily resulting from: $13.3 million in additional wage and associated fringe benefit costs primarily stemming from payments and provisions for actual and projected union contract settlements retroactive to 2009; an actuarial adjustment of $3.8 million for Workers’ Compensation; $9.5 million to fund additional major maintenance and bridge painting projects; and a total increase of $6.5 million in property and general liability insurance premiums.
In 2015, total operating expenses were $452.8 million, which was $9.0 million, or 2.0 percent above 2014 expenses. Labor expenses declined by $3.4 million, or 1.4 percent, primarily due to unfilled vacancies throughout the year and the transfer of 53 technology positions to the MTA as part of an agency-wide IT consolidation effort. Non-labor expenses grew by $12.4 million, or 6.1 percent, primarily due to additional major maintenance and bridge painting projects and higher credit card fees associated with the toll increase implemented on March 22, 2015.
In 2016, total operating expenses were $464.9 million, which was $12.1 million, or 2.7 percent above 2015 expenses. Labor expenses increased by $8.3 million, or 3.5 percent, primarily due to wage inflation and actuarial adjustments to pension expenses. Non-labor expenses grew by $3.8 million, or 1.7 percent, which was slightly above the national inflation rate of 1.3 percent. Growth exceeded inflation primarily due to additional major maintenance projects and higher bond issuance costs.
In 2017, total operating expenses were $490.2 million, which was $25.3 million, or 5.4 percent above 2016 operating expenses. Labor expenses increased by $4.9 million, or 2.0 percent, primarily due to wage inflation. Non-labor expenses grew by $20.4 million, or 9.2 percent, primarily due to implementation costs for Cashless Tolling and back-office costs for administering the TBM program.
Total operating expenses in 2018 were $501.3 million, which was 2.3 percent above costs in 2017. Labor expenses declined by 2.1 percent primarily due to vacant positions and headcount reductions achieved solely through attrition that were realized through the move to Cashless
HISTORY AND PROJECTION OF TRAFFIC, TOLL REVENUES AND EXPENSES AND REVIEW OF PHYSICAL CONDITIONS OF THE FACILITIES OF TRIBOROUGH BRIDGE AND TUNNEL AUTHORITY
31
Tolling. Non-labor costs increased by 6.7 percent primarily due to a full year’s facility-wide impact on back-office and other non-labor costs related to Cashless Tolling operations.
FACTORS AFFECTING TRAFFIC GROWTH
A previous section of this report identified the historical trends in traffic, revenue, and expenses of the nine TBTA bridges and tunnels. Before developing the forecasts, several factors affecting future traffic were considered, including the projected trends in population and employment, TBTA and regional construction impacts, the capacity constraints in the regional highway network, and toll and elasticity impacts. This section of the report concludes with a summary of the assumptions and conditions upon which the traffic and toll revenue forecasts were based.
Employment, Population, and Motor Vehicle Registrations
In keeping with federal requirements mandating the preparation of long-term demographic and socioeconomic forecasts for travel demand modeling purposes, the New York Metropolitan Transportation Council (NYMTC) prepares and periodically updates employment and population forecasts for the 10-county NYMTC territory1 and 21 surrounding counties in New York, New Jersey, and Connecticut. The latest forecasts, which are included in the following tables, range from 2010 to 2050 on a 5-year interval basis. They are consistent with historical trends from 1970 to 2018.
The NYMTC forecasting approach begins with modeling of the regional growth in employment relative to national trends and forecasts prepared by IHS Global Insight, Moody’s, and the Bureau of Labor Statistics (BLS), calibrated at the county level on an industry-specific basis (IHS Global and Moody’s are major vendors of economic and financial analysis, forecasts, and market intelligence worldwide). Employment then drives population growth which is forecasted at the sub-regional and county levels by a model that includes fertility, mortality, and recent past trends in net migration and induced labor force growth.
Typically, traffic volumes in the region are affected by changes in employment and population. The demand on TBTA facilities normally tends to be influenced less by regional employment and population trends than other toll facilities because available water crossings are limited. Motor vehicle registrations are another indicator of trends in traffic volumes. To better understand how these indicators may influence traffic volumes on TBTA crossings over the long term, Stantec first reviewed historical trends and forecasts by NYMTC and others, and then adjusted traffic forecasts in the short term to account for current economic conditions.
Employment Trends and Projections
Job growth traditionally has had an impact on traffic generation. Generally, when the economy is robust and jobs are growing, there is an increase in traffic. Conversely, when employment trends downward traffic volumes generally decline. However, the rate of decline depends upon the
1 The 10-County NYMTC Territory includes the five boroughs of New York City as well as Nassau, Suffolk, Rockland, Westchester and Putnam Counties.
HISTORY AND PROJECTION OF TRAFFIC, TOLL REVENUES AND EXPENSES AND REVIEW OF PHYSICAL CONDITIONS OF THE FACILITIES OF TRIBOROUGH BRIDGE AND TUNNEL AUTHORITY
32
severity of employment losses. Table 12 depicts the long-term trend in total employment in the region since 1970. The region is defined as consisting of 31 counties that comprised the commuter-shed: the five boroughs of the City; 9 suburban counties of New York State in Long Island and the Mid-Hudson; 14 counties of northern and central New Jersey; and 3 counties of Connecticut.
As Table 12 shows, the City’s employment decreased from a peak of 4.1 million jobs in 1970 to 3.6 million in 1980. Since 1980, the City has shown consistent employment growth in each decade, having returned to 1970 levels in the 1990s and reached 6.0 million jobs in 2018. The Long Island and Mid-Hudson suburbs, otherwise known as the New York Region, have reflected continuous growth in the decades since 1970, expanding from 1.6 million jobs in 1970 to 3.1 million in 2018. Similar rates of suburban growth occurred in New Jersey and Connecticut between 1970 and 2010. In the New Jersey suburban region, the annual growth rate from 2010 to the present outpaced historic annual growth from 1970 to 2010. The growth rate remained unchanged during both periods in Connecticut and the New York suburban region which saw a slightly reduced growth rate over the 2010-2018 period. Between 1970 and 2018, New Jersey added 2.0 million jobs while Connecticut gained 0.5 million jobs. Among the four sub-regions, the City accounted for the largest employment base with 40 percent of 14.8 million regional jobs, followed by New Jersey with 30 percent, the New York suburbs with 21 percent and Connecticut with 8 percent.

HISTORY AND PROJECTION OF TRAFFIC, TOLL REVENUES AND EXPENSES AND REVIEW OF PHYSICAL CONDITIONS OF THE FACILITIES OF TRIBOROUGH BRIDGE AND TUNNEL AUTHORITY
33
Table 12 Employment Trends Number of Jobs (000s)(a)
Year New York City
New York Region(b)
New Jersey Region(c)
Connecticut Region(d)
NYC and All Regions(e)
1970 4,066.5 1,554.6 2,447.6 727.4 8,796.1 1980 3,614.0 1,918.6 2,828.2 869.3 9,230.1 1990 3,962.3 2,343.6 3,419.2 1,001.7 10,726.8 2000 4,300.3 2,565.7 3,741.5 1,084.2 11,691.7 2005 4,411.1 2,720.0 3,951.1 1,109.0 12,191.2 2010 4,788.6 2,786.8 3,943.9 1,120.9 12,640.2 2015(f) 5,601.0 3,005.0 4,263.4 1,199.2 14,068.5 2016 5,725.7 3,044.3 4,334.9 1,209.5 14,314.4 2017 5,845.7 3,087.9 4,407.0 1,216.0 14,556.6 2018 5,964.8 3,117.1 4,463.1 1,226.3 14,771.3
Average Annual Percent Change
1970 to 1980 -1.2% 2.1% 1.5% 1.8% 0.5% 1980 to 1990 0.9% 2.0% 1.9% 1.4% 1.5% 1990 to 2000 0.8% 0.9% 0.9% 0.8% 0.9% 2000 to 2005 0.5% 1.2% 1.1% 0.5% 0.8% 2005 to 2010 1.7% 0.5% 0.0% 0.2% 0.7% 2010 to 2015 3.2% 1.5% 1.6% 1.4% 2.2% 2015 to 2016 2.2% 1.3% 1.7% 0.9% 1.7% 2016 to 2017 2.1% 1.4% 1.7% 0.5% 1.7% 2017 to 2018 2.0% 0.9% 1.3% 0.9% 1.5%
Source: New York Metropolitan Transportation Council, New York State Department of Labor, Connecticut Department of Labor, New Jersey Department of Labor and Workforce Development, United States Bureau of Labor Statistics (BLS), and United States Bureau of Economic Analysis.
Notes: (a) Historic employment estimates are modeled using data inputs from the BLS Current Employment Statistics Program (CES)
Quarterly Census of Employment and Wages (QCEW) program as well as the Bureau of Economic Analysis’ Table 25N Proprietors statistics. Final revisions to statewide and local area CES data, called a "Benchmark," are made each March for the previous five years based on payroll tax reports submitted by employers covered by the Unemployment Insurance program to individual states. On February 1, 2019, the BLS released its 2018 re-benchmarked CES data with revisions to employment of specific industries going back as far as 1990.
(b) Consists of the following counties: Dutchess, Nassau, Orange, Putnam, Rockland, Suffolk, Sullivan, Ulster and Westchester. (c) Consists of the following counties: The 13 counties of the North Jersey Transportation Planning Authority (Bergen, Essex,
Hudson, Hunterdon, Middlesex, Monmouth, Morris, Ocean, Passaic, Somerset, Sussex, Union, Warren) plus Mercer County of the Delaware Valley Regional Planning Commission.
(d) Consists of the following counties: Fairfield, Litchfield, and New Haven. (e) Totals may not add due to rounding. (f) In 2015, the City of New York changed its methodology of reporting local government workers to more accurately reflect
the geographic distribution of the workforce.
NYMTC prepared a series of 40-year employment forecasts, released in final form in March 2015. Forecasted trends are compressed to 5-year intervals which masks cyclical trends between these years, a common practice in long term forecasting. NYMTC projected regional employment growth would increase at an average annual rate of 0.5 percent between 2010 and 2050. However, regional employment levels increased at an average annual growth rate of 2.0 percent between 2010 and 2018, more than four times greater than the average annual growth rate NYMTC forecasted between 2010 and 2050 in 2018. However, since 2015, the annual regional growth rate has declined each year, suggesting less of an understatement in the decade long expansion. NYMTC is currently undertaking a revision in the long-term employment forecast that

HISTORY AND PROJECTION OF TRAFFIC, TOLL REVENUES AND EXPENSES AND REVIEW OF PHYSICAL CONDITIONS OF THE FACILITIES OF TRIBOROUGH BRIDGE AND TUNNEL AUTHORITY
34
will be released in 2020 for the 2017-2055 period. NYMTC’s employment projections from its current employment forecast are presented in Table 13.
Table 13 Employment Projections (000s)(a)
Year New York City
New York Region (b)
New Jersey Region (c)
Connecticut Region (d)
NYC and All Regions
Average Annual Percent Change
2010 to 2015 1.6% 1.1% 1.1% 0.9% 1.3% 2015 to 2020 0.5% 0.6% 0.8% 0.7% 0.6% 2020 to 2025 0.2% 0.4% 0.3% 0.3% 0.3% 2025 to 2030 0.2% 0.4% 0.3% 0.4% 0.3% 2030 to 2035 0.2% 0.4% 0.5% 0.4% 0.4% 2035 to 2040 0.2% 0.4% 0.5% 0.5% 0.4% 2040 to 2045 0.2% 0.4% 0.4% 0.5% 0.3% 2045 to 2050 0.2% 0.4% 0.4% 0.5% 0.4%
2010 to 2050 0.4% 0.5% 0.5% 0.5% 0.5% Source: New York Metropolitan Transportation Council Notes: (a) Future employment projections are modeled using an amalgam of data inputs from IHS Global Insight, Moody’s, State DOLs, USBLS’s
Current Employment Statistics Program (CES) Quarterly Census of Employment and Wages (QCEW) program, and the US Census Bureau’s American Community Survey.
(b) Consists of the following counties: Dutchess, Nassau, Orange, Putnam, Rockland, Suffolk, Sullivan, Ulster and Westchester. (c) Consists of the following counties: The 13 counties of the North Jersey Transportation Planning Authority (Bergen, Essex, Hudson,
Hunterdon, Middlesex, Monmouth, Morris, Ocean, Passaic, Somerset, Sussex, Union, Warren) plus Mercer County of the Delaware Valley Regional Planning Commission.
(d) Consists of the following counties: Fairfield, Litchfield, and New Haven.
Based on national forecasts to 2044 and regional forecasts to 2050, considering the solid recovery since the 2007-2009 recession, the existing regional outlook suggests that jobs will expand by 0.5 percent annually over the period, nearly half the annual average growth rate of 0.9 percent between 1970 and 2010. Employment in the City is expected to expand at a rate slightly less than half the suburban regions of New Jersey, Connecticut and New York. No sub-regions are projected to experience a period of interim decline in employment, as each tends to grow with cyclical contractions between 0.2 and 0.8 percent annually on average over the period.
To some extent, the economic recovery in the region and the nation appeared to be largely complete in 2018, with unemployment levels below 2007 pre-recession levels and rising wage and output growth. All regions have not recovered equally, with more than half of the regions’ job growth post-2010 occurring in the City. The New York State Department of Labor reported that the City’s annual average jobless rate had dropped to 4.1 percent in 2018, below the 5.0 percent unemployment rate reported in 2006 and 20072. On average, 170,200 residents were unemployed in a labor force of 4.1 million, while 375,800 had gained employment between 2010 and 2018. The City’s rate of unemployment is slightly less than that of the Connecticut counties of Fairfield, Litchfield and New Haven but more than that of the New York and New Jersey suburbs which
2 As of December 2018, the City’s monthly unemployment rate had fallen to 3.9 percent.

HISTORY AND PROJECTION OF TRAFFIC, TOLL REVENUES AND EXPENSES AND REVIEW OF PHYSICAL CONDITIONS OF THE FACILITIES OF TRIBOROUGH BRIDGE AND TUNNEL AUTHORITY
35
averaged 3.9 and 4.0 percent, respectively in 2018. Labor force conditions are summarized in Table 14.
Table 14 Labor Force(a) Conditions, 2010 & 2018
Year New York City New York Region(b)
New Jersey Region(c)
Connecticut Region(d)
Labor Force
2010 3,950,400 2,611,100 3,605,500 1,045,100 2018 4,119,500 2,641,400 3,582,400 1,044,900
Employed
2010 3,573,600 2,414,800 3,275,000 949,700 2018 3,949,400 2,538,400 3,439,300 1,000,600
Unemployed
2010 376,900 196,200 330,500 95,400 2018 170,200 103,000 143,200 44,300
Unemployment Rate
2010 9.5% 7.5% 9.2% 9.1% 2018 4.1% 3.9% 4.0% 4.2%
Source: State Departments of Labor and BLS. Notes: (a) This table, which reflects the NYMTC employment estimate, includes the jobs of self-employed (i.e.,
non-payroll) workers, some of which are part-time jobs, as reported by the US Department of Commerce, Bureau of Economic Analysis, for New York City. These non-payroll jobs are added to the NYS DOL payroll employment.
(b) Consists of the following counties: Dutchess, Nassau, Orange, Putnam, Rockland, Suffolk, Sullivan, Ulster and Westchester.
(c) Consists of the following counties: The 13 counties of the North Jersey Transportation Planning Authority (Bergen, Essex, Hudson, Hunterdon, Middlesex, Monmouth, Morris, Ocean, Passaic, Somerset, Sussex, Union, Warren) plus Mercer County of the Delaware Valley Regional Planning Commission.
(d) Consists of the following counties: Fairfield, Litchfield, and New Haven.
Over the year 2018, the City gained 71,000 Nonfarm jobs (a measure of the number of U.S. workers in the economy that excludes proprietors, private household employees, unpaid volunteers, farm employees, and the unincorporated self-employed) with an equal number added in the private sector. Leading industries included Health Care and Social Assistance, which added of 34,600 jobs; Educational Services which added 7,100 more jobs; Professional, Scientific, and Technical Services which added 6,700 added jobs; and Arts, Entertainment, and Recreation which added 6,300 additional jobs. Lesser job gains occurred in the sectors of Accommodation and Food Services (+5,600 jobs), Other Services (including Religious, Grant Making, Civic and Professional occupations (+5,200 jobs), Retail Trade (+3,200 jobs), Construction (+3,000 jobs), Transportation and Warehousing (+1,900 jobs) and Administrative and Support and Waste Management and Remediation Services (+1,600 jobs). Less than a thousand jobs were created in Management of Companies and Enterprises (+700 jobs), Finance and Insurance (+200 jobs) and Manufacturing (+100 jobs). Government services added zero jobs. Several sectors saw reduced employment including: Information, which includes publishing, broadcasting, and telecommunications, (-2,100 jobs), Wholesale Trade (-1,700 jobs), Real Estate and Rental and Leasing (-1,200 jobs), and Utilities (-100 jobs).

HISTORY AND PROJECTION OF TRAFFIC, TOLL REVENUES AND EXPENSES AND REVIEW OF PHYSICAL CONDITIONS OF THE FACILITIES OF TRIBOROUGH BRIDGE AND TUNNEL AUTHORITY
36
In the housing market, annual building permits authorizing new housing construction decreased in the City to 20,910 units in 2018, a reduction of 1,221 units or 5.5 percent over 2017 (as shown in Table 4). The number of permits approved in 2018 was down by 63.0 percent or 35,618 units compared to the recent high of 56,528 permits approved in 2015. The significant reduction was primarily due to a rush by multi-family housing developers in 2015 to secure 421-a property tax exemptions before the program’s expiration in January 2016. Compared with the post-recession period when just 5,000 to 6,000 units housing building permits were authorized annually, the trend in recent years is a major increase, with 15,000 to 20,000 permits approved annually. The actual number of constructed housing units annually is roughly 25,000 units, as many of the 2015 permit authorizations have been spread over successive years.
Table 15 Housing Building Permits Issued within the City, 2015 - 2018
Borough 2015 2016 2017 2018 Annual Growth
(2015-2016)
Annual Growth
(2016-2017)
Annual Growth
(2017-2018) Bronx 4,682 4,003 5,401 3,698 -14.5% 34.9% -31.5%
Brooklyn 26,026 4,503 6,130 8,445 -82.7% 36.1% 37.8% Manhattan 12,612 4,024 4,811 3,584 -68.1% 19.6% -25.5%
Queens 12,667 2,838 5,104 4,577 -77.6% 79.8% -10.3% Staten Island 541 901 685 606 66.5% -24.0% -11.5%
Total 56,528 16,269 22,131 20,910 -71.2% 36.0% -5.5% Source: US Census Bureau, Building Permit Survey.
In other property markets, notably office, Jones Lang LaSalle reported that leasing activity had accelerated in 2018 reaching 35.3 million square feet, the highest annualized amount since 2014. Reflecting a 29-year low in Manhattan unemployment, demand for office space swelled. At the top, Cushman & Wakefield reported that Class A rental rates fell to $78.83 per square foot from $79.05 in 2017 while among all classes, average rental rates edged up from $72.25 per square foot in 2017 to $72.28 in 2018. Net absorption for the borough’s office market was up by 10.4 million square feet by year end 2018, an increase from a 7.4 million square foot gain in 2017. Manhattan’s inventory of office space expanded from 399.0 million square feet in 2017 to 401.0 million square feet in 2018, a net gain of 2.0 million square feet.
During the fourth quarter of 2018, Cushman & Wakefield reported that 15.3 million square feet of office space was under construction and anticipated to be completed in Manhattan in the next few years. Table 16 further identifies major office buildings in Manhattan currently under construction by the gross square footage of space expected to be constructed in each year through 2022. These 18 projects will add 4.5 million square feet in 2019 and almost 12 million square feet from 2019 through 2022.

HISTORY AND PROJECTION OF TRAFFIC, TOLL REVENUES AND EXPENSES AND REVIEW OF PHYSICAL CONDITIONS OF THE FACILITIES OF TRIBOROUGH BRIDGE AND TUNNEL AUTHORITY
37
Table 16 Major Manhattan Office Buildings Under Construction in 2019
Year of Project
Completion
Address
Total Gross Square Feet
GSF Expected to be Constructed per Year
2019 2020 2021 2022
2019
1 Manhattan West 2,100,000 200,000 35 Hudson Yards 1,000,000 300,000
30 Hudson Yards 2,600,000 300,000
5 Manhattan West 1,800,000 100,000
55 Hudson Yards 1,300,000 150,000
520 West 20th St 30,000 30,000
40 Tenth Ave 145,000 145,000
106 W. 56th St 90,000 90,000
25 11th Ave 350,000 250,000
44 West 37th 43,000 43,000
542 West 22nd St 32,000 32,000
441 9th Ave 700,000 350,000
2020 24 Trinity Place 325,000 125,000 200,000
2021 1 Vanderbilt 1,600,000 400,000 250,000 150,000
3 Hudson Blvd 1,800,000 500,000 700,000 300,000
2022 50 Hudson Yards 2,900,000 600,000 700,000 600,000 500,000 2 Manhattan West 1,700,000 300,000 500,000 700,000 200,000 Farley Building
730,000 100,000 200,000 200,000 200,000
2023 66 Hudson Blvd 2,850,000 600,000 800,000 800,000 400,000
Population Trends and Projections
Since 1980, US Census data indicate that the City’s population has increased by 1.6 million persons to 8.6 million residents in 2017. In recent years, the City has continued to be a desirable place of residence for many young professionals, foreign immigrants and international investors who maintain multiple residences, as well as the City’s long-standing residents who have aged in place. As shown in Table 17, four of the City’s boroughs, Manhattan, Brooklyn, Queens, and Staten Island are now more populous than in 1970, a City high point, while the Bronx remains only marginally less populated than in earlier years.
While the City’s population has recorded historical periods of contraction, as shown in Table 17, the commuter suburbs of New York, New Jersey and Connecticut have grown largely continuously over the past 45 years. Compared to 8.6 million residents in the City, northern and central New Jersey now houses 7.2 million residents while the nine counties of Long Island and the Mid-Hudson are home to 5.2 million residents. Over the period from 1980 to 2017 in which the City added 1.6 million more inhabitants, the New Jersey region saw an increase of 1.3 million residents and the New York region added 666,500. The Connecticut region, with 2.0 million residents, has added 267,300 residents since 1980. This represents the latest data available.
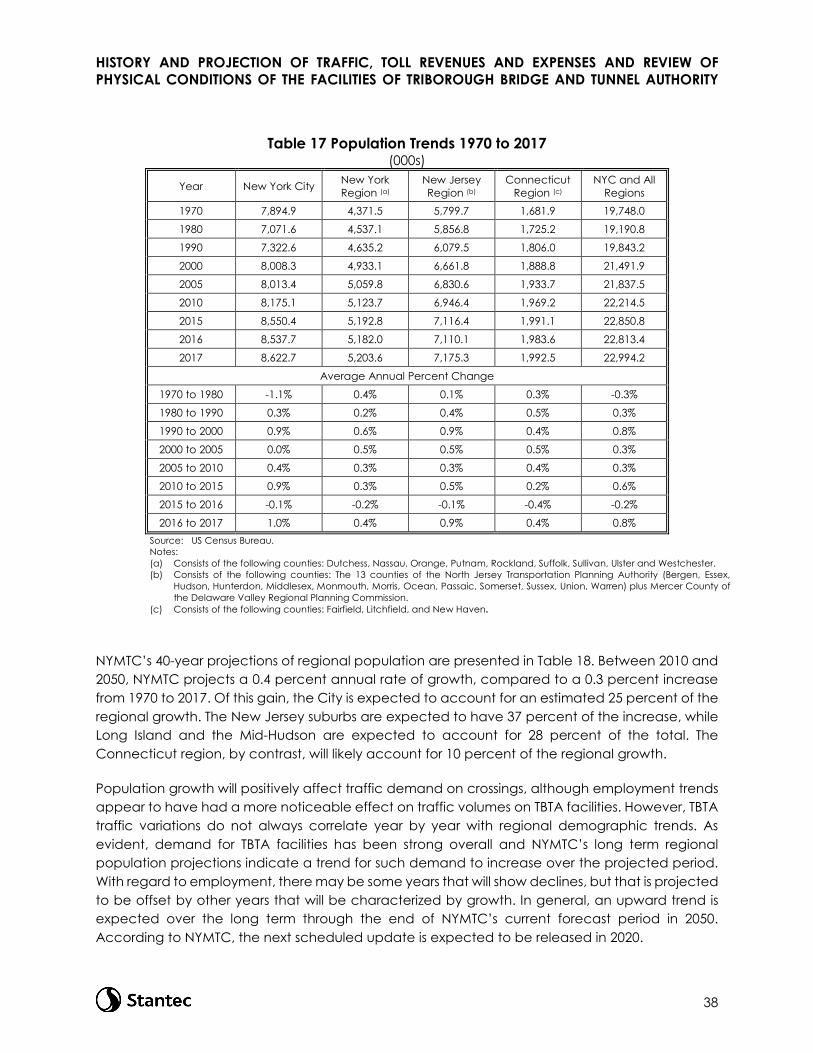
HISTORY AND PROJECTION OF TRAFFIC, TOLL REVENUES AND EXPENSES AND REVIEW OF PHYSICAL CONDITIONS OF THE FACILITIES OF TRIBOROUGH BRIDGE AND TUNNEL AUTHORITY
38
Table 17 Population Trends 1970 to 2017 (000s)
Year New York City New York Region (a)
New Jersey Region (b)
Connecticut Region (c)
NYC and All Regions
1970 7,894.9 4,371.5 5,799.7 1,681.9 19,748.0
1980 7,071.6 4,537.1 5,856.8 1,725.2 19,190.8
1990 7,322.6 4,635.2 6,079.5 1,806.0 19,843.2
2000 8,008.3 4,933.1 6,661.8 1,888.8 21,491.9
2005 8,013.4 5,059.8 6,830.6 1,933.7 21,837.5
2010 8,175.1 5,123.7 6,946.4 1,969.2 22,214.5
2015 8,550.4 5,192.8 7,116.4 1,991.1 22,850.8
2016 8,537.7 5,182.0 7,110.1 1,983.6 22,813.4
2017 8,622.7 5,203.6 7,175.3 1,992.5 22,994.2
Average Annual Percent Change
1970 to 1980 -1.1% 0.4% 0.1% 0.3% -0.3%
1980 to 1990 0.3% 0.2% 0.4% 0.5% 0.3%
1990 to 2000 0.9% 0.6% 0.9% 0.4% 0.8%
2000 to 2005 0.0% 0.5% 0.5% 0.5% 0.3%
2005 to 2010 0.4% 0.3% 0.3% 0.4% 0.3%
2010 to 2015 0.9% 0.3% 0.5% 0.2% 0.6%
2015 to 2016 -0.1% -0.2% -0.1% -0.4% -0.2%
2016 to 2017 1.0% 0.4% 0.9% 0.4% 0.8% Source: US Census Bureau. Notes: (a) Consists of the following counties: Dutchess, Nassau, Orange, Putnam, Rockland, Suffolk, Sullivan, Ulster and Westchester. (b) Consists of the following counties: The 13 counties of the North Jersey Transportation Planning Authority (Bergen, Essex,
Hudson, Hunterdon, Middlesex, Monmouth, Morris, Ocean, Passaic, Somerset, Sussex, Union, Warren) plus Mercer County of the Delaware Valley Regional Planning Commission.
(c) Consists of the following counties: Fairfield, Litchfield, and New Haven.
NYMTC’s 40-year projections of regional population are presented in Table 18. Between 2010 and 2050, NYMTC projects a 0.4 percent annual rate of growth, compared to a 0.3 percent increase from 1970 to 2017. Of this gain, the City is expected to account for an estimated 25 percent of the regional growth. The New Jersey suburbs are expected to have 37 percent of the increase, while Long Island and the Mid-Hudson are expected to account for 28 percent of the total. The Connecticut region, by contrast, will likely account for 10 percent of the regional growth.
Population growth will positively affect traffic demand on crossings, although employment trends appear to have had a more noticeable effect on traffic volumes on TBTA facilities. However, TBTA traffic variations do not always correlate year by year with regional demographic trends. As evident, demand for TBTA facilities has been strong overall and NYMTC’s long term regional population projections indicate a trend for such demand to increase over the projected period. With regard to employment, there may be some years that will show declines, but that is projected to be offset by other years that will be characterized by growth. In general, an upward trend is expected over the long term through the end of NYMTC’s current forecast period in 2050. According to NYMTC, the next scheduled update is expected to be released in 2020.

HISTORY AND PROJECTION OF TRAFFIC, TOLL REVENUES AND EXPENSES AND REVIEW OF PHYSICAL CONDITIONS OF THE FACILITIES OF TRIBOROUGH BRIDGE AND TUNNEL AUTHORITY
39
Table 18 Population Projections (000s)(a)
Year New York City
New York Region (b)
New Jersey Region (c)
Connecticut Region (d)
NYC and All Regions
Average Annual Percent Change
2015 to 2020 0.4% 0.2% 0.3% 0.3% 0.3%
2020 to 2025 0.3% 0.4% 0.4% 0.4% 0.4%
2025 to 2030 0.3% 0.7% 0.5% 0.6% 0.5%
2030 to 2035 0.2% 0.7% 0.6% 0.6% 0.5%
2035 to 2040 0.2% 0.6% 0.5% 0.5% 0.4%
2040 to 2045 0.2% 0.6% 0.5% 0.5% 0.4%
2045 to 2050 0.1% 0.6% 0.5% 0.5% 0.4% Source: New York Metropolitan Transportation Council. Notes: (a) Forecast is the most recent available, unchanged from the previous year. (b) Consists of the following counties: Dutchess, Nassau, Orange, Putnam, Rockland, Suffolk, Sullivan,
Ulster and Westchester. (c) Consists of the following counties: The 13 counties of the North Jersey Transportation Planning
Authority (Bergen, Essex, Hudson, Hunterdon, Middlesex, Monmouth, Morris, Ocean, Passaic, Somerset, Sussex, Union, Warren) plus Mercer County of the Delaware Valley Regional Planning Commission.
(d) Consists of the following counties: Fairfield, Litchfield, and New Haven.
Motor Vehicle Registrations
The trend in motor vehicle registrations in an area is a predictor of growth or stability in levels of vehicular traffic. As Table 19 shows, motor vehicle registrations in New York State, New Jersey and Connecticut peaked in 2005 and dropped sharply following the financial crisis. By 2011 Tri-State registrations neared peak 2005 levels though they have declined in recent years. Over the period from 2011 to 2017, registrations in the region dropped by 1.5 million due to a loss of 1.9 million registrants in New Jersey while New York City added 228,000 registrants, New York State added 426,000 registrants and Connecticut lost 3,000 registrants. As of March 2019, 2018 motor vehicle registration data for New Jersey and Connecticut had not been released.
Although motor vehicle registrations are not projected for future years, auto sales increased nationally following the 2007-2009 recession with a record number of annual sales in both 2015 and 2016. According to the United States Bureau of Economic Analysis monthly auto sales declined marginally in 2017 and 2018 from the peak in 2016 as average monthly finance rates for 48-month new auto loans increased from a 50-year low in November 2015 of 4.0 percent to 5.3 percent in November 2018. The outlook for future motor vehicle registrations will depend on consumer confidence levels which currently remains high at an index level of 131.4 recorded in February 2019, down from October 2018, when the highest index level was recorded in 18 years according to the Consumer Confidence Board. Consumer confidence levels could significantly deteriorate if a recession develops in the next few years, resulting in fewer motor vehicles per household.

HISTORY AND PROJECTION OF TRAFFIC, TOLL REVENUES AND EXPENSES AND REVIEW OF PHYSICAL CONDITIONS OF THE FACILITIES OF TRIBOROUGH BRIDGE AND TUNNEL AUTHORITY
40
Table 19 Motor Vehicle Registrations (000s)(a)
Year New York City
New York State(b) New Jersey Connecticut(c)
2008 1,945 11,429 6,411 3,160 2009 1,952 11,591 6,272 3,137 2010 1,962 10,603 6,956 3,148 2011 1,961 10,431 7,940 2,829 2012 1,978 10,449 7,911 2,706
2013 2,016 10,674 7,061 2,856
2014 2,057 10,904 6,874 2,866
2015 2,107 10,639 5,939 2,842
2016 2,162 11,122 5,941 2,842
2017 2,189 10,857 6,058 2,826
2018 2,015 10,623 N/A N/A
Average Annual Growth
2006-2016 1.7% -0.3% -0.3% -0.9%
2007-2017 1.3% -0.8% -0.6% -1.0%
2008-2018 0.4% -0.7% N/A N/A Source: United States Federal Highway Administration and New York State
Department of Motor Vehicles Notes: (a) This represents the most recent available data for New Jersey and Connecticut. (b) Including New York City. (c) Includes the totals for New York State, New Jersey and Connecticut.
Annual year-end motor vehicle registrations for the five-year period of 2014 through 2018 are shown for each of the City’s five boroughs in Table 20. The annual change in citywide registrations fell from a 2.6 percent increase from 2015 to 2016 to an 8.0 percent decrease from 2017 to 2018 as auto loan interest rates increased. When comparing 2014 to 2018, New York City lost 42,704 registrations; The Bronx saw the largest gain in new registrations (+4,051), followed by Brooklyn (+1,489), while registrations in Queens (-21,799), Manhattan (-17,377) and Staten Island (-9,068) decreased by 48,244 altogether. From 2017 to 2018, citywide registrations declined by 174,645 or 8 percent with significant declines reported in all five boroughs. It is worth noting that the availability and usage levels of for-hire services have had impacts on traffic and contributed to a portion of the increase in vehicular travel in recent years; for example the number of for-hire vehicles in New York City increased from 52,500 vehicles in 2014 up to 107,000 vehicles in 2018, the vast majority operated by drivers affiliated with high volume services such as Uber, Lyft, Juno, and Via.
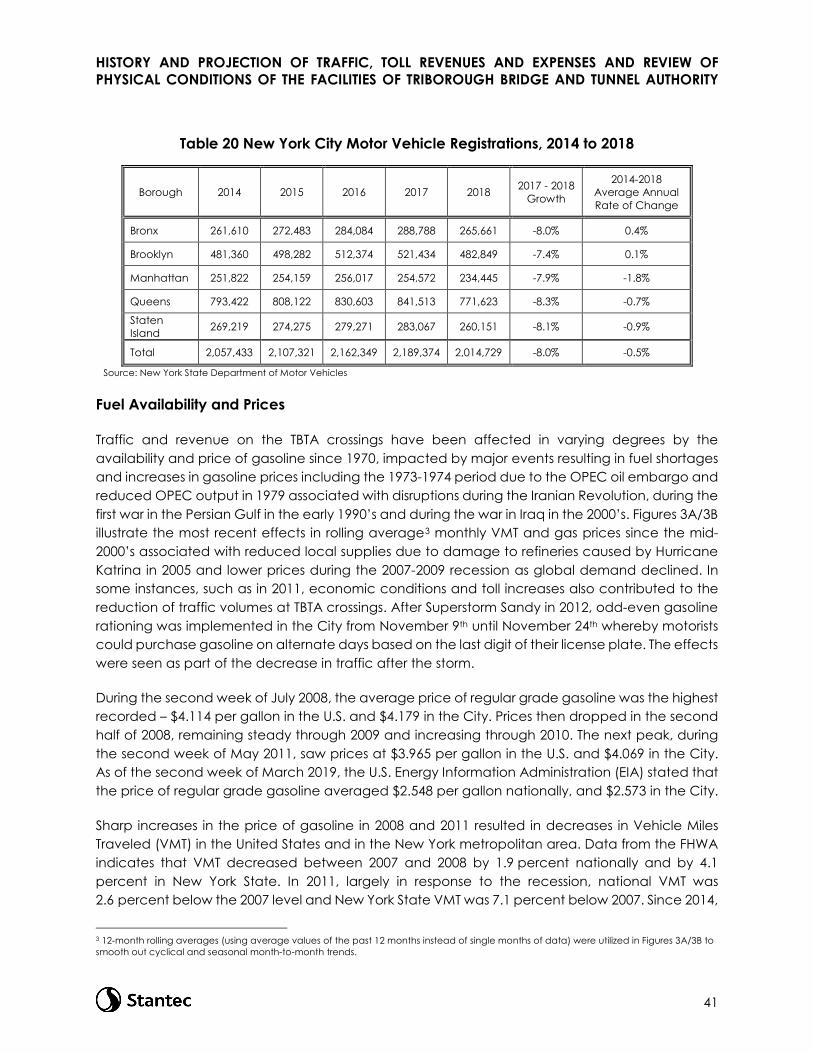
HISTORY AND PROJECTION OF TRAFFIC, TOLL REVENUES AND EXPENSES AND REVIEW OF PHYSICAL CONDITIONS OF THE FACILITIES OF TRIBOROUGH BRIDGE AND TUNNEL AUTHORITY
41
Table 20 New York City Motor Vehicle Registrations, 2014 to 2018
Borough 2014 2015 2016 2017 2018 2017 - 2018 Growth
2014-2018 Average Annual Rate of Change
Bronx 261,610 272,483 284,084 288,788 265,661 -8.0% 0.4%
Brooklyn 481,360 498,282 512,374 521,434 482,849 -7.4% 0.1%
Manhattan 251,822 254,159 256,017 254,572 234,445 -7.9% -1.8%
Queens 793,422 808,122 830,603 841,513 771,623 -8.3% -0.7%
Staten Island 269,219 274,275 279,271 283,067 260,151 -8.1% -0.9%
Total 2,057,433 2,107,321 2,162,349 2,189,374 2,014,729 -8.0% -0.5%
Source: New York State Department of Motor Vehicles
Fuel Availability and Prices
Traffic and revenue on the TBTA crossings have been affected in varying degrees by the availability and price of gasoline since 1970, impacted by major events resulting in fuel shortages and increases in gasoline prices including the 1973-1974 period due to the OPEC oil embargo and reduced OPEC output in 1979 associated with disruptions during the Iranian Revolution, during the first war in the Persian Gulf in the early 1990’s and during the war in Iraq in the 2000’s. Figures 3A/3B illustrate the most recent effects in rolling average3 monthly VMT and gas prices since the mid-2000’s associated with reduced local supplies due to damage to refineries caused by Hurricane Katrina in 2005 and lower prices during the 2007-2009 recession as global demand declined. In some instances, such as in 2011, economic conditions and toll increases also contributed to the reduction of traffic volumes at TBTA crossings. After Superstorm Sandy in 2012, odd-even gasoline rationing was implemented in the City from November 9th until November 24th whereby motorists could purchase gasoline on alternate days based on the last digit of their license plate. The effects were seen as part of the decrease in traffic after the storm.
During the second week of July 2008, the average price of regular grade gasoline was the highest recorded – $4.114 per gallon in the U.S. and $4.179 in the City. Prices then dropped in the second half of 2008, remaining steady through 2009 and increasing through 2010. The next peak, during the second week of May 2011, saw prices at $3.965 per gallon in the U.S. and $4.069 in the City. As of the second week of March 2019, the U.S. Energy Information Administration (EIA) stated that the price of regular grade gasoline averaged $2.548 per gallon nationally, and $2.573 in the City.
Sharp increases in the price of gasoline in 2008 and 2011 resulted in decreases in Vehicle Miles Traveled (VMT) in the United States and in the New York metropolitan area. Data from the FHWA indicates that VMT decreased between 2007 and 2008 by 1.9 percent nationally and by 4.1 percent in New York State. In 2011, largely in response to the recession, national VMT was 2.6 percent below the 2007 level and New York State VMT was 7.1 percent below 2007. Since 2014,
3 12-month rolling averages (using average values of the past 12 months instead of single months of data) were utilized in Figures 3A/3B to smooth out cyclical and seasonal month-to-month trends.
HISTORY AND PROJECTION OF TRAFFIC, TOLL REVENUES AND EXPENSES AND REVIEW OF PHYSICAL CONDITIONS OF THE FACILITIES OF TRIBOROUGH BRIDGE AND TUNNEL AUTHORITY
42
national travel demand has continued to increase by an average annual rate of 1.6 percent as statewide levels decreased by 2.2 percent. At the national level, low gas prices contributed to increased travel, while VMT declined in New York State as average transit ridership increased and new travel options including car shares, bike shares and taxi-booking services.
Factors contributing to changes in the price and availability of gasoline are both upward and downward and each has an unknown element that contributes to uncertainty. These factors include:
• Dependence on imported crude oil – United States dependence on imported fuel has continued to fall as the country continues to increase its reliance on domestic resources. This trend is expected to continue in the upcoming years. In March 2019, the EIA reported that domestic crude oil production averaged 12.1 million barrels per day. The EIA projects that daily domestic crude oil production will average 11.8 million barrels in 2019, surpassing the historic high of 10.6 million barrels per day previously set in 2018 that exceeded the long-time record of 9.6 million barrels per day set in 1970;
• Use of substitute fuels – Since 2010 the use of biofuels, including biomass-based diesel, ethanol and biofuel losses and co-products, has increased in the United States as domestic production has ramped up following reductions in foreign imports since 2013. In March 2019 the EIA projected that biofuel consumption would remain stable through 2020 with marginal growth expected from increased consumption of motor fuels. The share of biofuels consumed from gasoline fuel is expected to remain stable, while growth is expected in the share of biomass-based diesel in diesel fuel, increasing from 3.6 percent in 2018 to 4.5 percent in 2020. As of December 2018, the EIA reported4 that biofuel production is still increasing despite the expiration of a federal biofuel tax credit. Fluctuations in biofuel imports have an impact on the need for gasoline;
• Political conditions – Ongoing political developments and conflicts in oil producing countries and elsewhere produce instability in gasoline availability and prices; however, these factors are partially reflected in current oil prices; and
• Motor vehicle fuel efficiency – The projected real world model year 2018 fuel economy of 25.4 miles per gallon (mpg), if achieved, will be the highest level of fuel efficiency since the EPA began its analysis of light-duty automotive vehicles in 1975. In April 2010, both the National Highway Traffic Safety Administration and the EPA raised the fleet-wide Corporate Average Fuel Economy (CAFE) requirements to a real-world fuel economy of approximately 36 mpg for new vehicles in 2025. On April 2, 2018, the EPA announced the completion of the Midterm Evaluation process for the greenhouse gas (GHG) emissions standards for cars and light trucks for model years 2022-2025. The EPA is currently expected to submit a formal proposal to replace CAFE standards in 2019 with Safer Affordable Fuel Efficient (SAFE) standards which will limit future fuel efficient mileage gains from 0.5 percent to 1 percent per year, down from the CAFE standards' 5 percent annual mileage increases.
The EIA, in the April 2019 Short-Term Energy Outlook, indicates that they expect the national price of regular grade gasoline to average $2.60 per gallon in 2019 and $2.57 per gallon in 2020, 4 According EIA professionals, there have been increases in renewal diesel production identified by the EPA, but not reflected in EIA data.
HISTORY AND PROJECTION OF TRAFFIC, TOLL REVENUES AND EXPENSES AND REVIEW OF PHYSICAL CONDITIONS OF THE FACILITIES OF TRIBOROUGH BRIDGE AND TUNNEL AUTHORITY
43
compared with $2.73 per gallon in 2018. For the 2019 summer driving season (April-September) the EIA forecasts the national price of regular grade gasoline to average $2.76 per gallon, which is 9 cents per gallon lower than the average during the 2018 summer driving season and is primarily due to lower forecasted crude oil prices. The EIA predicts that stable demand in the United States, low international demand, a modest increase in United States crude oil production and sufficient global gasoline supply will limit potential increases in gasoline prices.
Depicted on the following page are Figure 3A and Figure 3B, which illustrate the relationship between gas prices and travel. As shown with both New York State VMT and TBTA Total Transactions, a reduction in the price of gas generally correlates with a rise in vehicular travel demand. However, Figure 3B shows that the rise in monthly transactions began prior to the drop in gas price, indicating that although gas prices can affect travel, the increase in transactions cannot entirely be attributed to the movement in gas prices.

HISTORY AND PROJECTION OF TRAFFIC, TOLL REVENUES AND EXPENSES AND REVIEW OF PHYSICAL CONDITIONS OF THE FACILITIES OF TRIBOROUGH BRIDGE AND TUNNEL AUTHORITY
44
Figure 3A/3B New York City Gas Prices Compared to New York State VMT and TBTA Bridges and Tunnels Total Transactions

HISTORY AND PROJECTION OF TRAFFIC, TOLL REVENUES AND EXPENSES AND REVIEW OF PHYSICAL CONDITIONS OF THE FACILITIES OF TRIBOROUGH BRIDGE AND TUNNEL AUTHORITY
45
Toll Increase Impacts, Collection Methods, and Elasticity
Tolls that are increased periodically can affect traffic usage, especially if they outpace the rate of inflation as well as in those instances where competing facilities provide a good alternative. Elasticity, as used herein, is the relationship between the change in traffic volume and the toll rate change, and represents the relative decrease in traffic corresponding to a given increase in toll. Elasticity is expressed as a negative value and the higher the absolute value, the more apt a facility is to lose traffic, which can be attributable to diversions to competing facilities, switches in travel modes, consolidation of trips, and elimination of trips. Elasticity, in this sense, is used to analyze the relationship between tolls and use, i.e., when tolls are increased, motorists react and travel patterns may change.
Elasticity factors vary, demonstrating that users react differently to toll increases depending on influencing conditions. On the TBTA crossings, elasticity tends to be influenced by the proximity of the toll-free City bridges and other considerations. The low elasticity factors for the Throgs Neck and Bronx-Whitestone Bridges indicate their relative isolation from the nearest toll-free competitor, the Ed Koch Queensboro Bridge. On the East River at the RFK Bridge and at the Queens Midtown and Hugh L. Carey Tunnels, elasticity increases as the degree of toll-free competition increases. The TBTA tunnels tend to lose traffic particularly when the competing crossings are operating under reasonable levels of traffic service and providing motorists with viable toll-free alternatives during non-peak periods. In addition, trip purpose influences demand; i.e., peak-period, work-related trips are less elastic than off-peak or discretionary trips that have fewer travel-time constraints. The effects of construction on main thoroughfares and feeder routes also affect drivers’ choices of toll facilities.
Two sets of forecasts were developed for this report: one at constant tolls (including only the effects of the recent toll increase on March 31, 2019) and the other which also factors in a toll increase in March 2021 as included in the MTA 2019-2022 Financial Plan adopted by the MTA Board in December 2018. Elasticity factors used for the forecasts in this report are based on factors Stantec developed from analyzing the elasticity exhibited following the March 2017 toll increase.
To evaluate the impact of any toll increase on transactions, transactional data at each of the TBTA facilities were split into three groups by payment type: NYCSC E-ZPass customers, non-NYCSC E-ZPass customers, and TBM customers. Stantec then estimated the revenue split by payment type; this enabled the tracking of the average toll rate throughout the months following the toll increase. The conversion to Cashless Tolling also occurred throughout 2017 at eight of the nine facilities and greatly induced cash customers to switch to E-ZPass. Overall E-ZPass usage increased by 3.4 percent (Throgs Neck Bridge) to 6.6 percent (RFK Bridge) in 2017 with the conversion to Cashless Tolling, which is a combination of background growth and payment method shifts, which vary by facility. Background growth rates were studied using historical and projected population growth, fuel prices, and VMT. Incorporating these various factors, seasonal trends in the data were also reviewed to determine the patterns and length of the toll increase impact. This process, generally, isolated the background growth and Cashless Tolling effects from the toll increase elasticities.
HISTORY AND PROJECTION OF TRAFFIC, TOLL REVENUES AND EXPENSES AND REVIEW OF PHYSICAL CONDITIONS OF THE FACILITIES OF TRIBOROUGH BRIDGE AND TUNNEL AUTHORITY
46
When reviewing changes in usage exhibited after the March 2017 toll increase, Stantec recognizes that it was unlike most prior toll increases in that, generally, total transactions at TBTA facilities continued to increase. This indicated, in Stantec’s opinion, that the sensitivity to toll increases was diminishing and the background growth was increasing. Our analysis of the previous toll increases, prior to the existence of Cashless Tolling, found that cash motorists are more sensitive to toll rates when compared to E-ZPass users; that is to say, the analysis indicated a significantly higher elasticity for cash customers than for E-ZPass customers. With regard to tolling elasticities, TBM customers are expected to behave more like E-ZPass customers than traditional cash customers, as there is no out-of-pocket cash transaction at the toll gantry for either customer. It is reasonable that TBM elasticities would be more similar to E-ZPass elasticities than to cash elasticities. Therefore, the cash elasticities previously analyzed and used in prior forecasts were not utilized for this recent analysis, since TBM customers are not as sensitive to toll increases as those of traditional cash customers. Stantec made separate analyses for both the E-ZPass customers and for the TBM customers. As a result, it is Stantec’s opinion that elasticity rates for TBM customers may continue to be closer to those found for E-ZPass customers as behavior stabilizes between the two collection methods. The elasticity factors used to develop Stantec’s forecast of toll revenue including the recent toll increase and a future potential toll increase are shown in Table 21.
As discussed earlier, there was a significant shift from cash to E-ZPass in response to the implementation of Cashless Tolling. In 2018, the unprecedented shift to E-ZPass continued with total E-ZPass market-share reaching 95.2 percent by December 2018. Stantec estimates that this shift will continue into the future, but as participation increases, the incremental changes will be smaller.
For purposes of this report and Stantec’s projections, we have assumed the future toll increase in accordance with the 2019-2022 MTA Financial Plan. This plan includes a projected toll increase on March 1, 2021. Accordingly, the revenue forecast with the toll increase laid out in this report includes a 5.3 percent toll increase to achieve a 4 percent revenue yield to be implemented on that date. Any such toll increase or other adjustments are subject to future action by the TBTA Board. Additionally, it should be noted that 2018 was a record year for transactions on TBTA facilities, and is above the forecast presented in our 2017 report. These recent data served as the new base for all future forecasting.
For the scenario which includes a future toll increase, it was assumed that the NYCSC E-ZPass toll for passenger cars on the major and minor crossings would be increased by 5.3 percent to achieve a 4 percent revenue yield in 2021, as noted previously. Further, it was assumed that truck tolls would be increased proportionately, and that the relationships between TBM and NYCSC E-ZPass tolls for passenger cars would remain the same as those implemented for the toll increase on March 31, 2019.

HISTORY AND PROJECTION OF TRAFFIC, TOLL REVENUES AND EXPENSES AND REVIEW OF PHYSICAL CONDITIONS OF THE FACILITIES OF TRIBOROUGH BRIDGE AND TUNNEL AUTHORITY
47
Table 21 Elasticity Factors
Facility Elasticity Factors(a)
TBM E-ZPass Throgs Neck Bridge -0.152 -0.087 Bronx-Whitestone Bridge -0.152 -0.087 RFK Bridge -0.152 -0.134 Queens-Midtown Tunnel -0.188 -0.130 Hugh L. Carey Tunnel -0.226 -0.178 Verrazzano-Narrows Bridge -0.174 -0.011 Henry Hudson Bridge -0.165 -0.099 Marine Parkway Bridge -0.116 -0.033
Cross Bay Bridge -0.163 -0.020 Notes: (a) For each 1% increase in toll the volume is expected to decrease by the elasticity factor; e.g. for each
1% increase in the TBM toll at the Queens Midtown Tunnel, TBM traffic would decrease by 0.188%.
As for the impacts of the recent and potential future toll increase on traffic demand, the elasticity factors from Table 21, as described previously, were used by Stantec to calculate changes in traffic, as shown in Table 22. These traffic impacts represent the reduction in volume from the corresponding annual traffic levels that would be expected if tolls were not increased. Future transactions are calculated by adding background growth to existing transactions, and, when there is a toll increase, factoring in traffic loss due to toll elasticity.
Table 22 Estimated Percent Change in Average Toll Rates and Traffic in 2021
Facility Elasticity Factors
Estimated Percent Change with Assumed 2021 Toll Increases
Toll Traffic
TBM E-ZPass TBM E-ZPass TBM E-ZPass
Throgs Neck Bridge -0.152 -0.087 5.3% 5.3% -0.8% -0.5% Bronx-Whitestone Bridge -0.152 -0.087 5.3% 5.3% -0.8% -0.5% RFK Bridge -0.152 -0.134 5.3% 5.3% -0.8% -0.7% Queens-Midtown Tunnel -0.188 -0.130 5.3% 5.3% -1.0% -0.7% Hugh L. Carey Tunnel -0.226 -0.178 5.3% 5.3% -1.2% -0.9% Verrazzano-Narrows Bridge -0.174 -0.011 5.3% 5.3% -0.9% -0.1% Henry Hudson Bridge -0.165 -0.099 5.3% 5.3% -0.9% -0.5% Marine Parkway Bridge -0.116 -0.033 5.3% 5.3% -0.6% -0.2%
Cross Bay Bridge -0.163 -0.020 5.3% 5.3% -0.9% -0.1%
Availability of Capacity on TBTA Facilities
Stantec's assessment of TBTA's bridges and tunnels indicates that during most, if not all hours of the day, most facilities are operating below carrying capacity and more growth can be accommodated. The exception is the Queens Midtown Tunnel where capacity is somewhat
HISTORY AND PROJECTION OF TRAFFIC, TOLL REVENUES AND EXPENSES AND REVIEW OF PHYSICAL CONDITIONS OF THE FACILITIES OF TRIBOROUGH BRIDGE AND TUNNEL AUTHORITY
48
constrained during specific hours within peak periods. This may limit potential traffic growth during these specific times, but the great majority of the hours have sufficient available capacity to absorb any volume growth that may occur. Overall, wherever capacity constraints are observed, TBTA acts wherever feasible to alleviate those constraints through targeted investments.
TBTA completed the implementation of Cashless Tolling at all of its facilities by fall 2017. The Cashless Tolling system utilizes tolling equipment mounted on overhead gantries to capture E-ZPass tag-reads and license plate images in an environment without traditional toll plazas, enabling customers to traverse tolling areas in free-flow fashion.
Actual traffic observed after the conversion to Cashless Tolling and subsequent removal of traditional toll plazas showed that the removal of the toll booths eliminated any localized queuing and congestion associated with cash collection and E-ZPass interventions. The conversion to Cashless Tolling, however, does not address any recurring upstream or downstream congestion issues that exist at some facilities. These capacity constraints are typically located outside TBTA’s jurisdictional boundaries, but can impact traffic flow within the tolling areas during peak commuter and recreational periods. Flow through the former plaza areas continues to be affected by these off-site conditions even with the facilities operating in a Cashless Tolling environment. TBTA has initiated a study to identify post Cashless Tolling traffic improvements that will mitigate some of these off-site constraints to the extent feasible and in coordination with NYCDOT and NYSDOT.
TBTA and Regional Operational and Construction Impacts
Traffic volumes on TBTA facilities are in some instances influenced by construction and rehabilitation projects involving roadways and bridges in the New York City area.
Major projects that result in long-term closures on the competing bridges may increase volumes on TBTA’s facilities. Also, long-term lane closures on the roadway network serving the TBTA crossings or on the TBTA crossings themselves may affect TBTA traffic volumes or cause traffic to shift from the affected crossing to either another TBTA facility or to one of the City’s toll-free bridges. For example, when replacement of the Queens Approach on the Bronx-Whitestone Bridge began in 2011, some traffic diverted to the Throgs Neck Bridge, as the Bronx-Whitestone Bridge and the Throgs Neck Bridge serve similar traffic and a delay on one of the bridges results in a shift to the other crossing. A number of roadway construction/rehabilitation projects, over the past few years, have influenced traffic volumes on TBTA facilities, and future construction will also affect traffic. The following descriptions also highlight area construction activities and measures that have influ-enced TBTA volumes and other planned and proposed projects that may affect traffic during the forecast period. Information on future construction activity was obtained from NYSDOT, NYCDOT, NYMTC, and the Port Authority.
HISTORY AND PROJECTION OF TRAFFIC, TOLL REVENUES AND EXPENSES AND REVIEW OF PHYSICAL CONDITIONS OF THE FACILITIES OF TRIBOROUGH BRIDGE AND TUNNEL AUTHORITY
49
Construction on TBTA Facilities
In general, the majority of construction activities programmed for the TBTA facilities themselves is scheduled to take place during off-peak hours, including nighttime and weekend lane closures in the tunnels. They are expected to have minimal impacts on daily bridge and/or tunnel traffic.
TBTA has an active program of regional transportation planning and coordinates closely with regional partners on all projects in common corridors. TBTA is part of a regional Interagency Program Coordination group that meets regularly to discuss ongoing and future projects in order to coordinate and align projects among the regional agencies to minimize adverse regional traffic impacts of construction by different regional agencies.
• On the Verrazzano-Narrows Bridge, reconstruction of the Staten Island and Brooklyn approach upper level elevated ramps is scheduled to begin in 2019.
• A major maintenance funded project on the Cross Bay Veterans Memorial Bridge, to address roadway joints, and perform milling and paving of the decks, began in 2018 and is planned to be completed in 2019.
• The Marine Parkway-Gil Hodges Memorial Bridge underwent electrical and mechanical rehabilitation of the lift span along with miscellaneous steel repairs and painting of the trusses, and installation of a fire line, under a project that was awarded in 2015 and was completed in 2018. The project involved off-peak lane closures and diversion of traffic to Cross Bay Bridge for work requiring full bridge closures.
• The Bronx-Whitestone Bridge is undergoing miscellaneous structural rehabilitation, painting, and inspection of the main cables. Phase I of this project was awarded in 2015 and was substantially complete in 2018; Phase II was awarded in early 2019 and is planned for completion prior to the start of deck replacement staged construction at the Throgs Neck Bridge. As noted above, the Bronx-Whitestone Bridge and the Throgs Neck Bridge serve the same traffic and delays on one of the bridges results in a shift to the other crossing.
• The Throgs Neck Bridge suspended span deck replacement design is complete and the construction contract was awarded in late 2018. Staged construction of the roadway deck will begin in 2020 with the use of a movable barrier to implement a reversible lane, three lanes will be maintained in the peak direction to maximize traffic flow. This traffic management strategy has been successfully deployed on recent projects at TBTA’s other suspension bridges and has been effective in minimizing traffic impacts. As noted above, the Bronx-Whitestone Bridge and the Throgs Neck Bridge serve similar traffic and a delay on one of the bridges results in a shift to the other crossing.
• At the Henry Hudson Bridge, a project to replace both the upper and lower level plaza began in 2017 and is scheduled to be completed in 2021. Two through lanes will be maintained on
HISTORY AND PROJECTION OF TRAFFIC, TOLL REVENUES AND EXPENSES AND REVIEW OF PHYSICAL CONDITIONS OF THE FACILITIES OF TRIBOROUGH BRIDGE AND TUNNEL AUTHORITY
50
the lower level at all times. Traffic mitigation measures are in place to minimize any traffic impacts.
• At the RFK Bridge, the reconstruction of the Bronx Toll Plaza deck began in early 2015 and was completed in 2018. Work was staged to minimize traffic impacts. Construction of a new ramp to the northbound Harlem River Drive is scheduled to start in 2019 and will continue into 2021. Construction of the new ramp is not expected adversely to impact traffic on the RFK Bridge and has been closely coordinated with the NYCDOT 127th Street viaduct project. Reconstruction of the Manhattan Toll Plaza structure began in 2018 and was completed in close coordination with the reconstruction of the Bruckner Expressway by NYSDOT.
• A major Queens Midtown Tunnel electrical rehabilitation project was awarded in late 2012 and will be completed in 2019. Major tunnel restoration work primarily attributable to Superstorm Sandy impacts commenced in the second quarter of 2015 and was completed in 2018. Rehabilitation of the Manhattan Exit plaza was combined with the major tunnel restoration project to minimize traffic impacts, and the plaza work was completed in 2017. Work in the tunnel was carried out via night and weekend closures.
• Hugh L. Carey Tunnel plaza rehabilitation in Brooklyn and in-tunnel rehabilitation work along with major Superstorm Sandy restoration work was completed in 2018.
Competing East River Crossings Construction
Programmed construction along competing East River crossings include:
• Ed Koch Queensboro Bridge – The replacement of the upper level roadway deck was started in 2018 and is expected to be completed by 2022. Periodic lane closures on the bridge will be necessary for this work. Lane closures have not yet commenced on the bridge and are subject to coordination with L-Train closures. This project may result in increased usage of the Queens Midtown Tunnel and, to a lesser extent, the RFK Bridge.
• Manhattan Bridge – As part of the rehabilitation of the Manhattan Bridge, all structural members and their connections will be evaluated and strengthened. The project is scheduled to be completed by spring of 2021. This project may result in increased usage of the Hugh L. Carey Tunnel and, to a lesser extent, the Queens Midtown Tunnel. Brooklyn Bridge – Rehabilitation of approach arches on the Brooklyn Bridge is scheduled to begin in summer 2019 and is expected to be completed in 2023. This project may result in increased usage of the High L. Carey Tunnel and, to a lesser extent, the Queens Midtown Tunnel.

HISTORY AND PROJECTION OF TRAFFIC, TOLL REVENUES AND EXPENSES AND REVIEW OF PHYSICAL CONDITIONS OF THE FACILITIES OF TRIBOROUGH BRIDGE AND TUNNEL AUTHORITY
51
Other Major Bridge and Roadway Construction
During the forecast period, several major roadway and bridge projects, which are part of NYMTC’s current Transportation Improvement Program (TIP) for federal Fiscal Years 2017-2021, will potentially have traffic implications for the TBTA facilities.
Other bridges, roads, and overpasses programmed for construction include:
• Madison Avenue Bridge – Rehabilitation of the Madison Avenue Bridge over the Harlem River began at the end of 2018 and is expected to end in April 2022. The project includes electrical, mechanical, and miscellaneous operating system-related work. Minimal diversions to the RFK Bridge are anticipated.
• Broadway Bridge – Reconstruction of the bridge is scheduled to start in 2019, and be completed in 2022. The project’s scope of work includes a major rehabilitation of the roadway deck, superstructure steel and substructure elements of the vertical lift span, as well as the approach spans. It will also include the replacement and rehabilitation of electrical and mechanical components of the vertical lift span, as well as replacement of the existing fender system with a new larger and stronger one. Minimal diversions to the Henry Hudson Bridge are anticipated.
• I-87/Major Deegan Expressway – Rehabilitation of various overpasses along the Major Deegan Expressway between the RFK Bridge and Mosholu Parkway is scheduled for design and construction through 2023. The anticipated schedule for construction is:
• RFK Bridge to 138th Street –spring 2021 - fall 2023 • 160th Street to 232nd Street – spring2019 – winter 2020/2021 • 232nd Street to City Line – fall 2019 – summer 2021
The Major Deegan Expressway between East 138th Street and the 161st Street/Macombs Dam Bridge interchange will be reconstructed to address structural deficiencies. The concrete deck will be replaced and approximately one mile of the steel structure will be repaired. The substructure will also be repaired. Construction began in spring 2014. Major completion occurred in 2018, with minor repair works expected through summer 2019. Two bridges over the subway and Metro-North rail yard (on the Major Deegan Expressway in the Bronx) will be eliminated. This project will also include operational improvements to the southbound and northbound roadways to ensure motorist safety. This project commences in spring 2019 and is expected to be completed in spring 2022. Safety and operational improvements northbound from Burnside Avenue to Van Cortlandt Park, including West 230th Street, are scheduled from summer 2021 to spring 2023. These projects may result in minimal diversions to the RFK Bridge.
HISTORY AND PROJECTION OF TRAFFIC, TOLL REVENUES AND EXPENSES AND REVIEW OF PHYSICAL CONDITIONS OF THE FACILITIES OF TRIBOROUGH BRIDGE AND TUNNEL AUTHORITY
52
• I-95/Cross Bronx Expressway – Several rehabilitation projects are in development for the Cross
Bronx Expressway. The rehabilitation of the six Cross Bronx Expressway bridges (replacement of deck and superstructure) over the Sheridan Expressway and Amtrak right-of-way from Boston Road to the Bronx River Parkway is a potential design-build project with construction currently scheduled to begin in summer 2021 and extend through fall 2024.
The rehabilitation of the Arthur Avenue and 176th Street bridges over the Cross Bronx Expressway is currently under development. Construction is scheduled to begin in winter 2023/2024 and be completed in summer 2025. The rehabilitation of the Grant Avenue Bridge to address structural deficiencies is scheduled to begin in spring 2022 and expected to be completed in winter 2024/2025. The rehabilitation of Jesup Avenue Bridge, which will include deck and bearings replacement and steel repairs to address structural deficiencies as well as extend service life of structures, is scheduled to begin in spring 2022 and be completed in winter 2024/2025. The rehabilitation and deck replacement of three bridges at the Highbridge interchange (which carry ramps between the Cross Bronx Expressway and Major Deegan Expressway) began in fall 2017 and is expected to be completed in summer 2019. The rehabilitation of Nelson Avenue Bridge over the Cross Bronx Expressway is scheduled to begin in spring 2022 and end in winter 2024/2025. The scope will include replacing the bridge deck, repairing concrete substructures, replacing bearings, and repairing other deteriorated elements to assure continued safe operations. The rehabilitation of Jerome Avenue and East 174th Street Bridges over the Cross Bronx Expressway (to extend the service life of the two bridges) is scheduled to begin in spring 2026 and end in spring 2027.The scope of work will include replacement of the bridge decks/slabs, the repair of superstructures, the repair of concrete substructures, the replacement of bearings, and the repair of other deteriorated elements to assure continued safe operations. The rehabilitation of Cross Bronx Expressway over Webster Avenue, Third Avenue, and the Metro-North Railroad is scheduled to begin in winter 2024/2025 and end in winter 2027/2028. The scope will include replacing the concrete deck and replacing/repairing other deteriorated bridge elements to ensure continued safe operations. These projects may result in minimal diversions to the RFK, Bronx-Whitestone, and/or the Throgs Neck bridges.

HISTORY AND PROJECTION OF TRAFFIC, TOLL REVENUES AND EXPENSES AND REVIEW OF PHYSICAL CONDITIONS OF THE FACILITIES OF TRIBOROUGH BRIDGE AND TUNNEL AUTHORITY
53
• Bruckner/Sheridan Expressway Interchange – The project consists of reconstruction of the Bruckner Expressway viaduct and the related ramps to address the poorly rated deck, deteriorated concrete columns, repair/replacement of the bearings, pedestals and other minor work elements. The twelve bridges in this project include ten vehicular bridges and two pedestrian bridges. Phase 1 includes reconstruction of the deck area from RFK Bridge to East 141st Street. Under construction since winter 2017/2018, Phase I is expected to be completed in spring 2020. Phase 2 includes the deck area east of East 141st Street to Bronx River Avenue and is expected to begin in spring 2020 and end in winter 2021. The TBTA has executed a Memorandum of Understanding with NYSDOT to fund the reconstruction of the Bruckner connector ramp to the RFK facility which is being addressed under NYSDOT’s design-build project. This project may result in minimal diversions from the RFK and to the Bronx-Whitestone, and/or the Throgs Neck bridges.
• I-95/Bruckner Expressway – The addition of a fourth northbound lane from Exit 8B (to Orchard Beach/City Island) to Exit 9 (to northbound Hutchinson River Parkway) and a northbound Hutchinson River Parkway exit ramp to Co-Op City at Bartow Avenue in Bronx County, NYC is slated to begin in summer 2020 and be completed in summer 2022. Construction to repair and replace deteriorated components of the Bruckner Expressway Bridge over Rosedale Avenue is expected to begin in winter 2022/2023 and end in winter 2025/2026. The Unionport Bridge, which carries the northbound and southbound Bruckner Expressway service roads over the Westchester Creek, is scheduled for a complete replacement beginning in spring 2017. The new bridge would be expanded from four to six lanes and all of the approaches will be completely rebuilt. Traffic flow across the bridge is expected to continue uninterrupted through the estimated four-year construction period, which is anticipated to be completed in summer 2021. Reconstruction on the Bruckner Expressway between East 141st St and the interchange with the Major Deegan Expressway and Robert F. Kennedy Bridge includes replacing bridge decks, repairing concrete piers and steel girders, and replacing all bearings and pedestals on both the mainline Bruckner Expressway and connecting ramps, including the entrance ramp at East 138th St. The project began in March 2018 and expected to be completed by the summer of 2020. These projects may result in minimal diversions to the RFK, Bronx-Whitestone, and/or the Throgs Neck bridges.
• Bronx River Parkway – This project involves the removal and installation of a new Bronx River Parkway Bridge over Metro-North Railroad. A replacement with highway realignment is being considered. Construction is expected to begin in spring 2021 and be completed in spring 2023.

HISTORY AND PROJECTION OF TRAFFIC, TOLL REVENUES AND EXPENSES AND REVIEW OF PHYSICAL CONDITIONS OF THE FACILITIES OF TRIBOROUGH BRIDGE AND TUNNEL AUTHORITY
54
Repair of the Bronx River Parkway Bridge over Morris Park Avenue and the NYCTA Unionport Yard will address steel and concrete repairs. Construction began in fall 2017 and is expected to be completed in spring 2019.
Replacement of deteriorated bridges on the Bronx River Parkway, specifically the two-span bridge over AMTRAK/CSX (near the Cross Bronx Expressway interchange), the single span bridge over East Tremont Avenue and the seventeen-span viaduct over East 180th Street/Morris Park Avenue and along the NYCTA’s East 180th Street subway yard is expected to begin in summer 2025 and is expected to be completed in winter 2028/2029. The project will improve the roadway geometry, eliminate the structural deficiencies and provide standard travel lanes and shoulders. In addition, the project will provide a fully ADA compliant shared-use path and a new exit ramp structure spanning over the AMTRAK/CSX tracks.
These projects may result in minimal diversions to the RFK, Bronx-Whitestone, and/or the Throgs Neck bridges.
• I-278/Gowanus Expressway – The replacement of bridge decks on the 79th Street Bridge is scheduled to begin in 2019. A temporary bridge at 79th St. will be installed in mid/late May 2019, and all lanes of traffic will be maintained with the following exceptions: HOV lane will be closed during off-peak hours for two weeks from late May to mid-June for demolition, and two weeks in July/August for deck replacement. Safety improvements will be made throughout the Gowanus Expressway especially including the eastbound section from the Prospect Expressway to the Hugh Carey Tunnel. Construction is set to begin fall 2019 with completion in summer 2020. Active Traffic Management improvements to provide improved incident response, reduce secondary incidents, and improve reliability and level-of-service on the Gowanus Expressway. Improvements include barrier gates for HOV Lane, HOV Lane Monitoring, tow truck staging, center-to-center communication between bus operations center and highway operations center.
These projects may result in minimal diversions to the Hugh L. Carey Tunnel and the Verrazzano-Narrows Bridge.
• I-695/Throgs Neck Expressway – The replacement of bridge decks and repair of deteriorated elements on the Randall Avenue Bridge was completed in early 2019.
The construction contract for the complete replacement of the roadway deck and repairs to the supporting structural steel on the Throgs Neck’s Bridge’s suspended span was awarded in late 2018. Fifteen months of staged construction of the roadway deck will begin in 2020. With the use of a movable barrier to implement a reversible lane, three lanes will be maintained in the peak direction to maximize traffic flow and minimize traffic impacts.

HISTORY AND PROJECTION OF TRAFFIC, TOLL REVENUES AND EXPENSES AND REVIEW OF PHYSICAL CONDITIONS OF THE FACILITIES OF TRIBOROUGH BRIDGE AND TUNNEL AUTHORITY
55
Minimal impact to traffic at the Throgs Neck Bridge may occur.
• Hutchinson River Parkway – The rehabilitation of the Westchester Avenue bridge over the Hutchinson River Parkway will repair abutments, piers, approaches, steel superstructure and replace the reinforced concrete deck. Currently under construction, the project is expected to be completed in the end of summer 2021. Minimal impact to traffic at the Bronx-Whitestone Bridge may occur.
• I-278/Brooklyn-Queens Expressway (BQE) – Repair and replacement of the steel and concrete elements on Astoria Boulevard bridge over BQE ramp to Grand Central Parkway is scheduled to begin in winter 2019/2020 and is expected to be completed in fall 2022. Reconstruction of the Grand Central Parkway between the RFK Bridge and the BQE will allow large trucks that currently are using Astoria Blvd and Hoyt Avenue to travel from the RFK Bridge and the west leg of the BQE to use the Grand Central Parkway. Construction is expected to begin spring 2019. The rehabilitation of the Grand Central Parkway interchange complex from 71st Street to 82nd Street and 25th Avenue on the BQE to the Grand Central Parkway ramp is scheduled to begin in 2020, preceded by the section of the Grand Central Parkway from Astoria Boulevard to 44th Street in 2019. The projects involve reconstruction of the highway interchange and both stages are currently in development. This project has the potential for lane closures that could affect the Queens Midtown Tunnel and the RFK Bridge; however, this would affect alternative routes as well. The rehabilitation of the BQE bridge over 47th Street bridge (Queens) will replace the concrete deck, repair concrete substructure and repair other deteriorated elements of the bridge. Construction is expected to begin in summer 2023 and be completed in spring 2026. The replacement of four bridge decks over the BQE, which will replace concrete decks, repair concrete substructures, and repair other deteriorated elements, is in development and construction expected to begin in summer 2024 and expected to be completed in winter 2025. Phase I of the new Kosciuszko Bridge, which began in fall 2014, was completed in April 2017 with the opening of the Queens bound bridge. Three lanes of traffic will be maintained in both directions until the completion of Phase II. Phase II of the project began in October 2017 with demolition of the old bridge and is expected to be completed in summer 2019. Maintenance and protection of traffic plans indicate that the existing number of lanes will be maintained during peak periods on the BQE while lane reductions and or closures may occur during off-peak periods. These projects may result in minimal diversions to the RFK Bridge and Queens Midtown Tunnel.

HISTORY AND PROJECTION OF TRAFFIC, TOLL REVENUES AND EXPENSES AND REVIEW OF PHYSICAL CONDITIONS OF THE FACILITIES OF TRIBOROUGH BRIDGE AND TUNNEL AUTHORITY
56
• BQE Triple Cantilever Project – The NYCDOT plans to reconstruct 1.5 miles of the BQE including
the triple cantilever structure between Atlantic Avenue and Sands Street which consists of a series of 21 concrete-and-steel bridges over local roads. This is in the preliminary design stage. Improvements will include new lane design, fewer joints on the roadway, a new highway deck, new ramps, improved drainage and new lighting. The formal environmental process for the BQE reconstruction is expected to begin at the end of 2019. Traffic is not expected to be diverted to local streets during construction, but this project has potential for lane closures that could impact traffic at the Hugh L. Carey Tunnel.
• Belt Parkway – Installation of Advanced Traffic Management System equipment including CCTV, VMS, detection system and travel time system from the Gowanus Expressway to Cross Bay Boulevard began in fall 2018 and is anticipated to end in winter 2020. The reconstruction of the seven bridges and their approaches on the Belt Parkway (over three local streets and four waterways) began in the fall of 2009. Six of the bridges are completed, and the Nostrand Avenue Bridge is expected to be completed in summer 2025. Construction of the 17th Avenue Pedestrian Bridge and 27th Avenue Bridge over the Belt Parkway is anticipated to begin in 2019 with an expected date of completion in 2021. TBTA plans to add an additional lane on the Belt Parkway from the Verrazzano-Narrows Bridge to Bay Parkway which will help alleviate back-ups on the Verrazzano-Narrows Bridge Belt Parkway exits and the Verrazzano-Narrows Bridge main span. The project is scheduled to begin preliminary design in 2019, with construction scheduled to begin in 2022. The Shore Parkway Bridge rehabilitation over Shell Road will replace the concrete decks; repair the superstructure, substructure and other deteriorated elements. Construction is expected to begin in summer 2025 with an expected date of completion in summer 2028. These projects may result in some impacts to traffic at the Verrazzano-Narrows Bridge, Cross Bay Bridge, and Marine Parkway Bridge.
• Grand Central Parkway – A project will replace highway viaducts and ramp structures; realign ramps and add highway shoulders; install multi-use path for pedestrian and bicycle usage along the Kew Gardens Interchange (an intersection of the Grand Central Parkway, the Van Wyck Expressway, the Jackie Robinson Parkway and Union Turnpike) located in central Queens. The contract was awarded in October 2018 with an estimated completion date of summer 2022. The project to reconstruct the Grand Central Parkway and BQE (east leg) interchange is scheduled to start in spring 2020 and expected to be completed in 2024 while the reconstruction of BQE and Grand Central Parkway (west leg) interchange is expected to be completed in 2035.
HISTORY AND PROJECTION OF TRAFFIC, TOLL REVENUES AND EXPENSES AND REVIEW OF PHYSICAL CONDITIONS OF THE FACILITIES OF TRIBOROUGH BRIDGE AND TUNNEL AUTHORITY
57
The planned rehabilitation of the Grand Central Parkway Bridge over Winchester Boulevard and ramp over the Cross Island Parkway is scheduled to begin in winter 2021/2022 and be completed in winter 2024/2025. A guiderail upgrade on Grand Central Parkway between 31st Street and the Nassau County Line began in February 2018 and is expected to be completed in summer 2019. The purpose of this project is to improve the roadside safety for motorists by upgrading nonstandard guiderails.
Repaving and concrete repairs in both directions of the Grand Central Parkway between 34th Street and 82nd Street and in eastbound direction from 168th Street to the Clearview Expressway are scheduled to be completed in 2019.
These projects may result in minimal impacts to traffic at the RFK Bridge and Queens Midtown Tunnel.
• I-678/Whitestone Expressway Bridge over the Cross Island Parkway – The Whitestone Expressway/Van Wyck Expressway bridge over the Cross Island Parkway (Exit 16) is scheduled for replacement. Construction began in fall 2018 and is expected to be completed in 2020. A 10-foot travel lane will be maintained at all times on the bridge during both stages of construction. No detours are proposed for the construction. The project may result in some impacts to traffic at the Bronx-Whitestone Bridge and Throgs Neck Bridge.
• I-678/Van Wyck Expressway – The rehabilitation of the Roosevelt Avenue Bridge began in January 2016 and is expected to be complete in summer 2020. Major reconstruction plans include installation of new girders, a new deck, new lighting, and an approximate two-feet widening of the sidewalk to allow for a bike lane. One lane in each direction would be available to traffic. This project may result in minimal impact to traffic at the Bronx-Whitestone Bridge and RFK Bridge. The project to replace steel girders on the Rockaway Boulevard Bridge over the Van Wyck Expressway is scheduled to begin in winter 2018/2019 and be completed in winter 2021/2022. Phase III of the Kew Gardens Interchanges reconstruction, currently underway, is replacing the existing deteriorated two-lane Van Wyck Expressway southbound viaduct over the Grand Central Parkway with a continuous three-lane viaduct and constructing new exits to the westbound Union Turnpike and the Jackie Robinson Parkway. The three lanes from the Van Wyck Expressway will also merge with two lanes from the Grand Central Parkway over a longer distance. Van Wyck Expressway / Long Island Expressway Interchange structural rehabilitation project will replace concrete deck, perform corrective repairs of bridge steel and concrete elements on College Point Boulevard ramp and concrete deck replacement and concrete piers repairs
HISTORY AND PROJECTION OF TRAFFIC, TOLL REVENUES AND EXPENSES AND REVIEW OF PHYSICAL CONDITIONS OF THE FACILITIES OF TRIBOROUGH BRIDGE AND TUNNEL AUTHORITY
58
on selected spans of the Van Wyck Expressway viaduct over the Long Island Expressway. The project is expected to begin in summer 2020 and is expected to be completed in winter 2022/2023.
• Van Wyck Expressway/JFK Airport Access Improvements – This project will widen Van Wyck
Expressway from three to four lanes (five lanes at some locations) in each direction from Queens Boulevard to 133 Avenue in the vicinity of John F. Kennedy (JFK) Airport located in Queens County, New York City. This project will replace overpass bridges and Long Island Rail Road (LIRR) bridges; install new pavement, noise and retaining walls and other associated elements as part of the contract. Construction is expected to begin in winter 2019/2020 and be completed in spring 2022. These projects may result in minimal impacts to traffic at the Bronx-Whitestone Bridge, Throgs Neck Bridge, the Queens Midtown Tunnel, and the RFK Bridge.
• I-495/Long Island Expressway – A project will construct an auxiliary lane on the eastbound Long Island Expressway to connect the entrance ramp from the Clearview with the exit ramp to Springfield Boulevard. The provision of a continuous lane for entering and exiting traffic will alleviate congestion and reduce delays. Construction is expected to begin in fall 2020 and last until fall 2022. Plans are in development to extend the existing managed HOV/Bus contraflow lane from its current terminus at 58th Avenue to a new terminus in the vicinity of 102nd Street in Queens. The contraflow lane, operating on the left lane of the eastbound side of the Long Island Expressway, will operate on weekdays from 6AM to 1PM. Construction is expected to begin in fall 2020 and be completed in summer 2022. An Active Traffic Management (ATM) system on the Eastbound and Westbound Long Island Expressway, between the Queens Midtown Tunnel and Main Street, Queens is currently under development. The system will result in improved safety, reduced congestion and delays, and improved route choices. Construction is expected to begin in summer 2021 and be completed in summer 2023. These projects may result in minimal impacts to traffic at the Queens Midtown Tunnel and Bronx-Whitestone Bridge.
• Route 9A/West Side Highway – Henry Hudson Parkway Viaduct reconstruction from West 72nd to 82nd Street is currently scheduled for completion in summer 2020. The viaduct reconstruction from West 94th to 98th Street is also scheduled for completion in summer 2020. This project has the potential for lane closures that could affect the Henry Hudson Bridge and possibly alternative routes. Repairs from the World Trade Center attacks and Superstorm Sandy are in progress to improve transportation systems in this area. The World Trade Campus Security project, in the vicinity of
HISTORY AND PROJECTION OF TRAFFIC, TOLL REVENUES AND EXPENSES AND REVIEW OF PHYSICAL CONDITIONS OF THE FACILITIES OF TRIBOROUGH BRIDGE AND TUNNEL AUTHORITY
59
World Trade Center site, is expected to affect Hugh L. Carey Tunnel traffic when implemented in 2019. The project involves the implementation of a comprehensive perimeter vehicle security plan for the World Trade Center site. Construction was anticipated to be completed by June 2017 but has been delayed.
The ongoing West Thames Street pedestrian bridge construction project will construct a pedestrian bridge over Route 9A at West Thames Street, and remove the existing Rector Street pedestrian bridge. The project was closely coordinated with recently completed post-Superstorm Sandy work at the Hugh L. Carey Tunnel and construction of the Morris Street Pedestrian Bridge by TBTA. The plan is to place both bridge spans (over northbound and southbound Route 9A) on the weekend of Friday- May 31-June 2, 2019. Upon completion, these projects may have a positive impact on traffic using the Hugh L. Carey Tunnel as motorists achieve the comfort level with the permanent traffic patterns that will be in place.
• Harlem River/FDR Drive – Replacement of decks on the Harlem River Drive exit ramp to 139th Street began in 2018 and is expected to be completed in winter 2021/2022. The project to restore the highway and bridge elements of FDR Drive damaged by Superstorm Sandy will rehabilitate bridge elements such as the pier columns, base pedestals and paint and also repair highway pavement, barriers and joints on the FDR along South Street Viaduct and 42nd Street northbound off-ramp. Construction is underway and is expected to be completed by fall 2019. The Harlem River Drive Viaduct reconstruction at 127th street (between the Willis Avenue and Third Avenue bridges) includes on-line bridge replacement with auxiliary exit and entrance lanes and left-lane exit to Second Avenue. Construction began in 2015 and is expected to be completed in summer 2019. Construction resulted in full closure of the northbound East 125th Street exit for 33 months and full closure of the southbound East 125th Street exit for ten months. Construction of the southbound viaduct was completed in June 2017. TBTA has committed to the construction of a new connecting ramp between the westbound Manhattan approach of the RFK Bridge and the northbound Harlem River Drive (via a “tie in” on the left of the northbound viaduct structure) to begin in 2019 via a Design-Build contract. This project has been closely coordinated with TBTA’s RFK Bridge construction program. Substructure work to facilitate the future TBTA connector ramp project is included in the current NYCDOT 127th Street Viaduct project under an ongoing TBTA/NYCDOT MOU. The project may result in some impact to traffic at the RFK Bridge. Widening of the FDR Drive southbound from RFK Bridge to 116th Street, to four lanes, requires the replacement of an existing pedestrian bridge at 120th Street. Currently planned for 2020 to 2024, this project will improve traffic flow off the RFK Bridge to the FDR Drive.

HISTORY AND PROJECTION OF TRAFFIC, TOLL REVENUES AND EXPENSES AND REVIEW OF PHYSICAL CONDITIONS OF THE FACILITIES OF TRIBOROUGH BRIDGE AND TUNNEL AUTHORITY
60
Replacement of the deck on the Trans-Manhattan Expressway Connector ramp is expected to begin in fall 2020. An RFP was released in January 2018 with an anticipated contract term of 8 years. Restoration of FDR Drive bridge structure and adjacent roadway elements damaged by Superstorm Sandy will repair the pier columns along South Street Viaduct and 42nd Street, the northbound off-ramp and the at-grade pavement, joints and concrete barriers. The construction began in winter 2018/2019 and is estimated to be completed in summer 2020.
FDR Drive, northbound from East 42nd to 49th Street is scheduled for rehabilitation. Currently under design, construction is expected to begin in winter 2019/2020 and be completed in fall 2026. These projects may result in minimal adverse impacts to traffic at the RFK Bridge and the Queens Midtown Tunnel.
• I-278/Staten Island Expressway – Construction started this year and is expected to end in winter 2019/2020 for the replacement of decks of four bridges located along Staten Island Expressway at Mosel Avenue (westbound and eastbound) and Staten Island Rapid Transit right-of-way. This project will replace concrete decks, repair concrete substructures, repair bearings, and other deteriorated elements at the four bridges. Throughout the duration of construction, there will be lane closures. During off-peak travel times and directions: one lane may be closed on the mainline and additionally there may be off-peak closures of the HOV lane to facilitate construction. Nighttime, eastbound and westbound: one lane may be closed in each direction on the service roads. Travel lanes remaining open: During peak travel times and directions: HOV Lane and three lanes of mainline traffic will be open. Daytime, eastbound and westbound: two lanes open on the service roads. These projects may result in minimal impacts to traffic at the Verrazzano-Narrows Bridge and Hugh L. Carey Tunnel. Additional projects in Staten Island scheduled for the long term would likely have little negative impacts on the Verrazzano-Narrows Bridge during construction but positive impacts upon completion.
• Route 440/Bayonne Bridge – In December 2010, the Port Authority announced that the
Bayonne Bridge would be raised to solve the navigational clearance restrictions. The construction began in May 2013 and was completed in the spring 2019. The bridge has been re-opened.
• Holland Tunnel – In February 2018, the Port Authority authorized $364.2 million for a
rehabilitation and resiliency project for the Holland Tunnel to repair and restore critical mechanical, electrical and plumbing systems damaged by Superstorm Sandy, and to install protective measures to mitigate future flooding in the facility. Construction is expected to begin in spring 2020 and take approximately five years to complete. The work is expected to result in a partial closure of the Holland Tunnel six nights a week for four years beginning in
HISTORY AND PROJECTION OF TRAFFIC, TOLL REVENUES AND EXPENSES AND REVIEW OF PHYSICAL CONDITIONS OF THE FACILITIES OF TRIBOROUGH BRIDGE AND TUNNEL AUTHORITY
61
2020. One tube at a time will be closed overnight all nights except Saturday, starting with the eastbound tunnel for two years, followed by the westbound tunnel beginning in 2022. Potential lane closures may result in a minimal positive impact to the traffic at the Hugh L. Carey and the Verrazzano-Narrows Bridge.
• Lincoln Tunnel Helix Replacement – In 2015, the Lincoln Tunnel Helix went through a three-year
rehabilitation program which has extended its estimated service life to 2025. Currently in the planning stage, the Port Authority is evaluating replacement of the Lincoln Tunnel Helix. The purpose of the project is to replace the aging and deteriorated structure with a new roadway that meets current highway and safety standards. If the project proceeds, construction is anticipated to start in 2022 and end in 2027.
• George Washington Bridge Rehabilitation – “Restoring the George” is an ongoing 10-year
program that the Port Authority initiated in 2016. The new helix linking the Palisades Interstate Parkway to the George Washington Bridge opened in early 2019. Construction to complete the final tie-in of the new ramp with the main span of the bridge is expected to be complete by the end of 2019. Ongoing and planned projects include rehabilitation of upper level spans over Hudson Terrace and New Jersey anchorage (2016-2020), suspender ropes replacement and rehabilitation of the main cables (2017-2026), rehabilitation of Trans-Manhattan Expressway (TME) median barriers (2018-2023), rehabilitation of 178th Street & 179th Street ramps and bus ramps (2017-2025), main span upper level structural steel rehab (2019-2024), upper level eastbound main span pavement rehabilitation (2018-2019), rehabilitation of six TME overpass bridges in Manhattan (2020-2024), Rehabilitation of TME Overpass Phase 1 (2021-2026), Rehabilitation of Structural Steel Lead Paint Removal and Recoating Underside LL (2019-2024), Rehabilitation of Center and Lemoine Bridges (2018-2023), Hydrant and Water System B (2018-2020), Intelligent Transportation System Replacement of Signs and Field Devices (2019-2021). These projects may result in minimal impacts to the traffic at the Henry Hudson, RFK, Bronx-Whitestone and Throgs Neck Bridges.
• Gowanus Canal Superfund Site – In 2010, Gowanus Canal, an EPA Superfund site was added to the National Priorities List (NPL) as a hazardous waste site requiring clean up. In September 2013, the EPA issued its Record of Decision (ROD), which explained the remediation plan for the Gowanus Canal. The project involves removing contaminated sediment from the canal via dredging, installing a cap, and restoring the 5th Street basin. The Remedial Design (RD) process is currently underway and the design related to the upper portion of the Canal is expected to be completed in 2019. It is anticipated that active construction will occur over a six- to ten-year period. Proposed plans for Hamilton Avenue over Gowanus Canal are not yet available so it is not possible to assess the impact to traffic at the Hugh L. Carey Tunnel.
• Rockaway Beach Boulevard Safety Improvements – This project will bring street and infrastructure improvements to Rockaway Beach Boulevard/Arverne Boulevard between Beach 49th and Beach 59th Streets, as well as Beach 67th Street between Rockaway Beach

HISTORY AND PROJECTION OF TRAFFIC, TOLL REVENUES AND EXPENSES AND REVIEW OF PHYSICAL CONDITIONS OF THE FACILITIES OF TRIBOROUGH BRIDGE AND TUNNEL AUTHORITY
62
Boulevard and Rockaway Freeway and part of Beach 53rd Street. The project, which is being managed by the NYC Department of Design and Construction for the New York City Department of Environmental Protection (NYCDEP) and NYCDOT, began in winter 2018/2019 and is scheduled to be completed in summer 2021. This project may result in minimal impacts to the traffic at the Cross Bay Bridge and, to a lesser extent, the Marine Parkway Bridge.
• Cross Bay Bridge Safety Improvements – This project proposes to make safety improvements,
including a new traffic signal, at Beach Channel Drive and Beach 94th Street. As part of the same project, NYCDOT proposes to connect the pedestrian paths in Broad Channel to those on Rockaway Beach, improving the Jamaica Bay Greenway. The construction timeline is not available for this project. This project may result in minimal impacts to traffic at the Cross Bay Bridge.
Transit Improvements
Significant transit improvements, when completed, are expected to affect TBTA traffic levels during the forecast period through the year 2024.
• MTA Second Avenue Subway – Construction of Phase 1 started in April 2007 and service opened to the public on January 1, 2017. Service from new stations at East 96th, East 86th, and East 72nd Streets along Second Avenue now connects to the 63rd Street line at Lexington Avenue. The 2015-2019 Capital Program includes funding to complete design and begin initial construction of Phase 2 (125th Street to 96th Street). Major construction of Phase 2 is not yet funded and is not included in the MTA 2015-2019 Capital Program.
• MTA L Train – The MTA in January 2019 accepted the recommendations of a panel of engineering experts that determined a complete closure of the L Train Tunnel is unnecessary to achieve full rehabilitation of the Canarsie Tunnel, severely damaged by Superstorm Sandy. The report presents a series of engineering methods to streamline the required repair work and limit the impact on L Train service, which provides 400,000 daily rides. Work could be completed on nights and weekends only, with a single tube providing continued service in both directions during work periods. The report assumes the work can be completed within a 15 to 20-month timeframe. The NYCTA still plans to implement additional subway service where needed, including on the G, M and 7 Trains. The project may result in some impacts to traffic at the Hugh L Carey Tunnel and the Queens Midtown Tunnel.
• MTA/LIRR East Side Access – This project will result in a new connection from the LIRR Main and Port Washington lines in Queens to a new LIRR terminal beneath Grand Central Terminal in Manhattan. Project completion is scheduled for December 2022. MTA anticipates that some travelers to Manhattan’s East Side will shift to the LIRR from other modes, including the Queens Midtown Tunnel and the RFK Bridge.
• Penn Station Access – The Penn Station Access (PSA) project would take Metro-North’s New Haven Line directly to Penn Station using Amtrak’s Hell Gate line and will add four new stations

HISTORY AND PROJECTION OF TRAFFIC, TOLL REVENUES AND EXPENSES AND REVIEW OF PHYSICAL CONDITIONS OF THE FACILITIES OF TRIBOROUGH BRIDGE AND TUNNEL AUTHORITY
63
in the East Bronx. Currently, conceptual engineering, program management, and design activities are underway for planned infrastructure improvements on the Hell Gate line in the East Bronx. Metro-North service to Penn Station will begin after completion of the East Side Access project.
• The Gateway Program (Amtrak) – The Gateway Program is a comprehensive program of strategic rail infrastructure improvements designed to improve current services and create new capacity that will allow the doubling of passenger trains running under the Hudson River. The program will increase track, tunnel, bridge, and station capacity, eventually creating four mainline tracks between Newark, New Jersey, and Penn Station, New York, including a new, two-track Hudson River tunnel. Due to the high level of traffic in the existing Hudson River Tunnel (450 trains per weekday, 600,000 riders), taking one of its two tubes out of service for necessary repairs would reduce total capacity for Amtrak and NJ TRANSIT from 24 trains per hour to approximately six trains per hour in the peak direction. This very significant reduction in capacity would impact New York and New Jersey commuters who cross the Hudson on a daily basis along with Amtrak passengers. This Program will allow NJ TRANSIT and Amtrak to continue to operate and maintain existing levels of passenger rail service in the new tunnel while the North River Tunnel is taken out of service for critical rehabilitation and repairs. This Program is currently in the planning stages. The Hudson Tunnel Component of the Gateway Program includes the design and construction of a new Hudson River rail tunnel serving Penn Station, New York, and the rehabilitation and modernization of the existing North River Tunnel which incurred serious and ongoing damage during Super Storm Sandy. This project is currently in the environmental review phase. A Draft Environmental Impact Statement was released in July 2017. A preliminary schedule aims to complete the new tunnel in 2026 to enable the planned rehabilitation of the existing tubes to be complete in 2030. Unexpected closures in existing tubes for emergency repairs during weekday hours may force some rail commuters to switch to a bus or car. Funding is not yet identified to fully finance this project. TBTA facilities may experience a sporadic increase in usage with commuters choosing to travel to/from the City via any of the tolled Hudson River bridges and tunnel facilities or the Verrazzano-Narrows Bridge.
• AirTrain extension to LGA – This Port Authority capital project will provide a new AirTrain service between the LGA airport and a new intermodal station at Willets Point with connections to LIRR and MTA-NYCT (“7” Subway line). The project is still in conceptual design stage. If it proceeds, construction is expected to begin in 2020 and end in 2022. This project can impact traffic at the RFK Bridge and the Queens Midtown Tunnel as some airport travelers and employees may shift to subway. Some impacts to traffic may also be seen at the Bronx-Whitestone and Throgs Neck Bridges. This would impact the other East River crossings as well.
• JFK area projects – Work on the aqueduct overpass bridges over the Belt Parkway is scheduled for construction in 2019 with lane closures required on the Belt Parkway.

HISTORY AND PROJECTION OF TRAFFIC, TOLL REVENUES AND EXPENSES AND REVIEW OF PHYSICAL CONDITIONS OF THE FACILITIES OF TRIBOROUGH BRIDGE AND TUNNEL AUTHORITY
64
Summary of Assumptions and Conditions
TBTA traffic, toll revenues and expenses have been projected by Stantec on the basis of the historical record of traffic, toll revenues and expenses, the capacities of the TBTA facilities, traffic growth forecasts, the historic traffic elasticity due to toll variations, impacts of construction projects and the following assumptions and conditions, which we believe are reasonable.
• All TBTA facilities will be operated efficiently and maintained in a state of good repair in order to attract customers and to sustain traffic demand levels.
• The TBTA 2015-2019 Capital Program that was approved by the MTA Board on May 24, 2017 and amended on April 25, 2018 will be carried out throughout the forecast period. Future capital programs sufficient to maintain the structural integrity of bridges and tunnels will be adopted and implemented throughout the forecast period.
• Electronic toll payment by E-ZPass will continue to be available on all TBTA crossings, and the payment of revenue in full to TBTA will continue to be in accordance with current inter-agency agreements. As of the end of 2018, 95.2 percent of all tolls paid on TBTA facilities were E-ZPass transactions. As a result of the E-ZPass participation rate increases that have been experienced at the TBTA facilities, future growth is expected to be limited. It is projected that E-ZPass participation rates will experience small annual growth until a maximum of 98 percent is reached.
• It is assumed that congestion pricing or similar type program in Manhattan will not be implemented until at least early 2021 and will be limited to vehicles entering the central business district at or below 60th Street, with appropriate exemptions and credits. Since the exact date of activation, tolling structure, tolling rates, and possible credits have not yet been established, Stantec cannot draw any meaningful and dependable conclusions about the potential impacts of congestion pricing initiatives on usage of TBTA facilities and, therefore, Stantec is unable to include the effects of the CBD Tolling Program into its forecast.
• Competing East River crossings will continue to operate toll-free and be maintained in efficient operating condition. At this time, it is too uncertain for Stantec to draw any meaningful conclusions about the potential impacts of tolling the competing East River crossings on TBTA facilities.
• For the scenario with constant tolls, the present toll schedule, that began on March 31, 2019, will be in effect during the remainder of the forecast period through 2029. For the scenario with the toll increase, tolls on TBTA facilities will be increased by 4 percent for most customers on March 1, 2021, in accordance with the 2019-2022 MTA Financial Plan.
• Capacity constraints on the local and arterial highway networks which may be somewhat mitigated by stagnant traffic growth in the near term will, however, continue to limit traffic growth on the nine TBTA crossings. This is reflected in conservative growth rates used to forecast TBTA traffic.

HISTORY AND PROJECTION OF TRAFFIC, TOLL REVENUES AND EXPENSES AND REVIEW OF PHYSICAL CONDITIONS OF THE FACILITIES OF TRIBOROUGH BRIDGE AND TUNNEL AUTHORITY
65
• Although City and State budget difficulties continue, highway/crossing improvements, in general, for the competing bridges and roadway network will be made in accordance with the plans and schedules described herein.
• Major TBTA roadway and structural improvements will continue to be performed during nighttime and non-peak hours, and/or in the off-peak direction, and approaches to the nine TBTA crossings will not be significantly impaired by construction work.
• Growth assumptions, based on trends in regional employment and population, forecast by NYMTC through 2050, will be realized in the Tri-State area and in the City.
• If gasoline prices in the New York Metropolitan Area were to increase again to and above the levels they did when they spiked in 2008 and 2011, discretionary travel could decline and there may be fewer recreational trips. Also, the reduced non-work travel could also make the toll-free alternatives more competitive. In general, however, TBTA facilities carry regular com-muters and other non-discretionary trips so that the overall impact on toll volumes and toll revenues is not expected to be significant if prices do not increase substantially above previously experienced high levels.
• LIRR East Side Access may shift some Long Island auto commuters to rail, after its planned completion in December 2022.
• Current TBTA reduced rate toll programs and MTA rebate programs remain in effect at current projected levels, including reduced rates for NYCSC E-ZPass and E-Token customers and for Staten Island residents at the Verrazzano-Narrows Bridge and for Rockaway Peninsula and Broad Channel residents at the Cross Bay and Marine Parkway Bridges. TBTA’s reduced rate programs provide, by statute, a toll rate lower than the TBM rate for Staten Island Residents using resident E-Tokens to cross the Verrazzano-Narrows Bridge and for Rockaway Residents using resident E-Tokens and non-residents using minor E-Tokens to cross the Cross Bay and Marine Parkway Bridges. The reduced rate programs provide, by Board policy, a toll rate lower than the TBM rate to non-resident NYCSC E-ZPass customers. TBTA’s reduced rate programs also provide, by Board Policy, a toll rate lower than the NYCSC E-ZPass rate to Staten Island Residents crossing the Verrazzano-Narrows Bridge and to Rockaway Residents crossing the Cross Bay and Marine Parkway Bridges. The MTA’s rebate programs lower the effective toll rates below the reduced rates discussed above for Rockaway Residents at the Cross Bay Bridge and Staten Island Residents and certain commercial vehicles with NYCSC commercial and business accounts at the Verrazzano-Narrows Bridge by using a combination of MTA funds and New York State funds to pay for all or a portion of the toll. TBTA’s “reduced rate” programs and MTA's rebate programs both result in increased traffic. TBTA's toll revenue is impacted unfavorably by charging a reduced rate for residents but there are no adverse revenue impacts stemming from the rebate programs because the rebate values are fully reimbursed by MTA and New York State.
• No other reduced rate toll programs will be introduced that would adversely affect the TBTA toll facilities' revenue stream.
• Economic conditions, nationally and in the New York Metropolitan Area, are generally expected to improve over the duration of the forecast period. It is important to note that

HISTORY AND PROJECTION OF TRAFFIC, TOLL REVENUES AND EXPENSES AND REVIEW OF PHYSICAL CONDITIONS OF THE FACILITIES OF TRIBOROUGH BRIDGE AND TUNNEL AUTHORITY
66
Stantec assumes the economy to be cyclical and thus it will both grow and contract at certain points within the forecast period.
• No natural disaster or local, state or national emergency will occur that would materially alter travel patterns and divert traffic from the TBTA facilities.
While the projections are made and presented year by year by Stantec, they are intended to show trends on the basis of its analysis of historical data and the assumptions and conditions set forth above. Variations in the year-to-year forecasted results may occur and such variations may be significant.
PROJECTED TRAFFIC, REVENUES, AND EXPENSES
Current and future traffic and toll revenues are estimated for the 11-year (2019-2029) forecast period for each TBTA facility based on historical trends in traffic and toll revenue, elasticity factors for the future toll increase, toll collection operations, capacities of the nine crossings, facility maintenance, E-ZPass participation levels, externalities such as area roadway improvement plans and regional demographic projections, and the assumptions and conditions summarized previously. Trends in operating expenses for the toll facilities, TBTA’s 2019 budget, 2019-2022 MTA Financial Plan, and growth estimates based on the Consumer Price Index and historical trends are reflected in the future operating expense forecast. Future operating expense estimates are used to develop net toll revenue projections over the forecast period.
Estimated Traffic and Toll Revenue, 2019
Stantec’s development of the traffic and toll revenue estimates for 2019 took into account the economic condition of the region, fuel prices, unusual weather events, and construction projects. The impacts in the long term, regarding the national and regional economies, projected employment in the Manhattan business districts and the traffic and toll revenue forecasts beyond 2019, are covered in a previous section of this report. In developing the traffic and toll revenue estimates for 2019, Stantec reviewed data for the previous six-year period (2013-2018) as well as preliminary 2019 data. The estimates for the remainder of 2019 assume that the base traffic levels at TBTA facilities for the remaining months of calendar year 2019 will be 1.2 percent greater than volumes in the same months of 2018. The forecast percent changes are shown in Table 23. Traffic volumes in January and February 2019 increased at all of the facilities when compared to the same months in 2018.

HISTORY AND PROJECTION OF TRAFFIC, TOLL REVENUES AND EXPENSES AND REVIEW OF PHYSICAL CONDITIONS OF THE FACILITIES OF TRIBOROUGH BRIDGE AND TUNNEL AUTHORITY
67
Table 23 Estimated Changes in Annual Traffic, 2018 to 2019
Facility
Actual Percent Change
January - February 2018 to 2019 (a)
Estimated Percent Change
March - December 2018 to 2019
Projected Percent Change
Full Year 2019
Throgs Neck Bridge 3.4% 0.5% 0.9% Bronx-Whitestone Bridge 3.8% 0.9% 1.3% RFK Bridge 1.2% 0.6% 0.7% Queens Midtown Tunnel 17.4% 3.1% 5.1% Hugh L. Carey Tunnel 9.2% 1.8% 2.9% Verrazzano-Narrows Bridge 3.8% 1.8% 2.1% Henry Hudson Bridge 2.0% 0.0% 0.3% Marine Parkway-Gil Hodges Memorial Bridge 0.9% 0.7% 0.7% Cross Bay Veterans Memorial Bridge 3.2% 0.5% 0.9% Total 4.4% 1.2% 1.6% Notes: (a) Based on preliminary actual data, subject to final audit.
As shown in Table 23, total 2019 traffic at the crossings is forecasted to increase at an average rate of 1.6 percent for the year, which is the result of an actual 4.4 percent gain in January and February and net system wide growth of 1.2 percent from March through December. Traffic is estimated to increase at all facilities stemming largely from continued economic growth and continued lower gasoline prices. The resulting traffic and toll revenue estimates for 2019 are presented in Table 24. Estimated toll revenue for 2019 is based on average toll rates developed from the toll schedule in effect as of the March 31, 2019 toll increase and the projected vehicle class distribution and payment method for 2018 and 2019.
Table 24 Estimated 2019 Toll-Paying Traffic and Toll Revenue
Facility Traffic (000s)
Average Toll
Revenue (000s)
Throgs Neck Bridge 44,743 $8.17 $365,376 Bronx-Whitestone Bridge 48,588 7.27 353,264
RFK Bridge 66,871 7.09 474,228
Queens Midtown Tunnel 28,966 6.59 190,752 Hugh L. Carey Tunnel 19,346 6.32 122,342 Verrazzano-Narrows Bridge(a) 76,405 6.08 464,340 Henry Hudson Bridge 25,913 3.44 89,181 Marine Parkway-Gil Hodges Memorial Bridge 8,128 2.23 18,115 Cross Bay Veterans Memorial Bridge 8,599 2.29 19,672 Total 327,560 6.40 2,097,268
Percent Change
2018-2019 (All Facilities) 1.6% 5.0% 6.7% Notes:
(a) Westbound traffic doubled, since traffic is not registered in the eastbound direction.

HISTORY AND PROJECTION OF TRAFFIC, TOLL REVENUES AND EXPENSES AND REVIEW OF PHYSICAL CONDITIONS OF THE FACILITIES OF TRIBOROUGH BRIDGE AND TUNNEL AUTHORITY
68
Summarizing, our estimates show a 1.6 percent increase in traffic, a 5.0 percent increase in the systemwide average toll, and a 6.7 percent increase in systemwide revenue over 2018, which reflects actual performance through February 2019 and anticipated traffic volumes for the remainder of the year. Table 24 provides the transition between the historical traffic and revenue data presented earlier in the report and the 10-year forecasts in Table 25 and Table 26.
Traffic and Toll Revenue at Current Tolls
Traffic and toll revenues were first projected on the basis that the tolls placed into effect on March 31, 2019 will be continued throughout the forecast period. The methodology employed by Stantec to forecast traffic was based on the development of an annual growth rate for each facility (based on historical traffic trends), the construction activity (historical and projected) throughout the highway network (bridges, tunnels and arterials), and the traffic capacity constraints in the network. Regional demographic projections were also taken into consideration. All indicators point to the potential for traffic growth in the short-term, reflecting continued improvements in the economy, buoyed by the sustained low cost of motor fuel.
The 2019 estimated traffic and revenue from Table 24 include the impacts of the March 2019 toll increase. Starting with the estimate for 2019 as a base, Stantec projected the traffic and toll revenue for the forecast period through 2029 (at constant tolls at the current rates established on March 31, 2019), as shown in Table 25. Changes in traffic volumes are in the range of +0.3 to +5.1 percent in 2019 depending on the facility. As previously discussed, this is based on the actual change in traffic on each facility in January and February 2019 and Stantec’s projections by facility for the March through December period. For 2020, traffic is projected to increase at 0.9 percent systemwide, with growth rates varying by facility. For 2021, traffic is projected to increase at 0.3 percent annually, with growth rates varying by facility. For 2022 through 2029, Stantec assumes a conservative long-term growth rate of 0.25 percent to approximate the trendline background growth rate accounting for changes in population, employment and other economic factors. Over the forecast period, the economy is assumed to be cyclical and thus will both grow and contract in certain periods; this trendline growth assumption accounts for the overall growth pattern through these cycles. Impacts associated with a general increase in total (NYCSC and non-NYCSC) E-ZPass usage and toll increases are computed separately.
Traffic and Toll Revenue with Assumed 2021 Toll Increase
The traffic forecast with a toll increase in 2021 was built upon the base forecast (from Table 25), to which the elasticity impacts (from Table 21) were applied. In accordance with the 2019-2022 MTA Financial Plan, Stantec applied the appropriate projected future increase in toll rates (from Table 22) effective March 1, 2021 (a 5.3 percent toll increase) to calculate the corresponding toll revenues. The traffic and revenue forecasts with the planned toll increase in 2021 are listed in Table 26.

HISTORY AND PROJECTION OF TRAFFIC, TOLL REVENUES AND EXPENSES AND REVIEW OF PHYSICAL CONDITIONS OF THE FACILITIES OF TRIBOROUGH BRIDGE AND TUNNEL AUTHORITY
69
Table 25 Traffic and Toll Revenue Forecast, Constant Tolls
Year Throgs Neck Bridge
Bronx-Whitestone
Bridge
RFK Bridge
Queens Midtown
Tunnel
Hugh L. Carey Tunnel
Verrazzano- Narrows (a)
Bridge
Henry Hudson Bridge
Marine Parkway-Gil
Hodges Bridge
Cross Bay Bridge
All Facilities
Traffic Change 2018-2019 0.89% 1.31% 0.71% 5.13% 2.91% 2.13% 0.32% 0.69% 0.90% 1.64% 2019-2020 0.52% 0.85% 0.78% 1.79% 1.21% 0.96% 0.34% 0.51% 0.44% 0.86% 2020-2021 0.25% 0.25% 0.25% 0.25% 0.25% 0.25% 0.25% 0.25% 0.25% 0.25% 2021-2022 0.25% 0.25% 0.25% 0.25% 0.25% 0.25% 0.25% 0.25% 0.25% 0.25% 2022-2023 0.25% 0.25% 0.25% 0.25% 0.25% 0.25% 0.25% 0.25% 0.25% 0.25% 2023-2024 0.25% 0.25% 0.25% 0.25% 0.25% 0.25% 0.25% 0.25% 0.25% 0.25% 2024-2025 0.25% 0.25% 0.25% 0.25% 0.25% 0.25% 0.25% 0.25% 0.25% 0.25% 2025-2026 0.25% 0.25% 0.25% 0.25% 0.25% 0.25% 0.25% 0.25% 0.25% 0.25% 2026-2027 0.25% 0.25% 0.25% 0.25% 0.25% 0.25% 0.25% 0.25% 0.25% 0.25% 2027-2028 0.25% 0.25% 0.25% 0.25% 0.25% 0.25% 0.25% 0.25% 0.25% 0.25% 2028-2029 0.25% 0.25% 0.25% 0.25% 0.25% 0.25% 0.25% 0.25% 0.25% 0.25%
Annual Traffic (000s) 2018 44,347 47,958 66,398 27,552 18,799 74,809 25,831 8,072 8,522 322,290 2019 44,743 48,588 66,871 28,966 19,346 76,405 25,913 8,128 8,599 327,560 2020 44,975 49,002 67,393 29,484 19,581 77,142 26,002 8,170 8,638 330,385 2021 45,087 49,124 67,562 29,557 19,630 77,335 26,067 8,190 8,659 331,211 2022 45,200 49,247 67,731 29,631 19,679 77,529 26,132 8,210 8,681 332,039 2023 45,313 49,370 67,900 29,705 19,728 77,722 26,197 8,231 8,703 332,869 2024 45,426 49,493 68,070 29,780 19,777 77,917 26,263 8,252 8,724 333,701 2025 45,540 49,617 68,240 29,854 19,827 78,111 26,328 8,272 8,746 334,536 2026 45,654 49,741 68,411 29,929 19,876 78,307 26,394 8,293 8,768 335,372 2027 45,768 49,866 68,582 30,003 19,926 78,503 26,460 8,314 8,790 336,210 2028 45,882 49,990 68,753 30,078 19,976 78,699 26,526 8,334 8,812 337,051 2029 45,997 50,115 68,925 30,154 20,026 78,896 26,593 8,355 8,834 337,894
Average Toll 2018 $7.77 $6.94 $6.76 $6.28 $6.03 $5.79 $3.25 $2.15 $2.18 $6.10 2019 $8.17 $7.27 $7.09 $6.59 $6.32 $6.08 $3.44 $2.23 $2.29 $6.40 2020 $8.27 $7.36 $7.18 $6.67 $6.41 $6.16 $3.49 $2.25 $2.31 $6.49 2021 $8.26 $7.35 $7.17 $6.67 $6.40 $6.15 $3.48 $2.24 $2.30 $6.48 2022 $8.25 $7.33 $7.16 $6.66 $6.40 $6.14 $3.47 $2.24 $2.30 $6.47 2023 $8.24 $7.32 $7.15 $6.65 $6.39 $6.14 $3.46 $2.24 $2.29 $6.46 2024 $8.23 $7.32 $7.15 $6.65 $6.39 $6.13 $3.45 $2.23 $2.29 $6.45 2025 $8.22 $7.31 $7.14 $6.65 $6.39 $6.13 $3.45 $2.23 $2.29 $6.45 2026 $8.22 $7.31 $7.14 $6.64 $6.39 $6.13 $3.44 $2.23 $2.29 $6.45 2027 $8.22 $7.30 $7.13 $6.64 $6.39 $6.13 $3.44 $2.23 $2.28 $6.45 2028 $8.22 $7.30 $7.13 $6.64 $6.39 $6.13 $3.44 $2.23 $2.28 $6.44 2029 $8.22 $7.30 $7.13 $6.64 $6.39 $6.13 $3.44 $2.23 $2.28 $6.44
Toll Revenue (000s) 2018 $344,565 $332,715 $448,600 $173,021 $113,395 $433,121 $83,836 $17,396 $18,575 $1,965,223 2019 $365,376 $353,264 $474,228 $190,752 $122,342 $464,340 $89,181 $18,115 $19,672 $2,097,268 2020 $372,049 $360,721 $484,141 $196,782 $125,527 $475,197 $90,705 $18,377 $19,955 $2,143,455 2021 $372,332 $360,882 $484,471 $197,023 $125,705 $475,723 $90,602 $18,379 $19,945 $2,145,063 2022 $372,741 $361,186 $484,973 $197,313 $125,909 $476,378 $90,563 $18,390 $19,947 $2,147,399 2023 $373,255 $361,610 $485,618 $197,644 $126,143 $477,142 $90,577 $18,410 $19,958 $2,150,358 2024 $373,860 $362,139 $486,386 $198,011 $126,411 $477,999 $90,637 $18,438 $19,978 $2,153,860 2025 $374,545 $362,758 $487,263 $198,410 $126,695 $478,939 $90,737 $18,473 $20,005 $2,157,824 2026 $375,301 $363,459 $488,236 $198,836 $126,995 $479,952 $90,872 $18,514 $20,038 $2,162,202 2027 $376,123 $364,233 $489,297 $199,287 $127,305 $481,032 $91,040 $18,556 $20,078 $2,166,952 2028 $377,006 $365,078 $490,443 $199,765 $127,620 $482,176 $91,238 $18,601 $20,123 $2,172,050 2029 $377,891 $365,926 $491,591 $200,246 $127,936 $483,323 $91,437 $18,646 $20,168 $2,177,164
Notes: (a) Westbound traffic doubled, since traffic is not registered in the eastbound direction.
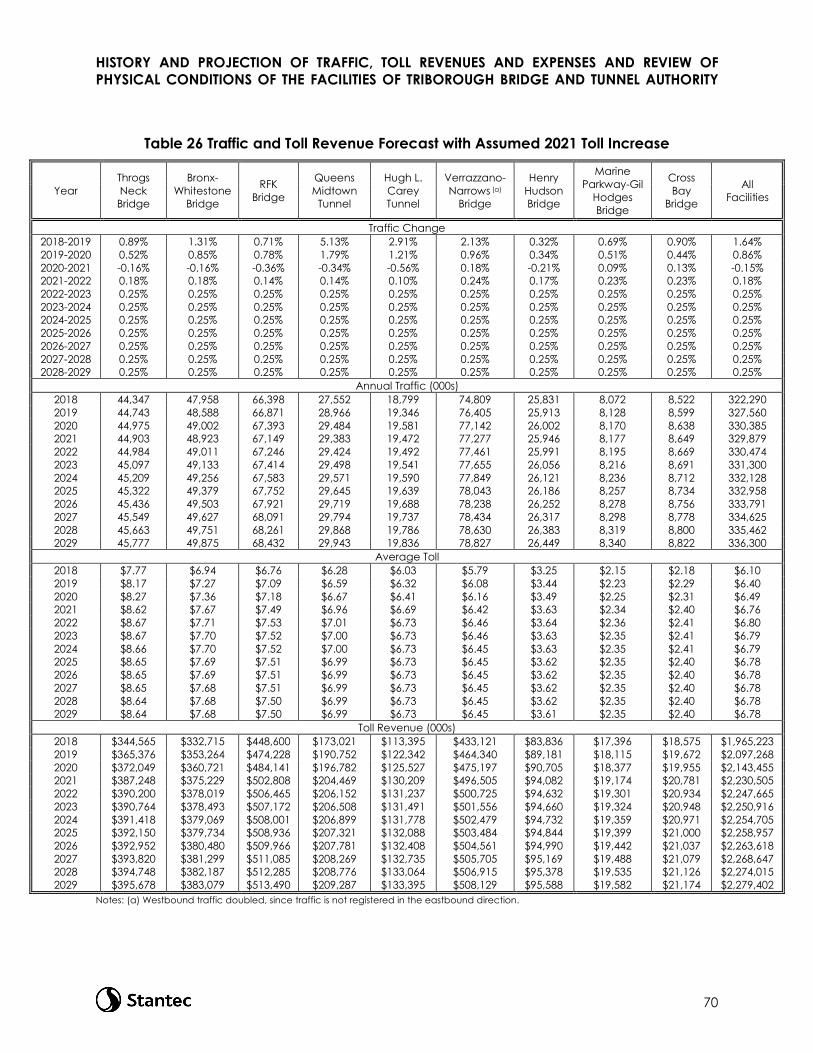
HISTORY AND PROJECTION OF TRAFFIC, TOLL REVENUES AND EXPENSES AND REVIEW OF PHYSICAL CONDITIONS OF THE FACILITIES OF TRIBOROUGH BRIDGE AND TUNNEL AUTHORITY
70
Table 26 Traffic and Toll Revenue Forecast with Assumed 2021 Toll Increase
Year Throgs Neck Bridge
Bronx-Whitestone
Bridge
RFK Bridge
Queens Midtown
Tunnel
Hugh L. Carey Tunnel
Verrazzano- Narrows (a)
Bridge
Henry Hudson Bridge
Marine Parkway-Gil
Hodges Bridge
Cross Bay
Bridge
All Facilities
Traffic Change 2018-2019 0.89% 1.31% 0.71% 5.13% 2.91% 2.13% 0.32% 0.69% 0.90% 1.64% 2019-2020 0.52% 0.85% 0.78% 1.79% 1.21% 0.96% 0.34% 0.51% 0.44% 0.86% 2020-2021 -0.16% -0.16% -0.36% -0.34% -0.56% 0.18% -0.21% 0.09% 0.13% -0.15% 2021-2022 0.18% 0.18% 0.14% 0.14% 0.10% 0.24% 0.17% 0.23% 0.23% 0.18% 2022-2023 0.25% 0.25% 0.25% 0.25% 0.25% 0.25% 0.25% 0.25% 0.25% 0.25% 2023-2024 0.25% 0.25% 0.25% 0.25% 0.25% 0.25% 0.25% 0.25% 0.25% 0.25% 2024-2025 0.25% 0.25% 0.25% 0.25% 0.25% 0.25% 0.25% 0.25% 0.25% 0.25% 2025-2026 0.25% 0.25% 0.25% 0.25% 0.25% 0.25% 0.25% 0.25% 0.25% 0.25% 2026-2027 0.25% 0.25% 0.25% 0.25% 0.25% 0.25% 0.25% 0.25% 0.25% 0.25% 2027-2028 0.25% 0.25% 0.25% 0.25% 0.25% 0.25% 0.25% 0.25% 0.25% 0.25% 2028-2029 0.25% 0.25% 0.25% 0.25% 0.25% 0.25% 0.25% 0.25% 0.25% 0.25%
Annual Traffic (000s) 2018 44,347 47,958 66,398 27,552 18,799 74,809 25,831 8,072 8,522 322,290 2019 44,743 48,588 66,871 28,966 19,346 76,405 25,913 8,128 8,599 327,560 2020 44,975 49,002 67,393 29,484 19,581 77,142 26,002 8,170 8,638 330,385 2021 44,903 48,923 67,149 29,383 19,472 77,277 25,946 8,177 8,649 329,879 2022 44,984 49,011 67,246 29,424 19,492 77,461 25,991 8,195 8,669 330,474 2023 45,097 49,133 67,414 29,498 19,541 77,655 26,056 8,216 8,691 331,300 2024 45,209 49,256 67,583 29,571 19,590 77,849 26,121 8,236 8,712 332,128 2025 45,322 49,379 67,752 29,645 19,639 78,043 26,186 8,257 8,734 332,958 2026 45,436 49,503 67,921 29,719 19,688 78,238 26,252 8,278 8,756 333,791 2027 45,549 49,627 68,091 29,794 19,737 78,434 26,317 8,298 8,778 334,625 2028 45,663 49,751 68,261 29,868 19,786 78,630 26,383 8,319 8,800 335,462 2029 45,777 49,875 68,432 29,943 19,836 78,827 26,449 8,340 8,822 336,300
Average Toll 2018 $7.77 $6.94 $6.76 $6.28 $6.03 $5.79 $3.25 $2.15 $2.18 $6.10 2019 $8.17 $7.27 $7.09 $6.59 $6.32 $6.08 $3.44 $2.23 $2.29 $6.40 2020 $8.27 $7.36 $7.18 $6.67 $6.41 $6.16 $3.49 $2.25 $2.31 $6.49 2021 $8.62 $7.67 $7.49 $6.96 $6.69 $6.42 $3.63 $2.34 $2.40 $6.76 2022 $8.67 $7.71 $7.53 $7.01 $6.73 $6.46 $3.64 $2.36 $2.41 $6.80 2023 $8.67 $7.70 $7.52 $7.00 $6.73 $6.46 $3.63 $2.35 $2.41 $6.79 2024 $8.66 $7.70 $7.52 $7.00 $6.73 $6.45 $3.63 $2.35 $2.41 $6.79 2025 $8.65 $7.69 $7.51 $6.99 $6.73 $6.45 $3.62 $2.35 $2.40 $6.78 2026 $8.65 $7.69 $7.51 $6.99 $6.73 $6.45 $3.62 $2.35 $2.40 $6.78 2027 $8.65 $7.68 $7.51 $6.99 $6.73 $6.45 $3.62 $2.35 $2.40 $6.78 2028 $8.64 $7.68 $7.50 $6.99 $6.73 $6.45 $3.62 $2.35 $2.40 $6.78 2029 $8.64 $7.68 $7.50 $6.99 $6.73 $6.45 $3.61 $2.35 $2.40 $6.78
Toll Revenue (000s) 2018 $344,565 $332,715 $448,600 $173,021 $113,395 $433,121 $83,836 $17,396 $18,575 $1,965,223 2019 $365,376 $353,264 $474,228 $190,752 $122,342 $464,340 $89,181 $18,115 $19,672 $2,097,268 2020 $372,049 $360,721 $484,141 $196,782 $125,527 $475,197 $90,705 $18,377 $19,955 $2,143,455 2021 $387,248 $375,229 $502,808 $204,469 $130,209 $496,505 $94,082 $19,174 $20,781 $2,230,505 2022 $390,200 $378,019 $506,465 $206,152 $131,237 $500,725 $94,632 $19,301 $20,934 $2,247,665 2023 $390,764 $378,493 $507,172 $206,508 $131,491 $501,556 $94,660 $19,324 $20,948 $2,250,916 2024 $391,418 $379,069 $508,001 $206,899 $131,778 $502,479 $94,732 $19,359 $20,971 $2,254,705 2025 $392,150 $379,734 $508,936 $207,321 $132,088 $503,484 $94,844 $19,399 $21,000 $2,258,957 2026 $392,952 $380,480 $509,966 $207,781 $132,408 $504,561 $94,990 $19,442 $21,037 $2,263,618 2027 $393,820 $381,299 $511,085 $208,269 $132,735 $505,705 $95,169 $19,488 $21,079 $2,268,647 2028 $394,748 $382,187 $512,285 $208,776 $133,064 $506,915 $95,378 $19,535 $21,126 $2,274,015 2029 $395,678 $383,079 $513,490 $209,287 $133,395 $508,129 $95,588 $19,582 $21,174 $2,279,402
Notes: (a) Westbound traffic doubled, since traffic is not registered in the eastbound direction.
HISTORY AND PROJECTION OF TRAFFIC, TOLL REVENUES AND EXPENSES AND REVIEW OF PHYSICAL CONDITIONS OF THE FACILITIES OF TRIBOROUGH BRIDGE AND TUNNEL AUTHORITY
71
Effects of Second Avenue Subway Construction in Forecast Years
The foregoing tables forecasting traffic and toll revenues incorporate estimated effects of the continued construction of the Second Avenue Subway. Phase 2 of the project, which would extend the Second Avenue Subway north to 125th Street, is currently in the design phase. Environmental reviews are also ongoing.
Activity associated with such construction could result in changes to traffic patterns, possibly resulting in a shift of traffic volumes from the RFK Bridge to other TBTA facilities, as well as the toll-free East River Bridges or a diversion to mass transit. Such changes in traffic patterns could have an adverse effect on the forecasts.
Various stages of the project will result in visible construction activity on segments of Second Avenue at any given time. In addition, tunnel construction, either through the use of a tunnel boring machine or cut-and-cover, will affect vehicular activity not only on Second Avenue, but also on adjacent avenues and streets.
Effects of Cashless Tolling in Forecast Years
Consistent with current TBTA practices, the foregoing tables forecasting traffic and toll revenues assume that revenues associated with TBM transactions will be accounted for within the month that the transaction takes place. A liability on the balance sheet will be created to offset the toll revenue associated with TBM revenues and this liability will decrease as tolls are collected. Therefore, there is no delay in revenue collection assumed in our forecast due to the implementation of Cashless Tolling.
Operating Expenses
The projection of operating expenses for 2019 through 2029 is shown in Table 27. Total operating expenses, consisting of labor and non-labor, are estimated to increase from $574.0 million in 2019 to $839.9 million in 2029. Labor expenses consist of wages, salaries, overtime and fringe benefits. Non-labor expenses include items such as maintenance, revenue management, supplies, utilities and other expenses. The table includes operating expenses budgeted by TBTA for 2019, operating expenses projected by TBTA through 2022 and Stantec’s projections of operating expenses from 2023 through 2029.
In 2019, expenses have been budgeted by TBTA at $574.0 million, an increase of 14.5 percent over 2018 expenses of $501.3 million. These expenses are split into the following categories: labor expenses of $272.3 million (an increase of 12.0 percent over 2018) and non-labor expenses of $301.7 million (an increase of 16.9 percent over 2018). Labor expenses are higher primarily due to the filling of 2018 vacancies, contractual payroll adjustments, and inflationary increases to fringe benefits. The major factors behind growth in non-labor expenses are anticipated increases in major maintenance, including bridge painting projects that will not be eligible for capital funding, higher E-ZPass expenses associated with expected continued growth in usage, and general inflationary adjustments.
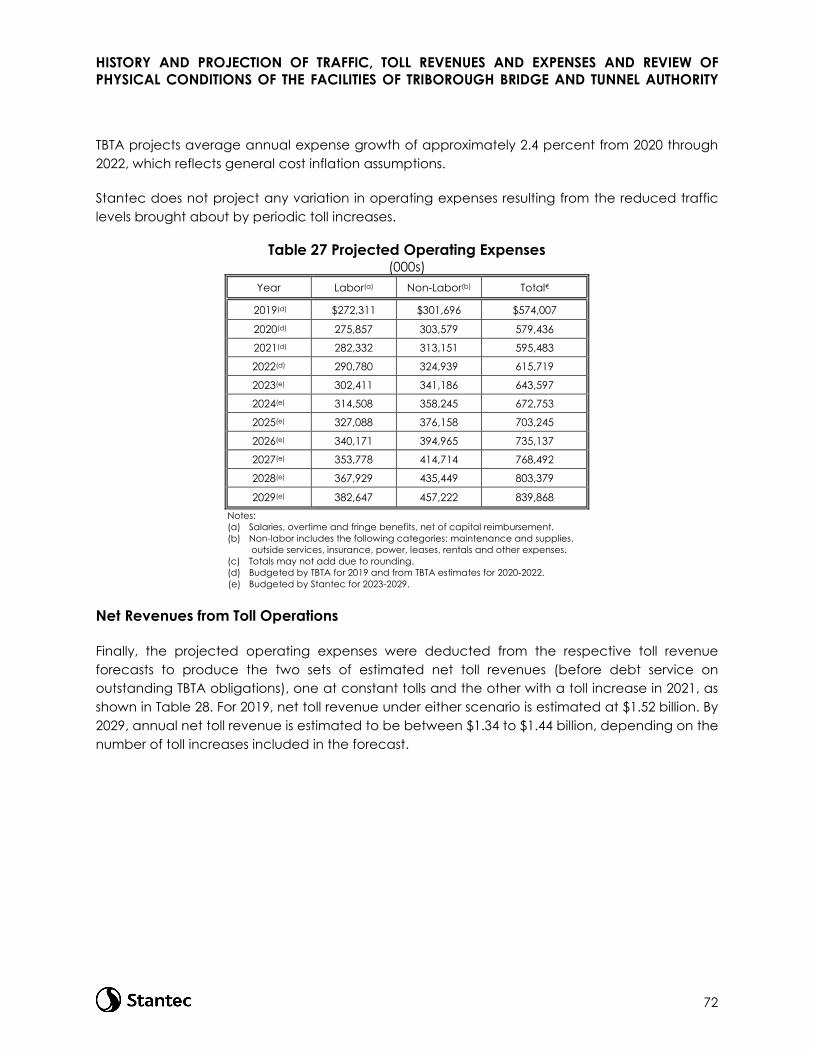
HISTORY AND PROJECTION OF TRAFFIC, TOLL REVENUES AND EXPENSES AND REVIEW OF PHYSICAL CONDITIONS OF THE FACILITIES OF TRIBOROUGH BRIDGE AND TUNNEL AUTHORITY
72
TBTA projects average annual expense growth of approximately 2.4 percent from 2020 through 2022, which reflects general cost inflation assumptions.
Stantec does not project any variation in operating expenses resulting from the reduced traffic levels brought about by periodic toll increases.
Table 27 Projected Operating Expenses
(000s) Year Labor(a) Non-Labor(b) Total€
2019(d) $272,311 $301,696 $574,007
2020(d) 275,857 303,579 579,436
2021(d) 282,332 313,151 595,483
2022(d) 290,780 324,939 615,719
2023(e) 302,411 341,186 643,597
2024(e) 314,508 358,245 672,753
2025(e) 327,088 376,158 703,245
2026(e) 340,171 394,965 735,137
2027(e) 353,778 414,714 768,492
2028(e) 367,929 435,449 803,379
2029(e) 382,647 457,222 839,868 Notes: (a) Salaries, overtime and fringe benefits, net of capital reimbursement. (b) Non-labor includes the following categories: maintenance and supplies,
outside services, insurance, power, leases, rentals and other expenses. (c) Totals may not add due to rounding. (d) Budgeted by TBTA for 2019 and from TBTA estimates for 2020-2022. (e) Budgeted by Stantec for 2023-2029.
Net Revenues from Toll Operations
Finally, the projected operating expenses were deducted from the respective toll revenue forecasts to produce the two sets of estimated net toll revenues (before debt service on outstanding TBTA obligations), one at constant tolls and the other with a toll increase in 2021, as shown in Table 28. For 2019, net toll revenue under either scenario is estimated at $1.52 billion. By 2029, annual net toll revenue is estimated to be between $1.34 to $1.44 billion, depending on the number of toll increases included in the forecast.
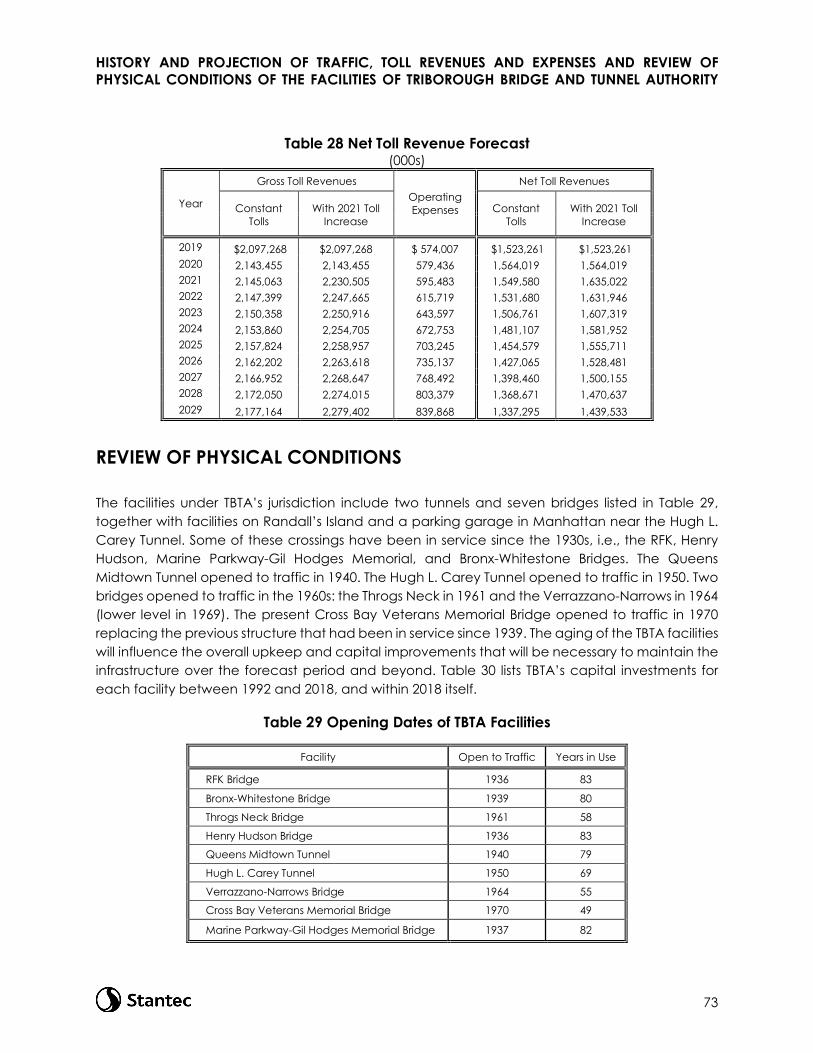
HISTORY AND PROJECTION OF TRAFFIC, TOLL REVENUES AND EXPENSES AND REVIEW OF PHYSICAL CONDITIONS OF THE FACILITIES OF TRIBOROUGH BRIDGE AND TUNNEL AUTHORITY
73
Table 28 Net Toll Revenue Forecast (000s)
Year
Gross Toll Revenues Operating Expenses
Net Toll Revenues
Constant Tolls
With 2021 Toll Increase
Constant Tolls
With 2021 Toll Increase
2019 $2,097,268 $2,097,268 $ 574,007 $1,523,261 $1,523,261 2020 2,143,455 2,143,455 579,436 1,564,019 1,564,019 2021 2,145,063 2,230,505 595,483 1,549,580 1,635,022 2022 2,147,399 2,247,665 615,719 1,531,680 1,631,946 2023 2,150,358 2,250,916 643,597 1,506,761 1,607,319 2024 2,153,860 2,254,705 672,753 1,481,107 1,581,952 2025 2,157,824 2,258,957 703,245 1,454,579 1,555,711 2026 2,162,202 2,263,618 735,137 1,427,065 1,528,481 2027 2,166,952 2,268,647 768,492 1,398,460 1,500,155 2028 2,172,050 2,274,015 803,379 1,368,671 1,470,637 2029 2,177,164 2,279,402 839,868 1,337,295 1,439,533
REVIEW OF PHYSICAL CONDITIONS
The facilities under TBTA’s jurisdiction include two tunnels and seven bridges listed in Table 29, together with facilities on Randall’s Island and a parking garage in Manhattan near the Hugh L. Carey Tunnel. Some of these crossings have been in service since the 1930s, i.e., the RFK, Henry Hudson, Marine Parkway-Gil Hodges Memorial, and Bronx-Whitestone Bridges. The Queens Midtown Tunnel opened to traffic in 1940. The Hugh L. Carey Tunnel opened to traffic in 1950. Two bridges opened to traffic in the 1960s: the Throgs Neck in 1961 and the Verrazzano-Narrows in 1964 (lower level in 1969). The present Cross Bay Veterans Memorial Bridge opened to traffic in 1970 replacing the previous structure that had been in service since 1939. The aging of the TBTA facilities will influence the overall upkeep and capital improvements that will be necessary to maintain the infrastructure over the forecast period and beyond. Table 30 lists TBTA’s capital investments for each facility between 1992 and 2018, and within 2018 itself.
Table 29 Opening Dates of TBTA Facilities
Facility Open to Traffic Years in Use
RFK Bridge 1936 83
Bronx-Whitestone Bridge 1939 80
Throgs Neck Bridge 1961 58
Henry Hudson Bridge 1936 83
Queens Midtown Tunnel 1940 79
Hugh L. Carey Tunnel 1950 69
Verrazzano-Narrows Bridge 1964 55
Cross Bay Veterans Memorial Bridge 1970 49
Marine Parkway-Gil Hodges Memorial Bridge 1937 82
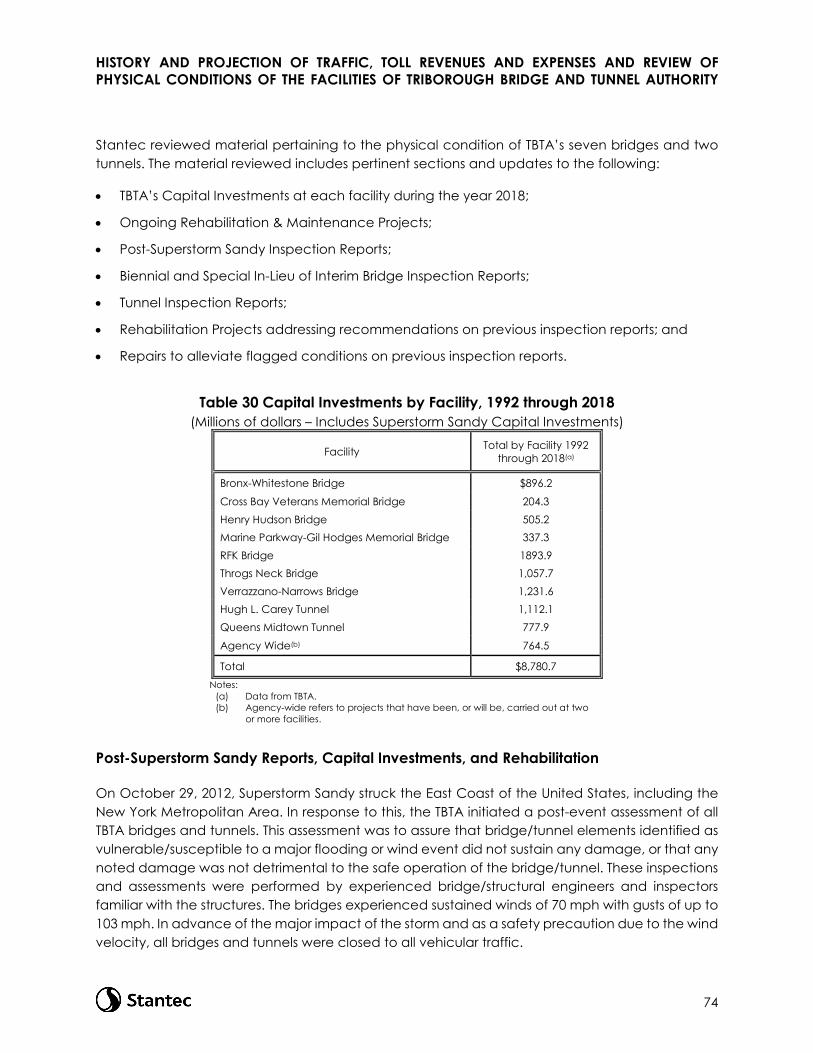
HISTORY AND PROJECTION OF TRAFFIC, TOLL REVENUES AND EXPENSES AND REVIEW OF PHYSICAL CONDITIONS OF THE FACILITIES OF TRIBOROUGH BRIDGE AND TUNNEL AUTHORITY
74
Stantec reviewed material pertaining to the physical condition of TBTA’s seven bridges and two tunnels. The material reviewed includes pertinent sections and updates to the following:
• TBTA’s Capital Investments at each facility during the year 2018;
• Ongoing Rehabilitation & Maintenance Projects;
• Post-Superstorm Sandy Inspection Reports;
• Biennial and Special In-Lieu of Interim Bridge Inspection Reports;
• Tunnel Inspection Reports;
• Rehabilitation Projects addressing recommendations on previous inspection reports; and
• Repairs to alleviate flagged conditions on previous inspection reports.
Table 30 Capital Investments by Facility, 1992 through 2018 (Millions of dollars – Includes Superstorm Sandy Capital Investments)
Facility Total by Facility 1992 through 2018(a)
Bronx-Whitestone Bridge $896.2
Cross Bay Veterans Memorial Bridge 204.3 Henry Hudson Bridge 505.2 Marine Parkway-Gil Hodges Memorial Bridge 337.3 RFK Bridge 1893.9 Throgs Neck Bridge 1,057.7 Verrazzano-Narrows Bridge 1,231.6 Hugh L. Carey Tunnel 1,112.1 Queens Midtown Tunnel 777.9
Agency Wide(b) 764.5
Total $8,780.7 Notes:
(a) Data from TBTA. (b) Agency-wide refers to projects that have been, or will be, carried out at two
or more facilities.
Post-Superstorm Sandy Reports, Capital Investments, and Rehabilitation
On October 29, 2012, Superstorm Sandy struck the East Coast of the United States, including the New York Metropolitan Area. In response to this, the TBTA initiated a post-event assessment of all TBTA bridges and tunnels. This assessment was to assure that bridge/tunnel elements identified as vulnerable/susceptible to a major flooding or wind event did not sustain any damage, or that any noted damage was not detrimental to the safe operation of the bridge/tunnel. These inspections and assessments were performed by experienced bridge/structural engineers and inspectors familiar with the structures. The bridges experienced sustained winds of 70 mph with gusts of up to 103 mph. In advance of the major impact of the storm and as a safety precaution due to the wind velocity, all bridges and tunnels were closed to all vehicular traffic.

HISTORY AND PROJECTION OF TRAFFIC, TOLL REVENUES AND EXPENSES AND REVIEW OF PHYSICAL CONDITIONS OF THE FACILITIES OF TRIBOROUGH BRIDGE AND TUNNEL AUTHORITY
75
When the Post-Superstorm Sandy inspections were finalized, it was found that no significant damages were caused by Superstorm Sandy at any of the bridges; however, some of the ancillary facilities of the Rockaway crossings (Cross Bay Veterans Memorial Bridge and Marine Parkway-Gil Hodges Memorial Bridge) sustained damage. TBTA’s bridges reopened the day after the storm (except the Marine Parkway-Gil Hodges Bridge which reopened October 31st). TBTA’s two tunnels sustained structural, electrical and mechanical damage due to substantial flooding. TBTA engineering and maintenance staff worked with outside contractors to reopen the tunnels in a relatively short period of time.
Inspection Reports, Flagged5 Conditions and Rehabilitation Projects
The review by Stantec of the pertinent material consists of the following subtasks:
• Comparison of condition ratings of the current inspection reports with the previous inspection reports to note significant changes in observed deterioration, and repairs to priority conditions from previous inspections, if any.
• Review of the current TBTA Capital Program to verify that the repairs recommended by the latest inspection reports are being addressed.
• Review of TBTA’s Routine Maintenance Program to verify that the maintenance-related recommendations of the current inspection reports are being addressed.
TBTA’s seven bridges and two tunnel facilities undergo periodic condition inspections. Bridges and tunnels are inspected biennially per federal and State mandate, with interim yearly inspections of any components that require monitoring. The purpose of the biennial inspection program is to maintain the safety and structural integrity of bridges and tunnels.
Bridge and Tunnel Inspections. The New York State Department of Transportation (“NYSDOT”) maintains a program of comprehensive bridge and tunnel management, maintenance and inspection applicable to TBTA’s bridges and tunnels. That program includes the uniform codes for bridge inspection and tunnel inspection, which:
• meet or exceed applicable Federal law; • require that bridges and tunnels be inspected at least every two years in accordance with the
provisions of that code; • prescribe qualifications for licensed professional engineers who inspect bridges and tunnels;
and • require that all bridge and tunnel inspections be performed or supervised by such persons.
5 The New York State Bridge Inspection Manual defines the following "flags" for reporting purposes: Red Flag – A structural flag that is used to report the failure or potential failure of a primary structural component that is likely to occur within two years from the current inspection. Red Flag PIA (Prompt Interim Action) – A designation that is made when a Red Flag condition is considered extremely serious and in need of immediate attention. This designation requires appropriate action by the responsible party within twenty-four hours. Yellow Flag - A structural flag that is used to report a potentially hazardous structural condition which if left unattended could become a clear and present danger within two years from the current inspection, or the actual or imminent failure of a non-critical structural component, where such failure may reduce the reserve capacity or redundancy of the bridge, but would not result in a structural collapse. Safety Flag PIA (Prompt Interim Action) – A flag that is used to report a condition presenting a clear and present danger to vehicular or pedestrian traffic, but poses no danger of structural failure or collapse. Safety Flag PIA can be issued on closed bridges where conditions present a threat to vehicular or pedestrian traffic underneath the structure or in the immediate vicinity. This designation requires appropriate action by the responsible party within twenty-four hours.

HISTORY AND PROJECTION OF TRAFFIC, TOLL REVENUES AND EXPENSES AND REVIEW OF PHYSICAL CONDITIONS OF THE FACILITIES OF TRIBOROUGH BRIDGE AND TUNNEL AUTHORITY
76
Bridge and tunnel inspection reports must be filed with NYSDOT and NYSDOT may close bridges or tunnels found unsafe for public use. TBTA is in compliance with the NYSDOT program.
TBTA’s Bridge Inspection Program was assessed from 2006 to 2007 by an independent engineering firm well known in the field of structural inspection and appraisal, which noted that “the program is meeting the minimum State and federal standards” and “in several respects the program exceeds the minimum standards” and “with respect to the accuracy, clarity, and thoroughness of the reports generated, we find them to be of the highest quality.”
The TBTA bridges and tunnels were last inspected and their physical condition appraised in 2017-2018 by various consultants, under the New York State Biennial Bridge and Tunnel Inspection Pro-gram, as shown in Table 31. Separate underwater and substructure inspections were performed in accordance with the five-year cycles of NYSDOT to obtain riverbed contours and to assess potential scour conditions at the substructure.
These ongoing inspections, performed by the inspection consultants, consist of close visual exami-nation, 100 percent hands-on inspection of designated critical elements, sounding concrete, and taking appropriate measurements to determine the physical conditions of the bridges and tunnels. All bridge inspections beginning in 2017 and continuing thereafter were performed in accordance with the updated 2017 New York State Bridge Inspection Manual (BIM) and the AASHTO Manual for Bridge Element Inspection. All tunnel inspections beginning in 2017 and continuing thereafter were performed in accordance with the Federal Highway Administration’s National Tunnel Inspection Standards (NTIS), the 2015 Specification for the National Tunnel Inventory (SNTI), and the 2015 Tunnel Operations, Maintenance, Inspection and Evaluation (TOMIE) Manual; and NYSDOT Technical Advisory, TA 16-001. Under these guidelines, all bridge and tunnel components are inspected and assigned a quantitative condition rating. Any priority conditions are reported immediately to the TBTA for prompt attention. The ratings are reviewed by TBTA personnel to assess what components of the bridge or tunnel require more comprehensive inspection and rehabilitation. Required rehabilitation are then awarded as contracts under the Capital and Maintenance Programs. Bridge and tunnel components which warrant more frequent monitoring due to their condition are monitored annually with a special in-lieu of interim inspection.
After performing a comparison of the individual overall ratings of the current inspection reports against the previous inspection reports, it was noted that there has been no significant change in the overall ratings and the bridges and tunnels remain in good condition.
TBTA has an ongoing seismic retrofit program to identify and implement necessary seismic retrofits in order to bring critical facilities to current seismic code standards. This program has made substantial progress in identifying necessary seismic upgrades and incorporating them into various capital facility rehabilitation design and construction projects when applicable. This effort will continue in the current 2015-2019 Capital Program.
The consulting engineering firms who performed the 2017 and 2018 biennial bridge or special in-lieu of interim inspections and the 2016 tunnel inspections for each facility are shown in Table 31.

HISTORY AND PROJECTION OF TRAFFIC, TOLL REVENUES AND EXPENSES AND REVIEW OF PHYSICAL CONDITIONS OF THE FACILITIES OF TRIBOROUGH BRIDGE AND TUNNEL AUTHORITY
77
Table 31 Facility Inspection Firms
Facility Consulting Firm (Inspection Year)
RFK Bridge WSP / Stantec (2018)
Throgs Neck Bridge Hardesty & Hanover (2017)
Bronx-Whitestone Bridge Atane (2017)
Henry Hudson Bridge WSP (2017)
Queens Midtown Tunnel Gannett Fleming (2017)
Queens Midtown Tunnel facility approach bridges WSP (2017)
Hugh L. Carey Tunnel Gannett Fleming (2017)
Verrazzano-Narrows Bridge Hardesty & Hanover / AI Engineers (2018)
Marine Parkway-Gil Hodges Memorial Bridge HNTB (2017)
Cross Bay Veterans Memorial Bridge HNTB (2017)
These firms are well known in the field of structural inspection and appraisal. Copies of pertinent sections of the final inspection reports for the various facilities were requested and made available by TBTA. Bridges that are part of the odd-year inspection cycle listed above will be undergoing inspections this summer, however, the 2018 special in-lieu of interim inspection data is available for review, as well as the 2017 biennial inspection data. The results of the comprehensive 2019 biennial inspections, also done by experts in the field, will generally be available later in the year.
Funds currently programmed for TBTA’s 2015-2019 Capital Program are summarized in Table 32. The plan, which totals $2.936 billion, separates this amount into specific projects by facility as well as agency-wide projects. Comparisons between the 2015-2019 Capital Program planned projects and total repair item lists for each facility, as prepared by inspection consultants in the biennial reports, confirm that the 2015-2019 Capital Program gives high priority to key rehabilitation projects. By prioritizing necessary facility rehabilitation projects, TBTA addresses all high priority recommendations in the current 2015-2019 Capital Program or maintenance programs that have not been addressed as part of the previous 2010-2014 Capital Program. All of these high priority needs will continue to be met. The future 2020-2024 Capital Program is in planning stages and is expected to be considered by the TBTA in 2019.

HISTORY AND PROJECTION OF TRAFFIC, TOLL REVENUES AND EXPENSES AND REVIEW OF PHYSICAL CONDITIONS OF THE FACILITIES OF TRIBOROUGH BRIDGE AND TUNNEL AUTHORITY
78
Table 32 TBTA 2015-2019 Capital Program by Facility ($ in millions)
Facility 2015-2019 Percent
Bronx-Whitestone Bridge (BWB) $176 6%
Henry Hudson Bridge (HHB) 265 9%
Hugh L. Carey Tunnel (HCT) 137 5%
Queens Midtown Tunnel (QMT) 92 3%
Robert F. Kennedy Bridge (RFK) 613 21%
Rockaway Crossings (Cross Bay and Marine Parkway Bridges) 95 3%
Throgs Neck Bridge (TNB) 681 23%
Verrazzano-Narrows Bridge (VNB) 553 19%
Agency Wide 324 11%
Total $2,936 100%
Bronx-Whitestone Bridge (BWB)
The special in-lieu of interim inspection of the BWB was completed in 2018. Of the 30 yellow flags issued in the 2017 biennial inspection, 27 remain active. During the 2018 special in-lieu of interim inspection, 3 new yellow flags were issued resulting in 30 active yellow flags on the bridge. One Safety Flag PIA (Prompt Interim Action) was issued during the 2017 biennial inspection which has been recategorized as a lower priority maintenance issue.
Projects in the 2015-2019 Capital Program (or ongoing from 2010-2014 Capital Program) at the BWB:
• Fender Protection Around Tower Piers – Design-Build award scheduled for 2019. • Miscellaneous Structural Rehabilitation – Phase I Construction was awarded in late 2015 and
was substantially complete in 2018. Phase II Construction was awarded in early 2019. • Continued Cable Investigation/Monitoring – The design contract was awarded in September
2013 with the associated construction contract awarded in late 2015. The construction contract was completed in 2018 and the main cable analysis is ongoing.
• Installation of Facility-wide Electronic Monitoring and Detection Systems – Contract was awarded in late 2017. The project is ongoing and is projected to be complete in 2020.
• Paint Tower Interior Base Cells and Struts – Construction was awarded in late 2015 and was substantially complete in 2018.
• Installation of Fire Standpipe Connection from Tower Pedestals to Roadway Level – Design-Build award scheduled for 2019.

HISTORY AND PROJECTION OF TRAFFIC, TOLL REVENUES AND EXPENSES AND REVIEW OF PHYSICAL CONDITIONS OF THE FACILITIES OF TRIBOROUGH BRIDGE AND TUNNEL AUTHORITY
79
Henry Hudson Bridge (HHB)
The special in-lieu of interim inspection of the HHB was completed in 2018. Of the 6 yellow flags issued in the 2017 biennial inspection, 3 are currently under repair, 3 were addressed, with the flag removal report pending.
Projects in the 2015-2019 Capital Program (or ongoing from 2010-2014 Capital Program) at the HHB:
• Skewbacks Retrofit – Design-build awarded in 2017. This project is ongoing and projected to be complete in 2020.
• Replacement of the Upper and Lower Plaza and Southbound Approach – The design contract was awarded in January 2013. Phase I construction contract was awarded in December 2014 and was substantially complete in 2016. Phase II construction was awarded in April 2017, is ongoing, and projected to be complete in 2021.
• Structural Rehabilitation Consisting of High Priority Structural Steel Repairs – Phase I is complete and Phase II construction award is scheduled for 2019.
• Replacement of Overcoat System – Construction award is scheduled for 2019. • Replacement of Facility Lighting System – Construction was awarded in 2017. This project is
ongoing and projected to be complete in 2021.
Hugh L. Carey Tunnel (HCT)
The initial NTIS Tunnel Inspection of the HCT was performed in 2017. During the 2017 NTIS Inspection, one new yellow flag was issued which has since been repaired and removed. During the 2017 biennial inspection of the Governor’s Island Pedestrian Bridge, one yellow flag was issued, which remains active.
Projects in the 2015-2019 Capital Program (or ongoing from 2010-2014 Capital Program and Sandy Program) at the HCT:
• Rehabilitation of the Tunnel Walls, Roadway Drainage, Firelines, Superstorm Sandy Restoration, and Repair/Replacement of Brooklyn Plaza Structural Slab – The construction contract was awarded in 2014 and was substantially complete in 2018.
• Rehabilitation of HCT Ventilation Systems – Design-Build Contract was awarded in 2018. It is an ongoing project and is projected to be complete in 2022.
• Rehabilitation of the Ventilation Buildings (Design Only) – Design award scheduled for 2019. • Electrical Rehabilitation at the Brooklyn Service Building – Design-Build Contract was awarded
in 2018. It is an ongoing project and is projected to be complete in 2020. • Install Smoke Detection/Alarm Systems - Design-Build Contract was awarded in 2018. It is an
ongoing project and is projected to be complete in 2021.
Queens Midtown Tunnel (QMT)
The initial NTIS Tunnel Inspection of the QMT and the biennial inspection of the QMT approach bridges were performed in 2017.
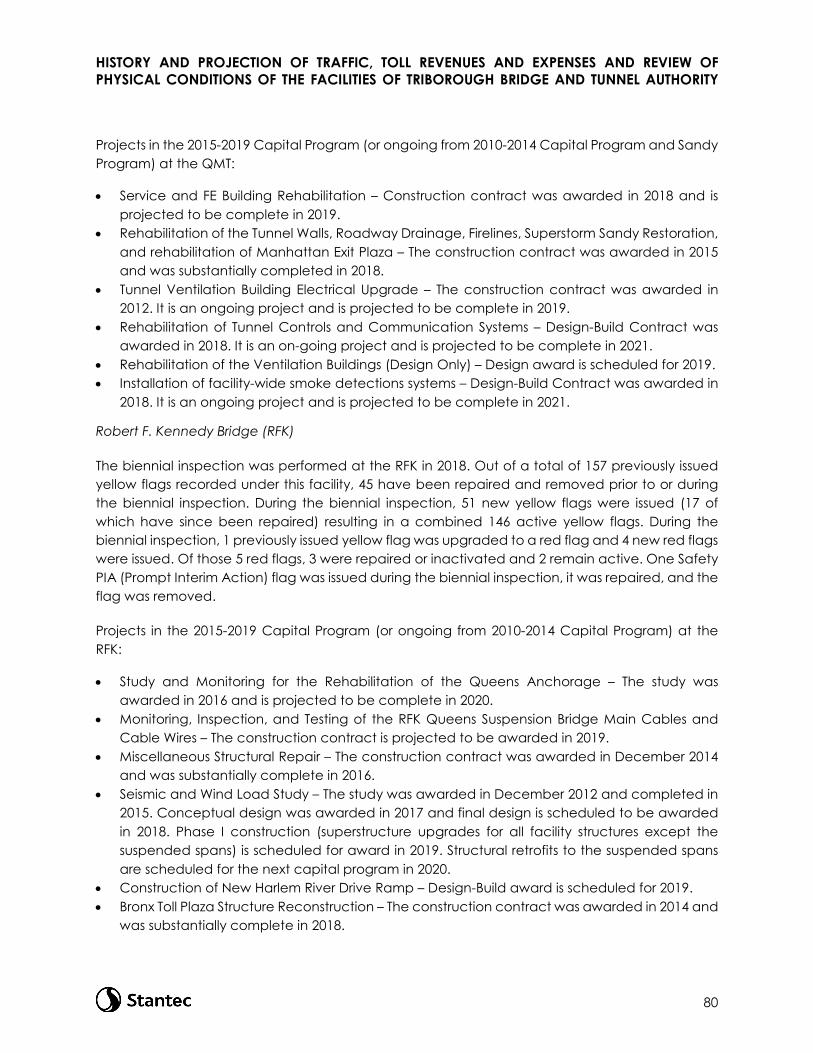
HISTORY AND PROJECTION OF TRAFFIC, TOLL REVENUES AND EXPENSES AND REVIEW OF PHYSICAL CONDITIONS OF THE FACILITIES OF TRIBOROUGH BRIDGE AND TUNNEL AUTHORITY
80
Projects in the 2015-2019 Capital Program (or ongoing from 2010-2014 Capital Program and Sandy Program) at the QMT:
• Service and FE Building Rehabilitation – Construction contract was awarded in 2018 and is projected to be complete in 2019.
• Rehabilitation of the Tunnel Walls, Roadway Drainage, Firelines, Superstorm Sandy Restoration, and rehabilitation of Manhattan Exit Plaza – The construction contract was awarded in 2015 and was substantially completed in 2018.
• Tunnel Ventilation Building Electrical Upgrade – The construction contract was awarded in 2012. It is an ongoing project and is projected to be complete in 2019.
• Rehabilitation of Tunnel Controls and Communication Systems – Design-Build Contract was awarded in 2018. It is an on-going project and is projected to be complete in 2021.
• Rehabilitation of the Ventilation Buildings (Design Only) – Design award is scheduled for 2019. • Installation of facility-wide smoke detections systems – Design-Build Contract was awarded in
2018. It is an ongoing project and is projected to be complete in 2021.
Robert F. Kennedy Bridge (RFK)
The biennial inspection was performed at the RFK in 2018. Out of a total of 157 previously issued yellow flags recorded under this facility, 45 have been repaired and removed prior to or during the biennial inspection. During the biennial inspection, 51 new yellow flags were issued (17 of which have since been repaired) resulting in a combined 146 active yellow flags. During the biennial inspection, 1 previously issued yellow flag was upgraded to a red flag and 4 new red flags were issued. Of those 5 red flags, 3 were repaired or inactivated and 2 remain active. One Safety PIA (Prompt Interim Action) flag was issued during the biennial inspection, it was repaired, and the flag was removed.
Projects in the 2015-2019 Capital Program (or ongoing from 2010-2014 Capital Program) at the RFK:
• Study and Monitoring for the Rehabilitation of the Queens Anchorage – The study was awarded in 2016 and is projected to be complete in 2020.
• Monitoring, Inspection, and Testing of the RFK Queens Suspension Bridge Main Cables and Cable Wires – The construction contract is projected to be awarded in 2019.
• Miscellaneous Structural Repair – The construction contract was awarded in December 2014 and was substantially complete in 2016.
• Seismic and Wind Load Study – The study was awarded in December 2012 and completed in 2015. Conceptual design was awarded in 2017 and final design is scheduled to be awarded in 2018. Phase I construction (superstructure upgrades for all facility structures except the suspended spans) is scheduled for award in 2019. Structural retrofits to the suspended spans are scheduled for the next capital program in 2020.
• Construction of New Harlem River Drive Ramp – Design-Build award is scheduled for 2019. • Bronx Toll Plaza Structure Reconstruction – The construction contract was awarded in 2014 and
was substantially complete in 2018.
HISTORY AND PROJECTION OF TRAFFIC, TOLL REVENUES AND EXPENSES AND REVIEW OF PHYSICAL CONDITIONS OF THE FACILITIES OF TRIBOROUGH BRIDGE AND TUNNEL AUTHORITY
81
• Reconstruction of the Manhattan Toll Plaza Structure – Phase I construction was substantially complete in 2016. Phase II construction was awarded in 2016 and substantially completed in 2018. Phase III construction was awarded in 2018 and will be substantially completed in 2019.
• Installation of Facility-wide Electronic Monitoring and Detection Systems – Design-Build awarded 2017, is ongoing, and is projected to be complete in late 2020.
• Installation of Fire Standpipe and Upgrade of Fire Protection Systems – Design-Build awarded 2017, is ongoing, and is projected to be complete in 2020.
• Electrical/Mechanical Rehabilitation of Harlem River Lift Span – Design-Build Contract was awarded in 2018. It is an ongoing project and is projected to be complete in 2020.
• Painting of Lift Span and Bronx Truss Steel – Construction award is scheduled for 2019. • Interim Repairs to the FDR Ramp – Construction Contract was awarded in 2017. It is an ongoing
project and is projected to be complete in 2019.
Throgs Neck Bridge (TNB)
The special in-lieu of interim inspection of the TNB was completed in 2018. Out of the 100 yellow flags which remained active from the 2017 biennial inspection, 12 were removed prior to or during the special in-lieu of interim inspection and 2 were inactivated and upgraded to red flags. During the 2018 special in-lieu of interim inspection, 4 new yellow flags were issued resulting in 90 active yellow flags on the bridge. Out of the 44 red flags issued during the 2017 biennial inspection, 42 were inactivated or removed prior to or during the special in-lieu of interim inspection, 2 previously issued yellow flags were upgraded to red flags (one of which has since been inactivated) resulting in 3 active red flags on the bridge which are being actively monitored and are scheduled for repair in June 2019.
Projects in the 2015-2019 Capital Program (or ongoing from 2010-2014 Capital Program) at the TNB:
• Anchorage Dehumidification – The Construction Contract was awarded in 2015 and was substantially complete in 2018.
• Approach Viaducts Seismic Retrofit & Structural Rehabilitation – Design was awarded in 2016 with construction award scheduled for 2019.
• Replacement of Grid Decks on Suspended Span and Painting on Suspended Span – Construction Contract was awarded in 2018 and is projected to be complete in 2023.
• Anchorage and Tower Protection (Design Only) – Design award is scheduled for 2019. • Study for Bronx-Queens Viaduct Replacement – Study was awarded in 2017 and is ongoing.
Verrazzano-Narrows Bridge (VNB)
The biennial inspection was performed at the VNB in 2018. Out of the 8 yellow flags which remained active from the 2017 special in-lieu of interim inspection of the VNB, 2 were removed prior to or during the 2018 biennial inspection and 6 were reissued. During the 2018 biennial inspection, 3 new yellow flags were issued (one of which has since been removed) resulting in 8 active yellow flags on the bridge.
HISTORY AND PROJECTION OF TRAFFIC, TOLL REVENUES AND EXPENSES AND REVIEW OF PHYSICAL CONDITIONS OF THE FACILITIES OF TRIBOROUGH BRIDGE AND TUNNEL AUTHORITY
82
Projects in the 2015-2019 Capital Program (or ongoing from 2010-2014 Capital Program) at the VNB:
• Main Cable and Suspender Rope Testing – The scoping/preliminary design contract was awarded in 2014. The associated design-build contract for cable openings was awarded in late 2017, is an ongoing project, and is projected to be complete in 2019.
• Rehabilitation of the Staten Island and Brooklyn Upper Level Approach Ramps – The feasibility study and conceptual design for the reconstruction and reconfiguration of the ramps and approaches was awarded in 2013. Design award for Phase I – Rehabilitation of Upper Level Elevated Approach and Anchorage Decks was awarded in 2016, with construction for Phase I scheduled for 2019.
• Anchorage & Piers Rehabilitation and Sealing – Construction Contract was awarded in 2018. It is an ongoing project and is projected to be complete in 2021.
• Elevator Rehabilitation – Construction Contract was awarded in 2018. It is an ongoing project and projected to be complete in 2020.
• Steel Repair and Concrete Rehabilitation – Construction award is scheduled for 2019. • Tower Pedestal Rehabilitation/Mooring Platform – Design-Build was awarded in 2018. The
project is ongoing and projected to be complete in 2021. • Panting of Suspended Span & Lower Level Steel – Construction award is scheduled for 2019.
Marine Parkway Bridge (MPB)
The special in-lieu of interim inspection of the MPB was completed in 2018. Out of the seven yellow flags which remained active from the 2017 biennial inspection, all seven were removed prior to or during the special in-lieu of interim inspection. During the 2018 special in-lieu of interim inspection, no new yellow flags were issued.
Projects in the 2015-2019 Capital Program (or ongoing from 2010-2014 Capital Program) at the MPB:
• Electrical and Mechanical Rehabilitation – Phase I Design-Build Contract was awarded in 2015 and was substantially completed in 2018. Phase II construction contract was awarded in 2015 and was substantially completed in 2018.
• Miscellaneous Steel Repairs – Construction contract award was awarded in 2015 and was substantially completed in 2018.
• Rehabilitation of Pier Fender System at the MPB and CBB – Design-build Contract was awarded in 2018. It is an ongoing project and is projected to be complete in 2021.
Cross Bay Bridge (CBB)
The special in-lieu of interim inspection of the CBB was completed in 2018. During the 2018 special in-lieu of interim inspection, one Safety PIA (Prompt Interim Action) Flag was issued which has since been repaired and removed.
Projects in the 2015-2019 Capital Program (or ongoing from 2010-2014 Capital Program) at the CBB:

HISTORY AND PROJECTION OF TRAFFIC, TOLL REVENUES AND EXPENSES AND REVIEW OF PHYSICAL CONDITIONS OF THE FACILITIES OF TRIBOROUGH BRIDGE AND TUNNEL AUTHORITY
83
• Rehabilitation of Pier Fender System at the MPB and CBB – Design-build Contract was awarded in 2018. It is an ongoing project and is projected to be complete in 2021.
• Replace Mechanical and Electrical Equipment – Design-Build Contract was awarded in 2015 and was substantially completed in 2018.
• Rehabilitation/Reconstruction of Rockaway Crossings – Scoping study was completed in March 2018.
Other System Wide Improvements
Agency-Wide (AW) – Since the September 11th attack on the World Trade Center, TBTA has engaged consultants to assess security risks of their facilities. As a result of these risk assessments, increased security improvements including various monitoring, surveillance and hardening projects have been implemented or will begin construction shortly at TBTA facilities. Video surveillance software and hardware upgrades have been installed at many facilities. TBTA has also maintained a security department and incorporates mitigation measures into their operations, capital, and maintenance programs.
AW Projects in the 2015-2019 Capital Program:
Intelligent Transportation System Enhancements – This project will complete the installation of CCTV cameras at the TNB and BWB, improving the monitoring and observation of traffic flow on these bridges. In addition, this project will design and install CCTV on the RFK. Hardware upgrades will also be made for the Advanced Traffic Management Systems (ATMS).
Hazardous Materials Abatement – This project will remove hazardous materials at various facility work sites.
Miscellaneous Agency-Wide Painting – This project provides for additional unplanned painting needs that may arise from findings in ongoing biennial inspections. It also includes painting the HCT and QMT ventilation buildings and facility buildings, and emergency lead paint removal.
Additional projects:
• Traffic Detection/Incident Management Systems (design)
• Facility Monitoring & Safety Systems Replacement
• Bridge Structural Health Monitoring Initiatives
• Weigh-in-motion (WIM) installation
• Operations Command Center Rehabilitation/Replacement
As part of the Capital Program planning process, TBTA personnel conduct a 20-year capital needs assessment every five years. The assessment is compiled from data from biennial inspections and system improvements suggested by the Engineering and Construction department, and include factors such as service life of various structural components and normal replacement cycles. Scheduling of Major Maintenance projects is closely coordinated with the 20-year capital needs
HISTORY AND PROJECTION OF TRAFFIC, TOLL REVENUES AND EXPENSES AND REVIEW OF PHYSICAL CONDITIONS OF THE FACILITIES OF TRIBOROUGH BRIDGE AND TUNNEL AUTHORITY
84
assessment to ensure that the optimal level of service to the traveling public both locally and systemwide is maintained while balancing operating and capital expenditures.
Stantec’s review of pertinent sections of the recent facility inspection reports found them to be extensive and detailed. The reports, based on Stantec’s limited review, appear, in the opinion of Stantec, to be reasonable. The reviews proved informative. Facility projects and agency-wide projects specific to each structure were discussed.
It is important to note, however, that Stantec’s review of portions of the work of other parties shall not relieve such other parties from their responsibility for performing their work in accordance with applicable requirements and the customary standard of care. Stantec shall not be responsible for the acts or omissions of other parties engaged by TBTA.
Long-Term Outlook for TBTA Facilities
The useful lives of bridges and tunnels, in general, could possibly be cut short for two main reasons: (a) they are geometrically and functionally unsatisfactory because they are too narrow, too steep, lacking in clearance or sufficient spatial capacity to handle the traffic; or (b) they are structurally unsafe because of deterioration or because their load-carrying capacity is inadequate to handle the loads imposed under current conditions. Deterioration may occur for a variety of reasons, including aging, but it will occur sooner if there has been inadequate or improper maintenance.
On the basis of the foregoing review and information available to us from reports of others, it is our opinion that the TBTA bridges, tunnels and approaches are all geometrically and functionally ade-quate, structurally sound, and generally maintained to good standards. Ongoing maintenance requirements of the structures are assessed, prioritized and addressed in an appropriate manner by TBTA to maintain a high level of safety to the traveling public, and to maintain the structures for many years to come.
TBTA is looking forward, exploring ways to add capacity at its facilities (where possible) while maintaining and rehabilitating its structures in order to ensure their future serviceability. We are of the opinion that all the TBTA facilities are and will be physically capable of accommodating traffic volumes at the levels projected for 2029 through the duration of the outstanding bonds that have been issued and future bonds to be issued based on a pledge of TBTA revenues through 2049, assuming maintenance and rehabilitation consistent with past practice.
CONCLUDING REMARKS
It is Stantec’s opinion that the revenue projections in this report are reasonable and have been prepared in accordance with accepted practice for investment-grade studies. However, given the uncertainties within the current international and economic climate, Stantec considers it is necessary to state that the traffic and revenue projections take into consideration the following caveats:
HISTORY AND PROJECTION OF TRAFFIC, TOLL REVENUES AND EXPENSES AND REVIEW OF PHYSICAL CONDITIONS OF THE FACILITIES OF TRIBOROUGH BRIDGE AND TUNNEL AUTHORITY
85
• This report presents the results of Stantec’s consideration of the information available to us as of the date hereof and the application of Stantec’s experience and professional judgment to that information. It is not a guarantee of any future events or trends.
• The traffic and revenue forecasts will be subject to future economic and social conditions and demographic developments that cannot be predicted with certainty.
• The projections contained in this report, while presented with numerical specificity, are based on a number of estimates and assumptions which, though considered reasonable to us, are inherently subject to significant economic and competitive uncertainties and contingencies, many of which will be beyond Stantec’s control and that of TBTA. In many instances, a broad range of alternative assumptions could be considered reasonable. Changes in the assumptions used could result in material differences in projected outcomes.
• If, for any reason, any of these conditions should change due to changes in the economy or competitive environment, or other factors, Stantec’s opinions or estimates may require amendment or further adjustments.
• Stantec’s toll revenue projections only represent its best judgment and Stantec does not warrant or represent that actual toll revenues will not vary from its projections, estimates and forecasts.
Many statements contained in this report that are not historical facts are forward-looking statements, which are based on Stantec’s opinions, as well as assumptions made by, and information currently available to, the management and staff of Stantec. Because the statements are based on expectations about future events and economic performance and are not statements of fact, actual results may differ materially from those projected. The words “anticipate”, “assume”, “estimate”, “expect”, “objective”, “projection”, “plan”, “forecast”, “goal”, “budget”, or similar words are intended to identify forward-looking statements. The words or phrases “to date”, “now”, “currently”, and the like are intended to mean as of the date of this report.
Respectfully,
Stantec Consulting Services Inc. 475 Fifth Avenue, 12th Floor New York, NY 10017
Steven Abendschein, P.E., ENV™ SP Senior Principal
HISTORY AND PROJECTION OF TRAFFIC, TOLL REVENUES AND EXPENSES AND REVIEW OF PHYSICAL CONDITIONS OF THE FACILITIES OF TRIBOROUGH BRIDGE AND TUNNEL AUTHORITY
86
Thomas Harknett, P.E., ENV™ SP Senior Principal
Julianne DiGennaro, P.E. Transportation Engineer