Embed Size (px)
Citation preview
Appendix D
FINAL Economic Assessment for a Proposed Cherry
Valley National Wildlife Refuge Pennsylvania
Prepared by:
Division of Economics U.S. Fish and Wildlife Service
4401 N. Fairfax Drive MS 7081‐43
Arlington, VA 22203
December 2008


Table of Contents
Introduction .....................................................................................................................D‐1 Population Profile ............................................................................................................D‐2 Monroe County Economic Profile....................................................................................D‐5 Employment.................................................................................................................D‐5 Payroll ..........................................................................................................................D‐6 Housing ........................................................................................................................D‐8 Agriculture ...................................................................................................................D‐9
Cherry Valley Land Use ..................................................................................................D‐10 Developed Land .........................................................................................................D‐13 Industrial Parcels....................................................................................................D‐13 Residential Parcels .................................................................................................D‐14 Retail/Services........................................................................................................D‐15 Hotels/Camps.........................................................................................................D‐15 Other Classified Parcels .........................................................................................D‐16
Open Space ................................................................................................................D‐17 Agriculture .............................................................................................................D‐17 Communications/Transportation/Utilities ............................................................D‐17 Forestry ..................................................................................................................D‐18 Parklands................................................................................................................D‐19 Vacant Lands ..........................................................................................................D‐19
Tax Revenue Impacts .....................................................................................................D‐22 Refuge – Related Impacts ..............................................................................................D‐25 Visitor‐Related Impacts..............................................................................................D‐25 Participation in Monroe County ................................................................................D‐26


Introduction
The 109th U.S. Congress passed the Cherry Valley National Wildlife Refuge Study Act in 2006 (Study Act). The Study Act directs the U.S. Fish and Wildlife Service, which administers the National Wildlife Refuge System, to evaluate the biological value of natural communities within the valley to determine if the area merits protection as a national wildlife refuge (refuge). The purposed of this economic assessment is to provide a summary of the economic activities in the vicinity of the proposed refuge and to determine the extent to which such activities may be impacted by the establishment of a refuge. Except for a narrow strip of land along the top of Kittatinny Ridge, Cherry Valley lies almost entirely within Monroe County, Pennsylvania, in the northeast portion of the State. Monroe County lies 90 miles north of Philadelphia, 75 miles west of New York and 116 miles east of Harrisburg. The county consists of 16 townships and 4 boroughs. The townships are governed by supervisors and the boroughs by councils. Outside of the boroughs, the county’s 611 square miles is characterized as rural terrain, rolling hills, and farmlands. The watershed of Cherry Valley encompasses a large segment of the Kittatinny Ridge, which is an important migration route for birds of prey throughout the Northeastern United States. Two federally owned parcels of land are contiguous to the Study Act boundary (Figure 1): the Delaware Water Gap National Recreation Area and a 700‐acre segment of the Appalachian Trail that is owned by the National Park Service. Figure 1 shows the general location of the refuge study boundary (as defined in the Study Act) within Monroe County. Approximately 30,000 acres fall within the boundary lines. The Service, in consultation with others, determined that a section of Lower Cherry Creek had likely been inadvertently left out of the refuge study boundary as defined in the Study Act. Therefore, an additional 1,500 acres were added to the refuge study boundary defined in the Study Act for our evaluation (Figure 1). We have defined this as the refuge study area (or Study Area). When possible, information from this section was included in the following analyses. The Study Area includes lands in six municipalities: Chestnuthill, Hamilton, Ross, Stroud, and Smithfield townships and Delaware Water Gap Borough.
Final Cherry Valley NWR Feasibility Study and EA Appendix D D‐1
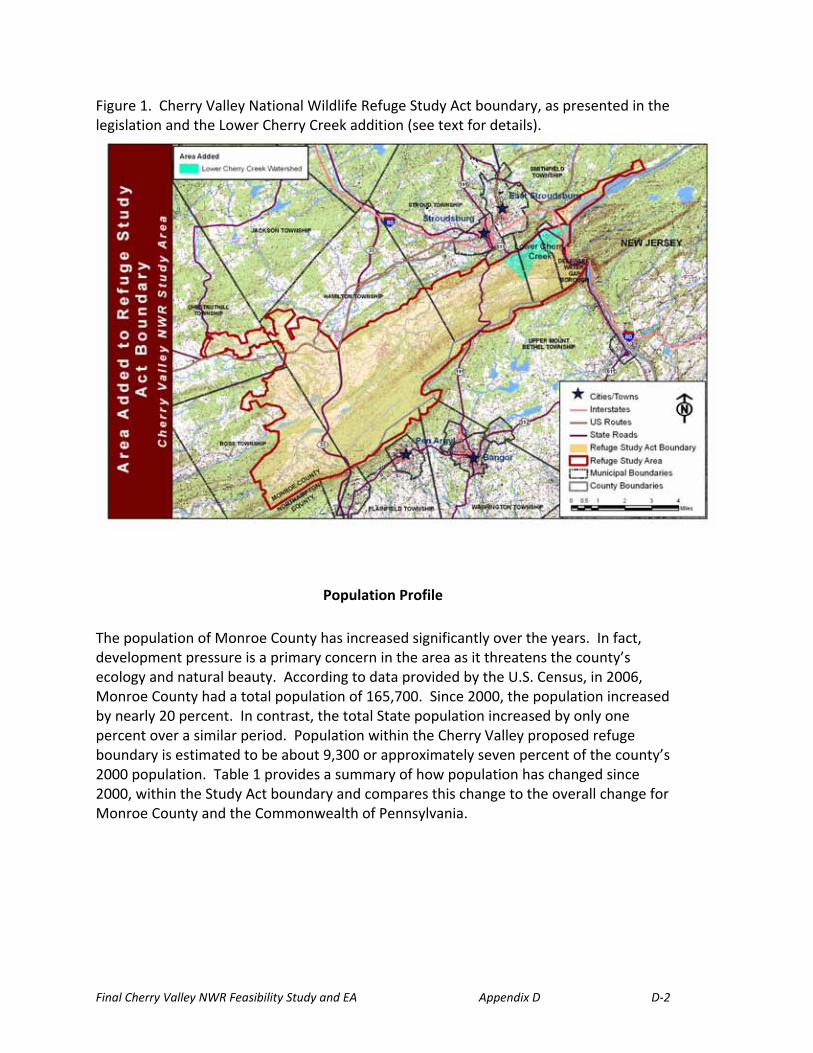
Figure 1. Cherry Valley National Wildlife Refuge Study Act boundary, as presented in the legislation and the Lower Cherry Creek addition (see text for details).
Population Profile
The population of Monroe County has increased significantly over the years. In fact, development pressure is a primary concern in the area as it threatens the county’s ecology and natural beauty. According to data provided by the U.S. Census, in 2006, Monroe County had a total population of 165,700. Since 2000, the population increased by nearly 20 percent. In contrast, the total State population increased by only one percent over a similar period. Population within the Cherry Valley proposed refuge boundary is estimated to be about 9,300 or approximately seven percent of the county’s 2000 population. Table 1 provides a summary of how population has changed since 2000, within the Study Act boundary and compares this change to the overall change for Monroe County and the Commonwealth of Pennsylvania.
Final Cherry Valley NWR Feasibility Study and EA Appendix D D‐2

Table 1. Population Estimates for the Cherry Valley National Wildlife Refuge Study Act boundary, Monroe County, and Pennsylvania.
2000 2006 % change Study Act Boundary 9,304 n/a Monroe County 138,687 165,685 19.5% Pennsylvania 12,281,054 12,440,621 1.3%
Note – Study Act boundary population estimates based on census block groups and Division of Economics GIS analysis. June, 2008. Study Act boundary population estimate excludes Lower Cherry Valley addition. Source: www.fedstats.gov/qf/states/42/42089.html A significant amount of population growth is attributable to an influx of workers and families from the greater New York metropolitan area seeking lower cost housing.1 Monroe County commuting time is over 30 percent higher than the state average. Many of these workers commute via Martz Trailways into Manhattan, nearly a two‐hour journey across Interstate 80. The majority of the Monroe County newcomers reside in new housing developments built outside of the Cherry Valley area.
Table 2 presents total population estimates in years 1990 and 2000 for the municipalities within the Study Act boundary along with an estimate of the population residing within the boundary lines. Of the 9,300 individuals residing within the Study Act boundary, over 60 percent resided in either Hamilton or Ross townships. Population increases were greatest in the townships of Chestnuthill, Smithfield, and Stroud. For the latter two, population increases within the Study Act boundary were twice that of the townships in general. Overall, between 1990 and 2000, the population within the Study Act boundary increased 28 percent. This rate was less than the total growth rate for the townships that have property included in the refuge (36 percent) and for Monroe County (45 percent), indicative of the relative rural nature of the area. Nonetheless, a 28 percent change reflects significant change for the area. By comparison, state population changed by only 3.4 percent over a similar period, while overall U.S. population changed by 13 percent, which reflects huge population growth in the Southeast and West.
1 Next Stop: Martz Trailways Bus from Mount Pocono, Pa., to the Port Authority in Manhattan, by Billie Cohen, The New York Times, January 28, 2008.
Final Cherry Valley NWR Feasibility Study and EA Appendix D D‐3

Table 2. Population for Monroe County and Municipalities in the Cherry Valley National Wildlife Refuge Study Act Boundary, Pennsylvania.
Total PopulationStudy Act Boundary
Population 1990 2000 Change 1990 2000 ChangeChestnuthill 8,554 14,598 71% 969 1,642 69%Delaware Water Gap 436 562 29% 113 52 ‐54%
Hamilton 6,511 7,004 8% 3,537 3,509 ‐1%Ross 3,671 5,768 57% 1,629 2,288 40%Smithfield 6,106 6,692 10% 470 841 79%Stroud 11,583 15,515 34% 558 972 74%Municipality Total 36,861 50,139 36% 7,276 9,304 28% Monroe County Total 95,709 138,572 45% PA Total 11,881,643 12,281,054 3.4% U.S. Total 248,709,873 281,421,906 13.2% Note: Refuge population estimates exclude Lower Cherry Valley addition. Source: 1990CensusMuniBnds.xls; CensusBlocks 2000 MuniBounds; US FWS Division of Economics GIS analysis (Monroe County Population). May 29, 2008.
Final Cherry Valley NWR Feasibility Study and EA Appendix D D‐4
Monroe County Economic Profile This section provides a general overview of the economic environment of Monroe County. The characterization is based on data collected and summarized by several sources, including the U.S. Census Bureau, the Bureau of Labor Statistics, and the U.S. Department of Agriculture. In general, county‐level statistics are the geographically finest level of data readily available. After profiling the economic environment of Monroe County, this analysis will look at land parcel data provided by Monroe County to determine the degree to which economic sectors within the county could be most affected should land use be converted to refuge status.
Employment
Total employment in Monroe County in 2005 was 75,728.2 Since 2001, Monroe County has experienced a net increase of over 7,600 new jobs. Over 40 percent of total employment in 2005 occurred in one of three economic sectors – government‐related, retail trade, and services. Of the three, government and government enterprises employed the greatest number of workers in 2005 (12,748), which represents almost 17 percent of total employment. Less than one‐half of one percent of total county employment (264) worked on farms. Since 2001, farming employment has decreased by about four percent. The fastest growing employment sectors in the county were educational services, and transportation and warehousing. The total employment in these sectors grew by 88 percent and 43 percent, respectively, since 2001. In addition to farming, Monroe County also saw a decrease in employment in the manufacturing and wholesale trade sectors. All other sectors had a net gain in employment between 2001 and 2005. Table 3 provides detailed description of employment in Monroe County in the years 2001 and 2005.
2 Source: Regional Economic Information System, Bureau of Economic Analysis, U.S. Department of Commerce; CA25N Footnotes; http://www.bea.gov/regional/reis/CA25Nfn.cfm; Accessed December 13 2007.
Final Cherry Valley NWR Feasibility Study and EA Appendix D D‐5

Final Cherry Valley NWR Feasibility Study and EA Appendix D D‐6
Table 3. Employment by Industry, Monroe County, Pennsylvania.
2005 % of total 2001
% of total
% Change 2001 ‐ 2005
Total employment 75,728 100.0% 68,112 100.0% 11.2% Farm employment 264 0.3% 275 0.4% ‐4.0% Nonfarm employment 75,464 99.7% 67,837 99.6% 11.2% Forestry, fishing, related activities, and other 65 0.1% n/a n/a n/a Mining and Utilities 179 0.2% 135 0.2% 32.6% Construction 5,691 7.5% 4,828 7.1% 17.9% Manufacturing 5,373 7.1% 5,423 8.0% ‐0.9% Wholesale trade 1,387 1.8% 1,401 2.1% ‐1.0% Retail trade 10,932 14.4% 10,314 15.1% 6.0% Transportation and warehousing 3,888 5.1% 2,708 4.0% 43.6% Information, Finance, Insurance, and Real Estate 6,591 8.7% 6,474 9.5% 1.8% Professional, management, admin & waste services 7,668 10.1% 6,511 9.6% 17.8% Educational services 852 1.1% 452 0.7% 88.5% Health care and social assistance 6,375 8.4% 5,192 7.6% 22.8% Arts, entertainment, and recreation 2,686 3.5% 2,144 3.1% 25.3% Accommodation and food services 6,831 9.0% 7,339 10.8% ‐6.9% Other services, except public administration 4,198 5.5% 3,750 5.5% 11.9% Government and government enterprises 12,748 16.8% 11,048 16.2% 15.4%
Source: Regional Economic Information System, Bureau of Economic Analysis, U.S. Department of Commerce; CA25N Footnotes; http://www.bea.gov/regional/reis/CA25Nfn.cfm. Accessed December 13 2007
Payroll
Government‐related services, manufacturing, and retail trade comprised the highest payrolls of the Monroe County industries. Collectively, these three sectors accounted for over 53 percent of the total employment earnings within the county. None of these industries, however, represented the fastest growing sectors over the previous five years. Total earnings increased the greatest in educational services (161 percent), transportation and warehousing (109 percent) and wholesale trade (76 percent). With the exception of wholesale trade, the pace of the earnings increase mirrored the pace of the job increases. Agricultural earnings in the county were extremely low, less than one‐tenth of a percent of total county earnings. Table 4 shows the total earnings for Monroe County by economic sector.

Cherry Valley NWR Feasibility Study and EA Appendix D D‐7
2005
($1,000)% of Total
2001($1,000)
% of Total
% Change
Farm compensation $ 787 0.0% $ 794 0.0% ‐0.9% Nonfarm compensation $ 2,503,292 100.0% $ 1,818,099 100.0% 37.7% Private compensation $ 1,797,273 71.8% $ 1,328,523 73.0% 35.3% Mining and Utilities 0.4%$ 9,637 n/a n/a n/a Construction 5.8%$ 144,764 $ 108,989 6.0% 32.8% Manufacturing 15.5%$ 387,123 $ 282,665 15.5% 37.0% Wholesale trade 3.6%$ 90,302 $ 51,122 2.8% 76.6% Retail trade 9.3%$ 231,906 $ 186,509 10.3% 24.3% Transportation and warehousing $ 164,079 6.6% $ 78,431 4.3% 109.2% Information, Finance, Insurance, and Real Estate $ 122,301 4.9% $ 117,841 6.5% 3.8% Professional, Management, Admin & Waste Services $ 171,233 6.8% $ 122,087 6.7% 40.3% Educational services 0.6%$ 15,870 $ 6,079 0.3% 161.1% Health care and social assistance $ 226,030 9.0% $ 154,554 8.5% 46.2% Arts, entertainment, and recreation $ 38,799 1.5% $ 27,305 1.5% 42.1% Accommodation and food services $ 115,715 4.6% $ 122,267 6.7% ‐5.4% Other services, except public administration $ 79,474 3.2% $ 59,636 3.3% 33.3% Government and government enterprises $ 706,019 28.2% $ 489,576 26.9% 44.2%Source: Regional Economic Information System, Bureau of Economic Analysis, U.S. Department of Commerce, CA06N Footnotes http://www.bea.gov/regional/reis/CA06Nfn.cfm
Table 4. Earnings by Industry, Monroe County, Pennsylvania.
Final

Housing
According to the 2000 U.S. Census, Monroe County had a total of 67,581 total housing units.3 By 2006, this number increased to 77,175 units, an increase of 14 percent. In 2000, the Census reported the total number of households to be 49,454, which implied a total of 18,127 vacant housing units. (While this number appears high, it reflects both the high number of existing seasonal units along with new housing construction and not yet occupied.) Since 2000, Monroe County has permitted slightly over 9,400 new single family homes. The pace of new construction peaked in 2003 at 1,679 permits. In contrast, the average cost of new, single‐family residential structures has risen consistently over the years. The latest average cost of a new single family home is $212,262 compared to $140,373 in 2000. The pace of new housing construction has declined significantly in recent years. In 2007, the total number of new permits issued declined by over 30 percent from the year earlier, signifying a strong decline in demand. The county experienced record foreclosures in 2007 and looks to set a new record in 2008. According to a recent article in the Pocono Record there were 1,253 foreclosure filings in 2007.4 Table 5. Single Family Home Construction, Monroe County, Pennsylvania.
Year Permits Annual Change Total Cost
Annual Change Avg Cost
Annual Change
2007 900 ‐36% $191,036,244 ‐39% $212,262 5% 2006 1,399 ‐13.1% $311,573,822 ‐0.8% $222,712 14.2% 2005 1,610 ‐2.1% $314,059,152 2.4% $195,068 4.7% 2004 1,645 ‐2.0% $306,610,397 6.9% $186,389 9.2% 2003 1,679 6.7% $286,709,547 13.2% $170,762 6.0% 2002 1,573 4.2% $253,352,319 12.9% $161,063 8.4% 2001 1,510 2.0% $224,358,519 7.9% $148,582 5.8% 2000 1,481 8.3% $207,892,568 8.4% $140,373 0.0% 1999 1,367 21.0% $191,829,977 39.6% $140,329 15.4% 1998 1,130 0.0% $137,446,018 0.0% $121,634 0.0%
Source: U.S. Census Bureau, http://www.census.gov/const/www/permitsindex.html
3 U.S. Census Bureau, U.S. Department of Commerce, http://censtats.census.gov/bldg/bldgprmt.shtml. 4 Monroe Smashed Home Foreclosure Record with 1,253 filings in 2007, by David Pierce, Pocono Record Writer, January 2, 2008 and County’s Foreclosure Filings May Hit New High in 2008, by David Pierce, Pocono Record Writer, April 13, 2008.
Final Cherry Valley NWR Feasibility Study and EA Appendix D D‐8

Agriculture
In 2002, Monroe County had a total of 324 farms, up from 257 farms in 1997.5 Land in farms also increased, from 29,877 acres in 1997 to 32,938 acres in 2002. The total market value of production from all farms was $6.6 million. Crop sales accounted for 70 percent of this total ($4.7 million), livestock the remaining 30 percent ($1.9 million). Top ranked sales for commodities were for nursery products ($2.3 million) and aquaculture ($1.0 million). Table 6 presents latest U.S. Census figures for commodity sales. Table 6. Value of Sales by Commodity Group (in $1,000), Monroe County, Pennsylvania.
Commodity Group Sales ($1,000)
Grains, oilseeds dry beans and dry peas $882 Tobacco ‐ Cotton and cottonseed ‐ Vegetables, melons, potatoes, and sweet potatoes $641 Fruits, tree nuts, and berries $242 Nursery,greenhouses, floriculture, and sod $2,348 Cut Christmas trees and short rotation woody crops $119 Other crops and hay $454 Poultry and eggs $17 Cattle and calves $324 Milk and dairy $360 Hogs and pigs $13 Sheep, goats, and related products $18 Horses, ponies, mules, burros, and donkeys $67 Aquaculture $1,014 Other animals and animal products $82 Source: 2002 Census of Agriculture, County Profile, U.S. Dept. of Agriculture, Pennsylvania Agriculture Statistics Service.
Table 7 shows the total breakdown, by acreage, of the top crop items for Monroe County. Slightly less than one‐third of agricultural land in the county was used for the production of one of four items. Land use for the production of forage (e.g., hay) topped the list at 5,314 acres.
5 2002 Census of Agriculture, U.S. Department of Agriculture.
Final Cherry Valley NWR Feasibility Study and EA Appendix D D‐9

Table 7. Top Crop Items (by acres) in Monroe County, Pennsylvania. Item Acres Forage 5,314 Corn (for grain) 3,536 Soybeans 1,843 Oats 771 Nursery stock 684 Total 12,148 Source: 2002 Census of Agriculture, County Profile, USDA.
Cherry Valley Land Use
While specific economic data within the Cherry Valley area is not readily available, Monroe County does collect and maintain data concerning parcel characteristics. Among other characteristics, the parcel data set includes such descriptive characteristics as size, total assessment, ownership, and use. By carefully reviewing these data, one can make some general assumptions concerning the economy of the Cherry Valley area and its relative contribution to the overall larger economy of Monroe County. Land use within the Study Area can be classified roughly into ten general categories, which are identified in Table 8. For the purposes of this analysis, these categories were further classified into one of two groups: open space parcels and developed space parcels. The exhibit shows that developed parcels, which include residential and industrial properties, collectively account for about one‐third of the Study Area. Residential properties, alone, cover nearly 20 percent of the Study Area. Open space parcels, which include agriculture, parks, forest, vacant, and in this case, property owned by utilities, together account for nearly 70 percent of the Study Area.6 In total, the Study Area, including the Lower Cherry Valley addition, consists of 4,159 unique parcels. These parcels total over 34,000 acres. Many parcels extend beyond the borders of the Study Area, which explains the why the total parcel acreage exceeds the acreage of the Study Area.
6 Land classified for use by utilities comprises 10 percent of the total. This area is largely reflective of the land holding by PA American Water, which owns over 3,000 acres of nearly contiguous property in the southwestern portion of the proposed refuge boundary. This land remains largely undeveloped.
Final Cherry Valley NWR Feasibility Study and EA Appendix D D‐10

Table 8. General Land Use Characteristics within the Cherry Valley National Wildlife Refuge Study Area, Monroe County, Pennsylvania.
Land Category Land Use Acres1Percent of Total
Agriculture
5,634 16.2%
Communication/Transportation/Utilities
3,444 9.9%
Forest
4,879 14.0%
Public/Private Parks
5,248 15.1%
Vacant
4,563 13.1%
“Open Space” Parcels
subtotal
23,768 68.2%
Hotels/Camps
761 2.2%
Industrial
2,423 6.9%
Residential
7,012 20.1%
Retail/Services
646 1.9%
Other
259 0.7%
“Developed” Parcels
subtotal
11,101 31.8%Grand Total
34,869 100.0%1 Total acres exceed total area of the Study Area because several border parcels extend beyond the Study Area boundary. Source: Monroe County parcel data, 2007. GIS analysis conducted by U.S. Fish and Wildlife Service, Division of Economics. Figure 2 shows how land use is generally distributed across the Study Area. The exhibit shows that developed parcels (e.g., residential and industrial) are primarily located along Cherry Valley road and areas to the northeast of the road. Open space parcels generally lie on the southeast side of Cherry Valley road up to Kittatinny Ridge. Hamilton Township, alone, accounts for nearly 50 percent of the total Study Area acreage. According to Monroe County assessment records, the total assessed value of parcels within the Study Area was $100.3 million in 2007. Sixty percent of the total is
Final Cherry Valley NWR Feasibility Study and EA Appendix D D‐11

associated with a single land use category – residencies. A more detailed discussion of general land use characteristics, by land use category, follows. Figure 2. Location of Developed and Open Space Parcels within the Cherry Valley National Wildlife Refuge Study Area, Monroe County, Pennsylvania.
Source: Monroe County Land Use data. Analysis conducted by Division of Economics, U.S. Fish and Wildlife Service, May 2008.
Final Cherry Valley NWR Feasibility Study and EA Appendix D D‐12

Developed Land
Industrial Parcels
Industrial parcels are clustered in three main locations within the Study Area. Two clusters lie right on the border of the boundary line. There are 32 industrial parcels, in total and collectively accounting for 2,423 acres, or about seven percent of the parcel land cover. Total assessment value of these properties is over $2.3 million. The first noticeable cluster lies in Ross Township, at the southwest border of the Study Area. This cluster consists of three parcels, the largest of which is owned by the Lehigh Portland Cement Company. This parcel is operated as a quarry and is reported to be 1,538 acres in size. The parcel was assessed at nearly $250 thousand. The second cluster is located in Hamilton Township, along the northern border of the Study Area. This cluster largely consists of multiple, adjacent parcels owned by Eureka Stone Quarry. The company own 585 acres within the Study Area and their property is currently assessed at $321 thousand. The third cluster of industrial property is located just to the southeast of the Eureka parcels. This cluster is approximately 185 acres and is assessed at $177 thousand. Two parcels, totaling 72 acres, are owned by the Hamilton Stone Company, while the remaining parcels are owned by the Herbert Imbt/Fairmont Development Corporation, which is also operated as a quarry. Table 9. Industrial Lands Within the Cherry Valley National Wildlife Refuge Study Area, Monroe County, Pennsylvania.
Municipality Acres % of Study Area 2007 Total Assessment Chestnuthill 0 0% $ 8,240 Delaware Water Gap 34 3% $ 853,980 Hamilton 771 5% $ 658,710 Ross 1,591 20% $ 500,440Smithfield 27 1% $ 336,750 Stroud 0 0% $ ‐ Grand Total 2,423 7% $ 2,358,120
Final Cherry Valley NWR Feasibility Study and EA Appendix D D‐13

Residential Parcels
Residential parcels, occupy over 7,000 acres of the Study Area. This amounts to 20 percent of the Study Area. Distribution of residential parcels is relatively uniform across the municipalities, with the exception of Delaware Water Gap Borough and Smithfield Township. Collectively, residential parcels are assessed at slightly over $60 million, which computes to about 60 percent of the total assessment value of all the parcels within the Study Area.7 There are over 2,500 residential parcels. The median parcel size is slightly over one acre with a corresponding median assessment of $23,500, which based on Pennsylvania’s current market index, computes to a median current market value of $183,470.8 Nearly 30 percent of Chestnuthill Township’s acreage within the Study Area is classified as residential. Hamilton, Ross, and Stroud also have about 20 percent of their Study Area acres classified as residential parcels. There are 33 parcels greater than 25 acres. The largest residential parcel is 110 acres and is located in Hamilton Township. Table 10 shows the total amount of residential acres and total value of residential property by township, within the Study Area. Table 10. Residential Lands Within the Cherry Valley National Wildlife Refuge Study Area, Monroe County, Pennsylvania. Municipality Acres % of Study Area 2007 Total Assessment Chestnuthill 428 30% $ 3,134,470 Delaware Water Gap 89 9% $ 3,766,570 Hamilton 3,087 20% $ 28,634,750 Ross 1,770 22% $ 11,092,620 Smithfield 411 11% $ 5,190,540 Stroud 1,228 24% $ 8,272,910 Grand Total 7,012 20% $ 60,091,860
7 Monroe County latest reassessment occurred in 1988 and is the source of the database. 8 The State of Pennsylvania uses a multiplier of 7.81 to estimate the current market value of assessed property. Source: Email from George Basila, Monroe County Planning Commission to Edward Maillett , U.S. Fish and Wildlife Service, “Assessment units ?” on 9 June 2008.
Final Cherry Valley NWR Feasibility Study and EA Appendix D D‐14

Retail/Services
Land parcels associated with retail or service establishments are primarily located near residential areas. Hamilton and Smithfield townships have the greatest amount of acreage in these sectors (290 and 196 acres, respectively). While the Hamilton Township parcels are numerous and contain no large parcels (the largest parcels are less than 50 acres and are associated with church groups), the majority of the acreage in Smithfield consist of a single parcel owned by the Manwalamink Water Company (174 acres). This company is affiliated with the Shawnee on Delaware Corporation. The parcel, while classified as developed, likely supports many refuge‐related characteristics. Table 11. Retail/Service Lands Within the Cherry Valley National Wildlife Refuge Study Area, Monroe County, Pennsylvania.
Municipality Acres % of Study Area 2007 Total Assessment Chestnuthill 65 5% $ 1,106,910 Delaware Water Gap 21 2% $ 817,910 Hamilton 290 2% $ 1,947,660 Ross 27 0% $ 403,300 Smithfield 196 5% $ 687,090 Stroud 47 1% $ 165,320 Grand Total 646 2% $ 5,128,190
Hotels/Camps
Hotel and camp parcels collectively comprise 761 acres within the Study Area and have a current assessment of over $8.7 million. Smithfield Township contains 263 of the acres. Shawnee on Delaware Corporation owns the vast majority of this property. Other large hotel/camp property owners include 181 acres owned by Forte, Inc., at the border of the Study Area in Stroud Township and 85 acres owned by the Saylors Lake Fishing Association in Hamilton Township. Although initially classified as developed property, much open space area permeates these parcels and may support desirable refuge characteristics.
Final Cherry Valley NWR Feasibility Study and EA Appendix D D‐15

Table 12. Hotel/Camp Lands Within the Cherry Valley National Wildlife Refuge Study Area, Monroe County, Pennsylvania.
Municipality Acres % of Study Area 2007 Total Assessment
Chestnuthill 41 3% $ 218,630 Delaware Water Gap 65 6% $ 996,860 Hamilton 178 1% $ 1,418,660 Ross 17 0% $ 220,730 Smithfield 263 7% $ 5,175,560 Stroud 196 4% $ 722,090 Grand Total 761 2% $ 8,752,530
Other Classified Parcels Approximately 259 acres classified as “otherwise” have development characteristics. Land use in this category may include scrap yards and educational and government services. In total, these parcels account for about two percent of the Study Area. The relatively large percent of parcels in Delaware Water Gap is comprised of property owned primarily by the Delaware River Joint Toll Bridge Commission. Table 13. Other Classified Lands Within the Cherry Valley National Wildlife Refuge Study Area, Monroe County, Pennsylvania.
Municipality Acres % of Study Area 2007 Total Assessment
Chestnuthill 9 1% $ 151,410 Delaware Water Gap 31 3% $ 234,380 Hamilton 46 0% $ 798,710 Ross 21 0% $ 201,160 Smithfield 49 1% $ 1,250,430 Stroud 104 2% $ 184,230 Grand Total 259 1% $ 2,820,320
Final Cherry Valley NWR Feasibility Study and EA Appendix D D‐16

Open Space
Agriculture
Agricultural parcels occupy a total of 5,634 acres. Collectively, this represents about 16 percent of the total Study Area. These lands primarily lie along the valley floor, north of Cherry Valley Road and to the west of PA 33. There are nearly 140 agricultural parcels that range in size from over 200 acres to an acre. The average agricultural parcel size is about 40 acres. The total assessment of agricultural parcels in the Study Area is about $6.1 million. Hamilton Township contains the greatest amount (2,907 acres) of agricultural acreage of all the municipalities within the Study Area. Over 20 percent of the parcel acreage in Chestnuthill is classified as agriculture. Hamilton, Ross, and Stroud townships also have high percentages of agricultural use. Table 14 details the breakdown of agricultural land by municipality, along with assessment value. Table 14. Agricultural Lands Within the Cherry Valley National Wildlife Refuge Study Area, Monroe County, Pennsylvania
Municipality Acres % of Study Area 2007 Total Assessment
Chestnuthill 325 23% $ 203,600 Delaware Water Gap 0 0% $ ‐ Hamilton 2,889 19% $ 3,458,770 Ross 1,445 18% $ 1,153,040 Smithfield 0 0% $ ‐ Stroud 976 19% $ 1,222,830 Grand Total 5,634 16% $ 6,038,240
Communications/Transportation/Utilities
Over 3,400 acres of the Study Area are classified as either communication, transportation, or utility land. Collectively, these parcels represent about ten percent of the Study Area. However, one company, the Pennsylvania American Water Company owns the majority of this land. Specifically, this company owns about 3,050 contiguous acres in Hamilton Township. This property remains largely undeveloped due to unfulfilled previous development plants. It is currently assessed by the county near $1.2 million.
Final Cherry Valley NWR Feasibility Study and EA Appendix D D‐17

Table 15. Communication/Transportation/Utility Lands Within the Cherry Valley National Wildlife Refuge Study Area, Monroe County, Pennsylvania
Municipality Acres % of Study Area
2007 Total
Assessment Chestnuthill 0% $ ‐ Delaware Water Gap 40 4% $ 181,520 Hamilton 3,121 20% $ 1,183,910 Ross 242 3% $ 118,630 Smithfield 34 1% $ 74,850 Stroud 7 0% $ 24,100 Grand Total 3,444 10% $ 1,583,010
Forestry
There are nearly 5,000 acres of land identified as forest parcels within the Study Area (Table 16). The majority of these parcels lie in Hamilton, Ross, and Stroud townships. Stroud Township has nearly 25 percent of its total Study Area acreage classified as forest. The ownership of these parcels is numerous. There are over 100 forest parcels, the majority of which are owned by individuals. Parcel sizes range from less than one acre to 150 acres. The average parcel size is 30 acres. Table 16. Forestry Lands Within the Cherry Valley National Wildlife Refuge Study Area, Monroe County, Pennsylvania.
Municipality Acres % of Study Area 2007 Total
Assessment Chestnuthill 235 16% $ 357,130 Delaware Water Gap 0% $ ‐ Hamilton 1,902 12% $ 2,435,690 Ross 1,302 16% $ 1,136,120 Smithfield 82 2% $ 111,250 Stround 1,357 27% $ 1,259,460 Grand Total 4,879 14% $ 5,299,650
Final Cherry Valley NWR Feasibility Study and EA Appendix D D‐18

Parklands
There are over 5,000 acres in the Study Area classified as parkland by Monroe County. This constitutes about 15 percent of the total Study Area. The U.S. Government owns nearly 4,000 acres of parkland parcels, most of which lie in Smithfield and Stroud townships. The Nature Conservancy is the second largest landowner of park parcels. They own about 400 acres within the Study Area. Other large landowners (i.e., greater than 100 acres) of parklands include the Commonwealth of Pennsylvania, the Pocono Heritage Land Trust, and Smithfield Township. Table 17. Parklands Within the Cherry Valley National Wildlife Refuge Study Area, Monroe County, Pennsylvania
Municipality Acres % of Study Area
2007 Total Assessment
Chestnuthill 145 10% $ 114,340 Delaware Water Gap 542 54% $ 312,630 Hamilton 1,970 13% $ 757,750 Ross 455 6% $ 198,810 Smithfield 1,551 40% $ 1,490,050 Stround 584 11% $ 519,380 Grand Total 5,248 15% $ 3,392,960
Vacant Lands
There are 789 parcels classified as vacant by Monroe County within the Study Area. In total, vacant parcels make up about 13 percent of the Study Area. Smithfield Township has the largest percentage of its Study Area acres classified as vacant. The largest parcels are located in Smithfield Township and Delaware Water Gap Borough and are owned by the Borough of Delaware Water Gap. These two adjacent parcels total 660 acres (512 acres and 148 acres, respectively) and are bounded by property owned by the U.S. National Park Service.
Final Cherry Valley NWR Feasibility Study and EA Appendix D D‐19

Final Cherry Valley NWR Feasibility Study and EA Appendix D D‐20
Table 18. Vacant Parcels Within the Cherry Valley National Wildlife Refuge Study Area, Monroe County, Pennsylvania.
Municipality Acres % of Study Area 2007 Total Assessment
Chestnuthill 177 12% $ 366,900 Delaware Water Gap 187 19% $ 413,240 Hamilton 1,266 8% $ 1,849,660 Ross 1,106 14% $ 609,340 Smithfield 1,234 32% $ 1,011,830 Stround 593 12% $ 550,630 Grand Total 4,563 13% $ 4,801,600
Figure 3, below, illustrates in greater detail the location of the parcels within the Study Area by specific land‐use.

Final Cherry Valley NWR Feasibility Study and EA Appendix D D‐21
Figure 3. Land Use by Parcel within the Cherry Valley National Wildlife Refuge Study Area, Monroe County, Pennsylvania.

Tax Revenue Impacts
Monroe County and its municipalities derive the majority of their tax revenues from real estate taxes. Real estate taxes fund school districts, libraries, and county and municipal government services. Monroe County uses millage to compute real estate taxes. Each mill represents one dollar in taxes for every $1,000 in value. Monroe County calculates current market value of property, for tax purposes, to be four times the current assessed value.9 The actual current market value of property in Monroe County, based on more recent real estate sales, is estimated at 7.81 times the current assessed value.10
Table 19 shows the total assessed value and calculated current market value (using the more accurate 7.81 multiplier) for all of the real estate parcels located within the Study Area. Current market value for all parcels is estimated to be $783 million based on a total assessment of $100.3 million. Total tax revenue on these properties is about $63.4 million. Table 19. Estimated 2008 Real Estate Tax Receipts For Parcels lying within the Cherry Valley National Wildlife Refuge Study Area, Monroe County, Pennsylvania.
Municipality 2007
AssessmentEstimated
Market Value12008
millage2Estimated Tax
Receipts3
Chestnuthill $ 5,661,630 $ 44,217,330 0.153 $ 3,464,918 Delaware Water Gap $ 7,577,090 $ 59,177,073 0.16835 $ 5,102,412 Hamilton $ 43,144,270 $ 336,956,749 0.15375 $ 26,533,726 Ross $ 15,634,190 $ 122,103,024 0.1505 $ 9,411,782 Smithfield $ 15,328,350 $ 119,714,414 0.16952 $ 10,393,848 Stroud $ 12,920,950 $ 100,912,620 0.16475 $ 8,514,906 Grand Total $ 100,266,480 $ 783,081,209 $ 63,421,592 1 Estimated current market value computed using State multiplier of 7.81 provided by Monroe County Planning Commission, June 2008. 2 Millage rates provided by Monroe County Assessors Office, September 2008. 3 Estimated tax receipts computed as follows: (2007 Assessment)* 4 * millage. The fiscal impact to Monroe County and its municipalities due to the establishment of a refuge will depend on both the quantity of land acquired and the rate at which it is acquired. While land owned by the U.S. Government is not taxable by state or local
9 Current assessed values are based on Monroe County’s last reassessment, conducted in 1988. 10 Source: Email from George Basila, Monroe County Planning Commission to Edward Maillett , U.S. Fish and Wildlife Service, “Assessment units ?” on 9 June 2008.
Final Cherry Valley NWR Feasibility Study and EA Appendix D D‐22

Final Cherry Valley NWR Feasibility Study and EA Appendix D D‐23
authorities, the federal government has a program in place to compensate local governments for foregone tax revenues. The Refuge System typically makes a revenue sharing payment, annually, to local governments. The payment made depends on the revenues that accrue to the Refuge System and the proportion of those revenues that are appropriated by Congress for revenue sharing purposes. In recent times, the payment has been less than what the government may have received through normal taxation. It should be noted that the property that is most highly assessed within the Study Area (e.g., residential, industrial, and retail) represent those parcels that have the least desirable characteristics, from a national wildlife refuge perspective. Table 20 shows the total breakdown of the current real estate assessment by land use. Open space parcels account for 21 percent of the total Study Area parcel assessments, while developed parcels account for the remaining 79 percent. This contrasts to the total acreage of open and developed space parcels, which accounted for nearly 70 and 30 percent of the total Study Area, respectively. Consequently, given the likelihood of limited funding and the fact that open space parcels would most likely be targeted, establishing a refuge will likely have minimal fiscal impact on the county and municipalities in the near future.

Table 20. Estimated Tax Receipts by Land Use Classification within the Cherry Valley National Wildlife Refuge Study Area, Monroe County, Pennsylvania.
Cherry Valley NWR Feasibility Study and EA Appendix D D‐24
Land Category Land Use
2007 Assessment
Percent of Grand Total Assessment
Current Market
Value1
Estimated Tax Receipts2
Agriculture $ 6,038,240 6.0% $ 47,158,654 $ 3,864,474 Communication/Transportation/Utilities $ 1,583,010 1.6% $ 12,363,308 $ 1,013,126 Forest $ 5,299,650 5.3% $ 41,390,267 $ 3,391,776 Public/Private Parks $ 3,392,960 3.4% $ 26,499,018 $ 2,171,494 Vacant $ 4,801,600 4.8% $ 37,500,496 $ 3,073,024 Open Space
Parcels subtotal $ 21,115,460 21.1% $ 164,911,743 $ 13,513,894 Hotels/Camps $ 8,752,530 8.7% $ 68,357,259 $ 5,601,619 Industrial $ 2,358,120 2.4% $ 18,416,917 $ 1,509,197 Residential $ 60,091,860 59.9% $ 469,317,427 $ 38,458,790 Retail/Services $ 5,128,190 5.1% $ 40,051,164 $ 3,282,042 Other $ 2,820,320 2.8% $ 22,026,699 $ 1,805,005 Developed
Parcels subtotal $ 79,151,020 78.9% $ 618,169,466 $ 50,656,653 Grand total $100,266,480 100.0% $ 783,081,209 $ 64,170,547
1 Estimated current market value computed using the state multiplier of 7.81. 3 Estimated tax receipts computed as follows: (2007 Assessment)* 4 * average millage rate of .160.
Final

Refuge – Related Impacts
The establishment and operation of a refuge will contribute to the local economy in terms of construction and maintenance expenditures and employment. In addition, the refuge will draw visitors that will spend locally on food, services, and lodging. However, it is not currently feasible to provide a reliable estimate of these economic impacts due to many uncertainties regarding the establishment, size, and operation of the refuge. The following section provides some ancillary information regarding how the establishment of a refuge may impact the local economy.
Visitor‐Related Impacts
Absent more detailed information regarding anticipated refuge budget for land acquisition and anticipated management, it is difficult to make any credible estimates regarding refuge visitation. It is anticipated that, should the refuge be established, visitors would be welcomed to enjoy traditional refuge‐related activities such as hunting, fishing, and wildlife viewing. Hunting and fishing on refuge property would still require a state license. Pennsylvania has always had a large segment of its population engaged in traditional outdoor activities. Many of these participants visit State Game Lands located in the northern part of Monroe County. The 2001 National Survey of Fishing, Hunting, and Wildlife‐Associated Recreation revealed that 4.6 million Pennsylvania residents and nonresidents 16 years old and older fished, hunted, or watched wildlife in Pennsylvania.11 Of the total number of participants, 1.3 million fished, 1 million hunted, and 3.8 million participated in wildlife‐watching activities, including observing, feeding, and photographing wildlife.12 In total, 1.8 million state residents and nonresidents fished or hunted in Pennsylvania. This group comprised 1.3 million anglers (71 percent of all participants) and one million hunters (56 percent of all participants). Among the 1.8 million people who fished or hunted in the state, 784 thousand (44 percent) fished but did not hunt in Pennsylvania. Another 517 thousand (29 percent) hunted but did not fish. The remaining 482 thousand (27 percent) fished and hunted in Pennsylvania in 2001. In 2001, state residents and nonresidents spent $3 billion on wildlife recreation in Pennsylvania. Of that total, trip‐related expenditures were $644 million and equipment purchases totaled $1.9 billion. The remaining $462 million was spent on licenses, contributions, land ownership and leasing, and other items and services.
11 2001 National Survey of Fishing, Hunting, and Wildlife‐Associated Recreation ‐ Pennsylvania, US Fish and Wildlife Service, February 2003. 12 The sum of anglers, hunters, and wildlife watchers exceeds the total number of participants in wildlife‐related recreation because many individuals engaged in more than one wildlife activity.
Final Cherry Valley NWR Feasibility Study and EA Appendix D D‐25

The 2001 survey reported that the average expenditure in Pennsylvania, per participant, was $582 for hunting, $321 for fishing, and $230 for wildlife watching. Table 21 shows the breakdown for each of these figures. Table 21. Pennsylvania Outdoor Recreation Expenditures for 2001.
Avg. Expenditures per Participant
Percent of Total
Hunting $ 582 100% Food and Lodging $ 104 18% Transportation $ 73 13% Other trip costs $ 13 2% Equipment $ 392 67% Fishing (freshwater, except Great Lakes) $ 321 100% Food and Lodging $ 96 30% Transportation $ 64 20% Other trip costs $ 70 22% Equipment $ 92 29% Wildlife Watching $ 230 100% Food and Lodging $ 80 35% Transportation $ 47 20% Other trip costs $ 8 3% Equipment $ 95 41% Source: 2001 National Survey of Fishing, Hunting, and Wildlife‐Associated Recreation ‐ Pennsylvania, US Fish and Wildlife Service, February 2003
Participation in Monroe County
Limited data exist to describe outdoor recreational activity in Monroe County. The Pennsylvania Game Commission does track hunting license sales in the county (Table 22). In 2006, over 7,000 resident adult hunting licenses were sold in the county. The Pennsylvania Fish and Boat Commission reports over 13,000 resident fishing licenses were sold in the county in 2006. These figures support the sense that Monroe County residents are active participants in traditional outdoor sports.
Final Cherry Valley NWR Feasibility Study and EA Appendix D D‐26

Table 22. Resident Hunting and Fishing License Sales for Monroe County, Pennsylvania in 2006.
Hunting Sales % of pop. Adult 7,011 4.2% Archery 2,356 1.4% Fur 1,653 1.0% Bear 2,001 1.2% Antlerless 9,965 6.0% Fishing 13,303 8.0% Source: Pennsylvania Game Commission, Pennsylvania Fish and Boat Commission
Final Cherry Valley NWR Feasibility Study and EA Appendix D D‐27

![Ashikaga Orihiñe shrine Cherry-Blossom Garden …...Cherry-Blossom Garden (Apr] Rhododendron Garden {May) Maple Valley (Nov) TEL 0284-22-8256 7 @ to.Mt.Gyodo to City Area Accessible](https://img.dokumen.tips/doc/110x75/5ee074ebad6a402d666ba2c4/ashikaga-orihie-shrine-cherry-blossom-garden-cherry-blossom-garden-apr-rhododendron.jpg)