Embed Size (px)
Citation preview
© Biohabitats, Inc. Rutgers Stormwater and Landscape Management Master Plan D-1
Runoff Vol.: 6.1 Ac-ft
Peak Runoff: 30.2 cfs
Runoff Vol.: 7.5 Ac-ft
Peak Runoff: 46.7 cfs
Rainfall Runoff (Volume 2.45792 US Mgal) Rainfall Runoff (Volume 1.98190 US Mgal)
1/1/1900 1/1/19001/2/1900 1/2/19001/3/1900 1/3/1900
Appendix D FUTURE CONDITIONS : STORMWATER MODELING
The objective of an analysis of future proposed conditions is to understand the hydrologic response due to changes in the land cover, typically associ-ated with an increase in impervious cover. The shift in hydrology then needs to be balanced with appropriate strategies that can meet stormwater management regulatory requirements (noted in Appendix C) while pro-viding functional and integrated landscapes on campus. Modeling Potential Benefit of Green Infrastructure RetrofitsTo illustrate the effectiveness and benefits of applying green infrastructure strategies, the integrated InfoWorks 1-D and 2-D models were reconfig-ured to characterize two potential retrofitting scenarios on campus. In the two examples below, the first example shows the volume reduction and associated water quality benefit of porous pavement, while the second example shows the benefit of providing underground detention in a high density area of campus.
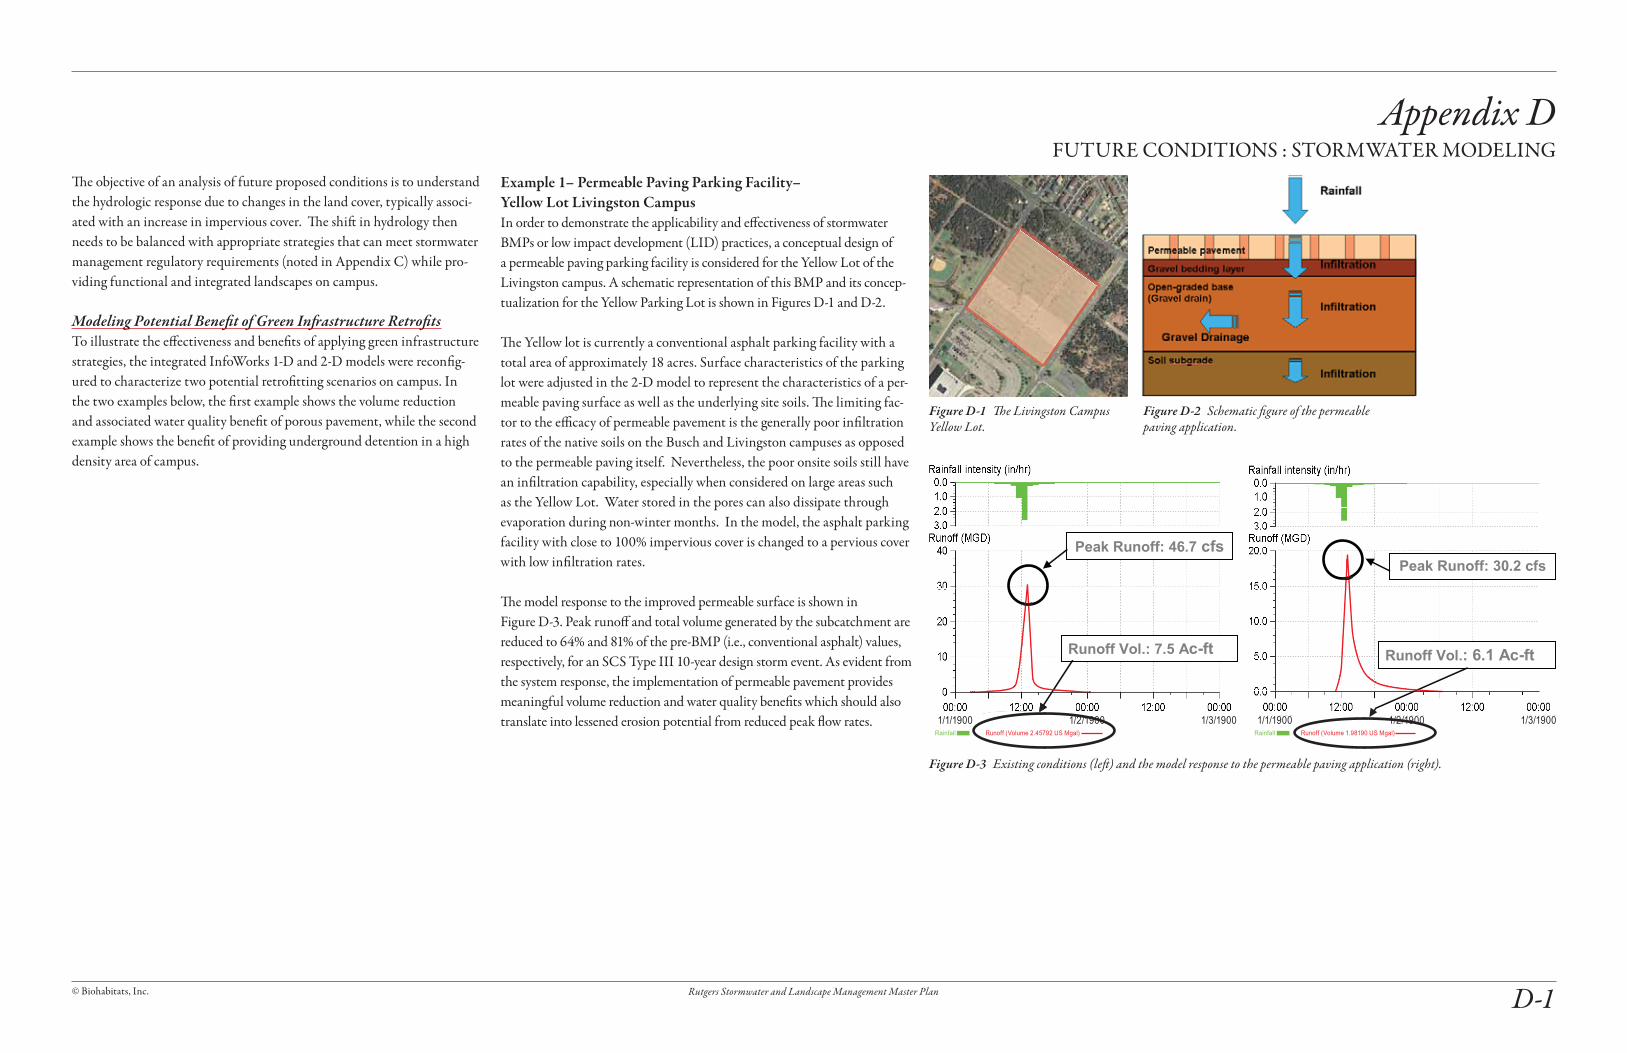
Example 1– Permeable Paving Parking Facility– Yellow Lot Livingston CampusIn order to demonstrate the applicability and effectiveness of stormwater BMPs or low impact development (LID) practices, a conceptual design of a permeable paving parking facility is considered for the Yellow Lot of the Livingston campus. A schematic representation of this BMP and its concep-tualization for the Yellow Parking Lot is shown in Figures D-1 and D-2.
The Yellow lot is currently a conventional asphalt parking facility with a total area of approximately 18 acres. Surface characteristics of the parking lot were adjusted in the 2-D model to represent the characteristics of a per-meable paving surface as well as the underlying site soils. The limiting fac-tor to the efficacy of permeable pavement is the generally poor infiltration rates of the native soils on the Busch and Livingston campuses as opposed to the permeable paving itself. Nevertheless, the poor onsite soils still have an infiltration capability, especially when considered on large areas such as the Yellow Lot. Water stored in the pores can also dissipate through evaporation during non-winter months. In the model, the asphalt parking facility with close to 100% impervious cover is changed to a pervious cover with low infiltration rates.
The model response to the improved permeable surface is shown in Figure D-3. Peak runoff and total volume generated by the subcatchment are reduced to 64% and 81% of the pre-BMP (i.e., conventional asphalt) values, respectively, for an SCS Type III 10-year design storm event. As evident from the system response, the implementation of permeable pavement provides meaningful volume reduction and water quality benefits which should also translate into lessened erosion potential from reduced peak flow rates.
Figure D-1 The Livingston Campus Yellow Lot.
Figure D-2 Schematic figure of the permeable paving application.
Figure D-3 Existing conditions (left) and the model response to the permeable paving application (right).

© Biohabitats, Inc.Rutgers Stormwater and Landscape Management Master PlanD-2
Example 2 – Storage Facility– Dining Hall Parking Lot Busch CampusThe Dining Hall area is an area that is known to frequently flood on the Busch campus. Currently there is a stormwater facility along the edge of the Dining Hall parking lot, along Bartholomew Road. (Figure D-4) Installation of underground storage facilities is one of the ways to mitigate nuisance flooding problems in high density areas that lack space for green infrastructure implementation. Underground storage facilities typically consist of large diameter pipes placed closely and parallel to each other, with the area above the pipes providing functions such as parking or play areas. During rainy periods, the flow is diverted to the storage facility and subsequently released slowly by providing a smaller diameter outlet pipe that limits the volume and rate of water exiting the storage area, effectively reducing peak flow from the contributing drainage area. The effective-ness of these detention facilities can be enhanced by using perforated pipe to promote exfiltration to the shallow groundwater thereby reducing the runoff volume. During large rain events, the flow in excess of the storage volume will be released through overflow pipes into the receiving waters.
For this example, the 2-D model was used to assess the benefits of a storage facility under the Dining Hall parking lot. A storage node with a capacity of two acre-feet was placed under the parking lot and the flows generated from the adjacent subcatchments were diverted into this facility. The outlet pipe diameter of this facility was set to 12 inches. The model with existing conditions and the model response resulting from implementation of this facility are shown in Figure D-5 and D-6 respectively. As evident in the figures, the area affected due to flooding is reduced significantly after this storage facility is incorporated.
Figure D-5 2-D model results of existing conditions.
Figure D-6 2-D model results with added storage facility under the Busch Dining Hall parking lot.
Figure D-4 The existing stormwater facility at the Busch Dining Hall.
© Biohabitats, Inc. Rutgers Stormwater and Landscape Management Master Plan D-3
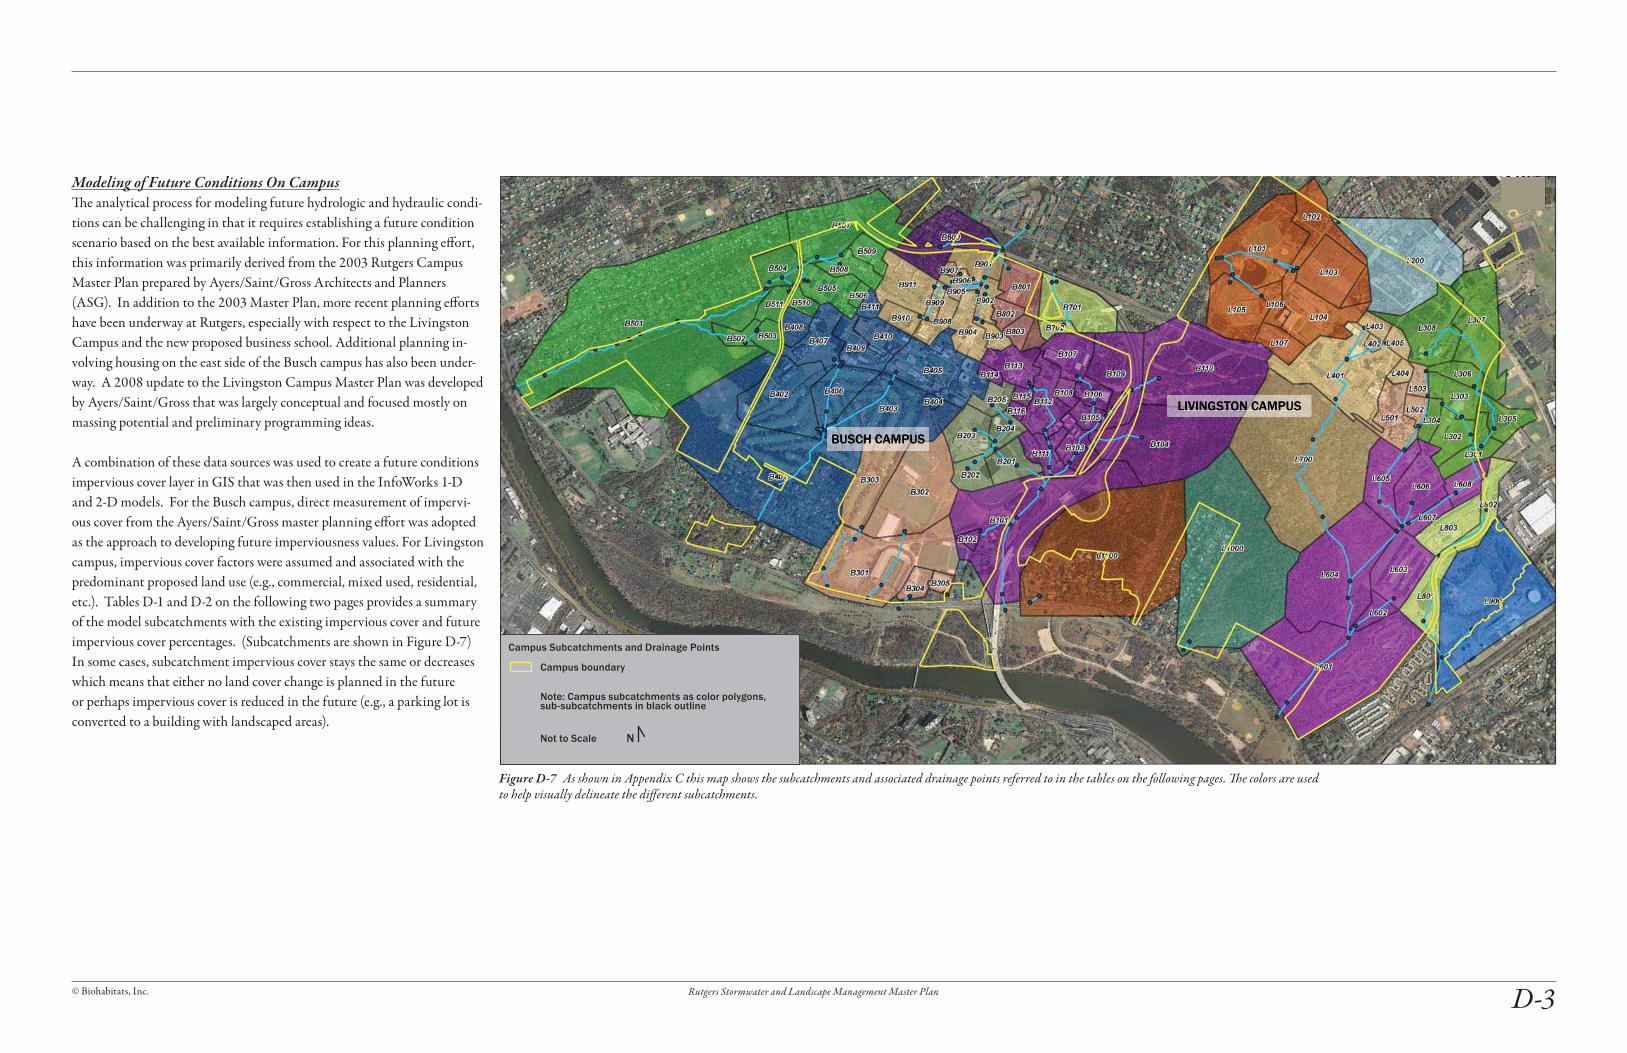
Modeling of Future Conditions On CampusThe analytical process for modeling future hydrologic and hydraulic condi-tions can be challenging in that it requires establishing a future condition scenario based on the best available information. For this planning effort, this information was primarily derived from the 2003 Rutgers Campus Master Plan prepared by Ayers/Saint/Gross Architects and Planners (ASG). In addition to the 2003 Master Plan, more recent planning efforts have been underway at Rutgers, especially with respect to the Livingston Campus and the new proposed business school. Additional planning in-volving housing on the east side of the Busch campus has also been under-way. A 2008 update to the Livingston Campus Master Plan was developed by Ayers/Saint/Gross that was largely conceptual and focused mostly on massing potential and preliminary programming ideas.
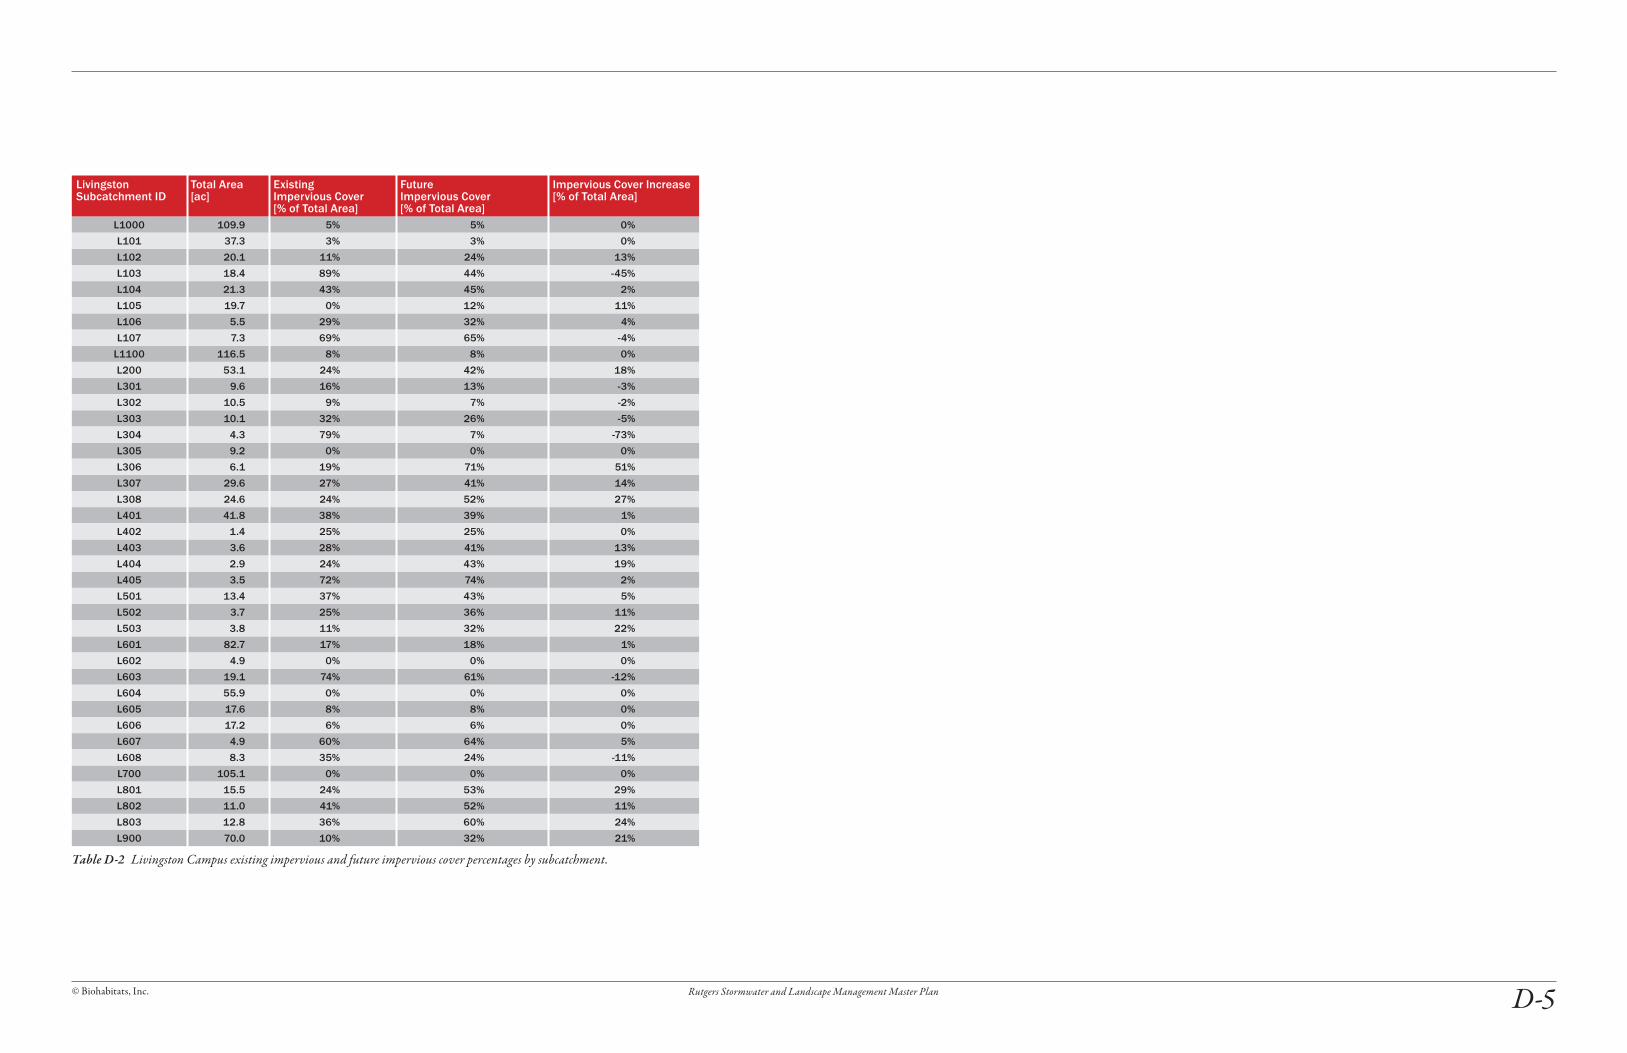
A combination of these data sources was used to create a future conditions impervious cover layer in GIS that was then used in the InfoWorks 1-D and 2-D models. For the Busch campus, direct measurement of impervi-ous cover from the Ayers/Saint/Gross master planning effort was adopted as the approach to developing future imperviousness values. For Livingston campus, impervious cover factors were assumed and associated with the predominant proposed land use (e.g., commercial, mixed used, residential, etc.). Tables D-1 and D-2 on the following two pages provides a summary of the model subcatchments with the existing impervious cover and future impervious cover percentages. (Subcatchments are shown in Figure D-7) In some cases, subcatchment impervious cover stays the same or decreases which means that either no land cover change is planned in the future or perhaps impervious cover is reduced in the future (e.g., a parking lot is converted to a building with landscaped areas).
Figure D-7 As shown in Appendix C this map shows the subcatchments and associated drainage points referred to in the tables on the following pages. The colors are used to help visually delineate the different subcatchments.
Campus boundary
Note: Campus subcatchments as color polygons, sub-subcatchments in black outline
Campus Subcatchments and Drainage Points
Not to Scale N
LILILILILILILILILILILILILILILILIILILILILLILLLLILILIL VIVIVIVIVIVVVIIVIVIVIVVIIVIVIVIVIVVIVIVIVIIIVVVVVVVVV NGNGNGNGNGNNGNGNGNGNGNGGNGNGGGGGNGNNGGNGNNNGNGNGNGGNGNN STSTSTSSTSTSTSTSTSSTSTSTSTSTSTSTSTSTSTSTSSTSTSSTSTSSTSTSTSSSSSTS ONONONONONONONONONNONONONONONONONONONONONOONONNNOONONNONOONONNONOONNNONNNNNNNNO CC CCCCCCCCC CCCC CCCCAMAMAAMAMAMAMMAMAMMMMMPUPUPUPUPUPUPUPUPPUPUPPP SSSSSSSSSSSLIVINGSTON CAMPUS
BUBUUUUUUBUBUBUBUBUBBUUUBUBBUBUBUUBUBUUUUBBUUBUBUUBBBUUBB SCSCSCSCSCSCSCSCSCSCCSCSCSCCCSCSCSCCCSCSCSSCSCSCSCSCSCSCSCCCSCSCSCSCCCCSCSCSSCCCS HHHHHHHHHHHHHHHHHHHHHHHHHHHHHHHHHHHHHHHHHHHHH H HHHH HHHHHHHHHHHHH CACCACACCACACACCCCCCCCAAACCCCCCCCCACACACCACACCAAACCCACCACCACCACCAACACACACCAAACCACACACACACAACAAAAAACAAAAAACAAACAAC MPMPMPMPMPMPMPPMPPMPMPMPMPPPMMPPMPMMPPPMPPPPPPPPPMPMPMPMPMPMPMMPPPMPMPMPMPPPMPMPMPMPMPMPPPPMMMMMMMPMPMMPPPPPPMPMPPMPMPMMMPMMMMMMPMPMPMPPMPPMMPPPMPPPPPPUSUSUSUSUSUSUSSSSUUUSUSUSUSUSUUUUSUUUSSUUSUSUSSSUUUSUSUUSUSUSUUUSUUSUSUSUUUUSUSUUUUSSUSUUUUUUUUUBUSCH CAMPUS

© Biohabitats, Inc.Rutgers Stormwater and Landscape Management Master PlanD-4
Busch Subcatchment ID
Total Area [ac]
Existing Impervious Cover [% of Total Area]
Future Impervious Cover [% of Total Area]
Impervious Cover Increase [% of Total Area]
B101 70.8 23% 23% 0%
B102 1.9 96% 92% -4%
B103 9.8 30% 30% 1%
B104 52.3 3% 3% 0%
B105 4.7 43% 34% -9%
B106 5.4 28% 28% 0%
B107 12.1 50% 44% -6%
B108 3.2 87% 35% -52%
B109 25.3 19% 30% 12%
B110 59.7 9% 41% 32%
B111 10.1 43% 50% 7%
B112 14.4 54% 42% -12%
B113 10.7 49% 69% 20%
B114 2.0 86% 58% -27%
B115 1.9 65% 15% -51%
B116 1.6 62% 21% -41%
B201 9.8 5% 1% -4%
B202 7.4 28% 29% 1%
B203 13.3 42% 51% 9%
B204 6.0 31% 58% 28%
B205 6.5 65% 52% -13%
B301 53.0 35% 34% -2%
B302 39.1 16% 16% 0%
B303 20.9 3% 3% 0%
B304 4.9 74% 65% -9%
B305 2.7 3% 6% 3%
B401 116.4 7% 7% 0%
B402 30.9 17% 12% -5%
B403 34.9 8% 6% -3%
B404 1.0 21% 24% 3%
B405 29.2 42% 49% 7%
B406 15.1 1% 1% 0%
B407 14.6 49% 52% 3%
B408 5.7 62% 89% 26%
B409 10.2 45% 51% 6%
B410 8.9 42% 46% 4%
B411 3.0 70% 31% -38%
B501 195.8 10% 10% 0%
B502 4.8 0% 0% 0%
B503 5.0 62% 78% 16%
B504 10.5 2% 2% 0%
B505 12.3 39% 35% -4%
B506 2.0 87% 75% -12%
B507 36.1 14% 14% 0%
B508 7.7 46% 42% -3%
B509 5.8 54% 68% 14%
B510 3.6 45% 44% 0%
B511 5.7 59% 59% 0%
B600 24.4 17% 17% 0%
B701 20.1 29% 26% -2%
B702 3.2 46% 78% 32%
B801 14.0 37% 62% 26%
B802 4.3 50% 51% 2%
B803 4.0 82% 37% -44%
B901 9.4 16% 34% 18%
B902 5.1 36% 44% 8%
B903 3.8 31% 45% 14%
B904 11.1 56% 64% 8%
B905 3.0 35% 42% 7%
B906 1.0 42% 76% 34%
B907 1.2 21% 28% 7%
B908 6.4 74% 71% -3%
B909 3.1 44% 75% 31%
B910 5.6 68% 67% 0%
B911 15.3 39% 51% 12%
Busch Subcatchment ID
Total Area [ac]
Existing Impervious Cover [% of Total Area]
Future Impervious Cover [% of Total Area]
Impervious Cover Increase [% of Total Area]
Table D-1 Busch Campus existing impervious and future impervious cover percentages by subcatchment.
© Biohabitats, Inc. Rutgers Stormwater and Landscape Management Master Plan D-5
Livingston Subcatchment ID
Total Area [ac]
Existing Impervious Cover [% of Total Area]
Future Impervious Cover [% of Total Area]
Impervious Cover Increase [% of Total Area]
L1000 109.9 5% 5% 0%
L101 37.3 3% 3% 0%
L102 20.1 11% 24% 13%
L103 18.4 89% 44% -45%
L104 21.3 43% 45% 2%
L105 19.7 0% 12% 11%
L106 5.5 29% 32% 4%
L107 7.3 69% 65% -4%
L1100 116.5 8% 8% 0%
L200 53.1 24% 42% 18%
L301 9.6 16% 13% -3%
L302 10.5 9% 7% -2%
L303 10.1 32% 26% -5%
L304 4.3 79% 7% -73%
L305 9.2 0% 0% 0%
L306 6.1 19% 71% 51%
L307 29.6 27% 41% 14%
L308 24.6 24% 52% 27%
L401 41.8 38% 39% 1%
L402 1.4 25% 25% 0%
L403 3.6 28% 41% 13%
L404 2.9 24% 43% 19%
L405 3.5 72% 74% 2%
L501 13.4 37% 43% 5%
L502 3.7 25% 36% 11%
L503 3.8 11% 32% 22%
L601 82.7 17% 18% 1%
L602 4.9 0% 0% 0%
L603 19.1 74% 61% -12%
L604 55.9 0% 0% 0%
L605 17.6 8% 8% 0%
L606 17.2 6% 6% 0%
L607 4.9 60% 64% 5%
L608 8.3 35% 24% -11%
L700 105.1 0% 0% 0%
L801 15.5 24% 53% 29%
L802 11.0 41% 52% 11%
L803 12.8 36% 60% 24%
L900 70.0 10% 32% 21%
Table D-2 Livingston Campus existing impervious and future impervious cover percentages by subcatchment.
© Biohabitats, Inc.Rutgers Stormwater and Landscape Management Master PlanD-6
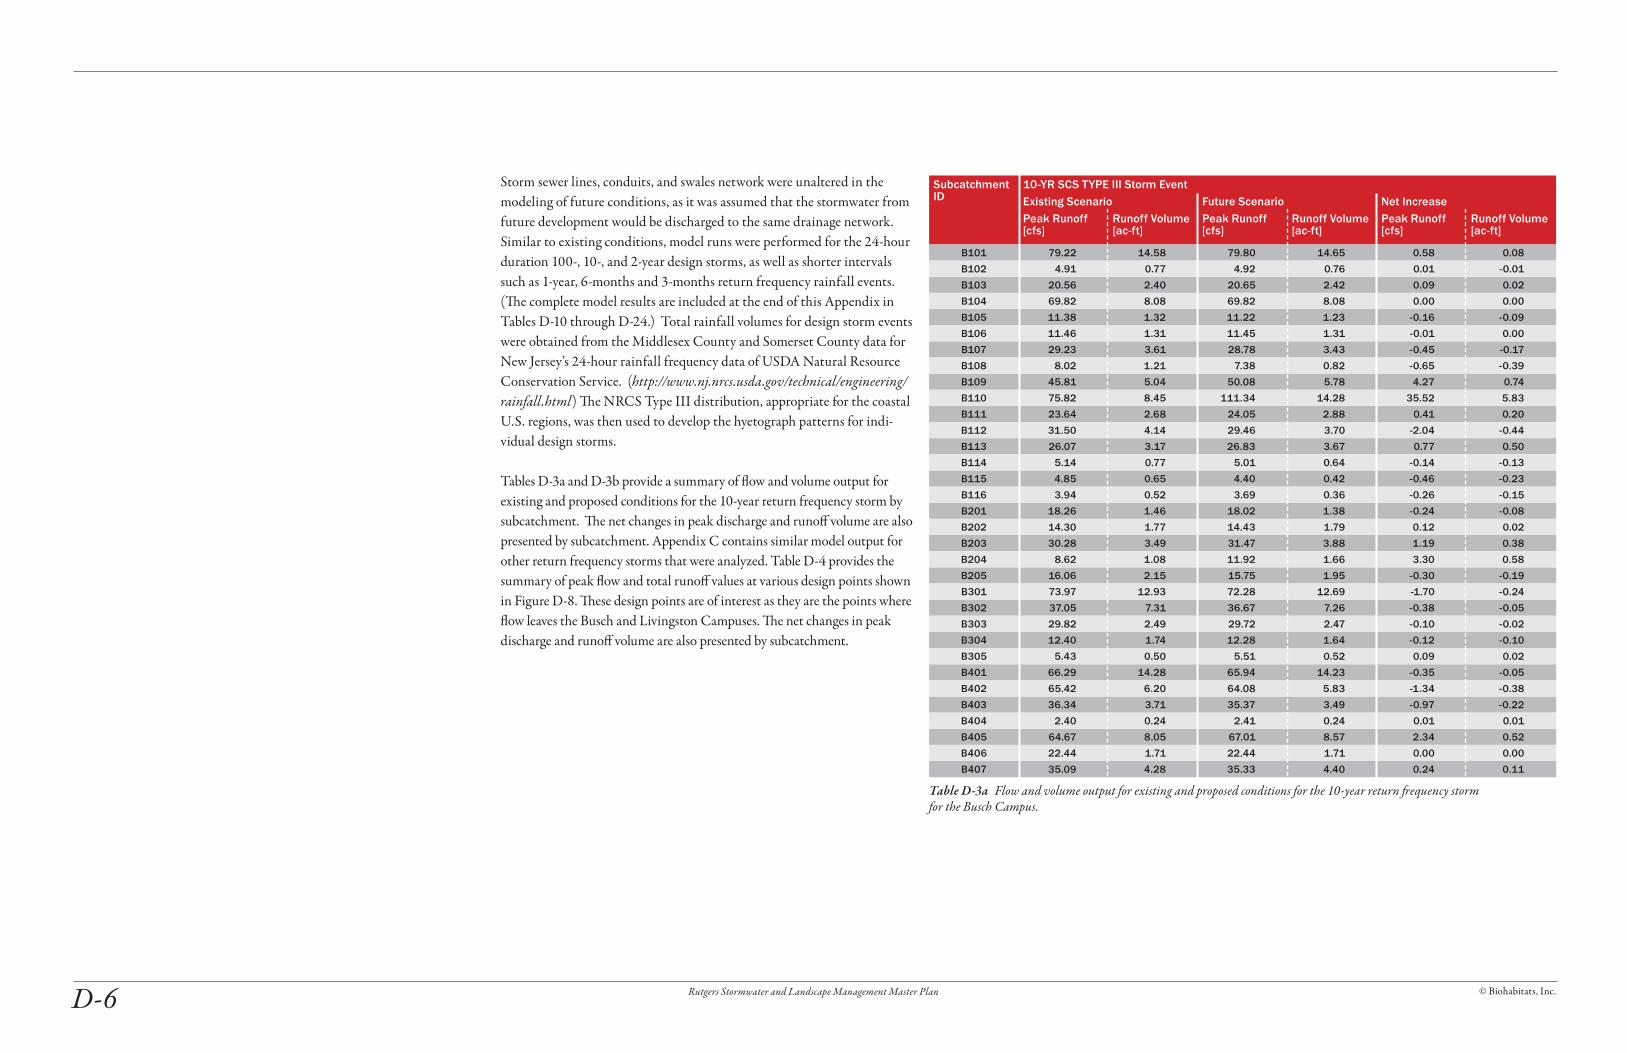
Storm sewer lines, conduits, and swales network were unaltered in the modeling of future conditions, as it was assumed that the stormwater from future development would be discharged to the same drainage network. Similar to existing conditions, model runs were performed for the 24-hour duration 100-, 10-, and 2-year design storms, as well as shorter intervals such as 1-year, 6-months and 3-months return frequency rainfall events. (The complete model results are included at the end of this Appendix in Tables D-10 through D-24.) Total rainfall volumes for design storm events were obtained from the Middlesex County and Somerset County data for New Jersey’s 24-hour rainfall frequency data of USDA Natural Resource Conservation Service. (http://www.nj.nrcs.usda.gov/technical/engineering/rainfall.html) The NRCS Type III distribution, appropriate for the coastal U.S. regions, was then used to develop the hyetograph patterns for indi-vidual design storms.
Tables D-3a and D-3b provide a summary of flow and volume output for existing and proposed conditions for the 10-year return frequency storm by subcatchment. The net changes in peak discharge and runoff volume are also presented by subcatchment. Appendix C contains similar model output for other return frequency storms that were analyzed. Table D-4 provides the summary of peak flow and total runoff values at various design points shown in Figure D-8. These design points are of interest as they are the points where flow leaves the Busch and Livingston Campuses. The net changes in peak discharge and runoff volume are also presented by subcatchment.
Subcatchment ID
10-YR SCS TYPE III Storm EventExisting Scenario Future Scenario Net IncreasePeak Runoff [cfs]
Runoff Volume [ac-ft]
Peak Runoff [cfs]
Runoff Volume [ac-ft]
Peak Runoff [cfs]
Runoff Volume [ac-ft]
B101 79.22 14.58 79.80 14.65 0.58 0.08
B102 4.91 0.77 4.92 0.76 0.01 -0.01
B103 20.56 2.40 20.65 2.42 0.09 0.02
B104 69.82 8.08 69.82 8.08 0.00 0.00
B105 11.38 1.32 11.22 1.23 -0.16 -0.09
B106 11.46 1.31 11.45 1.31 -0.01 0.00
B107 29.23 3.61 28.78 3.43 -0.45 -0.17
B108 8.02 1.21 7.38 0.82 -0.65 -0.39
B109 45.81 5.04 50.08 5.78 4.27 0.74
B110 75.82 8.45 111.34 14.28 35.52 5.83
B111 23.64 2.68 24.05 2.88 0.41 0.20
B112 31.50 4.14 29.46 3.70 -2.04 -0.44
B113 26.07 3.17 26.83 3.67 0.77 0.50
B114 5.14 0.77 5.01 0.64 -0.14 -0.13
B115 4.85 0.65 4.40 0.42 -0.46 -0.23
B116 3.94 0.52 3.69 0.36 -0.26 -0.15
B201 18.26 1.46 18.02 1.38 -0.24 -0.08
B202 14.30 1.77 14.43 1.79 0.12 0.02
B203 30.28 3.49 31.47 3.88 1.19 0.38
B204 8.62 1.08 11.92 1.66 3.30 0.58
B205 16.06 2.15 15.75 1.95 -0.30 -0.19
B301 73.97 12.93 72.28 12.69 -1.70 -0.24
B302 37.05 7.31 36.67 7.26 -0.38 -0.05
B303 29.82 2.49 29.72 2.47 -0.10 -0.02
B304 12.40 1.74 12.28 1.64 -0.12 -0.10
B305 5.43 0.50 5.51 0.52 0.09 0.02
B401 66.29 14.28 65.94 14.23 -0.35 -0.05
B402 65.42 6.20 64.08 5.83 -1.34 -0.38
B403 36.34 3.71 35.37 3.49 -0.97 -0.22
B404 2.40 0.24 2.41 0.24 0.01 0.01
B405 64.67 8.05 67.01 8.57 2.34 0.52
B406 22.44 1.71 22.44 1.71 0.00 0.00
B407 35.09 4.28 35.33 4.40 0.24 0.11
Table D-3a Flow and volume output for existing and proposed conditions for the 10-year return frequency storm for the Busch Campus.

© Biohabitats, Inc. Rutgers Stormwater and Landscape Management Master Plan D-7
B408 14.15 1.86 14.55 2.21 0.40 0.35
B409 24.68 2.91 24.91 3.06 0.23 0.15
B410 21.47 2.48 21.63 2.57 0.16 0.09
B411 7.57 1.04 7.26 0.77 -0.31 -0.27
B501 199.15 32.83 199.15 32.83 0.00 0.00
B502 10.03 0.76 10.03 0.76 0.00 0.00
B503 11.46 1.62 12.12 1.82 0.67 0.20
B504 15.24 1.22 15.21 1.21 -0.02 0.00
B505 28.45 3.15 28.06 3.00 -0.38 -0.15
B506 5.02 0.75 4.96 0.70 -0.06 -0.05
B507 61.32 6.92 61.40 6.94 0.09 0.01
B508 18.07 2.15 17.89 2.09 -0.18 -0.07
B509 14.02 1.77 14.36 1.96 0.34 0.19
B510 8.53 0.99 8.55 0.99 0.02 0.00
B511 13.84 1.76 13.84 1.76 0.01 0.00
B600 39.70 4.42 39.70 4.42 0.00 0.00
B701 37.92 4.10 37.44 3.98 -0.48 -0.12
B702 7.80 0.93 8.18 1.17 0.37 0.24
B801 27.47 3.58 29.04 4.48 1.57 0.89
B802 10.00 1.27 9.34 1.27 -0.67 0.00
B803 9.96 1.47 7.84 1.04 -2.12 -0.43
B901 11.36 1.23 15.17 1.85 3.81 0.62
B902 11.29 1.19 11.90 1.36 0.61 0.16
B903 8.37 0.96 8.90 1.09 0.54 0.13
B904 26.16 3.37 26.66 3.56 0.50 0.19
B905 6.37 0.68 6.49 0.74 0.12 0.05
B906 2.42 0.28 2.52 0.36 0.10 0.08
B907 2.73 0.27 2.74 0.29 0.01 0.01
B908 16.12 2.28 16.03 2.23 -0.09 -0.05
B909 7.32 0.87 7.71 1.09 0.40 0.22
B910 13.74 1.89 13.72 1.89 -0.01 0.00
B911 29.52 4.03 32.54 4.51 3.02 0.48
L1000 135.76 18.17 135.76 18.17 0.00 0.00
L101 47.60 5.53 47.54 5.52 -0.06 -0.01
L102 32.41 3.08 35.98 3.81 3.57 0.72
L103 45.32 6.96 32.57 4.15 -12.75 -2.81
L104 46.77 5.59 47.47 5.75 0.71 0.17
L105 15.17 2.06 20.29 2.78 5.12 0.72
L106 9.79 1.21 10.17 1.28 0.38 0.07
L107 16.60 2.45 16.30 2.38 -0.30 -0.06
L1100 149.10 21.24 149.10 21.24 0.00 0.00
L200 77.24 9.33 94.87 12.38 17.62 3.05
L301 13.12 1.67 12.48 1.59 -0.63 -0.09
L302 19.47 2.04 19.21 1.99 -0.26 -0.05
L303 23.16 2.56 22.76 2.43 -0.40 -0.13
L304 10.79 1.56 9.25 0.83 -1.54 -0.73
L305 9.40 0.96 9.40 0.96 0.00 0.00
L306 13.29 1.37 15.30 2.11 2.01 0.75
L307 55.18 6.79 61.71 7.88 6.52 1.09
L308 44.88 5.65 54.90 7.32 10.01 1.67
L401 82.91 10.77 84.11 10.86 1.20 0.10
L402 3.26 0.34 3.26 0.34 0.00 0.00
L403 8.14 0.88 8.51 0.99 0.37 0.12
L404 6.58 0.68 6.91 0.81 0.32 0.13
L405 8.81 1.22 8.83 1.24 0.02 0.02
L501 28.64 3.50 29.44 3.68 0.80 0.18
L502 8.28 0.89 8.64 0.99 0.35 0.10
L503 8.30 0.78 8.89 0.97 0.59 0.20
L601 106.80 16.65 108.65 16.89 1.86 0.24
L602 10.65 0.83 10.65 0.83 0.00 0.00
L603 47.64 6.71 46.54 6.16 -1.10 -0.55
L604 50.84 8.73 50.84 8.73 0.00 0.00
L605 33.86 3.27 33.86 3.27 0.00 0.00
L606 30.61 3.24 30.60 3.24 -0.02 0.00
L607 12.08 1.57 12.18 1.62 0.10 0.06
L608 14.68 1.90 13.13 1.67 -1.56 -0.23
L700 114.84 12.61 114.84 12.61 0.00 0.00
L801 29.34 2.94 34.69 4.29 5.36 1.36
L802 19.66 2.65 21.48 3.00 1.82 0.35
L803 24.75 3.23 28.95 4.02 4.20 0.79
L900 52.05 10.74 84.23 15.33 32.18 4.59
Subcatchment ID
10-YR SCS TYPE III Storm Event
Existing Scenario Future Scenario Net Increase
Peak Runoff [cfs]
Runoff Volume [ac-ft]
Peak Runoff [cfs]
Runoff Volume [ac-ft]
Peak Runoff [cfs]
Runoff Volume [ac-ft]
Table D-3a (continued)
Subcatchment ID
10 YR SCS TYPE III Storm Event
Existing Scenario Future Scenario Net Increase
Peak Runoff [cfs]
Runoff Volume [ac-ft]
Peak Runoff [cfs]
Runoff Volume [ac-ft]
Peak Runoff [cfs]
Runoff Volume [ac-ft]
Table D-3b Flow and volume output for existing and proposed conditions for the 10-year return frequency storm for the Livingston Campus.

© Biohabitats, Inc.Rutgers Stormwater and Landscape Management Master PlanD-8
The following observations are made based on the values seen for the 10-year 24-hour design storm. As expected, the peak discharge and overall stormwater runoff volume generated increased in subcatchments where there is a projected increase in impervious cover. In general, increases are more significant in the subcatchments of the Livingston campus where the growth rate will be significant (e.g., associated with the residential housing and business school development).
It is interesting to note that flow and volume increases are not as pro-nounced as one might expect due to the NRCS soil types found on the Rutgers campuses and surrounding areas. Specifically, the majority of the soils on the Busch and Livingston campuses are categorized as hydrologi-cally poor soils, or hydrologic soil groups (HSG) C and D. The infiltration capacities of these soils are limited; therefore, these areas can generate sig-nificant amounts of runoff after the initial hydrologic losses are met, even in the absence of development. New development (buildings) occurring on such soils results in smaller variation in the peak flow and volume when comparing existing conditions to the future conditions. This is particu-larly evident for larger storms, such as the 10-year and 100-year events.
It is also important to evaluate the modeling output for existing and future conditions at both subcatchment and catchment scales. While the future conditions runoff peak rates and volume can increase from the existing conditions at some subcatchments, the reductions in impervious cover in other tributary subcatchments can lead to similar or even lower overall ac-cumulated flooding conditions at the downstream creeks and swale sections under future conditions. This system response can be seen in both Busch and Livingston campuses’ catchments, since the 2003 Master Plan proposes replacing surface parking lots with parking structures so that there is a net increase in open space in some subcatchments. For example, the increased peak flow due to higher imperviousness in subcatchments L102 and L105 in future condition is balanced by the imperviousness reductions in subcatch-ments L103 within catchment L1. As reported in Table D-3 (previous pages), the peak flow increases for subcatchments L102 and L105 (3.57 cfs and 5.12 cfs, respectively) are balanced by a decrease of 12.57 cfs in peak flow value in subcatchment L103. Overall, there is a reduction of 7 cfs in peak flow at the design point L1, as stated in Table D-4 (in red, bold type). Catchments and design points are shown in Figure D-8.
Table D-4 Existing and future peak flows by catchment for Busch and Livingston Campuses.
Catchment Existing Future Comments
Peak Flow [Cfs]
Runoff Volume [Ac-Ft]
Peak Flow [Cfs]
Runoff Volume [Ac-Ft]
Busch CampusB1 389 66 423 71 Includes flow generated in
tributary catchment B2
B2 79 10 82 10
B3a 27 2 27 2 West to East - First Discharge Point
B3b 136 21 134 21 West to East - Second Discharge Point
B3c 12 2 12 2 West to East - Third Discharge Point
B3d 6 1 6 1 West to East - Fourth Discharge Point
B4 293 47 293 47
B5 293 52 292 51
B6 41 4 41 4 Includes flow generated in tributary catchments L3, L4, L5, L7
B7 43 5 43 5 Includes flow generated in tributary catchment L4
B8 49 6 50 7
B9 127 17 136 19
B6789* 221 32 238 35 Combined flow from Catchments B6, B7, B8, B9
Livingston Campus
L1 186 26 179 25 Difference of 7 cfs in peak flow
L2 78 9 96 12
L3 148 22 169 24
L4 102 14 105 14
L5 41 5 44 6
L6 463 89 485 91
L7 172 25 175 26
L8 72 9 85 11
L9 89 12 121 16
L89* 144 20 192 27 Combined flow from Catchments L8, L9
L10 112 17 112 17
L11 117 20 117 20
* - Total volume from the contributing catchments may not match the total flow because of model rounding errors

© Biohabitats, Inc. Rutgers Stormwater and Landscape Management Master Plan D-9
Figure D-8 Catchments and design points used to calculate peak flows.
Campus boundary
Note: Campus subcatchments as color polygons
Campus Subcatchments and Drainage Points
Not to Scale N
LILIL VIVIVINGNGN STSTTONON CCCCCAMAMPUPUSLIVINGSTON CAMPUS
BUBUBUB SCSCSCSS H H H H CACACACAMPMPMPMPUSUSUSBUSCH CAMPUS
© Biohabitats, Inc.Rutgers Stormwater and Landscape Management Master PlanD-10
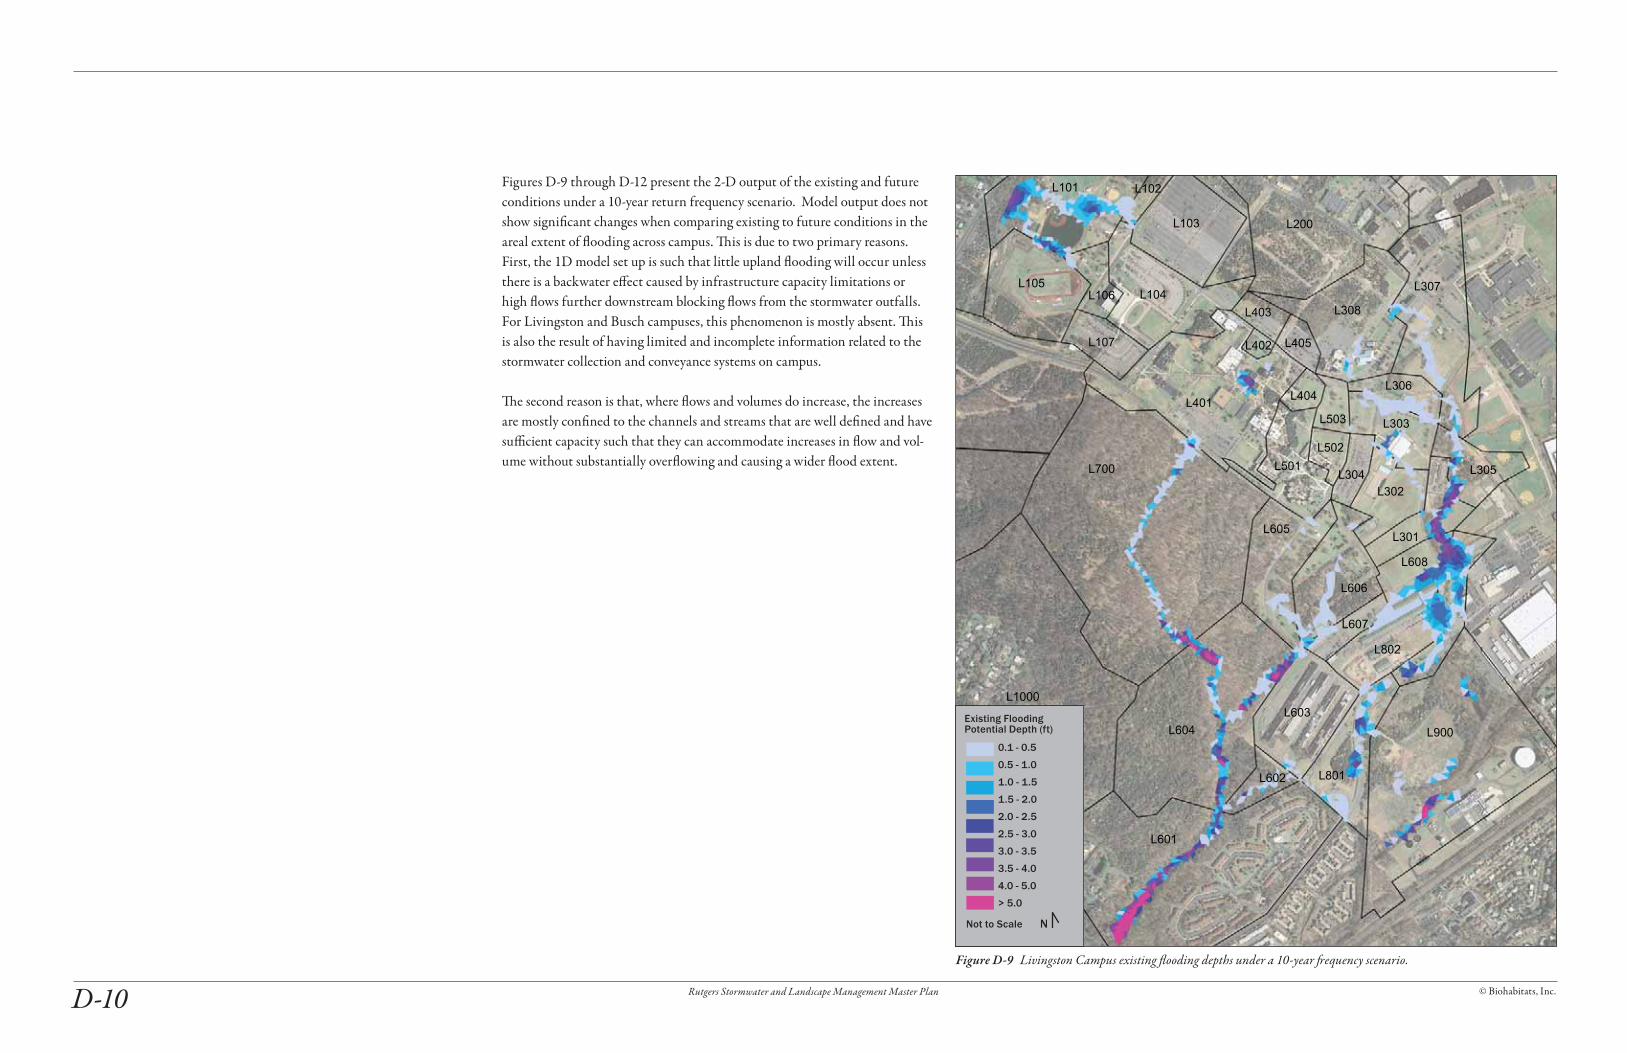
Figures D-9 through D-12 present the 2-D output of the existing and future conditions under a 10-year return frequency scenario. Model output does not show significant changes when comparing existing to future conditions in the areal extent of flooding across campus. This is due to two primary reasons. First, the 1D model set up is such that little upland flooding will occur unless there is a backwater effect caused by infrastructure capacity limitations or high flows further downstream blocking flows from the stormwater outfalls. For Livingston and Busch campuses, this phenomenon is mostly absent. This is also the result of having limited and incomplete information related to the stormwater collection and conveyance systems on campus.
The second reason is that, where flows and volumes do increase, the increases are mostly confined to the channels and streams that are well defined and have sufficient capacity such that they can accommodate increases in flow and vol-ume without substantially overflowing and causing a wider flood extent.
Figure D-9 Livingston Campus existing flooding depths under a 10-year frequency scenario.
L101 L102
L103
L104L105
L106
L107
L700
L200
L301
L302
L303
L304 L305
L306
L307
L308
L401
L402
L403
L404
L405
L501L502
L503
L601
L602
L603L604
L605
L606
L607
L608
L801
L802
L900
L1000
Not to Scale N
0.1 - 0.5
0.5 - 1.0
1.0 - 1.5
1.5 - 2.0
2.0 - 2.5
2.5 - 3.0
3.0 - 3.5
3.5 - 4.0
4.0 - 5.0
> 5.0
Existing Flooding Potential Depth (ft)
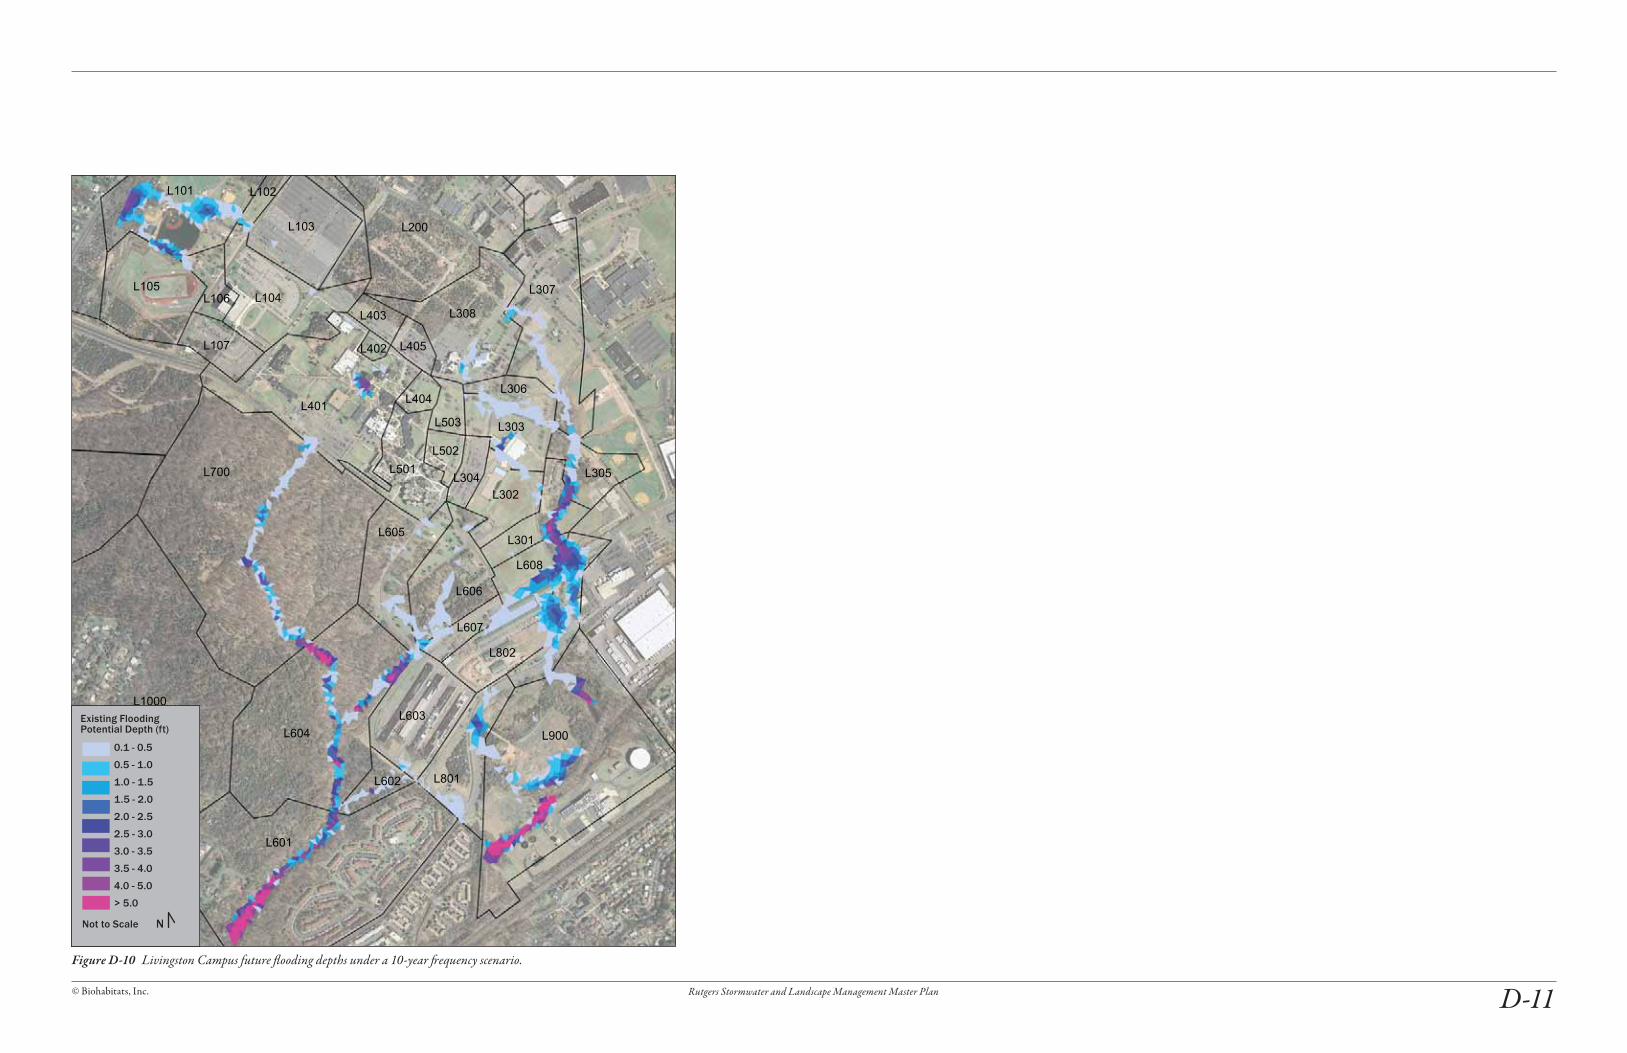
© Biohabitats, Inc. Rutgers Stormwater and Landscape Management Master Plan D-11Figure D-10 Livingston Campus future flooding depths under a 10-year frequency scenario.
L101 L102
L103
L104L105
L106
L107
L700
L200
L301
L302
L303
L304 L305
L306
L307
L308
L401
L402
L403
L404
L405
L501L502
L503
L601
L602
L603L604
L605
L606
L607
L608
L801
L802
L900
L1000
Not to Scale N
0.1 - 0.5
0.5 - 1.0
1.0 - 1.5
1.5 - 2.0
2.0 - 2.5
2.5 - 3.0
3.0 - 3.5
3.5 - 4.0
4.0 - 5.0
> 5.0
Existing Flooding Potential Depth (ft)
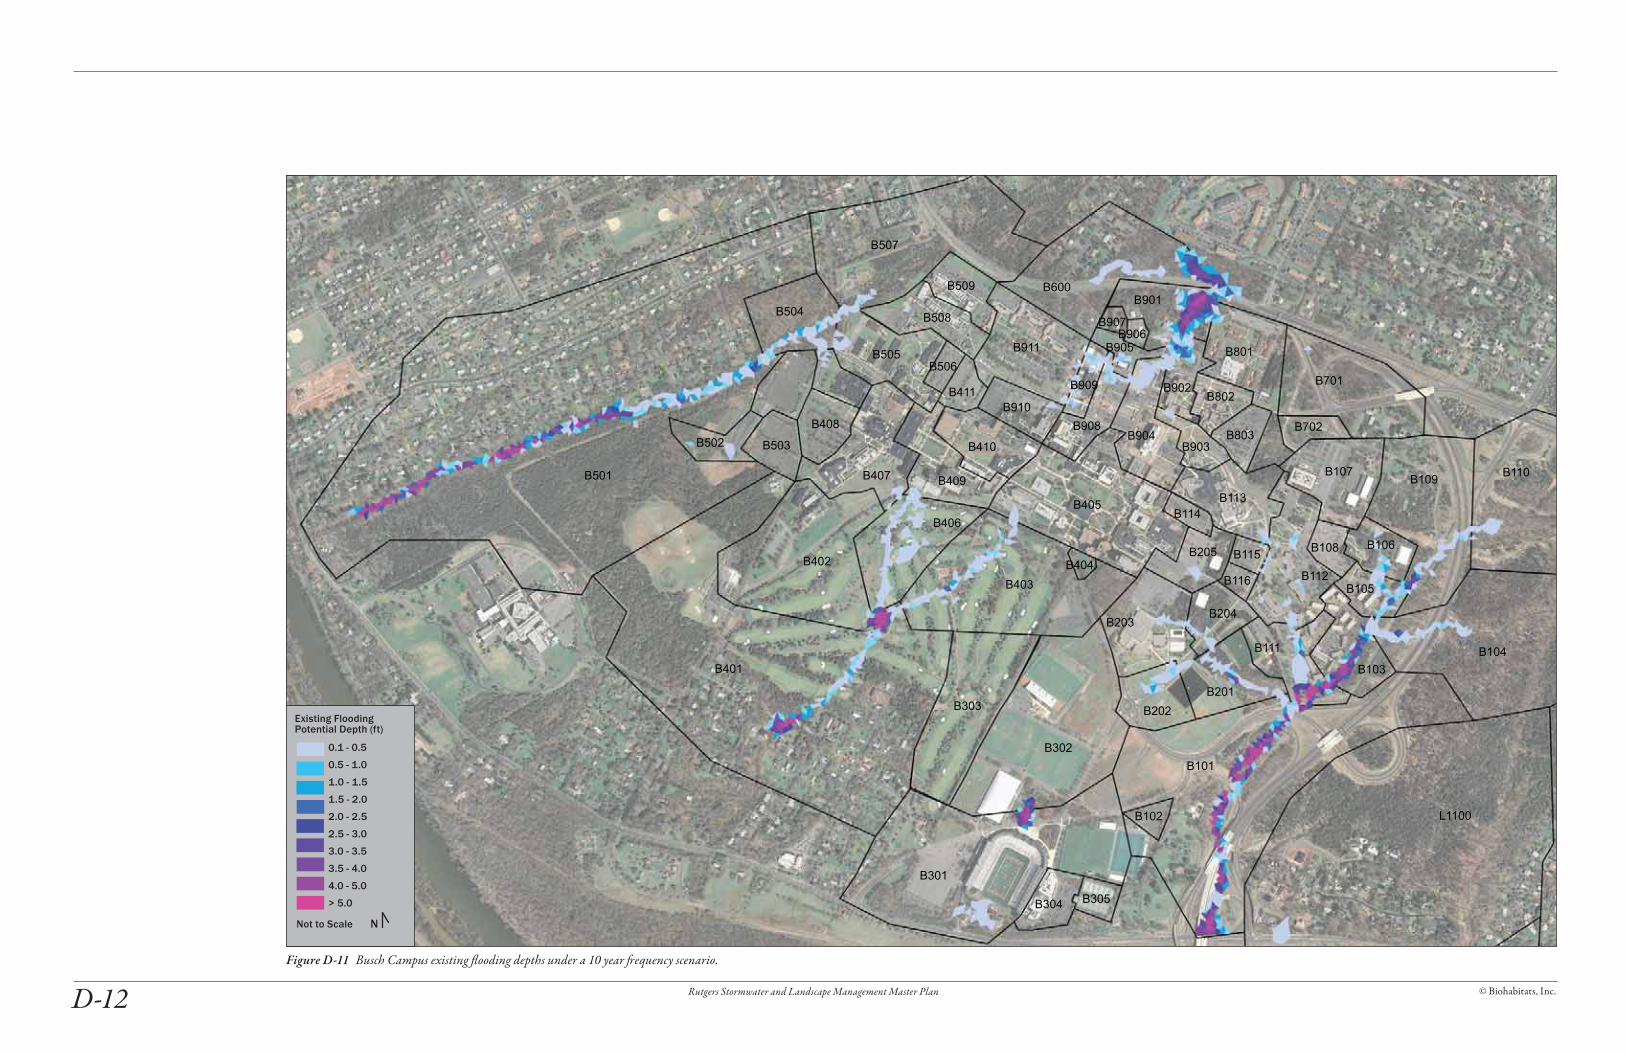
© Biohabitats, Inc.Rutgers Stormwater and Landscape Management Master PlanD-12Figure D-11 Busch Campus existing flooding depths under a 10 year frequency scenario.
B101
B102
B103B104
B105
B106
B107
B108
B109 B110
B111
B112
B201B202
B203B204
B205
B113B114
B115
B116
B301
B302
B303
B304 B305
B402
B401
B403B404
B405B406
B407
B408
B409
B410
B411
B501
B502 B503
B504
B505B506
B507
B508
B509 B600
B701
B702
B801
B802
B803
B901
B902
B903B904
B905B906
B907
B908
B909
B910
B911
L1100
Not to Scale N
0.1 - 0.5
0.5 - 1.0
1.0 - 1.5
1.5 - 2.0
2.0 - 2.5
2.5 - 3.0
3.0 - 3.5
3.5 - 4.0
4.0 - 5.0
> 5.0
Existing Flooding Potential Depth (ft)

© Biohabitats, Inc. Rutgers Stormwater and Landscape Management Master Plan D-13Figure D-12 Busch Campus future flooding depths under a 10 year frequency scenario.
B101
B102
B103B104
B105
B106
B107
B108
B109 B110
B111
B112
B201B202
B203B204
B205
B113B114
B115
B116
B301
B302
B303
B304 B305
B402
B401
B403B404
B405B406
B407
B408
B409
B410
B411
B501
B502 B503
B504
B505B506
B507
B508
B509 B600
B701
B702
B801
B802
B803
B901
B902
B903B904
B905B906
B907
B908
B909
B910
B911
L1100
Not to Scale N
0.1 - 0.5
0.5 - 1.0
1.0 - 1.5
1.5 - 2.0
2.0 - 2.5
2.5 - 3.0
3.0 - 3.5
3.5 - 4.0
4.0 - 5.0
> 5.0
Existing Flooding Potential Depth (ft)
© Biohabitats, Inc.Rutgers Stormwater and Landscape Management Master PlanD-14
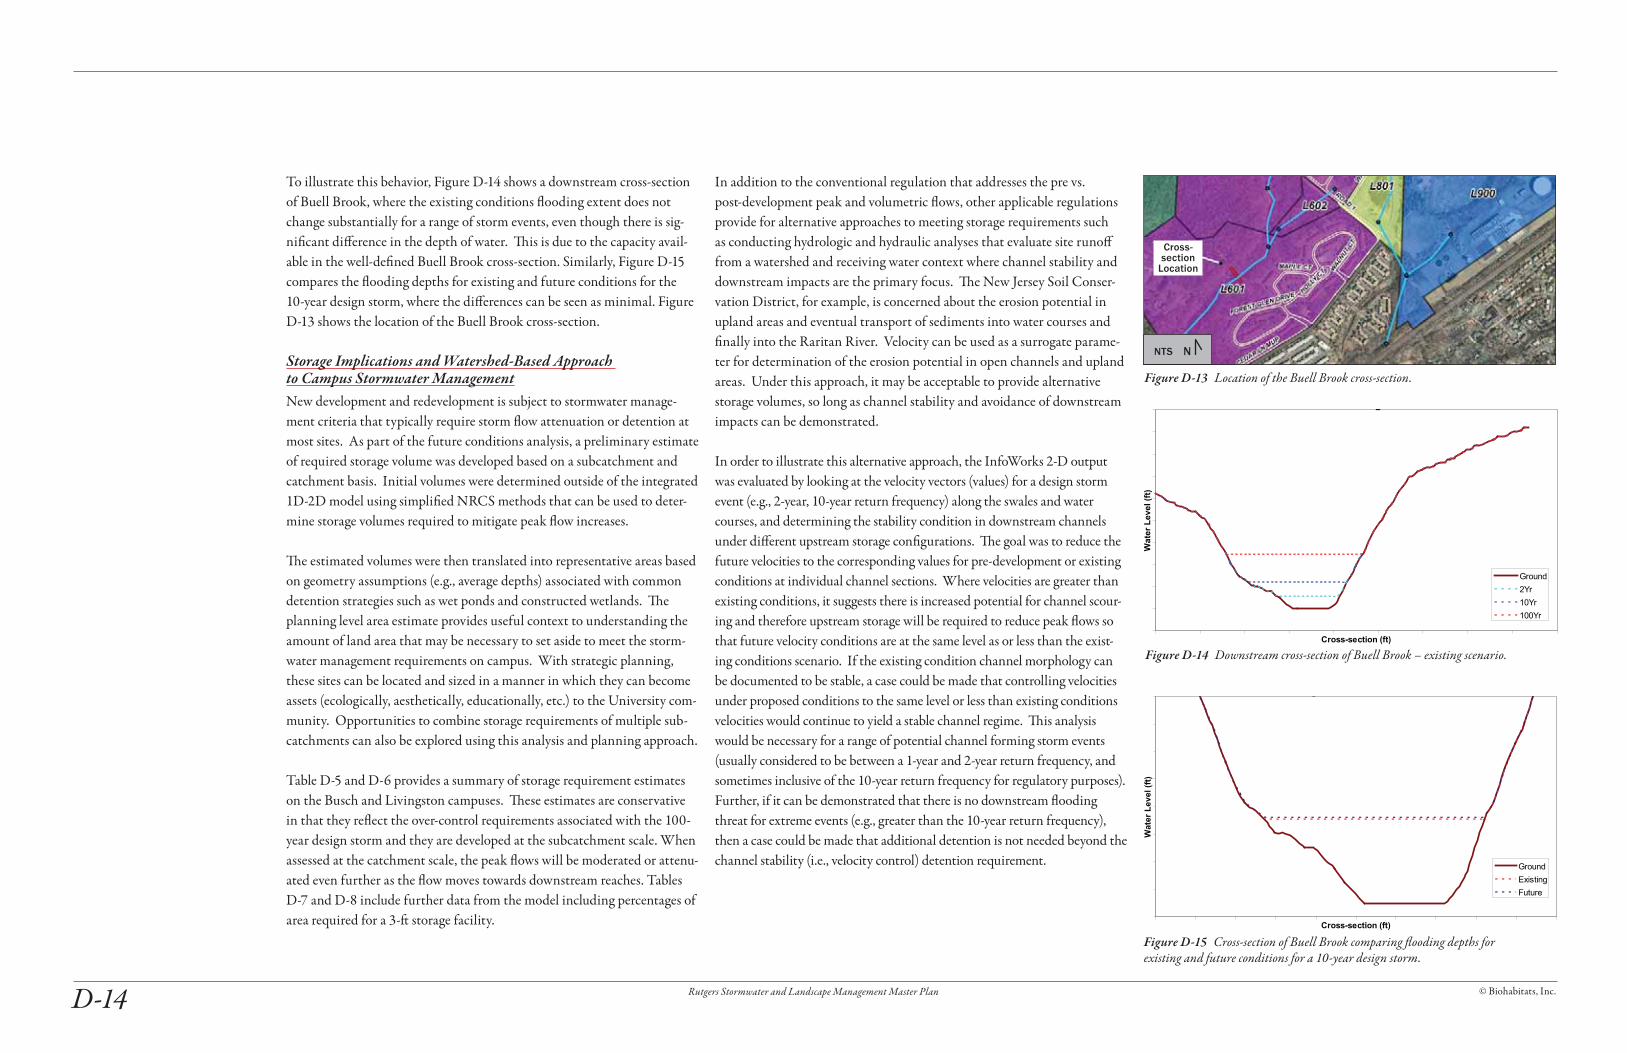
To illustrate this behavior, Figure D-14 shows a downstream cross-section of Buell Brook, where the existing conditions flooding extent does not change substantially for a range of storm events, even though there is sig-nificant difference in the depth of water. This is due to the capacity avail-able in the well-defined Buell Brook cross-section. Similarly, Figure D-15 compares the flooding depths for existing and future conditions for the 10-year design storm, where the differences can be seen as minimal. Figure D-13 shows the location of the Buell Brook cross-section.
Storage Implications and Watershed-Based Approach to Campus Stormwater ManagementNew development and redevelopment is subject to stormwater manage-ment criteria that typically require storm flow attenuation or detention at most sites. As part of the future conditions analysis, a preliminary estimate of required storage volume was developed based on a subcatchment and catchment basis. Initial volumes were determined outside of the integrated 1D-2D model using simplified NRCS methods that can be used to deter-mine storage volumes required to mitigate peak flow increases.
The estimated volumes were then translated into representative areas based on geometry assumptions (e.g., average depths) associated with common detention strategies such as wet ponds and constructed wetlands. The planning level area estimate provides useful context to understanding the amount of land area that may be necessary to set aside to meet the storm-water management requirements on campus. With strategic planning, these sites can be located and sized in a manner in which they can become assets (ecologically, aesthetically, educationally, etc.) to the University com-munity. Opportunities to combine storage requirements of multiple sub-catchments can also be explored using this analysis and planning approach.
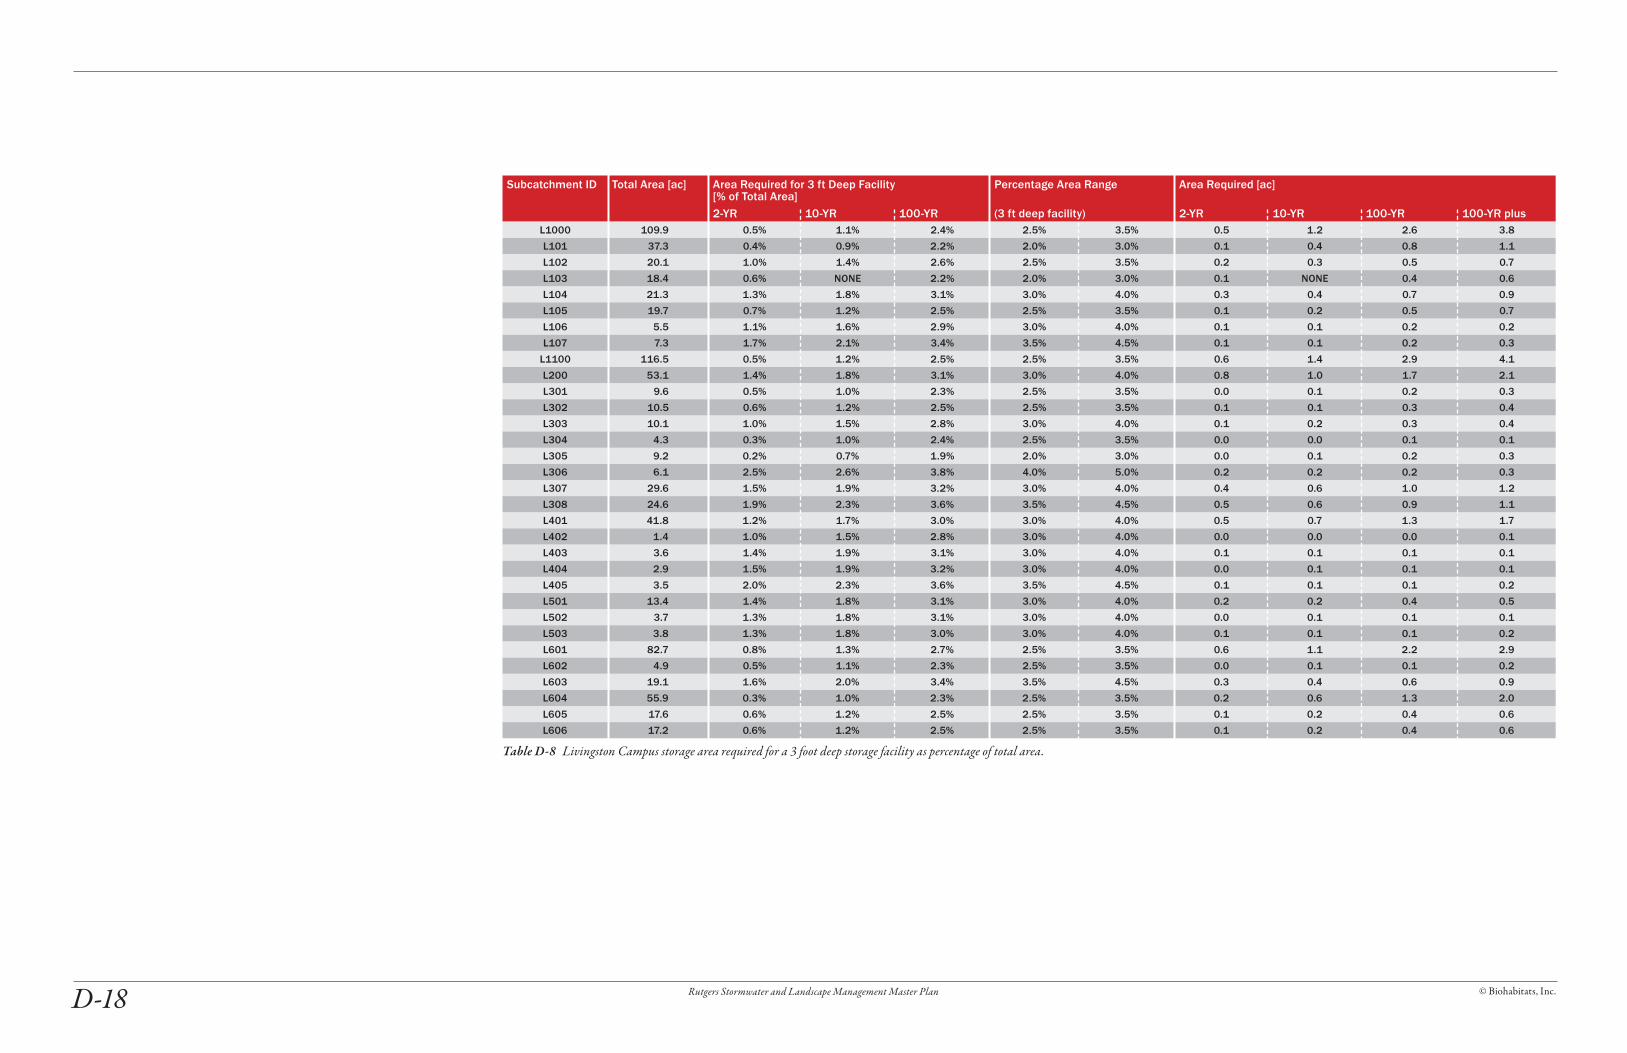
Table D-5 and D-6 provides a summary of storage requirement estimates on the Busch and Livingston campuses. These estimates are conservative in that they reflect the over-control requirements associated with the 100-year design storm and they are developed at the subcatchment scale. When assessed at the catchment scale, the peak flows will be moderated or attenu-ated even further as the flow moves towards downstream reaches. Tables D-7 and D-8 include further data from the model including percentages of area required for a 3-ft storage facility.
In addition to the conventional regulation that addresses the pre vs. post-development peak and volumetric flows, other applicable regulations provide for alternative approaches to meeting storage requirements such as conducting hydrologic and hydraulic analyses that evaluate site runoff from a watershed and receiving water context where channel stability and downstream impacts are the primary focus. The New Jersey Soil Conser-vation District, for example, is concerned about the erosion potential in upland areas and eventual transport of sediments into water courses and finally into the Raritan River. Velocity can be used as a surrogate parame-ter for determination of the erosion potential in open channels and upland areas. Under this approach, it may be acceptable to provide alternative storage volumes, so long as channel stability and avoidance of downstream impacts can be demonstrated.
In order to illustrate this alternative approach, the InfoWorks 2-D output was evaluated by looking at the velocity vectors (values) for a design storm event (e.g., 2-year, 10-year return frequency) along the swales and water courses, and determining the stability condition in downstream channels under different upstream storage configurations. The goal was to reduce the future velocities to the corresponding values for pre-development or existing conditions at individual channel sections. Where velocities are greater than existing conditions, it suggests there is increased potential for channel scour-ing and therefore upstream storage will be required to reduce peak flows so that future velocity conditions are at the same level as or less than the exist-ing conditions scenario. If the existing condition channel morphology can be documented to be stable, a case could be made that controlling velocities under proposed conditions to the same level or less than existing conditions velocities would continue to yield a stable channel regime. This analysis would be necessary for a range of potential channel forming storm events (usually considered to be between a 1-year and 2-year return frequency, and sometimes inclusive of the 10-year return frequency for regulatory purposes). Further, if it can be demonstrated that there is no downstream flooding threat for extreme events (e.g., greater than the 10-year return frequency), then a case could be made that additional detention is not needed beyond the channel stability (i.e., velocity control) detention requirement.
Figure D-14 Downstream cross-section of Buell Brook – existing scenario.
g
Cross-section (ft)
Wat
er L
evel
(ft)
GroundExistingFuture
Figure D-15 Cross-section of Buell Brook comparing flooding depths for existing and future conditions for a 10-year design storm.
Figure D-13 Location of the Buell Brook cross-section.
Cross-section
Location
NTS N
g
Cross-section (ft)
Wat
er L
evel
(ft)
Ground2Yr10Yr100Yr
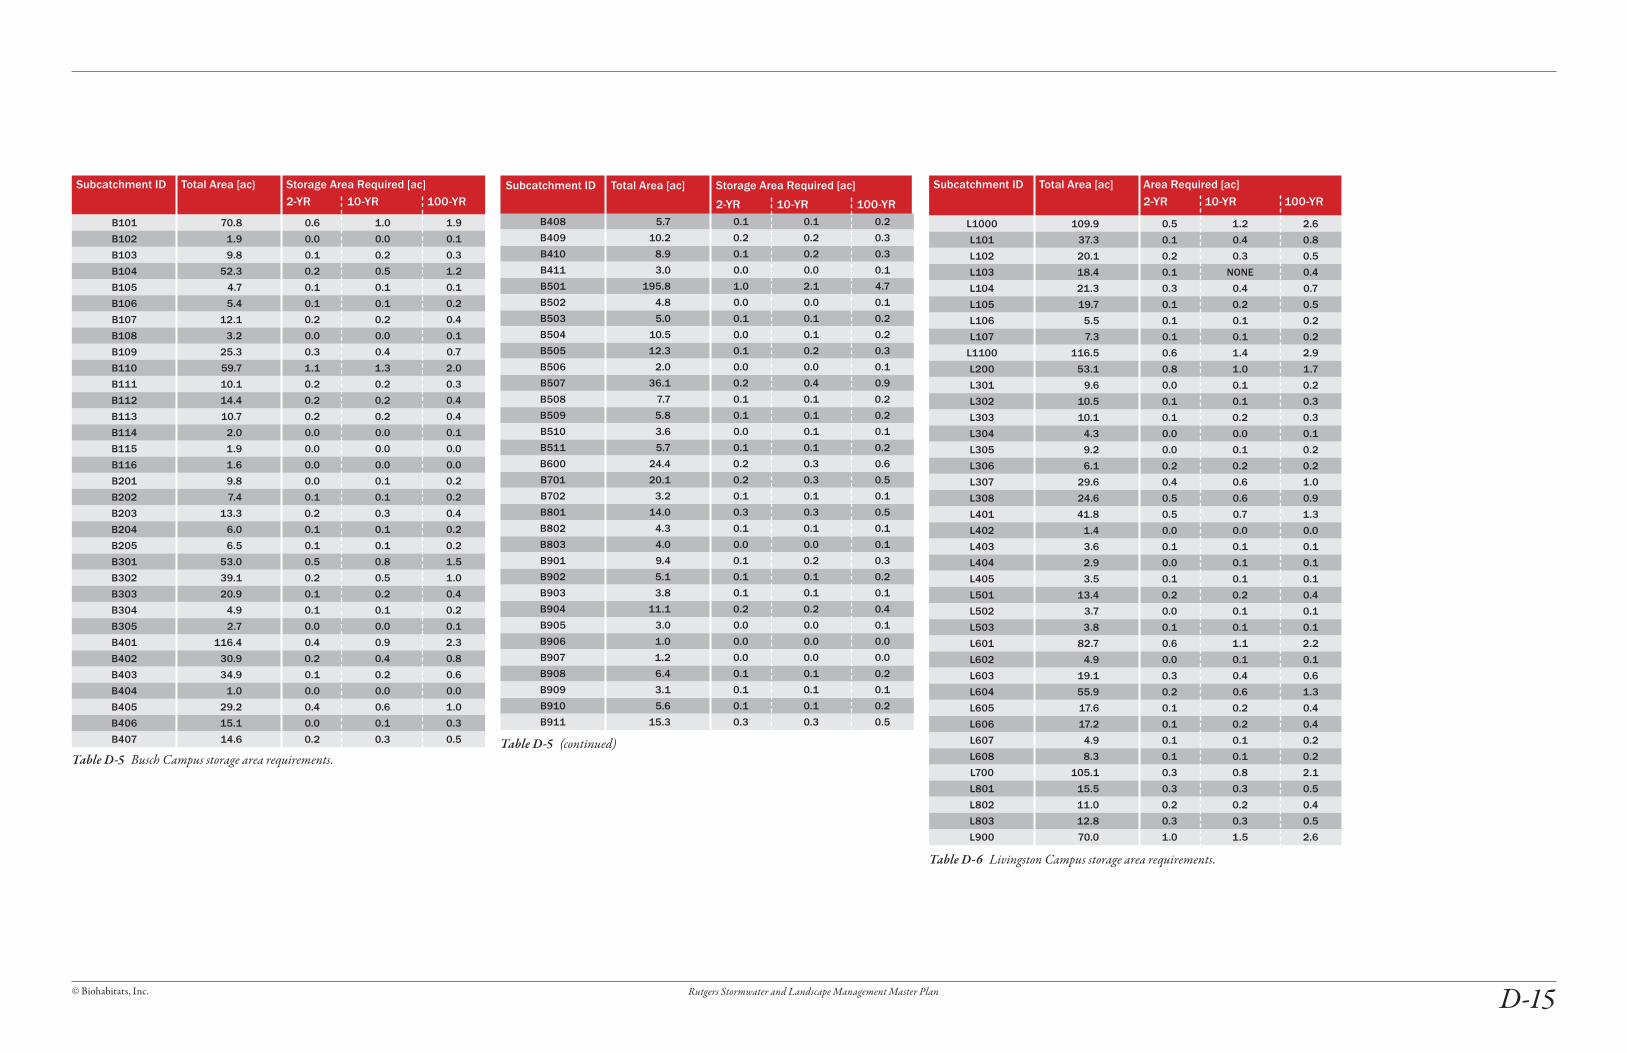
© Biohabitats, Inc. Rutgers Stormwater and Landscape Management Master Plan D-15
Subcatchment ID Total Area [ac] Area Required [ac] 2-YR 10-YR 100-YR
L1000 109.9 0.5 1.2 2.6
L101 37.3 0.1 0.4 0.8
L102 20.1 0.2 0.3 0.5
L103 18.4 0.1 NONE 0.4
L104 21.3 0.3 0.4 0.7
L105 19.7 0.1 0.2 0.5
L106 5.5 0.1 0.1 0.2
L107 7.3 0.1 0.1 0.2
L1100 116.5 0.6 1.4 2.9
L200 53.1 0.8 1.0 1.7
L301 9.6 0.0 0.1 0.2
L302 10.5 0.1 0.1 0.3
L303 10.1 0.1 0.2 0.3
L304 4.3 0.0 0.0 0.1
L305 9.2 0.0 0.1 0.2
L306 6.1 0.2 0.2 0.2
L307 29.6 0.4 0.6 1.0
L308 24.6 0.5 0.6 0.9
L401 41.8 0.5 0.7 1.3
L402 1.4 0.0 0.0 0.0
L403 3.6 0.1 0.1 0.1
L404 2.9 0.0 0.1 0.1
L405 3.5 0.1 0.1 0.1
L501 13.4 0.2 0.2 0.4
L502 3.7 0.0 0.1 0.1
L503 3.8 0.1 0.1 0.1
L601 82.7 0.6 1.1 2.2
L602 4.9 0.0 0.1 0.1
L603 19.1 0.3 0.4 0.6
L604 55.9 0.2 0.6 1.3
L605 17.6 0.1 0.2 0.4
L606 17.2 0.1 0.2 0.4
L607 4.9 0.1 0.1 0.2
L608 8.3 0.1 0.1 0.2
L700 105.1 0.3 0.8 2.1
L801 15.5 0.3 0.3 0.5
L802 11.0 0.2 0.2 0.4
L803 12.8 0.3 0.3 0.5
L900 70.0 1.0 1.5 2.6
Table D-6 Livingston Campus storage area requirements.
Subcatchment ID Total Area [ac} Storage Area Required [ac]2-YR 10-YR 100-YR
B101 70.8 0.6 1.0 1.9
B102 1.9 0.0 0.0 0.1
B103 9.8 0.1 0.2 0.3
B104 52.3 0.2 0.5 1.2
B105 4.7 0.1 0.1 0.1
B106 5.4 0.1 0.1 0.2
B107 12.1 0.2 0.2 0.4
B108 3.2 0.0 0.0 0.1
B109 25.3 0.3 0.4 0.7
B110 59.7 1.1 1.3 2.0
B111 10.1 0.2 0.2 0.3
B112 14.4 0.2 0.2 0.4
B113 10.7 0.2 0.2 0.4
B114 2.0 0.0 0.0 0.1
B115 1.9 0.0 0.0 0.0
B116 1.6 0.0 0.0 0.0
B201 9.8 0.0 0.1 0.2
B202 7.4 0.1 0.1 0.2
B203 13.3 0.2 0.3 0.4
B204 6.0 0.1 0.1 0.2
B205 6.5 0.1 0.1 0.2
B301 53.0 0.5 0.8 1.5
B302 39.1 0.2 0.5 1.0
B303 20.9 0.1 0.2 0.4
B304 4.9 0.1 0.1 0.2
B305 2.7 0.0 0.0 0.1
B401 116.4 0.4 0.9 2.3
B402 30.9 0.2 0.4 0.8
B403 34.9 0.1 0.2 0.6
B404 1.0 0.0 0.0 0.0
B405 29.2 0.4 0.6 1.0
B406 15.1 0.0 0.1 0.3
B407 14.6 0.2 0.3 0.5
B408 5.7 0.1 0.1 0.2
B409 10.2 0.2 0.2 0.3
B410 8.9 0.1 0.2 0.3
B411 3.0 0.0 0.0 0.1
B501 195.8 1.0 2.1 4.7
B502 4.8 0.0 0.0 0.1
B503 5.0 0.1 0.1 0.2
B504 10.5 0.0 0.1 0.2
B505 12.3 0.1 0.2 0.3
B506 2.0 0.0 0.0 0.1
B507 36.1 0.2 0.4 0.9
B508 7.7 0.1 0.1 0.2
B509 5.8 0.1 0.1 0.2
B510 3.6 0.0 0.1 0.1
B511 5.7 0.1 0.1 0.2
B600 24.4 0.2 0.3 0.6
B701 20.1 0.2 0.3 0.5
B702 3.2 0.1 0.1 0.1
B801 14.0 0.3 0.3 0.5
B802 4.3 0.1 0.1 0.1
B803 4.0 0.0 0.0 0.1
B901 9.4 0.1 0.2 0.3
B902 5.1 0.1 0.1 0.2
B903 3.8 0.1 0.1 0.1
B904 11.1 0.2 0.2 0.4
B905 3.0 0.0 0.0 0.1
B906 1.0 0.0 0.0 0.0
B907 1.2 0.0 0.0 0.0
B908 6.4 0.1 0.1 0.2
B909 3.1 0.1 0.1 0.1
B910 5.6 0.1 0.1 0.2
B911 15.3 0.3 0.3 0.5
Table D-5 Busch Campus storage area requirements.Table D-5 (continued)
Subcatchment ID Total Area [ac] Storage Area Required [ac]
2-YR 10-YR 100-YR

© Biohabitats, Inc.Rutgers Stormwater and Landscape Management Master PlanD-16
Subcatchment ID Total Area [ac] Area Required for 3ft Deep Facility [% of Total Area]
Percentage Area Range Area Required [ac]
2-YR 10-YR 100-YR (3 ft deep facility) 2-YR 10-YR 100-YR 100-YR plusB101 70.8 0.8% 1.3% 2.7% 2.5% 3.5% 0.6 1.0 1.9 2.5
B102 1.9 2.3% 2.6% 3.9% 4.0% 5.0% 0.0 0.0 0.1 0.1
B103 9.8 1.1% 1.6% 2.9% 3.0% 4.0% 0.1 0.2 0.3 0.4
B104 52.3 0.4% 1.0% 2.3% 2.5% 3.5% 0.2 0.5 1.2 1.8
B105 4.7 1.1% 1.6% 3.0% 3.0% 4.0% 0.1 0.1 0.1 0.2
B106 5.4 1.0% 1.5% 2.9% 3.0% 4.0% 0.1 0.1 0.2 0.2
B107 12.1 1.3% 1.8% 3.1% 3.0% 4.0% 0.2 0.2 0.4 0.5
B108 3.2 0.9% 1.5% 2.9% 3.0% 4.0% 0.0 0.0 0.1 0.1
B109 25.3 1.2% 1.6% 2.9% 3.0% 4.0% 0.3 0.4 0.7 1.0
B110 59.7 1.8% 2.2% 3.4% 3.5% 4.5% 1.1 1.3 2.0 2.7
B111 10.1 1.5% 1.9% 3.2% 3.0% 4.0% 0.2 0.2 0.3 0.4
B112 14.4 1.1% 1.5% 2.9% 3.0% 4.0% 0.2 0.2 0.4 0.6
B113 10.7 2.0% 2.3% 3.6% 3.5% 4.5% 0.2 0.2 0.4 0.5
B114 2.0 1.6% 2.0% 3.3% 3.5% 4.5% 0.0 0.0 0.1 0.1
B115 1.9 0.6% 1.2% 2.5% 2.5% 3.5% 0.0 0.0 0.0 0.1
B116 1.6 0.7% 1.3% 2.7% 2.5% 3.5% 0.0 0.0 0.0 0.1
B201 9.8 0.3% 0.9% 2.1% 2.0% 3.0% 0.0 0.1 0.2 0.3
B202 7.4 1.0% 1.6% 2.9% 3.0% 4.0% 0.1 0.1 0.2 0.3
B203 13.3 1.6% 2.0% 3.2% 3.0% 4.0% 0.2 0.3 0.4 0.5
B204 6.0 2.0% 2.4% 3.8% 4.0% 5.0% 0.1 0.1 0.2 0.3
B205 6.5 1.4% 1.9% 3.2% 3.0% 4.0% 0.1 0.1 0.2 0.3
B301 53.0 1.0% 1.5% 2.8% 3.0% 4.0% 0.5 0.8 1.5 2.1
B302 39.1 0.6% 1.2% 2.5% 2.5% 3.5% 0.2 0.5 1.0 1.4
B303 20.9 0.3% 0.8% 2.0% 2.0% 3.0% 0.1 0.2 0.4 0.6
B304 4.9 1.7% 2.1% 3.5% 3.5% 4.5% 0.1 0.1 0.2 0.2
B305 2.7 0.6% 1.2% 2.5% 2.5% 3.5% 0.0 0.0 0.1 0.1
B401 116.4 0.3% 0.8% 2.0% 2.0% 3.0% 0.4 0.9 2.3 3.5
B402 30.9 0.6% 1.2% 2.5% 2.5% 3.5% 0.2 0.4 0.8 1.1
B403 34.9 0.3% 0.6% 1.8% 2.0% 3.0% 0.1 0.2 0.6 1.0
B404 1.0 1.0% 1.5% 2.8% 3.0% 4.0% 0.0 0.0 0.0 0.0
B405 29.2 1.5% 2.0% 3.3% 3.5% 4.5% 0.4 0.6 1.0 1.3
B406 15.1 0.3% 0.7% 2.0% 2.0% 3.0% 0.0 0.1 0.3 0.5
B407 14.6 1.5% 2.0% 3.3% 3.5% 4.5% 0.2 0.3 0.5 0.7
B408 5.7 2.4% 2.6% 3.9% 4.0% 5.0% 0.1 0.1 0.2 0.3
B409 10.2 1.5% 2.0% 3.3% 3.5% 4.5% 0.2 0.2 0.3 0.5
B410 8.9 1.4% 1.9% 3.2% 3.0% 4.0% 0.1 0.2 0.3 0.4
Table D-7 Busch Campus storage area required for a 3 foot storage facility as percentage of total area.

© Biohabitats, Inc. Rutgers Stormwater and Landscape Management Master Plan D-17
B411 3.0 1.0% 1.6% 2.9% 3.0% 4.0% 0.0 0.0 0.1 0.1
B501 195.8 0.5% 1.1% 2.4% 2.5% 3.5% 1.0 2.1 4.7 6.9
B502 4.8 0.4% 1.0% 2.3% 2.5% 3.5% 0.0 0.0 0.1 0.2
B503 5.0 2.2% 2.5% 3.7% 3.5% 4.5% 0.1 0.1 0.2 0.2
B504 10.5 0.3% 0.7% 2.0% 2.0% 3.0% 0.0 0.1 0.2 0.3
B505 12.3 1.1% 1.5% 2.8% 3.0% 4.0% 0.1 0.2 0.3 0.5
B506 2.0 1.9% 2.2% 3.6% 3.5% 4.5% 0.0 0.0 0.1 0.1
B507 36.1 0.7% 1.2% 2.5% 2.5% 3.5% 0.2 0.4 0.9 1.3
B508 7.7 1.3% 1.7% 3.0% 3.0% 4.0% 0.1 0.1 0.2 0.3
B509 5.8 1.9% 2.2% 3.6% 3.5% 4.5% 0.1 0.1 0.2 0.3
B510 3.6 1.3% 1.8% 3.1% 3.0% 4.0% 0.0 0.1 0.1 0.1
B511 5.7 1.6% 2.0% 3.3% 3.5% 4.5% 0.1 0.1 0.2 0.3
B600 24.4 0.7% 1.2% 2.4% 2.5% 3.5% 0.2 0.3 0.6 0.9
B701 20.1 0.8% 1.3% 2.5% 2.5% 3.5% 0.2 0.3 0.5 0.7
B702 3.2 2.3% 2.5% 3.7% 3.5% 4.5% 0.1 0.1 0.1 0.1
B801 14.0 1.9% 2.2% 3.4% 3.5% 4.5% 0.3 0.3 0.5 0.6
B802 4.3 1.4% 1.7% 3.1% 3.0% 4.0% 0.1 0.1 0.1 0.2
B803 4.0 0.7% 1.0% 2.6% 2.5% 3.5% 0.0 0.0 0.1 0.1
B901 9.4 1.2% 1.7% 3.0% 3.0% 4.0% 0.1 0.2 0.3 0.4
B902 5.1 1.4% 1.8% 3.1% 3.0% 4.0% 0.1 0.1 0.2 0.2
B903 3.8 1.5% 2.0% 3.2% 3.0% 4.0% 0.1 0.1 0.1 0.2
B904 11.1 1.8% 2.1% 3.4% 3.5% 4.5% 0.2 0.2 0.4 0.5
B905 3.0 1.3% 1.6% 2.9% 3.0% 4.0% 0.0 0.0 0.1 0.1
B906 1.0 2.2% 2.4% 3.7% 3.5% 4.5% 0.0 0.0 0.0 0.0
B907 1.2 1.1% 1.6% 2.8% 3.0% 4.0% 0.0 0.0 0.0 0.0
B908 6.4 1.9% 2.2% 3.5% 3.5% 4.5% 0.1 0.1 0.2 0.3
B909 3.1 2.2% 2.4% 3.7% 3.5% 4.5% 0.1 0.1 0.1 0.1
B910 5.6 1.8% 2.2% 3.5% 3.5% 4.5% 0.1 0.1 0.2 0.3
B911 15.3 1.6% 2.1% 3.4% 3.5% 4.5% 0.3 0.3 0.5 0.7
Subcatchment ID Total Area [ac] Area Required for 3ft Deep Facility [% of Total Area] Percentage Area Range Area Required [ac]
2-YR 10-YR 100-YR (3 ft deep facility) 2-YR 10-YR 100-YR 100-YR plus
Table D-7 (continued)
© Biohabitats, Inc.Rutgers Stormwater and Landscape Management Master PlanD-18
Subcatchment ID Total Area [ac] Area Required for 3 ft Deep Facility [% of Total Area]
Percentage Area Range Area Required [ac]
2-YR 10-YR 100-YR (3 ft deep facility) 2-YR 10-YR 100-YR 100-YR plusL1000 109.9 0.5% 1.1% 2.4% 2.5% 3.5% 0.5 1.2 2.6 3.8
L101 37.3 0.4% 0.9% 2.2% 2.0% 3.0% 0.1 0.4 0.8 1.1
L102 20.1 1.0% 1.4% 2.6% 2.5% 3.5% 0.2 0.3 0.5 0.7
L103 18.4 0.6% NONE 2.2% 2.0% 3.0% 0.1 NONE 0.4 0.6
L104 21.3 1.3% 1.8% 3.1% 3.0% 4.0% 0.3 0.4 0.7 0.9
L105 19.7 0.7% 1.2% 2.5% 2.5% 3.5% 0.1 0.2 0.5 0.7
L106 5.5 1.1% 1.6% 2.9% 3.0% 4.0% 0.1 0.1 0.2 0.2
L107 7.3 1.7% 2.1% 3.4% 3.5% 4.5% 0.1 0.1 0.2 0.3
L1100 116.5 0.5% 1.2% 2.5% 2.5% 3.5% 0.6 1.4 2.9 4.1
L200 53.1 1.4% 1.8% 3.1% 3.0% 4.0% 0.8 1.0 1.7 2.1
L301 9.6 0.5% 1.0% 2.3% 2.5% 3.5% 0.0 0.1 0.2 0.3
L302 10.5 0.6% 1.2% 2.5% 2.5% 3.5% 0.1 0.1 0.3 0.4
L303 10.1 1.0% 1.5% 2.8% 3.0% 4.0% 0.1 0.2 0.3 0.4
L304 4.3 0.3% 1.0% 2.4% 2.5% 3.5% 0.0 0.0 0.1 0.1
L305 9.2 0.2% 0.7% 1.9% 2.0% 3.0% 0.0 0.1 0.2 0.3
L306 6.1 2.5% 2.6% 3.8% 4.0% 5.0% 0.2 0.2 0.2 0.3
L307 29.6 1.5% 1.9% 3.2% 3.0% 4.0% 0.4 0.6 1.0 1.2
L308 24.6 1.9% 2.3% 3.6% 3.5% 4.5% 0.5 0.6 0.9 1.1
L401 41.8 1.2% 1.7% 3.0% 3.0% 4.0% 0.5 0.7 1.3 1.7
L402 1.4 1.0% 1.5% 2.8% 3.0% 4.0% 0.0 0.0 0.0 0.1
L403 3.6 1.4% 1.9% 3.1% 3.0% 4.0% 0.1 0.1 0.1 0.1
L404 2.9 1.5% 1.9% 3.2% 3.0% 4.0% 0.0 0.1 0.1 0.1
L405 3.5 2.0% 2.3% 3.6% 3.5% 4.5% 0.1 0.1 0.1 0.2
L501 13.4 1.4% 1.8% 3.1% 3.0% 4.0% 0.2 0.2 0.4 0.5
L502 3.7 1.3% 1.8% 3.1% 3.0% 4.0% 0.0 0.1 0.1 0.1
L503 3.8 1.3% 1.8% 3.0% 3.0% 4.0% 0.1 0.1 0.1 0.2
L601 82.7 0.8% 1.3% 2.7% 2.5% 3.5% 0.6 1.1 2.2 2.9
L602 4.9 0.5% 1.1% 2.3% 2.5% 3.5% 0.0 0.1 0.1 0.2
L603 19.1 1.6% 2.0% 3.4% 3.5% 4.5% 0.3 0.4 0.6 0.9
L604 55.9 0.3% 1.0% 2.3% 2.5% 3.5% 0.2 0.6 1.3 2.0
L605 17.6 0.6% 1.2% 2.5% 2.5% 3.5% 0.1 0.2 0.4 0.6
L606 17.2 0.6% 1.2% 2.5% 2.5% 3.5% 0.1 0.2 0.4 0.6
Table D-8 Livingston Campus storage area required for a 3 foot deep storage facility as percentage of total area.

© Biohabitats, Inc. Rutgers Stormwater and Landscape Management Master Plan D-19
It is important to realize that the above example is only conceptual at this point and not based on field-determined geomorphological conditions. In addition, taking on such an approach is both a site-specific and receiving stream-specific exercise, such that it can’t be assumed that because the ap-proach is valid at one stream location it is also valid at another. Individual stream channel and catchment assessments and analysis are required.
Finally, it should be noted that stream velocities can be higher than litera-ture-based or regulatory mandated permissible thresholds and still main-tain channel stability due to the underlying stream bank and bed materials. Field documentation of these stream geomorphological characteristics may be required to receive a variance in a regulatory threshold. Using the above example the necessary storage was determined based on the target to reduce the future scenario velocities to the existing levels. Based on the uncalibrated model output, these velocities are higher under both scenarios than typical stable velocities. If a lower regulatory threshold were required (e.g., 6 feet per second) a significantly larger upstream storage or additional channel stabilization measures (such as vegetation or bank protection) would be needed to meet the threshold. One of the beneficial outputs of this Master Plan is that the University now has a watershed based hydrologic model that also has hydraulic analysis ca-pabilities that can be used in pursuing alternative approaches to meeting the stormwater management requirements on a campus or watershed/catchment scale as opposed to an individual site scale. This provides a wider range of thoughtful and effective design options to meet the regulatory requirements and can potentially yield more desirable environmental outcomes from a flow reduction and water quality improvement standpoint.
An example for catchment L4 involving the assessment of storage volume to meet the existing velocity values is discussed here. Catchment L4 is comprised of the subcatchments L401 through L405 that are tributary to the upstream end of Buell Brook. Velocity values for existing and future conditions for a total reach of 1,000 feet downstream of where the L4 dis-charges into Buell Brook were evaluated and are summarized in Table D-9. As can be seen in this table, the velocities for future conditions exceed the existing scenario for full reach when no storage is provided. Figure D-16 shows a schematic of the maximum velocities modeled for the 2.75 ac ft storage facility.
The next step is to analyze the 1,000 foot reach downstream of L401 with the benefit of providing storage upstream. An iterative analysis was per-formed to determine the volume of storage required to reduce the flow ve-locities to their existing condition values or lower. The analysis determined that for this reach, an estimated 2.75 ac-ft of storage is needed to manage velocities for the 10-year return frequency event. By comparison, it is esti-mated that approximately 2.81 acre-feet of storage is required to meet the peak discharge over-control requirement for subcatchments L401 through L405 for a 10-year storm event. This suggests that the storage requirement estimated based on the velocity analysis (i.e., erosion –based criteria) and peak flow control (traditional) are approximately equal for this catchment for the 10-year event. Yet, if the discussion above is considered, and it is shown that there is no downstream threat of flooding as Buell Brook enters into the Preserve before flowing into the Raritan River, then a case can be made that additional storage beyond the 2.75 acre-feet is not needed. In comparison, to meet the full range of over-control criteria (up through the 100-year return frequency storm) would mean that a total of approximate-ly 4.9 acre-feet of storage is required, or more than 40% more storage than that required for meeting a channel stability criteria.
Figure D-16 Maximum velocity schematic without (left) and with (right) 2.75 ac. ft storage facility.
Reach Downstream of Subcatchment L401 [ft - ft]
Velocity [ft/sec]Existing Future Future with 2.75
ac-ft Storage Facility
0 - 100 4.858 4.892 4.453
100 - 200 4.858 4.892 4.731
200 - 300 4.630 4.671 4.552
300 - 400 7.185 7.223 7.108
400 - 500 8.291 8.337 8.203
500 - 600 8.722 8.774 8.635
600 - 700 9.678 9.730 9.618
700 - 800 10.168 10.223 10.100
800 - 900 10.486 10.543 10.426
900 - 1000 10.424 10.479 10.368
Table D-9 Difference in velocity values.

© Biohabitats, Inc.Rutgers Stormwater and Landscape Management Master PlanD-20
Table D-10 Busch model results for 1-month storm event.
Subcatchment ID
1-Month Storm EventExisting Scenario Future Scenario Net IncreasePeak Runoff [cfs]
Runoff Volume [ac-ft]
Peak Runoff [cfs]
Runoff Volume [ac-ft]
Peak Runoff [cfs]
Runoff Volume [ac-ft]
B101 6.64 1.14 6.72 1.16 0.08 0.02
B102 0.92 0.13 0.88 0.13 -0.03 -0.01
B103 1.44 0.21 1.47 0.21 0.03 0.01
B104 0.78 0.11 0.78 0.11 0.00 0.00
B105 1.01 0.15 0.81 0.12 -0.20 -0.03
B106 0.76 0.11 0.75 0.11 0.00 0.00
B107 3.02 0.44 2.66 0.39 -0.35 -0.05
B108 1.34 0.20 0.55 0.08 -0.79 -0.12
B109 2.35 0.34 3.74 0.55 1.39 0.21
B110 2.73 0.39 10.88 1.75 8.15 1.35
B111 2.16 0.31 2.53 0.36 0.37 0.05
B112 3.39 0.55 2.77 0.43 -0.63 -0.12
B113 2.62 0.38 3.67 0.53 1.05 0.15
B114 0.87 0.12 0.59 0.09 -0.27 -0.04
B115 0.63 0.09 0.14 0.02 -0.49 -0.07
B116 0.49 0.07 0.17 0.02 -0.32 -0.05
B201 0.26 0.04 0.08 0.01 -0.18 -0.03
B202 1.02 0.15 1.06 0.16 0.04 0.01
B203 2.79 0.41 3.34 0.49 0.55 0.08
B204 0.86 0.13 1.43 0.25 0.57 0.11
B205 2.08 0.30 1.68 0.24 -0.40 -0.06
B301 6.82 1.32 6.63 1.26 -0.19 -0.06
B302 2.80 0.45 2.74 0.43 -0.06 -0.01
B303 0.35 0.05 0.32 0.05 -0.03 0.00
B304 1.81 0.26 1.60 0.23 -0.21 -0.03
B305 0.04 0.01 0.08 0.01 0.04 0.01
B401 3.89 0.60 3.83 0.59 -0.06 -0.01
B402 2.65 0.38 1.91 0.27 -0.74 -0.11
B403 1.44 0.21 0.98 0.14 -0.46 -0.07
B404 0.11 0.02 0.13 0.02 0.02 0.00
B405 5.95 0.88 6.89 1.03 0.94 0.15
B406 0.09 0.01 0.09 0.01 0.00 0.00
B407 3.54 0.51 3.77 0.55 0.23 0.03
B408 1.77 0.26 2.51 0.36 0.73 0.11
B409 2.29 0.33 2.61 0.38 0.32 0.05
B410 1.87 0.27 2.07 0.30 0.19 0.03
B411 1.05 0.15 0.48 0.07 -0.58 -0.08
B501 9.31 1.36 9.31 1.36 0.00 0.00
B502 0.00 0.00 0.00 0.00 0.00 0.00
B503 1.30 0.22 1.52 0.28 0.23 0.06
B504 0.10 0.01 0.09 0.01 -0.01 0.00
B505 2.41 0.35 2.15 0.31 -0.26 -0.04
B506 0.86 0.12 0.74 0.11 -0.12 -0.02
B507 2.51 0.36 2.53 0.36 0.02 0.00
B508 1.74 0.25 1.61 0.23 -0.13 -0.02
B509 1.55 0.23 1.93 0.28 0.38 0.06
B510 0.80 0.12 0.80 0.12 0.00 0.00
B511 1.68 0.24 1.68 0.24 0.00 0.00
B600 2.08 0.30 2.08 0.30 0.00 0.00
B701 2.86 0.42 2.63 0.38 -0.23 -0.03
B702 0.74 0.11 1.25 0.18 0.51 0.08
B801 2.40 0.37 3.02 0.61 0.61 0.24
B802 1.03 0.15 0.98 0.16 -0.06 0.00
B803 1.47 0.23 0.69 0.11 -0.77 -0.13
B901 0.76 0.11 1.52 0.23 0.76 0.12
B902 0.91 0.13 1.12 0.16 0.20 0.03
B903 0.60 0.09 0.85 0.13 0.26 0.04
B904 2.93 0.44 3.30 0.51 0.37 0.06
B905 0.51 0.07 0.62 0.09 0.11 0.02
B906 0.21 0.03 0.38 0.05 0.17 0.02
B907 0.13 0.02 0.16 0.02 0.04 0.01
B908 2.31 0.34 2.22 0.33 -0.09 -0.01
B909 0.68 0.10 1.12 0.17 0.45 0.07
B910 1.76 0.27 1.75 0.27 -0.01 0.00
B911 2.70 0.42 3.38 0.56 0.68 0.13
Subcatchment ID
1-Month Storm Event
Existing Scenario Future Scenario Net Increase
Peak Runoff [cfs]
Runoff Volume [ac-ft]
Peak Runoff [cfs]
Runoff Volume [ac-ft]
Peak Runoff [cfs]
Runoff Volume [ac-ft]
Table D-10 (continued)

© Biohabitats, Inc. Rutgers Stormwater and Landscape Management Master Plan D-21
Table D-11 Livingston model results for 1-month storm event.
L1000 2.90 0.42 2.90 0.42 0.00 0.00
L101 0.60 0.09 0.58 0.08 -0.02 0.00
L102 1.12 0.16 2.38 0.34 1.26 0.18
L103 7.08 1.17 3.92 0.58 -3.16 -0.58
L104 4.39 0.65 4.59 0.69 0.20 0.03
L105 0.05 0.01 1.12 0.17 1.07 0.16
L106 0.75 0.11 0.83 0.13 0.08 0.01
L107 1.89 0.35 1.83 0.33 -0.07 -0.02
L1100 4.74 0.68 4.74 0.68 0.00 0.00
L200 5.97 0.90 9.63 1.57 3.66 0.68
L301 0.75 0.11 0.61 0.09 -0.14 -0.02
L302 0.45 0.07 0.36 0.05 -0.10 -0.01
L303 1.60 0.23 1.34 0.19 -0.26 -0.04
L304 1.67 0.24 0.14 0.02 -1.53 -0.22
L305 0.02 0.00 0.02 0.00 0.00 0.00
L306 0.59 0.09 2.11 0.31 1.51 0.23
L307 3.88 0.57 5.69 0.87 1.81 0.30
L308 2.96 0.43 5.81 0.91 2.85 0.48
L401 7.34 1.13 7.58 1.18 0.24 0.04
L402 0.18 0.03 0.18 0.03 0.00 0.00
L403 0.50 0.07 0.73 0.11 0.24 0.03
L404 0.35 0.05 0.62 0.09 0.27 0.04
L405 1.24 0.18 1.27 0.19 0.03 0.01
L501 2.44 0.36 2.74 0.41 0.30 0.05
L502 0.47 0.07 0.68 0.10 0.21 0.03
L503 0.20 0.03 0.62 0.09 0.42 0.06
L601 6.87 1.03 7.25 1.09 0.38 0.06
L602 0.01 0.00 0.01 0.00 0.00 0.00
L603 6.62 1.01 5.62 0.84 -1.01 -0.17
L604 0.12 0.02 0.12 0.02 0.00 0.00
L605 0.75 0.11 0.75 0.11 0.00 0.00
L606 0.54 0.08 0.54 0.08 -0.01 0.00
L607 1.46 0.21 1.57 0.23 0.11 0.02
L608 1.31 0.21 0.95 0.14 -0.35 -0.06
L700 0.11 0.02 0.11 0.02 0.00 0.00
L801 1.85 0.27 4.00 0.59 2.15 0.32
L802 1.90 0.33 2.23 0.41 0.33 0.08
L803 2.13 0.33 3.21 0.54 1.08 0.22
L900 3.28 0.51 7.23 1.54 3.95 1.03
Subcatchment ID
1-Month Storm Event
Existing Scenario Future Scenario Net Increase
Peak Runoff [cfs]
Runoff Volume [ac-ft]
Peak Runoff [cfs]
Runoff Volume [ac-ft]
Peak Runoff [cfs]
Runoff Volume [ac-ft]

© Biohabitats, Inc.Rutgers Stormwater and Landscape Management Master PlanD-22
Table D-12 Busch model results for 3-month storm event.Table D-12 (continued)
B101 13.15 2.20 13.33 2.24 0.18 0.03
B102 1.66 0.25 1.60 0.24 -0.06 -0.01
B103 2.62 0.40 2.69 0.41 0.06 0.01
B104 1.41 0.22 1.41 0.22 0.00 0.00
B105 1.82 0.28 1.46 0.22 -0.36 -0.06
B106 1.38 0.21 1.37 0.21 -0.01 0.00
B107 5.50 0.84 4.84 0.74 -0.65 -0.10
B108 2.48 0.38 1.00 0.15 -1.48 -0.23
B109 4.26 0.65 6.88 1.06 2.62 0.41
B110 4.95 0.76 20.95 3.37 16.00 2.61
B111 3.91 0.60 4.59 0.70 0.68 0.10
B112 6.58 1.07 5.25 0.83 -1.32 -0.24
B113 4.76 0.73 6.69 1.02 1.93 0.30
B114 1.57 0.24 1.07 0.16 -0.50 -0.08
B115 1.15 0.18 0.25 0.04 -0.90 -0.14
B116 0.89 0.14 0.30 0.05 -0.59 -0.09
B201 0.46 0.07 0.14 0.02 -0.33 -0.05
B202 1.87 0.29 1.94 0.30 0.07 0.01
B203 5.09 0.78 6.12 0.94 1.03 0.16
B204 1.61 0.25 2.83 0.47 1.22 0.22
B205 3.80 0.58 3.05 0.47 -0.74 -0.11
B301 14.16 2.57 13.68 2.45 -0.48 -0.12
B302 5.37 0.86 5.25 0.84 -0.12 -0.02
B303 0.63 0.10 0.57 0.09 -0.05 -0.01
B304 3.29 0.50 2.91 0.44 -0.38 -0.06
B305 0.06 0.01 0.14 0.02 0.07 0.01
B401 7.32 1.15 7.21 1.13 -0.11 -0.02
B402 4.79 0.73 3.45 0.53 -1.34 -0.20
B403 2.60 0.40 1.78 0.27 -0.83 -0.13
B404 0.20 0.03 0.23 0.03 0.03 0.00
B405 10.98 1.69 12.82 1.99 1.84 0.30
B406 0.16 0.03 0.16 0.03 0.00 0.00
B407 6.44 0.99 6.87 1.05 0.43 0.07
Subcatchment ID
3-Month Storm Event
Existing Scenario Future Scenario Net Increase
Peak Runoff [cfs]
Runoff Volume [ac-ft]
Peak Runoff [cfs]
Runoff Volume [ac-ft]
Peak Runoff [cfs]
Runoff Volume [ac-ft]
B408 3.22 0.49 4.57 0.70 1.36 0.21
B409 4.15 0.63 4.73 0.72 0.58 0.09
B410 3.38 0.52 3.74 0.57 0.35 0.05
B411 1.91 0.29 0.86 0.13 -1.04 -0.16
B501 17.09 2.62 17.09 2.62 0.00 0.00
B502 0.00 0.00 0.00 0.00 0.00 0.00
B503 2.57 0.43 3.10 0.54 0.53 0.11
B504 0.17 0.03 0.16 0.03 -0.01 0.00
B505 4.37 0.67 3.90 0.60 -0.47 -0.07
B506 1.55 0.24 1.33 0.20 -0.22 -0.03
B507 4.54 0.69 4.59 0.70 0.05 0.01
B508 3.17 0.49 2.93 0.45 -0.24 -0.04
B509 2.83 0.43 3.54 0.54 0.71 0.11
B510 1.46 0.22 1.46 0.22 0.00 0.00
B511 3.05 0.47 3.05 0.47 0.00 0.00
B600 3.80 0.58 3.80 0.58 0.00 0.00
B701 5.21 0.80 4.79 0.73 -0.42 -0.06
B702 1.34 0.20 2.28 0.35 0.94 0.14
B801 4.53 0.71 6.37 1.19 1.83 0.48
B802 1.92 0.30 1.88 0.30 -0.03 0.01
B803 2.80 0.45 1.30 0.20 -1.50 -0.24
B901 1.39 0.21 2.83 0.44 1.45 0.23
B902 1.65 0.25 2.02 0.31 0.37 0.06
B903 1.09 0.17 1.57 0.24 0.48 0.07
B904 5.48 0.85 6.23 0.98 0.75 0.12
B905 0.92 0.14 1.12 0.17 0.20 0.03
B906 0.38 0.06 0.69 0.11 0.31 0.05
B907 0.23 0.03 0.29 0.04 0.06 0.01
B908 4.28 0.66 4.10 0.63 -0.18 -0.03
B909 1.23 0.19 2.07 0.32 0.83 0.13
B910 3.32 0.52 3.30 0.52 -0.02 0.00
B911 5.13 0.81 6.57 1.07 1.45 0.26
Subcatchment ID
3-Month Storm Event
Existing Scenario Future Scenario Net Increase
Peak Runoff [cfs]
Runoff Volume [ac-ft]
Peak Runoff [cfs]
Runoff Volume [ac-ft]
Peak Runoff [cfs]
Runoff Volume [ac-ft]

© Biohabitats, Inc. Rutgers Stormwater and Landscape Management Master Plan D-23
Table D-13 Livingston model results for 3-month storm event.
L1000 5.25 0.80 5.25 0.80 0.00 0.00
L101 1.08 0.17 1.05 0.16 -0.03 0.00
L102 2.02 0.31 4.33 0.66 2.31 0.35
L103 13.80 2.26 7.27 1.12 -6.53 -1.13
L104 8.13 1.26 8.52 1.32 0.39 0.06
L105 0.08 0.01 2.06 0.32 1.98 0.31
L106 1.39 0.22 1.56 0.24 0.17 0.03
L107 3.88 0.68 3.71 0.65 -0.17 -0.04
L1100 8.58 1.31 8.58 1.31 0.00 0.00
L200 11.12 1.73 18.69 3.04 7.57 1.31
L301 1.38 0.21 1.11 0.17 -0.27 -0.04
L302 0.82 0.12 0.64 0.10 -0.17 -0.03
L303 2.90 0.44 2.42 0.37 -0.48 -0.07
L304 3.06 0.47 0.25 0.04 -2.80 -0.43
L305 0.04 0.01 0.04 0.01 0.00 0.00
L306 1.07 0.16 3.88 0.60 2.81 0.43
L307 7.15 1.10 10.71 1.68 3.57 0.58
L308 5.42 0.83 11.05 1.75 5.63 0.92
L401 13.87 2.18 14.37 2.27 0.50 0.08
L402 0.33 0.05 0.33 0.05 0.00 0.00
L403 0.90 0.14 1.33 0.20 0.43 0.07
L404 0.64 0.10 1.12 0.17 0.49 0.07
L405 2.28 0.35 2.34 0.36 0.07 0.01
L501 4.50 0.69 5.08 0.79 0.58 0.09
L502 0.85 0.13 1.23 0.19 0.38 0.06
L503 0.36 0.06 1.12 0.17 0.75 0.11
L601 12.75 1.97 13.49 2.09 0.74 0.12
L602 0.01 0.00 0.01 0.00 0.00 0.00
L603 12.42 1.94 10.43 1.61 -1.99 -0.33
L604 0.21 0.03 0.21 0.03 0.00 0.00
L605 1.35 0.21 1.35 0.21 0.00 0.00
L606 0.98 0.15 0.97 0.15 -0.01 0.00
L607 2.65 0.40 2.85 0.44 0.21 0.03
L608 2.51 0.40 1.79 0.28 -0.72 -0.12
L700 0.19 0.03 0.19 0.03 0.00 0.00
L801 3.36 0.51 7.37 1.13 4.01 0.62
L802 3.77 0.63 4.53 0.79 0.76 0.16
L803 4.02 0.63 6.33 1.05 2.31 0.42
L900 6.21 0.98 15.50 3.00 9.29 2.02
Subcatchment ID
3-Month Storm Event
Existing Scenario Future Scenario Net Increase
Peak Runoff [cfs]
Runoff Volume [ac-ft]
Peak Runoff [cfs]
Runoff Volume [ac-ft]
Peak Runoff [cfs]
Runoff Volume [ac-ft]

© Biohabitats, Inc.Rutgers Stormwater and Landscape Management Master PlanD-24
Table D-14 Busch model results for 6-month storm event.Table D-14 (continued)
B101 16.66 2.74 16.89 2.78 0.23 0.04
B102 2.07 0.31 2.02 0.30 -0.05 -0.01
B103 3.37 0.50 3.45 0.51 0.08 0.01
B104 2.17 0.27 2.17 0.27 0.00 0.00
B105 2.44 0.35 1.99 0.28 -0.44 -0.07
B106 1.78 0.26 1.77 0.26 -0.01 0.00
B107 7.05 1.05 6.25 0.92 -0.80 -0.12
B108 3.12 0.47 1.32 0.19 -1.80 -0.28
B109 5.52 0.81 8.74 1.32 3.23 0.51
B110 6.51 0.94 26.44 4.19 19.93 3.25
B111 5.13 0.74 5.96 0.87 0.83 0.13
B112 8.30 1.33 6.63 1.03 -1.68 -0.29
B113 6.20 0.91 8.55 1.27 2.35 0.37
B114 2.01 0.30 1.45 0.20 -0.57 -0.09
B115 1.48 0.22 0.39 0.05 -1.09 -0.17
B116 1.15 0.17 0.44 0.06 -0.72 -0.11
B201 0.80 0.09 0.40 0.03 -0.40 -0.06
B202 2.39 0.36 2.47 0.37 0.09 0.01
B203 6.51 0.97 7.78 1.17 1.27 0.20
B204 2.03 0.31 3.58 0.59 1.55 0.28
B205 4.86 0.72 3.95 0.58 -0.91 -0.14
B301 18.10 3.19 17.46 3.05 -0.64 -0.14
B302 6.78 1.07 6.62 1.04 -0.16 -0.03
B303 1.08 0.12 1.01 0.11 -0.07 -0.01
B304 4.23 0.63 3.77 0.55 -0.45 -0.07
B305 0.15 0.01 0.24 0.03 0.09 0.01
B401 9.24 1.43 9.10 1.40 -0.14 -0.02
B402 6.62 0.92 4.98 0.66 -1.64 -0.25
B403 3.48 0.50 2.47 0.34 -1.01 -0.16
B404 0.29 0.04 0.33 0.04 0.03 0.01
B405 13.92 2.11 16.20 2.47 2.28 0.37
B406 0.49 0.03 0.49 0.03 0.00 0.00
B407 8.30 1.23 8.83 1.31 0.53 0.08
Subcatchment ID
6-Month Storm Event
Existing Scenario Future Scenario Net Increase
Peak Runoff [cfs]
Runoff Volume [ac-ft]
Peak Runoff [cfs]
Runoff Volume [ac-ft]
Peak Runoff [cfs]
Runoff Volume [ac-ft]
B408 4.17 0.61 5.77 0.87 1.60 0.26
B409 5.52 0.79 6.22 0.90 0.70 0.11
B410 4.55 0.65 4.98 0.71 0.43 0.07
B411 2.52 0.36 1.28 0.17 -1.24 -0.20
B501 21.78 3.27 21.78 3.27 0.00 0.00
B502 0.17 0.00 0.17 0.00 0.00 0.00
B503 3.25 0.53 3.94 0.67 0.69 0.14
B504 0.38 0.04 0.37 0.03 -0.01 0.00
B505 5.73 0.83 5.15 0.74 -0.57 -0.09
B506 1.98 0.29 1.75 0.25 -0.24 -0.04
B507 5.95 0.87 6.01 0.87 0.06 0.01
B508 4.05 0.60 3.76 0.56 -0.30 -0.05
B509 3.61 0.54 4.49 0.68 0.88 0.14
B510 1.89 0.28 1.89 0.28 0.00 0.00
B511 3.94 0.58 3.94 0.58 0.00 0.00
B600 4.88 0.72 4.88 0.72 0.00 0.00
B701 6.68 0.99 6.17 0.91 -0.52 -0.08
B702 1.75 0.26 2.89 0.43 1.14 0.18
B801 5.72 0.89 8.16 1.48 2.44 0.60
B802 2.43 0.37 2.38 0.38 -0.05 0.01
B803 3.53 0.55 1.65 0.25 -1.88 -0.30
B901 1.79 0.26 3.58 0.55 1.79 0.28
B902 2.19 0.32 2.65 0.39 0.46 0.07
B903 1.40 0.21 1.99 0.30 0.59 0.09
B904 6.91 1.06 7.85 1.22 0.93 0.15
B905 1.20 0.18 1.44 0.21 0.24 0.04
B906 0.51 0.07 0.88 0.13 0.37 0.06
B907 0.33 0.04 0.41 0.06 0.08 0.01
B908 5.41 0.82 5.18 0.79 -0.22 -0.04
B909 1.60 0.23 2.62 0.40 1.02 0.16
B910 4.18 0.65 4.16 0.65 -0.02 0.00
B911 6.47 1.01 8.31 1.34 1.84 0.32
Subcatchment ID
6-Month Storm Event
Existing Scenario Future Scenario Net Increase
Peak Runoff [cfs]
Runoff Volume [ac-ft]
Peak Runoff [cfs]
Runoff Volume [ac-ft]
Peak Runoff [cfs]
Runoff Volume [ac-ft]
© Biohabitats, Inc. Rutgers Stormwater and Landscape Management Master Plan D-25
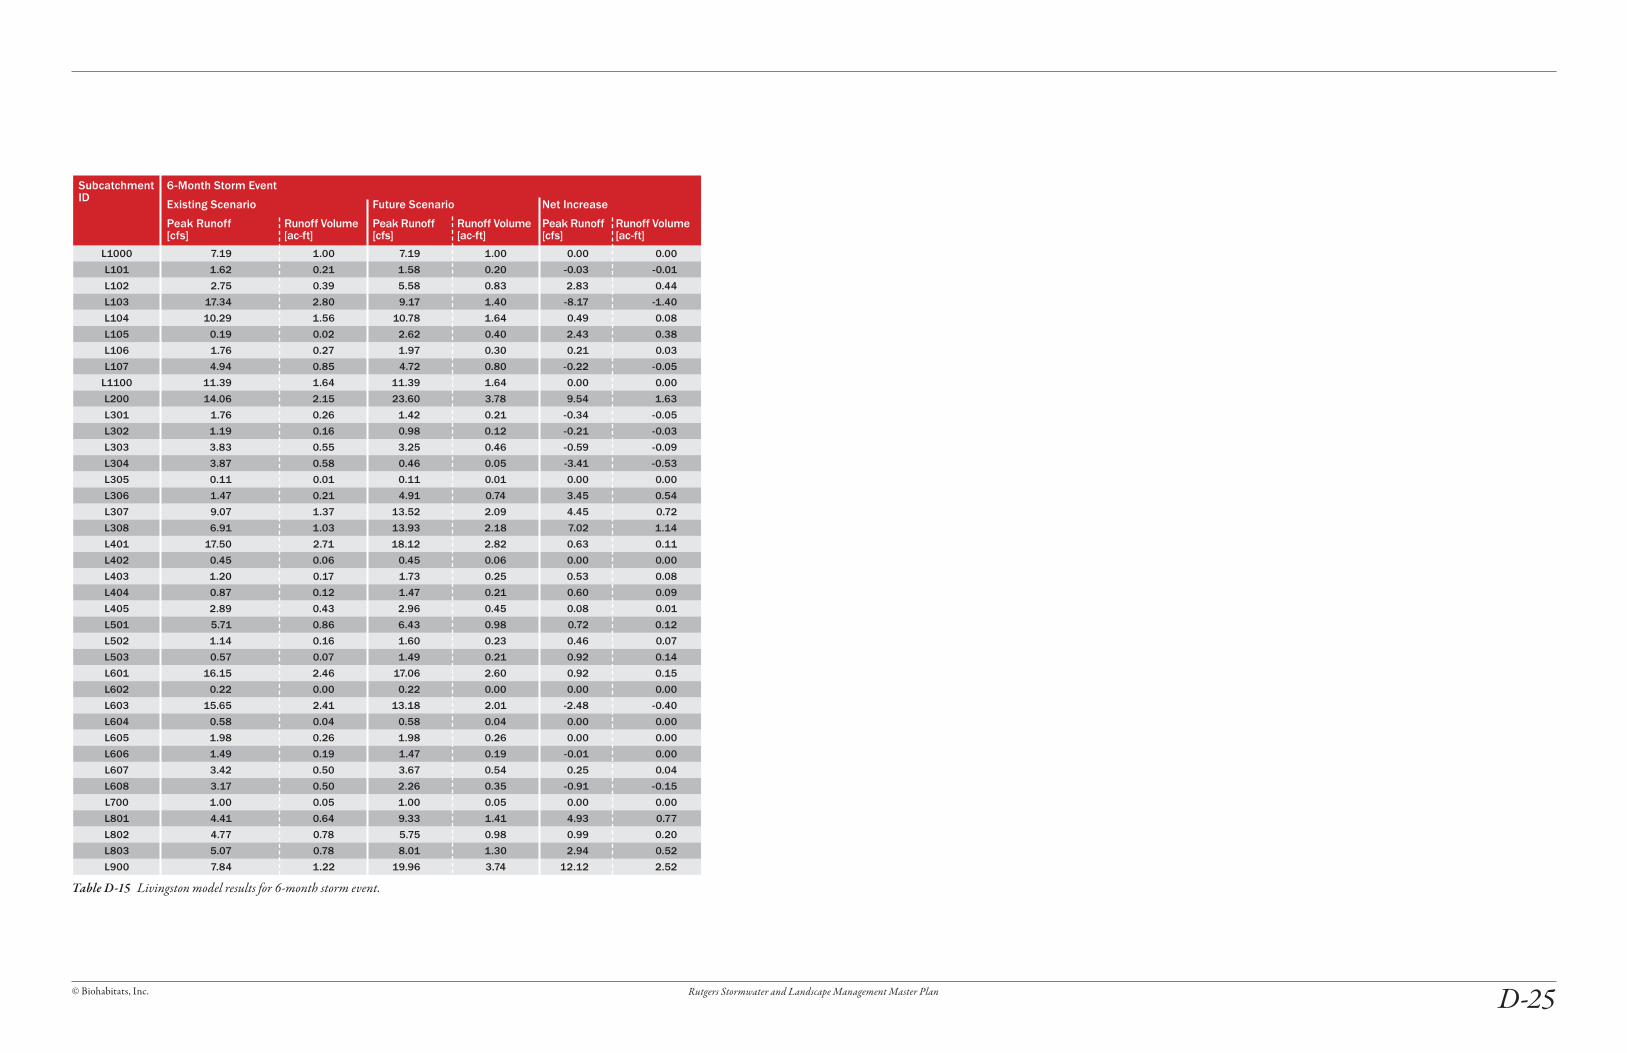
Table D-15 Livingston model results for 6-month storm event.
L1000 7.19 1.00 7.19 1.00 0.00 0.00
L101 1.62 0.21 1.58 0.20 -0.03 -0.01
L102 2.75 0.39 5.58 0.83 2.83 0.44
L103 17.34 2.80 9.17 1.40 -8.17 -1.40
L104 10.29 1.56 10.78 1.64 0.49 0.08
L105 0.19 0.02 2.62 0.40 2.43 0.38
L106 1.76 0.27 1.97 0.30 0.21 0.03
L107 4.94 0.85 4.72 0.80 -0.22 -0.05
L1100 11.39 1.64 11.39 1.64 0.00 0.00
L200 14.06 2.15 23.60 3.78 9.54 1.63
L301 1.76 0.26 1.42 0.21 -0.34 -0.05
L302 1.19 0.16 0.98 0.12 -0.21 -0.03
L303 3.83 0.55 3.25 0.46 -0.59 -0.09
L304 3.87 0.58 0.46 0.05 -3.41 -0.53
L305 0.11 0.01 0.11 0.01 0.00 0.00
L306 1.47 0.21 4.91 0.74 3.45 0.54
L307 9.07 1.37 13.52 2.09 4.45 0.72
L308 6.91 1.03 13.93 2.18 7.02 1.14
L401 17.50 2.71 18.12 2.82 0.63 0.11
L402 0.45 0.06 0.45 0.06 0.00 0.00
L403 1.20 0.17 1.73 0.25 0.53 0.08
L404 0.87 0.12 1.47 0.21 0.60 0.09
L405 2.89 0.43 2.96 0.45 0.08 0.01
L501 5.71 0.86 6.43 0.98 0.72 0.12
L502 1.14 0.16 1.60 0.23 0.46 0.07
L503 0.57 0.07 1.49 0.21 0.92 0.14
L601 16.15 2.46 17.06 2.60 0.92 0.15
L602 0.22 0.00 0.22 0.00 0.00 0.00
L603 15.65 2.41 13.18 2.01 -2.48 -0.40
L604 0.58 0.04 0.58 0.04 0.00 0.00
L605 1.98 0.26 1.98 0.26 0.00 0.00
L606 1.49 0.19 1.47 0.19 -0.01 0.00
L607 3.42 0.50 3.67 0.54 0.25 0.04
L608 3.17 0.50 2.26 0.35 -0.91 -0.15
L700 1.00 0.05 1.00 0.05 0.00 0.00
L801 4.41 0.64 9.33 1.41 4.93 0.77
L802 4.77 0.78 5.75 0.98 0.99 0.20
L803 5.07 0.78 8.01 1.30 2.94 0.52
L900 7.84 1.22 19.96 3.74 12.12 2.52
Subcatchment ID
6-Month Storm Event
Existing Scenario Future Scenario Net Increase
Peak Runoff [cfs]
Runoff Volume [ac-ft]
Peak Runoff [cfs]
Runoff Volume [ac-ft]
Peak Runoff [cfs]
Runoff Volume [ac-ft]
© Biohabitats, Inc.Rutgers Stormwater and Landscape Management Master PlanD-26
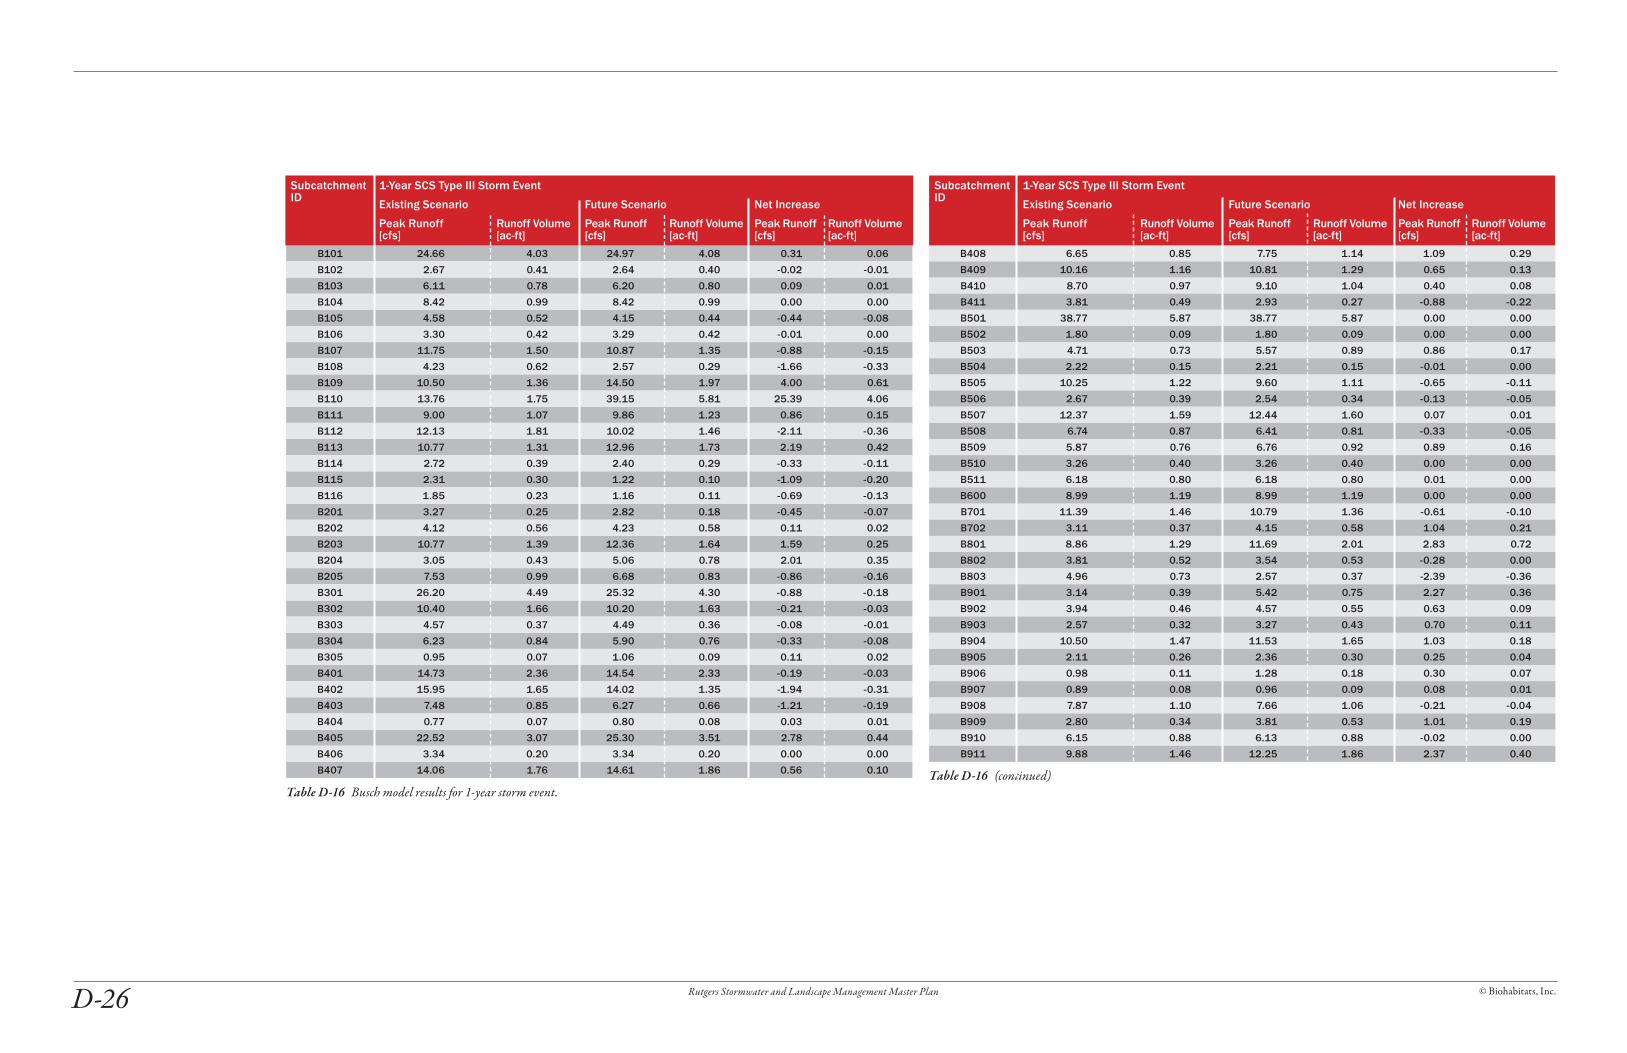
Table D-16 Busch model results for 1-year storm event.Table D-16 (continued)
B101 24.66 4.03 24.97 4.08 0.31 0.06
B102 2.67 0.41 2.64 0.40 -0.02 -0.01
B103 6.11 0.78 6.20 0.80 0.09 0.01
B104 8.42 0.99 8.42 0.99 0.00 0.00
B105 4.58 0.52 4.15 0.44 -0.44 -0.08
B106 3.30 0.42 3.29 0.42 -0.01 0.00
B107 11.75 1.50 10.87 1.35 -0.88 -0.15
B108 4.23 0.62 2.57 0.29 -1.66 -0.33
B109 10.50 1.36 14.50 1.97 4.00 0.61
B110 13.76 1.75 39.15 5.81 25.39 4.06
B111 9.00 1.07 9.86 1.23 0.86 0.15
B112 12.13 1.81 10.02 1.46 -2.11 -0.36
B113 10.77 1.31 12.96 1.73 2.19 0.42
B114 2.72 0.39 2.40 0.29 -0.33 -0.11
B115 2.31 0.30 1.22 0.10 -1.09 -0.20
B116 1.85 0.23 1.16 0.11 -0.69 -0.13
B201 3.27 0.25 2.82 0.18 -0.45 -0.07
B202 4.12 0.56 4.23 0.58 0.11 0.02
B203 10.77 1.39 12.36 1.64 1.59 0.25
B204 3.05 0.43 5.06 0.78 2.01 0.35
B205 7.53 0.99 6.68 0.83 -0.86 -0.16
B301 26.20 4.49 25.32 4.30 -0.88 -0.18
B302 10.40 1.66 10.20 1.63 -0.21 -0.03
B303 4.57 0.37 4.49 0.36 -0.08 -0.01
B304 6.23 0.84 5.90 0.76 -0.33 -0.08
B305 0.95 0.07 1.06 0.09 0.11 0.02
B401 14.73 2.36 14.54 2.33 -0.19 -0.03
B402 15.95 1.65 14.02 1.35 -1.94 -0.31
B403 7.48 0.85 6.27 0.66 -1.21 -0.19
B404 0.77 0.07 0.80 0.08 0.03 0.01
B405 22.52 3.07 25.30 3.51 2.78 0.44
B406 3.34 0.20 3.34 0.20 0.00 0.00
B407 14.06 1.76 14.61 1.86 0.56 0.10
Subcatchment ID
1-Year SCS Type III Storm Event
Existing Scenario Future Scenario Net Increase
Peak Runoff [cfs]
Runoff Volume [ac-ft]
Peak Runoff [cfs]
Runoff Volume [ac-ft]
Peak Runoff [cfs]
Runoff Volume [ac-ft]
B408 6.65 0.85 7.75 1.14 1.09 0.29
B409 10.16 1.16 10.81 1.29 0.65 0.13
B410 8.70 0.97 9.10 1.04 0.40 0.08
B411 3.81 0.49 2.93 0.27 -0.88 -0.22
B501 38.77 5.87 38.77 5.87 0.00 0.00
B502 1.80 0.09 1.80 0.09 0.00 0.00
B503 4.71 0.73 5.57 0.89 0.86 0.17
B504 2.22 0.15 2.21 0.15 -0.01 0.00
B505 10.25 1.22 9.60 1.11 -0.65 -0.11
B506 2.67 0.39 2.54 0.34 -0.13 -0.05
B507 12.37 1.59 12.44 1.60 0.07 0.01
B508 6.74 0.87 6.41 0.81 -0.33 -0.05
B509 5.87 0.76 6.76 0.92 0.89 0.16
B510 3.26 0.40 3.26 0.40 0.00 0.00
B511 6.18 0.80 6.18 0.80 0.01 0.00
B600 8.99 1.19 8.99 1.19 0.00 0.00
B701 11.39 1.46 10.79 1.36 -0.61 -0.10
B702 3.11 0.37 4.15 0.58 1.04 0.21
B801 8.86 1.29 11.69 2.01 2.83 0.72
B802 3.81 0.52 3.54 0.53 -0.28 0.00
B803 4.96 0.73 2.57 0.37 -2.39 -0.36
B901 3.14 0.39 5.42 0.75 2.27 0.36
B902 3.94 0.46 4.57 0.55 0.63 0.09
B903 2.57 0.32 3.27 0.43 0.70 0.11
B904 10.50 1.47 11.53 1.65 1.03 0.18
B905 2.11 0.26 2.36 0.30 0.25 0.04
B906 0.98 0.11 1.28 0.18 0.30 0.07
B907 0.89 0.08 0.96 0.09 0.08 0.01
B908 7.87 1.10 7.66 1.06 -0.21 -0.04
B909 2.80 0.34 3.81 0.53 1.01 0.19
B910 6.15 0.88 6.13 0.88 -0.02 0.00
B911 9.88 1.46 12.25 1.86 2.37 0.40
Subcatchment ID
1-Year SCS Type III Storm Event
Existing Scenario Future Scenario Net Increase
Peak Runoff [cfs]
Runoff Volume [ac-ft]
Peak Runoff [cfs]
Runoff Volume [ac-ft]
Peak Runoff [cfs]
Runoff Volume [ac-ft]

© Biohabitats, Inc. Rutgers Stormwater and Landscape Management Master Plan D-27
Table D-17 Livingston model results for 1-year storm event.
L1000 19.15 2.56 19.15 2.56 0.00 0.00
L101 5.80 0.69 5.76 0.69 -0.04 -0.01
L102 6.43 0.71 9.88 1.25 3.45 0.54
L103 22.77 3.64 13.03 1.86 -9.75 -1.78
L104 16.22 2.22 16.85 2.32 0.63 0.10
L105 1.35 0.16 4.45 0.65 3.10 0.48
L106 2.80 0.40 3.07 0.44 0.27 0.04
L107 7.06 1.15 6.77 1.09 -0.28 -0.06
L1100 26.06 3.57 26.06 3.57 0.00 0.00
L200 22.29 3.14 34.55 5.18 12.26 2.04
L301 3.00 0.43 2.57 0.36 -0.43 -0.07
L302 3.69 0.39 3.43 0.35 -0.26 -0.04
L303 7.57 0.87 6.90 0.77 -0.67 -0.11
L304 5.52 0.78 2.07 0.16 -3.44 -0.62
L305 0.96 0.09 0.96 0.09 0.00 0.00
L306 3.51 0.37 7.30 1.01 3.79 0.63
L307 15.20 2.12 20.83 3.00 5.62 0.89
L308 12.09 1.66 20.96 3.05 8.87 1.40
L401 26.96 3.93 27.74 4.05 0.78 0.12
L402 1.01 0.11 1.01 0.11 0.00 0.00
L403 2.49 0.28 3.09 0.38 0.61 0.10
L404 2.00 0.21 2.65 0.32 0.66 0.11
L405 4.28 0.59 4.33 0.60 0.05 0.02
L501 9.30 1.27 10.20 1.42 0.90 0.14
L502 2.40 0.27 2.94 0.36 0.54 0.09
L503 1.98 0.17 3.02 0.34 1.04 0.17
L601 26.71 4.00 27.89 4.19 1.18 0.19
L602 2.16 0.11 2.16 0.11 0.00 0.00
L603 22.69 3.24 20.06 2.77 -2.63 -0.47
L604 5.03 0.68 5.03 0.68 0.00 0.00
L605 6.23 0.63 6.23 0.63 0.00 0.00
L606 5.27 0.55 5.26 0.54 -0.01 0.00
L607 5.51 0.70 5.74 0.75 0.23 0.05
L608 4.75 0.71 3.58 0.52 -1.17 -0.19
L700 10.81 1.09 10.81 1.09 0.00 0.00
L801 8.28 0.97 14.01 1.92 5.74 0.95
L802 6.95 1.08 8.26 1.32 1.30 0.25
L803 7.86 1.15 11.63 1.78 3.78 0.64
L900 12.30 1.97 28.76 5.21 16.46 3.23
Subcatchment ID
1-Year SCS Type III Storm Event
Existing Scenario Future Scenario Net Increase
Peak Runoff [cfs]
Runoff Volume [ac-ft]
Peak Runoff [cfs]
Runoff Volume [ac-ft]
Peak Runoff [cfs]
Runoff Volume [ac-ft]

© Biohabitats, Inc.Rutgers Stormwater and Landscape Management Master PlanD-28
Table D-18 Busch model results for 2-year storm event.Table D-18 (continued)
B101 33.87 5.93 34.23 5.99 0.37 0.06
B102 3.16 0.49 3.14 0.47 -0.01 -0.01
B103 9.18 1.12 9.28 1.13 0.10 0.02
B104 17.50 2.26 17.50 2.26 0.00 0.00
B105 6.29 0.69 5.94 0.61 -0.35 -0.08
B106 5.02 0.60 5.01 0.60 -0.01 0.00
B107 15.96 1.95 15.16 1.79 -0.80 -0.15
B108 5.08 0.75 3.74 0.41 -1.33 -0.34
B109 16.53 2.06 20.89 2.71 4.36 0.65
B110 23.07 2.89 52.02 7.44 28.95 4.55
B111 12.04 1.40 12.84 1.56 0.80 0.17
B112 15.84 2.28 13.58 1.90 -2.27 -0.38
B113 14.55 1.70 16.24 2.15 1.70 0.44
B114 3.26 0.47 3.01 0.36 -0.25 -0.11
B115 2.92 0.38 2.01 0.17 -0.91 -0.21
B116 2.35 0.29 1.80 0.16 -0.55 -0.13
B201 5.84 0.46 5.42 0.39 -0.42 -0.08
B202 6.15 0.81 6.27 0.82 0.12 0.02
B203 14.71 1.81 16.51 2.11 1.81 0.29
B204 4.00 0.54 6.34 0.96 2.35 0.41
B205 9.58 1.24 8.90 1.07 -0.67 -0.17
B301 34.90 6.10 33.82 5.90 -1.08 -0.20
B302 14.83 2.64 14.59 2.60 -0.25 -0.04
B303 8.48 0.70 8.39 0.68 -0.09 -0.01
B304 7.65 1.04 7.42 0.95 -0.24 -0.09
B305 1.93 0.16 2.04 0.18 0.11 0.02
B401 21.82 4.16 21.59 4.12 -0.22 -0.04
B402 25.74 2.54 23.79 2.21 -1.95 -0.33
B403 11.86 1.27 10.63 1.07 -1.23 -0.20
B404 1.18 0.11 1.21 0.11 0.03 0.01
B405 31.64 4.12 34.52 4.58 2.88 0.46
B406 6.25 0.43 6.25 0.43 0.00 0.00
B407 19.13 2.30 19.61 2.40 0.48 0.10
Subcatchment ID
2-Year SCS Type III Storm Event
Existing Scenario Future Scenario Net Increase
Peak Runoff [cfs]
Runoff Volume [ac-ft]
Peak Runoff [cfs]
Runoff Volume [ac-ft]
Peak Runoff [cfs]
Runoff Volume [ac-ft]
B408 8.45 1.06 9.25 1.37 0.79 0.31
B409 13.79 1.54 14.29 1.67 0.51 0.13
B410 11.91 1.29 12.23 1.37 0.32 0.08
B411 4.66 0.61 4.03 0.38 -0.63 -0.23
B501 61.85 10.52 61.85 10.52 0.00 0.00
B502 3.47 0.22 3.47 0.22 0.00 0.00
B503 6.15 0.92 7.04 1.09 0.88 0.18
B504 4.23 0.32 4.21 0.31 -0.02 0.00
B505 14.04 1.61 13.39 1.49 -0.66 -0.12
B506 3.19 0.47 3.09 0.42 -0.10 -0.05
B507 20.60 2.61 20.68 2.62 0.08 0.01
B508 9.25 1.14 8.93 1.08 -0.31 -0.06
B509 7.84 0.98 8.57 1.14 0.73 0.17
B510 4.42 0.52 4.42 0.52 0.00 0.00
B511 7.79 1.00 7.80 1.00 0.01 0.00
B600 13.95 1.78 13.95 1.78 0.00 0.00
B701 16.00 1.94 15.39 1.83 -0.61 -0.10
B702 4.26 0.49 5.07 0.71 0.81 0.22
B801 12.37 1.75 15.20 2.52 2.83 0.77
B802 5.20 0.68 4.74 0.68 -0.46 0.00
B803 6.11 0.89 3.62 0.51 -2.49 -0.38
B901 4.39 0.52 7.05 0.94 2.66 0.43
B902 5.25 0.60 6.05 0.71 0.80 0.12
B903 3.84 0.46 4.55 0.57 0.71 0.12
B904 13.90 1.87 14.78 2.05 0.88 0.18
B905 2.90 0.34 3.11 0.38 0.22 0.05
B906 1.34 0.14 1.55 0.21 0.22 0.07
B907 1.36 0.12 1.42 0.13 0.06 0.01
B908 9.81 1.36 9.64 1.31 -0.17 -0.04
B909 3.89 0.46 4.72 0.65 0.83 0.19
B910 7.91 1.10 7.89 1.09 -0.02 0.00
B911 13.69 1.99 16.38 2.41 2.68 0.43
Subcatchment ID
2-Year SCS Type III Storm Event
Existing Scenario Future Scenario Net Increase
Peak Runoff [cfs]
Runoff Volume [ac-ft]
Peak Runoff [cfs]
Runoff Volume [ac-ft]
Peak Runoff [cfs]
Runoff Volume [ac-ft]

© Biohabitats, Inc. Rutgers Stormwater and Landscape Management Master Plan D-29
Table D-19 Livingston model results for 2-year storm event.
L1000 36.50 5.38 36.50 5.38 0.00 0.00
L101 11.84 1.54 11.80 1.53 -0.05 -0.01
L102 10.64 1.12 14.33 1.71 3.68 0.59
L103 27.18 4.34 15.98 2.27 -11.20 -2.07
L104 22.15 2.90 22.91 3.02 0.76 0.12
L105 3.16 0.46 6.77 1.01 3.61 0.55
L106 3.99 0.56 4.30 0.61 0.32 0.05
L107 9.08 1.42 8.78 1.36 -0.30 -0.06
L1100 46.79 6.90 46.79 6.90 0.00 0.00
L200 31.33 4.24 45.35 6.55 14.02 2.31
L301 4.55 0.65 4.05 0.58 -0.49 -0.07
L302 6.89 0.72 6.61 0.68 -0.28 -0.04
L303 11.28 1.23 10.63 1.12 -0.64 -0.11
L304 6.72 0.95 3.79 0.30 -2.93 -0.65
L305 2.15 0.22 2.15 0.22 0.00 0.00
L306 5.74 0.58 9.19 1.24 3.45 0.66
L307 22.45 3.05 28.74 4.00 6.28 0.95
L308 18.39 2.46 28.20 3.95 9.81 1.49
L401 37.47 5.32 38.28 5.43 0.82 0.11
L402 1.56 0.15 1.56 0.15 0.00 0.00
L403 3.81 0.41 4.39 0.51 0.58 0.10
L404 3.11 0.31 3.70 0.42 0.59 0.11
L405 5.35 0.72 5.39 0.74 0.04 0.02
L501 13.22 1.73 14.20 1.89 0.98 0.15
L502 3.75 0.40 4.28 0.49 0.53 0.09
L503 3.48 0.29 4.46 0.47 0.97 0.18
L601 40.18 6.37 41.57 6.58 1.39 0.21
L602 4.04 0.25 4.04 0.25 0.00 0.00
L603 28.50 3.99 26.26 3.49 -2.24 -0.49
L604 12.16 2.10 12.16 2.10 0.00 0.00
L605 11.47 1.15 11.47 1.15 0.00 0.00
L606 10.27 1.09 10.26 1.08 -0.02 0.00
L607 7.11 0.89 7.28 0.93 0.18 0.05
L608 6.46 0.94 5.13 0.74 -1.33 -0.20
L700 25.28 2.99 25.28 2.99 0.00 0.00
L801 11.84 1.32 17.79 2.38 5.95 1.07
L802 9.20 1.38 10.70 1.66 1.50 0.27
L803 11.00 1.57 15.23 2.26 4.23 0.69
L900 17.94 3.36 38.02 7.04 20.07 3.68
Subcatchment ID
2-Year SCS Type III Storm Event
Existing Scenario Future Scenario Net Increase
Peak Runoff [cfs]
Runoff Volume [ac-ft]
Peak Runoff [cfs]
Runoff Volume [ac-ft]
Peak Runoff [cfs]
Runoff Volume [ac-ft]

© Biohabitats, Inc.Rutgers Stormwater and Landscape Management Master PlanD-30
Table D-20 Busch model results for 5-year storm event.Table D-20 (continued)
B101 57.46 10.55 57.95 10.62 0.49 0.07
B102 4.13 0.64 4.13 0.63 0.00 -0.01
B103 15.53 1.82 15.63 1.84 0.10 0.02
B104 43.72 5.27 43.72 5.27 0.00 0.00
B105 9.18 1.04 8.95 0.95 -0.23 -0.09
B106 8.63 0.99 8.62 0.99 -0.01 0.00
B107 23.50 2.86 22.91 2.70 -0.59 -0.17
B108 6.72 1.01 5.82 0.64 -0.90 -0.37
B109 31.94 3.63 36.42 4.34 4.47 0.71
B110 48.73 5.57 82.52 10.96 33.79 5.40
B111 18.70 2.09 19.29 2.28 0.59 0.19
B112 24.24 3.28 22.00 2.86 -2.24 -0.42
B113 21.09 2.51 22.18 2.99 1.09 0.48
B114 4.31 0.64 4.13 0.52 -0.18 -0.12
B115 4.00 0.53 3.38 0.30 -0.62 -0.22
B116 3.25 0.42 2.88 0.27 -0.36 -0.14
B201 12.29 0.96 11.98 0.88 -0.31 -0.08
B202 10.61 1.33 10.74 1.35 0.13 0.02
B203 23.41 2.71 25.07 3.07 1.66 0.36
B204 6.25 0.80 9.21 1.32 2.96 0.53
B205 13.22 1.74 12.79 1.56 -0.43 -0.18
B301 55.46 9.80 54.02 9.57 -1.44 -0.23
B302 26.22 5.12 25.90 5.08 -0.32 -0.04
B303 18.77 1.51 18.68 1.49 -0.10 -0.02
B304 10.30 1.42 10.14 1.33 -0.16 -0.09
B305 3.89 0.35 3.99 0.36 0.10 0.02
B401 42.78 9.12 42.48 9.07 -0.29 -0.04
B402 48.02 4.49 46.34 4.12 -1.68 -0.36
B403 23.32 2.30 22.20 2.08 -1.12 -0.21
B404 1.88 0.18 1.90 0.18 0.02 0.01
B405 50.11 6.28 52.77 6.78 2.66 0.50
B406 14.02 1.00 14.02 1.00 0.00 0.00
B407 28.23 3.39 28.56 3.50 0.33 0.11
Subcatchment ID
5-Year SCS Type III Storm Event
Existing Scenario Future Scenario Net Increase
Peak Runoff [cfs]
Runoff Volume [ac-ft]
Peak Runoff [cfs]
Runoff Volume [ac-ft]
Peak Runoff [cfs]
Runoff Volume [ac-ft]
B408 11.65 1.50 12.19 1.83 0.54 0.33
B409 19.97 2.29 20.30 2.44 0.32 0.14
B410 17.34 1.95 17.55 2.03 0.21 0.09
B411 6.28 0.85 5.86 0.59 -0.43 -0.25
B501 129.38 22.15 129.38 22.15 0.00 0.00
B502 7.22 0.51 7.22 0.51 0.00 0.00
B503 9.10 1.31 9.89 1.50 0.79 0.19
B504 9.54 0.72 9.52 0.72 -0.02 0.00
B505 22.28 2.44 21.74 2.30 -0.54 -0.14
B506 4.21 0.63 4.13 0.57 -0.08 -0.05
B507 42.13 4.90 42.21 4.91 0.08 0.01
B508 14.32 1.69 14.08 1.63 -0.24 -0.06
B509 11.35 1.41 11.83 1.60 0.49 0.18
B510 6.79 0.78 6.80 0.78 0.01 0.00
B511 11.27 1.41 11.27 1.41 0.01 0.00
B600 26.96 3.12 26.96 3.12 0.00 0.00
B701 27.15 3.02 26.60 2.90 -0.55 -0.12
B702 6.28 0.73 6.81 0.97 0.53 0.23
B801 20.63 2.75 22.77 3.60 2.14 0.85
B802 7.90 1.01 7.28 1.01 -0.63 0.00
B803 8.27 1.21 5.92 0.80 -2.35 -0.41
B901 7.61 0.82 10.99 1.37 3.38 0.55
B902 8.57 0.91 9.39 1.06 0.82 0.15
B903 6.38 0.74 7.01 0.86 0.63 0.12
B904 20.87 2.70 21.52 2.88 0.64 0.18
B905 4.76 0.52 4.93 0.57 0.16 0.05
B906 1.95 0.22 2.09 0.29 0.14 0.07
B907 2.15 0.20 2.18 0.22 0.03 0.01
B908 13.35 1.87 13.23 1.82 -0.12 -0.05
B909 5.84 0.68 6.40 0.89 0.56 0.21
B910 11.20 1.54 11.18 1.53 -0.02 0.00
B911 22.30 3.11 25.27 3.57 2.98 0.46
Subcatchment ID
5-Year SCS Type III Storm Event
Existing Scenario Future Scenario Net Increase
Peak Runoff [cfs]
Runoff Volume [ac-ft]
Peak Runoff [cfs]
Runoff Volume [ac-ft]
Peak Runoff [cfs]
Runoff Volume [ac-ft]

© Biohabitats, Inc. Rutgers Stormwater and Landscape Management Master Plan D-31
Table D-21 Livingston model results for 5-year storm event.
L1000 86.79 12.12 86.79 12.12 0.00 0.00
L101 29.46 3.57 29.40 3.56 -0.06 -0.01
L102 21.49 2.07 25.27 2.75 3.78 0.68
L103 37.25 5.77 23.87 3.18 -13.38 -2.60
L104 35.62 4.34 36.49 4.49 0.86 0.16
L105 8.76 1.21 13.28 1.87 4.52 0.65
L106 6.99 0.90 7.38 0.96 0.39 0.06
L107 13.28 1.99 12.95 1.93 -0.32 -0.06
L1100 100.24 14.64 100.24 14.64 0.00 0.00
L200 54.09 6.71 70.61 9.51 16.52 2.80
L301 8.78 1.17 8.20 1.09 -0.59 -0.08
L302 13.82 1.44 13.54 1.40 -0.28 -0.04
L303 18.05 1.96 17.54 1.84 -0.51 -0.12
L304 8.99 1.29 6.91 0.59 -2.08 -0.70
L305 5.59 0.56 5.59 0.56 0.00 0.00
L306 10.02 1.01 12.63 1.73 2.61 0.71
L307 40.21 5.07 46.92 6.12 6.72 1.04
L308 32.65 4.21 43.04 5.81 10.39 1.60
L401 62.28 8.28 63.23 8.38 0.95 0.10
L402 2.53 0.26 2.53 0.26 0.00 0.00
L403 6.27 0.67 6.74 0.78 0.46 0.11
L404 5.10 0.51 5.53 0.64 0.43 0.12
L405 7.29 1.00 7.32 1.02 0.03 0.02
L501 21.85 2.70 22.75 2.87 0.90 0.17
L502 6.32 0.67 6.75 0.77 0.44 0.10
L503 6.23 0.56 6.99 0.75 0.76 0.19
L601 75.05 11.91 76.72 12.14 1.67 0.23
L602 7.91 0.56 7.91 0.56 0.00 0.00
L603 39.29 5.50 37.74 4.97 -1.54 -0.53
L604 31.76 5.64 31.76 5.64 0.00 0.00
L605 23.94 2.29 23.94 2.29 0.00 0.00
L606 21.39 2.26 21.37 2.26 -0.02 0.00
L607 9.91 1.26 10.03 1.31 0.12 0.05
L608 10.68 1.44 9.17 1.22 -1.51 -0.22
L700 68.12 7.60 68.12 7.60 0.00 0.00
L801 20.69 2.11 26.78 3.38 6.09 1.27
L802 14.56 2.04 16.32 2.36 1.76 0.32
L803 18.49 2.47 22.90 3.23 4.41 0.76
L900 34.35 7.11 61.40 11.39 27.05 4.29
Subcatchment ID
5-Year SCS Type III Storm Event
Existing Scenario Future Scenario Net Increase
Peak Runoff [cfs]
Runoff Volume [ac-ft]
Peak Runoff [cfs]
Runoff Volume [ac-ft]
Peak Runoff [cfs]
Runoff Volume [ac-ft]
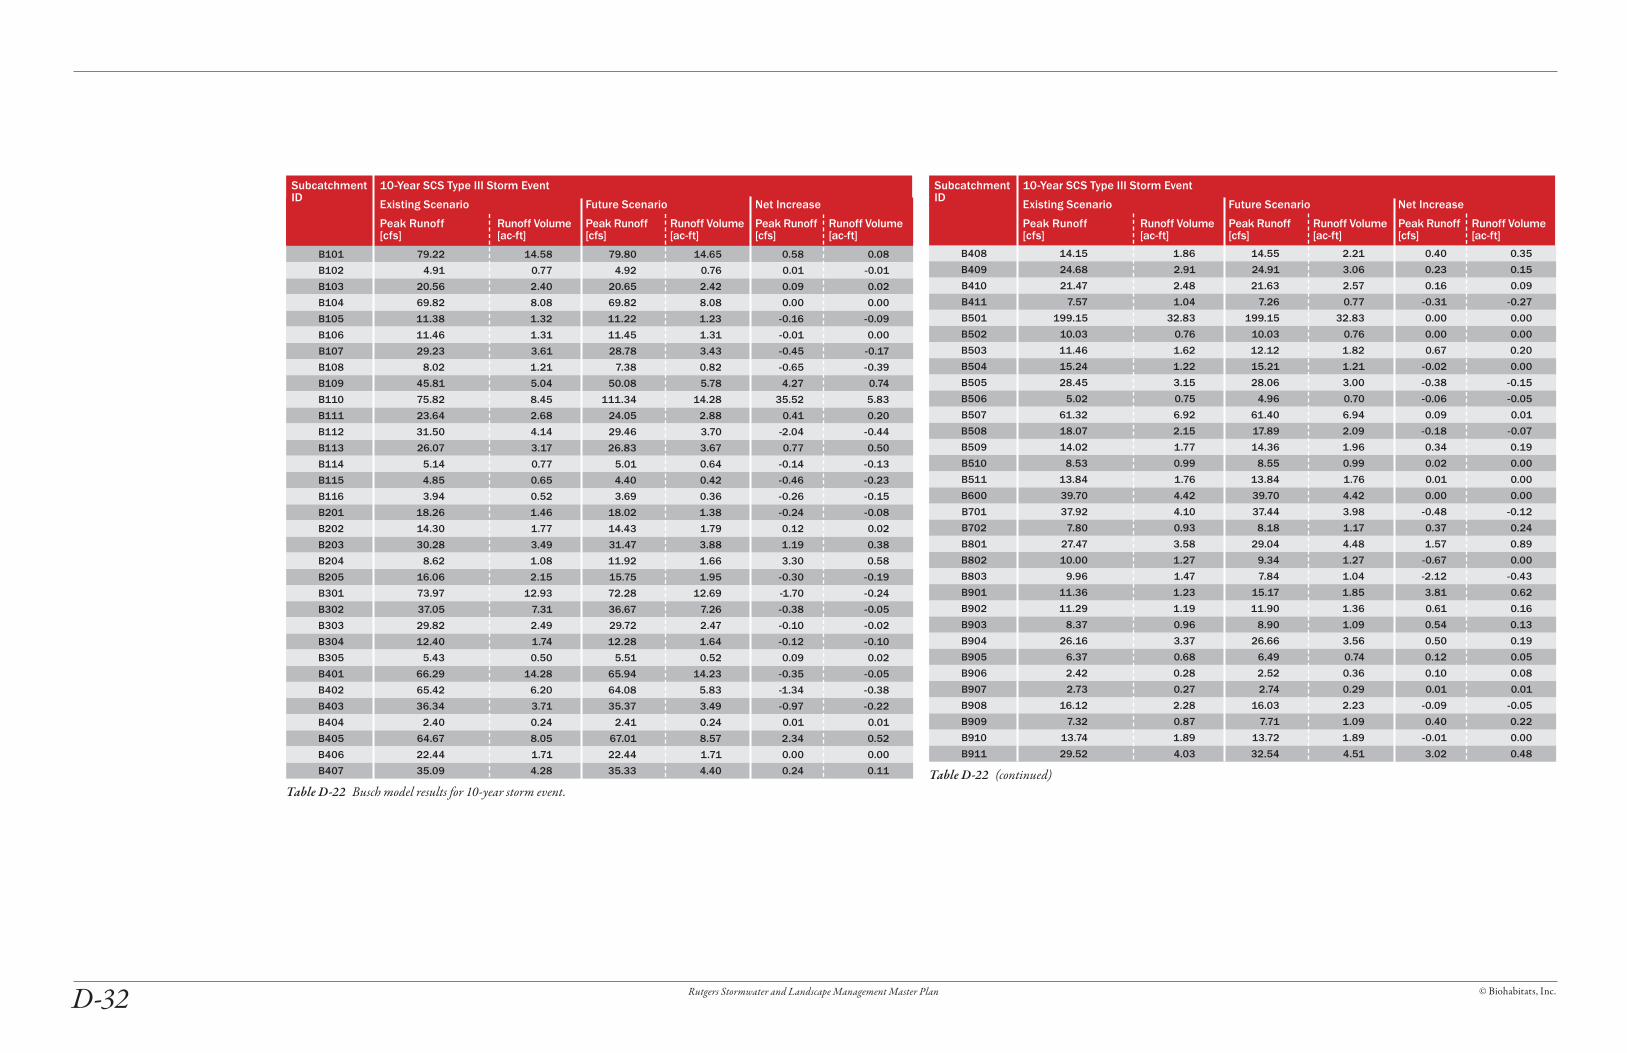
© Biohabitats, Inc.Rutgers Stormwater and Landscape Management Master PlanD-32
Table D-22 Busch model results for 10-year storm event.Table D-22 (continued)
B101 79.22 14.58 79.80 14.65 0.58 0.08
B102 4.91 0.77 4.92 0.76 0.01 -0.01
B103 20.56 2.40 20.65 2.42 0.09 0.02
B104 69.82 8.08 69.82 8.08 0.00 0.00
B105 11.38 1.32 11.22 1.23 -0.16 -0.09
B106 11.46 1.31 11.45 1.31 -0.01 0.00
B107 29.23 3.61 28.78 3.43 -0.45 -0.17
B108 8.02 1.21 7.38 0.82 -0.65 -0.39
B109 45.81 5.04 50.08 5.78 4.27 0.74
B110 75.82 8.45 111.34 14.28 35.52 5.83
B111 23.64 2.68 24.05 2.88 0.41 0.20
B112 31.50 4.14 29.46 3.70 -2.04 -0.44
B113 26.07 3.17 26.83 3.67 0.77 0.50
B114 5.14 0.77 5.01 0.64 -0.14 -0.13
B115 4.85 0.65 4.40 0.42 -0.46 -0.23
B116 3.94 0.52 3.69 0.36 -0.26 -0.15
B201 18.26 1.46 18.02 1.38 -0.24 -0.08
B202 14.30 1.77 14.43 1.79 0.12 0.02
B203 30.28 3.49 31.47 3.88 1.19 0.38
B204 8.62 1.08 11.92 1.66 3.30 0.58
B205 16.06 2.15 15.75 1.95 -0.30 -0.19
B301 73.97 12.93 72.28 12.69 -1.70 -0.24
B302 37.05 7.31 36.67 7.26 -0.38 -0.05
B303 29.82 2.49 29.72 2.47 -0.10 -0.02
B304 12.40 1.74 12.28 1.64 -0.12 -0.10
B305 5.43 0.50 5.51 0.52 0.09 0.02
B401 66.29 14.28 65.94 14.23 -0.35 -0.05
B402 65.42 6.20 64.08 5.83 -1.34 -0.38
B403 36.34 3.71 35.37 3.49 -0.97 -0.22
B404 2.40 0.24 2.41 0.24 0.01 0.01
B405 64.67 8.05 67.01 8.57 2.34 0.52
B406 22.44 1.71 22.44 1.71 0.00 0.00
B407 35.09 4.28 35.33 4.40 0.24 0.11
Subcatchment ID
10-Year SCS Type III Storm Event
Existing Scenario Future Scenario Net Increase
Peak Runoff [cfs]
Runoff Volume [ac-ft]
Peak Runoff [cfs]
Runoff Volume [ac-ft]
Peak Runoff [cfs]
Runoff Volume [ac-ft]
B408 14.15 1.86 14.55 2.21 0.40 0.35
B409 24.68 2.91 24.91 3.06 0.23 0.15
B410 21.47 2.48 21.63 2.57 0.16 0.09
B411 7.57 1.04 7.26 0.77 -0.31 -0.27
B501 199.15 32.83 199.15 32.83 0.00 0.00
B502 10.03 0.76 10.03 0.76 0.00 0.00
B503 11.46 1.62 12.12 1.82 0.67 0.20
B504 15.24 1.22 15.21 1.21 -0.02 0.00
B505 28.45 3.15 28.06 3.00 -0.38 -0.15
B506 5.02 0.75 4.96 0.70 -0.06 -0.05
B507 61.32 6.92 61.40 6.94 0.09 0.01
B508 18.07 2.15 17.89 2.09 -0.18 -0.07
B509 14.02 1.77 14.36 1.96 0.34 0.19
B510 8.53 0.99 8.55 0.99 0.02 0.00
B511 13.84 1.76 13.84 1.76 0.01 0.00
B600 39.70 4.42 39.70 4.42 0.00 0.00
B701 37.92 4.10 37.44 3.98 -0.48 -0.12
B702 7.80 0.93 8.18 1.17 0.37 0.24
B801 27.47 3.58 29.04 4.48 1.57 0.89
B802 10.00 1.27 9.34 1.27 -0.67 0.00
B803 9.96 1.47 7.84 1.04 -2.12 -0.43
B901 11.36 1.23 15.17 1.85 3.81 0.62
B902 11.29 1.19 11.90 1.36 0.61 0.16
B903 8.37 0.96 8.90 1.09 0.54 0.13
B904 26.16 3.37 26.66 3.56 0.50 0.19
B905 6.37 0.68 6.49 0.74 0.12 0.05
B906 2.42 0.28 2.52 0.36 0.10 0.08
B907 2.73 0.27 2.74 0.29 0.01 0.01
B908 16.12 2.28 16.03 2.23 -0.09 -0.05
B909 7.32 0.87 7.71 1.09 0.40 0.22
B910 13.74 1.89 13.72 1.89 -0.01 0.00
B911 29.52 4.03 32.54 4.51 3.02 0.48
Subcatchment ID
10-Year SCS Type III Storm Event
Existing Scenario Future Scenario Net Increase
Peak Runoff [cfs]
Runoff Volume [ac-ft]
Peak Runoff [cfs]
Runoff Volume [ac-ft]
Peak Runoff [cfs]
Runoff Volume [ac-ft]

© Biohabitats, Inc. Rutgers Stormwater and Landscape Management Master Plan D-33
Table D-23 Livingston model results for 10-year storm event.
L1000 135.76 18.17 135.76 18.17 0.00 0.00
L101 47.60 5.53 47.54 5.52 -0.06 -0.01
L102 32.41 3.08 35.98 3.81 3.57 0.72
L103 45.32 6.96 32.57 4.15 -12.75 -2.81
L104 46.77 5.59 47.47 5.75 0.71 0.17
L105 15.17 2.06 20.29 2.78 5.12 0.72
L106 9.79 1.21 10.17 1.28 0.38 0.07
L107 16.60 2.45 16.30 2.38 -0.30 -0.06
L1100 149.10 21.24 149.10 21.24 0.00 0.00
L200 77.24 9.33 94.87 12.38 17.62 3.05
L301 13.12 1.67 12.48 1.59 -0.63 -0.09
L302 19.47 2.04 19.21 1.99 -0.26 -0.05
L303 23.16 2.56 22.76 2.43 -0.40 -0.13
L304 10.79 1.56 9.25 0.83 -1.54 -0.73
L305 9.40 0.96 9.40 0.96 0.00 0.00
L306 13.29 1.37 15.30 2.11 2.01 0.75
L307 55.18 6.79 61.71 7.88 6.52 1.09
L308 44.88 5.65 54.90 7.32 10.01 1.67
L401 82.91 10.77 84.11 10.86 1.20 0.10
L402 3.26 0.34 3.26 0.34 0.00 0.00
L403 8.14 0.88 8.51 0.99 0.37 0.12
L404 6.58 0.68 6.91 0.81 0.32 0.13
L405 8.81 1.22 8.83 1.24 0.02 0.02
L501 28.64 3.50 29.44 3.68 0.80 0.18
L502 8.28 0.89 8.64 0.99 0.35 0.10
L503 8.30 0.78 8.89 0.97 0.59 0.20
L601 106.80 16.65 108.65 16.89 1.86 0.24
L602 10.65 0.83 10.65 0.83 0.00 0.00
L603 47.64 6.71 46.54 6.16 -1.10 -0.55
L604 50.84 8.73 50.84 8.73 0.00 0.00
L605 33.86 3.27 33.86 3.27 0.00 0.00
L606 30.61 3.24 30.60 3.24 -0.02 0.00
L607 12.08 1.57 12.18 1.62 0.10 0.06
L608 14.68 1.90 13.13 1.67 -1.56 -0.23
L700 114.84 12.61 114.84 12.61 0.00 0.00
L801 29.34 2.94 34.69 4.29 5.36 1.36
L802 19.66 2.65 21.48 3.00 1.82 0.35
L803 24.75 3.23 28.95 4.02 4.20 0.79
L900 52.05 10.74 84.23 15.33 32.18 4.59
Subcatchment ID
10-Year SCS Type III Storm Event
Existing Scenario Future Scenario Net Increase
Peak Runoff [cfs]
Runoff Volume [ac-ft]
Peak Runoff [cfs]
Runoff Volume [ac-ft]
Peak Runoff [cfs]
Runoff Volume [ac-ft]

© Biohabitats, Inc.Rutgers Stormwater and Landscape Management Master PlanD-34
Table D-24 Busch model results for 100-year storm event.Table D-24 (continued)
B101 182.90 31.95 183.75 32.04 0.85 0.08
B102 8.06 1.29 8.09 1.27 0.03 -0.01
B103 38.84 4.81 38.89 4.83 0.05 0.02
B104 175.26 20.37 175.26 20.37 0.00 0.00
B105 19.46 2.50 19.38 2.40 -0.08 -0.11
B106 21.70 2.65 21.69 2.65 -0.01 0.00
B107 50.25 6.69 50.02 6.49 -0.23 -0.20
B108 13.25 2.05 12.93 1.61 -0.32 -0.44
B109 96.03 11.10 98.97 11.93 2.93 0.83
B110 195.24 22.08 226.58 28.82 31.34 6.74
B111 41.24 5.17 41.46 5.41 0.22 0.23
B112 58.14 7.77 56.95 7.27 -1.18 -0.50
B113 44.47 5.88 44.85 6.46 0.38 0.57
B114 8.49 1.31 8.41 1.16 -0.09 -0.15
B115 8.13 1.15 7.89 0.88 -0.24 -0.27
B116 6.62 0.93 6.50 0.75 -0.12 -0.17
B201 38.01 3.71 37.90 3.62 -0.10 -0.09
B202 28.31 3.59 28.41 3.61 0.09 0.02
B203 54.08 6.78 54.64 7.22 0.57 0.45
B204 19.57 2.45 22.96 3.14 3.39 0.69
B205 26.93 3.82 26.78 3.60 -0.15 -0.22
B301 158.70 26.19 156.30 25.92 -2.40 -0.27
B302 90.83 16.81 90.29 16.76 -0.55 -0.05
B303 73.73 7.16 73.66 7.14 -0.07 -0.02
B304 20.63 3.03 20.56 2.92 -0.07 -0.11
B305 10.73 1.15 10.78 1.17 0.05 0.02
B401 201.26 40.27 200.73 40.21 -0.53 -0.06
B402 123.14 13.55 122.54 13.12 -0.60 -0.43
B403 99.80 11.29 99.26 11.04 -0.54 -0.25
B404 4.21 0.49 4.22 0.50 0.01 0.01
B405 118.05 15.39 119.37 15.98 1.32 0.59
B406 54.45 5.06 54.45 5.06 0.00 0.00
B407 60.27 7.97 60.38 8.10 0.11 0.13
Subcatchment ID
100-Year SCS Type III Storm Event
Existing Scenario Future Scenario Net Increase
Peak Runoff [cfs]
Runoff Volume [ac-ft]
Peak Runoff [cfs]
Runoff Volume [ac-ft]
Peak Runoff [cfs]
Runoff Volume [ac-ft]
B408 23.75 3.33 23.99 3.73 0.24 0.40
B409 42.10 5.47 42.21 5.64 0.11 0.17
B410 36.69 4.71 36.80 4.81 0.11 0.11
B411 12.62 1.82 12.43 1.52 -0.18 -0.31
B501 524.49 79.63 524.49 79.63 0.00 0.00
B502 19.08 1.87 19.08 1.87 0.00 0.00
B503 20.45 2.92 20.77 3.15 0.32 0.23
B504 37.39 3.55 37.38 3.55 -0.02 0.00
B505 50.06 6.17 49.87 6.00 -0.19 -0.17
B506 8.28 1.28 8.25 1.22 -0.04 -0.06
B507 132.75 15.57 132.84 15.58 0.09 0.01
B508 31.59 4.08 31.51 4.01 -0.08 -0.07
B509 23.92 3.24 24.08 3.46 0.16 0.22
B510 14.81 1.89 14.84 1.89 0.04 0.00
B511 23.54 3.21 23.55 3.21 0.00 0.00
B600 89.42 10.18 89.42 10.18 0.00 0.00
B701 77.54 8.86 77.26 8.72 -0.28 -0.14
B702 13.39 1.75 13.58 2.03 0.19 0.28
B801 53.72 7.07 54.13 8.09 0.41 1.02
B802 17.70 2.37 17.21 2.37 -0.50 0.00
B803 16.61 2.52 15.31 2.03 -1.30 -0.48
B901 29.20 3.31 33.29 4.04 4.09 0.73
B902 20.47 2.42 20.80 2.61 0.33 0.19
B903 15.49 1.92 15.77 2.07 0.28 0.15
B904 45.56 6.19 45.72 6.40 0.16 0.21
B905 11.82 1.39 11.87 1.45 0.05 0.06
B906 4.13 0.53 4.19 0.62 0.06 0.09
B907 4.79 0.56 4.76 0.57 -0.03 0.01
B908 26.90 3.96 26.82 3.90 -0.08 -0.06
B909 12.66 1.64 12.85 1.89 0.19 0.25
B910 23.33 3.35 23.33 3.34 0.00 -0.01
B911 58.14 7.87 60.62 8.41 2.48 0.54
Subcatchment ID
100-Year SCS Type III Storm Event
Existing Scenario Future Scenario Net Increase
Peak Runoff [cfs]
Runoff Volume [ac-ft]
Peak Runoff [cfs]
Runoff Volume [ac-ft]
Peak Runoff [cfs]
Runoff Volume [ac-ft]

© Biohabitats, Inc. Rutgers Stormwater and Landscape Management Master Plan D-35
Table D-25 Livingston model results for 100-year storm event.
L1000 342.29 44.31 342.29 44.31 0.00 0.00
L101 123.44 14.23 123.39 14.22 -0.06 -0.01
L102 73.93 7.70 76.19 8.53 2.26 0.83
L103 76.52 11.84 68.75 8.56 -7.77 -3.28
L104 85.82 10.85 86.17 11.05 0.35 0.20
L105 48.50 6.39 54.87 7.24 6.37 0.85
L106 20.51 2.53 20.75 2.61 0.24 0.08
L107 29.40 4.33 29.24 4.26 -0.17 -0.07
L1100 363.34 49.37 363.34 49.37 0.00 0.00
L200 179.16 21.65 195.99 25.22 16.82 3.57
L301 31.95 3.93 31.33 3.83 -0.62 -0.09
L302 40.05 4.55 39.90 4.50 -0.16 -0.05
L303 41.23 5.06 41.04 4.91 -0.18 -0.14
L304 17.90 2.69 17.19 1.85 -0.72 -0.83
L305 27.21 2.99 27.21 2.99 0.00 0.00
L306 24.68 2.86 25.60 3.71 0.93 0.85
L307 111.77 14.04 116.68 15.27 4.91 1.23
L308 91.85 11.70 99.38 13.58 7.53 1.88
L401 161.34 21.18 162.52 21.28 1.18 0.10
L402 5.80 0.69 5.80 0.69 0.00 0.00
L403 14.68 1.77 14.88 1.90 0.20 0.13
L404 11.78 1.39 11.92 1.54 0.14 0.15
L405 14.71 2.14 14.73 2.16 0.01 0.02
L501 53.56 6.84 54.05 7.05 0.49 0.20
L502 15.17 1.81 15.34 1.92 0.17 0.11
L503 15.36 1.69 15.62 1.92 0.26 0.23
L601 249.90 36.83 252.14 37.11 2.24 0.27
L602 19.72 1.97 19.72 1.97 0.00 0.00
L603 79.84 11.71 79.40 11.08 -0.44 -0.63
L604 142.68 22.10 142.68 22.10 0.00 0.00
L605 68.28 7.46 68.28 7.46 0.00 0.00
L606 64.82 7.38 64.81 7.38 -0.01 0.00
L607 20.35 2.82 20.43 2.89 0.08 0.07
L608 30.78 3.91 29.42 3.65 -1.36 -0.26
L700 326.30 36.36 326.30 36.36 0.00 0.00
L801 60.02 6.57 62.71 8.14 2.69 1.57
L802 40.81 5.35 42.29 5.75 1.48 0.40
L803 48.84 6.42 51.88 7.31 3.04 0.89
L900 144.94 27.25 192.61 32.48 47.67 5.23
Subcatchment ID
100-Year SCS Type III Storm Event
Existing Scenario Future Scenario Net Increase
Peak Runoff [cfs]
Runoff Volume [ac-ft]
Peak Runoff [cfs]
Runoff Volume [ac-ft]
Peak Runoff [cfs]
Runoff Volume [ac-ft]

© Biohabitats, Inc.Rutgers Stormwater and Landscape Management Master Plan


