Embed Size (px)
Citation preview
i:\07\81694\0400\tailingcelldesign-fnl-06oct08\073-81694-tailingscelldesignrep_fnl-06oct08.doc Golder Associates
APPENDIX C
ANCHOR TRENCH EVALUATION

October 2008 C-1 073-81694.0003
i:\07\81694\0400\tailingcelldesign-fnl-06oct08\appendices\app c\app c .docx Golder Associates
APPENDIX C
ANCHOR TRENCH EVALUATION
Due to both the long-term exposure of the tailings cell liner system to wind effects and the
long slope runs (i.e., on the order of 300 feet), the liner system design incorporates anchorage
and buttressing considerations. This appendix presents the following calculations related to liner
anchorage against wind uplift forces:
• Appendix C-1 presents an analysis of wind uplift forces;
• Appendix C-2 presents the anchor trench capacity calculations; and
• Appendix C-3 presents a calculation for buttressing at the tailings cell benches.
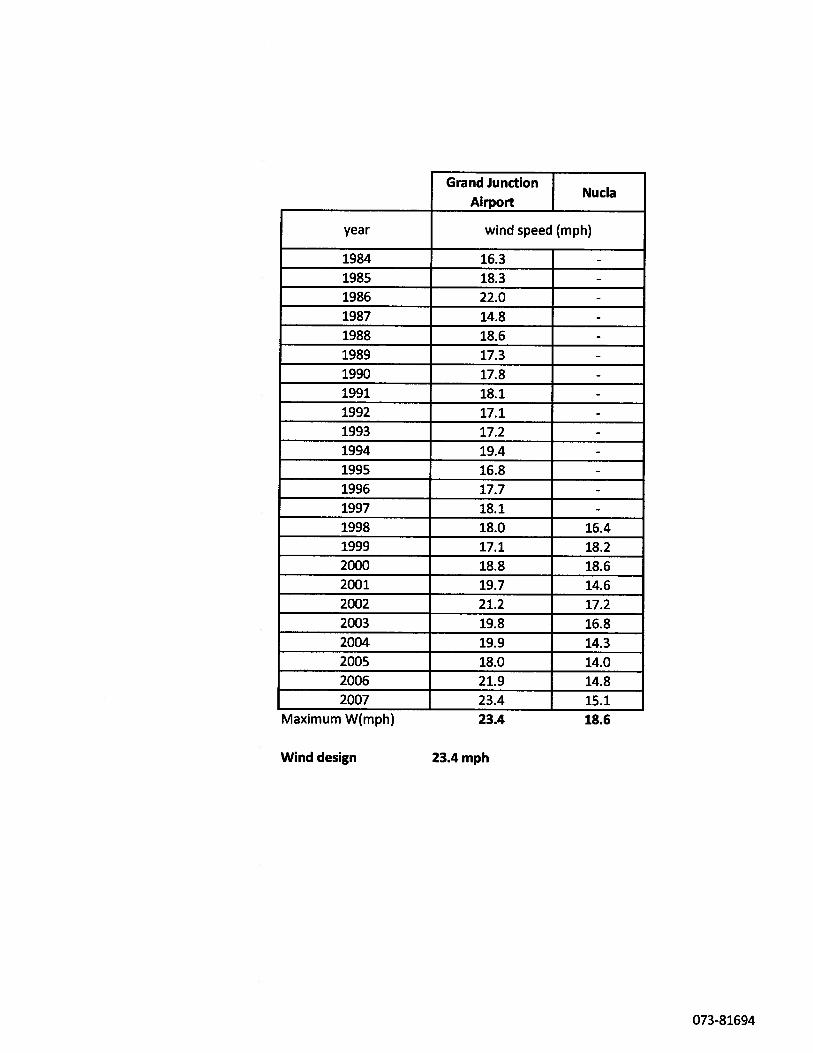
A design wind velocity of 23.4 miles per hour (mph) was used based on the highest recorded wind
speed at the Grand Junction Airport over the past 23 years. Geomembrane wind uplift analyses,
presented in Appendix C-1, were conducted using the method proposed by Giroud et al.
(1995). These analyses indicate that the maximum strain on the high density polyethylene
(HDPE) geomembrane liner is expected to be 1.5 percent, which is well below the yield
elongation of 12 percent for 60 mil HDPE geomembrane liner. Therefore, permanent
deformations are not expected in the geomembrane due to wind effects.
The wind uplift analyses also provided design forces and inclinations required for evaluation
of the geomembrane anchor trench. Results show the maximum tension in the liner to be 151
pounds per foot (lb/ft) at an inclination of 17 degrees with respect to the surface of the side slope.
The tensile strength capacity of the proposed tailings cell liner anchor trench was evaluated
using the methodology presented by Koerner (1998), included in Appendix C-2. These
analyses indicate that the anchor trench, as designed, will provide sufficient resistance to the
forces developed in the geomembrane due to wind uplift, with a factor of safety greater
than 8.

October 2008 C-2 073-81694.0003
i:\07\81694\0400\tailingcelldesign-fnl-06oct08\appendices\app c\app c .docx Golder Associates
The tailings cells were designed with intermediate benches to provide additional anchorage of the
geomembrane liner system. Tailings Cell A is designed with an anchor bench at the mid-height of the
tailings cell, while Tailings Cells B and C are designed with two intermediate anchor benches. The
following design components have been incorporated into the anchor benches:
• An anchor trench will be constructed to provide additional anchorage of the underlying geosynthetic clay liner (GCL) layer; and
• Buttressing of the liner system will be employed by placement of corrugated HDPE pipes backfilled with soil or grout, and secured by sandbags, to limit uplift of the liner system due to wind effects (see calculation provided in Appendix C-3).
REFERENCES
Giroud, J.P., Pelte, T., and Bathurst, R.J. 1995. “Uplift of geomembrane by wind.” Geosynthetics International, 2(6), 897-953.
Koerner, R.M. 1998. Designing With Geosynthetics. Prentice Hall: Upper Saddle River,
New Jersey.

i:\07\81694\0400\tailingcelldesign-fnl-06oct08\073-81694-tailingscelldesignrep_fnl-06oct08.doc Golder Associates
APPENDIX C-1
GEOMEMBRANE WIND UPLIFT ANALYSES
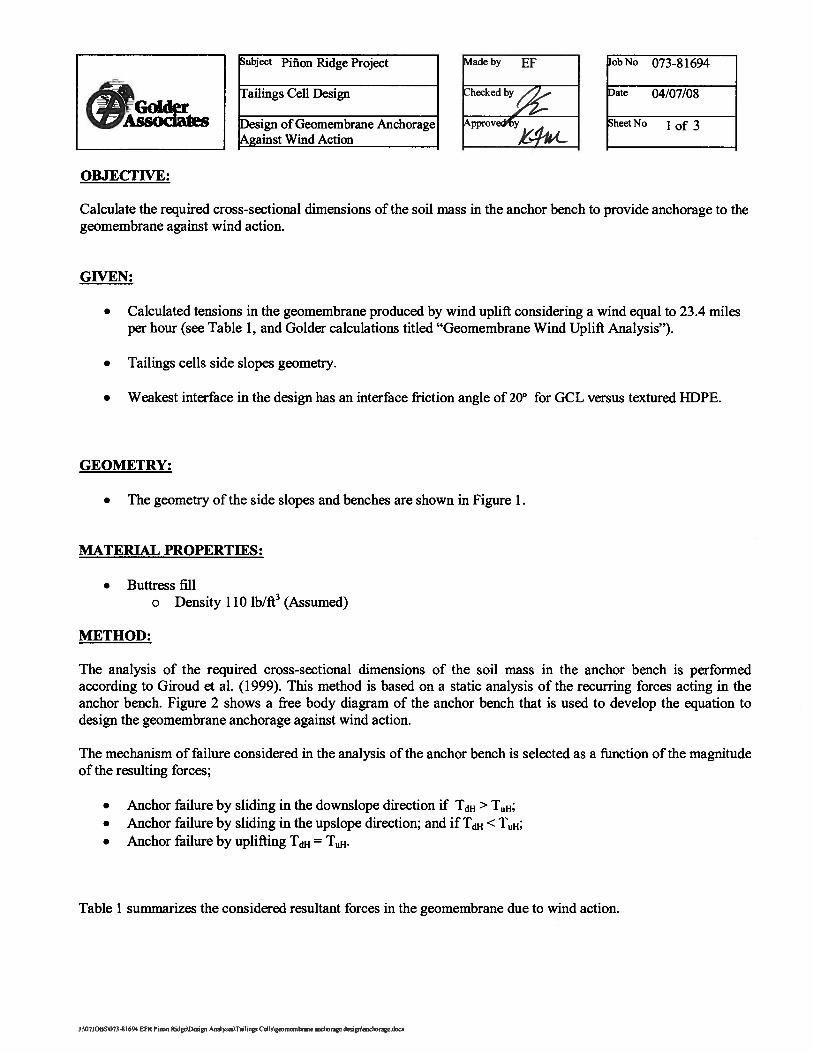
OBJECflVE:
The objective is to estimate the tensions and deformations of the geomembrane during wind uplift consideringanchor trenches at the top of the slopes and buttressing at the base of the slope for the leeward slopes. The cases tobe investigated are:
• Case 1 At the base of the tailings cells;• Case 2 On the leeward slope of the tailings cells Al and A2; and• Case 3 On the leeward slope of the tailings cells B and C.
GIVEN:
• The tailings cell layout plan;• Geomembrane typical properties; and• Design wind velocity of 23.4 mph (37.7 km/br) (see Attachment 7).
GEOMETRY:
• The assumed geometrical configuration of the base of the tailing cells and the leeward slopes are shownin Figure 1.
MATERIAL PROPERTIES:
• Geomembrane (Textured HDPE geomembrane, see Attachment 8)o Density 58.7 lb/ft3o Thickness 60 milo Yield Strengtho Break Strengtho Yield Elongationo Break Elongationo Mass
METHOD:
126 lb/in= 1,512 lb/ft=22 KN/m90 lb/in = 1,080 lb/ft = 15.8 KN/m12%100%0.284 lb/ft2 = 1.43 Kg/m2
• The analysis of the tension and deformations of the geomembrane during uplift is performed according toGiroud et al.(1995).
ASSUMPTIONS:
• A HDPE pipe filled with sand or grout at the bottom of the cell sideslope is placed to provide anchorageto the geomembrane;
• Two I-IDPE pipe filled with sand or grout are placed on sideslope benches to provide anchorage to thegeomembrane;
• The magnitude of suction does not change in response to changes in geomembrane shape after initialuplift;
• The geomembrane is sealed around its perimeter;• The problem is assumed to be two dimensional;
ubject Piñon Ridge
‘aiings Cell Design
eomembrane Wind Uplift Analysis
obNo 073-81694
)ate 04/07/08
heetNo 1 of 3
J:O7JOS’734I694 EFR Pi RidgcDa. AnT&inp Cdk\i

• The tensile characteristics of the geomembrane do not depend on temperature;• The geomembrane did not experience initial uplift leading to a change in aerodynamic flow;• The tension-strain curve has a peak;• The suction factors (A) according to Giroud et al.(l 995) assumed in these calculations are: 0.4 for the
base of the tailings cells; 0.8 for the leeward slope of the reservoir upper portion tailing cells Al and A2,0.6 for the leeward slope of the reservoir, lower portion, tailing cells Al and A2; 0.9 for the leeward slopeof the reservoir, upper portion, tailing cells B and C; 0.7 for the leeward slope of the reservoir, middleportion, tailing cells B and C; and 0.55 for the leeward slope of the reservoir, lower portion, tailing cells Band C
CALCULATIONS:
The calculations are presented in the following Attachments:
• Attachment 1• Attachment 2• Attachment 3• Attachment 4• Attachment 5• Attachment 6
Case 1 At the base of the reservoir;Case 2 On the leeward slope of the reservoir, upper portion, tailing cells Al and A2;Case 2 On the leeward slope of the reservoir, lower portion, tailing cells Al and A2;Case 4 On the leeward slope of the reservoir, upper portion, tailing cells B and C;Case 4 On the leeward slope of the reservoir, middle portion, tailing cells B and C; andCase 4 On the leeward slope of the reservoir, lower portion, tailing cells B and C;
Figure 2 shows a schematic representation of uplifted geomembrane used for developing equations to estimate thedeformation in the geomembrane due to wind suctions.
RESULTS:
The following table summarizes the results:
ubject Piñon Ridge
Failings Cell Design
ieomembrane Wind Uplift Analysis
4adeby EF
Dhecked by
jprovedbYUL
obNo 073-81694
)ate 04/07/08
heetNo 2 of 3
length Strain u T 8(ft) (%) (ft) (lb/ft) (degrees)
Cells A,B and C Cell base 253 1.1 16.6 93 14.6upper portion
Cells Al and A2 (0.5L)1 131 1.5 9.8 151 17.0Slopeside lower portion
(0.51)1 131 1.1 8.5 82 14.8upper portion
(0.25L)1 66 1.1 4.2 103 14.6Cells B and C middle portion
Slopeside (0.33L)1 87 1.2 5.9 89 15.5lower portion
(0.42L)1 110 1.0 6.9 82 14.3= total length of the slope

ubject Piñon Ridge 4adeby EF obNo 073-81694
ailings Cell Design hecked by 7), ‘ate 04/07/08
eomembrane Wind Uplift Analysis woved heet No 3 of 3
CONCLUSIONS:
The analyses shows that the tensions produced in the geomembrane by the wind uplift forces are significantlybelow the tensile yield strength for the considered geomembrane (i.e. FS > 10). Nevertheless due to the tensilebehavior of the geomembrane, deformations are a controlling parameter.
The maximum strain expected in the geomembrane is 1.5%. For all considered cases, the strain in thegeomembrane is less than 12%. Therefore permanent deformations are not expected in the geomembrane.
The anchor trench at the top of the cell sides lope should resist a minimum force equal to 151 lb/ft with aninclination (0) of 17 degrees with respect to the surface of the sideslope.
REFERENCES:
Giroud, J. P., Pelte, T., and Bathurst, R. J. (1995). “Uplift of geomembranes by wind.” GeosyntheticsInternational, 2(6), 897-953.
J:O7JOBS’734I694 EFR Pn RidgDgn ATaIigs CdI,wi1 qdiflqthfl3.doc

saInoH

Gro
ute
dH
DPE
pip
e
CA
SE1:
BA
SEO
FTA
ILIN
GS
CELL
lv
Gro
ute
dH
DPE
pipe
Ben
ch
Gro
uted
HD
PEp
ipe
3H
lv
CA
SE2:
TAIL
ING
SCE
LLS
A.1
AN
DA
.2
Anc
hor
tren
ch
CA
SE3:
TAIL
ING
SCE
LLS
BA
ND
C
Col
orad
oC
IJE
NT
IPR
OJE
CT EN
ER
GY
FUE
LS
RE
SOU
RC
ES
CO
RPO
RA
TIO
NP
IIIO
NR
IDG
EP
RO
JEC
T
GEO
MET
RIC
AL
CO
NFI
GU
RA
TIO
NFO
RCA
SE1,
CASE
2,A
ND
CASE
3A
PRIL
720
08.T
..
lv
Gro
uted
HD
PEpi
pe
NrN
NN
3H
Lin
er
7
/1
252.
5ft
1
3H
Lin
erA
ncho
rtr
ench
Lin
er
Ben
ch
Gro
ute
d
HD
PEpi
pe
O.3
3LO
.25L
lv
3H
FILE
NO
.Fi
gure
s-up
lift.p
ptx

T
Rep
rodu
ced
from
Gir
oud
etal
.(19
95)
pp.
918
Se=
effe
ctiv
esu
ctio
nT
=ge
omem
bran
ete
nsio
n0
=an
gle
u=
uplif
tL
=co
nsid
ered
leng
thF
=re
sult
ant
forc
e
TITL
E
,.
SCH
EMA
TIC
REP
RES
ENTA
TIO
NO
FU
PLIF
TG
EO
ME
MB
RA
NE
Ib
Den
ver,
Col
orad
o
EN
ER
GY
FU
EL
SR
ES
OU
RC
ES
CO
RP
OR
AT
ION
CH
EC
KE
DSC
ALE
N.T
.S.
DW
G.N
O.
CL
IEN
T/P
RO
JEC
TD
PPW
ND
ATE
APR
IL7
2008
J08N
007
3-81
694
PIFc
ION
RID
GE
PR
OJE
CT
RE
VIE
WE
DFI
LEN
O. Fi
gure
s-up
lift.p
ptx
FIG
UR
EN
O.
2
R
T
0

ATTACHMENT 1
Made by: EF A Subject: Piñon Ridge
•Checked by:/— Job No. 073-81694
• Approved by. I/Is4A Date: 4/7/2008SheetNo.1 of 4
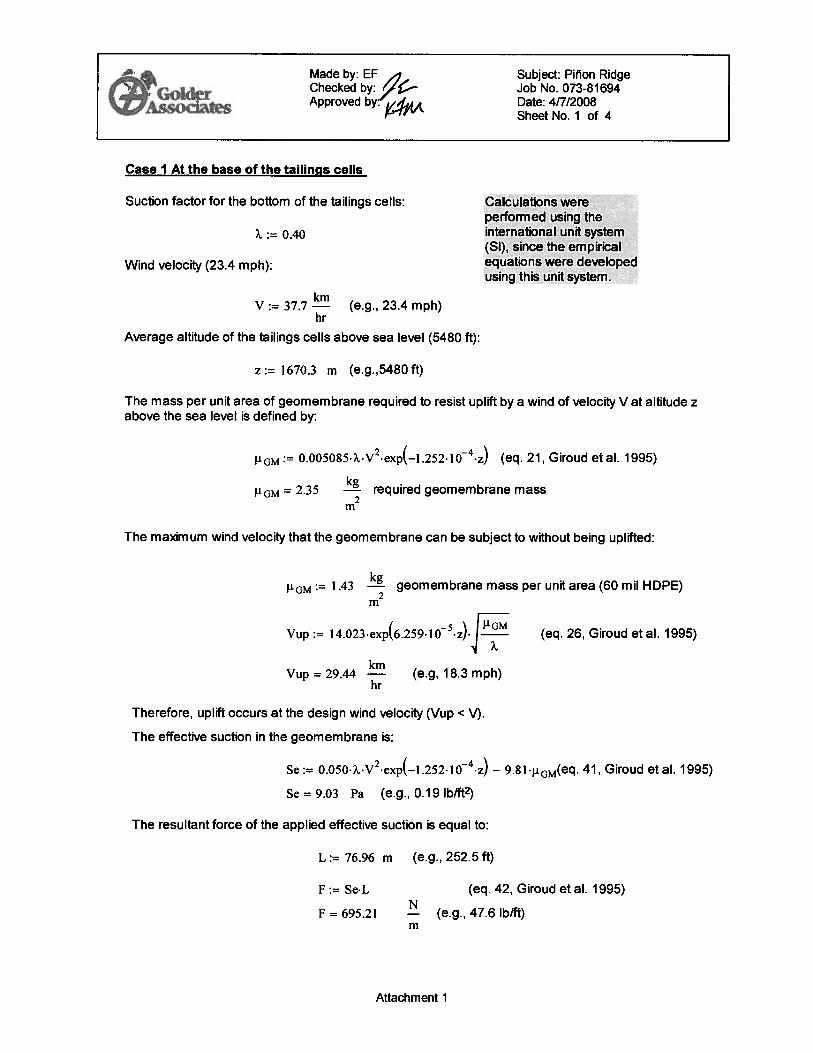
Case I At the base of the tailings cells
Suction factor for the bottom of the tailings cells: ‘álculations,weie -
per ôrii’ ing the::= 0.40 iñternàtionaluñitsS,steni
rSI),sincethe empiñcaI’
Wind velocity (23.4 mph): equatiôn&we’re developedsg tflis unitsy’..,
V := 37.7 (e.g., 23.4 mph)hr
Average altitude of the tailings cells above sea level (5480 ft):
z := 1670.3 m (e.g.,5480 ft)
The mass per unit area of geomembrane required to resist uplift by a wind of velocity Vat altitude zabove the sea level is defined by:
VGM=0.005085.?..V2.exp(_l.252.10_4.z) (eq. 21, Giroudetal. 1995)
GM = 2.35 - required geomembrane mass
The maximum wind velocity that the geomembrane can be subject to without being uplifted:
GM := 1.43 .. geomembrane mass per unit area (60 mil HDPE)
Vup := 14.023.exP(6.259.10_5.z).j!.$!! (eq. 26, Giroud etal. 1995)
Vup = 29.44 (e.g, 18.3 mph)hr
Therefore, uplift occurs at the design wind velocity (Vup < V).
The effective suction in the geomembrane is:
Se := 0.050..V2.exp(_1 .252 io.) — 9.81 41, Giroud et al. 1995)
Se= 9.03 Pa (e.g.,0.l9lbIft2)
The resultant force of the applied effective suction is equal to:
L := 76.96 m (e.g., 252.5 ft)
F:= Se.L (eq.42, Giroudetal. 1995)
F = 695.21 (e.g., 47.6 lb/ft)
Attachment 1

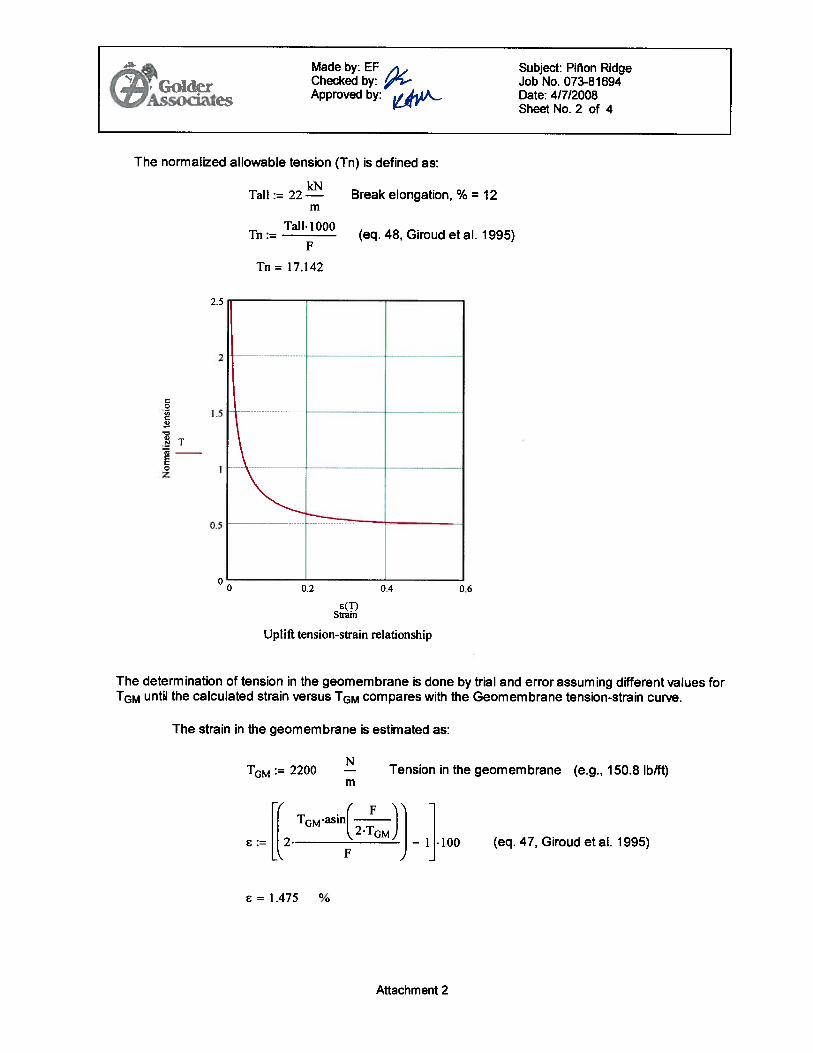
The normalized allowable tension (Tn) is defined as:
Tall := 22
Tall. 1000Tn :=
F
Tn 31.64
Break elongation, % = 12
(eq.48, Giroudetal. 1995)
0
CI)
NT
0
£(T)Strain
Uplift tension-strain relationship
The determination of tension in the geomembrane is done by trial and error assuming different values forTGM until the calculated strain versus TGM compares with the Geomembrane tension-strain curve.
The strain in the geomembrane is estimated as:
TGM.asin(F
2.TGM:= 2 —1 .100
F
E=1.14 00
Made by: EF Subject: Piñon Ridge
fIi Checked by: Job No. 073-81694, Approved by: Date: 4/7/2008
Sheet No. 2 of 4
TGM:= 1350N
mTension in the geomembrane (e.g., 92.5 lb/It)
(eq. 47, Giroud etal. 1995)
Attachment I

rrC0
GM...
TGMTGM
1000TGM= 1.35 (i.e., 92.5 lb!ft)
95 100
The orientation of the geomembrane tension at both extremities of the geomembrane is:
TOM. 1000Tn :=
Tn = 1.94
F
.( io := asini‘ 2 Tn
o = 0.26 adians
(eq. 56, Giroud et al. 1995)
(i.e., 14.6 degrees)
The geomembrane uplift is:
u:= 0.5.tan(!’1.L2)
u=5.04 m
(eq. 54, Giroud et al. 1995)
(i.e., 16.6 ft)
.. Made by: EF Subject: Piñon Ridge
4. Checked by: Job No. 073-81694
• Approved by(fr{ Date: 41712008Sheet No. 3 of 4
CE , CStrain [0]
Geomembrane tension-strain curve
Attachment 1

Made by: EF /1 - Subject: Piñon Ridge
e1Checked by: /6— Job No. 073-81694
• bApproved by: Date: 4/7/2008
Sheet No. 4 of 4
Plots data:
E(T) := 2.T.asiJ_!_— 1
2.TJ
T:= 0.50,0.51 .. 2.5
‘O
2 3
12 22IT :=
20 21
50 19
\100 \16,
Attachment I

ATTACHMENT 2

Made by: EF g, Subject: Piñon RidgeChecked by: ,$ Job No. 073-81694
• Approved by: ,iiaA Date: 4/7/2008Sheet No. I of 4
Case 2 On the leeward slope of the tailings cells (cells Al and A2). lower portion
Suction factor for the leeward slope of the tailings cells:Calculations were
:= 0.51 for the lower portion of the slope performed using theinternational unit system
Wind velocity: (SI), since the empiricalequations were developedusing this unit system.
V := 37.7 — (e.g., 23.4 mph)hr
Altitude above sea level:
z := 1670.3 m (e.g.,5480 ft)
The mass per unit area of geomembrane required to resist uplift by a wind of velocity Vat altitude zabove the see level is defined by:
LGM := O.005085..V2.exp(_l.252.l0_4.z) (eq. 21, Giroud etal. 1995)
GM = 2.99 .! required geomembrane mass
The maximum wind velocity that the geomembrane can be subject to without being uplifted:
GM := 1.431 - geomembrane mass per unit area (60 mil HDPE)
Vup := 14.023.exp(6.259.105.z).!±! (eq. 26, Giroud etal. 1995)
Vup = 26.078 (e.g, 14.9 mph)hr
The effective suction in the geomembrane is:
Se:= 0.050.2..V2.exp(_1.252.10_4.z)— 9.81.(eq. 41, Giroud etal. 1995)
Se = 15.366 Pa (e.g., 0.43 lbIft2)
The resultant force of the applied effective suction is equal to:
L:= 40.0 m (e.g., 131 .2 ft)
F := Se.L(eq. 42, Giroud et al. 1995)
F = 6 14.625 (e.g., 56.3 lb/ft)
Attachment 3

The normalized allowable tension (Tn) is defined as:
0
0
•0
. T
0
kNTall := 22 —
m
Tall 1000Tn
F
Tn = 35.794
Break elongation, % = 12
0.6
Uplift tension-strain relationship
The determination of tension in the geomembrane is done by trial and error assuming different values forTGM until the calculated strain versus TGM compares with the Geomembrane tension-strain curve.
The strain in the geomembrane is estimated as:
(eq. 47, Giroud et al. 1995)
Made by: EF ,- Subject: Piñon Ridge
. 4cr Checked by:.4.— Job No. 073-81694• - Approved by. Date: 4/7/2008
Sheet No. 2 of 4
E(T)Strain
TGM:= 1200 Tension in the geomembrane (e.g., 82.2 lbift)
El2.TGM.asin(FJ]
-
[L\ F
E — 1.127 00
Attachment 3

TGMTOM
1000TOM = 1.2 (i.e., 82.2 lb/ft)
ETT
• TGM...
45 50 55 60 65 70 75 80 85 90 95 100
CStrain [001
The orientation of the geomembrane tension at both extremities of the geomembrane is:
TOM. 1000Tn :=
F
Tn= 1.952
.( 1o := asini —2Tn
o = 0.259 radians
(eq. 56, Giroud et al. 1995)
(i.e., 14.8 degrees)
The geomembrane uplift is:
u:— O.5•tan(’L2)
u=2.604 m
(eq. 54, Giroud et al. 1995)
(i.e., 8.54 ft)
Made by: EF A Subject: Piñon Ridge
f . Checked by:fr’- Job No. 073-81694Approved by. 4p4j, Date: 4/7/2008
Sheet No. 3 of 4
00 5 10152025303540
Geomembrane tension-strain curve
Attachment 3

Made by: EF j Subject: Piñon Ridgee, Checked by: Job No. 073-81694. ASSOO2S
Approved by: Date: 4/7/2008Sheet No. 4 of 4
Plots data
e(T) := 2.T.asin(—J-- — i2.T)
T := 0.50, 0.5 1.. 2.5
2 3
12 22TT:=
20 21
50 19
8O0 16,
Attachment 3

ATTACHMENT 3

Made by: EF /), Subject: Piñon RidgeChecked by: >.Z.. Job No. 073-81694
, Approved by: Date: 4/7/2008Sheet No. I of 4
Case 2 On the leeward slope of the tailings cells (cells Al and A2). upper portion
Suction factor for the leeward slope of the tailings cells:Calculations were
:= 0.8 for the upper portion of the slope performed using theinternational unit system
Wind velocity: (SI), since the empiricalequations were developedusing this unit system.
V := 37.7 — (e.g., 23.4 mph)hr
Altitude above sea level:
z := 1670.3 m (e.g., 5480 ft)
The mass per unit area of geomembrane required to resist uplift by a wind of velocity V at altitude zabove the see level is defined by:
:= 0.005085.X.V2.exp(_l.252.l0_4.z) (eq. 21, Giroud etal. 1995)
GM = 4.691 required geomembrane mass
The maximum wind velocity that the geomembrane can be subject to without being uplifted:
GM := 1.431 geomembrane mass per unit area (60 miI HDPE)
Vup := I4.023.exP(6.259.10_5.z).j.L!. (eq. 26, Giroud etal. 1995)
Vup = 20.822 .!E! (e.g, 12.9 mph)hr
The effective suction in the geomembrane is:
Se:= 0.050..V2.exp(_1.252.10_4.z)_ 9.81.1.t0q.4l, Giroudetal. 1995)
Se = 32.085 Pa (e.g., 0.67 lb/ft2)
The resultant force of the applied effective suction is equal to:
L:=40.O m (e.g.,131.2ft)
F:= Se•L (eq.42, Giroudetal. 1995)
F = 1.283 x (e.g., 87.9 IbIft)
Attachment 2
The normalized allowable tension (Tn) is defined as:
C0
CV
•0V
0
Tall := 22.!
Tall. 1000Tn
F
Tn= 17.142
Break elongation, % = 12
(eq. 48, Giroud etal. 1995)
06
c(T)Strain
Uplift tension-strain relationship
The determination of tension in the geomembrane is done by trial and error assuming different values forTGM until the calculated strain versus TGM compares with the Geomembrane tension-strain curve.
The strain in the geomembrane is estimated as:
(FTGM•asin
2 TOM£ := 2 — 1 .100 (eq. 47, Giroud etal. 1995)
F
Made by: EF Subject: Piñon Ridge
Mer Checked by: Job No. 073-81694Approved by: Date: 4/7/2008
Sheet No. 2 of 4
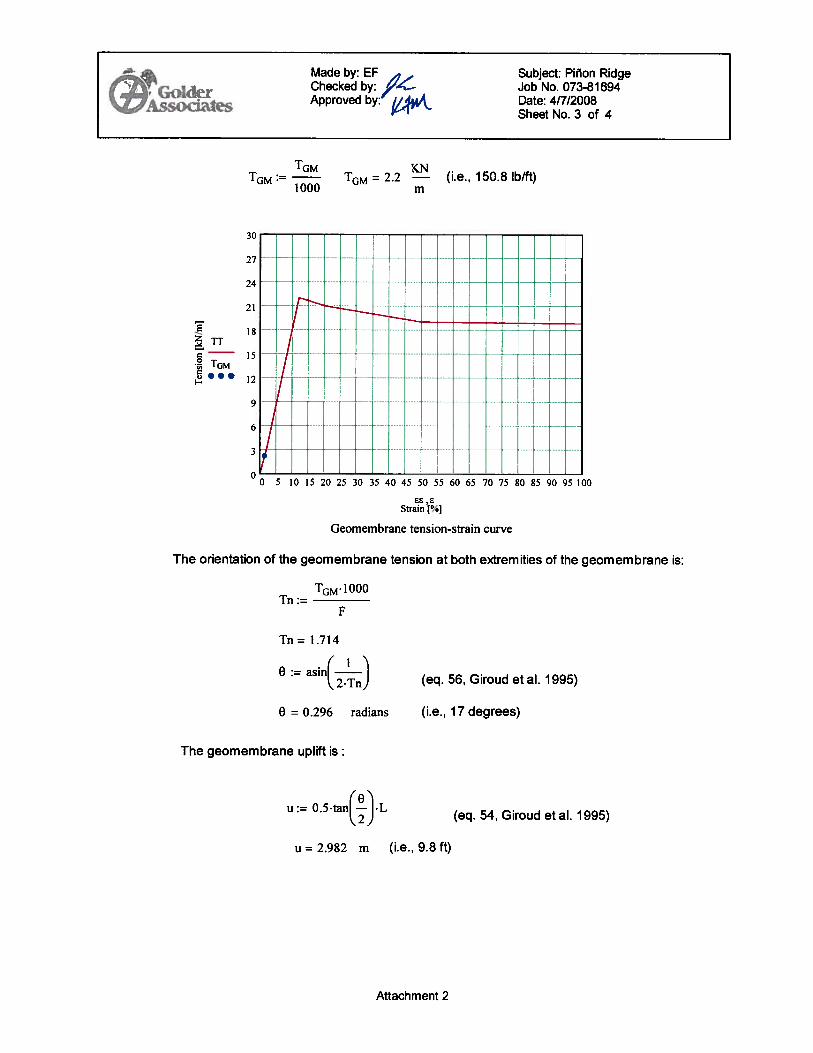
TOM := 2200N
mTension in the geomembrane (e.g., 150.8 lb/ft)
= 1.475 0
Attachment 2
ETTC 15• T...
u:= O.5.tan(!.}L
u = 2.982 m (i.e., 9.8 ft)
Made by: EF Subject: Piñon Ridge
• Checked by: Job No. 073-81694
• . Approved by:’1( Date: 41712008Sheet No. 3 of 4
TGM KNTGM := TGM = 2.2 — (i.e., 150.8 lb/It)
1000 m
0 5 101520253035404550556065707580859095100
EEStrain (0]
Geomembrane tension-strain curve
The orientation of the geomembrane tension at both extremities of the geomembrane is:
TGM.I000Tn :=
F
Tn= 1.714
.( ie := asini —2.Tn
0 = 0.296 radians
The geomembrane uplift is:
(eq. 56, Giroud etal. 1995)
(i.e., 17 degrees)
(eq. 54, Giroud etal. 1995)
Attachment 2

Made by: EF Subject: Piñon RidgeChecked by: Job No. 073-81694
VApproved by. Date: 4/7/2008
Sheet No. 4 of 4
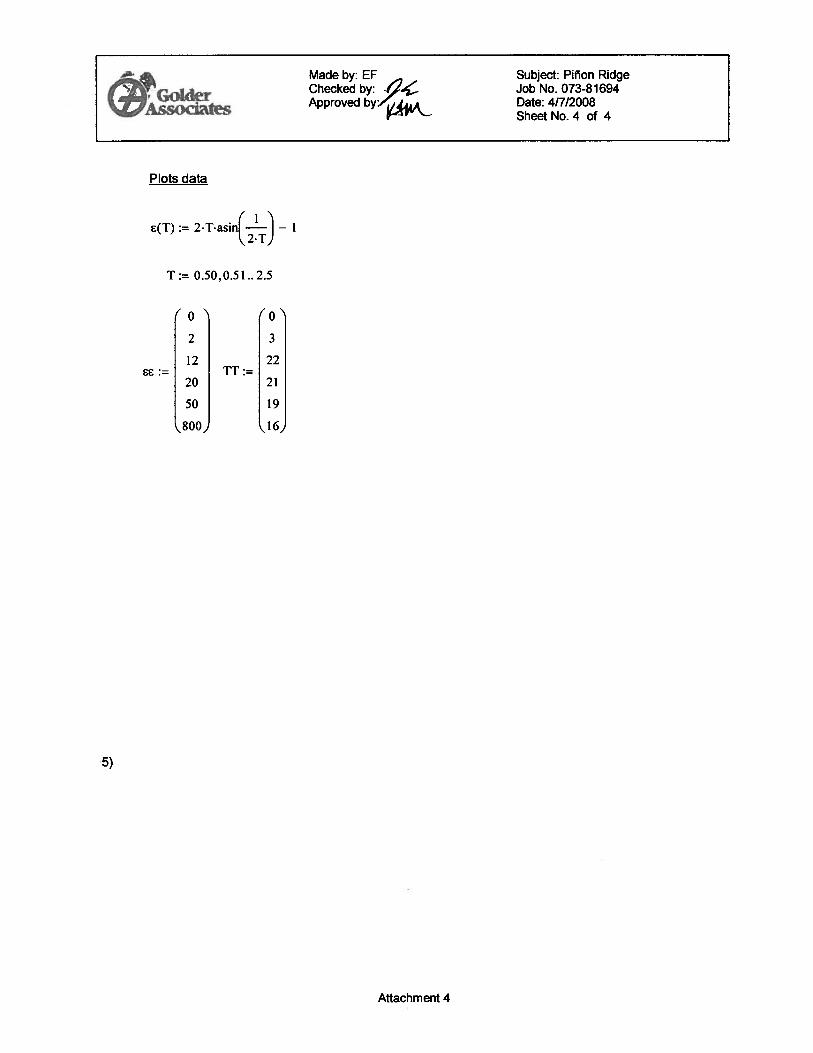
Plots data
c(T) := 2.T.asiJ_!_”— 1
L\2.T)
T:= 0.50,0.51.. 2.5
‘0
2 3
12 22IT :=
20 21
50 19
80O 16
Attachment 2

ATTACHMENT 4

Made by: EF , Subject: Piñon Ridge- . Checked by: /6 Job No. 073-81694•1, Approved by(j Date: 4/7/2008
SheetNo.1 of 4
Case 3 On the leeward slope of the tailings cells (cells B and C), upper portion
Suction factor for the leeward slope of the reservoir:Calculations wereperformed using the
:= 0.9 for the upper portion of the slope international unit system(SI), since the empirical
Wind velocity: equations were developedusing this unit system.
V := 37.7 .!! (e.g., 23.4 mph)hr
Altitude above sea level:
z := 1670.3 m (e.g., 5480 ft)
The mass per unit area of geomembrane required to resist uplift by a wind of velocity V at altitude zabove the see level is defined by:
1iGM := 0.005085..V2.exp(_1.252.10_4.z) (eq. 21, Giroud etal. 1995)
= 5.28 .! required geomembrane mass
The madmum wind velocity that the geomembrane can be subject to without being uplifted:
:= 1.431 . geomembrane mass per unit area (60 mil HDPE)
Vup := 14.023.exp(6.259.IO_5.z).M (eq. 26, Giroud etal. 1995)
Vup = 19.63 — (e.g, 12.2 mph)
The effective suction in the geomembrane is:
Se:= 0.050.)..V2.exp(_1.252.10_4.z)_ 9.81.j.tGM (eq.41, Giroudetal. 199
Se = 37.85 Pa (e.g., 0.79 lb/ft2)
The resultant force of the applied effective suction is equal to:
L := 20.0 m (e.g., 65.6 ft)
F := SeL (eu. 42, Giroud et al. 1995)
F = 757.02 (e.g., 51.9 lblft)
Attachment 4

The normalized allowable tension (Tn) is defined as:
0
0V
NT
Tall := 22.!
Tall. 1000Tn :=
F
Tn = 29.06
Break elongation, % = 12
(eq. 48, Giroud etal. 1995)
0.6
Uplift tension-strain relationship
The determination of thension in the geomembrane is done by trial and error assuming different valuesfor TGM untill the calculated strain versus TGM compares with the Geomembrane tension-strain curve.
The strain in the geomembrane is estimated as:
TGM•asinF
E:= 2•2.TGM)
— i .100F
e=1.09 %
Made by: EF Subject: Piñon Ridge
f • 4cr Checked by: Job No. 073-81694
• Approved by: Date: 41712008Sheet No. 2 of 4
e(T)Strain
TGM:= 1500N
mTension in the geomembrane (e.g., 102.8 lblft)
(eq. 47, Giroud et al. 1995)
Attachment 4

Geomembrane tension-strain curve
The orientation of the geomembrane tension at both extremities of the geomembrane is:
TGM• 1000Tn
Tn= 1.98
F
O := asin(__!__2•Tn
O = 0.26 radians
The geomembrane uplift is:
(eu := 0.5•tanl — I•L
k,2)
(eq. 56, Giroud et al. 1995)
(i.e., 14.6 degrees)
(eq. 54, Giroud et al. 1995)
u=1.28 m (i.e., 4.2 ft)
Made by: EF Subject: Piñon RidgeChecked by: Job No. 073-81694
It. Approved by: Date: 4/7/2008Sheet No. 3 of 4
TGMTOM := TOM = 1.5 — (i.e., 102.8 lb/ft)
1000 In
TT
TGM
30
27
24
21
18
12
9
6
3
00 5 10 15 20 25 30 35 40 45 50 55 60 65 70 75 80 85 90 95 100
CC CStrain [0o]
Attachment 4
Made by: EF Subject: Piñon Ridge
f. . Checked by: Job No. 073-81694
• Approved by: Date: 4/7/2008Sheet No. 4 of 4
Plots data
e(T) := 2.T.asin(—i_)— i
T:= 0.50,0.51.. 2.5
2 3
12 22TT :=
20 21
50 19
\800 \16,
5)
Attachment 4

ATTACHMENT 5

Made by: EF Subject: Piñon RidgeChecked by: (Jet Job No. 073-81694
P. Approved byf,,j Date: 4/7/2008
r ‘ Sheet No. I of 4
Case 3 On the leeward slope of the tailings cells (cells B and C). middle portion
Suction factor for the leeward slope of the reservoir: Calculations wereperformed using the
:= 0.7 for the middle portion of the slope international unit system(SI), since the empirical
Wind velocity: equations were developedusing this unit system.
V := 37.7 (e.g., 23.4 mph)hr
Altitude above sea level:
z := 1670.3 m (e.g., 5480 ft)
The mass per unit area of geomembrane required to resist uplift by a wind of velocity V at altitude zabove the see level is defined by:
110M := 0.O05085...V2.exp(_1.252.10_4.z) (eq. 21, Giroud etal. 1995)
= 4.1 .!. required geomembrane mass
The maximum wind velocity that the geomembrane can be subject to without being uplifted:
GM := 1.431 geomembrane mass per unit area (60 mil HDPE)
Vup :=14.023.exp(6.259.105.z).j!! (eq. 26, Giroud etal. 1995)
Vup = 22.26 (e.g, 12.9 mph)hr
The effective suction in the geomemebrane is:
Se:= 0.050.).V2.exp(_1.252.10_4.z)_9.81.J.LGM (eq.41, Giroudetal. 1995)
Se = 26.32 Pa (e.g., 0.55 lb/ft2)
The resultant force of the applied effective suction is equal to:
L := 26.4 m (e.g., 86.6 ft)
F := Se•L (eq. 42, Giroud et al. 1995)
F = 694.85 (e.g., 47.6 lb/ft)
Attachment 5

The normalized allowable tension (Tn) is defined as:
C0
C
0z
Tall := 22
TaIl• 1000Tn :=
F
Tn = 31.66
Break elongation, % = 12
(eq. 48, Giroud etal. 1995)
06
Uplift tension-strain relationship
The determination of thension in the geomembrane is done by trial and error assuming different valuesfor TGM untill the calculated strain versus TGM compares with the Geomembrane tension-strain curve.
The strain in the geomembrane is estimated as:
TGM:= 1300N
mTension in the geomembrane (e.g., 89.1 lblft)
E( TGM.asin(F
—
(eq. 47, Giroud etal. 1995)2TGM
L\ F
6=1.23 00
Made by: EF Subject: Piñon Ridge
f . Checked by:51t Job No. 073-81694Approved by. Date: 4/7/2008
Sheet No. 2 of 4
e(T)Strain
Attachment 5
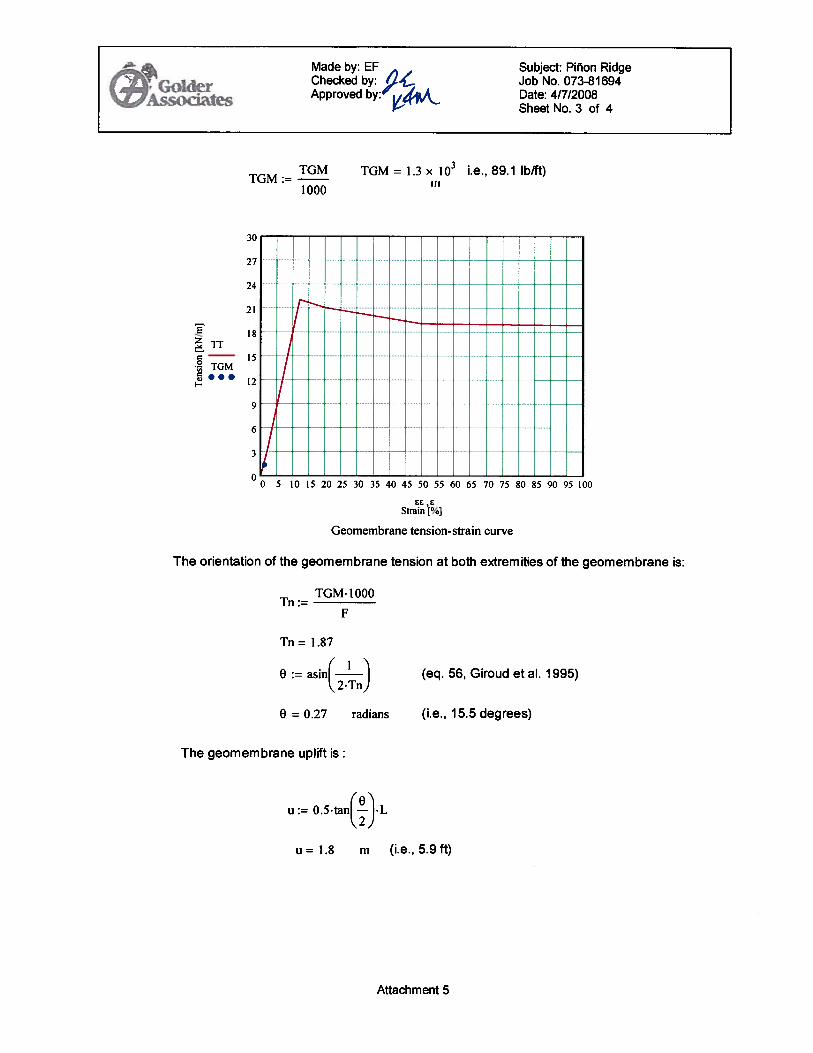
TGMTGM
1000
TGM = 1.3 x i.e., 89.1 lbIft)III
E
TT15
TGM
12
00 5 10 15 20 25 30 35 40 45 50 55 60 65 70 75 80 85 90 95 100
EC ,EStrain (°o]
Geomembrane tension-strain curve
The orientation of the geomembrane tension at both extremities of the geomembrane is:
TGM. 1000Tn :=
F
Tn= 1.87
0 := asin(’._L_2•Tn
(eq. 56, Giroud etal. 1995)
0 = 0.27 radians (i.e., 15.5 degrees)
The geomembrane uplift is:
u := 0.5tanI — IL2)
u=1.8 m (i.e., 5.9 ft)
Made by: EF Subject: Piñon Ridge
f . Checked by: Job No. 073-81694Approved by: Date: 4/7/2008
Sheet No. 3 of 4
Attachment 5
Made by: EF , Subject: Piñon Ridge
• Checked b:,5?1 Job No. 073-81694Approved by 4k.. Date: 4/7/2008
Sheet No. 4 of 4
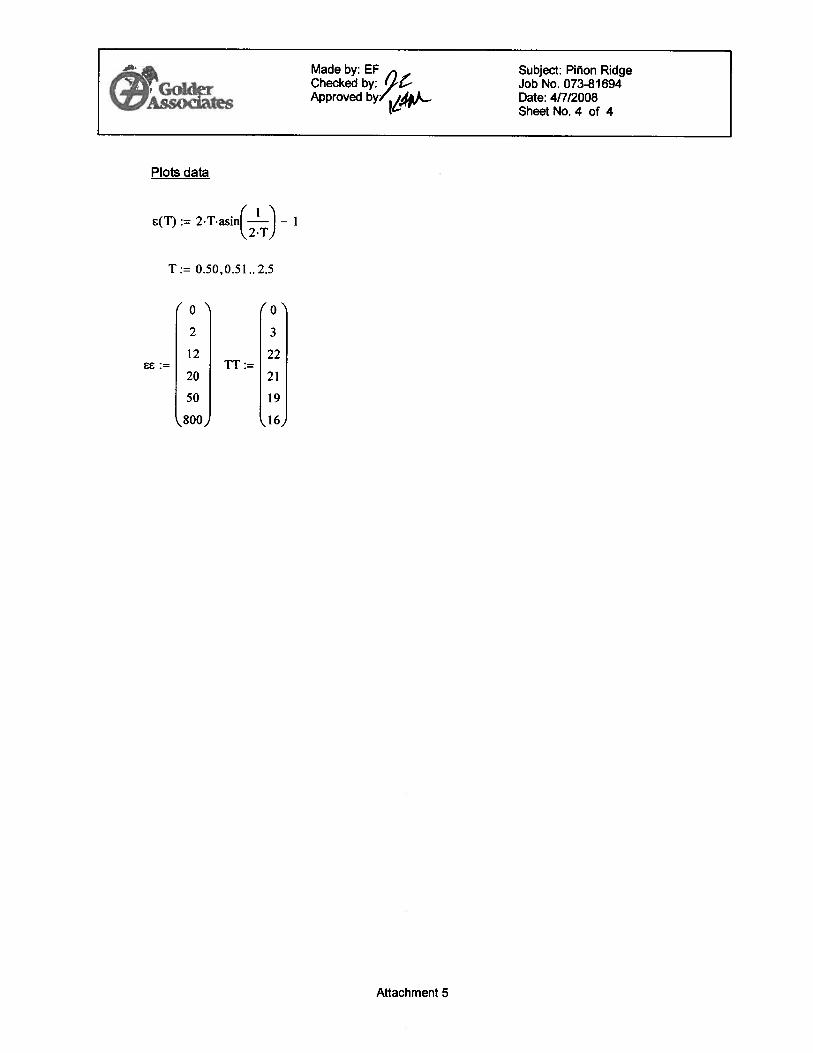
Plots data
E(T) := 2.T.asiJ!_”— 1
T:= 0.50,0.51.. 2.5
2 3
12 22TT:=
20 21
50 19
800, 16,
Attachment 5

ATTACHMENT 6
Made by: EF ,, Subject: Piñon RidgeChecked by: (/4- Job No. 073-81694Approved by: 1/j4 Date: 4/7/2008
SheetNo.1 of 4
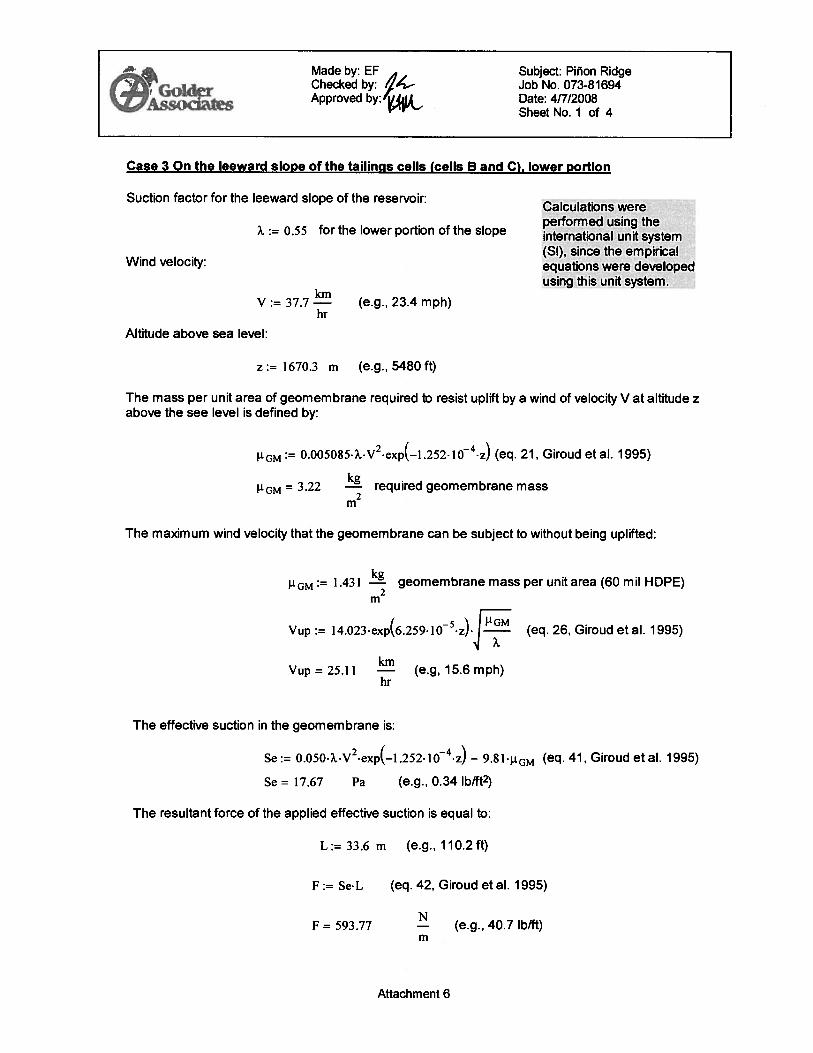
Case 3 On the leeward slope of the taiIinis cells (cells B and C). lower portion
Suction factor for the leeward slope of the reservoir:Calculations wereperformed using the
:= 0.55 for the lower portion of the slope international unit system(SI), since the empirical
Wind velocity: equations were developedusing this unit system.
V := 37.7 (e.g., 23.4 mph)hr
Altitude above sea level:
z := 1670.3 m (e.g., 5480 ft)
The mass per unit area of geomembrane required to resist uplift by a wind of velocity V at altitude zabove the see level is defined by:
I’GM := 0.005085..V2.exp(_1.252.10_4.z) (eq. 21, Giroud etal. 1995)
GM = 3.22 required geomembrarie mass
The maximum wind velocity that the geomembrane can be subject to without being uplifted:
GM := 1.431 geomembrane mass per unit area (60 mil HDPE)
Vup :=14.023.exp(6.259.105.z).i (eq. 26, Giroud etal. 1995)
Vup = 25.11 (e.g, 15.6 mph)hr
The effective suction in the geomembrane is:
Se := 0.050.?.V2.exp(_1.252.10_4.z)— 981i.GM (eq. 41, Giroud etal. 1995)
Se = 17.67 Pa (e.g., 0.34 lb/ft2)
The resultant force of the applied effective suction is equal to:
L:= 33.6 m (e.g., 110.2ft)
F:= SeL (eq.42, Giroudetal. 1995)
F = 593.77 (e.g., 40.7 lblft)
Attachment 6

The normalized allowable tension (Tn) is defined as:
C0
C
V
. T
0
Tall := 22
Tall. 1000Tn :=
F
Tn = 37.05
Break elongation, % = 12
(eq. 48, Giroud et al. 1995)
06
Uplift tension-strain relationship
The determination of thension in the geomembrane is done by trial and error assuming different valuesfor TGM untill the calculated strain versus TGM compares with the Geomembrane tension-strain curve.
The strain in the geomembrane is estimated as:
TOM:— 1200N
mTension in the geomembrane (e.g., 82.2 lb/ft)
£=1.05 00
F 1—11100
Made by: EF Subject: Piñon Ridge
f* . Checked by: jt... Job No. 073-81694• Approved by. Date: 4/712008
Sheet No. 2 of 4
£(T)Strain
:= [[2
TGM.asinF
I. 2TGM (eq. 47, Giroud et al. 1995)
Attachment 6
:TTC 15
TGM
TGMTGM := —
1000
00 5 10 15 20 25 30 35 40 45 50 55 60 65 70 75 80 85 90 95 100
cc ,cStrain [°ol
Geomembrane tension-strain curve
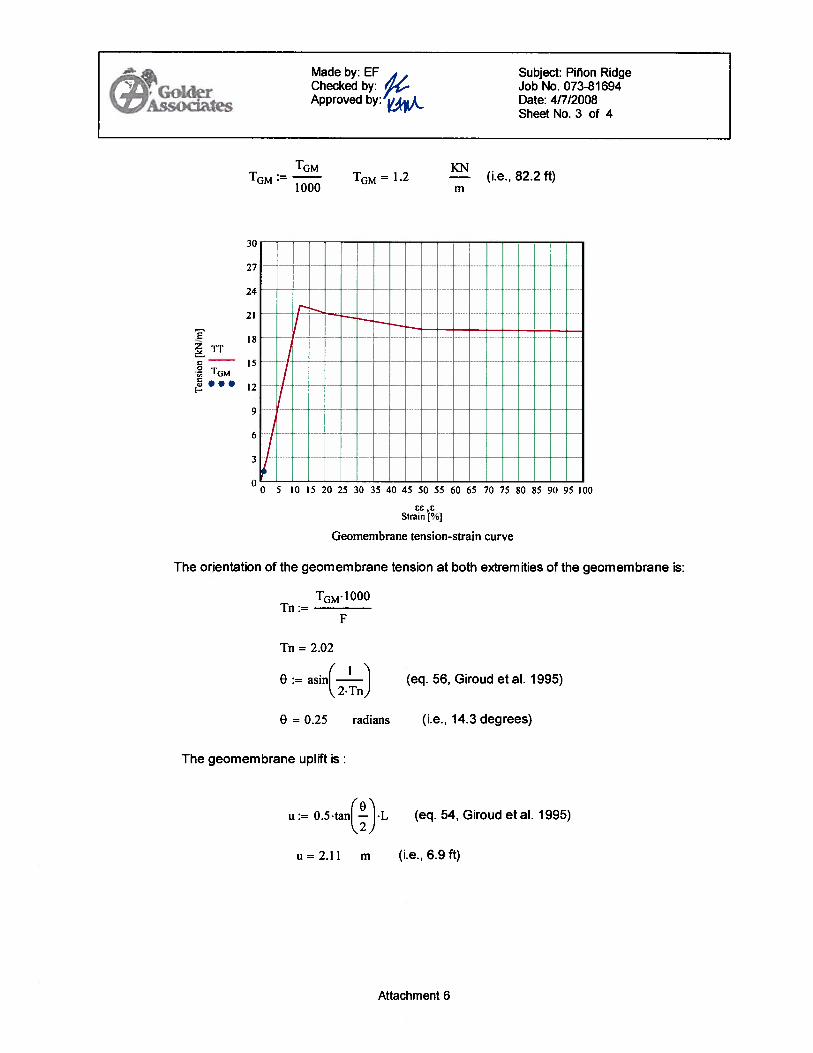
The orientation of the geomembrane tension at both extremities of the geomembrane is:
ToM1000Tn :
F
Tn = 2.02
o := asini—!-—2.Tn
o = 0.25 radians
The geomembrane uplift is:
u:= 0.5.tan(!.L2}
u=2.11 m
(eq. 56, Giroud et al. 1995)
(i.e., 14.3 degrees)
(eq. 54, Giroud et al. 1995)
(i.e., 6.9 ft)
Made by: EF Subject: Piñon Ridge
fA . Checked by: Job No. 073-81 694Approved by: Date: 4/7/2008
Sheet No. 3 of 4
TGM = 1.2 (i.e., 82.2 ft)
Attachment 6
Made by: EF Subject: Piñon Ridge
fI -
Checked by: Job No. 073-81694Approved by: Date: 4/7/2008
Sheet No. 4 of 4
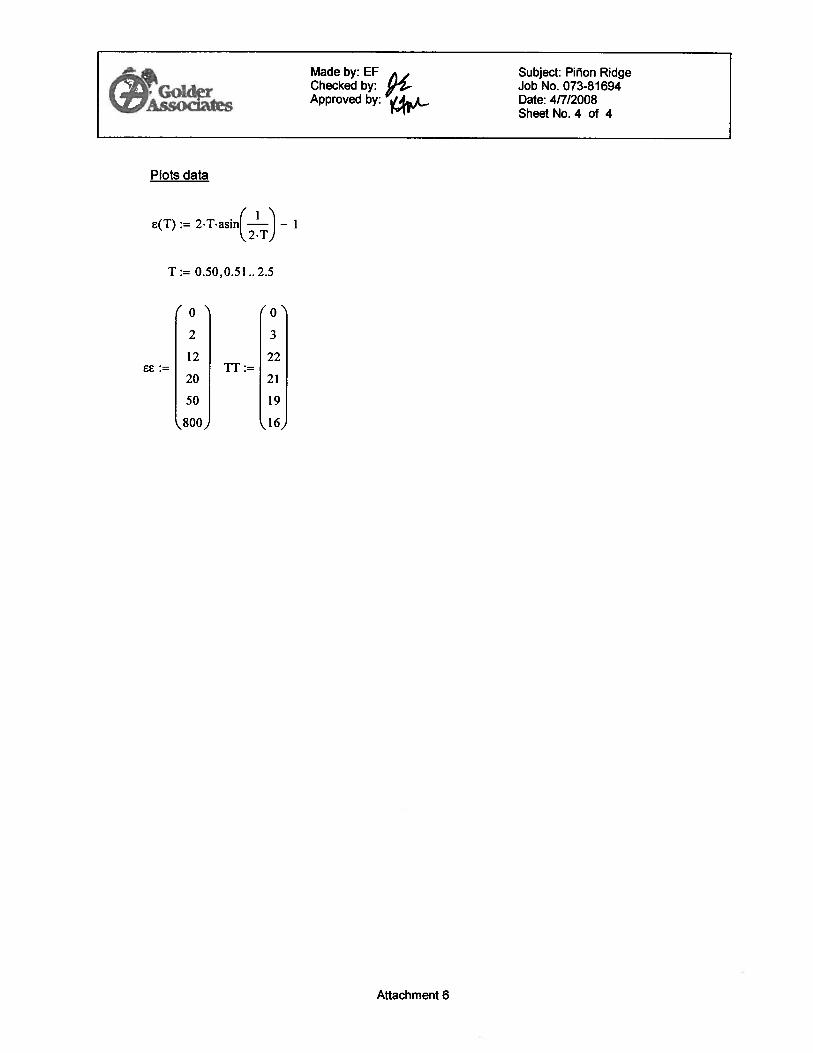
Plots data
E(T) :=2.T.asiJJ— — 1L\2.T)
T:= 0.50,0.51 .. 2.5
0’
2 3
12 22ec:= TT:=
20 21
50 19
800, 16,
Attachment 6

ATTACHMENT 7
5. a.-.
a. CDC
In o1N
;N
;N
;N
;N
;N
;N
;N
;I-
I-
I-
I-
I-
I-I
I-
I-
I-
I-
I-
I-
I-
<0000000
0D
Wco
LD
LD
LD
DID
DI.D
‘.DO
DD
DD
CD..-.0
00
0000
0D
WD
‘.0
‘.0
I.D
LD
LD
‘.0
1.0
000000000000
0
N—
wG
)
3N
N;
N;
i-I-
N;
I-I-
I-
I-
I-
I-
I-
i-i-
i-i-
i-N
;I-
a.W
W00’.000%
J%
J00N
;00aI
5 I,,
—.
00
CDZ
CD—
—
II
I
000W
0N
;00N
;

ATTACHMENT 8

TEXTURED HDPE GEOMEMBRANEENGLISH UNITS
Property Test Method
POLYFLEXPOIYF.THYLENE GEOMEMBRANES
Minimum Average Values40 mu 60 mu 80 mU 100 mU
Thickness, mils ASTM D 5994minimum average 38 57 76 95lowest individual of 8 of 10 readings 36 54 72 90lowest individual of 10 readings 34 51 68 85
Asperity Height1,mils GRI GM12 10 10 10 10
Sheet Density, g/cc ASTM D 1 505/D 792 0.940 0.940 0.940 0.940
Tensile Properties2 ASTM D 6693
1. ‘Yield Strength, lb/in 84 126 168 2102. Break Strength, lb/in 60 90 120 1503. Yield Elongation, % 12 12 12 124. Break Elongation, % 100 100 100 100
Tear Resistance, lb ASTM D 1004 28 42 56 70
Puncture Resistance, lb ASTMD4833 60 90 120 150
Stress Crack Resistance3,hrs ASTM D 5397 (App.) 300 300 300 300
Carbon Black Content4,% ASTM D 1603 2.0 - 3.0 2.0 - 3.0 2.0- 3.0 2.0 - 3.0
Carbon Black Dispersion ASTM D 5596 —Note 5—
Oxidative Induction lime (OlT)Standard CIT. minutes ASTM 0 3895 100 100 100 100
Oven Aging at 85°C ASTM D 5721High Pressure CIT - % retained after 90 days ASTM D 5885 80 80 80 80
UV Resistance6 GRI GM1 1High Pressure 01T7 - % retained after 1600 hrs ASTM 0 5885 50 50 50 50
Seam Properties ASTM D 6392(@ 2 in/mm)
1. Shear Strength, lb/in 80 120 160 2002. Peel Strength, lb/in - Hot Wedge 60 91 121 151
- Extrusion Fillet 52 78 104 130
Roll Dimensions1. Width (feet) 23 23 23 232. Length (feet) 750 500 375 3003. Area (square feet): 17,250 11500 8,625 6,9004. Gross weight (pounds, approx.) 3,500 3,500 3,470 3,470
1 Of 10 readings, 8 must be a 7 mils and lowest individual reading must be a S mile.2 Machine direction (MD) and cross machine direction (XMD) average values should be on the basis of 5 test specimens each direction
Yield elongation is calculated using a gauge length of 1.3 inches; Break elongation is calculated using a gauge length of 2.0 inches.3 The yield stress used to calculate the applied load for the SP-NCTL test should be the mean value via MQC testing.4 Other methods such as ASTM D 4218 or microwave methods are acceptable if an appropriate correlation can be established.5 Carbon black dispersion for 10 different views: Nine in Categories 1 and 2 with one allowed in Category 3.6 The condition of the test should be 20 hr. IJV cycle at 75°C followed by 4 hr. condensation at 60°C.7 UV resistance is based on percent retained value regardless of the original HP-CIT value.This data is provided for informational purposes only and is not intended as a warranty or guarantee. Poly-Flex, Inc. assumes no responsibilityin connection with the use of this data. These values are subject to change without notice. REV1 1/06
6

i:\07\81694\0400\tailingcelldesign-fnl-06oct08\073-81694-tailingscelldesignrep_fnl-06oct08.doc Golder Associates
APPENDIX C-2
ANCHOR TRENCH CAPACITY CALCULATIONS

1ade by EF
approved y
OBJECTiVE:
The objective is to evaluate the tensile strength capacity for the anchorage trench of the liner system at the top ofthe cell side slope with respect to wind uplift forces on the geomembrane.
GWEN:
• Tailings cell liner anchor trench geometry.• Geomembrane properties.• Cell side slope inclination 3H: lv.• Resultant stress in the geomembrane due to wind uplift (from calculation sheet “Geomembrane wind
uplift analysis”):Maximum tension in the geomembrane = 151 lb/ftAngle of the force with respect to the side slope surface = 17 degrees
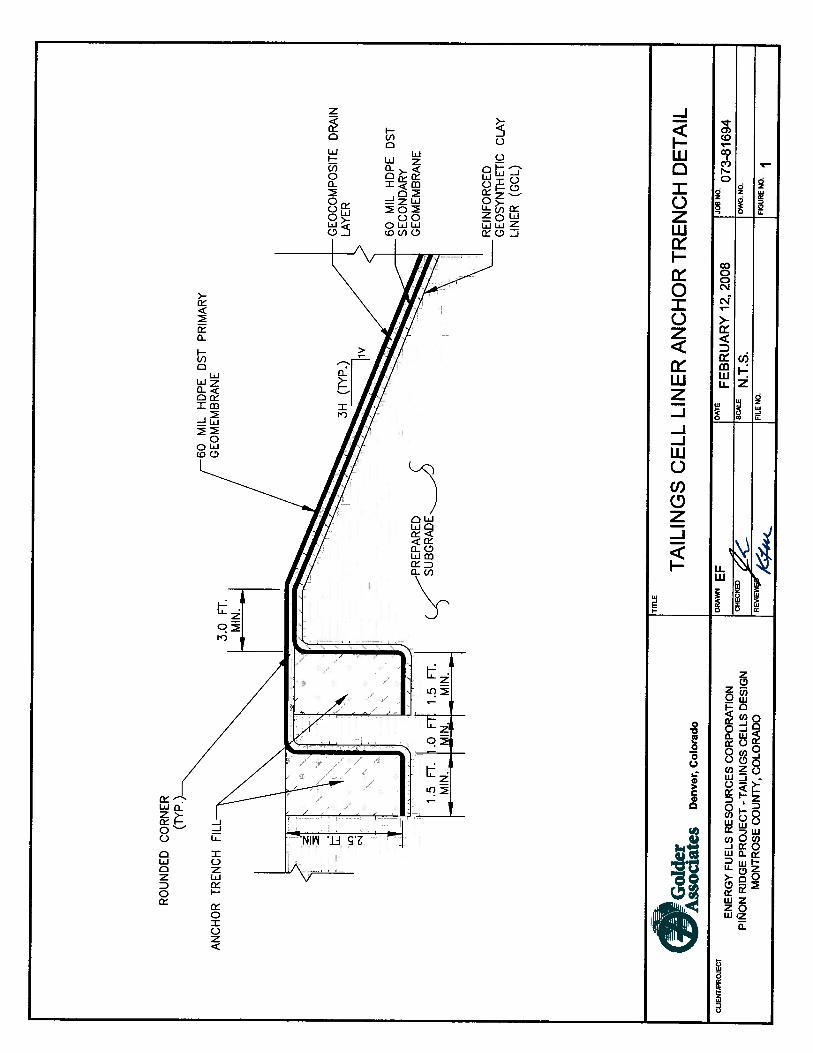
GEOMETRY:
• The proposed geometry for the geomembrane anchor trench is presented in Figure 1.
MATERIAL PROPERTIES:
• Geomembrane (Textured HDPE geomembrane)o Density 58.7 lb/ft3 (i.e., 0.94 g/cm3)o Thickness 60 muo Yield Strength 126 lb/in
• Soil properties (Trench fill)o Density 115 lb/ft3o Friction angle 30°
• Peak interface friction angle of 21° for 60 mil textured HDPE geomembrane versus geocomposite (seeAttachment 2).
METHOD:
The tensile strength capacity of the anchor trench is evaluated using the methodology presented by Koerner(1998). The methodology is based on a static equilibrium analysis of the problem. Figure 2 shows the free bodydiagram for the geomembrane considered to develop the analytical equations.
The proposed analytical equation for determination of the allowable geomembrane tension from the anchor trenchis:
uLect Piñon Ridge
Failings Cell Design
eomembrane Anchorage Trench.nalysis
obNo 073-81694
)ate 02/28/08
heetNo I of 2
J:O7JOBS’O734I694 EFRPrnrn, RidrDcv Ad)aT.Iiop Cd1sArTrhwxtmra
uect Piñon Ridge fadeby EF obNo 073-8 1694
railmgs Cell Design hecked )ate 02/28/08
I bd 3eomembrane Anchorage Trench pproved by heet No 2 of 2
___________________
nalysis
_______________ ________________
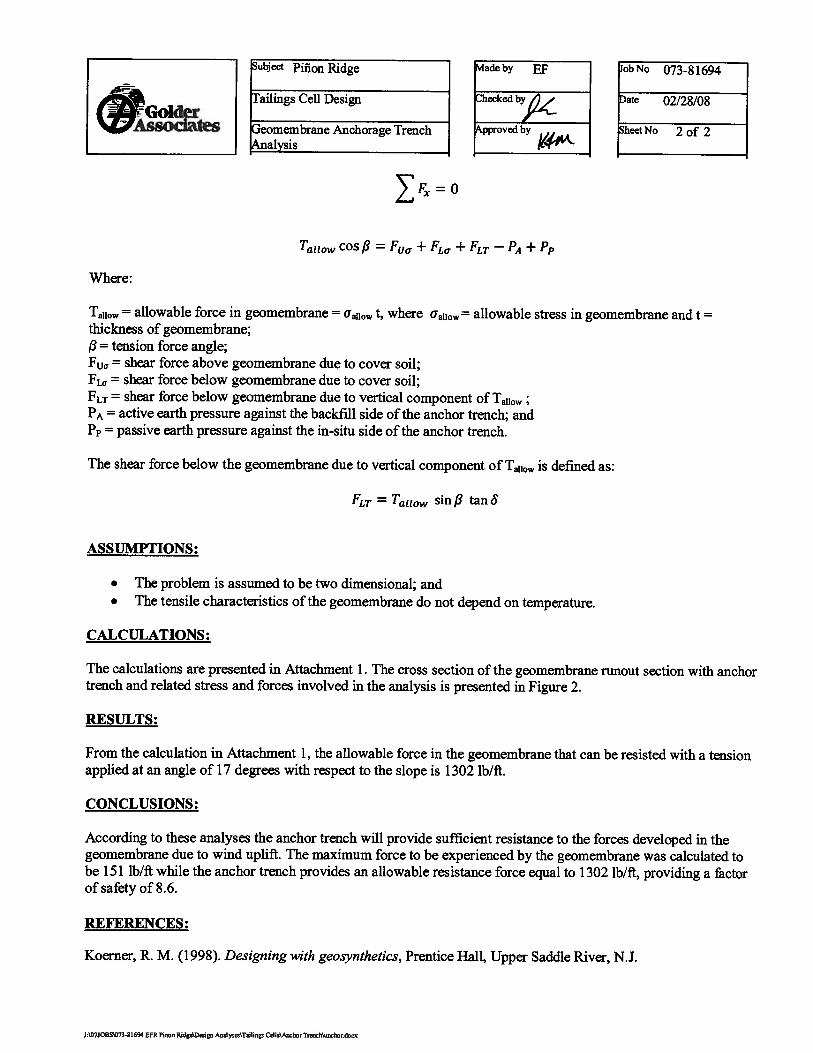
F=0
Tajiow COS/3 = Fu7 + + FLT — PA + Pp
Where:
T10 = allowable force in geomembrane = u0 t, where u0=allowable stress in geomembrane and t =
thickness of geomembrane;= tension force angle;
Fu = shear force above geomembrane due to cover soil;F = shear force below geomembrane due to cover soil;FLT shear force below geomembrane due to vertical component Of Taiiow;PA = active earth pressure against the backfill side of the anchor trench; andPp = passive earth pressure against the in-situ side of the anchor trench.
The shear force below the geomembrane due to vertical component ofT10 is defined as:
FLT = Taiiow sin 1? tanS
ASSUMPTIONS:
• The problem is assumed to be two dimensional; and• The tensile characteristics of the geomembrane do not depend on temperature.
CALCULATIONS:
The calculations are presented in Attachment 1. The cross section of the geomembrane runout section with anchortrench and related stress and forces involved in the analysis is presented in Figure 2.
RESULTS:
From the calculation in Attachment 1, the allowable force in the geomembrane that can be resisted with a tensionapplied at an angle of 17 degrees with respect to the slope is 1302 lb/ft.
CONCLUSIONS:
According to these analyses the anchor trench will provide sufficient resistance to the forces developed in thegeomembrane due to wind uplift. The maximum force to be experienced by the geomembrane was calculated tobe 151 lb/ft while the anchor trench provides an allowable resistance force equal to 1302 lb/ft. providing a factorof safety of 8.6.
REFERENCES:
Koerner, R. M. (1998). Designing with geosynthetics, Prentice Hall, Upper Saddle River, N.J.
JO7JOBS’fl34l694 EFRPI,,o,, RidgDign csT&rngs CdIs\ArTMx1x,r.do

S[W1DH
AN
CH
OR
TREN
CH
REI
NFO
RC
ED
DRA
IN
CLA
Y
c#G
olde
rT
AIL
ING
SC
EL
LL
INE
RA
NC
HO
RT
RE
NC
HD
ETA
IL
TIT1
.E
Ass
ocia
tes
Denver,
Co
lo
rad
o
JN
Ocu
Nio
a°“
EF
I0
AFE
BR
UA
RY
12,
2008
I0
73
-81
69
4E
NE
RG
YF
UE
LS
RE
SO
UR
CE
SC
OR
POR
AT
ION
PIO
NR
IDG
EP
RO
JEC
T-T
AIL
ING
SC
EL
LS
DE
SIG
NC
HEC
KED
N.T
.S.
DW
GN
O
MO
NT
RO
SEC
OU
NTY
,CO
LOR
AD
OFI
LEN
OFI
GU
RE
NOI
RO
UN
DED
CO
RN
ER(T
h’P.
MIL
HD
PED
STPR
IMA
RY
GEO
MEM
SRA
NE
PRE
PAR
ED
sU
BG
RA
DE
GEO
MEM
BR
AN
E
LIN
ER(G
CL
)

CL
IEIP
RO
JEC
TEN
ERG
YF
UE
RES
OU
RC
ESC
OR
POR
ATI
ON
GEQ
ME
MB
RA
NE
FREE
BO
DY
DIA
GR
AM
PIO
NR
IDG
EPR
OJE
CT
-TA
ILIN
GS
CELL
SD
ESIG
NM
ON
TR
OSE
CO
UN
TY,
CO
LOR
AD
O

ATTACHMENT 1

Made by: EF Subject: Piñon RidgeChecked by: &.. Job No. 073-81694
$ Approved bf Date: 2/28/2008Sheet No. I of 2
Geomembrane Anchor Trench Analysis
Shear force above geomembrane due to trench fill (Fu0):
lbYAT := 115.— Unit weight of anchor trench fill
ft3dAT := 2.5.ft Depth of anchor trench
YATdAT
on = 287.5—ft2
5 := 2ldeg Interface friction angle (weakest interface)
L10 := 1.5.ft Length of anchor trench
Fu0 on.tan(S).LRO
Fua= 165.54
Shear force below geomembrane due to trench fill (FLG):
FLa := an.wn(5).T0
FLO.= 165.54-
Active earth pressure (PA):
:= 3odeg friction angle of soil
KA := [tan((45de—
j)] Active earth pressure coefficient
KA=O.33
2O.Spjd .KA
= 119.79—ft
ATTACHMENT I

Made by: EF Subject: Piñon Ridge
e Checked Job No. 073-81694Approved b : Date: 2/28/2008
Sheet No. 2 of 2
Passive earth pressure (Kp):
( C 4)I Passive earth pressure coefficient:= (tan45deg
+
K = 3
2Pp := O.5•YAT.dAT .K
= 1078.13—ft
Allowable fçrce in geomembrane
6 := l7deg angle of the resultant tension in the geomembrane
a := atan(!) a = 18.43 deg angle of slope (i.e., 3H:1V)
13= a —6
13 = 1.43 deg Force angle in the geomembrane - slope angle
(FuO+FLO—PA+Pp)Ti0
cos(j3) — n(3).tan(8)
T1= 13O2.34
AUACHMENT I

ATTACHMENT 2

FEBRUARY 2008 073-81694DIRECT SHEAR TEST RESULTS
ASTM D5321
PROJET NAME: ENEIOY FUE GEoTEc1- PINON RiGEjcoSAMPLE NUMBER: I (GM vs GO)
INTERFACE TESTED:TEST CONDrnONS:SHEAR RATE:SUBSTRATE:
60 mu TEXTURED HDPE GEOMEMBRANE vs TEXDRAIN 250 DS 6 GEOCOMPOSITEINTERFACES WETrED, CONSOLIDATED 15 mm AT NORMAL LOAD0.2 in/mmTEXTURED RIGID PLATES
Normal Shear Stress Peak Residual
Stress Peak1 I Residual FrIctIon Adhesion2 FrIction Adhesion2(psi) (psi) I (psi) Angle (psi) Angle (psi)20 12.2 5.340 28.2 9.9 21.2 14.8 I
80 37.1 21.5
Observations After Test20 psi: Shearing occurred at the interface between the Geomembrane and the Geocomposite40 psi: Shearing occurred at the interface between the Geomembrarie and the Geocomposite80 psi: Shearing occurred at the interface between the Geomembrane and the Geocomposite
(1) The peak shear stresses for 20, 40, and 80 psi normal stresses were chosen at 0.300, 0.319, and 0.693 in horizontal displacements, respectively(2) The adhesion value is based on the “best-fit line which may not show true adhesion.
100RESIDUAL @3 IN HORIZONTAL DISPLACEMENTPEAK
100
80y = 0.3878x + 7.7465R2=0.8813
60
0
40I
20
0 I I
0 20 40 60 80 100NORMAL STRESS (psI)
y= 0.2643xR2 = 0.9956
80
ff1
IU,
20
0
0 20 40 60NORMAL STRESS (psI)
80 100
Golder Associates Inc.

i:\07\81694\0400\tailingcelldesign-fnl-06oct08\073-81694-tailingscelldesignrep_fnl-06oct08.doc Golder Associates
APPENDIX C-3
DESIGN OF GEOMEMBRANE BUTTRESSING
OBJECTIVE:
EF
Calculate the required cross-sectional dimensions of the soil mass in the anchor bench to provide anchorage to thegeomembrane against wind action.
GWEN:
• Calculated tensions in the geomembrane produced by wind uplift considering a wind equal to 23.4 milesper hour (see Table 1, and Golder calculations titled “Geomembrane Wind Uplift Analysis”).
• Tailings cells side slopes geometry.
• Weakest interface in the design has an interface friction angle of 200 for GCL versus textured HDPE.
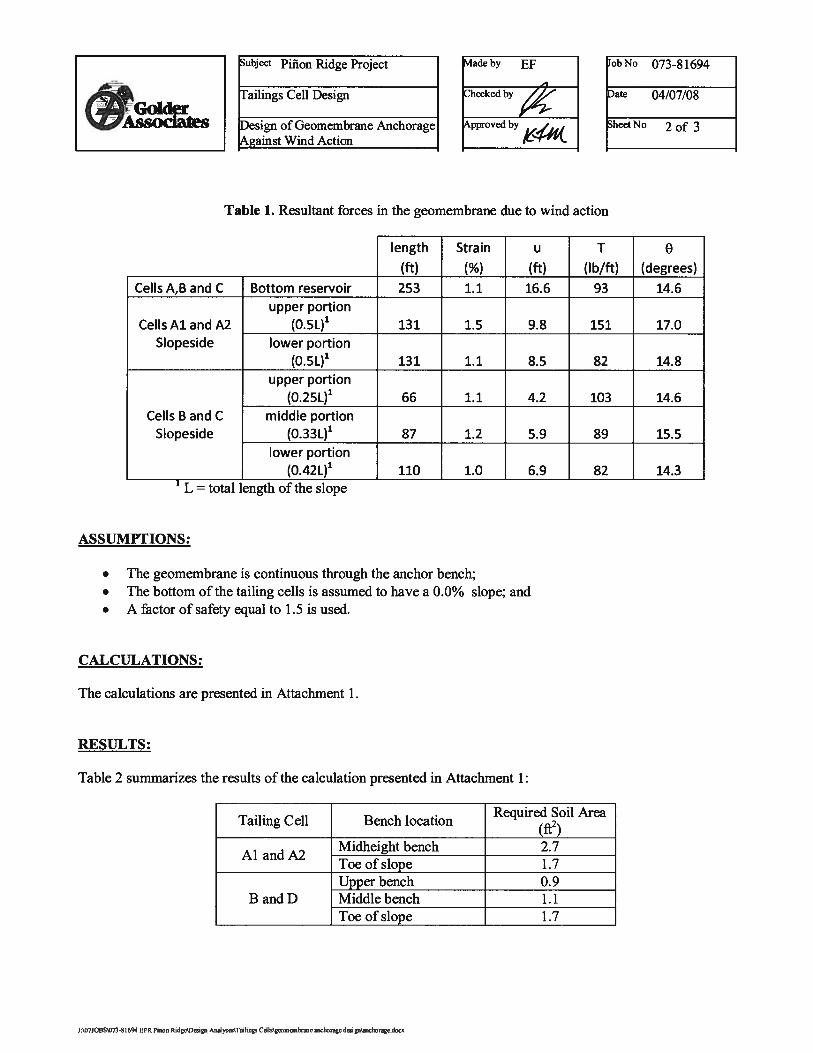
GEOMETRY:
. The geometry of the side slopes and benches are shown in Figure 1.
MATERIAL PROPERTIES:
• Buttress fillo Density 110 lb/ft3 (Assumed)
METHOD:
The analysis of the required cross-sectional dimensions of the soil mass in the anchor bench is performedaccording to Giroud et al. (1999). This method is based on a static analysis of the recurring forces acting in theanchor bench. Figure 2 shows a free body diagram of the anchor bench that is used to develop the equation todesign the geomembrane anchorage against wind action.
The mechanism of failure considered in the analysis of the anchor bench is selected as a function of the magnitudeof the resulting forces;
• Anchor failure by sliding in the downslope direction if TdH > TUH;
• Anchor failure by sliding in the upslope direction; and ifT <TUH;• Anchor failure by uplifting TdH = TUH.
Table 1 summarizes the considered resultant forces in the geomembrane due to wind action.
ubject Piñon Ridge Project
ailings Cell Design
)esign of Geomembrane Anchoragegainst Wind Action
obNo 073-81694
)ate 04/07/08
heetNo I of 3
J:\O7JOBS73$I694 EFR Pimo RidgoDogn AoMo\TaIingo
ASSUMPTIONS:
Table 1. Resultant forces in the geomembrane due to wind action
• The geomembrane is continuous through the anchor bench;• The bottom of the tailing cells is assumed to have a 0.0% slope; and• A factor of safety equal to 1.5 is used.
CALCULATIONS:
The calculations are presented in Attachment 1.
RESULTS:
Table 2 summarizes the results of the calculation presented in Attachment 1:
Tailing Cell Bench locationRequired Soil Area
(ft2)
Al andMidheight bench 2.7Toe of slope 1.7Upper bench 0.9
B and D Middle bench 1.1Toe of slope 1.7
;ubjt Piñon Ridge Project
railings Cell Design
Jesign of Geomembrane Anchoragegainst Wind Action
dadeby EF
hecked by
pproved by
obNo 073-81694
)ate 04/07/08
;heet No 2 of 3
length Strain u T 0(ft) (%) (ft) (lb/ft) (degrees)
Cells A,B and C Bottom reservoir 253 1.1 16.6 93 14.6upper portion
Cells Al and A2 (0.5L)1 131 1.5 9.8 151 17.0Slopeside lower portion
(0.SL)1 131 1.1 8.5 82 14.8upper portion
(0.25L)1 66 1.1 4.2 103 14.6Cells B and C middle portion
Slopeside (0.33L)1 87 1.2 5.9 89 15.5lower portion
(0.421)1 110 1.0 6.9 82 14.3= total iength of the slope

u1ect Piñon Ridge Project ttadeby EF obNo 073-8 1694
- ‘ailings Cell Design Dhecked by ‘ate 04/07/08
)esign of Geomembrane Anchorage pproved by beet No 3 of 3
______________
gainst Wind Action
___________ ____________
CONCLUSIONS:
The maximum cross sectional area of buttress fill required to prevent geomembrane uplift at the anchor benches is2.7 ft2. Therefore, two 1 8-inch diameter HDPE pipes filled with sand or grout placed at the anchor benches alongthe sideslope and one 1 8-inch diameter HDPE pipe filled with sand or grout placed at the anchor toe will providesufficient anchorage to the geomembrane against wind action.
REFERENCES:
Giroud, J. P., Gleason, M. H., and Zornberg, J. G. (1999). “Design of geomembrane anchorage against windaction.” Geosynthetics International, 6(6).

SaInDH

TREN
CH
5550
z 055
00
5450
CR
OSS
SEC
TIO
N
3H
SLO
PE
2G
olde
rA
ssoc
iate
sD
enve
r,C
oIo
ido
EN
ER
GY
FUE
LS
RE
SO
UR
CE
SC
OR
POR
AT
ION
PII
ON
RID
GE
PR
OJE
CT
-T
AIL
ING
SC
EL
LS
DE
SIG
NM
ON
TR
OSE
CO
UN
TY
,C
OL
OR
AD
O
5400
MID
HEI
GH
TA
NC
HO
RBE
NCH
5350
016
0
1%M
IN.
260
360
460
TAIL
ING
CEL
LS
560
Al
AN
D
TOE
AN
CH
OR
BEN
CH
660
A2
7O0
SLO
PESI
DE
5550
CR
OSS
SEC
TIO
N
55
0O
5450
5400
1%M
IN.
•UPP
ER
AN
CH
OR
BEN
CH
5350
AN
CHO
RBE
NCH
AN
CH
OR
BEN
CH
10fe
et
5300
U16
026
0
AN
CH
OR
BEN
CH
DET
AIL
360
TAIL
ING
CEL
LS
460
TOE
AN
CH
OR
BEN
CH
BA
ND
560
CSL
OPE
660
SID
E
760

T
FREE
BO
DY
DIA
GRA
M
Ref
eren
ceG
irou
det
al.
(199
9)
Go
‘A
sstl
es
Den
ver,
Col
orad
o
EN
ER
GY
FUE
LS
RE
SOU
RC
ES
CO
RPO
RA
TIO
NP
ION
RID
GE
PR
OJE
CT
-T
AIL
ING
SC
EL
LS
DE
SIG
NM
ON
TR
OSE
CO
UN
TY
,C
OL
OR
AD
O
DEC
OM
POSI
TIO
NO
FTH
EFO
RC
ESA
CTIN
GON
ANA
NC
HO
RB
ENC
H
DIR
EC
TT
ON
Rd
DIR
EC
TIO
NR
,

ATTACHMENT 1

Design of Geomembrane Anchorage Against Wind Action
Cells Al and A2
Midheight bench
Td
T :=
lb82.2 — downslope tension
ft
14.8 degrees angle of downslope tension
lb150.8 — upsiope tension
17 degrees angle of upslope tension
18.435 degrees slope inclination 3H:1V
:= 13d
3a := 0.573 degrees bench inclination
6 := 20 degrees interface friction angle soil/geomembrane
Made by: EF Subject: Piñon Ridge ProjectChecked by: Job No.: 073-81694
• Approved b{,s Date: 417/2008Sheet No. 1 of 10
T
w
Td
Tg
ft
Attachment I

Made by: EF Subject: Piñon Ridge ProjectChecked b:- Job No.: 073-81694Approved by. Date: 41712008
Sheet No.2 of 10
Sliding direction:
Horizontal projections
T := Td.COS[(O I3d)”j]
TdH=82
TUH : Tucos[(Ou +
TH = 122.9
Because TUH> TdH, anchor failure by sliding in the upslope direction will be considered.
The required soil weight (W) per foot width is determined by the following equation:
[_Td.cos[(_ed + Pd +6 + I3a)i] + T.cos[(o + Pu c3—
Wmin
sin[(ö + Pa)”j]lb
Wmin = 201.4
Wthctored := Wmin 1.5
lbWctored = 302.1
lb:= 110 —
ft3
Attachment I

At the toe of the side slope
WctoredAreq :-
y
Areq = 2.7 It
ft
Td 92.5
9d := 14.9
T := 82.2
:= 14.8
Id 0
:= 18.435
lb— downslope tensionft
degrees angle of downslope tension
lb— upslope tension
degrees angle of upsiope tension
degrees at the toe of the side slope
Sliding direction:
13a 0
ö := 20
degrees at the toe of the side slope
degrees interface friction angle soil/geornembrane
Horizontal projections
TdH := Td.cos[(Od— Id)”jj]
= 89.4lb
ft
Made by: EF Subject: Piñon Ridge ProjectChecked by:,C Job No.: 073-81694Approved by. Date: 41712008
lbSheet No.3 of 10
Attachment I
Made by: EF Subject: Piñon Ridge ProjectChecked by: Job No.: 073-81694
• 1 Approved by: Date: 4/7/2008Sheet No.4 of 10
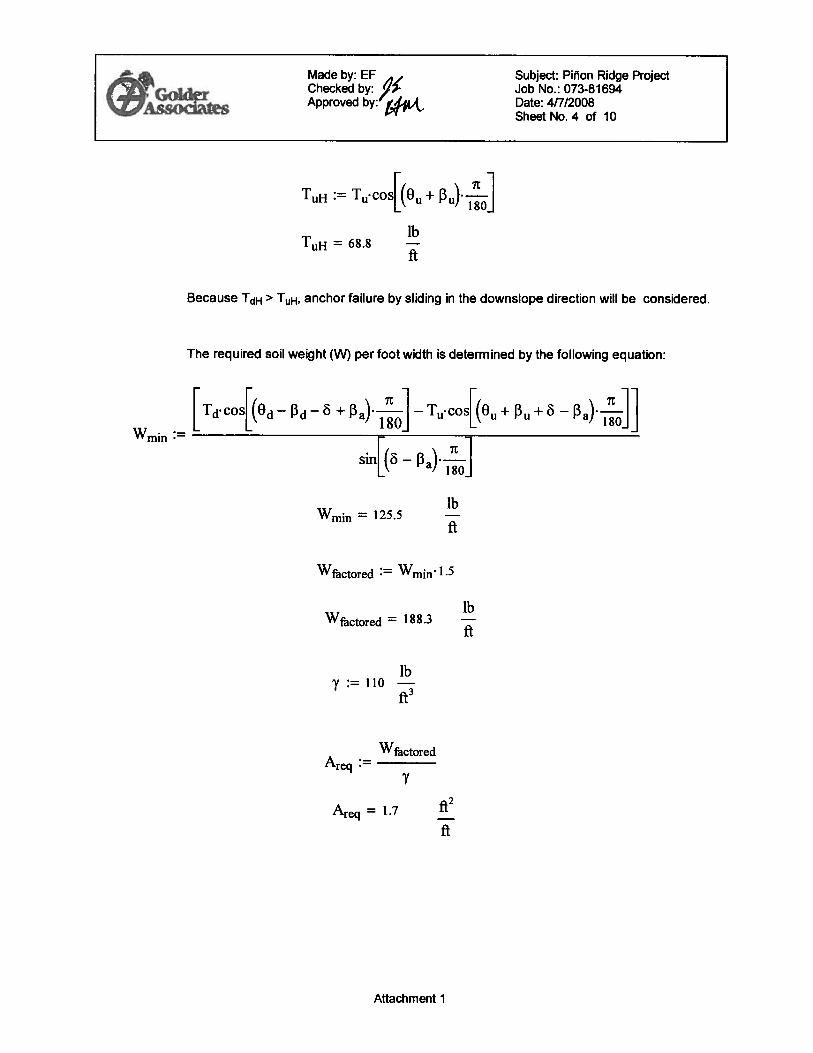
: T.cos[(o +
TH 68.8
Because TdH> TUH, anchor failure by sliding in the downslope direction will be considered.
The required soil weight (W) per foot width is determined by the following equation:
[Td.cos[(ed— 13d — + 3a)”jj] — T.cos[(o + + —
Wmin
lbWmin 125.5
Wthctorerj := Wmin 1.5
lbWctored = 188.3
lb:= 110 —
ft3
WctoredAreq :—
Areq = 1.7
ft
Attachment I

Made by: EF Subject: Piñon Ridge Project
• Checked by: Job No.: 073-81694
.,Approved by: L’dAM Date: 4/7/2008
Sheet No.5 of 10
Cells B and C
Upper Bench
lbTd := 89.1 — downslope tension
ed := 15.5 degrees angle of downslope tension
lbT := 102.8 — upslope tension
:= 14.6 degrees angle of upsiope tension
Pd := 18.435 degrees slope inclination 3H:IV
:= Pd
Pa := 0.573 degrees bench inclination
6 := 20 degrees interface friction angle soil/geomembrane
Sliding direction:
Horizontal projections
TdH := Td.cos[(Od—
TdH=89 —
TH := T.cos[(e +
TH = 86.2 —
Attachment I

Made by: EF , Subject: Piñon Ridge ProjectChecked by: Job No.: 073-81694Approved by: ,4.,,f4 / Date: 4/7/2008
1 Sheet No.6 of 10
Because TdH > TUH, the anchor failure by sliding in the downslope direction will beconsidered.
The required soil weight (W) per foot width is determined by the following equation:
[Td.cos[(_od + — 6 + — T.cos[(o + + 6—
Wmin
sin[(ö—
lbWmin 68.5
Wctored := Wmin 1.5
lbWctored = 102.8
lb:= 110 —
ft3
W1ctoredAreq :—
Areq = 0.9 ft
ft
Attachment I

Made by: EF — Subject: Piñon Ridge ProjectChecked by: Job No.: 073-81694
4 -
. •1 Approved by. k#jJAJ Date: 41712008Sheet No. 7 of 10
Middle Bench
lbTd := 82.2 — downslope tension
ed := 14.3 degrees angle of downslope tension
lbT := 89.1 — upslope tension
:= 15.5 degrees angle of upsiope tension
Pd := 18.435 degrees slope inclination 3H:IV
:= Pd
Pa := 0.573 degrees bench inclination
:= 20 degrees interface friction angle soil/geomembrane
Sliding direction:
Horizontal projections
TdH Td.cos[(Od— Pd)j]
TdH=82 —
: T.cos[(e +
T = 73.9 —
Attachment I

Made by: EF Subject: Piñon Ridge ProjectChecked by:1 / Job No.: 073-81694Approved by. l,,4jiAJ Date: 4/7/2008
Sheet No.8 of 10
Because TdH> TUH, anchor failure by sliding in the downslope direction will be considered.
The required soil weight (W) per foot width is determined by the following equation:
[Td.cos[(_od + 13d 6 + — T.cos[(o + + ö—
mm
sin[(8—
lbWmin = 78.5
Wctored Wmin1.5
lbWctored = 117.8
lby := 110 —
ft3
WthctoredAreq :=
Areq 1.1
ft
Attachment I
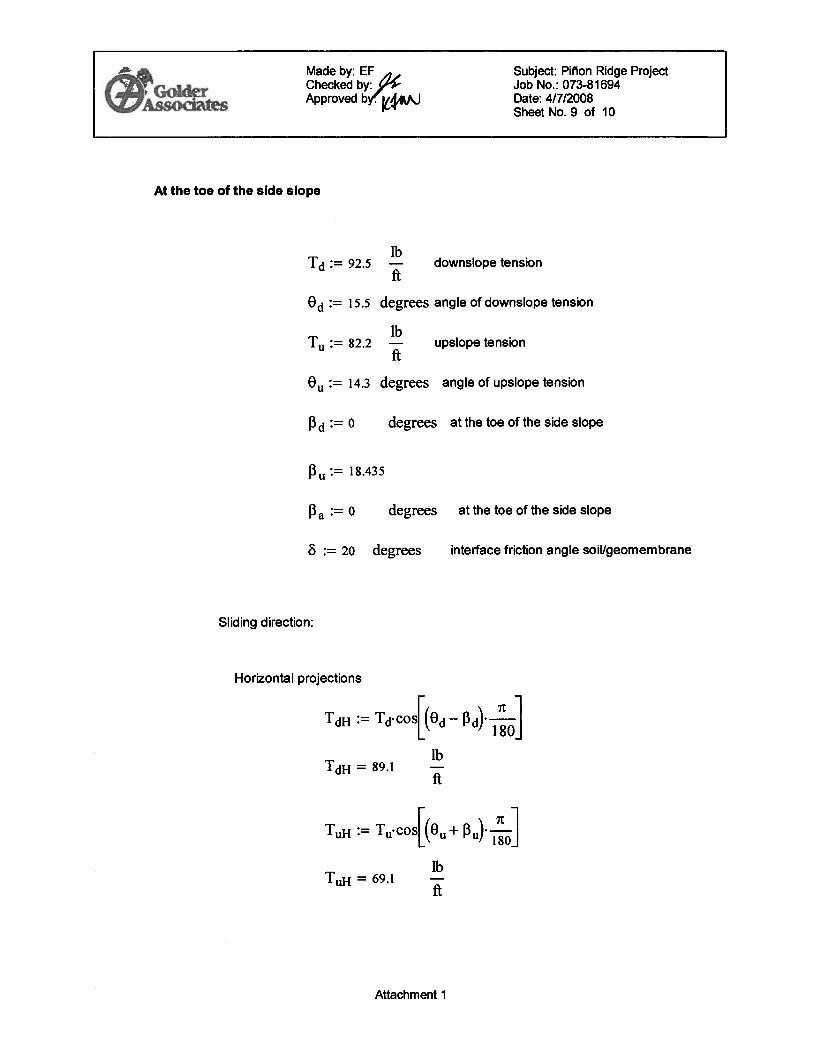
At the toe of the side slope
lbTd := 92.5 — downslope tension
:= 15.5 degrees angle of downslope tension
lbT := 82.2 — upslope tension
:= 14.3 degrees angle of upslope tension
:= 0 degrees at the toe of the side slope
18.435
I3a := 0 degrees at the toe of the side slope
6 := 20 degrees interface friction angle soil/geomembrane
Sliding direction:
Horizontal projections
TdH Td.cos[(Od— 3d)”j]
T= 89.1 —
TUH T.cos[(e + 13u)i1TH = 69.1 —
Made by: EF Subject: Piñon Ridge Project
•. Checked by: Job No.: 073-81694
a Approved by(44J.J Date: 4/7/2008Sheet No.9 of 10
Attachment I
Made by: EF A Subject: Piñon Ridge Project
f.i-: Checked by: (J. Job No.: 073-81694
Approved by/JL4jAJ Date: 4/7/2008Sheet No. 10 of 10
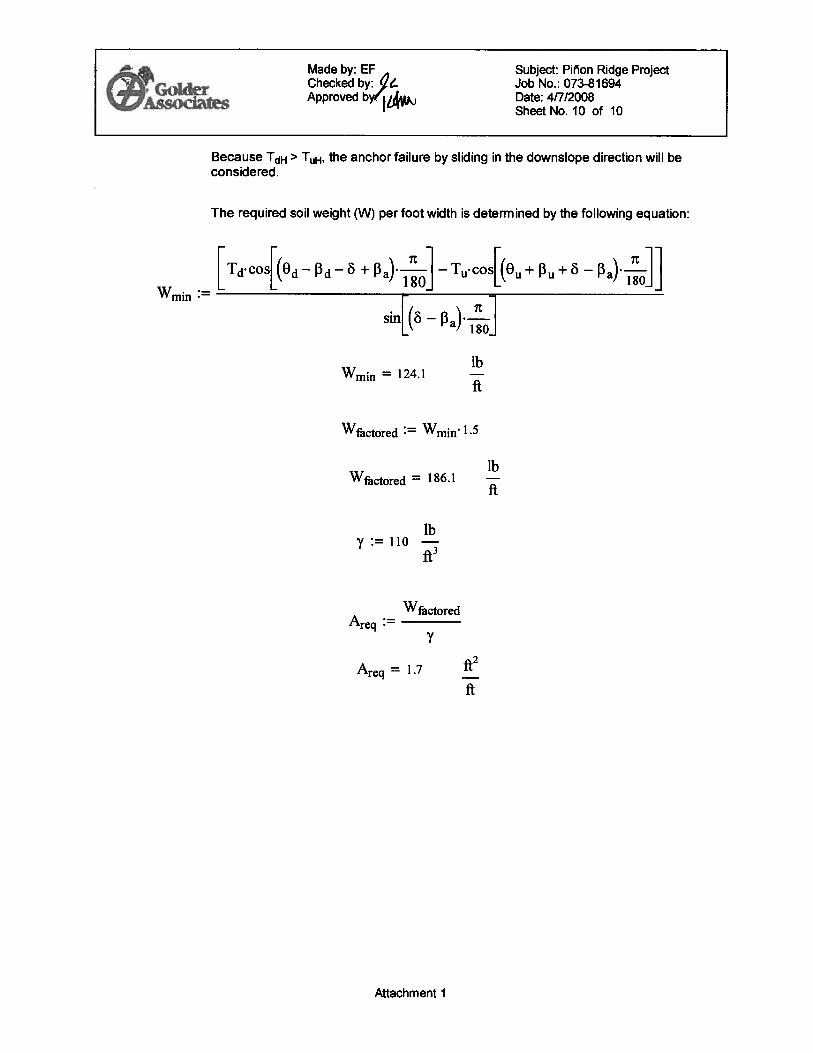
Because TdH > TUH, the anchor failure by sliding in the downslope direction will beconsidered.
The required soil weight (W) per foot width is determined by the following equation:
[Td.cos[(ed—
—6 + — T.cos[(O + 1u +—
Wmin :—
lbWmin = 124.1
WjjjcOre := Wmin 1.5
lbWthctored = 186.1
lby 110 —
ft3
WjtoreAreq :-
Areq = 1.7
ft
Attachment I