Embed Size (px)
Citation preview

Appendix B Review of Similar Projects and Related Studies
T e c h n i c a l M e m o r a n d u m To File Date 20 July 2016 Copy David Hopper Project TO3188TOB From Holly Kerslake
Re Downtown Ottawa Truck Tunnel Feasibility Review of Similar Projects in Other Cities
As identified in the task assignment for this feasibility study a review was undertaken of similar projects in other cities to compare to a potential downtown Ottawa truck tunnel Although the initial task assignment had identified seven cities this was expanded and a total of 24 tunnel sites were selected and evaluated based on their similarly to the potential downtown Ottawa truck tunnel project
The following tunnel projects were examined
1 Port Miami Tunnel 9 Detroit-Windsor Tunnel 17 Ville-Marie and Viger Tunnels (Montreal)
2 Dublin Port Tunnel 10 Louis-Hippolyte Lafontaine 18 Wacker Drive Chicago Bridge-Tunnel
3 Blanka Tunnel Complex 11 Robertson Tri-Met Tunnel 19 Thorold Stone Road Tunnel (Prague) (Portland)
4 Seattle Alaskan Way Viaduct 12 New Portsmouth Midtown 20 Dulles International Airport Replacement Tunnel Immersed Tunnel AeroTrain Tunnel
5 Oakland Caldecott Tunnel 13 George Massey Tunnel 21 Al Salam Street Tunnel (Abu (Vancouver) Dhabi)
6 Auckland Waterview Connection 14 Vancouver Trans-Canada 22 Fraser Canyon Highway Tunnel Cassiar Connector Tunnel Tunnels
7 Brisbane Clem Jones Tunnel 15 Joseph-Samson Tunnel (Quebec 23 East-West Access Road City) (Algeria)
8 Calgary Airport Trail Tunnel 16 Palm Jumeirah Vehicular Tunnel 24 Laerdal Tunnel (Norway) (Dubai)
Although the task assignment identifies a preference for the evaluation of tunnels solely used for trucks no tunnels used exclusively for trucks were found Therefore all the tunnels examined utilize a combination of truck and vehicular traffic However it was individually identified how each type of vehicle is treated as in some cases truck and vehicular traffic is managed differently
Information was primarily collected via the internet All websites where information was collected was recorded In the cases of the ldquoworld famousrdquo or high profile tunnels most information was readily available In the cases of some of the low profile smaller or older tunnel projects some of the information was not found or missing Further investigation such as contacting local agencies would need to be completed in order to attempt to obtain the missing information although it was not felt necessary at this time In the cases of tunnel projects completed by Parsons (such as the East-West Access Road in Algeria) information was available through Parsonsrsquo records
P a g e | 2
The following criteria were included in the evaluation of each of the tunnels
Location City and Country Length Length of the Tunnel in Metres Type Underwater or Underground (also - where available depth of tunnel) AADT Annual Average Daily Traffic utilizing the Tunnel Number of Lanes Total Number of Lanes in the Tunnel Date Constructed Start Date of Tunnel Construction and Date of Tunnel Opening Construction Costs Total Project Cost in Canadian Dollars Construction Method Type of Construction Method Utilized Problem Being Solved Initial Issue triggering the need for a Tunnel Community Impacts How the tunnel has impacted the surrounding community from an economic or social perspective
etc TollingOther Funding Identifies what kind of tolling strategy (if any) the tunnel utilizes and for what types of vehicles this for Operating and affects Maintenance Unforseen Problems Any construction or operational issues the tunnel has experienced and why Dangerous Goods How vehiclestrucks carrying hazardous goods are managed Treatment Inclusion of Vehicles What types of vehicles are permitted to use the tunnel Other than Trucks Permitted Success of the Tunnel Whether the tunnel is considered a success or not and why Other Comments Any other interesting facts or comments found
All information was researched and a table containing all relevant information was completed Example projects were ordered based on similarity to the Downtown Ottawa Truck Tunnel proposed project and qualityquantity of information available
Tunnel Name Photos Location Length Type AADT Number of Lanes Date Constructed Construction Costs Construction Method
Port Miami Tunnel Miami Florida USA 1300m Underwater
Tunnel Depth (Lowest
Elevation) = ~37m
AADT = 7000
Heavy Traffic = ~16
4 Lanes (2 per tunnel) Start of Construction
May 24th 2010
Opened
August 3rd 2014
Total Project Cost = $1
Billion (USD) [$745 Million
CAD]
Design and Construction
Public-Private Partnership (PPP)
2 Tunnels constructed using a Tunnel
Boring Machine (TBM)
Costs = $667 Million (USD)
Dublin Port Tunnel Dublin Ireland Underground AADT = 15000 4 Lanes (2 per tunnel) Start of Construction
June 1st 2001
euro752 Million (Euro) [$11
Billion CAD]
Built in 5 Sections using 3 Methods
- Cut and Cover
Tunnel Depth (Ground Level
to top of Tunnel) = ~21-23m
Heavy Traffic = ~40
Opened
December 20th 2006
Construction Tender Costs
= euro448 Million (Euro)
- Tunnel Boring
- Pipe Jacking (Under existing
Railway)
Blanka Tunnel Complex Prague City Czech
Republic
6400m
(3 Tunnels)
Underground Unknown 4 Lanes (2 in each
direction)
Start of Construction
2006
$37 Billion (Koruna) [$2
Billion CAD]
Driven (mined) and Cut and Cover
(divided into small sections)
Opened
Expected Early 2015
~$15 Billion (USD) Geological Condtions Generally Rock
formed by Sediment (old sea bed)
Seattle Alaskan Way Viaduct
Replacement Tunnel
Seattle Washington
USA
3200m Underground AADT = 110000 4 Lanes (1 Tunnel
Stacked)
Start of Construction
July 30th 2013
$425 Billion (USD) [$57
Billion CAD]
Single TBM (Worlds Largest)
Opening
Unknown (Under
Construction)
Oakland Caldecott Tunnel Oakland California
USA
Bores 1 amp 2 - 1100m
Bore 3 - 1149m
Bore 4 - 1033m
Underground AADT = 160000 8 Lanes (2 per tunnel) Start of Construction
Bores 1 amp 2 - 1929
Bore 3 - 1960
Bore 4 - 2010
Bore 4 = $417 Million (USD)
[$560 Million CAD]
Bore 4 - New Austrian Tunneling
Method (NATM)
Opened
Bores 1 amp 2 - 1937
Bore 3 - 1964
Bore 4 - 2013
Auckland Waterview Aukland New Zealand 2500m Underground Underground AADT (Predicted 2026) = 6 Lanes (2 Tunnels 3 Start of Construction $17 Billion (NZD) [$15 Public-Private Partnership (PPP)
Connection Tunnel 4500m Total Length 83000 Lanes Each) 2013 Billion CAD]
Earth Pressure Balance TBM
Opening
2017
1
Tunnel Name Photos Location Length Type AADT Number of Lanes Date Constructed Construction Costs Construction Method
Brisbane Clem Jones Tunnel Brisbane Australlia 4800m Underground and
Underwater
AADT = 28000
Low due to the high cost
of tolls rated to carry
~60000 vehday
4 Lanes (2 per tunnel) Star of Construction
September 2006
Opened
March 15th 2010
$32 Billion (AUD) [$31
Billion CAD]
Public-Private Partnership (PPP)
The digging was done using a
boring machine
Calgary Airport Trail Tunnel Calgary Alberta
Canada
620m Underground (under Calgary
Airport Runway)
AADT = Designed to
accommodate 75000
6 Lanes (3 in each
direction)
Start of Construction
July 2011
Opened
May 25th 2014
$295 Million (CAD) Cut and cover method was used prior
to the new runway expansion (tunnel
was constructed before the runway)
Detroit-Windsor Tunnel Windsor Ontario
Canada
Detroit Michigan USA
1570m Underwater
Tunnel Depth (Lowest
Elevation) = ~23m
AADT = 13000 2 Lanes (1 in each
direction)
Start of Construction
1927
Opened
November 3rd 1930
$25 Million (USD) [$33
Million CAD]
Immersed Tube (sections of steel tube
floated into place and sunk into a
trench dug in the river bottom)
Louis-Hippolyte Lafontaine
Bridge-Tunnel
Montreal Quebec
Canada
1391m (Tunnel Only)
Total Length = 1800m
Underwater AADT = 120000 6 Lanes (2 Tunnels 3
Lanes Each)
Start of Construction
1963
Opened
March 11th 1967
$75 Million (CAD) Immersed Tube (sections of steel tube
floated into place and sunk into a
trench dug in the river bottom)
Robertson Tri-Met Tunnel Portland Oregon USA 4710m Underground
LRT Tunnel
NA 2 Rail Lines (1 per
tunnel)
Start of Construction
June 1st 1993
Opened
September 12th 1998
$184 Million (USD) [$247
Million CAD]
TBM and Drilling and Blasting
First mile of the west end was
completed using the conventional
mining technique of drilling and
blasting due to the loose mixture of
materials East end construction
began with a TBM
New Portsmouth Midtown
Immersed Tunnel
Portsmouth Virginia
USA
1278m Underwater AADT = 46000 (2007) Existing = 2 Lanes (1 in
each direction)
New 2 Lanes (one-way
traffic)
New tunnel being built
adjacent to old tunnel to
convert from 2 Lanes to
4 Lanes
New Tunnel
Start of Construction
mid-2012
Opened
Planned 2017
$21 Billion (USD) [28
Billion CAD]
The river will be dredged and the
tunnel will be constructed separetly on
a dry dock Each piece will then be
transported to location using tugboats
and dropped in the dredged canel
Once the tunnel is in final place and
connected to adjacent tunnels backfill
is layered around the segment This is
repeated for all 11 tunnel segments
George Massey Tunnel Vancouver British
Columbia Canada
629m Underwater AADT = ~80000 (2012) 4 Lanes (2 in each
direction)
Start of Construction
March 1st 1957
Opened
May 23rd 1959
$25 Million (CAD) The tunnel is made up of six precast
concrete segments Sections were
floated into postion then sunk into a
shallow trench that had been dug into
the river bed The trench and tunnel
were then covered by a protective
layer of rock
2
Tunnel Name Photos Location Length Type AADT Number of Lanes Date Constructed Construction Costs Construction Method
Vancouver Trans-Canada
Cassiar Connector Tunnel
Vancouver British
Columbia Canada
724m Underground Unknown 6 Lanes (3 per tunnel) Start of Construction
Unknown
$115 Million (CAD) Cut and Cover
Originally opened with 4
Lanes but was designed Opened
to accommodate 6
Lanes total (was
expanded ~2005)
January 12th 1992
Joseph-Samson Tunnel Quebec City Quebec
Canada
280m Underground Unknown 3 Lanes (dynamic lane
reversal technology)
Unknown Unknown Unknown
Palm Jumeirah Vehicular Dubai United Arab 1398m Underwater Unknown 6 Lanes (3 per Start of Construction $145 Million (USD) [$194 Cut and Cover with Sheet-Piled
Tunnel Emirates directiontunnel) 2005 Million CAD] Cofferdam to hold back surrounding
Islands estimated visitors seawater
per day is 20000 Opened
2007
Ville-Marie and Viger Tunnels Montreal Quebec 1500m Underground A-720 AADT=~160000 6 Lanes (3 per Start of Construction Unknown Cut and Cover
(Montreal A-720) Canada directiontunnel) plus Late 1960s
single lanes for onoff
ramps Opened
1974
Wacker Drive Chicago Chicago Illinois USA 3500m Double-decked Highway AADT = 65000
Pedestrians = 60000day
Upper Deck
6 Lanes (with Parking -
3 in each direction)
Lower Deck
4 Lanes (2 in each
direction)
Start of Construction
~1909
Opened
1926
East Extensions
- 1963
$8 Million (USD 1926)
$200 Million (USD) 2001
2002 redesign and
reconstruction between
Michigan Ave and Randolph
St
2001-2002 Upper Deck
Reconstruction
Cast-in-place system flat-slab
longitudinally post-tensioned
reinforced high-performance
concrete
- 1975
- 1986-1987
- 2001-2002 (reconst)
- 2010 (reconst)
Thorold Stone Road Tunnel Thorold Ontario
Canada
840m Underwater
Runs under the Welland
Unknown 4 Lanes (2 per tunnel) Start of Construction
1965
Unknown The Canal section of the tunnel was
poured during the winter months when
the tunnel was drained in order to
Canal (near boat locks)
Opened
1967
minimize impacts on shipping
Concrete sections in the shape of
tubes were poured in a trench to
create the tunnel During the summer
months each end of the tunnel was
constructed
3
shy
Tunnel Name Photos Location Length Type AADT Number of Lanes Date Constructed Construction Costs Construction Method
Dulles International Dulles Airport Virginia 6080m Underground NA 2 People Mover Lines (1 Start of Construction $2 Billion (USD) [$27 Billion Cut and Cover for sections adjacent
Airport AeroTrain Tunnel USA per tunnel) 2004 CAD] to existing infrastructure
People Mover
Opened TBM or NATM for sections under
January 26th 2010 taxiways and concourses
Al Salam Street Tunnel Abu Dhabi United 2400m Underground (Roadway) Unknown 8 Lanes (4 per tunnel) Start of Construction $360 Million (USD) [$483 Cut and Cover
(renamed Sheikh Zayed Arab Emirates October 2007 Million CAD]
Tunnel)
Opened
December 4th 2012
Fraser Canyon Highway Fraser Canyon 7 Tunnels Underground Unknown 2 Lanes (1 in each Start of Construction Unknown Unknown (likely dugblasted based on
Tunnels (7 Total) British Columbia direction 1 Tunnel) 1957 old photography)
Canada Shortest 57m
Longest 610m Opened
1964
East-West Access Road Highway stretching the Total Highway Length = HighwayUnderground Unknown 6 Lanes Start of Construction $112 Billion (USD) [$153 12 Tunnels 70 Viaducts 60
Annaba Algeria complete Northern 1216km 2009 Billion CAD] Interchanges
border of Algeria
5 Tunnels Opened Construction Method Unknown
August 2014
Laeligrdal Tunnel Connects the cities 2451km Underground AADT = 1000 2 Lanes (1 in each Start of Construction $1131 Million (USD) Drilling and Blasting
Bergen and Oslo
in Norway
direction 1 Tunnel) 1995 [$1517 CAD]
Opened
2000
4
Tunnel Name Photos Problem Being Solved Community Impacts TollingOther Funding for
Operating and Maintenance Unforseen Problems Dangerous Goods Treament
Port Miami Tunnel Before the tunnel was opened the only
route for Port Miami traffic was through
downtown Miami As future plans to expand
the ports capacity proceeded there was
concern on how the increased truck vehicle
traffic would affect already congested
downtown Miamis economy and growth
Therefore a tunnel was needed to connect
Miami Port traffic directly to the MacArthur
Causeway (which connects to I-95 via Ishy
395)
The port has been losing cruise ship and cargo
traffic to Port Everglades and Fort Lauderdale
over the years due to the port layout and access
issues The new tunnel will help provide better
access to the cruise ship and cargo ports
making them a more competetive port in the
area Also due to the decrease in Port Traffic
through downtown Miami the ecomonic growth
and expansion of the downtown core will not be
hindered
No Toll
Florida Department of Transportation
fully funds the tunnel operation and
maintenance
Miami Access Tunnel (contractor) requested money from
a $150 Million (USD) reserve fund as there was an
unexpected need to grout the limestone beneath the
surface to help the TBM cut more smoothly The FDOT
denied the request for more money to the contractor
Dangerous goods are prohibited
Dublin Port Tunnel To remove heavy goods trucks from
the city-centre streets of Dublin as they
travel to the surrounding highways from the
Dublin Port
The tunnel construction employed 5000 people No Tolls for all commercial vehicles
above 35 tonnes buses with more than
25 seats and vehicles driven by
physically disabled drivers that have
been adapted for physically disabled
drivers
For all other vehicles tolling ranges from
euro3 to euro10 This is to deter non-
commercial vehicles from using this
route
During the hard-rock boring vibration caused some
damage to houses in the Marino Area A total of 241
claims were reimbursed
There was a problem with the height as many critics
argued that the 465m height isnt enough and rather a
55m height would be needed in order to accommodate
all sizes of trucks
Dangerous goods are Prohibited
(they provide a list of restricted
items)
Blanka Tunnel Complex Relieve heavy traffic through the historic
centre of Prague (congestion issues)
Unknown Unknown Political disputes (financial) contributed heavily to delays
(almost 4 years - was originally to be completed by
2011)
Unknown
Seattle Alaskan Way Viaduct Replacing the SR-99 Alaskan Way Viaduct The improved transportation and accessibility Tolled After 3 weeks for drilling the project was already 2 Unknown
Replacement Tunnel which is a 60-year old double-deck highway
that spans Seattles downtown waterfront
Due to a significant earthquake in 2001
(magnitude 68) the existing structure sunk
several inches and needed significant
repairs - which were completed If the
earthquake would have lasted a few
seconds longer engineers say the structure
would have collapsed
will help create better economic and social
prospects for those living in the area
weeks behind schedule due to problems with fiberglass
near the front of the drill and a labor dispute
In Dec 2013 the TBM struck a steel pipe which had been
installed for exploratory drilling in the planning phase of
the project This damaged the TBM requiring a 37m
shaft to be constructed to repair the TBM This delay
lasted over 1 year
Oakland Caldecott Tunnel To ease traffic congestion and end the
process of manually reversing the flow of
traffic twice a day along the middle bore
Unknown No Toll Weather conditions can vary greatly from one end
of the tunnel to the other Weather conditions should be
taken into consideration for safety reasons
Due to the Caldecott Tunnel
fire in 1982 which killed 7 people
it is illegal to transport hazardous
material in a tanker truck through
the tunnel except during the
hours of 300 am and 500 am
(light traffic times)
Auckland Waterview The tunnels will connect the Southwestern 205 houses had to be demolished No Toll Unknown Unknown
Connection Tunnel and Northwestern Motorways to complete
the Western Ring Route - a 27km long
alternative Motorway around the city In
addition the tunnels will take traffic off local
roads
The New Zealand Transportation Agency is
working to keep down construction noise have
minimal traffic impacts and surpress dust and
mud to keep residents happy during
construction
5
Tunnel Name Photos Problem Being Solved Community Impacts TollingOther Funding for
Operating and Maintenance Unforseen Problems Dangerous Goods Treament
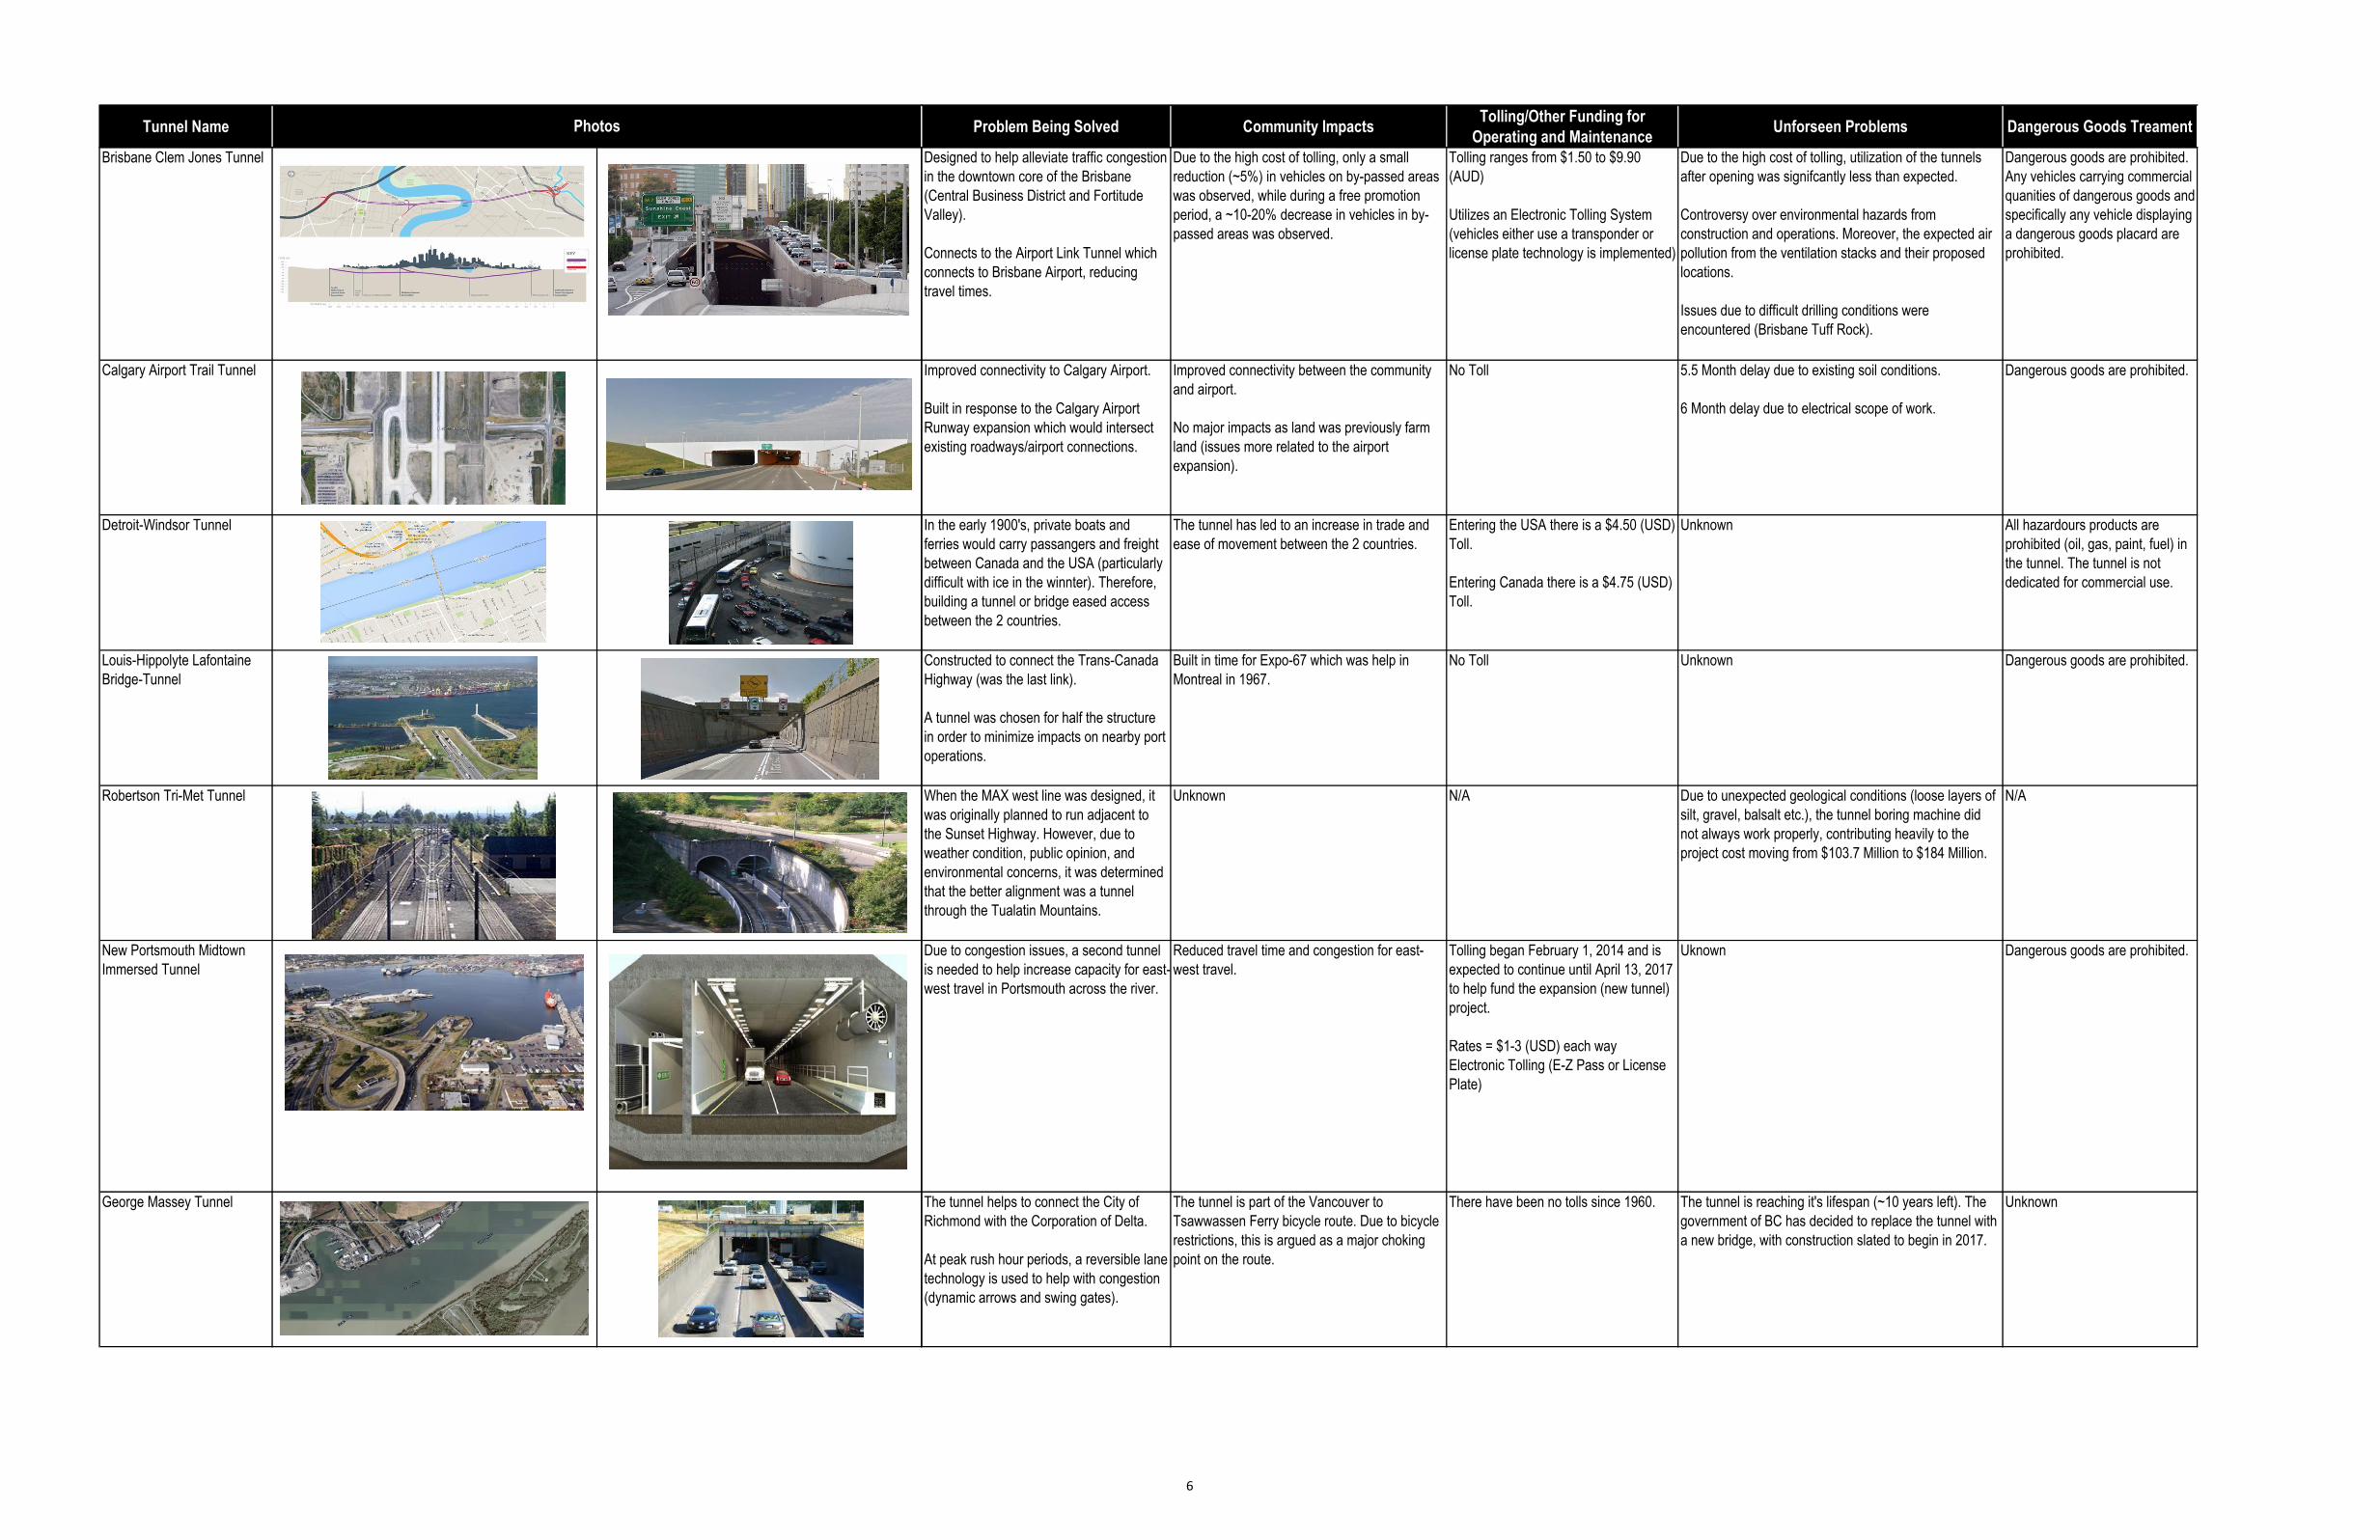
Brisbane Clem Jones Tunnel Designed to help alleviate traffic congestion
in the downtown core of the Brisbane
(Central Business District and Fortitude
Valley)
Connects to the Airport Link Tunnel which
connects to Brisbane Airport reducing
travel times
Due to the high cost of tolling only a small
reduction (~5) in vehicles on by-passed areas
was observed while during a free promotion
period a ~10-20 decrease in vehicles in byshy
passed areas was observed
Tolling ranges from $150 to $990
(AUD)
Utilizes an Electronic Tolling System
(vehicles either use a transponder or
license plate technology is implemented)
Due to the high cost of tolling utilization of the tunnels
after opening was signifcantly less than expected
Controversy over environmental hazards from
construction and operations Moreover the expected air
pollution from the ventilation stacks and their proposed
locations
Issues due to difficult drilling conditions were
encountered (Brisbane Tuff Rock)
Dangerous goods are prohibited
Any vehicles carrying commercial
quanities of dangerous goods and
specifically any vehicle displaying
a dangerous goods placard are
prohibited
Calgary Airport Trail Tunnel Improved connectivity to Calgary Airport
Built in response to the Calgary Airport
Runway expansion which would intersect
existing roadwaysairport connections
Improved connectivity between the community
and airport
No major impacts as land was previously farm
land (issues more related to the airport
expansion)
No Toll 55 Month delay due to existing soil conditions
6 Month delay due to electrical scope of work
Dangerous goods are prohibited
Detroit-Windsor Tunnel In the early 1900s private boats and
ferries would carry passangers and freight
between Canada and the USA (particularly
difficult with ice in the winnter) Therefore
building a tunnel or bridge eased access
between the 2 countries
The tunnel has led to an increase in trade and
ease of movement between the 2 countries
Entering the USA there is a $450 (USD)
Toll
Entering Canada there is a $475 (USD)
Toll
Unknown All hazardours products are
prohibited (oil gas paint fuel) in
the tunnel The tunnel is not
dedicated for commercial use
Louis-Hippolyte Lafontaine
Bridge-Tunnel
Constructed to connect the Trans-Canada
Highway (was the last link)
A tunnel was chosen for half the structure
in order to minimize impacts on nearby port
operations
Built in time for Expo-67 which was help in
Montreal in 1967
No Toll Unknown Dangerous goods are prohibited
Robertson Tri-Met Tunnel When the MAX west line was designed it
was originally planned to run adjacent to
the Sunset Highway However due to
weather condition public opinion and
environmental concerns it was determined
that the better alignment was a tunnel
through the Tualatin Mountains
Unknown NA Due to unexpected geological conditions (loose layers of
silt gravel balsalt etc) the tunnel boring machine did
not always work properly contributing heavily to the
project cost moving from $1037 Million to $184 Million
NA
New Portsmouth Midtown
Immersed Tunnel
Due to congestion issues a second tunnel
is needed to help increase capacity for east-
west travel in Portsmouth across the river
Reduced travel time and congestion for east-
west travel
Tolling began February 1 2014 and is
expected to continue until April 13 2017
to help fund the expansion (new tunnel)
project
Rates = $1-3 (USD) each way
Electronic Tolling (E-Z Pass or License
Plate)
Uknown Dangerous goods are prohibited
George Massey Tunnel The tunnel helps to connect the City of
Richmond with the Corporation of Delta
At peak rush hour periods a reversible lane
technology is used to help with congestion
(dynamic arrows and swing gates)
The tunnel is part of the Vancouver to
Tsawwassen Ferry bicycle route Due to bicycle
restrictions this is argued as a major choking
point on the route
There have been no tolls since 1960 The tunnel is reaching its lifespan (~10 years left) The
government of BC has decided to replace the tunnel with
a new bridge with construction slated to begin in 2017
Unknown
6
Tunnel Name Photos Problem Being Solved Community Impacts TollingOther Funding for
Operating and Maintenance Unforseen Problems Dangerous Goods Treament
Vancouver Trans-Canada
Cassiar Connector Tunnel
The tunnel eliminates at-grade intersections
of the Trans Canada Highway and the city
street system and improves traffic flow to
and from the Second Narrows Bridge
The tunnel has led to the removal of the last
remaining traffic lights on the Trans Canada
No Toll Unknown Dangerous goods are prohibited
Exceptions may occur at
specified times and with written
permission
Joseph-Samson Tunnel To connect the east side of downtown
Quebec City the Riviere Saint Charles
Bridge
Unknown No Toll Unknown Dangerous goods are prohibited
Palm Jumeirah Vehicular
Tunnel
A tunnel was needed in order to connect
the spine of The Palm Island to the outter
Crescent
Unknown No Toll Unknown Hazardous loads are not
restricted in the tunnel However
an automatic number plate reader
system is utilized which reads the
hazardous warning plate on a
vehicle when it enters and leaves
the tunnel This system helps
emergency services determine
what type of emergency they are
responding too if an accident was
to occur in one of the tunnels
Ville-Marie and Viger Tunnels
(Montreal A-720)
To create a fast and effective way to move
through the downtown core of Montreal
Unknown No Tolls On July 31st 2011 part of the interior roof collapsed The
tunnel was closed for repairs until August 6th 2011
Dangerous goods are prohibited
Wacker Drive Chicago Originally the highway was built to help
beautify the city and relieve congestion
The highway was built to replace South
Water and River Street
Extension were built in later years to extend
the highway to the east
Unknown No Toll Unknown
Thorold Stone Road Tunnel Highway 58 had to be continued so this
tunnel was constructed underneath the
Welland Canal
Unknown No Tolls During construction the concrete was poured during the
winter months of the year This has led to over-expansion
of the concrete resulting in some cracking Extensive
work has been done to correct this issue during the
summer months of the year which has had impacts on
traffic flow and congestion
Unknown
7
Tunnel Name Photos Problem Being Solved Community Impacts TollingOther Funding for
Operating and Maintenance Unforseen Problems Dangerous Goods Treament
Dulles International The system was built to replace mobile Unknown NA NA
Airport AeroTrain Tunnel lounges (buses) which moved passengers
from the Concourse to the Terminal
Al Salam Street Tunnel
(renamed Sheikh Zayed
Tunnel)
Al Salam Street is the main street in Abu
Dhabi Which connects the downtown
business sector with the 2 main bridges to
Unknown No Toll Unknown Dangerous goods are prohibited
the city Adding a tunnel under the main
road helps with congestion and reducing
travel times along the corridor
Fraser Canyon Highway To complete the Trans Canada Highway Unknown No Toll Unknown Unknown
Tunnels (7 Total) (Highway 1)
Very rural area
East-West Access Road The project will help reduce travel times Construction generated over 100000 jobs Tolled Cost Unknown Unknown Unknown
Annaba Algeria and provide better and safer access to the
north side of the country helping to
stimulate economic development
Laeligrdal Tunnel Due to harsh winters highways and ferries
between the two cities could not remain
Unknown No Tolls Unknown Unknown
open during the winter The tunnel provides
all-season access between the two cities
8
Tunnel Name Photos Inclusion of Vehicles Other than Trucks
Permitted Success of the Tunnel Other Comments
Port Miami Tunnel Trucks use right lane and carsother use left lane
Pedestrians and cyclists are prohibited from the tunnel
The project coincides with other projects which will increase port
traffic such as the Port of Miami Deep Dredge Project and Panama
Canal Expansion
Much public speculation that the project was unnecessary and a
waste of tax payer dollars
Very similar purposeproblem being
resolved to the King Edwards Truck
Tunnel in Ottawa
Dublin Port Tunnel Tolls for all non-truckbus traffic to deter other vehicles
from using the tunnel
The tunnel did in the end remove trucks from the streets of Dublin
but many problems were encountered during construction including
water leaks cost overruns height controversy and house damage
Blanka Tunnel Complex Unknown Tunnel is still under construction Located a few hundred metres from the
protected area of Prague Castle
Seattle Alaskan Way Viaduct
Replacement Tunnel
All types of vehicles permitted Tunnel is still under construction Utilizes the Worlds Largest Tunnel
Boring Machine
Oakland Caldecott Tunnel All types of vehicles permitted
Pedestrians and cyclists are prohibited from the tunnel
Unknown All four bores cross the Hayward Fault
Zone
Auckland Waterview
Connection Tunnel
Unknown Tunnel is still under construction 10th Largest Tunnel Boring Machine
Ever Built
9
Tunnel Name Photos Inclusion of Vehicles Other than Trucks
Permitted Success of the Tunnel Other Comments
Brisbane Clem Jones Tunnel Any vehicles are permitted except the following
- Vehicles and loads exceeding 46m high
- Vehicles carrying commercial quantities of dangerous
goods and specifically any vehicle displaying a
dangerous goods placard
- Mopeds
- Tractors
- Bicycles
Due to the high toll costs and inherent low demand for the tunnel the
bridge has not been as successful as planned due to extremely low
usage
Tunnel was sold in 2013 to Queensland Motorways for $618 Million
(AUD) well below the cost of $31 Billion (AUD) to build it
Very similar situation to Hwy 407 in
Toronto Ontario Canada
Calgary Airport Trail Tunnel All types of vehicles permitted Unknown
Detroit-Windsor Tunnel Motorcyles are prohibited in the tunnel About 13000
vehicles travel throught he tunnel daily 98 of them are
cars
Unknown
Louis-Hippolyte Lafontaine
Bridge-Tunnel
All types of vehicles permitted
Pedestrians and cyclists are prohibited from the tunnel
Unknown
Robertson Tri-Met Tunnel NA Unknown The tunnel is constructed through 16
million year old basalt layers - therefore
the tunnel curves updown and side to
side in order to follow the best rock
construction conditions
New Portsmouth Midtown
Immersed Tunnel
All types of vehicles permitted
Pedestrians and cyclists are prohibited from the tunnel
Tunnel is still under construction
George Massey Tunnel The tunnel is illegal for cyclists or pedestrians to traverse
Shuttle buses operate to provide access through the
tunnel for pedestrians and cyclists (the tunnel is part of
the Tsawwassen Ferry Bicycle Route)
Successful However 50 years later it does have traffic congestion
issues
The Geroge Massey Tunnel was the
first tunnel to use a precast construction
method (precast concrete sections) in
North America
10
Tunnel Name Photos Inclusion of Vehicles Other than Trucks
Permitted Success of the Tunnel Other Comments
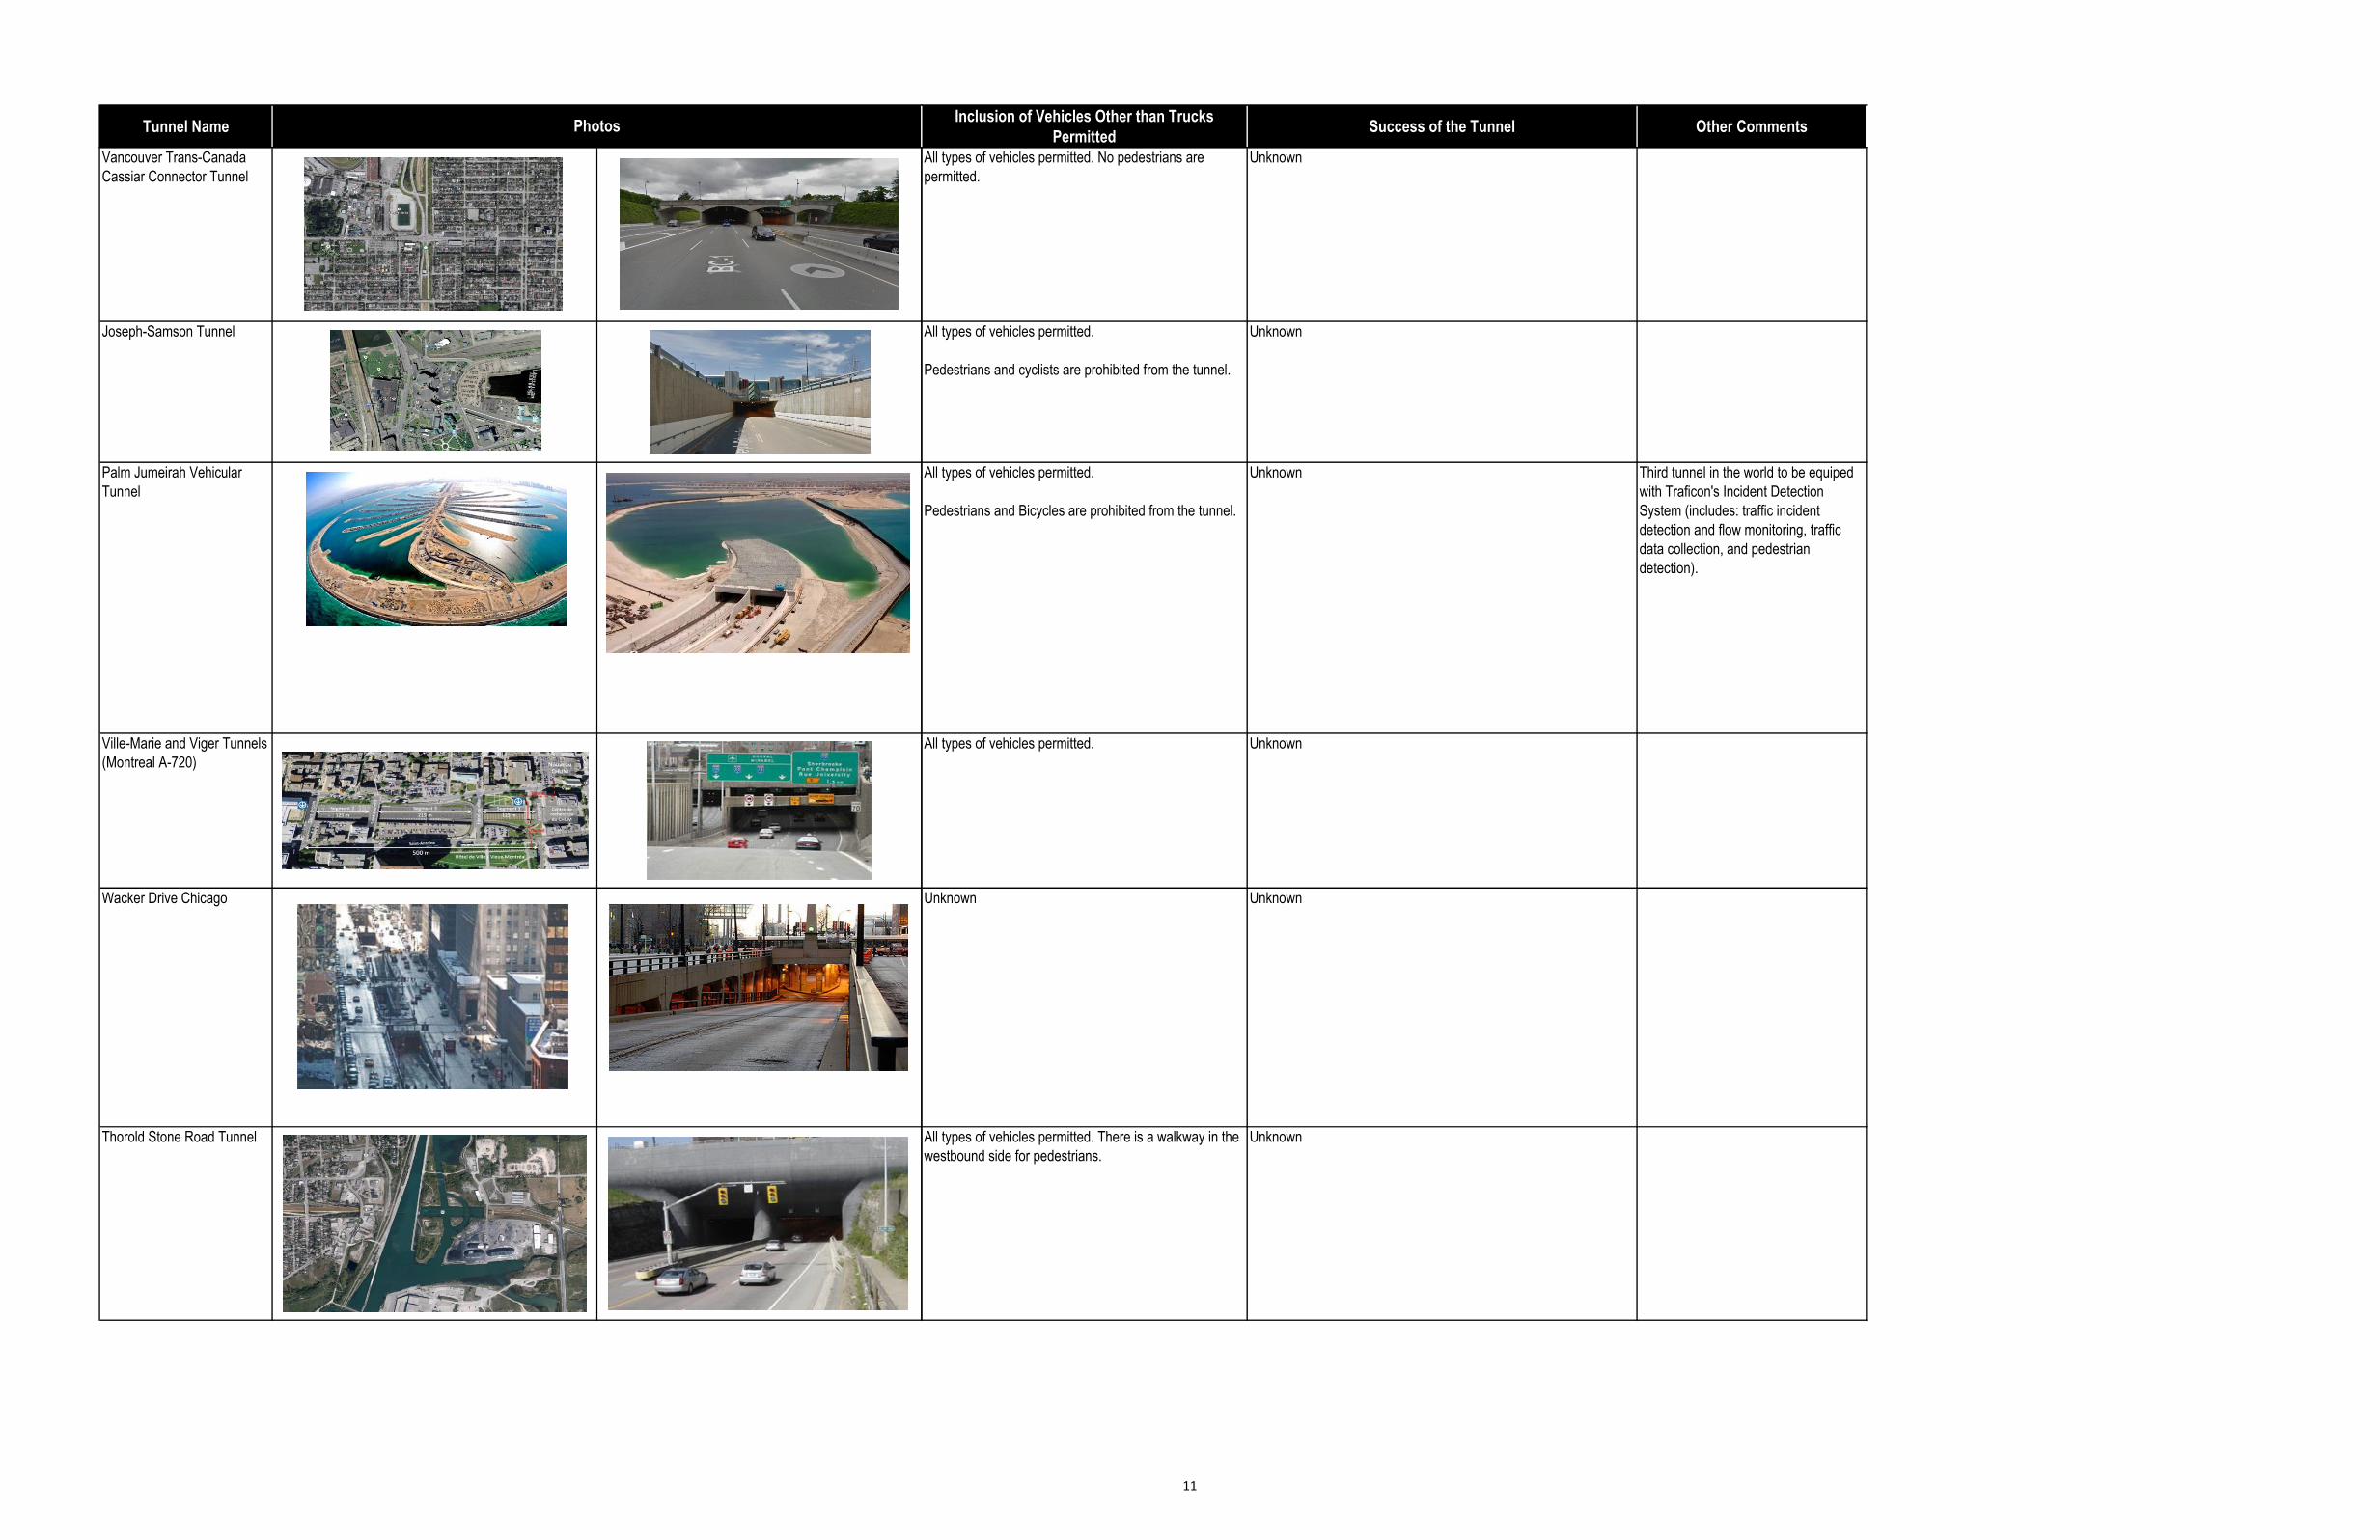
Vancouver Trans-Canada
Cassiar Connector Tunnel
All types of vehicles permitted No pedestrians are
permitted
Unknown
Joseph-Samson Tunnel All types of vehicles permitted
Pedestrians and cyclists are prohibited from the tunnel
Unknown
Palm Jumeirah Vehicular
Tunnel
All types of vehicles permitted
Pedestrians and Bicycles are prohibited from the tunnel
Unknown Third tunnel in the world to be equiped
with Traficons Incident Detection
System (includes traffic incident
detection and flow monitoring traffic
data collection and pedestrian
detection)
Ville-Marie and Viger Tunnels
(Montreal A-720)
All types of vehicles permitted Unknown
Wacker Drive Chicago Unknown Unknown
Thorold Stone Road Tunnel All types of vehicles permitted There is a walkway in the
westbound side for pedestrians
Unknown
11
Tunnel Name Photos Inclusion of Vehicles Other than Trucks
Permitted Success of the Tunnel Other Comments
Dulles International
Airport AeroTrain Tunnel
People Mover (AeroTrain) Unknown
Al Salam Street Tunnel
(renamed Sheikh Zayed
Tunnel)
All types of vehicles under 55m and under 25 tonnes
are permitted Pedestrians and cyclists are prohibited
from the tunnel Cameras are used to detect vehicle
height and detect when a vehicle taller than 55m has
entered the tunnel
Unknown
Fraser Canyon Highway
Tunnels (7 Total)
All types of vehicles permitted Cyclists are also
permitted
Unknown Two of the tunnels having warning lights
which cyclists activate prior to entering
the tunnel to notify motorists (due to
winding road conditions)
East-West Access Road
Annaba Algeria
Unknown Uknown
Laeligrdal Tunnel All types of vehicles permitted
Pedestrians and cyclists are prohibited from the tunnel
Tunnel is very rural
Unknown Longest Road Tunnel in the World
Tunnel is divided into 4 segments
seperated by large mountain caves The
main tunnel utilizes white lights while
the caves are different colours to beak
routine They also help with
claustrophobia
12
Tunnel Name Photos Web LINKS
Port Miami Tunnel httpwwwportofmiamitunnelcom
httpenwikipediaorgwikiPort_Miami_Tunnel
Dublin Port Tunnel httpdublintunnelieabout
httpenwikipediaorgwikiDublin_Port_Tunnel
httpwwwengineersjournalieoperations-dublin-tunnel
httpdublintunneliehauliers23_6_2008_Dangerous_Goods_Regspdf
Blanka Tunnel Complex httpwwwradioczensectioncurraffrsmassive-blanka-tunnel-has-been-completed-aftershy
years-of-delays
httpwwwcttaorgFileUploadita2007PdfCH-178pdf
httpwwwsatraczenblanka-tunnel-complex
httpenwikipediaorgwikiBlanka_tunnel_complex
httpwwwita-aitesczenpodzemni_stavbypodzemni_stavby_ve_vystavbeblanka-complexshy
tunnels-praguehtml
Seattle Alaskan Way Viaduct
Replacement Tunnel
httpwwwwsdotwagovProjectsViaductAboutTunneling
httpenwikipediaorgwikiAlaskan_Way_Viaduct_replacement_tunnel
httpwwwworldfinancecominfrastructure-investmentalaskan-way-viaduct-replacement-toshy
reshape-seattles-future
Oakland Caldecott Tunnel httpenwikipediaorgwikiCaldecott_Tunnel
httpwwwcaldecott-tunnelorg
Auckland Waterview
Connection Tunnel
httpwwwnztagovtnzprojectswaterviewconnection
httpenwikipediaorgwikiWaterview_Connection
13
Tunnel Name Photos Web LINKS
Brisbane Clem Jones Tunnel httpwwwclem7comaucontent22338Working-With-Our-Community
httpenwikipediaorgwikiClem_Jones_TunnelPoor_patronage
httpwwwbrisbaneqldgovautraffic-transportroads-infrastructure-bikewaystunnelsshy
bridges-transport-linksclem7-tunnel
httpwwwsmhcomaubusinessturning-3b-into-618m-brisbanes-failed-clem7-tunnel-soldshy
off-20130927-2uihwhtml
Calgary Airport Trail Tunnel httpenwikipediaorgwikiCalgary_International_Airport
httpwwwcalgarycaTransportationTIPagesRoad-projectsAirport-Trail-Tunnelaspx
httpconftac-atccaenglishannualconferencetac2013session10linpdf
httpwwwpclcomprojects-that-inspirepagesairport-trail-underpassaspx
Detroit-Windsor Tunnel httpenwikipediaorgwikiDetroitE28093Windsor_Tunnel
httpwwwdwtunnelcomAboutUsaspx
httpprojectswindsorpubliclibrarycomdigifleetwayhistophplang=enampstory=1
Louis-Hippolyte Lafontaine
Bridge-Tunnel
httpenwikipediaorgwikiLouis-Hippolyte_Lafontaine_BridgeE28093Tunnel
httpwwwmontrealroadscomcrossingslafontaine
httpwwwtrucknewscomfeaturesquebec-to-harmonize-dangerous-goods-regulations
Robertson Tri-Met Tunnel httpenwikipediaorgwikiRobertson_Tunnel
httpconferenceswsueduformsbridgeinspectorspresentations138apdf
New Portsmouth Midtown
Immersed Tunnel
httpwwwfhwadotgovipdproject_profilesva_midtown_tunnelaspx
httpswwwdriveertcomconstructionmidtown-tunnel
httpenwikipediaorgwikiMidtown_Tunnel_(Virginia)
httpwwwtunneltalkcomMidtown-Tunnel-Dec11-PPP-contract-awardedphp
httpwwwroadstothefuturecomMid_Tunn_Port_Norf_MLKhtml
httpswwwdriveertcomfaq
httpwwwdmvnowcomwebdocpdfdmv109pdf
George Massey Tunnel httpenwikipediaorgwikiGeorge_Massey_TunnelConfiguration
httpwww2newsgovbccanews_releases_2013-20172013PREM0095-001430pdf
httpengagegovbccamasseytunnel
14
Tunnel Name Photos Web LINKS
Vancouver Trans-Canada
Cassiar Connector Tunnel
httpswwwgooglecaurlsa=tamprct=jampq=ampesrc=sampsource=webampcd=8ampved=0CD4QFjAHampu
rl=http3A2F2Fwwwtunnelcanadaca2Fdocumentshy
loadphp3Fdir3D199426file3DBruce_et_al_1994pdfampei=VKX4VN6bL5alyAS6hoC
QAQampusg=AFQjCNEdndSmvvPiCZFLpi7FBw-SHAurqgampsig2=rPshy
iZfilrpx_ZhniYW3ypAampbvm=bv87519884daWwampcad=rja
httpenwikipediaorgwikiCassiar_Tunnel
httpwwwquickscribebccasecurepdfs3232pdf
Joseph-Samson Tunnel httpwww2publicationsduquebecgouvqccadynamicSearchtelechargephptype=1ampfile=
5021PDF
httpwwwnyx-hemeracomenprojectsitem45-tunnel-joseph-samson-in-quebec-cityshy
canada
Palm Jumeirah Vehicular
Tunnel
httpwwwparsonscomprojectsPagespalm-jumeirah-vehicular-tunnelaspx
httpwwwdesignbuild-networkcomprojectspalm-jumeirah
httpwwwworldhighwayscomcategoriesroad-highway-structuresfeatureskeepingshy
tunnels-safe
Ville-Marie and Viger Tunnels
(Montreal A-720)
httpstructuraenetstructuresville-marie-tunnel
httpwww2publicationsduquebecgouvqccadynamicSearchtelechargephptype=2ampfile=
2F2FC_24_22FC24_2R43_Ahtm
httpenwikipediaorgwikiQuebec_Autoroute_720
httpwwwmontrealroadscomroadsA-720
Wacker Drive Chicago httpenwikipediaorgwikiMultilevel_streets_in_Chicago
httpenwikipediaorgwikiWacker_Drive
Thorold Stone Road Tunnel httpwwwniagarafrontiercomchr
onohtml
httpenwikipediaorgwikiThorold_Tunnel
httpenwikipediaorgwikiOntario_Highway_58
15
Tunnel Name Photos Web LINKS
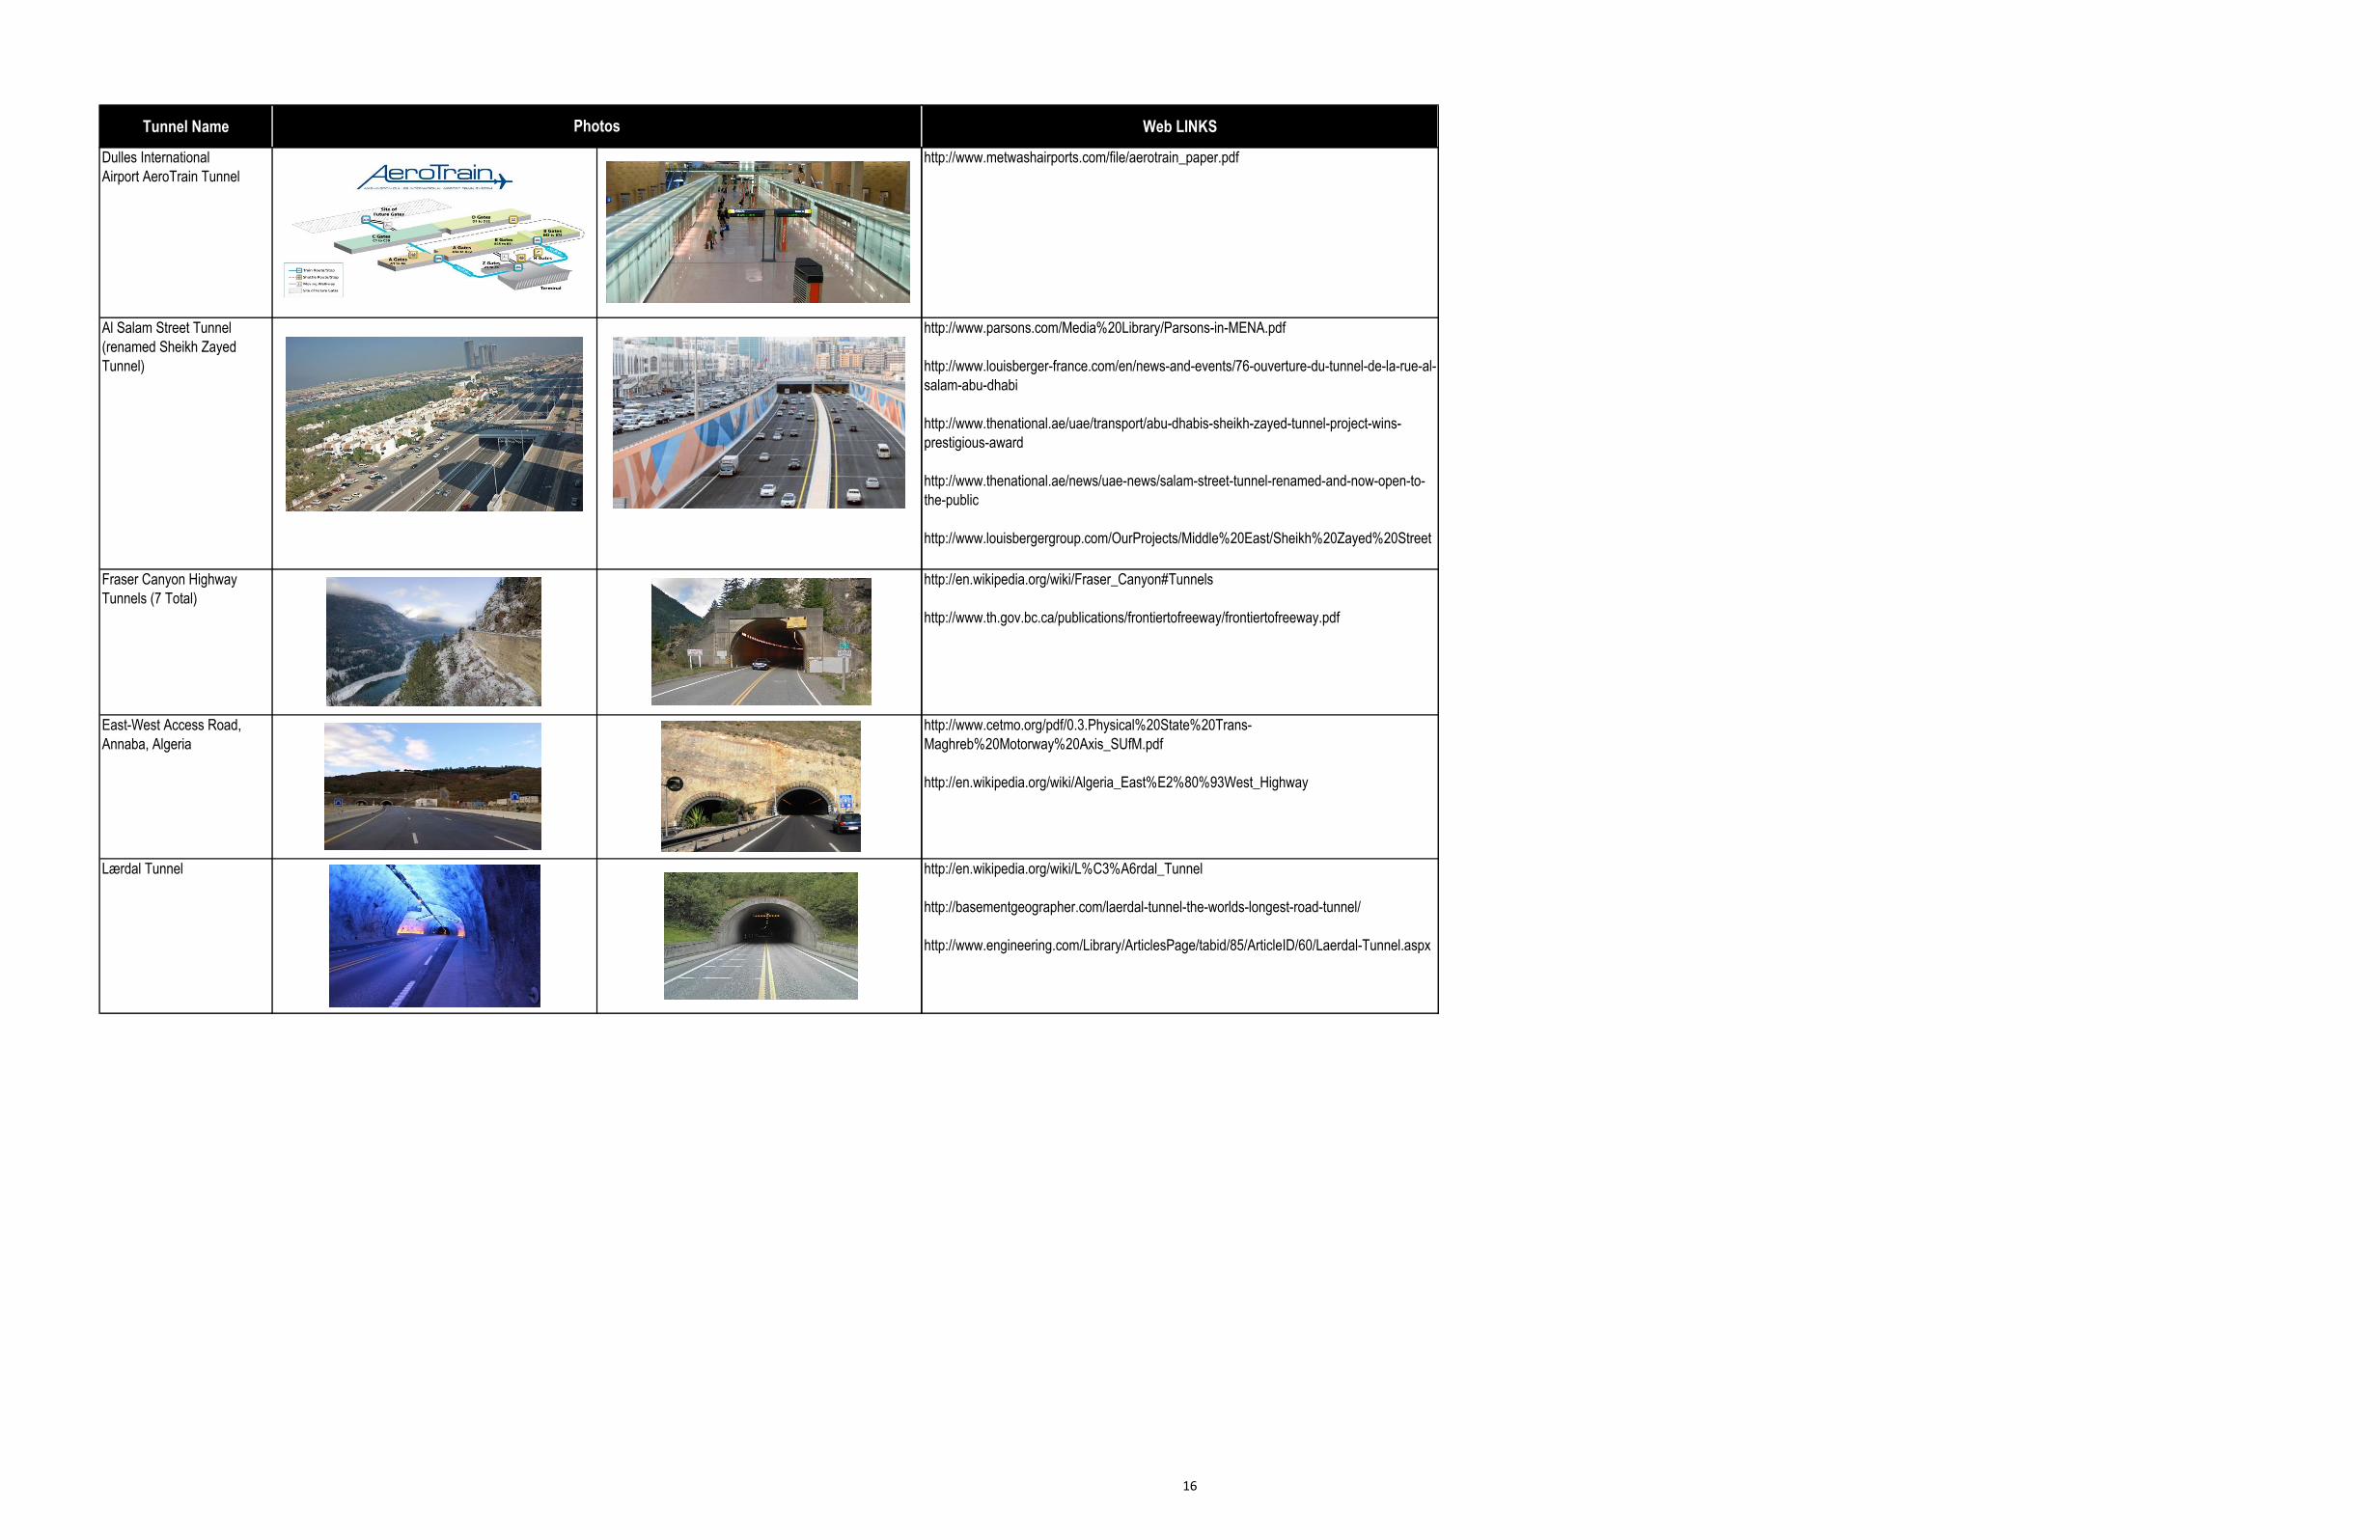
Dulles International
Airport AeroTrain Tunnel
httpwwwmetwashairportscomfileaerotrain_paperpdf
Al Salam Street Tunnel
(renamed Sheikh Zayed
Tunnel)
httpwwwparsonscomMedia20LibraryParsons-in-MENApdf
httpwwwlouisberger-francecomennews-and-events76-ouverture-du-tunnel-de-la-rue-alshy
salam-abu-dhabi
httpwwwthenationalaeuaetransportabu-dhabis-sheikh-zayed-tunnel-project-winsshy
prestigious-award
httpwwwthenationalaenewsuae-newssalam-street-tunnel-renamed-and-now-open-toshy
the-public
httpwwwlouisbergergroupcomOurProjectsMiddle20EastSheikh20Zayed20Street
Fraser Canyon Highway
Tunnels (7 Total)
httpenwikipediaorgwikiFraser_CanyonTunnels
httpwwwthgovbccapublicationsfrontiertofreewayfrontiertofreewaypdf
East-West Access Road
Annaba Algeria
httpwwwcetmoorgpdf03Physical20State20Transshy
Maghreb20Motorway20Axis_SUfMpdf
httpenwikipediaorgwikiAlgeria_EastE28093West_Highway
Laeligrdal Tunnel httpenwikipediaorgwikiLC3A6rdal_Tunnel
httpbasementgeographercomlaerdal-tunnel-the-worlds-longest-road-tunnel
httpwwwengineeringcomLibraryArticlesPagetabid85ArticleID60Laerdal-Tunnelaspx
16
Catalogue no 16‑002‑X ISSN 1913‑4320
EnviroStats
Trucking dangerous goods in Canada 2004 to 2012
by Sagal Searag Greg Maloney and Larry McKeown Environment Energy and Transportation Statistics Division
Release date February 11 2015
How to obtain more information For information about this product or the wide range of services and data available from Statistics Canada visit our website wwwstatcangcca
You can also contact us by
email at infostatsstatcangcca
telephone from Monday to Friday 830 am to 430 pm at the following toll‑free numbers
bull Statistical Information Service 1‑800‑263‑1136 bull National telecommunications device for the hearing impaired 1‑800‑363‑7629 bull Fax line 1‑877‑287‑4369
Depository Services Program
bull Inquiries line 1‑800‑635‑7943 bull Fax line 1‑800‑565‑7757
Standards of service to the public Statistics Canada is committed to serving its clients in a prompt reliable and courteous manner To this end Statistics Canada has developed standards of service that its employees observe To obtain a copy of these service standards please contact Statistics Canada toll‑free at 1‑800‑263‑1136 The service standards are also published on wwwstatcangcca under ldquoAbout usrdquo gt ldquoThe agencyrdquo gt ldquoProviding services to Canadiansrdquo
Note of appreciation Canada owes the success of its statistical system to a long‑standing partnership between Statistics Canada the citizens of Canada its businesses governments and other institutions Accurate and timely statistical information could not be produced without their continued co‑operation and goodwill
Standard table symbols The following symbols are used in Statistics Canada publications
not available for any reference period
not available for a specific reference period
not applicable 0 true zero or a value rounded to zero 0s value rounded to 0 (zero) where there is a meaningful
distinction between true zero and the value that was rounded p preliminary r revised x suppressed to meet the confidentiality requirements
of the Statistics Act E use with caution F too unreliable to be published significantly different from reference category (p lt 005)
Published by authority of the Minister responsible for Statistics Canada
copy Minister of Industry 2015
All rights reserved Use of this publication is governed by the Statistics Canada Open Licence Agreement
An HTML version is also available
Cette publication est aussi disponible en franccedilais
Statistics Canada mdash February 2015 EnviroStats 1
Trucking dangerous goods in Canada 2004 to 2012
by Sagal Searag Greg Maloney and Larry McKeown Environment Energy and Transportation Statistics Division
Highlights bull The Canadian for-hire trucking industry moved 650 million tonnes of freight in 2012 of which almost 17 consisted
of dangerous goods
bull In 2012 crude petroleum products accounted for the largest share of dangerous goods at over one-third (38) up from one-quarter (25) in 2004
bull During 2012 the for-hire trucking industry is estimated to have transported approximately four times the dangerous goods by weight than did railways
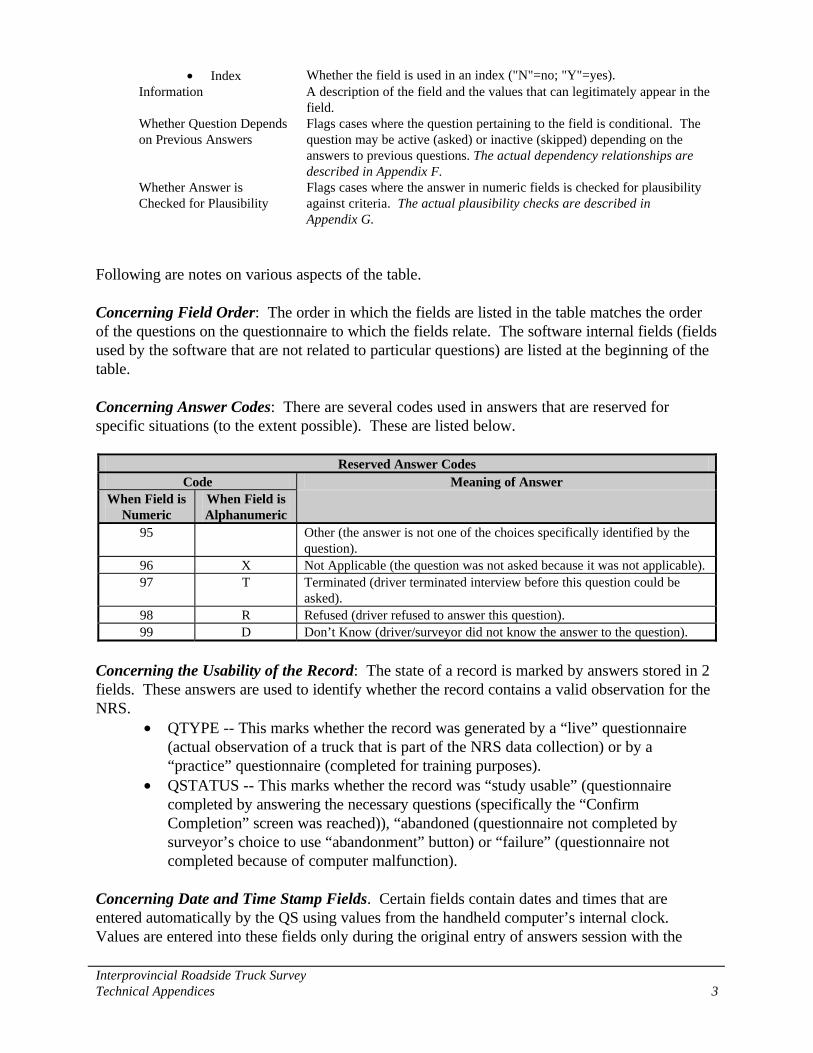
Introduction Recent events have heightened public awareness concerning the transportation of dangerous goods While economic regulation of Canadarsquos transportation sector has been reduced over the last 25 years the movement of dangerous goods continues to be carefully regulated Compared to other freight shipments of explosives gases flammable liquids flammable solids oxidizing substances poisonous and infectious substances nuclear substances corrosives and other products pose public safety and environmental risks1 The consequences of accidents or spills can be severe particularly if shipments travel through population centres or fragile ecosystems2
Regulations on the movement of dangerous goods can vary by jurisdiction but generally require accurate classification appropriate means of containment and correct marking labelling and documentation In Canada federal legislation currently prohibits the transportation of certain high risk dangerous goods unless an Emergency Response Assistance Plan (ERAP) has been submitted and approved The plan outlines how specialized emergency response personnel will react to
an accident and their overall capacity to respond As dangerous goods are likely to remain a significant portion of the overall freight moved across the country there is a recognized need to further enhance the monitoring of these shipments
For instance in June of 2014 Transport Canada amended the Transportation of Dangerous Goods Regulations to clarify the criteria for displaying safety marks3 The regulation now requires safety marks to be displayed on trucks rail cars and bulk containers used to transport dangerous goods identifying the type of goods and the nature of the risk posed And in August Transport Canada launched the second stage of consultations concerning adequate railway third party liability insurance in order to cover among other costs the spill of contaminants and environmental damage related to railway operation4
Surface transportation (ie road and rail excluding pipelines) is estimated to move almost 95 of the total tonnage of dangerous goods in Canada with trucking accounting for the largest share5 The possibility that accidents might occur at any time or any location
1 Dangerous goods are defined by the Transportation of Dangerous Goods Act 1992 as products substances or organisms in any of these nine classes Based on their inherent nature these goods are further classified from Packing Group I indicating great danger to Packing Group III indicating minor danger
2 For example estimated costs to clean-up the 2010 spill of diluted bitumen into Michiganrsquos Kalamazoo River basin now exceed $1-billion De Souza M 2014 ldquoThe pipeline proposals feeding Harperrsquos oil gridrdquo Power amp Influence The Business Issue Vol 3 no 3 Hill Times Publishing
3 Government of Canada 2014 Regulations Amending the Transportation of Dangerous Goods Regulations (Part 4 Dangerous Goods Safety Marks) PC 2014-684 June 12 2014 SOR2014-159 Canada Gazette Vol 148 no 14 July 2 2014
4 Transport Canada 2014 Comprehensive Review of the Third Party Liability and Compensation Regime for Rail TP 15242 E wwwtcgccamediadocuments policyDiscussion-Paper-Compensation-Liabilitypdf (accessed September 19 2014)
5 Provencher M 2010 The Movement and Handling of Dangerous Goods in Canada for the Year 2008 Transport Canada Transport Dangerous Goods Directorate Ottawa
2 EnviroStats February 2015 mdash Statistics Canada
Trucking dangerous goods in Canada 2004 to 2012
Chart 1 Total goods trucked by type Canada 2004 to 2012
weight (thousands of tonnes)
700000
600000
500000
400000
300000
200000
100000
Other goods Dangerous goods
Source Statistics Canada Environment Energy and Transportation Statistics Division Trucking Commodity Origin and Destination Survey (survey number 2741) various years
2004 2005 2006 2007 2008 2009 2010 2011 2012 0
between the origin and destination raises questions concerning the nature of these types of shipments To provide some perspective this study examines the dangerous goods
transported by the Canadian for-hire trucking industry from 2004 to 2012 focusing on tonnage types of goods and average distance per shipment
Increasing weight shipped
In 2012 the combined weight of all commodities moved by Canadian for-hire trucking establishments reached
What you should know about this study Statistics Canadarsquos Trucking Commodity Origin and Destination Survey (TCOD) targets large (annual revenue gt $13 million) establishments in the Canadian for-hire trucking industry (North American Industry Classification System 484) It excludes foreign-based trucking establishments operating in Canada and non-trucking establishments with their own fleets (ie private trucking) As such TCOD estimates should be considered as a lower boundary of total trucking activity in Canada For comparison for-hire trucking establishments in the United States accounted for just 58 of dangerous goods trucked by weight in 2012 but averaged over 45 times the distance shipped
Over the study period the number of target establishments ranged roughly from 2100 to 2900 in 2012 92 of 2196 establishments responded to the survey Statistics Canada interviewers visit each establishment and using a systematic sample of shipping documents record information on the origin and destination of shipments as well as the weight and type of goods The coefficient of variation (CV) by weight was calculated at less than 5 for all types of shipments in 2012
Commodities are classified to a Standard Classification of Transported Goods (SCTG) aggregation which includes about 500 groups In many cases all commodities in a group are considered dangerous while in other groups some are dangerous and others are not In the second case an algorithm based on Transport Canada information is used to apply a flag that reflects the likelihood that the shipment includes dangerous goods In 2012 97 of shipments by weight flagged as dangerous goods were classified to SCTG groups in which all goods are dangerous such as Petroleum products In comparison shipments of Glues and prepared glues were considered as dangerous 18 of the time
over 650 million tonnes a record amount culminating from steady growth experienced following the 2009 economic downturn (Chart 1) A key portion of these shipments in 2012 consisted of dangerous goods at just over 107 million tonnes (17 of all goods) up from the 81 million tonnes (or 14) trucked in 2004 This represents an increase of 32 since 2004 almost twice the rate of growth of the industryrsquos overall shipments (17) during this same period
Road versus rail Recent derailments have served to increase the level of scrutiny associated with the movement of dangerous goods by rail6 However a larger tonnage of dangerous
6 See for example Winter J 2014 ldquoSafety in Numbers Evaluating Canadian Rail Safety Datardquo SPP Communiqueacute Vol 6 no 2 University of Calgary The School of Public Policy
Trucking dangerous goods in Canada 2004 to 2012
Chart 2 Surface transportation1 of dangerous goods in Canada 2012
20
80
Rail transportation (NAICS 482) 261 million tonnes Truck transportation (NAICS 484) 1074 million tonnes
1 Excluding pipelines Note NAICS North American Industry Classification System Sources Statistics Canada Environment Energy and Transportation Statistics Division Trucking Commodity Origin and Destination Survey (survey number 2741) and Monthly Railway Carloadings Survey (survey number 2732) 2012
goods is transported by truck In 2012 the for-hire trucking industry handled approximately four times the dangerous goods by weight than did the mainline railways (Chart 2)7 In the United States but including private trucking carriers about 93 of the more than 16 billion tons of dangerous goods transported by surface moved by truck8
Despite carrying more dangerous goods by weight the consequences of an accident by truck are limited to a small number of trailers on a per truck basis And moreover the average shipments by truck i n v o l v e s h o r t e r d i s t a n c e s 9
Shipments of dangerous goods by truck and rail would be therefore more comparable on a per tonne-kilometre basis However it should also be noted that most accidents and spills of dangerous goods occur during handling rather than during actual transit10
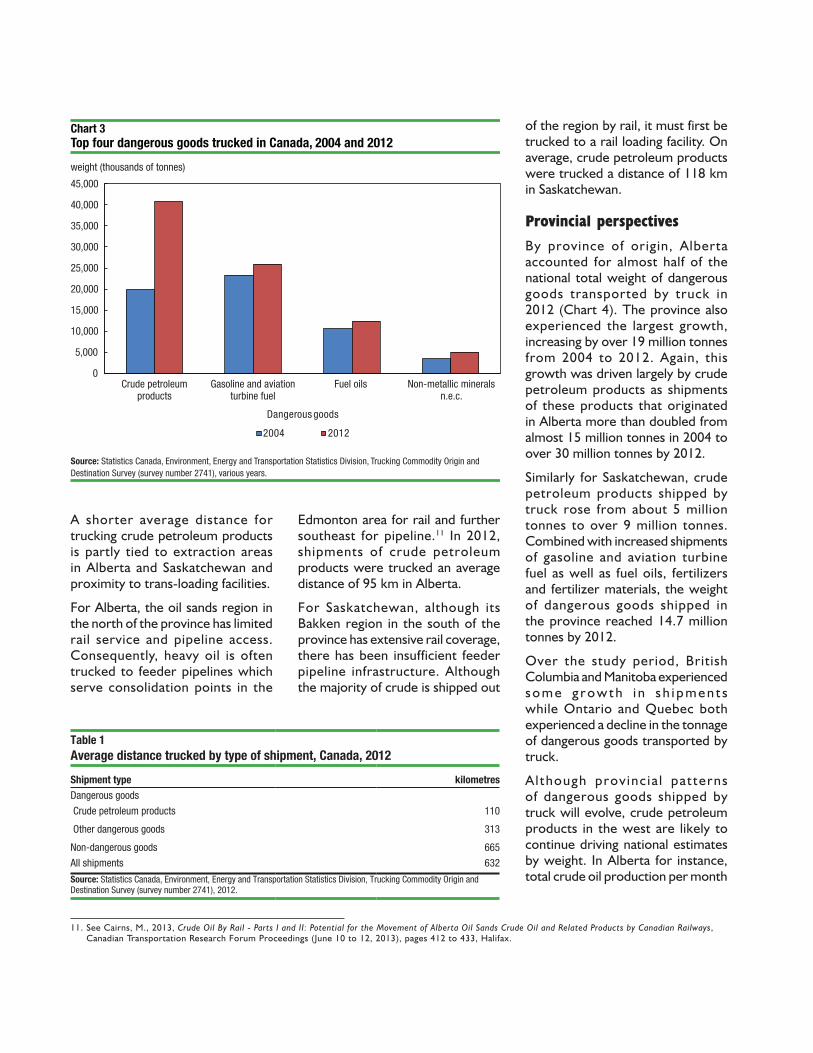
The top four dangerous goods
Although the top four dangerous goods trucked by weight remained the same over the study period they accounted for almost 80 of the total by 2012 up from 71 in 2004 (Chart 3) The increase was driven largely by the trucking of crude
petroleum products which more than doubled to reach over 40 million tonnes by 2012 accounting for more than one-third (38) of the total
Over the same period shipments of gasoline and aviation turbine fuel rose 11 to 26 million tonnes while fuel oils increased 16 to 124 million tonnes and non-metallic minerals (such as sulphur) rose 43 to 52 million tonnes Fertilizers and fertilizer materials (including nitric acid sulphonitric acids and ammonia) the fifth largest category of dangerous goods trucked in 2012 at 26 million tonnes increased by approximately 180 over the study period
Average distance An interesting factor is the distance that dangerous goods travel to reach their destination From 2004 to 2012 the average distance of all shipments trucked in Canada was estimated to have increased from 608 to 632 kilometres However shipments of dangerous goods declined from an average of 316 to 269 kilometres This decline reflects an increase in energy-related shipments particularly crude petroleum products since on average shipments of these products travelled about one-third (35) of the distance than did other dangerous goods (Table 1)
7 The rail proportion is estimated from the Monthly Railway Carloadings Survey based on the UN dangerous good designation identified by Standard Transportation Commodity Codes for revenue-generated freight moved by the two mainline freight railways only
8 US Department of Transportation Bureau of Transportation Statistics and US Department of Commerce US Census Bureau 2015 Hazardous Materials 2012 Commodity Flow Survey (Draft January) Washington
9 In the United States the average distance per hazardous material shipment by for-hire truck was 150 miles versus 808 by rail (2012 US Commodity Flow Survey)
10 Provencher M 2010 The Movement and Handling of Dangerous Goods in Canada for the Year 2008 Transport Canada Transport Dangerous Goods Directorate Ottawa
Statistics Canada mdash February 2015 EnviroStats 3
Chart 3 Top four dangerous goods trucked in Canada 2004 and 2012
weight (thousands of tonnes)
45000
40000
35000
30000
25000
20000
15000
10000
5000
0 Crude petroleum Gasoline and aviation Fuel oils Non-metallic minerals
products turbine fuel nec
Dangerous goods
2004 2012
Source Statistics Canada Environment Energy and Transportation Statistics Division Trucking Commodity Origin and Destination Survey (survey number 2741) various years
A shorter average distance for trucking crude petroleum products is partly tied to extraction areas in Alberta and Saskatchewan and proximity to trans-loading facilities
For Alberta the oil sands region in the north of the province has limited rail service and pipeline access Consequently heavy oil is often trucked to feeder pipelines which serve consolidation points in the
Edmonton area for rail and further southeast for pipeline11 In 2012 shipments of crude petroleum products were trucked an average distance of 95 km in Alberta
For Saskatchewan although its Bakken region in the south of the province has extensive rail coverage there has been insufficient feeder pipeline infrastructure Although the majority of crude is shipped out
Table 1 Average distance trucked by type of shipment Canada 2012
Shipment type kilometres Dangerous goods
Crude petroleum products 110
Other dangerous goods 313
Non-dangerous goods 665
All shipments 632
Source Statistics Canada Environment Energy and Transportation Statistics Division Trucking Commodity Origin and Destination Survey (survey number 2741) 2012
of the region by rail it must first be trucked to a rail loading facility On average crude petroleum products were trucked a distance of 118 km in Saskatchewan
Provincial perspectives By province of origin Alberta accounted for almost half of the national total weight of dangerous goods transported by truck in 2012 (Chart 4) The province also experienced the largest growth increasing by over 19 million tonnes from 2004 to 2012 Again this growth was driven largely by crude petroleum products as shipments of these products that originated in Alberta more than doubled from almost 15 million tonnes in 2004 to over 30 million tonnes by 2012
Similarly for Saskatchewan crude petroleum products shipped by truck rose from about 5 million tonnes to over 9 million tonnes Combined with increased shipments of gasoline and aviation turbine fuel as well as fuel oils fertilizers and fertilizer materials the weight of dangerous goods shipped in the province reached 147 million tonnes by 2012
Over the study period British Columbia and Manitoba experienced s o m e g r o w t h i n s h i p m e n t s while Ontario and Quebec both experienced a decline in the tonnage of dangerous goods transported by truck
A l though prov inc ia l patterns of dangerous goods shipped by truck will evolve crude petroleum products in the west are likely to continue driving national estimates by weight In Alberta for instance total crude oil production per month
11 See Cairns M 2013 Crude Oil By Rail - Parts I and II Potential for the Movement of Alberta Oil Sands Crude Oil and Related Products by Canadian Railways Canadian Transportation Research Forum Proceedings (June 10 to 12 2013) pages 412 to 433 Halifax
4 EnviroStats February 2015 mdash Statistics Canada
0
Chart 4 Dangerous goods trucked by province of origin 2004 and 2012
weight (thousands of tonnes)
60000
50000
40000
30000
20000
10000
NL PEI NS NB Que Ont Man Sask Alta BC
Province of origin
2004 2012
Source Statistics Canada Environment Energy and Transportation Statistics Division Trucking Commodity Origin and Destination Survey (survey number 2741) various years
has risen from an average of 93 million cubic metres in 2010 to 125 million cubic metres during the first half of 201412 largely from synthetic crude oil and crude bitumen extraction And truck-to-rail delivery is now considered as a medium term alternative to access those areas not served directly by pipelines13
12 Statistics Canada CANSIM table 126-0001 (accessed October 5 2014) 13 Ricciotti L 2013 ldquoRailcars and trucks make a comeback as methods for shipping oilrdquo Alberta Oil Magazine wwwalbertaoilmagazinecom201302railcars-
trucks-make-oil-comeback (accessed September 28 2014)
Statistics Canada mdash February 2015 EnviroStats 5
19992000 INTERPROVINCIAL
ROADSIDE TRUCK SURVEY REPORT
ENQUEcircTE ROUTIEgraveRE INTERPROVINCIALE SUR LE CAMIONNAGE 19992000 RAPPORT
McLean Transportation Engineering Consultants Ltd
TRANS MEMBER AGENCIES
National Capital Commission Mr Arto Keklikian Capital Planning and Real Asset Management
Ministegravere des Transports Queacutebec Monsieur Ghislain Couture Direction reacutegionale de lrsquoOutaouais
Ministry of Transportation Ontario Mr James Wong Transportation Planning Branch
Ville de Gatineau Monsieur Paul-Andreacute Roy Service Urbanisme
City of Ottawa Mr Don Stephens PEng ( Manager TRANS Programme ) Planning Environment and Infrastructure Policy Mr Rob Calladine Planning Environment and Infrastructure Policy
Socieacuteteacute de transport de lOutaouais Monsieur Salah Barj Service Strateacutegies et Deacuteveloppement Monsieur Carmel Dufour Service Strateacutegies et Deacuteveloppement
OCTranspo Mr Colin Leech Service Planning Department
19992000 INTERPROVINCIALROADSIDE TRUCK SURVEY
REPORT
ENQUEcircTE ROUTIEgraveRE INTERPROVINCIALE SUR LE CAMIONNAGE 19992000
RAPPORT
Prepared for Preacutepareacute pour
TRANS A Joint Technical Committee on Transportation Systems Planning
Un Comiteacute technique conjoint sur la planification des systegravemes de transport
By Par McLean Transportation Engineering Consultants Ltd
June juin 2002
ACKNOWLEDGEMENTS TRANS would like to acknowledge the funding support received from the following member Agencies
x National Capital Commission x Ministegravere des Transports du Queacutebec x Ministry of Transportation Ontario x Ville de Gatineau (formerly
Communauteacute Urbain de lrsquoOutaouais) x City of Ottawa (formerly Regional
Municipality of Ottawa-Carleton)
The roadside surveys while funded by TRANS Agencies were carried out in 1999 and 2000 by EarthTech Canada Inc under contract to the Province of Ontario (Ministry of Transportation) for the administration of all the roadside surveys across the province as part of the National Roadside Truck Survey Special thanks to Mr Rob Tardif Coordinator Commercial Vehicle Survey for the Ministry of Transportation of Ontario (MTO) who oversaw the survey work on behalf of TRANS Agencies and to Mr David Smith Manager Data Management and Analysis Office (MTO) for ongoing project support
The ldquo19992000 INTERPROVINCIAL ROADSIDE TRUCK SURVEYrdquo report was prepared by McLean Transportation Engineering Consultants Ltd The consultant acknowledges the invaluable assistance of Mr Petar Grubor of the City of Ottawa in the preparation of tabulations Mr Don Stephens Manager TRANS Programme and the Steering Committee Members in the provision of advice during the preparation of this report
REMERCIEMENTS TRANS souhaite remercier les organismes membres pour leur soutien financier
x La Commission de la Capitale nationale x Le ministegravere des Transports du Queacutebec x Le ministegravere des Transports de
lrsquoOntario x La Ville de Gatineau (autrefois la
Communauteacute urbaine de LrsquoOutaouais) x La Ville drsquoOttawa (autrefois la
Municipaliteacute reacutegionale drsquoOttawa-Carleton)
Lrsquoenquecircte routiegravere bien que financeacutee par les membres du groupe TRANS fucirct exeacutecuteacutee par Earthtech Canada Inc en 1999 et 2000 pour le compte de la province drsquoOntario (ministegravere des Transports) pour effectuer toutes les enquecirctes routiegraveres de la province en tant que participant dans lrsquoenquecircte nationale sur le camionnage Au nom des membres du groupe TRANS nous tenons agrave remercier monsieur Robert Tardif coordonnateur au Service des enquecirctes sur les veacutehicules commerciaux pour le ministegravere des Transports de lrsquoOntario (MTO) pour son travail de supervision dans cette enquecircte Nous tenons agrave remercier eacutegalement monsieur David Smith gestionnaire au Bureau de la gestion des donneacutees et des analyses (MTO) pour son soutien dans ce projet
McLean Transportation Engineering Consultants Ltd qui a prepare le rapport ldquoENQUEcircTE ROUTIEgraveRE INTERPROVINCIALE SUR LE CAMIONNAGE 19992000rdquo remercie monsieur Petar Grubor de la Ville drsquoOttawa pour son aide preacutecieuse dans la preacuteparation des tables monsieur Don Stephens gestionnaire du groupe TRANS ainsi que les membres du comiteacute technique pour leurs conseils lors de la preacuteparation de ce rapport
Interprovincial Roadside Truck Survey Enquecircte routiegravere interprovinciale sur le camionnage Executive Summary Sommaire
EXECUTIVE SUMMARY
Background
In the autumns of 1999 (October) and 2000 (September) surveys co-ordinated by TRANS were undertaken to establish a comprehensive database on interprovincial truck travel characteristics in the National Capital Region Surveys were carried out only on the Chaudiegravere and Macdonald-Cartier bridges as the movement of ldquoheavy trucksrdquo is prohibited on the remaining three bridges - the Alexandra Portage and Champlain bridges The roadside surveys were part of a broader national roadside survey program led by Transport Canada with participation of the provinces
The purpose of this study was the development of a good understanding of the interprovincial movement patterns origins destinations and characteristics of heavy trucks in the National Capital Region and the satisfaction of the TRANS mandate to furnish high quality and meaningful transportation data required for transportation planning and decision making in the National Capital Region In this context the study was undertaken to establish a comprehensive database of information regarding the characteristics of trucks crossing the Ottawa River and thus provide a basis for future studies and analysis In meeting this objective this study does not directly address specific transportation issues but rather provides TRANS Agencies with a database for this purpose Detailed analysis of the comprehensive data base would be necessary to assess the impact of new
SOMMAIRE
Contexte
En octobre 1999 et en septembre 2000 une enquecircte coordonneacutee par le groupe TRANS a eacuteteacute reacutealiseacutee dans le but de constituer une base de donneacutees complegravete au sujet du transport interprovincial de marchandises par camions qui traversent la riviegravere des Outaouais Lrsquoenquecircte routiegravere a eacuteteacute effectueacutee seulement sur les ponts Chaudiegravere et Macdonald-Cartier puisqursquoil est interdit aux poids lourds de circuler sur les trois autres ponts (Alexandra Portage et Champlain) Cette enquecircte srsquoinscrivait dans un programme drsquoeacutetude national dirigeacute par Transports Canada en collaboration avec les provinces
Cette eacutetude visait agrave brosser un tableau de la situation en ce qui a trait aux itineacuteraires aux points de deacutepart aux destinations et aux caracteacuteristiques des camions poids lourds dans la reacutegion de la capitale nationale Elle permettait aussi agrave TRANS de reacuteunir des donneacutees pertinentes et de qualiteacute pouvant faciliter la planification et la prise de deacutecisions concernant le transport dans la reacutegion de la capitale nationale conformeacutement au mandat qui lui avait eacuteteacute confieacute Dans ce contexte lrsquoenquecircte avait pour but de constituer une base de donneacutees exhaustive au sujet des camions qui franchissent la riviegravere des Outaouais et drsquoeacutetablir ainsi un point de deacutepart pour des eacutetudes et des analyses ulteacuterieures Compte tenu de cet objectif le rapport ne traite directement drsquoaucun enjeu preacutecis en matiegravere de transport mais fournit aux organisms de TRANS les donneacutees
i
Interprovincial Roadside Truck Survey Enquecircte routiegravere interprovinciale sur le camionnage Executive Summary Sommaire
or improved infrastructure on interprovincial truck traffic and would be a prerequisite for reaching any meaningful conclusions regarding future interprovincial transport needs
The database which is available for future studies provides significant information regarding the movement of heavy trucks across the Ottawa River historical heavy truck trends their composition in the traffic stream and their associated travel patterns
Roadside driver interview surveys gathered specific data on the characteristics of the trucks the travel patterns including detailed information on the trip origins and destinations and the commoditygoods carried The surveys revealed that approximately 3450 trucks cross the Ottawa River on a daily basis Trip characteristics were obtained from a sample of 143 of the vehicles and this sample was considered to be of sufficient magnitude and strength to allow expansion of the data by bridge and by certain time periods
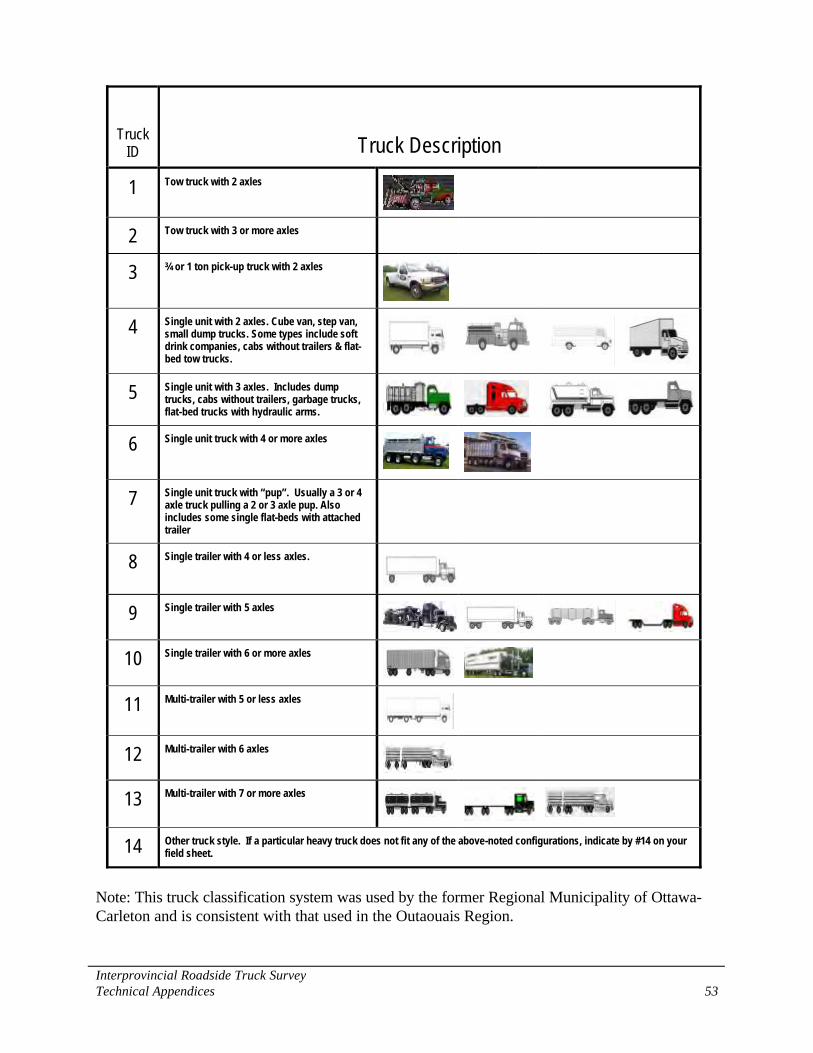
Truck Classification
The classification system applied three key categories of trucks (heavy trucks) as follows
x 2 axle trucks - which represent trucks with six wheels such as tow trucks large (34 ton 1 ton) pick-up trucks small vans small dump trucks etc defined as heavy trucks
neacutecessaires permettant de se pencher sur la question Il faudrait proceacuteder agrave une analyse deacutetailleacutee de la base de donneacutees exhaustive afin drsquoeacutevaluer les effets de la construction ou de la modernisation drsquoinfrastructures sur le transport interprovincial par camion analyse qui devrait ecirctre effectueacutee avant de pouvoir tirer de conclusions significatives sur les besoins futurs du transport interprovincial
La base de donneacutees qui pourra servir pour de futures eacutetudes contient des renseignements importants sur la circulation des poids lourds qui traversent la riviegravere des Outaouais sur lrsquoeacutevolution de la situation au fil des ans sur la place des poids lourds dans le flot de circulation et sur leurs itineacuteraires
Les camionneurs interrogeacutes ont fourni des donneacutees preacutecises sur les caracteacuteristiques de leurs veacutehicules et sur leurs itineacuteraires y compris leurs points de deacutepart et leurs destinations et la nature de leurs cargaisons Lrsquoenquecircte a reacuteveacuteleacute qursquoenviron 3 450 camions franchissent chaque jour la riviegravere des Outaouais Les caracteristiques des deacuteplacements ont eacuteteacute obtenues agrave partir drsquoun eacutechantillon de 143 des camions Ceci constitue un eacutechantillon de taille et drsquoimportance suffisantes pour effectuer une expansion des reacutesultats par pont et par peacuteriode de la journeacutee
Cateacutegories de camions
Le systegraveme de classement preacutevoyait trois cateacutegories de poids lourds
ii
x 3+ axle trucks - which represent medium size trucks such as large dump trucks straight trucks concrete mix trucks etc which are also defined as heavy trucks
x tractor trailer trucks - which represent the largest trucks such as tractor-trailer trucks flat-bed trucks etc
Of the total of approximately 3450 trucks observed over a 24 hour period as crossing the Ottawa River there were 1550 2 axle (45) 880 3+ axle (25) and 1020 tractor trailer (30) trucks
x camions agrave deux essieux ndash comprenant notamment les camions agrave six roues comme les deacutepanneuses les grosses camionnettes de trois quarts de tonne agrave une tonne les petits camions et les petits camions agrave benne consideacutereacutes comme des poids lourds
x camions agrave trois essieux et plus ndash comprenant notamment les camions de taille moyenne comme les gros camions agrave benne les camions porteurs et les camions malaxeurs consideacutereacutes aussi comme des poids lourds
45
Tractor Trailer Camion gros porteur
30
3+ Axle Truck Camion agrave 3 essieux et plus
252 Axle Truck Camion agrave 2 essieux
STUDY TRUCK CLASSIFICATION b CATEacuteGORIES DE CAMIONSb
x camions gros porteurs ndash comprenant notamment les camions les plus gros comme les semi shyremorques et les camions agrave plateshyforme
Interprovincial Roadside Truck Survey Enquecircte routiegravere interprovinciale sur le camionnage Executive Summary Sommaire iii
Truck Volumes
Daily heavy truck volumes crossing the Ottawa River were in 2000 approximately 3450 which is 5 higher than the recorded ten year average (3285) For comparative purposes overall traffic levels crossing the Ottawa River on all five bridges are about 200000 vehicles per day (traffic counts undertaken in 2000 indicate an average one way volume of approximately 94000 vehicles)
Truck movements are more predominant during the mid-day hours than in the commuter peak hours The mid-day peaking phenomenon may be attributed to the need to meet the expectations of the business day and quite possibly trucker attempt to avoid the commuter peak periods The tractor trailer trucks (which represented about 30 of all interprovincial truck trips) reported longer trip lengths and consequently were as a category responsible for approximately 50 of the total trip distance travelled by all trucks In contrast the 3+ axle trucks (representing 25 of the truck trips) were responsible for 20 of the distance travelled by all trucks while the 2 axle trucks (45 of interprovincial truck trips) were associated with 30 of the distance travelled by trucks
Most truck traffic across the Ottawa River occurs between 0600 and 2100 Approximately 95 of the 3+ axle trucks 93 of the 2 axle trucks and 80 of the tractor trailer crossings of the Ottawa River have occurred by 2100 This suggests that the tractor trailer vehicles tend to be more spread out across the 24 hour period than the other two categories of trucks
Les quelques 3 450 camions qui franchissent quotidiennement la riviegravere des Outaouais se reacutepartissent comme suit 1 550 camions agrave deux essieux (45) 880 camions agrave trois essieux ou plus (25) et 1 020 gros porteurs (30)
Volumes des camions
En 2000 environ 3 450 camions poids lourds franchissaient la riviegravere des Outaouais chaque jour ce qui constituait une leacutegegravere augmentation de 5 par rapport agrave la moyenneenregistreacutee il y a dix ans (3 285) Agrave des fins de comparaison au total pregraves de 200 000 veacutehicules empruntent chaque jour les cinq ponts qui enjambent la riviegravere des Outaouais (les releveacutes effectueacutes en 2000 indiquent quelque 94 000 veacutehicules en moyenne dans une direction)
La circulation des camions est plus dense au milieu de la journeacutee que pendant les heures de pointe Lrsquoheure de pointe qui se forme ainsi en milieu de journeacutee peut ecirctre attribueacutee au besoin de se conformer aux heures drsquoouverture des commerces et peut-ecirctre aussi aux efforts des camionneurs pour eacuteviter les heures drsquoarriveacutee et de deacutepart des navetteurs Ce sont les gros porteurs (environ 30 des deacuteplacements interprovinciaux de camions) qui effectuent les trajets plus longs parcourant agrave eux seuls pregraves de 50 des distances couvertes par des camions toutes cateacutegories confondues Les camions agrave trois essieux ou plus (25 des deacuteplacements interprovinciaux de camions) en parcourent 20 et les camions agrave deux essieux (45 des deacuteplacements interprovinciaux de camions) en parcourent 30
Interprovincial Roadside Truck Survey Enquecircte routiegravere interprovinciale sur le camionnage Executive Summary Sommaire iv
Macdonald Cartier Bridge2580 Trucks
Tractor Trailers17
( 150 )
Chaudiegravere Bridge870 Trucks
2 Axles60
( 520 )
Tractor Trailers34
( 870 )
2 Axles40
( 1030 )
3+ Axles23
( 200 )
3+ Axles26
( 680 )
DAILY TRUCK VOLUMESbBY CLASSIFICATIONb
Pont Macdonald-Cartier Bridge
2580 Trucks Camions Pont Chaudiegravere Bridge870 Trucks Camions
DAILY TRUCK VOLUMES BY CLASSIFICATIONbACHALANDAGE QUOTIDIEN PAR CATEacuteGORIE DE CAMIONSb
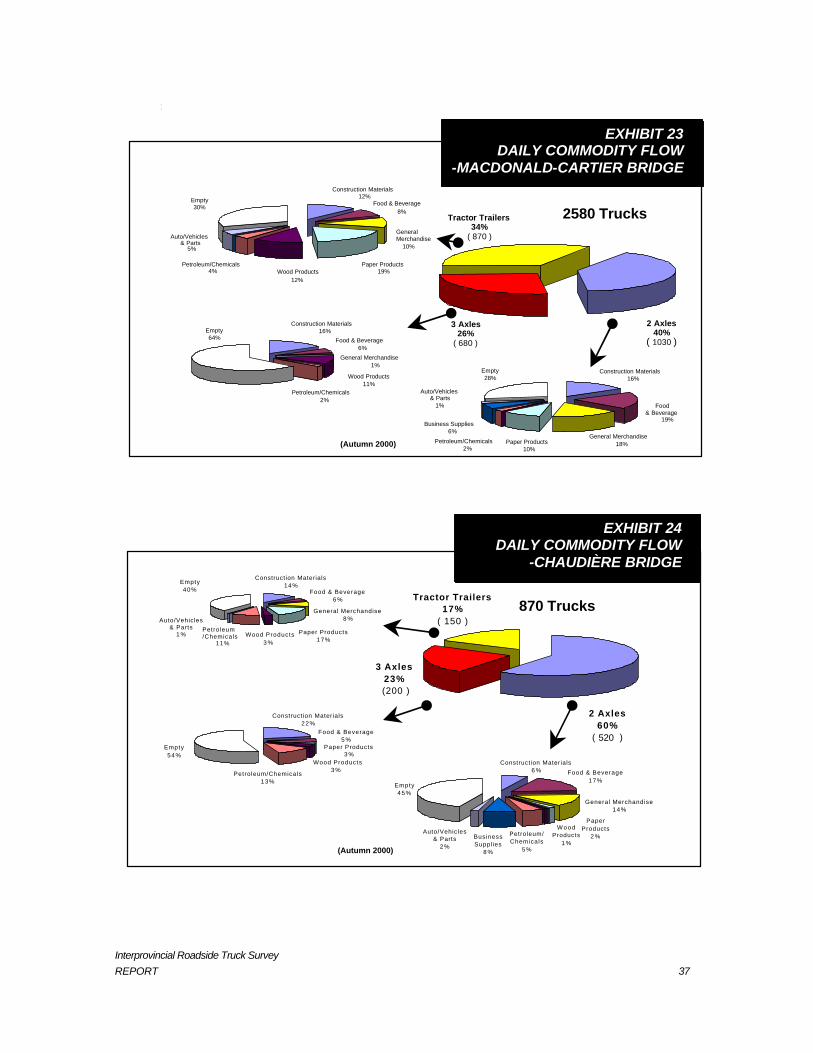
The Macdonald-Cartier bridge carried a total of 2580 trucks per day with by far the largest number of the tractor-trailers (870) When compared with the other two classes of trucks the tractor trailers represented about 34 of the total trucks on that bridge On the Chaudiegravere bridge which carried approximately 870 trucks per day in total the 2 axle truck is the largest vehicle class of truck (520) and dominates the composition (60) of the truck stream
shy
3+ AxlesCamions agrave 3 essieux et plus
26 ( 680 )
2 Axles Camions agrave 2 essieux
40 ( 1030 )
Tractor TrailersCamions gros porteurs
34 ( 870 )
Tractor Trailers Camions gros porteurs
17 ( 150 )
2 Axles Camions agrave 2 essieux
60 ( 520 )
3+ Axles Camions agrave 3 essieux et plus
23 ( 200 )
DAILY TRUCK VOLUMES BY CLASSIFICATIONb ACHALANDAGE QUOTIDIEN PAR CATEacuteGORIE DE CAMIONSb
Pont Macdonald-Cartier Bridge 2580 Trucks Camions
Pont Chaudiegravere Bridge 870 Trucks Camions
La plupart des camions franchissent les ponts de la riviegravere des Outaouais entre 06h00 et 21h00 Environ 95 des camions agrave trois essieux ou plus 93 de ceux agrave deux essieux et 80 des gros porteur les franchissent avant 21h00
Ces statistiques portent agrave croire que les deacuteplacements des gros porteurs srsquoeacutechelonnent davantage sur une peacuteriode de vingt-quatre heures que les deux autres cateacutegories de camions
Chaque jour 2 580 camions passent sur le pont Macdonald-Cartier dont 870 gros porteurs ce qui repreacutesente de loin le plus grand nombre de camions Comparativement aux deux autres cateacutegories de camions les gros porteurs constituent environ 34 de la circulation de camions sur ce pont Sur le pont Chaudiegravere ougrave circulent environ 870 camions par jour ce sont les camions agrave deux essieux (520) qui sont les plus nombreux et qui repreacutesentent la
Interprovincial Roadside Truck Survey Enquecircte routiegravere interprovinciale sur le camionnage Executive Summary Sommaire v
Interprovincial Roadside Truck Survey Enquecircte routiegravere interprovinciale sur le camionnage Executive Summary Sommaire vi
-
Travel Patterns
Local trips between the two cities on each side of the Ottawa River are understandably the largest component of travel about two-thirds (2300 trips) of all truck trips
A review of the remaining trips revealed that 975 (28) of the trucks made intershyregional trips (either an origin or a destination outside the National Capital area) while 175 (5) of the trucks made a through trip (neither an origin nor a destination within the National Capital area)
The key characteristics of the trip patterns are
x the dominance of the Hull district part of the new City of Gatineau as an attractorgenerator of truck trips (1360) more than fifty percent of these truck classes are the smaller 2 axle category
x the distribution of generated and attracted trips tofrom the nine remaining districts varies from 400 to 930 truck trips
x the variability of the truck classifications from ldquodistrict to districtrdquo is evident although the two eastern districts one on each side of the Ottawa River which also include origins and destinations outside the National Capital area (eg Montreal) have a large proportion of tractor trailer trucks
The daily distribution of trips (ldquoall trucksrdquo) clearly indicates the strength of the Hull district as compared with each of the other three districts (Aylmer Gatineau West and Gatineau East) on the Queacutebec side of the Ottawa River
plus grande partie (60) de la circulation de camions sur ce pont
Itineacuteraires
Naturellement les deux tiers (2 300) des deacuteplacements des camions srsquoeffectuent entre les deux villes qui se trouvent de chaque cocircteacute de la riviegravere
Lrsquoexamen des autres itineacuteraires permet de constater que 975 camions (28) effectuent des deacuteplacements interreacutegionaux (crsquoest-agrave-dire dont le point de deacutepart ou la destination se trouve agrave lrsquoexteacuterieur de la reacutegion de la capitale nationale-RCN) et que 175 camions (5) ne font que traverser la reacutegion (crsquoest-agrave-dire que ni leur point de deacutepart ni leur destination ne se trouvent dans la RCN) Principales caracteacuteristiques des itineacuteraires
x Crsquoest dans le district de Hull dans la nouvelle ville de Gatineau qursquoon compte le plus grand nombre de points de deacutepart et drsquoarriveacutee (1 360) il srsquoagit dans plus de cinquante pour cent des cas de petits camions agrave deux essieux
x Dans les neuf autres districts le nombre de points de deacutepart et drsquoarriveacutee varie entre 400 et 930
x La dispariteacute des cateacutegories de camions drsquoun district agrave lrsquoautre est eacutevidente toutefois les deux districts ldquoEstrdquo situeacutes de part et drsquoautre de la riviegravere des Outaouais qui comprennent eacutegalement des points de deacutepart et drsquoarriveacutee agrave lrsquoexteacuterieur de la reacutegion de la capitale nationale (ex Montreacuteal) accueillent un pourcentage eacuteleveacute de gros porteurs
1 Ottawa CentralCentre
5 IGB East ICV Est
2 IGB West ICV Ouest
3 Ottawa WestOuest
4 Ottawa SouthSud
6 Ottawa EastEst
7 Hull
8 Aylmer
9 Gatineau WestOuest
10 Gatineau EastEst
Queacutebec
Ontario
xxx
2 Axles Camions agrave deux essieux
3+ Axles Camions agrave trois essieux et plus
Tractor Trailers Camions gros porteurs
Total number of trucks (O+D) for the District Nombre total de camions (points de deacutepart et destinations) pour le district
IGB ndash Inside Green Belt ICV ndash Inteacuterieur de la Ceinture de Verdure
DAILY DISTRIBUTION OF ORIGINS-DESTINATIONS BY CLASSIFICATIONb REacutePARTITION QUOTIDIENNE DES POINTS DE DEacutePART ET DESb
DESTINATIONS PAR CATEacuteGORIE DE CAMIONSb
Commodities
The five most frequently reported commodities carried by trucks crossing the Ottawa River are
bull construction materials (475 trips) bull food and beverage (415 trips) bull general merchandise (360 trips) bull paper and paper products (310 trips) bull wood and wood products (195 trips)
La reacutepartition des itineacuteraires quotidien toutes cateacutegories de camions confondues montre clairement lrsquoimportance du district de Hull par rapport aux trois autres districts (Aylmer Gatineau-Ouest et Gatineau-Est) du cocircteacute queacutebeacutecois de la riviegravere des Outaouais
Cargaison
Voici les cinq types de marchandises transporteacutees le plus souvent par les camions qui franchissent la riviegravere des Outaouais
bull mateacuteriaux de construction (475 deacuteplacements)
bull aliments et boissons (415 deacuteplacements)
Interprovincial Roadside Truck Survey Enquecircte routiegravere interprovinciale sur le camionnage
Executive Summary Sommaire vii
Interprovincial Roadside Truck Survey Enquecircte routiegravere interprovinciale sur le camionnage Executive Summary Sommaire viii
While ldquoconstruction materialsrdquo tops the list of goods carried paper and wood products if taken together as a single group would become the prominent group of commodities
The movement of various commodities across the Ottawa River was identified from the survey results and some key characteristics are
x for construction materials while widely distributed an Aylmer to Ottawa Central trip pattern represented approximately 50 percent of the originsdestinations for that pairing
x for general merchandise a widely dispersed trip pattern was expected and no single prominent origins destinations pairing emerged
x for paperpaper products the dominant interchange of trips exists between Hull and Ottawa (both East and West) and between Gatineau East and Ottawa South
x for woodwood products Aylmer and Gatineau West trips to Ottawa South stand out to the exclusion of other pairings as the primary movements for these commodities
Most frequently reported commodities in the ldquoPetroleumChemicalsrdquo category were gasoline and furnace fuel Other notable petroleum chemicals commodities included propane oxygen and other gases
Detailed information regarding the flow of commodities on each of the two bridges was collected as part of truck roadside survey On the Macdonald-Cartier bridge for example the various commodities for each of 3 truck types indicate that the 1030 2 axle trucks on
x fournitures geacuteneacuterales (360 deacuteplacements)
x papier et produits de papier (310 deacuteplacements)
x bois et produits du bois (195 deacuteplacements)
Bien que les mateacuteriaux de construction dominent cette liste le papier et le bois formeraient la cateacutegorie la plus importante srsquoils eacutetaient consideacutereacutes comme un seul groupe
Lrsquoeacutetude a permis de deacuteterminer lrsquoitineacuteraire de diverses marchandises qui franchissent la riviegravere des Outaouais Voici quelques-unes des caracteacuteristiques principales
x mateacuteriaux de construction bien que les itineacuteraires soient reacutepartis sur lrsquoensemble de la RCN les deacuteplacements entre Aylmer et Ottawa-Centre repreacutesentent agrave eux seuls environ la moitieacute des trajets
x fournitures geacuteneacuterales les points de deacutepartdestinations sont tregraves disperseacutees et aucun point de deacutepart ou drsquoarriveacutee ne se distingue de faccedilon particuliegravere
x papier et produits de papier la plupart des deacuteplacements srsquoeffectuent entre Hull et Ottawa (tant Est que Ouest) et entre Gatineau-Est et Ottawa-Sud
x bois et produits du bois les deacuteplacements srsquoeffectuent pour la plupart drsquoAylmer et de Gatineau-Ouest agrave destination drsquoOttawa-Sud agrave lrsquoexclusion des autres districts
Les cargaisons le plus souvent releveacutees dans la cateacutegorie ldquoproduits chimiquesdeacuteriveacutes du peacutetrolerdquo eacutetaient lrsquoessence ou combustible de chauffage Les autres produits chimiques ou
EXHIBIT 23b COMMODITY FLOWb
- MACDONALD-CARTIER BRIDGEb
Construction Mater als16
Foodamp Beverage
19
General Merchandise18
Empty28
Paper Products10
Business Supplies6
AutoVehic esamp Parts
1
Petro eumChemicals2
2 Axles40
( 1025 )
3 Axles26
( 680 )
Tractor Trailers34
( 870 )
Genera Merchandise
Food amp Beverage6
Empty64
Construction Mater als16
1
PetroleumChemicals2
Wood Products11
Food amp Beverage
12
Construction Mater als12
Paper Products19
Empty30
8
GeneraMerchandise
10AutoVehicles
amp Parts5
Wood ProductsPetroleumChemicals
4
2580 Trucks
( 1030 )
COMMODITY FLOW-MACDONALD-CARTIER BRIDGE TRANSPORT DE MARCHANDISES SUR LE PONT
MACDONALD-CARTIER
i
l
l
l
i
i
l
bbb
2 580 Trucks Camions
DAILY COMMODITY FLOW-MACDONALD-CARTIER BRIDGE b TRANSPORT QUOTIDIEN DE MARCHANDISES SUR LE PONTb
MACDONALD-CARTIERb
Tractor Trailers Gros porteurs
34 ( 870 )
3 AxlesCamions agrave 3 essieux et plus
26 ( 680 )
2 AxlesCamions agrave 2 essieux
40 ( 1030 )
Emptyvide 30
Emptyvide 64
Emptyvide 28
Construction materials Mateacuteriaux de construction
12
Construction materials Mateacuteriaux de construction
16
Construction materials Mateacuteriaux de construction
16
Food amp Beverage Aliments et boissons
8
Food amp Beverage Aliments et boissons
6
Food amp Beverage Aliments et boissons
19
General Merchandise Marchandises geacuteneacuterales
10
General Merchandise Marchandises geacuteneacuterales
1
General Merchandise Marchandises geacuteneacuterales
18
Paper products Produits de papier
19
Paper products Produits de papier
10
W ood Products Produits du bois
12
Wood Products Produits du bois
11
Petroleum amp Chemicals Produits chimiques et
deacuteriveacutes du peacutetrole 4
Petroleum amp Chemicals Produits chimiques et
deacuteriveacutes du peacutetrole 2
Petroleum amp ChemicalsProduits chimiques et deacuteriveacutes du peacutetrole
2
Business Supplies Fournitures de bureau
6
Auto Vehicles amp Parts Veacutehicules automobiles et piegraveces
1
Auto Vehicles amp Parts Veacutehicules automobiles
et piegraveces 5
que 1 030 camions agrave 2 essieux transportent sur ce pont essentiellement lrsquoaliment et la boisson (19) fournitures geacuteneacuterales (18) et les mateacuteriaux de construction (16) Les camions agrave 3 essieux et plus (680) transportent essentiellement les mateacuteriaux de construction (16) et des produits de bois (11) Les camions gros porteurs (870) transportent principalement des produits de papier (19) produits de bois (12) et des mateacuteriaux de construction (12)
this bridge carry mainly food and beverage (19) general merchandise (18) and construction materials (16) The 680 trucks in the 3+ axle classification carry mainly construction materials (16) and wood products (11) while tractor trailers (870) carry predominantly paper products (19) wood products (12) and construction materials (12)
deacuteriveacutes du peacutetrole les plus souvent preacutesents dans les cargaisons eacutetaient le gaz propane lrsquooxygegravene et drsquoautres gaz
Les informations detailleacutees concernant le flot des cargaisons sur chacun des deux ponts eacutetaient recueillis durant lrsquoenquecircte routiegravere Sur le pont Macdonald-Cartier par exemple les diffeacuterentes cargaisons pour chacune des trois sortes de camions indiquent
Interprovincial Roadside Truck Survey Enquecircte routiegravere interprovinciale sur le camionnage Executive Summary Sommaire ix
TABLE OF CONTENTS
EXECUTIVE SUMMARY i SOMMAIRE i 10 BACKGROUND 1 20 STUDY METHODOLOGY 2 30 1989 TRUCK SURVEY 2 40 19992000 SURVEY PROGRAM AND METHODOLOGY 3
41 Historical Vehicle Data 3 42 Driver Interviews 4 43 Vehicular Traffic Classification Count Observations 5 44 Automatic Traffic Recorder (ATR) Counts 7
50 KEY RELATIONSHIPS 8 51 Historical traffic volumes 8 52 Truck Classification and Characteristics 12 53 Automatic Traffic Recorder (ATR) Counts 15
60 ZONEDISTRICT SYSTEM 16 70 DATA EXPANSION 17
71 Expansion Methodology 17 72 Expansion Factors 18
80 TRIP CHARACTERISTICS AND PATTERNS 21 81 Vehicle Types 21 82 Trip Tables 23 83 Travel Patterns 23 84 Origin-Destination Patterns 26 85 Vehicle Loading and Commodities 34
90 SUMMARY 38 100 LIST OF APPENDICES 39
x
LIST OF EXHIBITS
Exhibit 1 Illustration of Survey Station 4
Exhibit 2 Study Truck Classification 7
Exhibit 3 Historical All Vehicle Volumes 8
Exhibit 4 Historical Truck Volumes 10
Exhibit 5 Daily Truck Volumes by Classification 13
Exhibit 6 Hourly Truck Volumes Macdonald-Cartier Bridge 14
Exhibit 7 Hourly Truck Volumes Chaudiegravere Bridge 14
Exhibit 8 Hourly Vehicle Traffic Volumes 15
Exhibit 9 District System 16
Exhibit 10 Sample Size by Time of Day 20
Exhibit 11 Daily Truck Volumes by Classification 22
Exhibit 12 Cumulative Truck Traffic 22
Exhibit 13 Daily truck Composition Macdonald-Cartier Bridge 25
Exhibit 14 Daily Truck Composition Chaudiegravere Bridge 25
Exhibit 15 Trip Itineraries 26
Exhibit 16 Distribution of OriginsDestinations by Classification 27
Exhibit 17 Concentration of Truck Trip OriginsDestinations 28
Exhibit 18 Origin-Destination Desire Lines All Truck Trips (Autumn 2000) 30
Exhibit 19 Origin-Destination Desire Lines 2 Axle Truck Trips (Autumn 2000) 31
Exhibit 20 Origin-Destination Desire Lines 3+ Axle Truck Trips (Autumn 2000) 32
Exhibit 21 Origin-Destination Desire Lines Tractor Trailer Trips (Autumn 2000) 33
Exhibit 22 Goods Carried per Day 35
Exhibit 23 Daily Commodity Flow Macdonald-Cartier Bridge 37
Exhibit 24 Daily Commodity Flow Chaudiegravere Bridge 37
xi
LIST OF TABLES
Table 1 Current and Historical Two Way Truck Traffic Volumes 10
Table 2 Ratio of Peak Hour to 24 Hour Traffic Volumes 1999 to 2000 11
Table 3 Summary of 3+ Axle Trucks by Body Type and Cargo 19
Table 4 Expansion Factors by Bridge by Direction and by Time of Day 20
Table 5 Truck Travel Composition and Trip Distance 23
xii
10 BACKGROUND In the autumns of 1999 (October) and 2000 (September) several types of surveys co-ordinated by TRANS were undertaken to establish a comprehensive database on interprovincial truck travel characteristics in the National Capital Region Surveys were carried out on the Chaudiegravere and Macdonald-Cartier bridges as the movement of ldquoheavy trucksrdquo is prohibited on the remaining three bridges - the Alexandra Portage and Champlain bridges
The roadside surveys which were undertaken were part of a broader national roadside survey program led by Transport Canada with participation of the provinces
TRANS undertook an extensive amount of work in organizing and establishing the database for this project and prepared numerous data tabulations establishing relationships among the various components of the database Coding of the origins and destinations to the traffic zone system currently in use and applying preliminary expansion factors to some of the data were also undertaken by TRANS
The purpose of this study was the development of a good understanding of the interprovincial movement patterns origins destinations and characteristics of heavy trucks in the National Capital Region and the satisfaction of the TRANS mandate to furnish high quality and meaningful transportation data required for transportation planning and decision making in the National Capital Region In this context the study was undertaken to establish a comprehensive database of information regarding the characteristics of trucks crossing the Ottawa River and thus provide a basis for future studies and analysis In meeting this objective this study does not directly address specific transportation issues but rather provides TRANS Agencies with a database for this purpose The database which is available for future studies provides significant information regarding the movement of heavy trucks across the Ottawa River historical heavy truck trends their composition in the traffic stream and their associated travel patterns
In the establishment of the database of truck characteristics and patterns it was relevant to investigate various relationships and rationalize them as appropriate for practical application in transportation planning activities It was also necessary to identify and rationalize other relationships which are valuable in transportation planning activities These relationships are important in the background analytical work necessary to assess the impacts of a future Ottawa River crossing on the movement of goods between the two regions on each side of the Ottawa River
Interprovincial Roadside Truck Survey REPORT 1
Once all relationships were identified the appropriate data tabulations were prepared and evaluated When the findings were complete and valid this report which explains the process and the reliability of the findings was prepared The details of the work are described in this report
The consultant acknowledges the invaluable assistance of the TRANS Agencies staff in the establishment of the survey database as well as the ongoing assistance in preparing tabulations and the provision of advice in the preparation of this report
20 STUDY METHODOLOGY The methodologykey tasks that were involved in carrying out the project involved a collaborative effort on the part of the TRANS Agenciesrsquo staff and the consultant The results are described in this report The methodology included the preparation of several tabulations and graphical representations of the relationships among various elements of the data which were collected This culminated in the information which was deemed to be the most useful and the most effective means of presenting the findings from the analysis
30 1989 TRUCK SURVEY A National Capital Region Goods Movement Study undertaken by Delcan in 1989 produced a report for TRANS in May 1991
In the 1989 Region-wide survey truck origin-destination characteristics were collected for the movement of goods on a Region-wide basis including the movement of goods across the Ottawa River
The 1989 survey differed from the 2000 survey in two key aspects
x As part of the 1989 survey licence plate information (characters) was recorded for 2964 trucks From these trucks a sample of 700 trucks for which registry information was available was drawn to attempt to obtain trip itineraries for this sample Complete information was obtained for 96 trucks From the study information it has been determined that a total of 5955 ldquolocalrdquo (internalinternal) (plus an indeterminate number of external) truck trips was estimated as having crossed the Ottawa River Thus the sample of 96 trucks represented a sampling rate of approximately 16 of the universe of approximately (more than) 6000 trucks As a point of comparison the truck survey in the autumn of 2000 obtained data on 495 trucks in a universe of 3450 trucks (a sample size of 143) observed as having crossed the Ottawa River
Interprovincial Roadside Truck Survey REPORT 2
Interprovincial Roadside Truck Survey REPORT 3
x For the purposes of the 1989 survey vehicles were classified as light trucks (2 axles4 wheels) medium trucks (2 axles6 wheels) and heavy trucks (single unit3+ axles) Any registered commercial vehicle qualified as a candidate to be included in the survey In comparing the previous survey with the current survey the inclusion of two axlefour wheel trucks in the previous survey skewed the results considerably Of importance is the lack of compatibility between the classification system used in the 1989 study and the classification system used in the 19992000 surveys The 2 axle4 wheel truck classification which was included in the 1989 survey is currently a much larger component of the vehicle fleet as a consequence of the increased popularity of SUVs (sport utility vehicles) and vans as a means of personal transport The 19992000 survey applied a more realistic classification system which excluded the 2 axle4 wheel truck from the scope of the survey
The current study is significantly more focussed having been designed to provide more detailed origin-destination information on the flow of trucks across the Ottawa River
In summary aside from other problems related to the sample size comparisons between the 1989 and 19992000 surveys would be difficult particularly since the in-scope vehicles established for each survey are significantly different
40 19992000 SURVEY PROGRAM and METHODOLOGY In this section of the report the survey program and the methodologies applied in the application of the data are described
41 Historical Vehicle Data
The Regional Municipality of Ottawa-Carleton (predecessor of the City of Ottawa) had undertaken annually traffic counts along major travel corridors to establish trends related to vehicle classificationsoccupancy With the exception of the years between 1995 and 1998 inclusive in which years data were collected for an eight hour period these data have been collected for one 12 hour period (0700 to 1900) each year These traffic classification and vehicle occupancy data were available to supplement the data collected as part of the 19992000 survey to create a comprehensive database A significant part of the on-going traffic count program includes the collection of information on interprovincial travel on an annual basis
From the vehicle classification and occupancy surveys for the Chaudiegravere and Macdonald-Cartier bridges the historical data are to varying degrees relevant and have been applied when appropriate
xhibit 1 Illustration of Survey Station
EXHIBIT 1b ILLUSTRATION OFb SURVEY STATIONb
King Edward Av
E
42 Driver Interviews
The purpose of the driver interview surveys was to gather specific data on the characteristics of the trucks the travel patterns including detailed information on the trip origins and destinations and the commoditygoods carried The roadside driver interview surveys were carried out by trained surveyors (under contract to the Ministry of Transportation of Ontario) familiar with the form of data collection programs of the type applied in this study Survey crews were stationed on the south side of the Ottawa River - on King Edward Avenue in the vicinity of Boteler Street and on Booth Street south of the Ottawa River Parkway Bridge over Booth Street - and interviewed drivers of candidate trucks
Illustrations of a typical survey station set-up and lane closures are provided in EXHIBIT 1 - ILLUSTRATION OF SURVEY STATION
Driver interviews were conducted on separate days for northbound and southbound traffic movements The surveys were undertaken as follows
DIRECTIONYEAR 1999 2000
Midnight to midnight 0700 to 0700 (24 hours) (24 hours)
NORTHBOUND October 25th amp 28th September 6th amp 7th
SOUTHBOUND October 26th amp 27th September 7th amp 8th
Interprovincial Roadside Truck Survey REPORT 4
1 Appendix A ndash Survey Database Fields Interprovincial Roadside Truck Survey REPORT 5
From the interview surveys each record in the database contains responses collected from the questionnaire used in the 2000 survey (a modified version of the questionnaire that was used in the 1999 survey) In the 1999 survey the origins and destinations of the truck trip were recorded using a macro description whereas in the 2000 survey trip origins and destinations were recorded in very precise and specific terms in order to apply the existing traffic zone system to yield valid origin-destination information Consequently the roadside surveys carried out in 2000 have been used exclusively to establish trip patterns and trip tables for future analysis
A comprehensive description of the database fields is provided in Appendix A1 The following sections and database fields from the interview surveys are considered to be relevant in varying degrees to the purpose of the study as identified in the Terms of Reference as
the development of a good understanding of the interprovincial movement patterns origins destinations and characteristics of medium and heavy trucks in the National Capital Region and the satisfaction of the TRANS mandate to furnish high quality and meaningful transportation data required for transportation planning and decision making in the National Capital Region
A - the direction of travel of the truck B - the configuration of the truck (number of tiresaxles) C - additional descriptors identifying the configurationbody style of the truck (tractor
trailer straight truck van dangerous goods placards etc) F - commodity information such as cargo on board capacity (availableused)
category and amount origindestination dangerous goods etc H - information on characteristics including number of stops trip origindestination
details trip startend datetime etc J - information on axle groupings of trucks etc
Electronic boards were used to record the responses by the drivers That is there are no paper records of the responses
43 Vehicular Traffic Classification Count Observations
Observers were stationed at the locations described earlier and recorded all (100) of the trucks passing the station
The purpose of the separate classification counts undertaken as part of the project was to provide the identification of vehicles by classification (type) in order to derive expansion factors for application in the study and ensure that the results of the surveys were consistent with the results of the historical on-going program of collecting vehicle classification data
As part of the data collection program truck classification counts were undertaken
BRIDGEYEAR 1999 2000
0500 to 2200 0700 to 0700 (17 hours) (24 hours)
Macdonald-Cartier October 25th to 28th September 6th to 8th
Chaudiegravere October 25th to 28th September 6th to 8th
CumberlandMasson Ferry September 5th to 8th
A graphical representation of the various types of vehicles that are classified in this study as Trucks (Heavy Trucks) is provided in Appendix B2 This truck classification system was used by the (former) Regional Municipality of Ottawa-Carleton and is consistent with that used in the Outaouais Region
The classification system applied by the observers was detailed It was later refined to present information by three key categories of trucks (heavy trucks) as follows
x 2 axle trucks - which represent trucks with six wheels such as tow trucks large (34 ton 1 ton) pick-up trucks small vans small dump trucks etc which create very few traffic operational problems but are defined as heavy trucks
x 3+ (3 or more) axle trucks - which represent medium size single unit trucks such as large dump trucks straight trucks concrete mix trucks etc which contribute to environmental concerns (noise vibration) but do not create undue traffic operational concerns although these are also defined as heavy trucks
x tractor trailer trucks - which represent the largest trucks such as tractor-trailer trucks flat-bed trucks etc which contribute to both environmental concerns and traffic operational concerns due to the time headway utilization (in starting from a stopped position) and the large turning radius (particularly in the case of right turns)
Trucks with four wheels are not included in the study and are considered to be light trucks These include small (12 ton) pick-up trucks such as the Toyota TacomaChevrolet Sonoma or the Jeep or any SUV etc
2 Appendix B ndash Heavy Truck Classification System Interprovincial Roadside Truck Survey REPORT 6
Exhibit 2 Study Truck Classification
A further illustration of the classification of trucks is provided in EXHIBIT 2 - STUDY TRUCK CLASSIFICATION In this study trucks with the truck id as indicated in Appendix B - 1 and 3 are included in the survey (Note - these trucks have six wheels and are considered to be heavy trucks based on the truck classification system discussed earlier)
Tractor Trailer
3+ Axle Truck
2 Axle Truck
EXHIBIT 2b STUDY TRUCKb
CLASSIFICATIONb
44 Automatic Traffic Recorder (ATR) Counts
Automatic traffic recorders are devices which record impulses from tires or vehicle masses passing the site of the detecting devices (road tubes cable loops in the pavement etc) The impulses are translated into vehicle counts and in some cases into a count of vehicles by classification (eg various sizes of trucks) The sensitivity of automatic traffic recorders is affected by the number of lanes of traffic included in a survey When road tubes are used to record vehicles in four or more lanes results can be quite variable
The intended purpose of undertaking traffic counts using automatic traffic recorders during the period 1200 October 17 1999 to 0700 October 31 1999 (fourteen days) was to ensure representativeness of the classification counts which were undertaken during a limited period of time (four days) In 2000 traffic volume information was not collected using automatic traffic recorders as part of the program
Interprovincial Roadside Truck Survey REPORT 7
Exhibit 3 Historical All Vehicle Volumes
1999 2000
50 KEY RELATIONSHIPS
In this section of the report the key relationships identified in respect to the historical data the truck count characteristics and the travel patterns are discussed
51 Historical traffic volumes
From the historical (1991 to 2000) vehicle classification (light trucks heavy trucks passenger cars buses taxis bicycles and others) and occupancy surveys data are available by direction of traffic flow across the Ottawa River bridges by time period (8 or 12 hours morning and afternoon peak periodshours) This enabled the preparation of profiles for various periods of the day
All vehicle historical volumes are presented for each direction of travel (northbound and southbound) for all five bridges across the Ottawa River in EXHIBIT 3 shyHISTORICAL ALL VEHICLE VOLUMES for 12-hour periods (0700-1900) and for 24-hour periods (note that the 12 hour data for 1995 to 1998 have been factored from 8 hour data and the 24 hour data are factored from 8 or 12 hour data)
50000
60000
70000
80000
90000
100000
110000
120000
1991 1992 1993 1994 1995 1996 1997 1998 1999 2000
All Ottawa River Bridges (12 and 24 hour volumes)
12h
24h
Average per direction 105600
Average per direction 93800
Number of vehicles factored to 12 hours from 8 hour counts
Southbound
Northbound
Year
Num
ber
of v
ehic
les
per
dire
ctio
n
EXHIBIT 3b HISTORICALb
ALL VEHICLE VOLUMESb
(Spring)
Factors that were established in the early 1980rsquos from the on-going traffic survey counts conducted by the former Regional Municipality of Ottawa Carleton suggested
Interprovincial Roadside Truck Survey
REPORT 8
that 12 hour traffic volumes could be factored by 139 to represent a daily 24 hour volume This factor has been applied in several studies (including those undertaken by TRANS) to all vehicles including trucks In comparison the data collected in the 2000 surveys determined that an appropriate factor for trucks crossing the Ottawa River would be 127 and this value has been applied in factoring 12 hour historical truck traffic counts to derive 24 hour values
One element to consider in evaluating the data which are presented in this section is the time of year at which the data were collected - in the annual program data are collected in MayJune whereas the data collected for this survey were collected in late October 1999 and in early September 2000
As illustrated in Exhibit 3 daily (24 hour) ldquoall vehiclerdquo traffic volumes in 2000 were at a level similar to that which was experienced 10 years earlier (1991) After a steady growth in the first half of the decade a modest decline was experienced in the latter half
At the peak (1993) there were in the 24 hour period approximately 105600 vehicles (average for each direction) crossing the river while in 2000 there were approximately 93800 vehicles (average for each direction - a decline of approximately 12 from the peak (average for each direction) crossing the river
Relevant to this project are the data for the Chaudiegravere and Macdonald-Cartier bridges which are bridges on which ldquoheavy trucksrdquo are allowed ldquoHeavy trucksrdquo are prohibited on the Alexandra Portage and Champlain bridges
EXHIBIT 4 - HISTORICAL TRUCK VOLUMES presents the historical truck data for the Macdonald-Cartier and the Chaudiegravere bridges collectively
As illustrated in Exhibit 4 daily (24 hour) truck traffic volumes were in both the spring and autumn of 2000 at a level slightly lower than that which was experienced 10 years earlier (1991) The lowest level of approximately 1400 trucks (average number for each direction) occurred in the mid-1990s
After a steady decline in the first half of the decade a modest growth was experienced in the latter half At the peak (1992) there were in the 24 hour period approximately 1950 trucks (average for each direction) crossing the river while in the surveys in the autumn of 2000 there were approximately 1725 trucks (average for each direction) - a decline of approximately 10 from the peak truck traffic crossing the river
The profiles for the truck volumes may appear to be more pronounced because of the relatively low numbers when compared to the all vehicle values
Interprovincial Roadside Truck Survey REPORT 9
Exhibit 4 Historical Truck Volumes
Table 1 Current and Historical Two Way Truck Traffic Volumes
TABLE 1 CURRENT AND HISTORICAL TWO WAY
TRUCK TRAFFIC VOLUMES
NUMBER OF TRUCKS CROSSING THE OTTAWA RIVER
INFORMATION SOURCE MORNING AFTERNOON 24 HOURS COMMUTER COMMUTER
PEAK HOUR PEAK HOUR
2000 SURVEY AUTUMN 3450 205 170
2000 ANNUAL SURVEY SPRING 3335 215 170
5 YEAR AVERAGE (1996-2000) 3120 235 180
10 YEAR AVERAGE (1991-2000) 3285 250 210
12h
24h
Average per direction 1950
Average per direction 1725
Southbound Northbound
Macdonald-Cartier and Chaudiegravere Bridges (12 and 24 hour volumes)
Number of trucks factored to 12 hours from 8 hour counts (Spring) Roadside Truck Survey Data
Num
ber o
f tru
cks
per d
irect
ion
Year
EXHIBIT 4b HISTORICALb
TRUCK VOLUMESb
(Autumn)
0
200
400
600
800
1000
1200
1400
1600
1800
2000
2200
2400
1991 1992 1993 1994 1995 1996 1997 1998 1999 1999 2000 2000
A summary of relevant data for two way truck traffic on the two bridges combined for the 24 hour period and the morning and afternoon peak hours is provided in TABLE 1 - CURRENT AND HISTORICAL TWO WAY TRUCK TRAFFIC VOLUMES
- Ottawa river crossing includes the Macdonald-Cartier and Chaudiegravere Bridges as heavy trucks are prohibited on the Alexandra Portage and Champlain bridges
Interprovincial Roadside Truck Survey REPORT 10
Table 2 Ratio of Peak Hour to 24 Hour Traffic Volumes 1999 to 2000
The 24-hour truck volume levels observed in the autumn of 2000 compare reasonably well with previous counts undertaken over the past ten year period
Further the historical data for the two bridges (Macdonald-Cartier and Chaudiegravere) crossing the Ottawa River have been tabulated for each bridge separately for the two bridges and for all bridges and are provided in Appendix C3 From the historical traffic volume information time period relationships have been determined for the peak hourpeak period peak hour12 hour and peak hour24 hour relationships These are provided in detail in Appendix D4
The most relevant information has been extracted and displayed in TABLE 2 ndash RATIO OF PEAK HOUR TO 24 HOUR TRAFFIC VOLUMES 1991 to 2000 The values for trucks are followed by the values for all vehicles (in parenthesis)
TABLE 2 RATIO OF PEAK HOUR TO 24 HOUR TRAFFIC VOLUMES
1991 to 2000
COMMUTER PEAK24 HOUR RATIO FOR TRUCKS (ALL VEHICLES) BRIDGE
FOR BOTH MORNING AFTERNOON DIRECTIONS
Range 7-11 ( 8-10) 5-8 ( 9-10) Macdonald-Cartier
Weighted Average 8 ( 9) 7 ( 9)
Range 6-9 ( 8-11) 3-8 ( 7-10) Chaudiegravere
Weighted Average 7 ( 9) 6 ( 9)
xx - trucks (yy) - all vehicles
A review of the information in Table 2 and in Appendix D indicates that
- For truck classifications
x in all cases the most stable relationships are the commuter peak hour24shyhour relationships The weighted averages for commuter peak hour24shyhour range from 6 to 8
3 Appendix C ndash Summary of Historical Ottawa River Crossing Truck Traffic Volumes4 Appendix D ndash Time Period Relationships Interprovincial Roadside Truck Survey REPORT 11
Interprovincial Roadside Truck Survey REPORT 12
x the range in the relationships is similar to the ldquoall vehiclerdquo relationships but is in general less variable than the all vehicle relationships when considered by direction
x the relationship of the peak hour24 hour when the directions are considered individually or in combination is quite inconsistent with the conventional rule of thumb relationship [the ldquorule of thumbrdquo suggests that the peak hour can be represented by 10 of the AADT (ANNUAL AVERAGE DAILY TRAFFIC)] and
- For all vehicle classifications
x in all cases the variations in the relationships are reasonably confined
x the average of the relationships over 10 years has been identical and therefore has been consistent particularly when both directions are considered
x the relationship of the peak hour24 hour when both directions are considered is consistent (although not precisely the same as) with the conventional rule of thumb relationship which suggests that the peak hour can be represented by 10 of the AADT
52 Truck Classification and Characteristics
The candidate trucks were grouped into sub-classifications (2 axle 3+ axle [3 or more axle] trucks and tractor trailers as described in Section 43
Of the total of approximately 3450 trucks observed over 24 hour period as crossing the Ottawa River there were 1550 2 axle (45) 880 3+ axle (25) and 1020 tractor trailer (30) trucks
Information on truck volumes as obtained from the classification counts in 1999 and 2000 is presented by direction for each of the Macdonald-Cartier and Chaudiegravere bridges in EXHIBIT 5 ndash DAILY TRUCK VOLUMES BY CLASSIFICATION
For the Macdonald-Cartier Bridge the volume of trucks was significantly higher (approximately 24) in 2000 than was the case in 1999 however the 2000 truck volumes are considered to be more representative for planning purposes (see comparative analysis in Table 1) than the 1999 truck volumes Truck volumes averaged over the two days were consistent in terms of the direction of travel and composition (2 axle 3+ axle and tractor trailers) For the Chaudiegravere Bridge truck volumes in 1999 and 2000 were reasonably consistent in magnitude by direction and by composition As would be expected the foregoing characteristics are also apparent when the volumes from both bridges are combined
Exhibit 5 Daily Truck Volumes by Classification
410
220
375
520
340
430
450
225
400
510
340
440
225
110
60
245
90
75
265
130
65
275
110
75
0
200
400
600
800
1000
1200
1400
1999 2000 1999 2000 1999 2000 1999 2000
Southbound Northbound
Southbound Northbound
2 Axles
3+ Axles
Trailers 1005
1290
1075
1290
395 410 460 460
Dai
ly n
umbe
r of
truc
ks p
er d
irect
ion
Macdonald-Cartier Chaudiegravere Year
EXHIBIT 5b DAILY TRUCK VOLUMESb
BY CLASSIFICATIONb
(Autumn)
The data from the MassonCumberland ferry when included with the totals from the two bridges had a minimal impact in terms of the total number of trucks (65 in each of the northbound and southbound directions) as well as in the 2 axle truck classification (10 in each direction) There is a disproportionate impact in the 3+ axle (30 in each direction) and tractor trailer (25 in each direction) classifications which would suggest that the smaller vehicles have less propensity to use the ferry probably due to its rural location
The recorded number of trucks by hour of the day is presented graphically in EXHIBIT 6 - HOURLY TRUCK VOLUMES MACDONALD-CARTIER BRIDGE and in EXHIBIT 7 - HOURLY TRUCK VOLUMES CHAUDIEgraveRE BRIDGE
It is clear from the exhibits that truck movements are more predominant during the mid-day hours than in the commuter peak hours The mid-day peaking phenomenon is more apparent on the Chaudiegravere Bridge than on the Macdonald-Cartier Bridge It is postulated that this is attributable to the attraction of the Chaudiegravere Bridge for short trips (Central Hull to Ottawa) in particular those made by smaller trucks The need to meet the expectations of the business day no doubt contributes to this phenomenon These characteristics also reinforce the historical trend which indicates that the relationship between the peak hour and the 24-hour volumes is lower for trucks than for mixed traffic The composition of the truck traffic stream is discussed in some detail in Sections 81 and 83 Interprovincial Roadside Truck Survey
REPORT 13
Exhi
Exhibit 7 Hourly
bit 6 Hourly Truck Volumes Macdonald-Cartier Bridge
Truck Volumes Chaudiegravere Bridge
MACDONALD-CARTIER BRIDGEb
0
20
40
60
80
100
120
140
160
180
200
220 1
00
200
300
400
500
600
700
800
900
100
0
110
0
120
0
130
0
140
0
150
0
160
0
170
0
180
0
190
0
200
0
210
0
220
0
230
0
240
0
Hour ending
Num
ber o
f tru
cks
ndash bo
th d
irect
ions
2 Axles
3+ Axles
Trailers
Peak hour 1000-1100 2 Axles = 81 3+ Axles = 69
Trailers = 56
(Autumn 2000)
EXHIBIT 6b HOURLY TRUCK VOLUMESb
0
20
40
60
80
100
120
140
160
180
200
220
100
200
300
400
500
600
700
800
900
100
0
110
0
120
0
130
0
140
0
150
0
160
0
170
0
180
0
190
0
200
0
210
0
220
0
230
0
240
0
Hour ending
Num
ber o
f tru
cks
ndash bo
th d
irect
ions
2 Axles
3+ Axles
Trailers
Peak hour 900-1000 2 Axles = 49 3+ Axles = 23 Trailers = 12
(Autumn 2000)
EXHIBIT 7b HOURLY TRUCK VOLUMESb
CHAUDIEgraveRE BRIDGEb
Interprovincial Roadside Truck Survey REPO RT 14
Exhibit 8 Hourly Vehicle Traffic Volumes
In EXHIBIT 8 - HOURLY VEHICLE TRAFFIC VOLUMES for all Ottawa River Bridges illustrates the typical daily peak traffic periods in the morning and afternoon and more significantly the relatively small proportion of trucks in the total traffic stream particularly during the peak traffic periods
0
2000
4000
6000
8000
10000
12000
14000
16000
18000
20000
100
200
300
400
500
600
700
800
900
100
0
110
0
120
0
130
0
140
0
150
0
160
0
170
0
180
0
190
0
200
0
210
0
220
0
230
0
240
0
Hour ending
Num
ber o
f veh
icle
s-bo
th d
irect
ions
All Ottawa River Bridges
Trucks
Other vehicles
Traffic not recorded Traffic not recorded
EXHIBIT 8b HOURLY VEHICLEb
TRAFFIC VOLUMESb
(Spring 2000)
53 Automatic Traffic Recorder (ATR) Counts
As indicated earlier there are significant challenges in collecting classification data using automatic traffic recorders The all vehicle survey data collected in 1999 are available from the TRANS Agencies however the survey results were not considered to be sufficiently reliable to be subjected to any form of analysis
No truck counts (by ATR) were taken as part of the Interprovincial Roadside Truck Survey in 2000 Any ATR data which are available were obtained from the annual traffic count program undertaken by the Regional Municipality of Ottawa-Carleton
Interprovincial Roadside Truck Survey REPORT 15
Exhibit 9 District System
5 Appendix E ndash Traffic Zones Comprising the Districts Interprovincial Roadside Truck Survey
REPORT 16
60 ZONEDISTRICT SYSTEM
In this report reference is made to the National Capital area This area closely replicates but does not precisely follow the boundaries of the new cities of Ottawa and Gatineau and Municipaliteacute Reacutegionale des Collines de lrsquoOutaouais (MRC) or the boundaries of the National Capital Region
The traffic zone system which has been in use for more than 10 years in the National Capital area is comprised of 258 zones (including 15 external zones) and all origin-destination information was coded to this 258-zone system This zone system has been respected in the development of a district system in all of the analyses which have been undertaken in the context of this study The district system was established to allow the recognition of relevant geographical characteristics and the presentation of relevant travel patterns and is illustrated in EXHIBIT 9 - DISTRICT SYSTEM The zones which comprise each of the ldquodistrictsrdquo are identified in Appendix E5 The districts have been identified by a geographical reference The preface IGB identified with some districts connotes a district which is Inside Green Belt
7 Hull
8 Aylmer
9 Gatineau West
10 Gatineau East
5 IGB East
1 Ottawa Central
6 Ottawa East
4 Ottawa South
2 IGB West
3 Ottawa West
Queacutebec
Ontario
EXHIBIT 9b DISTRICT SYSTEMb
There are ten ldquodistrictsrdquo in the current version of the ldquodistrictrdquo system External traffic zones in what can be considered to be ldquoremoterdquo areas (eg Montreal and contiguous areas in Quebec) have been incorporated into one of the ldquodistrictsrdquo In the presentation of the result of the analysis this factor must be borne in mind Modifications to the ldquodistrictrdquo system can be achieved with little effort for any study related to Interprovincial truck traffic
The ldquodistrictrdquo system was utilized to create origin-destination matrices for all trucks as well as each of the individual classifications of 2 axle 3+ axle and tractor trailer trucks
70 DATA EXPANSION Drivers of 549 trucks were interviewed and the survey yielded 495 (in-scope) valid (and completed) responses representing the characteristics of 3450 trucks - a sample size of 143 The data were considered to be of sufficient magnitude and strength to allow expansion by bridge and by certain time periods The methodology and expansion factors are discussed in the following
71 Expansion Methodology
The interview survey data are available for the morning and afternoon peak hours and peak periods as well as for the 0700 to 1900 [day] and 1900 to 0700 [night] and for the 24 hour period In order to determine the efficacy of utilizing the peak hour or peak period (as distinct from the 12 or 24 hour) data and applying a relationship factor (as discussed in Section 51) to establish origin-destination trip tables for transportation planning purposes two analytical processes have been applied
Origin-destination tables based on the district system were prepared to compare using percentages the results produced by the day data the night data and the full 24 hour data These tabulations were prepared for all trucks and individually for 2 axle trucks 3+ axle trucks and tractor trailers These tabulations are provided in Appendix F6 and Appendix G7
Out of a potential of 100 origin-destination pairs there were
x for all trucks of which there were 47 pairs there were 42 pairs in which the values for the day + night and the 24 hour were the same
x for 2 axle trucks of which there were 42 pairs there were 38 pairs in which the values for the day + night and the 24 hour were the same
6 Appendix F ndash ldquoDistrictrdquo Comparison of Trucks by Number 7 Appendix G ndash ldquoDistrictrdquo Comparison of Trucks by Percent Interprovincial Roadside Truck Survey REPORT 17
x for 3+ axle trucks of which there were 36 pairs there were only 22 pairs in which the values for the day + night and the 24 hour were the same
x for tractor trailer trucks of which there were 44 pairs there were only 28 pairs in which the values for the day + night and the 24 hour were the same
Since peak hour (normally the afternoon peak hour) values are typically used for transportation planning and road design principles it is essential to ensure that the peak hour (in particular the afternoon peak hour) values provide representative information for these purposes
It became apparent that the use of the afternoon peak period matrix would yield less reliable results than would the use of the 24 hour period accompanied by the application of a factor to estimate the peak period values The reliability of this procedure is enhanced by the consistency in the relationships between the peak period and the 24-hour period as determined from the results of the analysis presented earlier (Section 51)
It is apparent that the use of the values derived for all trucks by summing the two twelve hour survey periods 0700 to 1900 [day] and 1900 to 0700 [night]) would yield sufficiently reliable results to which a factor to estimate the peak period values could be applied
In the final analysis acceptable sampling rates were achieved by considering the utilization of the data by bridge and by direction for either one time period (24 hours) or two time periods (0700 to 1900 and 1900 to 0700) combined Intuitively it was collectively considered that the utilization of a process in which the two time periods were factored separately and combined to provide a strong sample would be the superior of the two methods
72 Expansion Factors
Survey expansion factors were required to expand the interview sample to the universe of the trucks observed crossing the Ottawa River Initially expansion factors were developed based on grouping the trucks by bridge by direction of travel by vehicle type and by time period The results indicated a very low (as small as 1) sampling rate for certain classifications of vehicles during certain time periods A sampling rate of 5 would be considered to be acceptable This was as a consequence of for example
x the necessity to discontinue the survey during some peak traffic periods due to the congestion being created by the survey procedures resulting in very few and in some cases no interviews
Interprovincial Roadside Truck Survey REPORT 18
Table 3 Summary of 3+ Axle Trucks by Body Type and Cargo
Interprovincial Roadside Truck Survey REPORT 19
x certain types of trucks (eg 3+ axle trucks such as those used for construction materials empty dump trucks) being directed away from the interview stations on the perception that an interview of the driver was unnecessary This was in particular relevant on the Macdonald-Cartier Bridge
Based on the proportion of empty 3+ axle trucks a further examination of this classification of truck was undertaken TABLE 3 - SUMMARY OF 3+ AXLE TRUCKS BY BODY TYPE AND CARGO provides detailed information on the 3+ axle trucks in terms of the body type and whether or not cargo was being transported A significant number of the 3+ axle trucks are comprised of the dump truck tractor cab body types
TABLE 3 SUMMARY OF 3+ AXLE TRUCKS
BY BODY TYPE AND CARGO
TRUCK BODY TYPE WITH CARGO EMPTY TOTAL
DUMP TRUCK 65 225 290
FLATBED 90 85 175
TANKER 40 10 50
VAN ndash not refridgerated 50 - 50
VAN ndash refridgerated 20 25 45
CONTAINER CARRIER 10 25 35
FLOAT - 50 50
TRACTOR CAB (only) - 95 95
OTHER - 65 25
TOTAL 340 540 880
By utilizing longer time periods for the development of the expansion factors it was possible to achieve better sampling rates and thus provide more reliable results Following on from the foregoing the use of the two twelve hour survey periods (0700 to 1900 [day] and 1900 to 0700 [night]) was examined Sample sizes for the two periods differ There were significantly more trucks included in the 0700 to 1900 survey period while the sample size from the 1900 to 0700 survey period was significantly greater
The expansion factors are presented graphically for the three vehicle classifications for each bridge in the form of the sample size for two 12 hour time periods (0700 to
Exhibit 10 Sample Size by Time of Day
2 Axles
Tractor Trailers
3 Ax es
NB SB NB SB NB SB NB SB
70
l
0
5
10
15
20
25
30
35
40
100
Chaudiegravere Macdonald-Cartier
Night 1900-0700 Day 0700-1900 Night 1900-0700 Day 0700-1900
5 5 5
Tractor Trailers
3 Axles
2 Axles
EXHIBIT 10b SAMPLE SIZEb
BY TIME OF DAYb
Northbound Southbound Northbound Southbound Northbound Southbound Northbound Southbound
Perc
ent o
f tru
cks
(Autumn 2000)
1900 [day] and 1900 to 0700 [night]) in EXHIBIT 10 - SAMPLE SIZE BY TIME OF DAY The large sample size for tractor trailers during the night period on the Chaudiegravere Bridge can be attributed to the small number of tractor trailers using the bridge during this period
The numerical values for the expansion factors are provided in TABLE 4 shyEXPANSION FACTORS BY BRIDGE BY DIRECTION AND BY TIME OF DAY
Table 4 Expansion Factors by Bridge by Direction and by Time of Day
TABLE 4 EXPANSION FACTORS BY BRIDGE
BY DIRECTION AND BY TIME OF DAY
NORTHBOUND SOUTHBOUND BRIDGE PERIOD 2 3+ Tractor 2 3+ Tractor
Axles Axles Trailer Axles Axles Trailer
MACDONALD shy Day (0700ndash1900) 128 157 65 112 482 74CARTIER Night (1900ndash0700) 121 76 39 150 260 30
Day (0700ndash1900) 51 61 36 63 47 32CHAUDIEgraveRE
Night (1900ndash0700) 28 110 10 34 32 14
- Sampling rate less than 5
Interprovincial Roadside Truck Survey REPORT 20
8 Appendix H ndash Survey Expansion Factors Interprovincial Roadside Truck Survey REPORT 21
The complete analysis in tabular as well as in graphical form is provided in Appendix H8 in which the expansion factors are presented graphically for the three vehicle classifications for each bridge in the form of the sample size for various time periods (24 hours 12 hours (0700 to 1900 and 1900 to 0700) the morning peak period [0600 to 1000] the afternoon peak period [1500 to 1900] the mid-day period [1000 to 1500] and the night period [1900 to 0600]
Generally speaking the sample size is adequate particularly in the case of the tractor-trailer classification which is considered to be of the greatest significance of the three truck classifications in the context of this study
The 3+ axle trucks have the lowest sample size (as low as 2 for the southbound direction) The three axle category in particular the dump and tractor-trailer (without a trailer) type trucks dominate the empty trucks identified in the survey and were subjectively considered to form a large part of the trucks (affected by the exclusion actions discussed earlier in this section)
The empty 3+ axle truck aspect has been discussed earlier in Section 72 (Table3)
80 TRIP CHARACTERISTICS AND PATTERNS In this section of the report the vehicle types inter-regionalexternal travel origin-destination information and vehicle loading and commodities are examined to establish trip characteristics and patterns
81 Vehicle Types
As indicated earlier of the total of approximately 3450 trucks per day observed in the surveys as crossing the Ottawa River there were 1550 2 axle (45) 880 3+ axle (25) and 1020 tractor trailer (30) trucks
EXHIBIT 11 - DAILY TRUCK VOLUMES BY CLASSIFICATION illustrates the variation in the number of trucks on the two bridges for the three classifications of trucks
The Macdonald-Cartier bridge carries by far the largest number (870) and proportion (34) of the tractor-trailer classification of truck The 2 axle truck dominates the composition (60) on the Chaudiegravere bridge
Exhibit 11 Daily Truck Volumes by Classification
Exhibit 12 Cumulative Truck Traffic
Macdonald - Cartier Bridge 2580 Trucks
Tractor Trailers 17
( 150 )
Chaudiegravere Bridge 870 Trucks
2 Axles 60
( 520 )
Tractor Trailers 34
( 870 )
2 Axles 40
( 1030 )
3+ Axles 23
( 200 )
3+ Axles 26
( 680 )
EXHIBIT 11b DAILY TRUCK VOLUMESb
BY CLASSIFICATIONb
(Autumn 2000)
EXHIBIT 12 - CUMULATIVE TRUCK TRAFFIC illustrates the profile of the truck travel for all trucks (by each classification) crossing the Ottawa River over the course of the day commencing with the 0600 time point By 2100 95 of the 3+ axle trucks 93 of the 2 axle trucks and 80 of the tractor trailer crossings of the Ottawa River have occurred
0
10
20
30
40
50
60
70
80
90
100
600
700
800
900
100
0
110
0
120
0
130
0
140
0
150
0
160
0
170
0
180
0
190
0
200
0
210
0
220
0
230
0
000
100
200
300
400
500
Time of Day
Tractor Trailer
2 Axles
3+ Axles
EXHIBIT 12b CUMULATIVEb
TRUCK TRAFFICbMacdonald-Cartier and Chaudiegravere Bridges
Per
cent
of t
ruck
s pe
r da
y
(Autumn 2000)
Interprovincial Roadside Truck Survey
REPORT 22
Table 5 Truck Travel Composition and Trip Distance
In TABLE 5 -TRUCK TRAVEL COMPOSITION AND TRIP DISTANCE an analysis of travel by truck classification is provided Data in the table indicate that the composition of the trucks on the network for trucks crossing the Ottawa River is attributable to 2 axle trucks to the extent of 45 to 3+ axle trucks to the extent of 25 and to tractor trailer trucks to the extent of 30 The tractor trailer trucks (which represent only 30 of the total trucks have the longest trip lengths with 50 of the total trip distance compared to 3+ axle trucks with 20 of the total trip distance and 2 axle trucks with 30 of the total trip distance
TABLE 5 TRUCK TRAVEL COMPOSITION AND TRIP DISTANCE
TRUCK CLASSIFICATION TRUCK TRIPS(1) TRIP DISTANCE(2)
2 AXLE 45 30
3+ AXLE 25 20
TRACTOR TRAILER 30 50 (1) As determined from the classification counts
(2) As determined by assigning truck trips to the road system
82 Trip Tables
Origin-destination trip tables based on the district system were prepared solely for the purposes of the analysis presented in this report in order to test the sufficiency of the base data in the context of the district system described earlier The results of this application are discussed in this section of the report The objective of the analysis is for the foregoing purpose only The application of the data for any subsequent transportation planning activity andor project can be undertaken with a much finer level of detail particularly in terms of the zone and district system which can be applied The determination in this regard will be the responsibility of the agencyfirmperson undertaking the activity
83 Travel Patterns
In approximate terms there was a total of 3450 trucks per day in 2000 of which 2580 used the Macdonald-Cartier bridge - 1290 northbound and 1290 southbound shyand 870 used the Chaudiegravere bridge - 460 northbound and 410 southbound
Interprovincial Roadside Truck Survey REPORT 23
9 Appendix I ndash Trip Characteristics Interprovincial Roadside Truck Survey REPORT 24
Three trip types are identified
x a local trip which is also called an internalinternal trip which has both an origin and a destination within the National Capital area A trip from Hull to the west end of Ottawa would be a local trip
x a through trip which is also called an externalexternal trip which has both an origin and a destination outside the National Capital area A trip from Montreal to Maniwaki which crosses the Ottawa River would be a through trip
x an inter-regional trip which is also called either an internalexternal or an externalinternal trip which in the case of an internalexternal trip has an origin within the National Capital area and a destination outside the area (internalexternal) and in the case of an externalinternal trip has an origin outside the National Capital area and a destination within the National Capital area (externalinternal) A trip from Gatineau to Montreal (crossing the Ottawa River) would be an internalexternal trip and a trip from Kingston to Gatineau would be an externalinternal trip with both trips classed as an inter-regional trip
An overview of the trip characteristics reveals that 2300 (67) of the trucks per day made local trips (an origin and destination generally within the National Capital area) 975 (28) of the trucks made inter-regional trips (either an origin or a destination outside the National Capital area) while 175 (5) of the trucks made a through trip (an origin and destination outside the National Capital area) The tabulations of the trips for each bridge separately by direction and by truck classification are provided in Appendix I9
EXHIBIT 13 - DAILY TRUCK COMPOSITION BY CLASSIFICATION shyMACDONALD-CARTIER BRIDGE and EXHIBIT 14 - DAILY TRUCK COMPOSITION BY CLASSIFICATION - CHAUDIEgraveRE BRIDGE illustrate the variation in the trip patterns of trucks on each of the two bridges for the three classifications of trucks
The key characteristics identified are
x 60 of the truck traffic on the Macdonald-Cartier bridge are local trips (ie 40 of the trips have at least one end outside the limits of the National Capital area) while the trucks on the Chaudiegravere bridge are predominantly (87) local trips (internalinternal)
x tractor trailer trucks are dominant on both the Macdonald-Cartier bridge and the Chaudiegravere bridge in the through trip type as well as but in a less prominent way in the inter-regional trip type indicating the fact that the tractor trailer is used for the longer trips
Exhibit 13 Daily truck Composition Macdonald-Cartier Bridge
Exhibit 14 Daily Truck Composition Chaudiegravere Bridge
110 750( 760 )
( 155 )
bull the two axle truck is the most prominent classification for local trips particularly on the Chaudiegravere bridge
EXHIBIT 13b DAILY TRUCK COMPOSITIONb MACDONALD-CARTIER BRIDGEb
2 Axles 50
3 Axles 35
Tractor Trailer 15
3 Axles 15
2 Axles 26
Tractor Trailer 59
17
Tractor Trailer 83
2 Axles
Local 60
( 1550 )
Inter-regional 34
( 865 )
Through 6
2580 Trucks
(Autumn 2000)
165
Local 87
Inter-regional 12
( 105 )
Through 1
( 10 )
2 Axles 66
3 Axles 25
Tractor Trailer 9
2 Axles 25
3 Axles 8Tractor Trailer
67
Tractor Trailer 100
EXHIBIT 14b DAILY TRUCK COMPOSITIONb
CHAUDIEgraveRE BRIDGEb
870 Trucks
750110
(Autumn 2000)
Interprovincial Roadside Truck Survey
REPORT 25
Exhibit 15 Trip Itineraries
EXHIBIT 15 - TRIP ITINERARIES provides the trip end (destination) facility for in one case on the left of the exhibit the trips ending in Ontario and in the other case on the right of the exhibit the trips ending in Queacutebec With the exception of the imbalance in the retail trip ends (10 ending in Ontario and 24 ending in Queacutebec) and the truckrail terminal trip ends (23 ending in Ontario and 14 ending in Queacutebec) the end point of trips is more or less in an equilibrium condition
33
24 10
10
23
28
22 24
12 14
--------------------------------shy Other
----------shy Warehouse Distribution Centre --------------------shy Retail Outlet
Manufacturer Primary Producer
------------shy Truck and Rail Terminal
-------------------------------------shy
------------shy------------------------shy
-----------shy
Trips to Queacutebecfrom Ontario
Trips to Ontario from Queacutebec
EXHIBIT 15B TRIP ITINERARIESB
(Autumn 2000)
84 Origin-Destination Patterns
The most relevant relationships from a transportation planning perspective are the vehicle size and the origindestination information for the various time periods Using this information a database was prepared which is as valid and useful as possible and can be applied at the traffic zone system level (258 zones)
As discussed earlier a 10 district system (an aggregate of the 258 zone system) has been established to present origindestination information in as clear a format as possible In this context originsdestinations beyond the National Capital area have been included in the adjacent district For example the ldquoHullrdquo District includes origindestinations from a large area extending northerly along Highway 5 and likewise ldquoOttawa Eastrdquo includes origindestinations for a large portion of eastern Ontario as well as areas of Queacutebec east of the Queacutebec-Ontario border (eg Montreal)
As an overview of the origins and destinations of all trucks EXHIBIT 16 - DISTRIBUTION OF ORIGINSDESTINATIONS BY CLASSIFICATION illustrates the distribution by district of all of the originsdestinations recorded in the survey There is a reasonably balanced distribution ranging from a low of 400 (Ottawa Centre and IGB West) to a high of 1360 (Hull) originsdestinations based on the district system which has been applied in the study
Interprovincial Roadside Truck Survey REPORT 26
Exhibit 16 Distribution of OriginsDestinations by Classification
10 Appendix J ndash Origins and Destinations of Truck Trips by Direction Interprovincial Roadside Truck Survey
REPORT 27
1 Ottawa Central
5 IGB East
2 IGB West
3 Ottawa West
4 Ottawa South
6 Ottawa East
7 Hull
8 Aylmer
9 Gatineau West
10 Gatineau East
Queacutebec
Ontario 2 Axle Trucks
3+ Axles Trucks
Tractor Trailers
Total number of trucks (rounded) (Origins+Destinatios) for the District
IGB ndash Inside Green Belt
xxx
(Autumn 2000)
EXHIBIT 16b DAILY DISTRIBUTION OF ORIGINSb
DESTINATIONS BY CLASSIFICATIONb
The key characteristics as portrayed on the exhibit are
bull the dominance of the Hull District as an attractorgenerator of truck trips (1360 Origins and Destinations)
bull the distribution of generated and attracted trips tofrom the nine remaining districts varies from 400 to 930 truck trips
bull the variability of the truck classifications from ldquodistrict to districtrdquo is evident although the two eastern districts one on each side of the Ottawa River which also include origins and destinations outside the National Capital area (eg Montreal) have a large proportion of tractor trailer trucks
Additional data and information are presented graphically in Appendix J10 for the northbound and southbound trips individually
The concentration of the origins and destinations for individual traffic zones is portrayed in EXHIBIT 17 DAILY CONCENTRATION OF TRUCK TRIP ORIGINS AND DESTINATIONS As would be expected truck trip ends (at least one) are
Exhibit 17 Concentration of Truck Trip OriginsDestinations
11 Appendix K ndash Concentration of Truck Trip Ends Interprovincial Roadside Truck Survey REPORT 28
focussed in lands used for industrial purposes - notably in the Industrial Avenue area in business parks in Ottawa and in the industrial areas of the former cities of Aylmer Hull and Gatineau
Thirteen of the 220 urban traffic zones account for approximately 40 of all truck trip ends and a further twenty urban traffic zones account for a further 20 of all truck trip ends
The data are presented in tabular form in Appendix K11
b b
(Autumn 2000)
gt100 Truck Trips (13 zones of All Truck Trips)
50 to 100 Truck Trips (20 zones of All Truck Trips)
lt 50 Truck Trips of All Truck Trips)
Truck Trips outside Study Area of All Truck Trips)
20
21
19
40 ndash
-
(
(
EXHIBIT 17 DAILY CONCENTRATION OF TRUCK
TRIP ORIGINS AND DESTINATIONSb
Daily Origin-Destination desire lines for all trucks as well as for each truck type are presented in the following four four-panel exhibits
x EXHIBIT 18 - DAILY ORIGIN-DESTINATION DESIRE LINES ALL TRUCK TRIPS ( AUTUMN 2000)
x EXHIBIT 19 - DAILY ORIGIN-DESTINATION DESIRE LINES 2 AXLE TRUCK TRIPS ( AUTUMN 2000)
x EXHIBIT 20 - DAILY ORIGIN-DESTINATION DESIRE LINES 3+ AXLE TRUCK TRIPS ( AUTUMN 2000)
x EXHIBIT 21 - DAILY ORIGIN-DESTINATION DESIRE LINES TRACTOR TRAILER TRIPS ( AUTUMN 2000)
On each of these four-panel exhibits each panel illustrates the desire lines (daily) for trucks to and from each of the four ldquodistrictsrdquo on the north side of the Ottawa River from and to each of the six ldquodistrictsrdquo on the south side of the Ottawa River in the autumn of 2000 The information is also provided numerically in Appendix L12
The ldquoall trucksrdquo trip patterns (Exhibit 18) highlight the role of Hull as a major generatorattractor of truck trips when compared with Aylmer Gatineau West and Gatineau East The exhibit also presents trip interchanges with each of six districts on the Ottawa side of the Ottawa River
Two axle truck patterns (Exhibit 19) are similar to the patterns of ldquoall trucksrdquo with downtown Hull again dominating the generation and attraction of trips East Gatineau trips have an orientation to the eastern ldquodistrictsrdquo in Ottawa
Three axle trucks (Exhibit 20) seem to have an ldquoaffinityrdquo for the corresponding ldquodistrictsrdquo on the opposite side of the river That is west ldquodistrictsrdquo on the north side of the Ottawa River attract trips tofrom west ldquodistrictsrdquo on the south side of the Ottawa River Similarly east ldquodistrictsrdquo on the north side attract trips tofrom east ldquodistrictsrdquo on the south side of the Ottawa River
For tractor trailers (Exhibit 21) Hull again has the largest number of trips with strong interchanges with Ottawa East and Ottawa West Gatineau East and to a slightly less extent Aylmer are also prominent with strong interchanges with Ottawa East Ottawa West and Ottawa South
The Ottawa Central ldquodistrictrdquo serves as a destination for the fewest number of tractor trailer trips
More detailed comments are provided in Appendix M13
12 Appendix L ndash Tabulations of Trip Origins-Destinations by Truck Classification 13 Appendix M - Detailed Comments on Trip Origins and Destinations
Interprovincial Roadside Truck Survey REPORT 29
Queacute
bec
Ont
ario
Ont
ario
Queacute
bec
Queacute
bec
Ont
ario
Ont
ario
Ayl
mer
H
ull
Gat
inea
u W
est
Gat
inea
u E
ast
Otta
wa
Eas
t
IGB
Eas
t
Otta
wa
Cen
tral
IGB
Wes
t
Otta
wa
Sou
thO
ttaw
a W
est
Gat
inea
u E
ast
Gat
inea
u W
est
Hul
l
Ayl
mer
Otta
wa
Eas
t
IGB
Eas
t O
ttaw
a C
entr
al
IGB
Wes
t
Otta
wa
Sou
th
Otta
wa
Wes
t
Gat
inea
u E
ast
Gat
inea
u W
est
Hul
l
Ayl
mer
Otta
wa
Eas
t
IGB
Eas
t
Otta
wa
Cen
tral
IGB
Wes
t
Otta
wa
Sou
thO
ttaw
a W
est
EX
HIB
IT 1
8 O
RIG
IN-D
ES
TIN
AT
ION
DE
SIR
E L
INE
S A
LL
TR
UC
K T
RIP
S (
AU
TU
MN
200
0)
124
Ayl
mer
Hul
l Gat
inea
u W
est
Gat
inea
u E
ast
Otta
wa
Eas
t
IGB
Eas
t
Otta
wa
Cen
tral
IGB
Wes
t
Otta
wa
Sou
thO
ttaw
a W
est
Num
ber
of tr
uck
trip
s an
d di
rect
ion
LE
GE
ND
70
7 N
umbe
r of
O-D
rsquos fo
r D
istr
ict
HU
LL
OR
IGIN
S A
ND
DE
ST
INA
TIO
NS
AL
L T
RU
CK
TR
IPS
B
GA
TIN
EA
U E
AS
T O
RIG
INS
AN
D D
ES
TIN
AT
ION
S A
LL
TR
UC
K T
RIP
S
D
GA
TIN
EA
U W
ES
T O
RIG
INS
AN
D D
ES
TIN
AT
ION
S A
LL
TR
UC
K T
RIP
S
C
AY
LM
ER
OR
IGIN
S A
ND
DE
ST
INA
TIO
NS
AL
L T
RU
CK
TR
IPS
A
Queacute
bec
Inte
rpro
vinc
ial R
oads
ideT
ruck
Sur
vey
RE
PO
RT
30
Queacute
bec
Ont
ario
Ont
ario
Queacute
bec
Queacute
bec
Ont
ario
Ont
ario
Ayl
mer
H
ull
Gat
inea
u W
est
Gat
inea
u E
ast
Otta
wa
Eas
t
IGB
Eas
t
Otta
wa
Cen
tral
IGB
Wes
t
Otta
wa
Sou
thO
ttaw
a W
est
Gat
inea
u E
ast
Gat
inea
u W
est
Hul
l
Ayl
mer
Otta
wa
Eas
t
IGB
Eas
t
Otta
wa
Cen
tral
IGB
Wes
t
Otta
wa
Sou
th
Otta
wa
Wes
t
Gat
inea
u E
ast
Gat
inea
u W
est
Hul
l
Ayl
mer
Otta
wa
Eas
t
IGB
Eas
t
Otta
wa
Cen
tral
IGB
Wes
t
Otta
wa
Sou
thO
ttaw
a W
est
EX
HIB
IT 1
9 O
RIG
IN-D
ES
TIN
AT
ION
DE
SIR
E L
INE
S 2
AX
LE
TR
UC
K T
RIP
S (
AU
TU
MN
200
0)
33
Ayl
mer
Hul
l Gat
inea
u W
est
Gat
inea
u E
ast
Otta
wa
Eas
t
IGB
Eas
t
Otta
wa
Cen
tral
IGB
Wes
t
Otta
wa
Sou
thO
ttaw
a W
est
Num
ber
of tr
uck
trip
s an
d di
rect
ion
LE
GE
ND
26
5 N
umbe
r of
O-D
rsquos fo
r D
istr
ict
HU
LL
OR
IGIN
S A
ND
DE
ST
INA
TIO
NS
2 A
XL
E T
RU
CK
TR
IPS
B
GA
TIN
EA
U E
AS
T O
RIG
INS
AN
D D
ES
TIN
AT
ION
S 2
AX
LE
TR
UC
K T
RIP
S
D
GA
TIN
EA
U W
ES
T O
RIG
INS
AN
D D
ES
TIN
AT
ION
S 2
AX
LE
TR
UC
K T
RIP
S
C
AY
LM
ER
OR
IGIN
S A
ND
DE
ST
INA
TIO
NS
2 A
XL
E T
RU
CK
TR
IPS
A
Queacute
bec
Inte
rpro
vinc
ial R
oads
ideT
ruck
Sur
vey
RE
PO
RT
31
Queacute
bec
Ont
ario
Ont
ario
Queacute
bec
Queacute
bec
Ont
ario
Ont
ario
Ayl
mer
H
ull
Gat
inea
u W
est
Gat
inea
u E
ast
Otta
wa
Eas
t
IGB
Eas
t
Otta
wa
Cen
tral
IGB
Wes
t
Otta
wa
Sou
thO
ttaw
a W
est
Gat
inea
u E
ast
Gat
inea
u W
est
Hul
l
Ayl
mer
Otta
wa
Eas
t
IGB
Eas
t
IGB
Wes
t
Otta
wa
Sou
th
Otta
wa
Wes
t
Gat
inea
u E
ast
Gat
inea
u W
est
Hul
l
Ayl
mer
Otta
wa
Eas
t
IGB
Eas
t
Otta
wa
Cen
tral
IGB
Wes
t
Otta
wa
Sou
thO
ttaw
a W
est
EX
HIB
IT 2
0 O
RIG
IN-D
ES
TIN
AT
ION
DE
SIR
E L
INE
S 3
+ A
XL
E T
RU
CK
TR
IPS
(A
UT
UM
N 2
000)
26
Ayl
mer
Hul
l Gat
inea
u W
est
Gat
inea
u E
ast
Otta
wa
Eas
t
IGB
Eas
t
Otta
wa
Cen
tral
IGB
Wes
t
Otta
wa
Sou
thO
ttaw
a W
est
Num
ber
of tr
uck
trip
s an
d di
rect
ion
LE
GE
ND
12
0 N
umbe
r of
O-D
rsquos fo
r D
istr
ict
HU
LL
OR
IGIN
S A
ND
DE
ST
INA
TIO
NS
3+
AX
LE
TR
UC
K T
RIP
S
B
GA
TIN
EA
U E
AS
T O
RIG
INS
AN
D D
ES
TIN
AT
ION
S 3
+ A
XL
E T
RU
CK
TR
IPS
D
G
AT
INE
AU
WE
ST
OR
IGIN
S A
ND
DE
ST
INA
TIO
NS
3+
AX
LE
TR
UC
K T
RIP
S
C
AY
LM
ER
OR
IGIN
S A
ND
DE
ST
INA
TIO
NS
3+
AX
LE
TR
UC
K T
RIP
S
A
Queacute
bec
Otta
wa
Cen
tral
Inte
rpro
vinc
ial R
oads
ideT
ruck
Sur
vey
RE
PO
RT
32
Queacute
bec
Ont
ario
Ont
ario
Queacute
bec
Queacute
bec
Ont
ario
Ont
ario
Ayl
mer
H
ull
Gat
inea
u W
est
Gat
inea
u E
ast
Otta
wa
Eas
t
IGB
Eas
t
Otta
wa
Cen
tral
IGB
Wes
t
Otta
wa
Sou
thO
ttaw
a W
est
Gat
inea
u E
ast
Gat
inea
u W
est
Hul
l
Ayl
mer
Otta
wa
Eas
t
IGB
Eas
t
IGB
Wes
t
Otta
wa
Sou
th
Otta
wa
Wes
t
Gat
inea
u E
ast
Gat
inea
u W
est
Hul
l
Ayl
mer
Otta
wa
Eas
t
IGB
Eas
t
Otta
wa
Cen
tral
IGB
Wes
t
Otta
wa
Sou
thO
ttaw
a W
est
EX
HIB
IT 2
1 O
RIG
IN-D
ES
TIN
AT
ION
DE
SIR
E L
INE
S T
RA
CT
OR
TR
AIL
ER
TR
IPS
(A
UT
UM
N 2
000)
65
Ayl
mer
Hul
l Gat
inea
u W
est
Gat
inea
u E
ast
Otta
wa
Eas
t
IGB
Eas
t
Otta
wa
Cen
tral
IGB
Wes
t
Otta
wa
Sou
thO
ttaw
a W
est
Num
ber
of tr
uck
trip
s an
d di
rect
ion
LE
GE
ND
32
3 N
umbe
r of
O-D
rsquos fo
r D
istr
ict
HU
LL
OR
IGIN
S A
ND
DE
ST
INA
TIO
NS
TR
AC
TO
R T
RA
ILE
R T
RIP
S
B
GA
TIN
EA
U E
AS
T O
RIG
INS
AN
D D
ES
TIN
AT
ION
S T
RA
CT
OR
TR
AIL
ER
TR
IPS
D
G
AT
INE
AU
WE
ST
OR
IGIN
S A
ND
DE
ST
INA
TIO
NS
TR
AC
TO
R T
RA
ILE
R T
RIP
S
C
AY
LM
ER
OR
IGIN
S A
ND
DE
ST
INA
TIO
NS
TR
AC
TO
R T
RA
ILE
R T
RIP
S
A
Queacute
bec
Otta
wa
Cen
tral
Inte
rpro
vinc
ial R
oads
ideT
ruck
Sur
vey
RE
PO
RT
33
85 Vehicle Loading and Commodities
The survey reported that 2075 trucks were carrying goods while 1375 trucks were empty for a total of 3450 trucks per day
Of those drivers responding to the type of commodity carried 185 different commodities were identified The commodities were grouped into eight categories A complete listing of the commodities and the group with which the commodity is categorized is provided in Appendix N14
A graphical and numerical representation of the frequency with which a particular commodity was identified as having been carried is provided subdivided into the three truck classifications in EXHIBIT 22 ndash GOODS CARRIED PER DAY
Also indicated on Exhibit 22 are the distributions of the truck classificationcommodity by time of travel [day (0700 to 1900) and night (1900 to 0700)]
The five most frequently reported commodities as illustrated in Exhibit 22 for all trucks are
x construction materials (475 trips)
x food and beverage (415 trips)
x general merchandise (360 trips)
x paper and paper products (310 trips)
x wood and wood products (195 trips)
Origin-destination trip tables have been prepared for those commodities for which it was deemed likely to provide some defined pattern of desire lines - construction materials general merchandise paperpaper products and woodwood products
The exclusion of the food and beverage category was based on the expected widely dispersed trip patterns associated with this category The purpose here is to highlight significant differences among the trip patterns associated with the major commodity groups and is not intended to influence the perception of anyone who will conduct a more thorough analysis of the data
The key characteristics for individual commodities are as follows
x for construction materials the dominance of the Aylmer to Ottawa Central trip pattern
14 Appendix N ndash Categories of Commodities Interprovincial Roadside Truck Survey REPORT 34
Exh
ibit
22G
oods
Car
ried
per
Day
EX
HIB
IT 2
2G
OO
DS
CA
RR
IED
E
XH
IBIT
22b
G
OO
DS
CA
RR
IED
PE
R D
AY
b
2 A
XL
E T
RU
CK
S
95
5
45
10
105
20
5
15
200
195
205
50
GO
OD
S C
AR
RIE
D
Otta
wa
Riv
er C
ross
ing
by T
ruck
Typ
e
(Au
tum
n 2
000)
3+ A
XL
E T
RU
CK
S
90
4
0
10 7
0
5
10
25
10
15
155
Com
mod
ity
1 =
Co
nst
ruct
ion
Mat
eria
ls
2 =
Fo
od
an
d B
ever
age
3 =
Gen
eral
Mer
chan
dis
e
4 =
Pap
er amp
Pap
er P
rod
uct
s
5 =
Wo
od
amp W
oo
d P
rod
uct
s
6 =
Pet
role
um
Ch
emic
als
7 =
Bu
sin
ess
Su
pp
lies
8 =
Au
to V
ehic
les
amp P
arts
Tru
cks
wit
h C
om
mo
dit
ies
Tru
cks
wit
ho
ut
Co
mm
od
itie
s
To
tal T
ruck
s
LE
GE
ND
Co
mm
od
ity
gro
up
ing
s
TO
TA
L
TR
AC
TO
R T
RA
ILE
RS
N
o
Day
470
285
260
205
150
90
105
55
1620
1090
2710
Nig
ht
5
130
100
105
45
55
15
455
285
740
24H
115
5
50
30
55
40
105
75
35
20
30
35
10
1 2 3
90
4 5 6 7 8
50
100
150
200
25
0 30
0 5
0 1
00 1
50
Num
ber
of tr
ucks
N
umbe
r of
tru
cks
Day
N
ight
(2
4H)
Day
N
ight
(2
4H)
870
170
1040
29
5 4
5
340
385
125
510
465
75
54
0
1255
29
5 15
50
760
120
880
50
100
150
200
N
umbe
r of
tru
cks
Day
N
ight
(2
4H)
455
240
695
240
85
325
695
325
1020
1 =
Con
stru
ctio
n M
ater
ials
( d
ryw
allc
oncr
ete
win
dow
s tr
usse
s)
5 =
Woo
d amp
Woo
d P
rodu
cts
( lu
mbe
r lo
gs c
hip
boar
d )
2 =
Foo
d an
d B
ever
age
(pro
cess
ed fo
od a
nd b
ever
age)
6
= P
etro
leum
Che
mic
als
( ga
solin
efu
els
altl
ime)
3
= G
ener
al M
erch
andi
se (
mix
ed fr
eigh
t fu
rnitu
re b
oxes
) 7
= B
usin
ess
Sup
plie
s (
prin
ting
supp
lies
offi
ce fu
rnitu
re g
over
nmen
t rec
ords
)
4 =
Pap
er amp
Pap
er P
rodu
cts
( pa
per
new
sprin
t to
ilet p
aper
) 8
= A
uto
Veh
icle
s amp
Par
ts (
car
s a
uto
part
s ti
res)
Day
tim
e (
700
- 1
900
)
Nig
ht ti
me
( 19
00
- 7
00)
3450
2075
1375
105
70
195
145
360
310
475
415
Inte
rpro
vinc
ial R
oads
ide
Truc
k S
urve
y
RE
PO
RT
35
x for general merchandise the expected widely dispersed trip patterns
x for paperpaper products the dominant interchange of trips between Hull and Ottawa (both East and West) and between Gatineau East and Ottawa South
x for woodwood products the dominance of the Aylmer and Gatineau West trips to Ottawa South
Additional information on commodity patterns is presented in Appendix O15
EXHIBIT 23 -DAILY COMMODITY FLOW - MACDONALD-CARTIER BRIDGE and EXHIBIT 24 -DAILY COMMODITY FLOW - CHAUDIEgraveRE BRIDGE illustrates commodity flow for each bridge by the three truck classifications and by the type of commodity carried (including empty trucks) Of particular interest is
x the proportion of tractor trailers in the truck stream on the Macdonald-Cartier Bridge (34) compared to the Chaudiegravere Bridge (17)
x the approximately equal proportions of 3+ axle trucks in the truck stream on each of the Macdonald-Cartier Bridge and Chaudiegravere Bridge
x the proportion of trucks carrying petroleumchemical products hauled by 3+ axle trucks is 13 and by tractor trailers is 11 on the Chaudiegravere Bridge
x the proportion of the tractor trailer trucks hauling paper products is 19 on the Macdonald-Cartier and 17 on the Chaudiegravere Bridge
x the proportion of tractor trailer trucks carrying wood products on the Macdonald-Cartier Bridge is 12
x the proportion of the empty trucks notably the 3+ axle trucks is 64 on the Macdonald-Cartier and 54 on the Chaudiegravere Bridge as discussed in Section 72
15 Appendix O ndash Trip Origins and Destinations for Specific Commodities and Detailed Comments Interprovincial Roadside Truck Survey REPORT 36
Exhibit 23 Daily Commodity Flow Macdonald-Cartier Bridge
EXHIBIT 23 COMMODITY FLOW
- MACDONALD-CARTIER BRIDGE
( 1025 )
b b b
Construction Materials 16
Food amp Beverage
19
General Merchandise 18
Empty 28
Paper Products 10
Business Supplies 6
AutoVehicles amp Parts
1
PetroleumChemicals 2
2 Axles 40
3 Axles 26
( 680 )
Tractor Trailers 34
( 870 )
General Merchandise
Food amp Beverage 6
Empty 64
Construction Materials 16
1
PetroleumChemicals 2
Wood Products 11
Food amp Beverage
12
Construction Materials 12
Paper Products 19
Empty 30
8
General Merchandise
10
AutoVehicles amp Parts
5
Wood Products PetroleumChemicals
4
2580 Trucks
( 1030 )
EXHIBIT 23b DAILY COMMODITY FLOWb
-MACDONALD-CARTIER BRIDGEb
(Autumn 2000)
Exhibit 24 Daily Commodity Flow Chaudiegravere Bridge
520
EXHIBIT 24 COMMODITY FLOW- CHAUDIEgraveRE BRIDGE
( 525 )
2 Axles 60
3 Axles 23
(200 )
Tractor Trailers 17
( 150 )
Construction Materials 6 Food amp Beverage
17 Empty 45
Paper Products
2
General Merchandise 14
Business Suppl ies
8
AutoVehicles amp Parts
2
Wood Products
1
Petroleum Chemicals
5
Construction Materials 22
Food amp Beverage 5
Empty 54
PetroleumChemicals 13
Wood Products 3
Paper Products 3
Food amp Beverage 6
Paper Products 17
Empty 40
Construction Materials 14
General Merchandise 8
Petroleum Chemicals
11 Wood Products
3
AutoVehicles amp Parts
1
870 Trucks
b b b
EXHIBIT 24b DAILY COMMODITY FLOWb
-CHAUDIEgraveRE BRIDGEb
(Autumn 2000)
520
Interprovincial Roadside Truck Survey
REPORT 37
90 SUMMARY
Information in this report is presented at the most aggregate level with the purpose of developing a good understanding of the interprovincial trip patterns origins destinations and characteristics of trucks in Canadarsquos Capital Region This report is not intended to deal with specific interprovincial transportation issuess Detailed analysis of the comprehensive data base would be necessary to assess the impact of new or improved infrastrucure on interprovincial truck traffic and would be a prerequisite for reaching any meaningful conclusions regarding future interprovincial transport needs
The 1999 2000 Interprovincial roadside truck survey provides
bull An effective database of high quality strong and meaningful information for application in future transportation planning activities
bull The basis for a more thorough understanding of interprovincial truck movements
bull An efficient means of evaluating costs and benefits in assessing alternative solutions to interprovincial truck travel issuess
bull A thorough understanding of the interprovincial movement patterns origins and destinatioons and characteristics of heavy trucks in the National Capital Region
Interprovincial Roadside Truck Survey
REPORT 38
100 LIST OF APPENDICES The 19992000 Interprovincial Roadside Truck Survey Technical Appendiceshave been bound separately and contain the following
Appendix A Survey Database Fields
Appendix B Heavy Truck Classification System
Appendix C Summary of Historical Ottawa River Crossing Truck Traffic Volumes
Appendix D Time Period Relationships
Appendix E Traffic Zones Comprising the Districts
Appendix F ldquoDistrictrdquo Comparison of Trucks by Number
Appendix G ldquoDistrictrdquo Comparison of Trucks by Percent
Appendix H Survey Expansion Factors
Appendix I Trip Characteristics
Appendix J Origin and Destination of Truck Trips by Direction
Appendix K Concentration of Truck Trip Ends
Appendix L Tabulations of Trip Origins-Destinations by Truck Classification
Appendix M Detailed Comments on Trip Origins and Destinations
Appendix N Categories of Commodities
Appendix O Trip Origins and Destinations for Specific Commodities and Detailed Comments
Interprovincial Roadside Truck Survey REPORT 39
19992000INTERPROVINCIAL
ROADSIDE TRUCK SURVEY TECHNICAL APPENDICES
ENQUEcircTE ROUTIEgraveRE INTERPROVINCIALE SUR LE CAMIONNAGE 19992000 ANNEXES
McLean Transportation Engineering Consultants Ltd
TRANS MEMBER AGENCIES
National Capital Commission
Mr Arto KeklikianCapital Planning and Real Asset Management
Ministegravere des Transports Queacutebec
Monsieur Ghislain CoutureDirection reacutegionale de lrsquoOutaouais
Ministry of Transportation Ontario
Mr James WongTransportation Planning Branch
Ville de Gatineau
Monsieur Paul-Andreacute Roy Service Urbanisme
City of Ottawa
Mr Don Stephens PEng ( Manager TRANS Programme ) Planning Environment and Infrastructure Policy
Mr Rob Calladine Planning Environment and Infrastructure Policy
Socieacuteteacute de transport de lOutaouais
Monsieur Salah Barj Service Strateacutegies et Deacuteveloppement
Monsieur Carmel Dufour Service Strateacutegies et Deacuteveloppement
OCTranspo
Mr Colin LeechService Planning Department
19992000INTERPROVINCIAL ROADSIDE
TRUCK SURVEY
TECHNICAL APPENDICES
Prepared for
TRANS A Joint Technical Committee on Transportation Systems Planning
By
McLean Transportation Engineering Consultants Ltd
June 2002
LIST OF APPENDICES
Appendix A Survey Database Fields 1
Appendix B Heavy Truck Classification System 52
Appendix C Summary of Historical Ottawa River Crossing Truck Traffic Volumes 54
Appendix D Time Period Relationships 56
Appendix E Traffic Zones Comprising the Districts 58
Appendix F District Comparisons of Trucks by Number 61
Appendix G District Comparisons of Trucks by Percent 70
Appendix H Survey Expansion Factors 73
Appendix I Trip Characteristics 75
Appendix J Origins and Destinations of Truck Trips by Direction 77
Appendix K Concentration of Truck Trip Ends 79
Appendix L Tabulations of Trip Origins and Destinations by Truck Classification 83
Appendix M Detailed Comments on Trip Origins and Destinations 85
Appendix N Categories of Commodities 88
Appendix O Trip Origins and Destinations for Specific Commoditiesand Detailed Comments 98
Interprovincial Roadside Truck Survey Technical Appendices i
Appendix A Survey Database Fields
Interprovincial Roadside Truck Survey Technical Appendices 1
SURVEY DATABASE FIELDS-DETAILEDINFORMATION
(Same as 1999 NRS)
Answer Output Database
Note This version of the description includes the field and answer changes made in July 1999 when the questionnaire was shortened
Each record in the answer output database contains the answers collected from one questionnaire The fields of the database which is named STUDYDBF are explained in the table at the end of this appendix For each field the table lists the following information
Reference A cross-reference between the field and other documents bull Questionnaire A code of format cnn that denotes the question on the 1999
Questionnaire to which the field corresponds where bull c is the section of the questionnaire (eg section ldquoBrdquo is the
Scope section) and bull nn is the question number in the section (eg rdquo01rdquo ldquo02rdquo
etc) bull
Field Field specification bull Name A code of format ldquoaaabbbbbbbrdquo where
bull ldquoaaardquo is the number of the question on the 1999 Questionnaire to which the field corresponds (the same number ldquocnnrdquo as discussed above except that the ldquordquo is not included) and
bull ldquobbbbbbbrdquo represents 1 or more words that describe the related question and the field contents The following rules are applied when creating ldquobbbbbbbrdquo
bull A word is presented in full or as a short form the short form being
bull the first 1 letter bull the first 3 letters or bull the first 6 letters
bull ldquoSrdquo as the last letter usually means that the field marks the ldquostatusrdquo of the contents of another field
bull ldquoDrdquo as the last letter usually means that the field contains a hand-written ldquodescriptionrdquo that has been entered because the predetermined list of answers does not capture the actual answer
bull ldquoUrdquo as the last letter usually means that the field records the ldquounits of measurementrdquo that apply to the contents of another field
bull Type Type of information stored (N=numeric C=character L=logic ldquoDrdquo=Date)
bull Length Length of the field (total number of digits or characters (including the ldquordquo used for floating point numbers but excluding the ldquordquo that appears in dates)
bull Decimals Number of digits after the decimal point (valid only for a numeric field)
Interprovincial Roadside Truck Survey Technical Appendices 2
bull Index Whether the field is used in an index (N=no Y=yes) Information A description of the field and the values that can legitimately appear in the
field Whether Question Depends Flags cases where the question pertaining to the field is conditional The on Previous Answers question may be active (asked) or inactive (skipped) depending on the
answers to previous questions The actual dependency relationships are described in Appendix F
Whether Answer is Flags cases where the answer in numeric fields is checked for plausibility Checked for Plausibility against criteria The actual plausibility checks are described in
Appendix G
Following are notes on various aspects of the table
Concerning Field Order The order in which the fields are listed in the table matches the order of the questions on the questionnaire to which the fields relate The software internal fields (fields used by the software that are not related to particular questions) are listed at the beginning of the table
Concerning Answer Codes There are several codes used in answers that are reserved for specific situations (to the extent possible) These are listed below
Reserved Answer Codes Code Meaning of Answer
When Field is When Field is Numeric Alphanumeric
95 Other (the answer is not one of the choices specifically identified by the question)
96 X Not Applicable (the question was not asked because it was not applicable) 97 T Terminated (driver terminated interview before this question could be
asked) 98 R Refused (driver refused to answer this question) 99 D Donrsquot Know (driversurveyor did not know the answer to the question)
Concerning the Usability of the Record The state of a record is marked by answers stored in 2 fields These answers are used to identify whether the record contains a valid observation for the NRS
bull QTYPE -- This marks whether the record was generated by a ldquoliverdquo questionnaire (actual observation of a truck that is part of the NRS data collection) or by a ldquopracticerdquo questionnaire (completed for training purposes)
bull QSTATUS -- This marks whether the record was ldquostudy usablerdquo (questionnaire completed by answering the necessary questions (specifically the ldquoConfirm Completionrdquo screen was reached)) ldquoabandoned (questionnaire not completed by surveyorrsquos choice to use ldquoabandonmentrdquo button) or ldquofailurerdquo (questionnaire not completed because of computer malfunction)
Concerning Date and Time Stamp Fields Certain fields contain dates and times that are entered automatically by the QS using values from the handheld computerrsquos internal clock Values are entered into these fields only during the original entry of answers session with the
Interprovincial Roadside Truck Survey Technical Appendices 3
questionnaire During subsequent editing of answers sessions with the questionnaire the date and time fields are not changed by the QS and can not be changed by the surveyor with the exception of the A05QSDATE A06HOUR and A06MIN field values The date and time stamp fields are described below
bull A05QSDATE A06HOUR A06MIN -- These contain the datetime at which the questionnaire was started Specifically the datetime at which the QS reached the first screen of the Scope section of the questionnaire (the screen that asks if the truck is a cargo type etc) The purpose of this datetime is to mark when the truck was observed The values are automatically entered by the QS but the values can be edited by the surveyor during the original entry of answers session or during subsequent editing of answers sessions
bull PA05QSDATE PA06HOUR PA06MIN -- These permanently contain the first values that were automatically entered by the QS to A05QSDATE A06HOUR and A06MIN
bull QEDATE QEHOUR QEMINUTE -- These contain the datetime at which the original entry of answers session ended Specifically the datetime at which the QS passed the ldquoConfirm Completionrdquo screen
bull ISTDATE ISTHOUR ISTMINUTE -- These contain the datetime at which the driver interview started Specifically the datetime at which the QS reached the first screen of the Interview Start section of the questionnaire (the screen that asks for the drivers participationrefusal)
bull IENDDATE IENDHOUR IENDMINUTE -- These contain the datetime at which the driver interview ended Specifically the datetime at which the QS exits the driver interview sections of the survey by the surveyor either (1) pressing the End Survey button option on any of the screens or (2) pressing the Next Screen button after completing the last screen (the screen that asks about the drivers recent training)
Concerning Geographic Coordinates Format bull Longitude -- Longitude is expressed in decimal degrees The values range from -180
to +180 A positive value denotes a location west of the prime meridian A negative value denotes a location east of the prime meridian
bull Latitude -- Latitude is expressed in decimal degrees The values range from -90 to +90 A positive value denotes a location in the northern hemisphere A negative value denotes a location in the southern hemisphere
Concerning Out-of-Scope Trucks Trucks in the scope of the NRS are heavy cargo trucks which are defined as trucks
bull of a type normally used to move cargo from one point to another point bull that meets the definition of commercial vehicle under the National Safety Code
(meaning a truck tractor or combination thereof with a registered gross vehicle weight greater than 4500 kilograms)
Interprovincial Roadside Truck Survey Technical Appendices 4
Concerning the size of a heavy truck the following two practical definitions will be used bull To facilitate visual identification heavy trucks will consist of trucks that have 6 or
more tires bull To facilitate identification by automatic vehicle classifier equipment that use vehicle
length as the basis for differentiating between sizes of vehicle heavy trucks will consist of trucks that are longer than 20 feet
Therefore trucks are out of the scope of the NRS for the following reasons bull Light trucks of 4500 kilograms or less which is defined as any straight truck with 4
tires (with or without a trailer) bull Non-cargo type trucks which include
bull mobile machines (any straight truck without a trailer that has a permanently attached machine (ie the truck exists to move the machine around) -shyexamples include
bull crane bull drill rig bull seismic rig bull boomcherry pickerladder bull curbroadsidewalk cutter bull concrete pump bull rock crusher bull carnival ride
bull emergency truck -- examples include bull fire truck bull ambulance bull police vehicle
bull service truck -- examples include bull hydro truck bull road painter bull snow plow bull road sweeper
bull a tow truck (with or without vehicle) that moves a vehicle by means of a slinghook mounted at the back (ie some of the vehicles wheels are on the road)
But if any of the above listed trucks has a trailer attached that can be used to carry cargo then the truck is a cargo truck for the purposes of the NRS For example a hydro service truck that is pulling a trailer loaded with telephone poles is a cargo truck
Note that cargo truck includes bull any tractor pulling a trailer regardless of the trailer (for example the trailer could be a
permanently attached machine) bull a concrete mixer and bull a sewer cleaning truck if it has a holding tank
Interprovincial Roadside Truck Survey Technical Appendices 5
Concerning Definition of a Trip -- Refer to Reference 6
Concerning Border Crossings -- Refer to Reference 6
Interprovincial Roadside Truck Survey Technical Appendices 6
Answer Output Database Fields Reference Field Information
Questi- Name Type Length onnaire Decimals Index
Z Software Internal Fields (not related to questions on the Study Questionnaire) QID C 8 0 N Questionnaire IDentifier -- Uniquely identifies one
questionnaire among all questionnaires generated on all computers used in the NRS
QSTATUS C 1 0 N Questionnaire STATUS -- Marks whether the ldquonecessaryrdquo questions were completed in the original entry of answers session S = Study usable (completed) A = Abandoned (not completed -- ldquoabandonrdquo button used) F = Failure (did not pass ldquoConfirm Completionrdquo screen)
QTYPE C 1 0 N Questionnaire Type -- Marks why the questionnaire was entered L = Live (actual observation of a truck for the NRS) P = Practice (training)
DISTATUS C 1 0 N Driver Interview STATUS -- Marks whether all the driver interview questions were asked (conversely whether the driver terminated the interview) A = All questions asked I = Incomplete interview (driver terminated before all questions asked)
DILAST C 3 0 N Driver Interview LAST questions completed -shyIdentifies the last screen of questions completed before the driver terminated the interview blank = not applicable (driver interview not terminated) ccc = section letter and tab number for the last screen with all answers completed (eg ldquoF02rdquo)
PA01JUR C 4 0 N Permanent copy of the original value of A01JUR PA02SITE C 8 0 N Permanent copy of the original value of A02SITE PA02DCSSEL C 75 0 N Permanent copy of the original value of A02DCSSEL PA04DIRECT C 1 0 N Permanent copy of the original value of A04DIRECT PA05QSDATE D 8 0 N Permanent copy of the original value of A05QSDATE PA06QSHOUR N 2 0 N Permanent copy of the original value of
A06QSHOUR PA06QSMIN N 2 0 N Permanent copy of the original value of A06QSMIN QEDATE D 8 0 N Questionnaire End DATE -- When questionnaire
completed Format YYYYMMDD See description of date and time fields that precedes this table
QEHOUR N 2 0 N Questionnaire End HOUR -- When questionnaire completed Format 24 hour clock See description of date and time fields that precedes this table
QEMINUTE N 2 0 N Questionnaire End MINUTE -- When questionnaire completed See description of date and time fields that precedes this table
Interprovincial Roadside Truck Survey Technical Appendices 7
Answer Output Database Fields Reference Field Information
Questi- Name Type Length onnaire Decimals Index
ISTDATE D 8 0 N Interview STart DATE - When driver interview section of questionnaire started Format YYYYMMDD See description of date and time fields that precedes this table
ISTHOUR N 2 0 N Interview SSart HOUR - When driver interview section of questionnaire started Format 24 hour clock See description of date and time fields that precedes this table
ISTMINUTE N 2 0 N Interview STart MINUTE - When driver interview section of questionnaire started See description of date and time fields that precedes this table
IENDDATE D 8 0 N Interview END DATE - When driver interview sections of questionnaire completed Format YYYYMMDD See description of date and time fields that precedes this table
IENDHOUR N 2 0 N Interview END HOUR - When driver interview sections of questionnaire completed Format 24 hour clock See description of date and time fields that precedes this table
IENDMINUTE N 2 0 N Interview END MINUTE - When driver interview sections of questionnaire completed See description of date and time fields that precedes this table
XOBSERV L 1 0 N Questionnaire Observations Section F (or 0) = not started T (or 1) = partially or completely filled in
XSCOPE L 1 0 N Scope Section Results -- Whether truck is in-scope F (or 0) = not-in-scope T (or 1) = in-scope
XWEIGHTS L 1 0 N Questionnaire Weights and Measures Section Same answers as for Questionnaire Observations Section
A Identification Section A01 A01JUR C 4 0 N JURisdiction -- Provinceterritory in which DCS is
located The codes are listed in Appendix H A02 A02SITE C 8 0 N SITE ID -- Unique identifier assigned to the DCS
The codes are listed in Appendix H Note Identifier is filled automatically by the computer when DCSSEL is selected from the pick-list
A02 A02DCSSEL C 75 0 N DCS SELector -- Specification of the DCS that is used for selection (the pick-list entry) Format DCS name + traffic direction description
A02 A02DCSLON N 11 6 N DCS LONgitude -- Longitude of the DCS Format defined in description of geographic coordinates that precedes this table Note Longitude is filled automatically by the computer when DCSSEL is selected from the pick-list
Interprovincial Roadside Truck Survey Technical Appendices 8
Answer Output Database Fields Reference Field Information
Questi- Name Type Length onnaire Decimals Index A02 A02DCSLAT N 11 6 N DCS LATitude -- Latitude of the DCS Format
defined in description of geographic coordinates that precedes this table Note Latitude is filled automatically by the computer when DCSSEL is selected from the pick-list
A03 A03SURVEY C 3 0 N SURVEYor - ID assigned to the surveyor filling-in the questionnaire Unique at the DCS
A04 A04DIRECT C 1 0 N DIRECTion -- Direction of traffic being interviewed at DCS N = Northbound E = Eastbound S = Southbound W = Westbound
A05 A05QSDATE D 8 0 N Questionnaire Start DATE -- When questionnaire started Format YYYYMMDD See description of date and time fields that precedes this table
A06 A06QSHOUR N 2 0 N Questionnaire Start HOUR -- When questionnaire started Format 24 hour clock See description of date and time fields that precedes this table
A06 A06QSMIN N 2 0 N Questionnaire Start MINute -- When questionnaire started See description of date and time fields that precedes this table
B Scope Section B01 B01CARTYP C 1 0 N CARgo TYPe truck -- Whether the type of truck or
type of truck body is capable of carrying cargo or usually used for carrying cargo Y = Yes N = No Note ldquoNrdquo marks an out-of-scope truck Note See description of out-of-scope trucks that precedes this table
B02 B02OOSTYP C 20 0 N Out-Of-Scope truck TYPe blank = not applicable (truck is cargo type) something = description of the non-cargo type truck Note See description of out-of-scope trucks that precedes this table
B03 B03STR4T C 1 0 N STRaight truck with 4 Tires -- Whether truck is a straight truck with 4 tires (with or without a trailer) Y = Yes N = No Note ldquoYrdquo marks an out-of-scope truck
Interprovincial Roadside Truck Survey Technical Appendices 9
Answer Output Database Fields Reference Field Information
Questi- Name Type Length onnaire Decimals Index B04 B04AXLOOS N 2 0 N AXLes on Out-Of-Scope truck -- Number of axles on
the truck if it is out-of-scope (all axles on the straight trucktractor and trailers) 2 to 12 = number of axles 96 = not applicable (truck is in-scope)
C Observations Section C01 C01CONF N 2 0 N CONFiguration of truck -- Type of configuration
1 = tractor amp 1 trailer 2 = tractor amp 2 trailers 3 = tractor amp 3 trailers 4 = straight truck 5 = straight truck amp trailer 6 = tractor only 95 = other Note Type ldquo6rdquo applies only if the tractor is ldquobob tailrdquo If a tractor is towingcarrying other tractors or if tractor is towingcarrying trucks or if a tractor is carrying a trailer piggyback then the type is ldquo95rdquo Note Type ldquo95rdquo covers tractor towingcarrying other tractors tractor towingcarrying a truck and tractor carrying a trailer piggyback Note A jeepbooster used to support heavy loads is treated as part of the trailer
C02 C02CONFD C 20 0 N CONFiguration Description blank = not applicable (truck fits a predefined configuration) something = description of the ldquootherrdquo configuration
C03 C03HITCH C 1 0 N HITCH -- Type of connection used to join the 1st and 2nd trailer in a truck train (a tractor pulling 2 or 3 trailers) A = A train B = B train C = C train X = not applicable (not truck train)
C04 C04CAB C 1 0 N CAB style -- Type of the driver cab C = Conventional (long nose or cab after engine) O = cab-Over-engine
Interprovincial Roadside Truck Survey Technical Appendices 10
Answer Output Database Fields Reference Field Information
Questi- Name Type Length onnaire Decimals Index C05 C05BODY1 N 2 0 N BODY 1 style -- Classification of the style or
intended freight or intended use of the 1st cargo unit of the truck The 1st cargo unit is either a straight truck the first trailer pulled by a tractor or a tractor without a trailer 1 = van -- not refrigerated 2 = van -- refrigerated 3 = container carrier 4 = van -- soft sided 5 = flatbed 6 = stakerack 7 = float 8 = tanker 9 = hopper 10 = dump 11 = chip 12 = garbage truck 13 = vehicle carrier 14 = animal carrier 15 = none (applies only when the truck consists of a ldquobob tailrdquo tractor that is a tractor neither pulling a trailer nor towingcarrying other tractors) 95 = other Note Concerning the assignment of unusual body styles bull a flatbed or stakerack with a mounted loading
crane as a ldquoflatbedrdquo or ldquostakerackrdquo bull a deckless frame used to carry logspolls as a
stakerack bull a glass carrier as other bull a boat carrying frame as other bull a permanently attached machine as other bull a concrete mixer as other bull a sewer cleaner as other (a sewer cleaning
truck would be in-scope if it had a holding tank would be out-of-scope if it was only a pump)
bull a pick-up truck box as other C06 C06BODY1D C 20 0 N BODY 1 style Description
blank = not applicable (1st cargo unit fits predefined style) something = description of ldquootherrdquo style of 1st cargo unit
Interprovincial Roadside Truck Survey Technical Appendices 11
Answer Output Database Fields Reference Field Information
Questi- Name Type Length onnaire Decimals Index C07 C07BODY2 N 2 0 N BODY 2 style -- Classification of the style or
intended freight or intended use of the 2nd cargo unit of the truck The 2nd cargo unit is either the trailer pulled by a straight truck or the 2nd trailer pulled by a tractor 1 = van -- not refrigerated 2 = van -- refrigerated 3 = container carrier 4 = van -- soft sided 5 = flatbed 6 = stakerack 7 = float 8 = tanker 9 = hopper 10 = dump 11 = chip 12 = garbage truck 13 = vehicle carrier 14 = animal carrier 15 = none (no such unit on the truck) 95 = other Note See note under BODY 1 style
C08 C08BODY2D C 20 0 N BODY 2 style Description blank = not applicable (2nd cargo unit fits predefined style or no 2nd cargo unit) something = description of ldquootherrdquo style of 2nd
cargo unit C09 C09BODY3 N 2 0 N BODY 3 style -- Classification of the style or
intended freight or intended use of the 3rd cargo unit of the truck The 3rd cargo unit is the 3rd trailer pulled by a tractor 1 = van -- not refrigerated 2 = van -- refrigerated 3 = container carrier 4 = van -- soft sided 5 = flatbed 6 = stakerack 7 = float 8 = tanker 9 = hopper 10 = dump 11 = chip 12 = garbage truck 13 = vehicle carrier 14 = animal carrier 15 = none (no such unit on the truck) 95 = other Note See note under BODY 1 style
Interprovincial Roadside Truck Survey Technical Appendices 12
Answer Output Database Fields Reference Field Information
Questi- Name Type Length onnaire Decimals Index C10 C10BODY3D C 20 0 N BODY 3 style Description
blank = not applicable (3rd cargo unit fits predefined style or no 3rd cargo unit) something = description of ldquootherrdquo style of 3rd
cargo unit C11 C11LIGHTS C 1 0 N LIGHTS on -- Whether the headlights are on
Y = Yes N = No X = not applicable Note ldquoNot applicablerdquo because the question was not asked after being eliminated from the questionnaire
C12 C12SLEEP C 1 0 N SLEEPer -- Whether the tractorstraight truck has a sleeper (a compartment immediately behind the driver cab that contains a bed) Y = Yes N = No
C13 C13DROME C 1 0 N DROME -- Whether the tractor has a drome (a box for carrying cargo that is mounded on a tractor in front of the fifth wheel) Y = Yes N = No
C14 C14REFLEC C 1 0 N REFLECTive markers -- Whether the truck has reflective markers on the back and sites (reflective tape on the edges that increases truck visibility at night) Y = Yes N = No
C15 C15UNDER C 1 0 N UNDER-ride guard -- Whether the truck has a rear under-ride guard (beam that prevents a car from sliding under the back of the truck) Y = Yes N = No
C16 C16DGP1 N 2 0 N Dangerous Goods Placard 1 -- If there is at least 1 dangerous goods placard or placard holder what is onin the 1st placardplacard holder 1 to 9 = class marked on placard 10 = placard holder is empty 11 = no such placard or holder 95 = other class (not 1 through 9) 96 = not applicable 99 = unable to determine class Note ldquoNot applicablerdquo because the question was not asked after being eliminated from the questionnaire
Interprovincial Roadside Truck Survey Technical Appendices 13
Answer Output Database Fields Reference Field Information
Questi- Name Type Length onnaire Decimals Index C17 C17DGP2 N 2 0 N Dangerous Goods Placard 2 -- If there are at least 2
dangerous goods placards or placard holders what is onin the 2nd placardplacard holder 1 to 9 = class marked on placard 10 = placard holder is empty 11 = no such placard or holder 95 = other class (not 1 through 9) 96 = not applicable 99 = unable to determine class Note ldquoNot applicablerdquo because the question was not asked after being eliminated from the questionnaire
C18 C18DGP3 N 2 0 N Dangerous Goods Placard 3 -- If there are at least 3 dangerous goods placards or placard holders what is onin the 3rd placardplacard holder 1 to 9 = class marked on placard 10 = placard holder is empty 11 = no such placard or holder 95 = other class (not 1 through 9) 96 = not applicable 99 = unable to determine class Note ldquoNot applicablerdquo because the question was not asked after being eliminated from the questionnaire
C19 C19FLPJURS C 1 0 N Front Licence Plate JURisdiction Status -- Whether the identity of the jurisdiction (Canadian province territory US state Mexico) that issued the front licence plate of the straight truck or tractor is available Y = Yes N = No (unable to read)
C19 C19FLPJUR C 4 0 N Front Licence Plate JURisdiction -- The jurisdiction that issued the front licence plate blank = not available (see status field) cccc = jurisdiction code The codes are listed in Appendix H Note If a truck has 2 or more places select according to the following reules bull first choice -- a plate issued by the province in
which the DCS is located bull second choice -- the left most plate (driver side
plate) if plates are arranged horizontally and the top plate if plates are arranged vertically
C20 C20FLPNUMS C 1 0 N Front Licence Plate NUMber Status -- Whether the number on the front licence plate is available Y = Yes N = No (unable to read) X = not applicable Note ldquoNot applicablerdquo because the question was not asked after being eliminated from the questionnaire
Interprovincial Roadside Truck Survey Technical Appendices 14
Answer Output Database Fields Reference Field Information
Questi- Name Type Length onnaire Decimals Index C20 C20FLPNUM C 7 0 N Front Licence Plate NUMber -- The number on the
front licence plate blank = not available (see status field) ccccccc = number
C21 C21RLPJURS C 1 0 N Rear Licence Plate JURisdiction Status -- Whether the identity of the jurisdiction (Canadian province territory US state Mexico) that issued the rear licence plate on the last trailer of the truck is available Y = Yes N = No (unable to read) X = not applicable Note ldquoNot applicablerdquo if no trailer or because the question was not asked after being eliminated from the questionnaire
C21 C21RLPJUR C 4 0 N Rear Licence Plate JURisdiction -- The jurisdiction that issued the rear licence plate blank = not availableapplicable (see status field) cccc = jurisdiction code The codes are listed in Appendix H
C22 C22RLPNUMS C 1 0 N Rear Licence Plate NUMber Status -- Whether the number on the rear licence plate is available Y = Yes N = No (unable to read) X = not applicable Note ldquoNot applicablerdquo if no trailer or because the question was not asked after being eliminated from the questionnaire
C22 C22RLPNUM C 7 0 N Rear Licence Plate NUMber -- The number on the rear licence plate blank = not availableapplicable (see status field) ccccccc = number
C23 C23COMNAMS C 1 0 N COMpany NAMe Status -- Whether there is a truck company name on the driver door of the straight truck or tractor Y = Yes N = No X = not applicable Note ldquoNot applicablerdquo if jurisdiction containing the DCS does not require that the question be asked
C23 C23COMNAM C 50 0 N COMpany NAMe -- Truck company name on the driver door blank = not applicable (see status field) something = company name
Interprovincial Roadside Truck Survey Technical Appendices 15
Answer Output Database Fields Reference Field Information
Questi- Name Type Length onnaire Decimals Index C23 C23COMID C 10 0 N COMpany name ID -- Unique identifier assigned to
the record containing the company name blank = not applicable (see status field) something = identifier Note Identifier is filled automatically by the computer but only if the company name is selected from the pick-list
C24 C24LOCH1 N 2 0 N LOCation of Hitch 1 -- Point on the straight truck or tractor where the 1st trailer connects 237 = sequence number assigned to the axle group related to the connection 96 = not applicable (no trailers) Note The location point is identified by specifying the axle group above which or immediately after which the trailer hitch or king pin connects
C24 C24LOCH2 N 2 0 N LOCation of Hitch 2 -- Point on the first trailer where the 2nd trailer connects 347 = sequence number assigned to the axle group related to the connection 96 = not applicable (no 2nd trailer)
C24 C24LOCH3 N 2 0 N LOCation of Hitch 3 -- Point on the second trailer where the 3rd trailer connects 457 = sequence number assigned to the axle group related to the connection 96 = not applicable (no 3rd trailer)
C25 C25AXLAG1 N 1 0 N AXLes in Axle Group 1 -- Number of axles in the 1st
group of axles on the truck 12 = number of axles Note Axle groups are numbered sequentially beginning at the front of the truck Note An axle group consists of 1 2 3 or 4 axles Each axle on the truck is assigned to a group Two or more axles are assigned to the same group if they are closely spaced and attached to the truck in such a way that each axle is carrying approximately the same load Each axle on the truck is assigned to a group though
C25 C25AXLAG2 N 1 0 N AXLes in Axle Group 2 -- Number of axles in the 2st
group of axles on the truck 12 = number of axles
C25 C25AXLAG3 N 2 0 N AXLes in Axle Group 3 -- Number of axles in the 3rd group of axles on the truck 0 = not applicable (no 3rd group) 12 = number of axles
C25 C25AXLAG4 N 2 0 N AXLes in Axle Group 4 --Same answers as for AXLes in Axle Group 3
C25 C25AXLAG5 N 2 0 N AXLes in Axle Group 5 --Same answers as for AXLes in Axle Group 3
C25 C25AXLAG6 N 2 0 N AXLes in Axle Group 6 --Same answers as for AXLes in Axle Group 3
Interprovincial Roadside Truck Survey Technical Appendices 16
Answer Output Database Fields Reference Field Information
Questi- Name Type Length onnaire Decimals Index C25 C25AXLAG7 N 2 0 N AXLes in Axle Group 7 --Same answers as for
AXLes in Axle Group 3 C25 C25AXLAG8 N 2 0 N AXLes in Axle Group 8 --Same answers as for
AXLes in Axle Group 3 C25 C25AXLALL N 2 0 N AXLes ALL -- Total number of axles on the truck
1212 = Number of axles C26 C26UPAG1 N 1 0 N UP axles in Axle Group 1 -- Number of axles that
are lifted (raised so they are not in contact with the ground) in the 1st group of axles on the truck 0 = no axles are lifted 12 = number of axles lifted
C26 C26UPAG2 N 1 0 N UP axles in Axle Group 2 -- Same answers as for UP axles in Axle Group 1
C26 C26UPAG3 N 2 0 N UP axles in Axle Group 3 -- Number of axles that are lifted in the 3rd group of axles on the truck 0 = no axles are lifted or not applicable (no 3rd
group) 12 = number of axles lifted Note To decide whether ldquo0rdquo means ldquono axles liftedrdquo or means ldquonot applicablerdquo check C25AXLAG3 to determine if the 3rd axle group exists
C26 C26UPAG4 N 2 0 N UP axles in Axle Group 4 -- Same answers as for UP axles in Axle Group 3
C26 C26UPAG5 N 2 0 N UP axles in Axle Group 5 -- Same answers as for UP axles in Axle Group 3
C26 C26UPAG6 N 2 0 N UP axles in Axle Group 6 -- Same answers as for UP axles in Axle Group 3
C26 C26UPAG7 N 2 0 N UP axles in Axle Group 7 -- Same answers as for UP axles in Axle Group 3
C26 C26UPAG8 N 2 0 N UP axles in Axle Group 8 -- Same answers as for UP axles in Axle Group 3
C26 C26UPALL N 1 0 N UP axles ALL -- Total number of axles that are lifted on the truck 0 = no axles are lifted 129 = number of axles lifted
D Interview Start Section
D01 D01AGREE C 1 0 N AGREEs to interview -- Whether driver agrees to participate in an interview Y = Yes N = No
D02 D02REFUSE C 40 0 N REFUSE -- Reason given by driver for refusing to be interviewed blank = not applicable (driver agreed to interview) something = reason for refusing
Interprovincial Roadside Truck Survey Technical Appendices 17
Answer Output Database Fields Reference Field Information
Questi- Name Type Length onnaire Decimals Index D03 D03LANG C 1 0 N LANGuage of driver -- Drivers choice for the
language of the interview E = English F = French
E Interview Part 1 - Vehicle Profile Section E01 E01TBS C 1 0 N Truck Base Status -- Whether an answer is available
Y = Yes (driver identified a base) N = No base (driverrsquos answer) R = driver Refused to answer T = driver Terminated interview before question asked Note The base is the place in Canada US or Mexico where the straight truck or tractor is usually garaged or serviced or the operating centre to which it is assigned Some trucks may not be based at a specific place
E01 E01TBJUR C 4 0 N Truck Base JURisdiction -- The jurisdiction in which the truck base is located blank = not applicable (see status field) something = jurisdiction code The codes are listed in Appendix H
E01 E01TBPLA C 50 0 N Truck Base PLAce -- The name of the place in which the truck base is located blank = not applicable (see status field) something = place name
E01 E01TBID C 11 0 N Truck Base ID -- Unique identifier assigned to the record containing the place name blank = not applicable (see status field) something = identifier Note Identifier is filled automatically by the computer but only if the place is selected from the pick-list
E01 E01TBLON N 11 6 N Truck Base LONgitude -- Longitude of the place 0 = not applicable (see status field) something = longitude Format defined in description of geographic coordinates that precedes this table Note Longitude is filled automatically by the computer but only if the place is selected from the pick-list
E01 E01TBLAT N 11 6 N Truck Base LATitude -- Latitude of the place 0 = not applicable (see status field) something = latitude Format defined in description of geographic coordinates that precedes this table Note Latitude is filled automatically by the computer but only if the place is selected from the pick-list
Interprovincial Roadside Truck Survey Technical Appendices 18
Answer Output Database Fields Reference Field Information
Questishyonnaire
Name Type Length Decimals Index
E02 E02LIFTS C 1 0 N LIFT Status -- Whether the answer is available for the total number of liftable axles on the truck Y = Yes (driver answered 1 or more) N = None (driver answered no lift axles) D = driver Doesnrsquot know the answer R = driver Refused to answer T = driver Terminated interview before question asked Note Liftable axles are counted whether they are currently raised (off the ground) or lowered (on the ground)
E02 E02LIFT N 1 0 N LIFT -- Total number of liftable axles 0 = none or not available (see status field) 12 = total number of liftable axles
E03 E03LENT1S C 1 0 N LENgth of Trailer 1 Status -- Whether the answer is available for the length of the 1st trailer Y = Yes D = driver Doesnrsquot know the answer R = driver Refused to answer T = driver Terminated interview before question asked X = not applicable (no such trailer)
E03 E03LENT1 N 5 2 N LENgth of Trailer 1 -- Length of the 1st trailer 0 = not applicable (see status field) something = length Note Units of measurement are defined in field E06LENTU
E04 E04LENT2S C 1 0 N LENgth of Trailer 2 Status -- Same answers as for LENgth of Trailer 1 Status
E04 E04LENT2 N 5 2 N LENgth of Trailer 2 -- Same answers as for LENgth of Trailer 1
E05 E05LENT3S C 1 0 N LENgth of Trailer 3 Status -- Same answers as for LENgth of Trailer 1 Status
E05 E05LENT3 N 5 2 N LENgth of Trailer 3 -- Same answers as for LENgth of Trailer 1
E06 E06LENTU C 1 0 N LENgth of Trailer Units -- Units in which the length of the trailers are measured F = Feetinches (digits before the decimal point are feet digits after the decimal point are inches) M = Metres X = not applicable (no trailers or no measurements) T = driver Terminated interview before question asked
Interprovincial Roadside Truck Survey Technical Appendices 19
Answer Output Database Fields Reference Field Information
Questi- Name Type Length onnaire Decimals Index E07 E07LENC1S C 1 0 N LENgth of Container 1 Status -- Whether the answer
is available for the length of the 1st container carried by the truck Y = Yes D = driver Doesnrsquot know the answer R = driver Refused to answer T = driver Terminated interview before question asked X = not applicable Note ldquoNot applicablerdquo if no such container or because the question not asked after being eliminated from the questionnaire
E07 E07LENC1 N 5 2 N LENgth of Container 1 -- Length of the 1st
container 0 = not applicable (see status field) something = length Note Units of measurement are defined in field E10LENCU
E08 E08LENC2S C 1 0 N LENgth of Container 2 Status -- Same answers as for LENgth of Container 1 Status
E08 E08LENC2 N 5 2 N LENgth of Container 2 -- Same answers as for LENgth of Container 1
E09 E09LENC3S C 1 0 N LENgth of Container 3 Status -- Same answers as for LENgth of Container 1 Status
E09 E09LENC3 N 5 2 N LENgth of Container 3 -- Same answers as for LENgth of Container 1
E10 E10LENCU C 1 0 N LENgth of Container Units -- Units in which the length of the containers are measured F = Feetinches (digits before the decimal point are feet digits after the decimal point are inches) M = Metres X = not applicable (no containers or no measurements) T = driver Terminated interview before question asked
E11 E11TACHOG C 1 0 N TACHOGraph -- Whether there is a tachograph on-board the truck Y = Yes N = No R = driver Refused to answer T = driver Terminated interview before question asked Note A tachograph is a mechanical device that records truck speed engine speed and distance travelled It operates by drawing thin lines on a circular card each card covering 24 hours
Interprovincial Roadside Truck Survey Technical Appendices 20
Answer Output Database Fields Reference Field Information
Questi- Name Type Length onnaire Decimals Index E12 E12LOG C 1 0 N electronic drive LOG -- Same answers as for
TACHOGraph Note An electronic drive log is a device that automatically records the hours of oepration of the vehicle in some type of memory Usually it has a keyboard so the driver can enter events that occur
E13 E13COMPUT C 1 0 N COMPUTer -- Same answers as for TACHOGraph Note A computer that is adapted to the environment of the driver cab It is used to enter information on the events of the day
E14 E14TAG C 1 0 N electronic vehicle identification TAG -- Same answers as for TACHOGraph Note An electronic vehicle identification tag is a magnetically encoded device that can be read by equipment located in the roadway or at the roadside The tag contains information about the identity of the truck and the load
E15 E15SATELL C 1 0 N SATELLite -- Same answers as for TACHOGraph Note Satellite based communications use a transmitter-receiver that is usually curcular in shape approximately 15 to 30 centimetres in diameter and located on the roof of the driver cab ovten behind the wind deflector It is used by a carrier to track the location of its truck If equipped with a keyboard and screen in the cab the driver can send and receive information
E16 E16CELLPH C 1 0 N CELLular telePHone -- Same answers as for TACHOGraph Note This covers standard cellular telephones There may or may not be an antenna mounted on the truck
E17 E17PAGER C 1 0 N PAGER -- Same answers as for TACHOGraph Note This covers standard pagers
E18 E18RADIO C 1 0 N company RADIO -- Same answers as for TACHOGraph Note Company radio means a two-way radio that operates on a private frequency dedicated to the company It is used for voice messages between the driver and dispatcher
E19 E19MASTER C 1 0 N tripMASTER -- Same answers as for TACHOGraph Note A TripMaster provides the driver with information about the best route for a trip
Interprovincial Roadside Truck Survey Technical Appendices 21
Answer Output Database Fields Reference Field Information
Questi- Name Type Length onnaire Decimals Index E20 E20OTHER C 1 0 N OTHER electronic equipment Whether there is other
electronic equipment on-board the truck Y = Yes N = No R = driver Refused to answer T = driver Terminated interview before question asked X = not applicable Note ldquoNot applicablerdquo because the question was not asked after being eliminated from the questionnaire Note Other electronic equipment covers communications information or recording equipment except electronics equipment that has to do with the operation of the engine transmission suspension or other vehicle systems radar detectors or CB radios
E21 E21OTHERD C 20 0 N OTHER electronic equipment Description blank = not applicable (no ldquootherrdquo) something = description of the ldquootherrdquo electronic equipment
E22 E22MSAS C 1 0 N Manual Slack Adjustors Status -- Whether there are manual slack adjustors on the truck Y = Yes N = No D = driver Doesnrsquot know the answer R = driver Refused to answer T = driver Terminated interview before question asked
E23 E23MSAU1 C 1 0 N Manual Slack Adjustors on Unit 1 -- Whether there are manual slack adjusters on the 1st unit of the truck (straight truck or tractor) Y = Yes N = No D = driver Doesnrsquot know the answer R = driver Refused to answer T = driver Terminated interview before question asked X = not applicable Note ldquoNot applicablerdquo if no manual slack adjusters on truck or if driver refused doesnrsquot know previous answer whether manual slack adjusters on truck
Interprovincial Roadside Truck Survey Technical Appendices 22
Answer Output Database Fields Reference Field Information
Questi- Name Type Length onnaire Decimals Index E24 E24MSAU2 C 1 0 N Manual Slack Adjustors on Unit 2 -- Whether there
are manual slack adjustors on the 2nd unit of the truck (first trailer) Y = Yes N = No D = driver Doesnrsquot know the answer R = driver Refused to answer T = driver Terminated interview before question asked X = not applicable Note ldquoNot applicablerdquo if no 2nd unit on truck or if no manual slack adjusters on truck or if driver refused doesnrsquot know previous answer whether manual slack adjusters on truck
E25 E25MSAU3 C 1 0 N Manual Slack Adjustors on Unit 3 -- Whether there are manual slack adjustors on the 3rd unit of the truck (second trailer) Same answers as for Manual Slack Adjustors on Unit 2
E26 E26MSAU4 C 1 0 N Manual Slack Adjustors on Unit 4 -- Whether there are manual slack adjustors on the 4th unit of the truck (third trailer) Same answers as for Manual Slack Adjustors on Unit 2
E27 E27MSADK C 1 0 N Manual Slack Adjustments Driver Knowledge -shyWhether the driver knows how to make manual slack adjustments Y = Yes N = No R = driver Refused to answer T = driver Terminated interview before question asked Note All drivers are asked even drivers of trucks without manual slack adjusters
E28 E28MSACP C 1 0 N Manual Slack Adjustment Company Policy -shyWhether the truck company allows a driver to make manual slack adjustments Y = Yes N = No D = driver Doesnrsquot know the answer R = driver Refused to answer T = driver Terminated interview before question asked Note All drivers are asked even drivers who do not know how to make manual slack adjustments
Interprovincial Roadside Truck Survey Technical Appendices 23
Answer Output Database Fields Reference Field Information
Questi- Name Type Length onnaire Decimals Index E29 E29ALBS C 1 0 N Anti-Lock Brakes Status -- Whether there are anti-
lock brakes on the truck Y = Yes N = No D = driver Doesnrsquot know the answer R = driver Refused to answer T = driver Terminated interview before question asked
E30 E30ALBU1 C 1 0 N Anti-Lock Brakes on Unit 1 -- Whether there are anti-lock brakes on the 1st unit of the truck (straight truck or tractor) Y = Yes N = No D = driver Doesnrsquot know the answer R = driver Refused to answer T = driver Terminated interview before question asked X = not applicable Note ldquoNot applicablerdquo if no anti-lock brakes on truck or if driver refused doesnrsquot know previous answer whether anti-lock brakes on truck
E31 E31ALBU2 C 1 0 N Anti-Lock Brakes on Unit 2 -- Whether there are anti-lock brakes on the 2nd unit of the truck (first trailer) Y = Yes N = No D = driver Doesnrsquot know the answer R = driver Refused to answer T = driver Terminated interview before question asked X = not applicable Note ldquoNot applicablerdquo if no 2nd unit on truck or if no anti-lock brakes on truck or if driver refused doesnrsquot know previous answer whether anti-lock brakes on truck
E32 E32ALBU3 C 1 0 N Anti-Lock Brakes on Unit 3 -- Whether there are anti-lock brakes on the 3rd unit of the truck (second trailer) Same answers as for Anti-Lock Brakes on Unit 2
E33 E33ALBU4 C 1 0 N Anti-Lock Brakes on Unit 4 -- Whether there are anti-lock brakes on the 4th unit of the truck (third trailer) Same answers as for Anti-Lock Brakes on Unit 2
Interprovincial Roadside Truck Survey Technical Appendices 24
E34
Reference Questishyonnaire
E34ASS
Name
C 1 0 N
Answer Output Database Fields Field
Type Length Decimals Index
Air Suspension Status -- Whether there is air suspension on the truck Y = Yes N = No D = driver Doesnrsquot know the answer R = driver Refused to answer T = driver Terminated interview before question asked
Information
E35 E35ASU1 C 1 0 N Air Suspension on Unit 1 -- Whether there is air suspension on the 1st unit of the truck (straight truck or tractor) Y = Yes N = No D = driver Doesnrsquot know the answer R = driver Refused to answer T = driver Terminated interview before question asked X = not applicable Note ldquoNot applicablerdquo if no air suspension on truck or if driver refused doesnrsquot know previous answer whether air suspension on truck
E36 E36ASU2 C 1 0 N Air Suspension on Unit 2 -- Whether there is air suspension on the 2nd unit of the truck (first trailer) Y = Yes N = No D = driver Doesnrsquot know the answer R = driver Refused to answer T = driver Terminated interview before question asked X = not applicable Note ldquoNot applicablerdquo if no 2nd unit on truck or if no air suspension on truck or if driver refused doesnrsquot know previous answer whether air suspension on truck
E37 E37ASU3 C 1 0 N Air Suspension on Unit 3 -- Whether there is air suspension on the 3rd unit of the truck (second trailer) Same answers as for Air Suspension on Unit 2
E38
F
E38ASU4 C
Interview Part 2 - Commodity Information Section
1 0 N Air Suspension on Unit 4 -- Whether there is air suspension on the 4th unit of the truck (third trailer) Same answers as for Air Suspension on Unit 2
F01 F01CARGO C 1 0 N CARGO -- Whether the truck is carrying cargo Y = Yes N = No D = driver Doesnrsquot know the answer R = driver Refused to answer T = driver Terminated interview before question asked
Interprovincial Roadside Truck Survey Technical Appendices 25
Answer Output Database Fields Reference Field Information
Questi- Name Type Length onnaire Decimals Index F02 F02CAPUSE N 2 0 N CAPacity USEd -- How much of the truckrsquos cargo
capacity is used 1 = frac14 full 2 = frac12full 3 = frac34full 4 = full 96 = not applicable 97 = driver terminated interview before question asked 98 = driver refused to answer 99 = driver does not know the answer Note ldquoNot applicablerdquo if truck is empty or if unknown whether cargo is on-board
F03 F03SPACE C 1 0 N SPACE -- Whether the truck is fully loaded because the space limit has been reached Y = Yes N = No D = driver Doesnrsquot know the answer R = driver Refused to answer X = not applicable T = driver Terminated interview before question asked Note ldquoNot applicablerdquo if truck is not full or if truck is empty or if unknown whether cargo is on-board or if driver refused doesnrsquot know previous answer on capacity used
F04 F04WEIGHT C 1 0 N WEIGHT -- Whether the truck is fully loaded because the weight limit has been reached Same answers as for SPACE
F05 F05PICKUP C 1 0 N PICK-UP -- Whether the cargo was picked up at one address (location) Y = Yes N = No D = driver Doesnrsquot know the answer R = driver Refused to answer X = not applicable T = driver Terminated interview before question asked Note ldquoNot applicablerdquo if truck is empty or if unknown whether cargo is on-board
F06 F06DELIVE C 1 0 N DELIVEred -- Whether the cargo will be delivered to one address (location) Same answers as for PICKshyUP
Interprovincial Roadside Truck Survey Technical Appendices 26
Answer Output Database Fields Reference Field Information
Questi- Name Type Length onnaire Decimals Index F07 F07SHIPS C 1 0 N SHIPments Status -- Whether the number of
shipments on-board is available Y = Yes D = driver Doesnrsquot know the answer R = driver Refused to answer X = not applicable T = driver Terminated interview before question asked Note A shipment is a load going from one shipper to one receiver and may consist of one commodity or several commodities Note A load consisting of one commodity is may or may not be a single shipment It is multiple shipments if the load was collected from more than one shipper or if the load will be delivered to more than one receiver Note ldquoNot applicablerdquo if truck is empty or if unknown whether cargo is on-board
F07 F07SHIP N 4 0 N SHIPments -- Number of shipments 0 = not applicable (see status field) something = Number
F08 F08AMOACS C 1 0 N AMOunt of All Cargo Status -- Whether a measurement of the amount of all cargo on-board is available Y = Yes D = driver Doesnrsquot know the answer R = driver Refused to answer X = not applicable T = driver Terminated interview before question asked Note ldquoNot applicablerdquo if truck is empty or if unknown whether cargo is on-board
F08 F08AMOAC N 6 0 N AMOunt of All Cargo -- The weight or volume of all cargo on-board 0 = not applicable (see status field) something = amount Note Units of measurement are defined in field F09AMOACU
F09 F09AMOACU N 2 0 N AMOunt of All Cargo Units -- Units in which the amount of cargo is measured 1 = kilograms 2 = pounds 3 = litres 4 = gallons 96 = not applicable (see status field) 97 = driver Terminated interview before question asked
Interprovincial Roadside Truck Survey Technical Appendices 27
Answer Output Database Fields Reference Field Information
Questi- Name Type Length onnaire Decimals Index F10 F10ONECOM C 1 0 N ONE COMmodity -- Whether the cargo consists of
one commodity Y = Yes N = No D = driver Doesnrsquot know the answer R = driver Refused to answer X = not applicable T = driver Terminated interview before question asked Note ldquoNot applicablerdquo if truck is empty or if unknown whether cargo is on-board
F11 F11CATC1S C 1 0 N CATegory of Commodity 1 Status -- Whether the category of the 1st largest commodity on-board is available Y = Yes D = driver Doesnrsquot know the answer R = driver Refused to answer X = not applicable T = driver Terminated interview before question asked Note Size (ldquolargerdquo) is measured by amount of the commodity Note ldquoNot applicablerdquo if truck is empty or if unknown whether cargo is on-board
F11 F11CATC1 C 40 0 N CATegory of Commodity 1 -- Description of the category of the 1st largest commodity blank = not applicable (see status field) something = description
F12 F12AMOC1S C 1 0 N AMOunt of Commodity 1 -- Whether a measurement of the amount of the 1st largest commodity is available Y = Yes D = driver Doesnrsquot know the answer R = driver Refused to answer X = not applicable T = driver Terminated interview before question asked Note ldquoNot applicablerdquo if truck is empty or if unknown whether cargo is on-board
F12 F12AMOC1 N 6 0 N AMOunt of Commodity 1 -- The weight or volume of the 1st largest commodity 0 = not applicable (see status field) something = amount Note Units of measurement are defined in field F13AMOC1U
Interprovincial Roadside Truck Survey Technical Appendices 28
Answer Output Database Fields Reference Field Information
Questi- Name Type Length onnaire Decimals Index F13 F13AMOC1U N 2 0 N AMOunt of Commodity 1 Units -- Units in which
the amount of the 1st largest commodity is measured 1 = kilograms 2 = pounds 3 = litres 4 = gallons 96 = not applicable (see status field) 97 = driver Terminated interview before question asked
F14 F14OC1S C 1 0 N Origin of Commodity 1 Status -- Whether the origin of shipment of the 1st largest commodity is available Y = Yes D = driver Doesnrsquot know the answer R = driver Refused to answer X = not applicable T = driver Terminated interview before question asked Note The origin is the place in the world where the shipper put the cargo on the transportation system The waybill or the bill of lading should list the origin Note ldquoNot applicablerdquo if truck is empty or if unknown whether cargo is on-board
F14 F14OC1JUR C 4 0 N Origin of Commodity 1 JURisdiction -- The jurisdiction in which the shipment origin is located blank = not applicable (see status field) something = jurisdiction code The codes are listed in Appendix H
F14 F14OC1PLA C 50 0 N Origin of Commodity 1 PLAce -- The name of the place in which the shipment origin is located blank = not applicable (see status field) something = place name
F14 F14OC1ID C 11 0 N Origin of Commodity 1 ID -- Unique identifier assigned to the record containing the place name blank = not applicable (see status field) something = identifier Note Identifier is filled automatically by the computer but only if the place is selected from the pick-list
F14 F14OC1LON N 11 6 N Origin of Commodity 1 LONgitude -- Longitude of the place 0 = not applicable (see status field) something = longitude Format defined in description of geographic coordinates that precedes this table Note Longitude is filled automatically by the computer but only if the place is selected from the pick-list
Interprovincial Roadside Truck Survey Technical Appendices 29
Answer Output Database Fields Reference Field Information
Questi- Name Type Length onnaire Decimals Index F14 F14OC1LAT N 11 6 N Origin of Commodity 1 LATitude -- Latitude of the
place 0 = not applicable (see status field) something = latitude Format defined in description of geographic coordinates that precedes this table Note Latitude is filled automatically by the computer but only if the place is selected from the pick-list
F15 F15DC1S C 1 0 N Destination of Commodity 1 Status -- Same answers as for Origin of Commodity 1 Status Note The destination is the place in the world where the receiver will remove the cargo from the transportation system The waybill or the bill of lading should list the destination
F15 F15DC1JUR C 4 0 N Destination of Commodity 1 JURisdiction -- Same answers as for Origin of Commodity 1 JURisdiction
F15 F15DC1PLA C 50 0 N Destination of Commodity 1 PLAce -- Same answers as for Origin of Commodity 1 PLAce
F15 F15DC1ID C 11 0 N Destination of Commodity 1 ID -- Same answers as for Origin of Commodity 1 ID
F15 F15DC1LON N 11 6 N Destination of Commodity 1 LONgitude -- Same answers as for Origin of Commodity 1 LONgitude
F15 F15DC1LAT N 11 6 N Destination of Commodity 1 LATitude -- Same answers as for Origin of Commodity 1 LATitude
F16 F16DGOB C 1 0 N Dangerous Goods On-Board -- Whether there are dangerous goods on-board Y = Yes N = No D = driver Doesnrsquot know the answer R = driver Refused to answer answer X = not applicable T = driver Terminated interview before question asked Note ldquoNot applicablerdquo if truck is empty or if unknown whether cargo is on-board
Interprovincial Roadside Truck Survey Technical Appendices 30
Answer Output Database Fields Reference Field Information
Questi- Name Type Length onnaire Decimals Index F17 F17DGC1CS C 1 0 N Dangerous Goods Commodity 1 Class Status -shy
Whether the class of the 1st largest dangerous goods commodity is available Y = Yes D = driver Doesnrsquot know the answer R = driver Refused to answer answer X = not applicable blank = not applicable Note ldquoNot applicable=Xrdquo if no dangerous goods on-board or if truck is empty or if driver refused doesnrsquot know previous answer whether dangerous goods on-board Note ldquoNot applicable=blankrdquo because the question was not asked until being added to the questionnaire software
F17 F17DGC1C N 3 1 N Dangerous Goods Commodity 1 Class -- The class of the 1st largest dangerous goods commodity 00 = unknown or not applicable something = class Dangerous goods classes are listed in Appendix H Note See note under Dangerous Goods Commodity 1 UN number Note Size (ldquolargerdquo) is measured by amount of the commodity Note ldquoNot applicablerdquo if no dangerous goods on-board or if truck is empty or if unknown whether cargo is on-board or if driver refused doesnrsquot know previous answer whether dangerous goods on-board or if interview terminated
F18 F17DGC1UNS C 1 0 N Dangerous Goods Commodity 1 UN number Status shy- Whether the UN number of the 1st largest dangerous goods commodity is available Y = Yes D = driver Doesnrsquot know the answer R = driver Refused to answer answer X = not applicable blank = not applicable Note ldquoNot applicablerdquo if no dangerous goods on-board or if truck is empty or if driver refused doesnrsquot know previous answer whether dangerous goods on-board Note ldquoNot applicable=blankrdquo because the question was not asked until being added to the questionnaire software
Interprovincial Roadside Truck Survey Technical Appendices 31
Answer Output Database Fields Reference Field Information
Questi- Name Type Length onnaire Decimals Index F18 F18DGC1UN C 8 0 N Dangerous Goods Commodity 1 UN number -- The
UN number of the 1st largest dangerous goods commodity blank = not applicable something = number or the word UNKNOWN Dangerous goods UN numbers are listed in Appendix H Note The computer program requires that a UN Number or a Class be entered if the answer to Dangerous Goods On-Board is Yes If neither the UN number nor the class is known the surveyors are been directed to enter UNKNOWN in the UN number field Note ldquoNot applicablerdquo if no dangerous goods on-board or if truck is empty or if unknown whether cargo is on-board or if driver refused doesnrsquot know previous answer whether dangerous goods on-board or if interview terminated
G Interview Part 3 - Carrier Information Section G01 G01CTYPE N 2 0 N Company TYPE -- Type of trucking company
1 = for-hire 2 = private 97 = driver Terminated interview before question asked 98 = driver Refused to answer 99 = driver Doesnrsquot know the answer Note A for-hire trucking company earns its money by transporting cargo belonging to someone else A private trucking company is part of a parent company such as a retailer or a manufacturer and exists to transport cargo belonging to the parent company
G02 G02PRIFH C 1 0 N PRIvate company carrying cargo For-Hire -- Whether the private trucking company is carrying cargo for-hire on this trip Y = Yes N = No D = driver Doesnrsquot know the answer R = driver Refused to answer X = not applicable Note A private trucking company is mainly engaged in transporting the cargo of its parent company but on occasion will carry cargo on a for-hire basis (to minimize empty mileage) Note ldquoNot applicablerdquo if trucking company is for-hire or if truck is empty or if unknown whether cargo is on-board or if driver refused doesnrsquot know previous answer on company type or if interview terminated
Interprovincial Roadside Truck Survey Technical Appendices 32
Answer Output Database Fields Reference Field Information
Questi- Name Type Length onnaire Decimals Index G03 G03CDS C 1 0 N Company Dispatch centre Status -- Whether an
answer is available Y = Yes (driver identified a base) N = No dispatch centre (driverrsquos answer) R = driver Refused to answer T = driver Terminated interview before question asked X = not applicable Note ldquoNot applicablerdquo because the question was not asked after being eliminated from the questionnaire Note The dispatch centre is the trucking company office that coordinates the driverrsquos work (provides instructions on where to pick-up and deliver cargo tracks the progress of the cargo) It is located in Canada US or Mexico A driver does not necessarily deal with a dispatch centre
G03 G03CDJUR C 4 0 N Company Dispatch centre JURisdiction -- The jurisdiction in which the dispatch centre is located blank = not applicable (see status field) something = jurisdiction code The codes are listed in Appendix H
G03 G03CDPLA C 50 0 N Company Dispatch centre PLAce -- The name of the place in which the dispatch centre is located blank = not applicable (see status field) something = place name
G03 G03CDID C 11 0 N Company Dispatch centre ID -- Unique identifier assigned to the record containing the place name blank = not applicable (see status field) something = identifier Note Identifier is filled automatically by the computer but only if the place is selected from the pick-list
G03 G03CDLON N 11 6 N Company Dispatch centre LONgitude -- Longitude of the place 0 = not applicable (see status field) something = longitude Format defined in description of geographic coordinates that precedes this table Note Longitude is filled automatically by the computer but only if the place is selected from the pick-list
G03 G03CDLAT N 11 6 N Company Dispatch centre LATitude -- Latitude of the place 0 = not applicable (see status field) something = latitude Format defined in description of geographic coordinates that precedes this table Note Latitude is filled automatically by the computer but only if the place is selected from the pick-list
Interprovincial Roadside Truck Survey Technical Appendices 33
Answer Output Database Fields Reference Field Information
Questi- Name Type Length onnaire Decimals Index
H Interview Part 4 - Trip Information Section H01 H01TRITYP C 1 0 N TRIp TYPe -- Whether the trip is a linehaul or a
peddle run P = Peddle run L = Linehaul R = driver Refused to answer T = driver Terminated interview before question asked Note A linehaul trip transports the entire cargo load from one point to another point A peddle run makes stops for cargo pick-up and delivery between its first cargo pick-up point and last cargo delivery point See discussion of trip definition that precedes this table
H02 H02TRISTOS C 1 0 N TRIp STOps Status -- Whether the number of stops on the peddle run is available Y = Yes D = driver Doesnrsquot know the answer R = driver Refused to answer X = not applicable T = driver Terminated interview before question asked Note ldquoNot applicablerdquo if not a peddle run or if driver refused previous answer on trip type
H02 H02TRISTO N 2 0 N TRIp STOps -- Number of stops on the peddle run 0 = not applicable (see status field) something = number
H03 H03SECOND C 1 0 N SECOND -- Whether there is a second driver on-board the truck so that the trip is being driven by a driver team Y = Yes N = No R = driver Refused to answer T = driver Terminated interview before question asked
H04 H04TOS C 1 0 N Trip Origin Status -- Whether an answer is available Y = Yes (driver identified a base) D = driver Doesnrsquot know the answer R = driver Refused to answer T = driver Terminated interview before question asked Note The trip origin is a location in Canada US or Mexico See discussion of trip definition that preceeds this table
H04 H04TOJUR C 4 0 N Trip Origin JURisdiction -- The jurisdiction in which the trip origin is located blank = not applicable (see status field) something = jurisdiction code The codes are listed in Appendix H
Interprovincial Roadside Truck Survey Technical Appendices 34
Answer Output Database Fields Reference Field Information
Questi- Name Type Length onnaire Decimals Index H04 H04TOPLA C 50 0 N Trip Origin PLAce -- The name of the place in which
the trip origin is located blank = not applicable (see status field) something = place name
H04 H04TOID C 11 0 N Trip Origin ID -- Unique identifier assigned to the record containing the place name blank = not applicable (see status field) something = identifier Note Identifier is filled automatically by the computer but only if the place is selected from the pick-list
H04 H04TOLON N 11 6 N Trip Origin LONgitude -- Longitude of the place 0 = not applicable (see status field) something = longitude Format defined in description of geographic coordinates that precedes this table Note Longitude is filled automatically by the computer but only if the place is selected from the pick-list
H04 H04TOLAT N 11 6 N Trip Origin LATitude -- Latitude of the place 0 = not applicable (see status field) something = latitude Format defined in description of geographic coordinates that precedes this table Note Latitude is filled automatically by the computer but only if the place is selected from the pick-list
H05 H05TOADDS C 1 0 N Trip Origin ADDress Status -- Whether the trip origin address is available or needed Y = Yes D = driver Doesnrsquot know the answer R = driver Refused to answer T = driver Terminated interview before question asked X = not applicable Note ldquoNot applicablerdquo if origin place does not require that the question be asked or if driver refused doesnrsquot know previous answer on origin place
H05 H05TOADD1 C 40 0 N Trip Origin ADDress line 1 blank = not applicable (see status field) something = part of address
H05 H05TOADD2 C 40 0 N Trip Origin ADDress line 2 Same answers as for Trip Origin ADDress line 1
H05 H05TOADD3 C 40 0 N Trip Origin ADDress line 3 Same answers as for Trip Origin ADDress line 1
H06 H06TDS C 1 0 N Trip Destination Status -- Same answers as for Trip Origin Status Note The trip destination is a location in Canada US or Mexico See discussion of trip definition that preceeds this table
Interprovincial Roadside Truck Survey Technical Appendices 35
Answer Output Database Fields Reference Field Information
Questi- Name Type Length onnaire Decimals Index H06 H06TDJUR C 4 0 N Trip Destination JURisdiction -- Same answers as for
Trip Origin JURisdiction H06 H06TDPLA C 50 0 N Trip Destination PLAce -- Same answers as for Trip
Origin PLAce H06 H06TDID C 11 0 N Trip Destination ID -- Same answers as for Trip
Origin ID H06 H06TDLON N 11 6 N Trip Destination LONgitude -- Same answers as for
Trip Origin LONgitude H06 H06TDLAT N 11 6 N Trip Destination LATitude -- Same answers as for
Trip Origin LATitude H07 H07TDADDS C 1 0 N Trip Destination ADDress Status Same answers as
for Trip Origin ADDressStatus H07 H07TDADD1 C 40 0 N Trip Destination ADDress line 1 Same answers as
for Trip Origin ADDress line 1 H07 H07TDADD2 C 40 0 N Trip Destination ADDress line 2 Same answers as
for Trip Origin ADDress line 2 H07 H07TDADD3 C 40 0 N Trip Destination ADDress line 3 Same answers as
for Trip Origin ADDress line 3 H08 H08LSS C 1 0 N Last Stop Status -- Whether an answer is available on
the location of the last stop made before the DCS Y = Yes (driver identified a base) D = driver Doesnrsquot know the answer R = driver Refused to answer T = driver Terminated interview before question asked Note The last stop is a location in Canada US or Mexico See discussion of trip definition that preceeds this table
H08 H08LSJUR C 4 0 N Last Stop JURisdiction -- The jurisdiction in which the last stop was made blank = not applicable (see status field) something = jurisdiction code The codes are listed in Appendix H
H08 H08LSPLA C 50 0 N Last Stop PLAce -- The name of the place in which the last stop was made blank = not applicable (see status field) something = place name
H08 H08LSID C 11 0 N Last Stop ID -- Unique identifier assigned to the record containing the place name blank = not applicable (see status field) something = identifier Note Identifier is filled automatically by the computer but only if the place is selected from the pick-list
Interprovincial Roadside Truck Survey Technical Appendices 36
Answer Output Database Fields Reference Field Information
Questi- Name Type Length onnaire Decimals Index H08 H08LSLON N 11 6 N Last Stop LONgitude -- Longitude of the place
0 = not applicable (see status field) something = longitude Format defined in description of geographic coordinates that precedes this table Note Longitude is filled automatically by the computer but only if the place is selected from the pick-list
H08 H08LSLAT N 11 6 N Last Stop LATitude -- Latitude of the place 0 = not applicable (see status field) something = latitude Format defined in description of geographic coordinates that precedes this table Note Latitude is filled automatically by the computer but only if the place is selected from the pick-list
H09 H09NSS C 1 0 N Next Stop Status -- Same answers as for Last Stop Status Note The next stop is a location in Canada US or Mexico See discussion of trip definition that preceeds this table
H09 H09NSJUR C 4 0 N Next Stop JURisdiction -- Same answers as for Last Stop JURisdiction
H09 H09NSPLA C 50 0 N Next Stop PLAce -- Same answers as for Last Stop PLAce
H09 H09NSID C 11 0 N Next Stop ID -- Same answers as for Last Stop ID H09 H09NSLON N 11 6 N Next Stop LONgitude -- Same answers as for Last
Stop LONgitude H09 H09NSLAT N 11 6 N Next Stop LATitude -- Same answers as for Last Stop
LATitude H10 H10EPS C 1 0 N Entered Province crossing Status -- Whether the trip
entered the province territory containing the DCS from another jurisdiction Y = Yes D = driver Doesnrsquot know the answer R = driver Refused to answer X = not applicable (not entering province territory) T = driver Terminated interview before question asked Note The border crossing could be domestic (between Canadian jursidictions) or international (between Canada and the US) Note See discussion of border crossings that precedes this table
Interprovincial Roadside Truck Survey Technical Appendices 37
Answer Output Database Fields Reference Field Information
Questi- Name Type Length onnaire Decimals Index H10 H10EPPLA C 60 0 N Entered Province crossing PLAce -- Description of
the border crossing blank = not applicable (see status field) something = description Note Crossing could be between Canadian two jurisdictions or between a Canadian and a US jurisdiction Note Description consists of name of facility or jurisdiction and place or jurisdiction and highway number from the perspective of either side of the border)
H10 H10EPID C 10 0 N Entered Province crossing ID -- Unique identifier assigned to the border crossing 0 = not applicable (see status field) something = identifier Note Identifier is filled automatically by the computer but only if the location is selected from the pick-list
H10 H10EPLON N 10 6 N Entered Province crossing LONgitude -- Longitude of the border crossing 0 = not applicable (see status field) something = longitude Format defined in description of geographic coordinates that precedes this table Note Longitude is filled automatically by the computer but only if the location is selected from the pick-list
H10 H10EPLAT N 10 6 N Entered Province crossing LATitude -- Latitude of the border crossing 0 = not applicable (see status field) something = latitude Format defined in description of geographic coordinates that precedes this table Note Latitude is filled automatically by the computer but only if the location is selected from the pick-list
Interprovincial Roadside Truck Survey Technical Appendices 38
Answer Output Database Fields Reference Field Information
Questi- Name Type Length onnaire Decimals Index H11 H11LPS C 1 0 N Leaving Province crossing Status -- Whether the trip
will leave the province territory containing the DCS for another jurisdiction Y = Yes D = driver Doesnrsquot know the answer R = driver Refused to answer X = not applicable (not leaving province territory) T = driver Terminated interview before question asked Note The border crossing could be domestic (between Canadian jursidictions) or international (between Canada and the US) Note See discussion of border crossings that precedes this table
H11 H11LPPLA C 60 0 N Leaving Province crossing PLAce Same answers as for Entered Province PLAce
H11 H11LPID C 10 0 N Leaving Province crossing ID -- Same answers as for Entered Province ID
H11 H11LPLON N 10 6 N Leaving Province crossing LONgitude -- Same answers as for Entered Province LONgitude
H11 H11LPLAT N 10 6 N Leaving Province crossing LATitude -- Same answers as for Entered Province LATitude
H12 H12EC1S C 1 0 N Entered Canada crossing 1 Status -- Whether the trip entered Canada from the US at a crossing in a province territory other than the provinceterritory containing the DCS Y = Yes D = driver Doesnrsquot know the answer R = driver Refused to answer X = not applicable (no such crossing) T = driver Terminated interview before question asked Note See discussion of border crossings that precedes this table
H12 H12EC1PLA C 60 0 N Entered Canada crossing 1 PLAce Same answers as for Entered Province PLAce
H12 H12EC1ID C 10 0 N Entered Canada crossing 1 ID -- Same answers as for Entered Province ID
H12 H12EC1LON N 10 6 N Entered Canada crossing 1 LONgitude -- Same answers as for Entered Province LONgitude
H12 H12EC1LAT N 10 6 N Entered Canada crossing 1 LATitude -- Same answers as for Entered Province LATitude
Interprovincial Roadside Truck Survey Technical Appendices 39
Answer Output Database Fields Reference Field Information
Questi- Name Type Length onnaire Decimals Index H13 H13EC2S C 1 0 N Entered Canada crossing 2 Status -- Whether the
trip entered Canada from the US at a 2nd crossing in a province territory other than the provinceterritory containing the DCS Y = Yes D = driver Doesnrsquot know the answer R = driver Refused to answer X = not applicable (no such crossing) T = driver Terminated interview before question asked Note See discussion of border crossings that precedes this table
H13 H13EC2PLA C 60 0 N Entered Canada crossing 2 PLAce Same answers as for Entered Province PLAce
H13 H13EC2ID C 10 0 N Entered Canada crossing 2 ID -- Same answers as for Entered Province ID
H13 H13EC2LON N 10 6 N Entered Canada crossing 2 LONgitude -- Same answers as for Entered Province LONgitude
H13 H13EC2LAT N 10 6 N Entered Canada crossing 2 LATitude -- Same answers as for Entered Province LATitude
H14 H14LC1S C 1 0 N Leaving Canada crossing 1 Status -- Whether the trip will leave Canada for the US at a crossing in a province territory other than the provinceterritory containing the DCS Y = Yes D = driver Doesnrsquot know the answer R = driver Refused to answer X = not applicable (no such crossing) T = driver Terminated interview before question asked Note See discussion of border crossings that precedes this table
H14 H14LC1PLA C 60 0 N Leaving Canada crossing 1 PLAce Same answers as for Entered Province PLAce
H14 H14LC1ID C 10 0 N Leaving Canada crossing 1 ID -- Same answers as for Entered Province ID
H14 H14LC1LON N 10 6 N Leaving Canada crossing 1 LONgitude -- Same answers as for Entered Province LONgitude
H14 H14LC1LAT N 10 6 N Leaving Canada crossing 1 LATitude -- Same answers as for Entered Province LATitude
Interprovincial Roadside Truck Survey Technical Appendices 40
Answer Output Database Fields Reference Field Information
Questi- Name Type Length onnaire Decimals Index H15 H15LC2S C 1 0 N Leaving Canada crossing 2 Status -- Whether the
trip will leave Canada for the US at a 2nd crossing in a province territory other than the provinceterritory containing the DCS Y = Yes D = driver Doesnrsquot know the answer R = driver Refused to answer X = not applicable (no such crossing) T = driver Terminated interview before question asked Note See discussion of border crossings that precedes this table
H15 H15LC2PLA C 60 0 N Leaving Canada crossing 2 PLAce Same answers as for Entered Province PLAce
H15 H15LC2ID C 10 0 N Leaving Canada crossing 2 ID -- Same answers as for Entered Province ID
H15 H15LC2LON N 10 6 N Leaving Canada crossing 2 LONgitude -- Same answers as for Entered Province LONgitude
H15 H15LC2LAT N 10 6 N Leaving Canada crossing 2 LATitude -- Same answers as for Entered Province LATitude
H16 H16UM1S C 1 0 N UsMexico crossing 1 Status -- Whether the trip will cross the USMexico border Y = Yes D = driver Doesnrsquot know the answer R = driver Refused to answer X = not applicable (no such crossing) T = driver Terminated interview before question asked Note See discussion of border crossings that precedes this table
H16 H16UM1PLA C 60 0 N UsMexico crossing 1 PLAce Same answers as for Entered Province PLAce
H16 H16UM1ID C 10 0 N UsMexico crossing 1 ID -- Same answers as for Entered Province ID
H16 H16UM1LON N 10 6 N UsMexico crossing 1 LONgitude -- Same answers as for Entered Province LONgitude
H16 H16UM1LAT N 10 6 N UsMexico crossing 1 LATitude -- Same answers as for Entered Province LATitude
H17 H17HWYS C 1 0 N HighWaY route Status -- Whether the highways on the trip route are available Y = Yes D = driver Doesnrsquot know the answer R = driver Refused to answer T = driver Terminated interview before question asked X = not applicable Note ldquoNot applicablerdquo if jurisdiction containing the DCS does not require that the question be asked Note ldquoYesrdquo is triggered if something has been entered in H17HWY1
Interprovincial Roadside Truck Survey Technical Appendices 41
Answer Output Database Fields Reference Field Information
Questi- Name Type Length onnaire Decimals Index H17 H17HWY1 C 40 0 N HighWaY route line 1
blank = not applicable (see status field) something = highway description
H17 H17HWY2 C 40 0 N HighWaY route line 2 blank = none or not applicable (see status field) something = highway description
H17 H17HWY3 C 40 0 N HighWaY route line 3 Same answers as for HighWaY route line 2
H17 H17HWY4 C 40 0 N HighWaY route line 4 Same answers as for HighWaY route line 2
H17 H17HWY5 C 40 0 N HighWaY route line 5 Same answers as for HighWaY route line 2
H17 H17HWY6 C 40 0 N HighWaY route line 6 Same answers as for HighWaY route line 2
H17 H17HWY7 C 40 0 N HighWaY route line 7 Same answers as for HighWaY route line 2
H18 H18PTOD C 1 0 N Previous Trip Origin and Destination -- Whether the origin and destination of the previous trip were the same as the origin and destination of the current trip Y = Yes N = No D = driver Doesnrsquot know the answer R = driver Refused to answer T = driver Terminated interview before question asked X = not applicable Note ldquoNot applicablerdquo because the question was not asked after being eliminated from the questionnaire
H19 H19PTHWY C 1 0 N Previous Trip HighWaYs -- Whether the highways used on the previous trip were the sme as the highways used on the current trip Y = Yes N = No D = driver Doesnrsquot know the answer R = driver Refused to answer X = not applicable T = driver Terminated interview before question asked Note ldquoNot applicablerdquo if previous trip origin or destination different or if driver refused doesnrsquot know previous answer on previous trip origin destination or if previous question was not asked
Interprovincial Roadside Truck Survey Technical Appendices 42
Answer Output Database Fields Reference Field Information
Questi- Name Type Length onnaire Decimals Index H20 H20TSDATES C 1 0 N Trip Start DATE Status -- Whether the date on which
the trip started from the trip origin is available Y = Yes D = driver Doesnrsquot know the answer R = driver Refused to answer T = driver Terminated interview before question asked X = not applicable Note ldquoNot applicablerdquo because the question was not asked after being eliminated from the questionnaire
H20 H20TSDATE D 8 0 N Trip Start DATE blank = not applicable (see status field) something = date Format YYYYMMDD
H21 H21TSHOURS C 1 0 N Trip Start HOUR Status -- Whether the hour during which the trip started from the trip origin is available Y = Yes D = driver Doesnrsquot know the answer R = driver Refused to answer T = driver Terminated interview before question asked X = not applicable Note ldquoNot applicablerdquo because the question was not asked after being eliminated from the questionnaire
H21 H21TSHOUR N 2 0 N Trip Start HOUR blank = not applicable (see status field) something = hour Format 24 hour clock
H22 H22TSINT C 1 0 N Trip Start cargo INTerlined -- Whether the cargo picked-up at the trip start was received from another trucking company Y = Yes N = No D = driver Doesnrsquot know the answer R = driver Refused to answer X = not applicable T = driver Terminated interview before question asked Note ldquoNot applicablerdquo if no cargo on-board or because the question was not asked after being eliminated from the questionnaire Note The interlining could be accomplished by transferring the cargo itself from one truck to another or by transfering the trailer containing the cargo from one company to another
Interprovincial Roadside Truck Survey Technical Appendices 43
Answer Output Database Fields Reference Field Information
Questi- Name Type Length onnaire Decimals Index H23 H23TSFAC N 2 0 N Trip Start FACility -- The type of facility at which the
trip started 1 = Truck Terminal - Your Carrier 2 = Truck Terminal - Another Carrier 3 = Rail Terminal 4 = Marine Terminal 5 = Airport Terminal 6 = Primary Producer 7 = Manufacturer 8 = WarehouseDistribution Centre 9 = Retail Outlet 95 = Other 97 = driver Terminated interview before question asked 98 = driver Refused to answer 99 = driver Doesnrsquot know the answer
H24 H24TSFACD C 20 0 N Trip Start FACility Description blank = not applicable (see status field) something = description of ldquootherrdquo type of facility
H25 H25TEDATES C 1 0 N Trip End DATE Status -- Whether the date on which the trip will end at the trip destination is available Same answers as for Trip Start DATE Status
H25 H25TEDATE D 8 0 N Trip End DATE -- Same answers as for Trip Start DATE
H26 H26TEHOURS C 1 0 N Trip End HOUR Status -- Same answers as for Trip Start HOUR Status
H26 H26TEHOUR N 2 0 N Trip End HOUR -- Same answers as for Trip Start HOUR
H27 H27TEINT C 1 0 N Trip End cargo INTerlined -- Same answers as for Trip End cargo INTerlined
H28 H28TEFAC N 2 0 N Trip End FACility -- Same answers as for Trip Start FACility
H29 H29TEFACD C 20 0 N Trip End FACility Description -- Same answers as for Trip Start FACility Description
I Interview Part 5 - Driver Information Section I01 I01DBS C 1 0 N Driver Base Status -- Whether an answer is available
Y = Yes (driver identified a base) N = No base (driverrsquos answer) R = driver Refused to answer T = driver Terminated interview before question asked Note The base is the place in Canada US or Mexico where the driver lives
Interprovincial Roadside Truck Survey Technical Appendices 44
Answer Output Database Fields Reference Field Information
Questi- Name Type Length onnaire Decimals Index I01 I01DBJUR C 4 0 N Driver Base JURisdiction -- The jurisdiction in which
the driver base is located blank = not applicable (see status field) something = jurisdiction code The codes are listed in Appendix H
I01 I01DBPLA C 50 0 N Truck Base PLAce -- The name of the place in which the driver base is located blank = not applicable (see status field) something = place name
I01 I01DBID C 11 0 N Driver Base ID -- Unique identifier assigned to the record containing the place name blank = not applicable (see status field) something = identifier Note Identifier is filled automatically by the computer but only if the place is selected from the pick-list
I01 I01DBLON N 11 6 N Driver Base LONgitude -- Longitude of the place 0 = not applicable (see status field) something = longitude Format defined in description of geographic coordinates that precedes this table Note Longitude is filled automatically by the computer but only if the place is selected from the pick-list
I01 I01DBLAT N 11 6 N Driver Base LATitude -- Latitude of the place 0 = not applicable (see status field) something = latitude Format defined in description of geographic coordinates that precedes this table Note Latitude is filled automatically by the computer but only if the place is selected from the pick-list
I02 I02OWNER C 1 0 N OWNER -- Whether driver owns the straight truck or tractor Y = Yes N = No R = driver Refused to answer T = driver Terminated interview before question asked
Interprovincial Roadside Truck Survey Technical Appendices 45
Answer Output Database Fields Reference Field Information
Questi- Name Type Length onnaire Decimals Index I03 I03CONTRA C 1 0 N CONTRAct -- Whether the driver-owner of the truck
has a contract with a trucking company to haul cargo for that company Y = Yes N = No R = driver Refused to answer X = not applicable T = driver Terminated interview before question asked Note ldquoNot applicablerdquo if the driver is not the owner of the truck or if the driver refused to answer the previous question on truck ownership
I04 I04EMPLOY C 1 0 N EMPLOYer -- What type of company is the employer of a driver-non-owner C = Trucking Company L = Leasing Agency O = Other R = driver Refused to answer X = not applicable T = driver Terminated interview before question asked Note ldquoNot applicablerdquo if the driver is the owner of the truck or if the driver refused to answer the previous question on truck ownership
I05 I05OTHER C 20 0 N OTHER -- Description of the employer type if it was classified as Other blank = not applicable something = description
I06 I06AGES C 1 0 N AGE Status -- Whether the driverrsquos age is available Y = Yes R = driver Refused to answer T = driver Terminated interview before question asked
I06 I06AGE N 2 0 N AGE 0 = not applicable (see status field) something = age in years
I07 I07DRITOTS C 1 0 N DRIving TOTal Status -- Availability of how many years the driver has driven a truck for a living Y = Yes L = yes -- Less than 1 year D = driver Doesnrsquot know the answer R = driver Refused to answer T = driver Terminated interview before question asked
I07 I07DRITOT N 2 0 N DRIving TOTal 0 = none or less than 1 or not available (see status field) something = years of driving
Interprovincial Roadside Truck Survey Technical Appendices 46
Answer Output Database Fields Reference Field Information
Questi- Name Type Length onnaire Decimals Index I08 I08DRICONS C 1 0 N DRIving CONfiguration Status -- Availability of how
many years the driver has driven the observed configuration of truck for a living Y = Yes L = yes -- Less than 1 year D = driver Doesnrsquot know the answer R = driver Refused to answer X = not applicable T = driver Terminated interview before question asked Note ldquoNot applicablerdquo if truck configuration is not a tractor or a tractor-trailer combination
I08 I08DRICON N 2 0 N DRIving CONfiguration 0 = none or less than 1 or not available or not applicable (see status field) something = years of driving
I09 I09NSCRTR C 1 0 N National Safety Code Requirements TRaining -shyWhether in the past 3 years the driver has received at least 1 day of training on the requirements of the National Safety Code Y = Yes N = No R = driver Refused to answer T = driver Terminated interview before question asked Note Training could cover topics such as licences necessary maintaining an hours of service log and performing a daily vehicle trip inspection
I10 I10NSCRSP C 1 0 N National Safety Code Requirements SPonsor -shyWhether the driverrsquos employer sponsored the training Y = Yes N = No X = not applicable R = driver Refused to answer T = driver Terminated interview before question asked Note The driverrsquos employer sponsored the training if the employer paid the cost of the training outside of working hours or if the training occurred during working hours while the driver was being paid Note ldquoNot applicablerdquo if no training or if driver refused previous answer whether training received or because the question was not asked after being eliminated from the questionnaire
Interprovincial Roadside Truck Survey Technical Appendices 47
Answer Output Database Fields Reference Field Information
Questi- Name Type Length onnaire Decimals Index I11 I11DGHTR C 1 0 N Dangerous Goods Handling TRaining -shy Same
answers as for National Safety Code Requirements TRaining Note Training could cover topics such as documents and safety markings necessary handling characteristics of the product and responding to an emergency
I12 I12DGHSP C 1 0 N Dangerous Goods Handling SPonsor -shy Same answers as for National Safety Code Requirements SPonsor
I13 I13DSTR C 1 0 N Driving Skills TRaining -shy Same answers as for National Safety Code Requirements TRaining Note Training culd cover topics such as recognizing unsafe practices handling characteristics of the vehicle configuration and driving techniques to increase efficiency Not included is vehicle maintenance training
I14 I14DSSP C 1 0 N Driving Skills SPonsor -shy Same answers as for National Safety Code Requirements SPonsor
I15 I15BSTR C 1 0 N Business Skills TRaining -shy Same answers as for National Safety Code Requirements TRaining Note Training could cover topics such as dealing with customers tracking and analysing costs and revenues and understanding contracts
I16 I16BSSP C 1 0 N Business Skills SPonsor -shy Same answers as for National Safety Code Requirements SPonsor
I17 I17EEUTR C 1 0 N Electronic Equipment Usage TRaining -shy Same answers as for National Safety Code Requirements TRaining Note Training could cover topics such as purpose and use of communications and information recording equipment
I18 I18EEUSP C 1 0 N Electronic Equipment Usage SPonsor -shy Same answers as for National Safety Code Requirements SPonsor
J Weights and Measures Section J01 J01COUS C 1 0 N COUnt of axle groupings weighed Status -- Whether
the axles are weighted in groups that are the same as or different from the groups recorded in C25AXLAG1 through C25AXLAG8 M = Modified (weighed groupings of axles different from recorded axle groups) S = Same (weighed in same groupings) X = not applicable (no weight information available)
Interprovincial Roadside Truck Survey Technical Appendices 48
Answer Output Database Fields Reference Field Information
Questi- Name Type Length onnaire Decimals Index J01 J01COUAG1 N 1 0 N COUnt of Axles in weighed Grouping 1 -- How
many axles are in the 1st grouping to be weighed 12 = number of axles (including lifted axles) Note The number of axles includes any axles in the grouping that are lifted at the time of the weighing
J01 J01COUAG2 N 1 0 N COUnt of Axles in weighed Grouping 2 -- Same answers as for COUnt of Axles in weighed Group 1
J01 J01COUAG3 N 2 0 N COUnt of Axles in weighed Grouping 3 How many axles are in the 3rd grouping to be weighed 12 = number of axles 96 = not applicable (no 3rd group)
J01 J01COUAG4 N 2 0 N COUnt of Axles in weighed Grouping 4 -- Same answers as for COUnt of Axles in weighed Group 3
J01 J01COUAG5 N 2 0 N COUnt of Axles in weighed Grouping 5 -- Same answers as for COUnt of Axles in weighed Group 3
J01 J01COUAG6 N 2 0 N COUnt of Axles in weighed Grouping 6 -- Same answers as for COUnt of Axles in weighed Group 3
J01 J01COUAG7 N 2 0 N COUnt of Axles in weighed Grouping 7 -- Same answers as for COUnt of Axles in weighed Group 3
J01 J01COUAG8 N 2 0 N COUnt of Axles in weighed Grouping 8 -- Same answers as for COUnt of Axles in weighed Group 3
J02 J02WEIS C 1 0 N WEIght Status -- Whether the weight of the truck is available Y = Yes N = No
J02 J02WEIAG1 N 5 0 N WEIght for Axles in Grouping 1 -- Weight of the 1st
grouping of axles to be weighed 0 = not applicable (see status field) something = weight Note Units of measurement are defined in field J02WEIU
J02 J02WEIAG2 N 5 0 N WEIght for Axles in Grouping 2 -- Weight of the 2nd
grouping of axles to be weighed 0 = zero or not applicable something = weight Note Units of measurement are defined in field J02WEIU Note ldquoZerordquo means that all axles in the grouping are lifted Note ldquoNot applicablerdquo if no such grouping or if weight not available (see status field)
J02 J02WEIAG3 N 5 0 N WEIght for Axles in Grouping 3 -- Same answers as for WEIght for Axles in Groupint 2
J02 J02WEIAG4 N 5 0 N WEIght for Axles in Grouping 4 -- Same answers as for WEIght for Axles in Groupint 2
J02 J02WEIAG5 N 5 0 N WEIght for Axles in Grouping 5 -- Same answers as for WEIght for Axles in Groupint 2
J02 J02WEIAG6 N 5 0 N WEIght for Axles in Grouping 6 -- Same answers as for WEIght for Axles in Groupint 2
Interprovincial Roadside Truck Survey Technical Appendices 49
Answer Output Database Fields Reference Field Information
Questi- Name Type Length onnaire Decimals Index J02 J02WEIAG7 N 5 0 N WEIght for Axles in Grouping 7 -- Same answers
as for WEIght for Axles in Groupint 2 J02 J02WEIAG8 N 5 0 N WEIght for Axles in Grouping 8 -- Same answers
as for WEIght for Axles in Groupint 2 J02 J02WEIALL N 6 0 N WEIght of ALL axles -- Total weight of the truck
0 = not applicable (see status field) something = weight Note Units of measurement are defined in field J02WEIU
J03 J03WEIU C 1 0 N WEIght Units -- Units in which the weight of the truck is measured K = Kilograms P = Pounds X = not applicable (no measurements)
J04 J04MS C 1 0 N Measurement of length Status -- Whether the measurements of the truck length are available Y = Yes N = No
J04 J04MFB N 6 2 N Measurement for Front Bumper -- Reading on the measuring tape for the location of the front bumper 0 = not applicable (see status field) something = reading on tape Note Units of measurement are defined in field J04MU
J04 J04MAXL1 N 6 2 N Measurement for Axle 1 -- Reading on the measuring tape for the location of the 1st axle 0 = not applicable (see status field) something = reading on tape Note Units of measurement are defined in field J04MU
J04 J04MAXL2 N 6 2 N Measurement for Axle 2 Same answers as for Measurement for Axle 1
J04 J04MAXL3 N 6 2 N Measurement for Axle 3 -- Reading on the measuring tape for the location of the 3rd axle 0 = not applicable something = reading on tape Note Units of measurement are defined in field J04MU Note ldquoNot applicablerdquo if no such axle or if measurement not available (see status field)
J04 J04MAXL4 N 6 2 N Measurement for AXLe 4 Same answers as for Measurement for AXLe 1
J04 J04MAXL5 N 6 2 N Measurement for AXLe 5 Same answers as for Measurement for AXLe 1
J04 J04MAXL6 N 6 2 N Measurement for AXLe 6 Same answers as for Measurement for AXLe 1
J04 J04MAXL7 N 6 2 N Measurement for AXLe 7 Same answers as for Measurement for AXLe 1
Interprovincial Roadside Truck Survey Technical Appendices 50
J04
Reference Questishyonnaire J04
J04
J04
J04
J04
J04MBB
Name
J04MAXL8
J04MAXL9
J04MAXL10
J04MAXL11
J04MAXL12
N 6 2 N
Answer Output Database Fields Field
Type Length Decimals Index N 6 2 N
N 6 2 N
N 6 2 N
N 6 2 N
N 6 2 N
Measurement for Back Bumper -- Reading on the measuring tape for the location of the back bumper 0 = not applicable (see status field) something = reading on tape Note Units of measurement are defined in field J04MU
Information
Measurement for AXLe 8 Same answers as for Measurement for AXLe 1 Measurement for AXLe 9 Same answers as for Measurement for AXLe 1 Measurement for AXLe 10 Same answers as for Measurement for AXLe 1 Measurement for AXLe 11 Same answers as for Measurement for AXLe 1 Measurement for AXLe 12 Same answers as for Measurement for AXLe 1
J05 J05MU C 1 0 N Measurement Units -- Units in which the truck length is measured M = Metres F = Feetinches (digits before the decimal point are feet digits after the decimal point are inches) X = not applicable (no measurements)
J06
K K01 K02
J06WEICHES
Early Interview Termination Section
C 1 0 N WEIght CHEck Status -- Whether the check of truck weight against the minimum and maximum criteria for that configuration is active Y = Yes N = No blank = not applicable Note ldquoNot applicablerdquo because the question was not asked before being added to the questionnaire software
See Software Internal Fields section of table See Software Internal Fields section of table
Interprovincial Roadside Truck Survey Technical Appendices 51
Appendix B Heavy Truck Classification System
Interprovincial Roadside Truck Survey Technical Appendices 52
Truck ID Truck Description
1 Tow truck with 2 axles
2 Tow truck with 3 or more axles
3 frac34 or 1 ton pick-up truck with 2 axles
4 Single unit with 2 axles Cube van step van small dump trucks Some types include soft drink companies cabs without trailers amp flatshybed tow trucks
5 Single unit with 3 axles Includes dump trucks cabs without trailers garbage trucks flat-bed trucks with hydraulic arms
6 Single unit truck with 4 or more axles
7 Single unit truck with ldquopuprdquo Usually a 3 or 4 axle truck pulling a 2 or 3 axle pup Also includes some single flat-beds with attached trailer
8 Single trailer with 4 or less axles
9 Single trailer with 5 axles
10 Single trailer with 6 or more axles
11 Multi-trailer with 5 or less axles
12 Multi-trailer with 6 axles
13 Multi-trailer with 7 or more axles
14 Other truck style If a particular heavy truck does not fit any of the above-noted configurations indicate by 14 on your field sheet
Note This truck classification system was used by the former Regional Municipality of Ottawa-Carleton and is consistent with that used in the Outaouais Region
Interprovincial Roadside Truck Survey Technical Appendices 53
Appendix C Summary of Historical Ottawa River Crossing Truck Traffic Volumes
Interprovincial Roadside Truck Survey Technical Appendices 54
Interprovincial Roadside Truck Survey Technical Appendices 55
Heavy Trucks on the Macdonald-Cartier Bridge HEAVY_TRUCKS_Southbound (12H) (24H) HEAVY_TRUCKS_Northbound (12H) (24H) List of count dates
YEAR 2A 3A TT Southbound Southbound 2A 3A TT Northbound Northbound Year Date Day 1991 1071 1360 1083 1375 1991 22 May Wednesday 1992 1133 1439 1017 1292 1992 23 June Tuesday 1993 1004 1275 887 1126 1993 16 June Wednesday 1994 890 1130 1024 1300 1994 21 June Tuesday 1995 848 1077 730 927 1995 22 June Thursday 1996 806 1024 826 1049 1996 4 June Tuesday 1997 981 1246 887 1126 1997 4 June Wednesday 1998 823 1045 920 1169 1998 2 June Tuesday 1999 872 1107 940 1194 1999 2 June Wednesday
1999 323 173 295 791 1005 354 177 315 846 1075 2000 1 June Thursday 2000 988 1255 980 1245
2000 409 268 339 1016 1290 398 268 346 1012 1285
Heavy Trucks on the Chaudiegravere Bridge HEAVY_TRUCKS_Southbound (12H) (24H) HEAVY_TRUCKS_Northbound (12H) (24H) List of count dates
YEAR 2A 3A TT Southbound Southbound 2A 3A TT Northbound Northbound Year Date Day 1991 382 485 423 537 1991 22 May Wednesday 1992 456 579 474 602 1992 23 June Tuesday 1993 335 425 403 512 1993 16 June Wednesday 1994 311 395 339 431 1994 21 June Tuesday 1995 356 452 396 503 1995 22 June Thursday 1996 303 385 336 427 1996 4 June Tuesday 1997 317 403 381 484 1997 3 June Tuesday 1998 236 300 299 380 1998 2 June Tuesday 1999 329 418 405 514 1999 2 June Wednesday
1999 177 87 47 311 395 209 102 51 362 460 2000 1 June Thursday
2000 304 386 355 451 2000 193 71 59 323 410 217 87 59 362 460
Heavy Trucks on the Macdonald-Cartier and Chaudiegravere bridges HEAVY_TRUCKS_Southbound (12H) (24H) HEAVY_TRUCKS_Northbound (12H) (24H)
YEAR 2A 3A TT Southbound Southbound 2A 3A TT Northbound Northbound
1991 1453 1845 1506 1913 1992 1589 2018 1491 1894 1993 1339 1701 1290 1638 1994 1201 1525 1363 1731 1995 1204 1529 1126 1430 1996 1109 1409 1162 1475 1997 1298 1649 1268 1610 1998 1059 1345 1219 1548 1999 1201 1525 1345 1708
1999 500 260 343 1102 1400 563 280 366 1209 1535 2000 1292 1641 1335 1695
2000 602 339 398 1339 1700 614 354 406 1374 1745
Heavy Trucks on the all 5 bridges HEAVY_TRUCKS_Southbound (12H) HEAVY_TRUCKS_Northbound (12H)
YEAR 2A 3A TT Southbound 2A 3A TT Northbound
1991 1681 1741 1992 1771 1834 1993 1514 1522 1994 1473 1636 1995 1346 1366 1996 1252 1300 1997 1444 1440 1998 1195 1369 1999 1347 1486 2000 1411 1456
Source of data Annual Classification and Occupancy Counts Number of vehicles factored to 12 hours from 8 hour counts Roadside Truck Survey Data
Appendix D Time Period Relationships
Interprovincial Roadside Truck Survey Technical Appendices 56
TIME PERIOD RELATIONSHIPS FOR ALL VEHICLES RELATIONSHIP DIRECTION OF TRAVEL-MORNING DIRECTION OF TRAVEL-AFTERNOON BRDIGE NORTHBOUND SOUTHBOUND BOTH NBampSB NORTHBOUND SOUTHBOUND BOTH NBampSB
Peak HourPeak Period Macdonald-Cartier Chaudiegravere
43-47 43-48
47-52 43-52
46-50 43-49
44-47 41-48
42-46 39-46
43-46 40-47
Peak Hour12 Hours Macdonald-Cartier Chaudiegravere
6-8 9-11
16-19 13-18
11-13 11-14
17-19 13-16
8-9 7-11
12-14 1013
Peak Hour24 Hours Macdonald-Cartier Chaudiegravere
5 6-8
11-14 10-13
8-10 8-10
12-14 9-11
5-6 5-8
9-10 7-10
TIME PERIOD RELATIONSHIPS FOR TRUCKS RELATIONSHIP BRDIGE
DIRECTION OF TRAVEL-MORNING DIRECTION OF TRAVEL-AFTERNOON NORTHBOUND SOUTHBOUND BOTH NBampSB NORTHBOUND SOUTHBOUND BOTH NBampSB
Peak HourPeak Period Macdonald-Cartier Chaudiegravere
37-47 33-53
35-67 34-46
36-58 34-47
33-48 31-52
38-53 33-51
39-48 36-51
Peak Hour12 Hours Macdonald-Cartier Chaudiegravere
8-12 7-14
7-18 7-12
8-14 7-12
7-10 5-11
5-11 4-10
7-10 5-11
Peak Hour24 Hours Macdonald-Cartier Chaudiegravere
6-10 5-11
6-14 6-10
6-11 6-9
5-8 4-9
4-9 3-8
5-7 4-8
Interprovincial Roadside Truck Survey Technical Appendices 57
Appendix E Traffic Zones Comprising the Districts
Interprovincial Roadside Truck Survey Technical Appendices 58
LIST OF TRAFFIC ZONES BY DISTRICT DISTRICT TRAFFIC ZONES
1 Ottawa Central 1 2 3 4 5 6 7 8 9 10 11 12 13 14 15 16 17 18 19 20 21 22 23 24 25 201
2 IGB West
26 27 28 29 30 31 32 33 34 35 36 37 38 39 40 41 42 43 44 45 57 58 59 60 61 62 63 64 65 66 67 120
3 Ottawa West
46 47 48 49 50 51 52 53 54 55 56 121 122 123 124 125 126 127
128 129 130 131 132 133 134 135 136 137 138 190 191 192 193 194 195 206 207 208 209 210 211 212 213 214 215 216 217 218 219 220 221 222 223 224 225 226
4 Ottawa South
68 69 70 71 72 73 74 75 76 77 78 79 80 84 85 87 111 112 113 114 115 116 117 118 119 139 140 196 197 200 205 227 228 229 230 231 232 233
5 IGB East
81 82 83 86 88 89 90 91 92 93 94 95 96 97 98 99 100 101
102 103 104 105 106 107 108 109 110 234
6 Ottawa East 141 142 143 144 145 189 198 199 202 203 204 235 236 237 238 239 240 241 242 243 244 245 246 247
7 Hull 151 152 153 154 155 156 157 158 159 160 161 162 163 164 184 254 255
8 Aylmer 146 147 148 149 150 182 183 186 187 256 257 258
9 Gatineau West 165 166 167 168 169 170 177 185 252 253
10 Gatineau East 171 172 173 174 175 176 178 179 180 181 188 248 249 250 251
IGB - Inside Green Belt
Interprovincial Roadside Truck Survey Technical Appendices 59
Inte
rpro
vinc
ial R
oads
ide
Truc
k Su
rvey
T
echn
ical
App
endi
ces
60
Appendix F District Comparisons of Trucks by Number
Interprovincial Roadside Truck Survey Technical Appendices 61
Interprovincial Roadside Truck Survey Technical Appendices 62
TOTAL NUMBER OF ALL TRUCKS (12 HOURS_DAY)
ZONE GROUP O 1-O
ttaw
a C
ente
r
2-IG
B W
est
3-O
ttaw
a W
est
4-O
ttaw
a So
uth
5-IG
B-E
ast
6-O
ttaw
a E
ast
7-H
ull
8-A
ylm
er
9-G
atin
eau
Wes
t
10-G
atin
eau
Eas
t
TO
TA
L
1-Ottawa Center 3 13 3 50 13 49 5 137 2-IGB West 86 31 20 16 153 3-Ottawa West 4 6 72 45 21 54 201 4-Ottawa South 4 143 28 49 223 5-IGB-East 11 6 178 50 109 89 444 6-Ottawa East 7 11 22 22 19 92 42 13 80 308 7-Hull 69 63 100 50 159 48 490 8-Aylmer 77 81 33 35 32 11 269 9-Gatineau West 72 18 16 66 77 29 277 10-Gatineau East 11 3 45 65 63 15 6 208 TOTAL 244 172 208 251 356 138 620 208 212 300 2709 IGB-Inside Green Belt
TOTAL NUMBER OF 2A TRUCKS (12 HOURS_DAY)
ZONE GROUP O 1-O
ttaw
a C
ente
r
2-IG
B W
est
3-O
ttaw
a W
est
4-O
ttaw
a So
uth
5-IG
B-E
ast
6-O
ttaw
a E
ast
7-H
ull
8-A
ylm
er
9-G
atin
eau
Wes
t
10-G
atin
eau
Eas
t
TO
TA
L
1-Ottawa Center 31 13 18 5 66 2-IGB-West 38 15 10 64 3-Ottawa West 33 5 5 43 4-Ottawa South 51 18 23 92 5-IGB-East 5 120 28 59 51 263 6-Ottawa East 22 13 56 13 13 38 155 7-Hull 53 49 51 40 81 22 296 8-Aylmer 13 6 24 6 18 11 78 9-Gatineau West 24 18 11 18 29 29 127 10-Gatineau East 6 11 18 40 75 TOTAL 100 73 97 81 190 75 329 92 105 117 1260
TOTAL NUMBER OF 3A+ TRUCKS (12 HOURS_DAY)
ZONE GROUP O 1-O
ttaw
a C
ente
r
2-IG
B W
est
3-O
ttaw
a W
est
4-O
ttaw
a So
uth
5-IG
B-E
ast
6-O
ttaw
a E
ast
7-H
ull
8-A
ylm
er
9-G
atin
eau
Wes
t
10-G
atin
eau
Eas
t
TO
TA
L
1-Ottawa Center 12 31 44 2-IGB-West 38 12 6 6 62 3-Ottawa West 22 16 16 16 69 4-Ottawa South 79 6 85 5-IGB-East 6 18 16 44 31 115 6-Ottawa East 6 16 22 7-Hull 9 14 5 48 76 8-Aylmer 58 58 9 124 9-Gatineau West 48 5 48 48 149 10-Gatineau East 5 5 5 14 TOTAL 126 72 23 48 101 175 50 97 69 761
TOTAL NUMBER OF TRACTOR TRAILERS (12 HOURS_DAY)
ZONE GROUP O 1-O
ttaw
a C
ente
r
2-IG
B W
est
3-O
ttaw
a W
est
4-O
ttaw
a So
uth
5-IG
B-E
ast
6-O
ttaw
a E
ast
7-H
ull
8-A
ylm
er
9-G
atin
eau
Wes
t
10-G
atin
eau
Eas
t
TO
TA
L
1-Ottawa Center 3 13 3 7 26 2-IGB-West 10 4 4 10 27 3-Ottawa West 4 6 16 24 39 89 4-Ottawa South 4 13 4 26 46 5-IGB-East 6 39 6 6 6 65 6-Ottawa East 7 11 22 6 29 29 26 131 7-Hull 7 44 11 30 25 117 8-Aylmer 6 17 29 15 67 9-Gatineau West 10-Gatineau East 3 30 47 18 15 6 119 TOTAL 17 28 88 122 65 63 115 67 10 113 688
Interprovincial Roadside Truck Survey Technical Appendices 63
TOTAL NUMBER OF ALL TRUCKS (12 HOURS_NIGHT)
ZONE GROUP O 1-O
ttaw
a C
ente
r
2-IG
B W
est
3-O
ttaw
a W
est
4-O
ttaw
a So
uth
5-IG
B-E
ast
6-O
ttaw
a E
ast
7-H
ull
8-A
ylm
er
9-G
atin
eau
Wes
t
10-G
atin
eau
Eas
t
TO
TA
L
1-Ottawa Center 1 1 3 6 2-IGB West 14 5 1 12 31 3-Ottawa West 32 16 20 68 4-Ottawa South 12 7 4 48 71 5-IGB-East 8 31 23 11 26 99 6-Ottawa East 1 6 3 34 8 16 19 86 7-Hull 27 6 23 13 54 3 125 8-Aylmer 3 7 13 33 45 100 9-Gatineau West 3 4 27 15 15 3 67 10-Gatineau East 4 3 6 59 3 12 87 TOTAL 11 41 53 136 34 121 126 61 32 125 741 IGB-Inside Green Belt
TOTAL NUMBER OF 2A TRUCKS (12 HOURS_NIGHT)
ZONE GROUP O 1-O
ttaw
a C
ente
r
2-IG
B W
est
3-O
ttaw
a W
est
4-O
ttaw
a So
uth
5-IG
B-E
ast
6-O
ttaw
a E
ast
7-H
ull
8-A
ylm
er
9-G
atin
eau
Wes
t
10-G
atin
eau
Eas
t
TO
TA
L
1-Ottawa Center 3 3 2-IGB West 3 3 3-Ottawa West 3 12 15 4-Ottawa South 12 6 12 30 5-IGB-East 3 18 15 36 6-Ottawa East 6 12 15 33 7-Hull 15 18 7 30 70 8-Aylmer 7 3 15 7 32 9-Gatineau West 24 15 15 54 10-Gatineau East 3 15 18 TOTAL 22 30 63 22 37 29 23 12 54 293
TOTAL NUMBER OF 3A+ TRUCKS (12 HOURS_NIGHT)
ZONE GROUP O 1-O
ttaw
a C
ente
r
2-IG
B W
est
3-O
ttaw
a W
est
4-O
ttaw
a So
uth
5-IG
B-E
ast
6-O
ttaw
a E
ast
7-H
ull
8-A
ylm
er
9-G
atin
eau
Wes
t
10-G
atin
eau
Eas
t
TO
TA
L
1-Ottawa Center 2-IGB West 11 11 3-Ottawa West 8 8 4-Ottawa South 5-IGB-East 8 8 8 8 30 6-Ottawa East 7-Hull 3 3 6 8-Aylmer 3 3 26 32 9-Gatineau West 10-Gatineau East 3 26 29 TOTAL 6 3 3 26 37 19 8 8 8 117
TOTAL NUMBER OF TRACTOR TRAILERS (12 HOURS_NIGHT)
ZONE GROUP O 1-O
ttaw
a C
ente
r
2-IG
B W
est
3-O
ttaw
a W
est
4-O
ttaw
a So
uth
5-IG
B-E
ast
6-O
ttaw
a E
ast
7-H
ull
8-A
ylm
er
9-G
atin
eau
Wes
t
10-G
atin
eau
Eas
t
TO
TA
L
1-Ottawa Center 1 1 3 2-IGB West 5 1 12 18 3-Ottawa West 29 9 8 46 4-Ottawa South 1 4 36 41 5-IGB-East 20 5 4 4 33 6-Ottawa East 1 6 3 28 8 4 4 54 7-Hull 9 6 4 6 21 3 49 8-Aylmer 6 18 12 36 9-Gatineau West 3 4 3 3 13 10-Gatineau East 1 3 3 18 3 12 40 TOTAL 5 16 19 47 12 48 78 30 13 63 331
TOTAL NUMBER OF ALL TRUCKS (12 HOURS_DAY+12 HOURS_NIGHT)
ZONE GROUP O 1-O
ttaw
a C
ente
r
2-IG
B W
est
3-O
ttaw
a W
est
4-O
ttaw
a So
uth
5-IG
B-E
ast
6-O
ttaw
a E
ast
7-H
ull
8-A
ylm
er
9-G
atin
eau
Wes
t
10-G
atin
eau
Eas
t
TO
TA
L
1-Ottawa Center 5 14 3 53 13 49 5 142 2-IGB West 100 36 21 28 185 3-Ottawa West 4 6 104 61 21 74 270 4-Ottawa South 4 155 34 4 97 293 5-IGB-East 11 14 209 73 120 115 543 6-Ottawa East 1 7 11 28 25 19 126 50 29 99 395 7-Hull 69 90 106 73 172 102 3 615 8-Aylmer 80 88 46 68 32 56 369 9-Gatineau West 75 22 42 81 92 32 344 10-Gatineau East 15 6 52 124 66 27 6 295 TOTAL 255 213 261 387 390 259 745 270 244 425 3450 IGB-Inside Green Belt
TOTAL NUMBER OF 2A TRUCKS (12 HOURS_DAY+12 HOURS_NIGHT)
ZONE GROUP O 1-O
ttaw
a C
ente
r
2-IG
B W
est
3-O
ttaw
a W
est
4-O
ttaw
a So
uth
5-IG
B-E
ast
6-O
ttaw
a E
ast
7-H
ull
8-A
ylm
er
9-G
atin
eau
Wes
t
10-G
atin
eau
Eas
t
TO
TA
L
1-Ottawa Center 33 13 18 5 69 2-IGB West 41 15 10 67 3-Ottawa West 36 5 5 12 58 4-Ottawa South 63 24 35 122 5-IGB-East 5 123 46 59 66 298 6-Ottawa East 22 13 62 13 25 53 188 7-Hull 53 64 51 58 88 52 366 8-Aylmer 13 13 27 21 18 18 110 9-Gatineau West 24 18 35 33 44 29 181 10-Gatineau East 6 15 33 40 93 TOTAL 100 95 128 145 212 112 358 115 117 172 1553
TOTAL NUMBER OF 3A+ TRUCKS (12 HOURS_DAY+12 HOURS_NIGHT)
ZONE GROUP O 1-O
ttaw
a C
ente
r
2-IG
B W
est
3-O
ttaw
a W
est
4-O
ttaw
a So
uth
5-IG
B-E
ast
6-O
ttaw
a E
ast
7-H
ull
8-A
ylm
er
9-G
atin
eau
Wes
t
10-G
atin
eau
Eas
t
TO
TA
L
1-Ottawa Center 12 31 44 2-IGB West 49 12 6 6 73 3-Ottawa West 22 23 16 16 77 4-Ottawa South 79 6 85 5-IGB-East 6 8 26 16 51 39 146 6-Ottawa East 6 16 22 7-Hull 9 17 5 48 3 83 8-Aylmer 61 58 13 26 157 9-Gatineau West 48 5 48 48 149 10-Gatineau East 8 5 26 5 43 TOTAL 132 75 27 74 101 37 193 57 105 77 878
TOTAL NUMBER OF TRACTOR TRAILERS (12 HOURS_DAY+12 HOURS_NIGHT)
ZONE GROUP O 1-O
ttaw
a C
ente
r
2-IG
B W
est
3-O
ttaw
a W
est
4-O
ttaw
a So
uth
5-IG
B-E
ast
6-O
ttaw
a E
ast
7-H
ull
8-A
ylm
er
9-G
atin
eau
Wes
t
10-G
atin
eau
Eas
t
TO
TA
L
1-Ottawa Center 5 14 3 7 29 2-IGB West 10 8 5 22 45 3-Ottawa West 4 6 46 32 46 135 4-Ottawa South 4 13 5 4 62 87 5-IGB-East 6 60 11 10 10 98 6-Ottawa East 1 7 11 28 3 6 58 37 4 30 185 7-Hull 7 9 50 15 35 46 3 166 8-Aylmer 6 17 6 46 15 12 102 9-Gatineau West 3 4 3 3 13 10-Gatineau East 1 6 32 65 21 27 6 159 TOTAL 22 44 107 169 77 111 193 97 23 176 1019
Interprovincial Roadside Truck Survey Technical Appendices 64
TOTAL NUMBER OF ALL TRUCKS (24 HOURS)
ZONE GROUP O 1-O
ttaw
a C
ente
r
2-IG
B W
est
3-O
ttaw
a W
est
4-O
ttaw
a So
uth
5-IG
B-E
ast
6-O
ttaw
a E
ast
7-H
ull
8-A
ylm
er
9-G
atin
eau
Wes
t
10-G
atin
eau
Eas
t
TO
TA
L
1-Ottawa Center 5 13 3 50 13 45 5 134 2-IGB West 89 37 21 29 176 3-Ottawa West 3 5 110 63 19 68 268 4-Ottawa South 3 142 38 5 104 291 5-IGB-East 11 19 213 75 122 120 561 6-Ottawa East 3 5 8 25 29 18 133 46 30 95 391 7-Hull 65 88 98 73 164 105 5 599 8-Aylmer 71 80 51 68 27 85 383 9-Gatineau West 70 25 59 72 84 34 343 10-Gatineau East 17 8 47 135 63 30 5 304 TOTAL 240 206 267 386 370 299 737 277 242 426 3450 IGB-Inside Green Belt
TOTAL NUMBER OF 2A TRUCKS (24 HOURS)
ZONE GROUP O 1-O
ttaw
a C
ente
r
2-IG
B W
est
3-O
ttaw
a W
est
4-O
ttaw
a So
uth
5-IG
B-E
ast
6-O
ttaw
a E
ast
7-H
ull
8-A
ylm
er
9-G
atin
eau
Wes
t
10-G
atin
eau
Eas
t
TO
TA
L
1-Ottawa Center 33 13 17 5 67 2-IGB West 41 14 9 64 3-Ottawa West 36 5 5 13 58 4-Ottawa South 61 27 35 122 5-IGB-East 5 121 49 57 68 299 6-Ottawa East 24 13 65 13 25 55 194 7-Hull 52 56 53 58 91 48 357 8-Aylmer 11 16 28 17 17 23 111 9-Gatineau West 23 17 49 29 41 29 188 10-Gatineau East 5 17 29 41 93 TOTAL 95 89 147 134 214 112 356 119 113 175 1553
TOTAL NUMBER OF 3A+ TRUCKS (24 HOURS)
ZONE GROUP O 1-O
ttaw
a C
ente
r
2-IG
B W
est
3-O
ttaw
a W
est
4-O
ttaw
a So
uth
5-IG
B-E
ast
6-O
ttaw
a E
ast
7-H
ull
8-A
ylm
er
9-G
atin
eau
Wes
t
10-G
atin
eau
Eas
t
TO
TA
L
1-Ottawa Center 13 28 41 2-IGB West 41 13 6 6 67 3-Ottawa West 20 28 14 14 77 4-Ottawa South 70 6 77 5-IGB-East 6 14 33 14 55 42 165 6-Ottawa East 6 14 20 7-Hull 9 17 4 43 4 77 8-Aylmer 56 51 13 43 163 9-Gatineau West 43 4 43 43 132 10-Gatineau East 9 4 43 4 60 TOTAL 122 69 26 85 90 61 184 61 103 77 878
TOTAL NUMBER OF TRACTOR TRAILERS (24 HOURS)
ZONE GROUP O 1-O
ttaw
a C
ente
r
2-IG
B W
est
3-O
ttaw
a W
est
4-O
ttaw
a So
uth
5-IG
B-E
ast
6-O
ttaw
a E
ast
7-H
ull
8-A
ylm
er
9-G
atin
eau
Wes
t
10-G
atin
eau
Eas
t
TO
TA
L
1-Ottawa Center 5 13 3 5 26 2-IGB West 8 10 5 23 46 3-Ottawa West 3 5 54 31 41 133 4-Ottawa South 3 10 5 5 69 92 5-IGB-East 5 59 13 10 10 97 6-Ottawa East 3 5 8 25 5 5 62 33 5 26 176 7-Hull 5 15 40 15 30 53 5 164 8-Aylmer 5 13 10 51 10 20 109 9-Gatineau West 5 8 5 5 23 10-Gatineau East 3 8 25 63 18 30 5 152 TOTAL 23 48 94 167 66 127 197 97 26 175 1019
Interprovincial Roadside Truck Survey Technical Appendices 65
DIFFERENCE BETWEEN TOTAL NUMBERS OF ALL TRUCKS [(12 HOURS_DAY+12 HOURS_NIGHT)-24 HOURS]
ZONE GROUP O 1-O
ttaw
a C
ente
r
2-IG
B W
est
3-O
ttaw
a W
est
4-O
ttaw
a So
uth
5-IG
B-E
ast
6-O
ttaw
a E
ast
7-H
ull
8-A
ylm
er
9-G
atin
eau
Wes
t
10-G
atin
eau
Eas
t
TO
TA
L
1-Ottawa Center -1 1 1 3 0 4 0 8 2-IGB West 11 -1 0 -2 8 3-Ottawa West 1 1 -7 -2 2 7 2 4-Ottawa South 1 13 -4 -1 -7 2 5-IGB-East 0 -5 -5 -2 -1 -5 -18 6-Ottawa East -2 2 3 3 -3 1 -7 4 -2 4 4 7-Hull 4 2 8 0 7 -3 -2 16 8-Aylmer 8 8 -5 0 5 -29 -14 9-Gatineau West 5 -3 -16 9 8 -2 1 10-Gatineau East -1 -1 5 -11 2 -4 1 -9 TOTAL 16 7 -5 1 20 -40 8 -8 2 -2 0 IGB-Inside Green Belt
DIFFERENCE BETWEEN TOTAL NUMBERS OF 2A TRUCKS [(12 HOURS_DAY+12 HOURS_NIGHT)-24 HOURS]
ZONE GROUP O 1-O
ttaw
a C
ente
r
2-IG
B W
est
3-O
ttaw
a W
est
4-O
ttaw
a So
uth
5-IG
B-E
ast
6-O
ttaw
a E
ast
7-H
ull
8-A
ylm
er
9-G
atin
eau
Wes
t
10-G
atin
eau
Eas
t
TO
TA
L
1-Ottawa Center 1 0 1 0 2 2-IGB West 1 1 1 3 3-Ottawa West 0 0 0 -1 1 4-Ottawa South 2 -3 1 -1 5-IGB-East 0 2 -3 2 -2 0 6-Ottawa East -1 0 -3 0 0 -2 -6 7-Hull 1 8 -2 0 -3 5 9 8-Aylmer 2 -3 -1 4 0 -5 -2 9-Gatineau West 1 0 -14 3 3 0 -7 10-Gatineau East 1 -3 3 -1 1 TOTAL 6 6 -19 11 -3 0 3 -4 4 -3 0
DIFFERENCE BETWEEN TOTAL NUMBERS OF 3A+ TRUCKS [(12 HOURS_DAY+12 HOURS_NIGHT)-24 HOURS]
ZONE GROUP O 1-O
ttaw
a C
ente
r
2-IG
B W
est
3-O
ttaw
a W
est
4-O
ttaw
a So
uth
5-IG
B-E
ast
6-O
ttaw
a E
ast
7-H
ull
8-A
ylm
er
9-G
atin
eau
Wes
t
10-G
atin
eau
Eas
t
TO
TA
L
1-Ottawa Center -1 3 3 2-IGB West 8 -1 0 0 7 3-Ottawa West 1 -5 2 2 0 4-Ottawa South 8 0 8 5-IGB-East 0 -6 -7 2 -4 -3 -19 6-Ottawa East 0 2 1 7-Hull 1 0 0 6 -1 5 8-Aylmer 5 6 0 -17 -6 9-Gatineau West 6 0 6 6 17 10-Gatineau East -1 0 -17 0 -17 TOTAL 10 6 1 -11 11 -24 9 -4 1 0 0
DIFFERENCE BETWEEN TOTAL NUMBERS OF TRACTOR TRAILERS [(12 HOURS_DAY+12 HOURS_NIGHT)-24 HOURS]
ZONE GROUP O 1-O
ttaw
a C
ente
r
2-IG
B W
est
3-O
ttaw
a W
est
4-O
ttaw
a So
uth
5-IG
B-E
ast
6-O
ttaw
a E
ast
7-H
ull
8-A
ylm
er
9-G
atin
eau
Wes
t
10-G
atin
eau
Eas
t
TO
TA
L
1-Ottawa Center -1 1 1 2 4 2-IGB West 2 -2 0 -1 -1 3-Ottawa West 1 1 -8 2 5 1 4-Ottawa South 1 3 0 -1 -8 -6 5-IGB-East 1 1 -1 0 0 1 6-Ottawa East -2 2 3 3 -2 1 -4 4 -1 4 8 7-Hull 2 -7 10 0 5 -7 -2 2 8-Aylmer 1 4 -4 -4 5 -8 -7 9-Gatineau West -2 -3 -2 -2 -9
10-Gatineau East -2 -1 7 2 3 -4 1 7 TOTAL 0 -5 13 1 12 -16 -4 0 -3 2 0
Interprovincial Roadside Truck Survey Technical Appendices 66
Interprovincial Roadside Truck Survey Technical Appendices 67
ABSOLUTE DIFFERENCE BETWEEN TOTAL NUMBERS OF ALL TRUCKS [(12H_DAY+12H_NIGHT)-24H]
ZONE GROUP O 1-O
ttaw
a C
ente
r
2-IG
B W
est
3-O
ttaw
a W
est
4-O
ttaw
a So
uth
5-IG
B-E
ast
6-O
ttaw
a E
ast
7-H
ull
8-A
ylm
er
9-G
atin
eau
Wes
t
10-G
atin
eau
Eas
t
TO
TA
L (
AB
S)
1-Ottawa Center -1 1 1 3 0 4 0 10 2-IGB West 11 -1 0 -2 13 3-Ottawa West 1 1 -7 -2 2 7 20 4-Ottawa South 1 13 -4 -1 -7 26 5-IGB-East 0 -5 -5 -2 -1 -5 19 6-Ottawa East -2 2 3 3 -3 1 -7 4 -2 4 31 7-Hull 4 2 8 0 7 -3 -2 27 8-Aylmer 8 8 -5 0 5 -29 56 9-Gatineau West 5 -3 -16 9 8 -2 43 10-Gatineau East -1 -1 5 -11 2 -4 1 26 TOTAL (ABS) 21 16 38 25 27 48 45 16 11 26 272 IGB-Inside Green Belt
ABSOLUTE DIFFERENCE BETWEEN TOTAL NUMBERS OF 2A TRUCKS [(12H_DAY+12H_NIGHT)-24H]
ZONE GROUP O 1-O
ttaw
a C
ente
r
2-IG
B W
est
3-O
ttaw
a W
est
4-O
ttaw
a So
uth
5-IG
B-E
ast
6-O
ttaw
a E
ast
7-H
ull
8-A
ylm
er
9-G
atin
eau
Wes
t
10-G
atin
eau
Eas
t
TO
TA
L (
AB
S)
1-Ottawa Center 1 0 1 0 2 2-IGB West 1 1 1 3 3-Ottawa West 0 0 0 -1 2 4-Ottawa South 2 -3 1 6 5-IGB-East 0 2 -3 2 -2 9 6-Ottawa East -1 0 -3 0 0 -2 7 7-Hull 1 8 -2 0 -3 5 19 8-Aylmer 2 -3 -1 4 0 -5 15 9-Gatineau West 1 0 -14 3 3 0 22 10-Gatineau East 1 -3 3 -1 8 TOTAL (ABS) 6 12 19 11 9 10 8 8 5 5 92
ABSOLUTE DIFFERENCE BETWEEN TOTAL NUMBERS OF 3A+ TRUCKS [(12H_DAY+12H_NIGHT)-24H]
ZONE GROUP O 1-O
ttaw
a C
ente
r
2-IG
B W
est
3-O
ttaw
a W
est
4-O
ttaw
a So
uth
5-IG
B-E
ast
6-O
ttaw
a E
ast
7-H
ull
8-A
ylm
er
9-G
atin
eau
Wes
t
10-G
atin
eau
Eas
t
TO
TA
L (
AB
S)
1-Ottawa Center -1 3 4 2-IGB West 8 -1 0 0 9 3-Ottawa West 1 -5 2 2 10 4-Ottawa South 8 0 9 5-IGB-East 0 -6 -7 2 -4 -3 22 6-Ottawa East 0 2 2 7-Hull 1 0 0 6 -1 8 8-Aylmer 5 6 0 -17 28 9-Gatineau West 6 0 6 6 17 10-Gatineau East -1 0 -17 0 18 TOTAL (ABS) 12 6 1 22 11 24 26 7 9 7 127
ABSOLUTE DIFFERENCE BETWEEN TOTAL NUMBERS OF TRACTOR TRAILERS [(12H_DAY+12H_NIGHT)-24H]
ZONE GROUP O 1-O
ttaw
a C
ente
r
2-IG
B W
est
3-O
ttaw
a W
est
4-O
ttaw
a So
uth
5-IG
B-E
ast
6-O
ttaw
a E
ast
7-H
ull
8-A
ylm
er
9-G
atin
eau
Wes
t
10-G
atin
eau
Eas
t
TO
TA
L (
AB
S)
1-Ottawa Center -1 1 1 2 5 2-IGB West 2 -2 0 -1 6 3-Ottawa West 1 1 -8 2 5 18 4-Ottawa South 1 3 0 -1 -8 13 5-IGB-East 1 1 -1 0 0 4 6-Ottawa East -2 2 3 3 -2 1 -4 4 -1 4 26 7-Hull 2 -7 10 0 5 -7 -2 33 8-Aylmer 1 4 -4 -4 5 -8 27 9-Gatineau West -2 -3 -2 -2 9 10-Gatineau East -2 -1 7 2 3 -4 1 20 TOTAL (ABS) 10 18 27 11 16 26 20 11 3 20 161
Interprovincial Roadside Truck Survey Technical Appendices 68
COMPARISON OF TOTAL NUMBER OF ALL TRUCKS FOR DIFFERENT PERIOD OF TIME
ZONE GROUP O 1-O
ttaw
a C
ente
r
2-IG
B W
est
3-O
ttaw
a W
est
4-O
ttaw
a So
uth
5-IG
B E
ast
6-O
ttaw
a E
ast
D N D+N 24H D N D+N 24H D N D+N 24H D N D+N 24H D N D+N 24H D N D+N 24H
1-Ottawa Center 3 1 5 5 13 1 14 13 3 3 3 2-IGB West 3-Ottawa West 4 4 3 6 6 5 4-Ottawa South 4 4 3 5-IGB East 11 11 11 6 8 14 19 6-Ottawa East 1 1 3 7 7 5 11 11 8 22 6 28 25 22 3 25 29 19 19 18 7-Hull 69 69 65 63 27 90 88 100 6 106 98 50 23 73 73 159 13 172 164 48 54 102 105 8-Aylmer 77 3 80 71 81 7 88 80 33 13 46 51 35 33 68 68 32 32 27 11 45 56 85 9-Gatineau West 72 3 75 70 18 4 22 25 16 27 42 59 66 15 81 72 77 15 92 84 29 3 32 34 10-Gatineau East 11 4 15 17 3 3 6 8 45 6 52 47 65 59 124 135 63 3 66 63 15 12 27 30 TOTAL 244 11 255 240 172 41 213 206 208 53 261 267 251 136 387 386 356 34 390 370 138 121 259 299
ZONE GROUP O 7-H
ull
8-A
ylm
er
9-G
atin
eau
Wes
t
10-G
atin
eau
Eas
t
TO
TA
L
D N D+N 24H D N D+N 24H D N D+N 24H D N D+N 24H D N D+N 24H 1-Ottawa Center 50 3 53 50 13 13 13 49 49 45 5 5 5 137 6 142 134 2-IGB West 86 14 100 89 31 5 36 37 20 1 21 21 16 12 28 29 153 31 185 176 3-Ottawa West 72 32 104 110 45 16 61 63 21 21 19 54 20 74 68 201 68 270 268 4-Ottawa South 143 12 155 142 28 7 34 38 4 4 5 49 48 97 104 223 71 293 291 5-IGB East 178 31 209 213 50 23 73 75 109 11 120 122 89 26 115 120 444 99 543 561 6-Ottawa East 92 34 126 133 42 8 50 46 13 16 29 30 80 19 99 95 308 86 395 391 7-Hull 3 3 5 490 125 615 599 8-Aylmer 269 100 369 383 9-Gatineau West 277 67 344 343 10-Gatineau East 6 6 5 208 87 295 304 TOTAL 620 126 745 737 208 61 270 277 212 32 244 242 300 125 425 426 2709 741 3450 3450 IGB-Inside Green Belt D - DAY (700 - 1700) N - NIGHT (1900 - 700) 24H - 24 HOUR PERIOD
COMPARISON OF TOTAL NUMBER OF 2A TRUCKS FOR DIFFERENT PERIOD OF TIME
ZONE GROUP O 1-O
ttaw
a C
ente
r
2-IG
B W
est
3-O
ttaw
a W
est
4-O
ttaw
a So
uth
5-IG
B E
ast
6-O
ttaw
a E
ast
D N D+N 24H D N D+N 24H D N D+N 24H D N D+N 24H D N D+N 24H D N D+N 24H
1-Ottawa Center 2-IGB West 3-Ottawa West 4-Ottawa South 5-IGB East 5 5 5 6-Ottawa East 22 22 24 13 13 13 7-Hull 53 53 52 49 15 64 56 51 51 53 40 18 58 58 81 7 88 91 22 30 52 48 8-Aylmer 13 13 11 6 7 13 16 24 3 27 28 6 15 21 17 18 18 17 11 7 18 23 9-Gatineau West 24 24 23 18 18 17 11 24 35 49 18 15 33 29 29 15 44 41 29 29 29 10-Gatineau East 6 6 5 11 3 15 17 18 15 33 29 40 40 41 TOTAL 100 100 95 73 22 95 89 97 30 128 147 81 63 145 134 190 22 212 214 75 37 112 112
ZONE GROUP O 7-H
ull
8-A
ylm
er
9-G
atin
eau
Wes
t
10-G
atin
eau
Eas
t
TO
TA
L
D N D+N 24H D N D+N 24H D N D+N 24H D N D+N 24H D N D+N 24H 1-Ottawa Center 31 3 33 33 13 13 13 18 18 17 5 5 5 66 3 69 67 2-IGB West 38 3 41 41 15 15 14 10 10 9 64 3 67 64 3-Ottawa West 33 3 36 36 5 5 5 5 5 5 12 12 13 43 15 58 58 4-Ottawa South 51 12 63 61 18 6 24 27 23 12 35 35 92 30 122 122 5-IGB East 120 3 123 121 28 18 46 49 59 59 57 51 15 66 68 263 36 298 299 6-Ottawa East 56 6 62 65 13 13 13 13 12 25 25 38 15 53 55 155 33 188 194 7-Hull 296 70 366 357 8-Aylmer 78 32 110 111 9-Gatineau West 127 54 181 188 10-Gatineau East 75 18 93 93 TOTAL 329 29 358 356 92 23 115 119 105 12 117 113 117 54 172 175 1260 293 1553 1553
COMPARISON OF TOTAL NUMBER OF 3A+ TRUCKS FOR DIFFERENT PERIOD OF TIME
ZONE GROUP O 1-O
ttaw
a C
ente
r
2-IG
B W
est
3-O
ttaw
a W
est
4-O
ttaw
a So
uth
5-IG
B E
ast
6-O
ttaw
a E
ast
D N D+N 24H D N D+N 24H D N D+N 24H D N D+N 24H D N D+N 24H D N D+N 24H 1-Ottawa Center 2-IGB West 3-Ottawa West 4-Ottawa South 5-IGB East 6 6 6 8 8 14 6-Ottawa East 7-Hull 9 9 9 14 3 17 17 5 5 4 48 48 43 3 3 4 8-Aylmer 58 3 61 56 58 58 51 9 3 13 13 26 26 43 9-Gatineau West 48 48 43 5 5 4 48 48 43 48 48 43 10-Gatineau East 5 3 8 9 5 5 4 26 26 43 5 5 4 TOTAL 126 6 132 122 72 3 75 69 23 3 27 26 48 26 74 85 101 101 90 37 37 61
ZONE GROUP O 7-H
ull
8-A
ylm
er
9-G
atin
eau
Wes
t
10-G
atin
eau
Eas
t
TO
TA
L
D N D+N 24H D N D+N 24H D N D+N 24H D N D+N 24H D N D+N 24H 1-Ottawa Center 12 12 13 31 31 28 44 44 41 2-IGB West 38 11 49 41 12 12 13 6 6 6 6 6 6 62 11 73 67 3-Ottawa West 22 22 20 16 8 23 28 16 16 14 16 16 14 69 8 77 77 4-Ottawa South 79 79 70 6 6 6 85 85 77 5-IGB East 18 8 26 33 16 16 14 44 8 51 55 31 8 39 42 115 30 146 165 6-Ottawa East 6 6 6 16 16 14 22 22 20 7-Hull 76 6 83 77 8-Aylmer 124 32 157 163 9-Gatineau West 149 149 132 10-Gatineau East 14 29 43 60 TOTAL 175 19 193 184 50 8 57 61 97 8 105 103 69 8 77 77 761 117 878 878
COMPARISON OF TOTAL NUMBER OF TRACTOR TRAILERS FOR DIFFERENT PERIOD OF TIME
ZONE GROUP O 1-O
ttaw
a C
ente
r
2-IG
B W
est
3-O
ttaw
a W
est
4-O
ttaw
a So
uth
5-IG
B E
ast
6-O
ttaw
a E
ast
D N D+N 24H D N D+N 24H D N D+N 24H D N D+N 24H D N D+N 24H D N D+N 24H 1-Ottawa Center 3 1 5 5 13 1 14 13 3 3 3 2-IGB West 3-Ottawa West 4 4 3 6 6 5 4-Ottawa South 4 4 3 5-IGB East 6 6 5 6-Ottawa East 1 1 3 7 7 5 11 11 8 22 6 28 25 3 3 5 6 6 5 7-Hull 7 7 5 9 9 15 44 6 50 40 11 4 15 15 30 6 35 30 25 21 46 53 8-Aylmer 6 6 5 17 17 13 6 6 10 29 18 46 51 15 15 10 12 12 20 9-Gatineau West 3 3 5 4 4 8 3 3 5 3 3 5 10-Gatineau East 1 1 3 3 3 6 8 30 3 32 25 47 18 65 63 18 3 21 18 15 12 27 30 TOTAL 17 5 22 23 28 16 44 48 88 19 107 94 122 47 169 167 65 12 77 66 63 48 111 127
ZONE GROUP O 7-H
ull
8-A
ylm
er
9-G
atin
eau
Wes
t
10-G
atin
eau
Eas
t
TO
TA
L
D N D+N 24H D N D+N 24H D N D+N 24H D N D+N 24H D N D+N 24H 1-Ottawa Center 7 7 5 26 3 29 26 2-IGB West 10 10 8 4 5 8 10 4 1 5 5 10 12 22 23 27 18 45 46 3-Ottawa West 16 29 46 54 24 9 32 31 39 8 46 41 89 46 135 133 4-Ottawa South 13 13 10 4 1 5 5 4 4 5 26 36 62 69 46 41 87 92 5-IGB East 39 20 60 59 6 5 11 13 6 4 10 10 6 4 10 10 65 33 98 97 6-Ottawa East 29 28 58 62 29 8 37 33 4 4 5 26 4 30 26 131 54 185 176 7-Hull 3 3 5 117 49 166 164 8-Aylmer 67 36 102 109 9-Gatineau West 13 13 23 10-Gatineau East 6 6 5 119 40 159 152 TOTAL 115 78 193 197 67 30 97 97 10 13 23 26 113 63 176 175 688 331 1019 1019
Interprovincial Roadside Truck Survey Technical Appendices 69
Appendix G District Comparisons of Trucks by Percent
Interprovincial Roadside Truck Survey Technical Appendices 70
Interprovincial Roadside Truck Survey Technical Appendices 71
COMPARISON OF PERCENTS OF ALL TRUCKS FOR DIFFERENT PERIOD OF TIME ()
ZONE GROUP O 1-O
ttaw
a C
ente
r
2-IG
B W
est
3-O
ttaw
a W
est
4-O
ttaw
a So
uth
5-IG
B E
ast
6-O
ttaw
a E
ast
D N D+N 24H D N D+N 24H D N D+N 24H D N D+N 24H D N D+N 24H D N D+N 24H
1-Ottawa Center 0 0 0 0 0 0 0 0 0 0 0 2-IGB West 3-Ottawa West 0 0 0 0 0 0 4-Ottawa South 0 0 0 5-IGB East 0 0 0 0 1 0 1 6-Ottawa East 0 0 0 0 0 0 0 0 0 1 1 1 1 1 0 1 1 1 1 1 7-Hull 3 2 2 2 4 3 3 4 1 3 3 2 3 2 2 6 2 5 5 2 7 3 3 8-Aylmer 3 0 2 2 3 1 3 2 1 2 1 1 1 4 2 2 1 1 1 0 6 2 2 9-Gatineau West 3 0 2 2 1 1 1 1 1 4 1 2 2 2 2 2 3 2 3 2 1 0 1 1 10-Gatineau East 0 1 0 0 0 0 0 0 2 1 1 1 2 8 4 4 2 0 2 2 1 2 1 1 TOTAL 9 2 7 7 6 6 6 6 8 7 8 8 9 18 11 11 13 5 11 11 5 16 8 9
ZONE GROUP O 7-H
ull
8-A
ylm
er
9-G
atin
eau
Wes
t
10-G
atin
eau
Eas
t
TO
TA
L
D N D+N 24H D N D+N 24H D N D+N 24H D N D+N 24H D N D+N 24H
1-Ottawa Center 2 0 2 1 0 0 0 2 1 1 0 0 0 5 1 4 4 2-IGB West 3 2 3 3 1 1 1 1 1 0 1 1 1 2 1 1 6 4 5 5 3-Ottawa West 3 4 3 3 2 2 2 2 1 1 1 2 3 2 2 7 9 8 8 4-Ottawa South 5 2 4 4 1 1 1 1 1 0 0 2 6 3 3 8 10 9 8 5-IGB East 7 4 6 6 2 3 2 2 4 2 3 4 3 4 3 3 16 13 16 16 6-Ottawa East 3 5 4 4 2 1 1 1 0 2 1 1 3 3 3 3 11 12 11 11 7-Hull 0 0 0 18 17 18 17 8-Aylmer 10 13 11 11 9-Gatineau West 10 9 10 10 10-Gatineau East 0 0 0 8 12 9 9 TOTAL 23 17 22 21 8 8 8 8 8 4 7 7 11 17 12 12 100 100 100 100 IGB-Inside Green Belt D - DAY (700 - 1700) N - NIGHT (1900 - 700) 24H - 24 HOURS
COMPARISON OF PERCENTS OF 2A TRUCKS FOR DIFFERENT PERIOD OF TIME ()
ZONE GROUP O 1-O
ttaw
a C
ente
r
2-IG
B W
est
3-O
ttaw
a W
est
4-O
ttaw
a So
uth
5-IG
B E
ast
6-O
ttaw
a E
ast
D N D+N 24H D N D+N 24H D N D+N 24H D N D+N 24H D N D+N 24H D N D+N 24H
1-Ottawa Center 2-IGB West 3-Ottawa West 4-Ottawa South 5-IGB East 0 0 0 6-Ottawa East 2 1 2 1 1 1 7-Hull 4 3 3 4 5 4 4 4 3 3 3 6 4 4 6 2 6 6 2 10 3 3 8-Aylmer 1 1 1 1 2 1 1 2 1 2 2 1 5 1 1 1 1 1 1 2 1 1 9-Gatineau West 2 2 1 1 1 1 1 8 2 3 1 5 2 2 2 5 3 3 2 2 2 10-Gatineau East 1 0 0 1 1 1 1 1 5 2 2 3 3 3 TOTAL 8 6 6 6 7 6 6 8 10 8 9 6 22 9 9 15 7 14 14 6 13 7 7
ZONE GROUP O 7-H
ull
8-A
ylm
er
9-G
atin
eau
Wes
t
10-G
atin
eau
Eas
t
TO
TA
L
D N D+N 24H D N D+N 24H D N D+N 24H D N D+N 24H D N D+N 24H 1-Ottawa Center 2 1 2 2 1 1 1 1 1 1 0 0 0 5 1 4 4 2-IGB West 3 1 3 3 1 1 1 1 1 1 5 1 4 4 3-Ottawa West 3 1 2 2 0 0 0 0 0 0 4 1 1 3 5 4 4 4-Ottawa South 4 4 4 4 1 2 2 2 2 4 2 2 7 10 8 8 5-IGB East 10 1 8 8 2 6 3 3 5 4 4 4 5 4 4 21 12 19 19 6-Ottawa East 4 2 4 4 1 1 1 1 4 2 2 3 5 3 4 12 11 12 13 7-Hull 24 24 24 23 8-Aylmer 6 11 7 7 9-Gatineau West 10 18 12 12 10-Gatineau East 6 6 6 6 TOTAL 26 10 23 23 7 8 7 8 8 4 8 7 9 19 11 11 100 100 100 100
Interprovincial Roadside Truck Survey Technical Appendices 72
COMPARISON OF PERCENTS OF 3A+ TRUCKS FOR DIFFERENT PERIOD OF TIME ()
ZONE GROUP O 1-O
ttaw
a C
ente
r
2-IG
B W
est
3-O
ttaw
a W
est
4-O
ttaw
a So
uth
5-IG
B E
ast
6-O
ttaw
a E
ast
D N D+N 24H D N D+N 24H D N D+N 24H D N D+N 24H D N D+N 24H D N D+N 24H 1-Ottawa Center 2-IGB West 3-Ottawa West 4-Ottawa South 5-IGB East 1 1 1 6 1 2 6-Ottawa East 7-Hull 1 1 1 2 3 2 2 1 1 0 6 5 5 3 0 0 8-Aylmer 8 3 7 6 8 7 6 1 3 1 1 22 3 5 9-Gatineau West 6 5 5 1 1 0 6 5 5 6 5 5 10-Gatineau East 1 3 1 1 1 1 0 22 3 5 1 1 0 TOTAL 17 5 15 14 9 3 9 8 3 3 3 3 6 22 8 10 13 12 10 31 4 7
ZONE GROUP O 7-H
ull
8-A
ylm
er
9-G
atin
eau
Wes
t
10-G
atin
eau
Eas
t
TO
TA
L
D N D+N 24H D N D+N 24H D N D+N 24H D N D+N 24H D N D+N 24H 1-Ottawa Center 2 1 1 4 4 3 6 5 5 2-IGB West 5 9 6 5 2 1 1 1 1 1 1 1 1 8 9 8 8 3-Ottawa West 3 2 2 2 6 3 3 2 2 2 2 2 2 9 6 9 9 4-Ottawa South 10 9 8 1 1 1 11 10 9 5-IGB East 2 6 3 4 2 2 2 6 6 6 6 4 6 4 5 15 26 17 19 6-Ottawa East 1 1 1 2 2 2 3 2 2 7-Hull 10 5 9 9 8-Aylmer 16 28 18 19 9-Gatineau West 20 17 15 10-Gatineau East 2 25 5 7 TOTAL 23 16 22 21 7 6 7 7 13 6 12 12 9 6 9 9 100 100 100 100
COMPARISON OF PERCENTS OF TRACTOR TRAILERS FOR DIFFERENT PERIOD OF TIME ()
ZONE GROUP O 1-O
ttaw
a C
ente
r
2-IG
B W
est
3-O
ttaw
a W
est
4-O
ttaw
a So
uth
5-IG
B E
ast
6-O
ttaw
a E
ast
D N D+N 24H D N D+N 24H D N D+N 24H D N D+N 24H D N D+N 24H D N D+N 24H 1-Ottawa Center 0 0 0 1 2 0 1 1 0 0 0 2-IGB West 3-Ottawa West 1 0 0 1 1 1 4-Ottawa South 1 0 0 5-IGB East 1 1 1 6-Ottawa East 0 0 0 1 1 0 2 1 1 3 2 3 2 1 0 0 1 1 1 7-Hull 1 1 0 3 1 1 6 2 5 4 2 1 1 1 4 2 3 3 4 6 5 5 8-Aylmer 1 1 1 2 2 1 2 1 1 4 5 5 5 2 1 1 4 1 2 9-Gatineau West 1 0 0 1 0 1 1 0 0 1 0 0 10-Gatineau East 0 0 0 0 1 1 1 4 1 3 2 7 5 6 6 3 1 2 2 2 4 3 3 TOTAL 3 2 2 2 4 5 4 5 13 6 10 9 18 14 17 16 10 4 8 6 9 14 11 12
ZONE GROUP O 7-H
ull
8-A
ylm
er
9-G
atin
eau
Wes
t
10-G
atin
eau
Eas
t
TO
TA
L
D N D+N 24H D N D+N 24H D N D+N 24H D N D+N 24H D N D+N 24H 1-Ottawa Center 1 1 0 4 1 3 3 2-IGB West 1 1 1 1 1 1 1 1 0 0 0 1 4 2 2 4 5 4 5 3-Ottawa West 2 9 4 5 3 3 3 3 6 2 5 4 13 14 13 13 4-Ottawa South 2 1 1 1 0 0 0 1 0 1 4 11 6 7 7 12 9 9 5-IGB East 6 6 6 6 1 1 1 1 1 1 1 1 1 1 1 1 9 10 10 10 6-Ottawa East 4 9 6 6 4 2 4 3 1 0 1 4 1 3 3 19 16 18 17 7-Hull 1 0 0 17 15 16 16 8-Aylmer 10 11 10 11 9-Gatineau West 4 1 2 10-Gatineau East 1 1 1 17 12 16 15 TOTAL 17 24 19 19 10 9 10 10 1 4 2 3 16 19 17 17 100 100 100 100
Appendix H Survey Expansion Factors
Interprovincial Roadside Truck Survey Technical Appendices 73
Interprovincial Roadside Truck Survey Technical Appendices
74
NB SB NB SB NB SB NB SB NB SB NB SB NB SB NB SB NB SB NB SB NB SB NB SB NB SB NB SB
2000 Interprovincial Roadside Truck Survey Sample Size by Time of Day
Sam
ple
Siz
e
100
90
80
70
60
50
40
30
20
10
0
24 HR PERIOD
NIGHT (1900-600)
AM PEAK (600-1000)
MIDDAY (1000-1500)
PM PEAK (1500-1900)
NIGHT (1900-700)
DAY (700-1900)
100
90
80
70
60
50
40
30
20
10
0
Chaudiegravere Chaudiegravere Chaudiegravere Chaudiegravere Chaudiegravere Chaudiegravere Chaudiegravere
Macdonald- Macdonald- Macdonald- Macdonald- Macdonald-Macdonald-Macdonald-
Cartier Cartier Cartier Cartier Cartier CartierCartier
2A Trucks 3A Trucks T Trailers
EXPANSION FACTORS FOR TRUCKS BY BRIDGE DIRECTION TIME PERIOD AND TYPE OF TRUCKS BRIDGE DIRECTION PERIOD 2A Trucks 3A+ Trucks Tractor Trailers
Chaudiegravere Northbound
24 HOUR TOTAL 464 641 252 NIGHT (1900-700) 283 1100 100 DAY (700-1900) 511 613 359 ALL OTHER 270 1100 091 AM PEAK(600-1000) 384 667 214 MIDDAY(1000-1500) 622 600 388 PM PEAK(1500-1900) 517 600 567
Chaudiegravere Southbound
24 HOUR TOTAL 532 433 259 NIGHT (1900-700) 338 320 140 DAY (700-1900) 632 469 321 ALL OTHER 283 200 130 AM PEAK(600-1000) 428 533 243 MIDDAY(1000-1500) 850 475 1350 PM PEAK(1500-1900) 740 433 180
Macdonald-Cartier Northbound
24 HOUR TOTAL 1265 1404 514 NIGHT (1900-700) 1214 760 389 DAY (700-1900) 1276 1574 645 ALL OTHER 1083 967 356 AM PEAK(600-1000) 1489 940 606 MIDDAY(1000-1500) 1244 1825 813 PM PEAK(1500-1900) 1200 2267 507
Macdonald-Cartier Southbound
24 HOUR TOTAL 1189 4263 505 NIGHT (1900-700) 1500 2600 298 DAY (700-1900) 1119 4817 738 ALL OTHER 1171 3000 263 AM PEAK(600-1000) 7900 12200 1620 MIDDAY(1000-1500) 958 3750 865 PM PEAK(1500-1900) 631 1950 423
Appendix I Trip Characteristics
Interprovincial Roadside Truck Survey Technical Appendices
75
Truck trip characteristics
BRIDGE DIRECTION Location O Location D SUM 2A SUM 3A+ SUM Trailer SUM TRUCKS Chaudiegravere Northbound EXTERNAL EXTERNAL 755 755
EXTERNAL INTERNAL 929 641 2769 4339
INTERNAL EXTERNAL 464 464
INTERNAL INTERNAL 26007 10259 3776 40041
Summary for DIRECTION = Northbound
Sum 27400 10900 7300 45600 Chaudiegravere Southbound EXTERNAL EXTERNAL 517 517
EXTERNAL INTERNAL 1064 1293 2357
INTERNAL EXTERNAL 532 433 2845 3810
INTERNAL INTERNAL 23404 8667 2845 34916
Summary for DIRECTION = Southbound
Sum 25000 9100 7500 41600 Summary for BRIDGE = Chaudiegravere
Sum 52400 20000 14800 87200 Macdonald-Cartier Northbound EXTERNAL EXTERNAL 2530 6167 8697
EXTERNAL INTERNAL 8855 2808 23128 34791 INTERNAL EXTERNAL 3795 1404 2056 7255
INTERNAL INTERNAL 35420 29488 12849 77756
Summary for DIRECTION = Northbound
Sum 50600 33700 44200 128500 Macdonald-Cartier Southbound EXTERNAL EXTERNAL 1189 6561 7750
EXTERNAL INTERNAL 4755 4263 7571 16588
INTERNAL EXTERNAL 4755 4263 18674 27691
INTERNAL INTERNAL 41602 25575 10094 77271
Summary for DIRECTION = Southbound
Sum 52300 34100 42900 129300 Summary for BRIDGE = Macdonald-Cartier
Sum 102900 67800 87100 257800
Grand Total 155300 87800 101900 345000
Interprovincial Roadside Truck Survey Technical Appendices
76
Appendix J Origins and Destinations of Truck Trips by Direction
Interprovincial Roadside Truck Survey Technical Appendices
77
Interprovincial Roadside Truck Survey Technical Appendices
78
Origins and Destinations of Truck Trips (Northbound direction)
1 Ottawa Central
5 IGB East
2 IGB West
3 Ottawa West
4 Ottawa South
6 Ottawa East
7 Hull
8 Aylmer
9 Gatineau West
10 Gatineau East
Queacutebec
Ontario
2 Axle Trucks
3+ Axles Trucks
Tractor Trailers
Total number of trucks (Origins in Ontario Destinatios in Queacutebec)
IGB ndash Inside Green Belt
xxx
(Autumn 2000)
Origins and Destinations of Truck Trips (Southbound Direction)
1 Ottawa Central
5 IGB East
2 IGB West
3 Ottawa West
4 Ottawa South
6 Ottawa East
7 Hull
8 Aylmer
9 Gatineau West
10 Gatineau East
Queacutebec
Ontario
2 Axle Trucks
3+ Axles Trucks
Tractor Trailers
Total number of trucks (Origins in Queacutebec Destinatios in Ontario)
IGB ndash Inside Green Belt
xxx
(Autumn 2000)
Appendix K Concentration of Truck Trip Ends
Interprovincial Roadside Truck Survey Technical Appendices
79
Number of trucks by traffic zone (Origin+Destination) 13 traffic zones accounted for 40 of all trucks (O+D)
No Zone Trucks Trucks_cumul Trucks_cumul ()
1 162 578 578 8 2 88 463 1041 15 3 189 358 1399 20 4 120 246 1645 24 5 158 194 1839 27 6 167 182 2021 29 7 89 176 2197 32 8 200 163 2360 34 9 174 157 2517 36 10 146 148 2665 39 11 83 147 2812 41 12 190 139 2951 43 13 111 132 3083 45 14 187 132 3215 47 15 168 118 3333 48 16 186 103 3436 50 17 184 101 3537 51 18 164 101 3638 53 19 161 98 3736 54 20 198 98 3834 56 21 188 95 3929 57 22 8 91 4020 58 23 171 91 4111 60 24 177 86 4197 61 25 179 84 4281 62 26 169 82 4363 63 27 55 76 4439 64 28 173 75 4514 65 29 155 71 4585 66 30 159 70 4655 67 31 257 69 4724 68 32 116 65 4789 69 33 10 56 4845 70 34 16 55 4900 71 35 147 55 4955 72 36 183 51 5006 73 37 172 51 5057 73 38 180 51 5108 74 39 251 50 5158 75 40 205 50 5208 75 41 139 48 5256 76 42 191 46 5302 77 43 93 42 5344 77 44 1 40 5384 78 45 154 39 5423 79 46 196 39 5462 79 47 199 37 5499 80 48 121 37 5536 80 49 193 36 5572 81 50 192 35 5607 81 51 150 35 5642 82 52 252 32 5674 82 53 153 30 5704 83 54 237 30 5734 83 55 141 30 5764 84 56 166 29 5793 84 57 254 27 5820 84
No Zone Trucks Trucks_cumul Trucks_cumul ()
1 162 578 578 8 2 88 463 1041 15 3 120 246 1287 19 4 158 194 1481 21 5 167 182 1663 24 6 89 176 1839 27 7 174 157 1996 29 8 146 148 2144 31 9 83 147 2291 33
10 111 132 2423 35 11 168 118 2541 37 12 184 101 2642 38 13 164 101 2743 40
20 traffic zones accounted for 20 of all trucks (O+D)
No Zone Trucks Trucks_cumul Trucks_cumul ()
1 161 98 98 1 2 8 91 189 3 3 171 91 280 4 4 177 86 366 5 5 179 84 450 7 6 169 82 532 8 7 55 76 608 9 8 173 75 683 10 9 155 71 754 11
10 159 70 824 12 11 257 69 893 13 12 116 65 958 14 13 10 56 1014 15 14 16 55 1069 15 15 147 55 1124 16 16 183 51 1175 17 17 172 51 1226 18 18 180 51 1277 19 19 251 50 1327 19 20 205 50 1377 20
15 external traffic zones accounted for 19 of all trucks (O+D)
No Zone Trucks Trucks_cumul Trucks_cumul ()
1 189 358 358 5 2 200 163 521 8 3 190 139 660 10 4 187 132 792 11 5 186 103 895 13 6 198 98 993 14 7 188 95 1088 16 8 191 46 1134 16 9 196 39 1173 17
10 199 37 1210 18 11 193 36 1246 18 12 192 35 1281 19 13 194 9 1290 19 14 195 7 1297 19 15 197 3 1300 19
Interprovincial Roadside Truck Survey Technical Appendices
80
Number of trucks by traffic zone (Origin+Destination) No Zone Trucks Trucks_cumul Trucks_cumul () 58 204 27 5847 85 59 90 26 5873 85 60 143 26 5899 85 61 80 26 5925 86 62 119 24 5949 86 63 238 24 5973 87 64 253 24 5997 87 65 175 23 6020 87 66 136 23 6043 88 67 151 23 6066 88 68 233 23 6089 88 69 54 22 6111 89 70 249 22 6133 89 71 258 22 6155 89 72 39 21 6176 90 73 115 21 6197 90 74 66 21 6218 90 75 130 20 6238 90 76 4 19 6257 91 77 165 18 6275 91 78 117 17 6292 91 79 17 17 6309 91 80 170 17 6326 92 81 20 17 6343 92 82 12 16 6359 92 83 7 16 6375 92 84 75 16 6391 93 85 97 15 6406 93 86 107 14 6420 93 87 76 14 6434 93 88 110 14 6448 93 89 22 13 6461 94 90 145 13 6474 94 91 26 13 6487 94 92 125 13 6500 94 93 35 13 6513 94 94 19 13 6526 95 95 37 13 6539 95 96 28 13 6552 95 97 255 12 6564 95 98 70 12 6576 95 99 134 11 6587 95 100 176 11 6598 96 101 91 11 6609 96 102 135 11 6620 96 103 140 11 6631 96 104 2 10 6641 96 105 51 10 6651 96 106 148 10 6661 97 107 40 9 6670 97
Interprovincial Roadside Truck Survey Technical Appendices
81
Number of trucks by traffic zone (Origin+Destination) No Zone Trucks Trucks_cumul Trucks_cumul ()
108 194 9 6679 97 109 157 9 6688 97 110 63 8 6696 97 111 250 8 6704 97 112 41 8 6712 97 113 24 8 6720 97 114 210 8 6728 98 115 105 7 6735 98 116 149 7 6742 98 117 195 7 6749 98 118 239 7 6756 98 119 256 6 6762 98 120 103 6 6768 98 121 11 6 6774 98 122 29 6 6780 98 123 43 6 6786 98 124 50 6 6792 98 125 57 6 6798 99 126 220 6 6804 99 127 126 6 6810 99 128 6 5 6815 99 129 156 5 6820 99 130 207 5 6825 99 131 34 5 6830 99 132 42 5 6835 99 133 67 5 6840 99 134 3 5 6845 99 135 112 5 6850 99 136 123 5 6855 99 137 77 5 6860 99 138 18 5 6865 99 139 98 5 6870 100 140 230 3 6873 100 141 9 3 6876 100 142 197 3 6879 100 143 95 3 6882 100 144 106 3 6885 100 145 73 3 6888 100 146 152 3 6891 100 147 240 3 6894 100 148 23 3 6897 100 149 178 3 6900 100
Interprovincial Roadside Truck Survey Technical Appendices
82
Appendix L Tabulations of Trip Origins and Destinations by Truck Classification
Interprovincial Roadside Truck Survey Technical Appendices
83
TOTAL NUMBER OF ALL TRUCKS (12 HOURS_DAY+12 HOURS_NIGHT)
ZONE GROUP O 1-O
ttaw
a C
ente
r
2-IG
B W
est
3-O
ttaw
a W
est
4-O
ttaw
a So
uth
5-IG
B-E
ast
6-O
ttaw
a E
ast
7-H
ull
8-A
ylm
er
9-G
atin
eau
Wes
t
10-G
atin
eau
Eas
t
TO
TA
L
1-Ottawa Center 5 14 3 53 13 49 5 142 2-IGB West 100 36 21 28 185 3-Ottawa West 4 6 104 61 21 74 270 4-Ottawa South 4 155 34 4 97 293 5-IGB-East 11 14 209 73 120 115 543 6-Ottawa East 1 7 11 28 25 19 126 50 29 99 395 7-Hull 69 90 106 73 172 102 3 615 8-Aylmer 80 88 46 68 32 56 369 9-Gatineau West 75 22 42 81 92 32 344 10-Gatineau East 15 6 52 124 66 27 6 295 TOTAL 255 213 261 387 390 259 745 270 244 425 3450 IGB-Inside Green Belt
TOTAL NUMBER OF 2A TRUCKS (12 HOURS_DAY+12 HOURS_NIGHT)
ZONE GROUP O 1-O
ttaw
a C
ente
r
2-IG
B W
est
3-O
ttaw
a W
est
4-O
ttaw
a So
uth
5-IG
B-E
ast
6-O
ttaw
a E
ast
7-H
ull
8-A
ylm
er
9-G
atin
eau
Wes
t
10-G
atin
eau
Eas
t
TO
TA
L
1-Ottawa Center 33 13 18 5 69 2-IGB West 41 15 10 67 3-Ottawa West 36 5 5 12 58 4-Ottawa South 63 24 35 122 5-IGB-East 5 123 46 59 66 298 6-Ottawa East 22 13 62 13 25 53 188 7-Hull 53 64 51 58 88 52 366 8-Aylmer 13 13 27 21 18 18 110 9-Gatineau West 24 18 35 33 44 29 181 10-Gatineau East 6 15 33 40 93 TOTAL 100 95 128 145 212 112 358 115 117 172 1553
TOTAL NUMBER OF 3A+ TRUCKS (12 HOURS_DAY+12 HOURS_NIGHT)
ZONE GROUP O 1-O
ttaw
a C
ente
r
2-IG
B W
est
3-O
ttaw
a W
est
4-O
ttaw
a So
uth
5-IG
B-E
ast
6-O
ttaw
a E
ast
7-H
ull
8-A
ylm
er
9-G
atin
eau
Wes
t
10-G
atin
eau
Eas
t
TO
TA
L
1-Ottawa Center 12 31 44 2-IGB West 49 12 6 6 73 3-Ottawa West 22 23 16 16 77 4-Ottawa South 79 6 85 5-IGB-East 6 8 26 16 51 39 146 6-Ottawa East 6 16 22 7-Hull 9 17 5 48 3 83 8-Aylmer 61 58 13 26 157 9-Gatineau West 48 5 48 48 149 10-Gatineau East 8 5 26 5 43 TOTAL 132 75 27 74 101 37 193 57 105 77 878
TOTAL NUMBER OF TRACTOR TRAILERS (12 HOURS_DAY+12 HOURS_NIGHT)
ZONE GROUP O 1-O
ttaw
a C
ente
r
2-IG
B W
est
3-O
ttaw
a W
est
4-O
ttaw
a So
uth
5-IG
B-E
ast
6-O
ttaw
a E
ast
7-H
ull
8-A
ylm
er
9-G
atin
eau
Wes
t
10-G
atin
eau
Eas
t
TO
TA
L
1-Ottawa Center 5 14 3 7 29 2-IGB West 10 8 5 22 45 3-Ottawa West 4 6 46 32 46 135 4-Ottawa South 4 13 5 4 62 87 5-IGB-East 6 60 11 10 10 98 6-Ottawa East 1 7 11 28 3 6 58 37 4 30 185 7-Hull 7 9 50 15 35 46 3 166 8-Aylmer 6 17 6 46 15 12 102 9-Gatineau West 3 4 3 3 13
10-Gatineau East 1 6 32 65 21 27 6 159 TOTAL 22 44 107 169 77 111 193 97 23 176 1019
Interprovincial Roadside Truck Survey Technical Appendices
84
Appendix M Detailed Comments on Trip Origins and Destinations
Interprovincial Roadside Truck Survey Technical Appendices
85
DETAILED COMMENTS ON TRIPS ORIGINS AND DESTINATIONS
Detailed daily origin-destination desire lines are presented in the Report in Exhibit 18 for all truck trips in Exhibit 19 for 2 axle truck trips in Exhibit 20 for 3+ axle truck trips and in Exhibit 21 for tractor trailer trips Here are summarized some key characteristics
The number of truck trips higher than 50 for all truck classifications collectively or individually is considered to represent strong orientation while 25-50 truck trips are considered to represent a modestly strong orientation Number of truck trips is presented in parenthesis
EXHIBIT 18 (all truck trips) as illustrated in exhibit panel A ndash Trips from the Aylmer district demonstrate a strong orientation to Ottawa East (56) Ottawa Central (80) Ottawa South (68) and IGB West (88) Trips to Aylmer district demonstrate a strong orientation from IGB East (73) and from Ottawa West (61) The trips to Aylmer demonstrate a modestly strong orientation from Ottawa South (34) and from IGB West (36) The Modestly strong orientation of truck trips from Aylmer is demonstrated to IGB East (32) and to Ottawa West (46) B ndash Trips from the Hull district demonstrate a strong orientation to Ottawa Central (69) Ottawa South (73) IGB West (90) Ottawa East (102) Ottawa West (106) IGB East (172) Trips to Hull district demonstrate a strong orientation from Ottawa Central (53) IGB West (100) Ottawa West (104) Ottawa East (126) Ottawa South (155) and IGB East (209) C ndash Trips from the Gatineau West district demonstrate a strong orientation to Ottawa Central (75) Ottawa South (81) and IGB East (92) The trips to Gatineau West demonstrate strong orientation from IGB East (120) Modestly strong orientation is demonstrated from Gatineau West to Ottawa East (32) and Ottawa West (43) In other direction a modestly strong orientation is demonstrated to Gatineau West from Ottawa East (29) and Ottawa Central (49) D ndash Trips from the Gatineau East district demonstrate a strong orientation to Ottawa West (52) IGB East (66) and Ottawa South (124) The trips to Gatineau East demonstrate a strong orientation from Ottawa West (74) Ottawa South (97) Ottawa East (99) and IGB East (115) Modestly strong orientation is demonstrated from Gatineau East to Ottawa East (27) and from IGB West to Gatineau East (28)
EXHIBIT 19 (2 axle truck trips) as illustrated in exhibit panel A ndash Modestly strong orientation of trips from the Aylmer district is demonstrated to Ottawa West (27) as well as from IGB East to Aylmer (46) B ndash Trips from Hull district demonstrate a strong orientation to Ottawa West (51) Ottawa East (52) Ottawa Central (53) Ottawa South (58) IGB West (64) and IGB East (88) The trips to Hull demonstrate a strong orientation from Ottawa East (62) Ottawa South (63) and IGB East (123) Modestly strong orientation is demonstrated to Hull from Ottawa Central (33) Ottawa West (36) and IGB West (41) C ndash Trips to the Gatineau West district demonstrate a strong orientation from IGB East (59)
Interprovincial Roadside Truck Survey Technical Appendices
86
Modestly strong orientation is demonstrated from Gatineau West to Ottawa East (29) Ottawa South (33) Ottawa West (35) and IGB East (44) In opposite direction a modestly strong orientation is demonstrated from Ottawa East to Gatineau West (25) D ndash Trips to the Gatineau East district demonstrate a strong orientation from Ottawa East (53) and from IGB East (66) Modestly strong orientation of trips is demonstrated from Gatineau East to Ottawa South (33) and IGB East (40) as well as from Ottawa South to Gatineau East (35)
EXHIBIT 20 (3+ axle truck trips) as illustrated in exhibit panel A ndash Trips from the Aylmer district demonstrate a strong orientation to IGB West (58) and Ottawa Central (61) while a modestly strong orientation is demonstrated from Aylmer to Ottawa East (26) B ndash Trips to Hull district demonstrate a strong orientation from Ottawa South (79) Modestly strong orientation is demonstrated to Hull from IGB East (26) and from IGB West (49) as well as from Hull to IGB East (48) C ndash Trips to the Gatineau West district demonstrate a strong orientation from IGB East (51) Modestly strong orientation is demonstrated from Gatineau West to IGB East (48) Ottawa South (48) and Ottawa Central (48) as well as from Ottawa Central to Gatineau West (31) D ndash Modestly strong orientation of trips is demonstrated from Gatineau East to Ottawa South (26) and from IGB East to Gatineau East (39)
EXHIBIT 21 (tractor trailer trips) as illustrated in exhibit panel A ndash Trips to the Aylmer district demonstrate a modestly strong orientation from Ottawa West (32) and from Ottawa East (37) In opposite direction a modestly strong orientation is demonstrated from Aylmer to Ottawa South (46) B ndash Trips to Hull district demonstrate a strong orientation from Ottawa East (58) and from IGB East (60) Modestly strong orientation is demonstrated to Hull from Ottawa West (46) as well as from Hull to Ottawa West (50) C ndash There is no a strong or modestly strong orientation of trips tofrom the Gatineau West district tofrom the districts on the Ottawa side of the National Capital Region D ndash Trips to Gatineau East district demonstrate a strong orientation from Ottawa South (62) In the opposite direction a strong orientation of trips is demonstrated from Gatineau East to Ottawa South (65) Modestly strong orientation of trips is demonstrated from Gatineau East to Ottawa East (27) and Ottawa West (33) In the opposite direction a modestly strong orientation of trips is demonstrated to Gatineau East from Ottawa East (30) and from Ottawa West (46)
Interprovincial Roadside Truck Survey Technical Appendices
87
Appendix N Categories of Commodities
Interprovincial Roadside Truck Survey Technical Appendices
88
10
20
30
40
50
Commodity carried and number of All trucks during the day (700-1900)
No COMMODITY NAME NUMBER OF
TRUCKS COMMODITY CATEGORY
NUMBER OF TRUCKS PER COMMODITY CATEGORY
Empty Trucks 1092 1092
1 ALUMINUMS 8 1
472
2 ASPHALT 4 1 3 BRICKS 4 1 4 CARDBOARD TUBES 7 1 5 CEMENT 86 1 6 CEMENT POWDERED 7 1 7 CLAY 33 1 8 CONCRETE 42 1 9 CONSTRUCTION EQUIPMENT 20 1
CONSTRUCTION MATERIALS 7 1 11 DEBRIS 12 1 12 DOOR 8 1 13 DRYWALL 11 1 14 ELECTRICAL MANHOLES 7 1 15 FOAM 7 1 16 KITCHEN CABINETS 13 1 17 LIGHT FIXTURES 5 1 18 MANHOLE COVER FORMS 7 1 19 METAL BEAMS 11 1
METAL SHEETS 16 1 21 NEW JERSEY CEMENT BARRIERS 8 1 22 PAINTING CANVASS 13 1 23 PHONE FOR HYDRO 13 1 24 PLUMBING SUPPLIES 38 1 25 POOL EQUIPMENT 13 1 26 ROOFING MATERIALS 5 1 27 SAND 4 1 28 SHEET METAL 6 1 29 TELEPHONE POLES 7 1
TRANSFORMER 8 1 31 TREE 7 1 32 TRUSS 7 1 33 WINDOWS 21 1 34 WOOD ROOF TRUSS 12 1
35 BAKED GOODS 6 2 36 BOTTLED WATER 11 2 37 BREAD 12 2 38 CAKES 5 2 39 CANNED FOOD 13 2
CHICKEN 20 2 41 CHIPS 11 2 42 COOKIES BISCUITS 12 2 43 COOKIES AND CRACKERS 7 2 44 EGGS 13 2 45 FOOD 21 2 46 FOOD FROZEN 35 2 47 FRIES 7 2 48 MEAT BEEF AND FROZEN GOODS 7 2 49 NESTLE ICE TEA 7 2
PEPSI PRODUCT 16 2
Interprovincial Roadside Truck Survey Technical Appendices
89
No COMMODITY NAME NUMBER OF
TRUCKS COMMODITY CATEGORY
NUMBER OF TRUCKS PER COMMODITY CATEGORY
51 POTATO CHIPS 5 2
285
52 POTATOES 12 2 53 PRODUCE APPLES 5 2 54 PRODUCE MOSTLY BANANAS 3 2 55 SOFT DRINKS 16 2 56 SOYA MILK 12 2 57 VEGETABLES 5 2 58 WATER 25 2
59 ANIMAL FEED 4 3
259
60 BEDROOM FURNITURE 7 3 61 BRAS 5 3 62 CHAIRS 13 3 63 CLEANING SUPPLIES 25 3 64 CLOTHING RACKS 13 3 65 EMPTY PEPSI CANS 12 3 66 FURNITURE 37 3 67 GARBAGE CONTAINERS 12 3 68 HOUSE CONTENTS 13 3 69 HOUSEHOLD GOODS 13 3 70 MAIL 25 3 71 MIRRORS 7 3 72 PARCELS AND PACKAGES 5 3 73 PLANTS 4 3 74 POLY BAGS 7 3 75 SHELVING 5 3 76 SOAP 8 3 77 TABLES 11 3 78 TENT 5 3 79 TOBACCO 7 3 80 TOOLS 13 3 81 TV AND VCRS 7 3 82 USED HOUSEHOLD GOODS 4 3
83 BOXES 26 4
202
84 CARDBOARD BOXES 13 4 85 NEWSPAPERS 12 4 86 NEWSPAPERS SHEETS 8 4 87 NEWSPRINT 8 4 88 PAPER 84 4 89 PAPER PREMIUM 8 4 90 PAPER RECYCLED 12 4 91 PAPER ROLLS 18 4 92 TOILET PAPER 8 4 93 WASTE NEWSPRINT 7 4
94 LUMBER 14 5
152
95 PRESSURE TREATED LUMBER 50 5 96 SAWDUST WOODCHIPS 6 5 97 WOOD 43 5 98 WOOD BOARDS 8 5 99 WOOD CHIPS AND BLOCKS 8 5 100 WOOD PELLETS 8 5 101 WOOD PLANKS 15 5
Interprovincial Roadside Truck Survey Technical Appendices
90
No COMMODITY NAME NUMBER OF
TRUCKS COMMODITY CATEGORY
NUMBER OF TRUCKS PER COMMODITY CATEGORY
102 3 QUARTERS WATER 1 QUARTER ACID 3 6
90
103 ASPHALT WASTE 5 6 104 COMPRESSED GASES OXYGEN 7 6 105 FURNACE OIL 5 6 106 GAS AND LIQUID CO2 13 6 107 GASNO LEAD REG 7 6 108 LIME 3 6 109 LIQUID FERTILER 5 6 110 PESTICIDES 7 6 111 PETROLEUM 7 6 112 PROPANE 16 6 113 PROPANE TANKS 5 6 114 WASTE OIL 6 6
115 ARCHIVES 5 7
103
116 BINDERS 5 7 117 COMPUTER EQUIPMENT 5 7 118 COMPUTERS 28 7 119 ELECTRONIC CASH PRODUCT 5 7 120 GOVERNMENT RECORDS 7 7 121 OFFICE EQUIPMENT 12 7 122 OFFICE FURNITURE 12 7 123 OFFICE SUPPLIES 5 7 124 PRINTING SUPPLIES 13 7 125 STATIONARY 5 7
126 AUTO PARTS 7 8
54
127 BOB CAT 8 8 128 CARS 7 8 129 EQUIPMENT TO FIX TRAILERS 7 8 130 TIRES 20 8 131 TRUCK CABS 7 8
TOTAL 2709 2709 Where Drivers reported some commodity 1617
Empty trucks 1092 ) Commodity names are modified in some cases because of typing errors in the questionnaire
Interprovincial Roadside Truck Survey Technical Appendices
91
5
10
15
20
25
30
35
40
45
50
Commodity carried and number of All trucks during the night (1900-700)
No COMMODITY NAME NUMBER OF
TRUCKS COMMODITY CATEGORY
NUMBER OF TRUCKS PER COMMODITY CATEGORY
Empty trucks 286 286 1 INSULATION 8 1 8
2 BAKERY PRODUCTS 12 2
131
3 BREAD 13 2 4 CHEESE 8 2
DAIRY PRODUCTS 8 2 6 FOOD 3 2 7 FOOD FROZEN 4 2 8 FOOD-DESSERTS 3 2 9 GROCERIES 19 2
JOS LOUIS CAKES 15 2 11 MILK 6 2 12 PICK LES 3 2 13 POULTRY 3 2 14 PRODUCE 5 2
SANDWICH MEATS 12 2 16 SNACK FOODS 15 2
17 ART 3 3
99
18 CLEANING SUPPLIES 1 3 19 DRUG STORE PRODUCTS 4 3
FLOWERS 8 3 21 FRIDGE 15 3 22 FURNITURE 6 3 23 HARDWARE 4 3 24 HOUSEHOLD FURNITURE 3 3
LTL MIXED FREIGHT 3 3 26 MAIL 12 3 27 MIXED FREIGHT 4 3 28 PHARMACEUTICALS 4 3 29 SHOES 4 3
SNOW BLOWER 4 3 31 SPRING MACHINE 12 3 32 STEDMANS MERCHANDISE 3 3 33 STORE SUPPLIES 4 3 34 TOWELS 3 3
FLYERS 4 4
104
36 KLEENEX BOXES 4 4 37 LABELS 4 4 38 NEWSPAPERS 15 4 39 NEWSPRINT 6 4
OLD NEWSPAPER 4 4 41 PAPER 31 4 42 PAPER NEWSPRINT 3 4 43 PAPER PRODUCTS 3 4 44 PAPER RECYCLED 8 4
PAPER ROLLS 6 4 46 SCRAP PAPER 12 4 47 TOILET PAPER 3 4
48 ASPEN IT E 3 5 49 CHIP BOARD 3 5
LOGS 4 5
Interprovincial Roadside Truck Survey Technical Appendices
92
No COMMODITY NAME NUMBER OF
TRUCKS COMMODITY CATEGORY
NUMBER OF TRUCKS PER COMMODITY CATEGORY
51 LUMBER 11 5
44
52 MDF BOARD 3 5 53 WHIFFLE BOARD 3 5 54 WOOD 10 5 55 WOOD PANELS 3 5 56 WOOD PRODUCTS 3 5
57 CALCIUM CARBONATE 1 6
56
58 CHLORATE SODIUM 3 6 59 COLOURED DIESEL 3 6 60 FURNACE FUEL 11 6 61 GAS 4 6 62 GASOLINE 9 6 63 HYDRATED LIME 4 6 64 OMYAFILL SLURRY 1 6 65 OXYGEN 12 6 66 PASTE 3 6 67 SALT 4 6
68 AUTO PARTS 1 8
13
69 CARS 4 8 70 TIRES 3 8 71 VEHICLES 4 8
TOTAL Where Drivers reported some commodity
Empty trucks
741 455 286
741
) Commodity names are modified in some cases because of typing errors in the questionnaire
Interprovincial Roadside Truck Survey Technical Appendices
93
10
20
30
40
50
Commodity carried and number of All trucks during the 24 hour period
No COMMODITY NAME NUMBER OF
TRUCKS COMMODITY CATEGORY
NUMBER OF TRUCKS PER COMMODITY CATEGORY
Empty Trucks 1378 1378 1 ALUMINUMS 8 1
480
2 ASPHALT 4 1 3 BRICKS 4 1 4 CARDBOARD TUBES 7 1 5 CEMENT 86 1 6 CEMENT POWDERED 7 1 7 CLAY 33 1 8 CONCRETE 42 1 9 CONSTRUCTION EQUIPMENT 20 1
CONSTRUCTION MATERIALS 7 1 11 DEBRIS 12 1 12 DOOR 8 1 13 DRYWALL 11 1 14 ELECTRICAL MANHOLES 7 1 15 FOAM 7 1 16 INSULATION 8 1 17 KITCHEN CABINETS 13 1 18 LIGHT FIXTURES 5 1 19 MANHOLE COVER FORMS 7 1
METAL BEAMS 11 1 21 METAL SHEETS 16 1 22 NEW JERSEY CEMENT BARRIERS 8 1 23 PAINTING CANVASS 13 1 24 PHONE FOR HYDRO 13 1 25 PLUMBING SUPPLIES 38 1 26 POOL EQUIPMENT 13 1 27 ROOFING MATERIALS 5 1 28 SAND 4 1 29 SHEET METAL 6 1
TELEPHONE POLES 7 1 31 TRANSFORMER 8 1 32 TREE 7 1 33 TRUSS 7 1 34 WINDOWS 21 1 35 WOOD ROOF TRUSS 12 1
36 BAKED GOODS 6 2 37 BAKERY PRODUCTS 12 2 38 BOTTLED WATER 11 2 39 BREAD 25 2
CAKES 5 2 41 CANNED FOOD 13 2 42 CHEESE 8 2 43 CHICKEN 20 2 44 CHIPS 11 2 45 COOKIES BISCUITS 12 2 46 COOKIES AND CRACKERS 7 2 47 DAIRY PRODUCTS 8 2 48 EGGS 13 2 49 FOOD 24 2
FOOD FROZEN 39 2
Interprovincial Roadside Truck Survey Technical Appendices
94
No COMMODITY NAME NUMBER OF
TRUCKS COMMODITY CATEGORY
NUMBER OF TRUCKS PER COMMODITY CATEGORY
51 FOOD-DESSERTS 3 2
416
52 FRIES 7 2 53 GROCERIES 19 2 54 JOS LOUIS CAKES 15 2 55 MEAT BEEF AND FROZEN GOODS 7 2 56 MILK 6 2 57 NESTLE ICE TEA 7 2 58 PEPSI PRODUCT 16 2 59 PICK LES 3 2 60 POTATO CHIPS 5 2 61 POTATOES 12 2 62 POULTRY 3 2 63 PRODUCE 5 2 64 PRODUCE APPLES 5 2 65 PRODUCE MOSTLY BANANAS 3 2 66 SANDWICH MEATS 12 2 67 SNACK FOODS 15 2 68 SOFT DRINKS 16 2 69 SOYA MILK 12 2 70 VEGETABLES 5 2 71 WATER 25 2 72 ANIMAL FEED 4 3 73 ART 3 3 74 BEDROOM FURNITURE 7 3 75 BRAS 5 3 76 CHAIRS 13 3 77 CLEANING SUPPLIES 26 3 78 CLOTHING RACKS 13 3 79 DRUG STORE PRODUCTS 4 3 80 EMPTY PEPSI CANS 12 3 81 FLOWERS 8 3 82 FRIDGE 15 3 83 FURNITURE 43 3 84 GARBAGE CONTAINERS 12 3 85 HARDWARE 4 3 86 HOUSE CONTENTS 13 3 87 HOUSEHOLD FURNITURE 3 3 88 HOUSEHOLD GOODS 13 3 89 LTL MIXED FREIGHT 3 3 90 MAIL 37 3 91 MIRRORS 7 3 92 MIXED FREIGHT 4 3 93 PARCELS AND PACKAGES 5 3 94 PHARMACEUTICALS 4 3 95 PLANTS 4 3 96 POLY BAGS 7 3 97 SHELVING 5 3 98 SHOES 4 3 99 SNOW BLOWER 4 3 100 SOAP 8 3
Interprovincial Roadside Truck Survey Technical Appendices
95
No COMMODITY NAME NUMBER OF
TRUCKS COMMODITY CATEGORY
NUMBER OF TRUCKS PER COMMODITY CATEGORY
101 SPRING MACHINE 12 3
358
102 STEDMANS MERCHANDISE 3 3 103 STORE SUPPLIES 4 3 104 TABLES 11 3 105 TENT 5 3 106 TOBACCO 7 3 107 TOOLS 13 3 108 TOWELS 3 3 109 TV AND VCRS 7 3 110 USED HOUSEHOLD GOODS 4 3 111 BOXES 26 4
306
112 CARDBOARD BOXES 13 4 113 FLYERS 4 4 114 KLEENEX BOXES 4 4 115 LABELS 4 4 116 NEWSPAPERS 27 4 117 NEWSPAPERS SHEETS 8 4 118 NEWSPRINT 14 4 119 OLD NEWSPAPER 4 4 120 PAPER 115 4 121 PAPER NEWSPRINT 3 4 122 PAPER PREMIUM 8 4 123 PAPER PRODUCTS 3 4 124 PAPER RECYCLED 20 4 125 PAPER ROLLS 24 4 126 SCRAP PAPER 12 4 127 TOILET PAPER 11 4 128 WASTE NEWSPRINT 7 4
129 ASPEN IT E 3 5
195
130 CHIP BOARD 3 5 131 LOGS 4 5 132 LUMBER 25 5 133 MDF BOARD 3 5 134 PRESSURE TREATED LUMBER 50 5 135 SAWDUST WOODCHIPS 6 5 136 WHIFFLE BOARD 3 5 137 WOOD 53 5 138 WOOD BOARDS 8 5 139 WOOD CHIPS AND BLOCKS 8 5 140 WOOD PANELS 3 5 141 WOOD PELLETS 8 5 142 WOOD PLANKS 15 5 143 WOOD PRODUCTS 3 5
144 3 QUARTERS WATER 1 QUARTER ACID 3 6 145 ASPHALT WASTE 5 6 146 CALCIUM CARBONATE 1 6 147 CHLORATE SODIUM 3 6 148 COLOURED DIESEL 3 6 149 COMPRESSED GASES OXYGEN 7 6 150 FURNACE FUEL 11 6
Interprovincial Roadside Truck Survey Technical Appendices
96
No COMMODITY NAME NUMBER OF
TRUCKS COMMODITY CATEGORY
NUMBER OF TRUCKS PER COMMODITY CATEGORY
151 FURNACE OIL 5 6
147
152 GAS 4 6 153 GAS AND LIQUID CO2 13 6 154 GASNO LEAD REG 7 6 155 GASOLINE 9 6 156 HYDRATED LIME 4 6 157 LIME 3 6 158 LIQUID FERTILER 5 6 159 OMYAFILL SLURRY 1 6 160 OXYGEN 12 6 161 PASTE 3 6 162 PESTICIDES 7 6 163 PETROLEUM 7 6 164 PROPANE 16 6 165 PROPANE TANKS 5 6 166 SALT 4 6 167 WASTE OIL 6 6
168 ARCHIVES 5 7
103
169 BINDERS 5 7 170 COMPUTER EQUIPMENT 5 7 171 COMPUTERS 28 7 172 ELECTRONIC CASH PRODUCT 5 7 173 GOVERNMENT RECORDS 7 7 174 OFFICE EQUIPMENT 12 7 175 OFFICE FURNITURE 12 7 176 OFFICE SUPPLIES 5 7 177 PRINTING SUPPLIES 13 7 178 STATIONARY 5 7 179 AUTO PARTS 8 8
67
180 BOB CAT 8 8 181 CARS 11 8 182 EQUIPMENT TO FIX TRAILERS 7 8 183 TIRES 23 8 184 TRUCK CABS 7 8 185 VEHICLES 4 8
TOTAL 3450 3450 Where Drivers reported some commodity 2072
Empty trucks 1378
) Commodity names are modified in some cases because of typing errors in the questionnaire
Interprovincial Roadside Truck Survey Technical Appendices
97
Appendix O Trip Origins and Destinations for Specific Commodities and Detailed Comments
Interprovincial Roadside Truck Survey Technical Appendices
98
Inte
rpro
vinc
ial R
oads
ide
Truc
k Su
rvey
T
echn
ical
App
endi
ces
99
Queacute
be
c Ont
ario
O
ntar
io
Queacute
bec
Queacute
bec
Ont
ario
O
ntar
io
Ayl
mer
Hul
l
Gat
inea
u W
est
Gat
inea
u E
ast
Otta
wa
Eas
t
IGB
Eas
t
Otta
wa
Cen
tral
IGB
Wes
t
Otta
wa
Sou
thO
ttaw
a W
est
Gat
inea
u E
ast
Gat
inea
u W
est
Hul
l
Ayl
mer
Otta
wa
Eas
t
IGB
Eas
tO
ttaw
a C
entr
al
IGB
Wes
t
Otta
wa
Sou
th
Otta
wa
Wes
t
Gat
inea
u E
ast
Gat
inea
u W
est
Hul
l
Ayl
mer
Otta
wa
Eas
t
IGB
Eas
t
Otta
wa
Cen
tral
IGB
Wes
t
Otta
wa
Sou
thO
ttaw
a W
est
Ap
pen
dix
O D
aily
Ori
gin
s an
d D
esti
nat
ion
s fo
r S
pec
ific
C
om
mo
dit
ies
- A
ll T
ruck
Tri
ps
(AU
TU
MN
200
0)
48
Ayl
mer
Hul
l
Gat
inea
u W
est
Gat
inea
u E
ast
Otta
wa
Eas
t
IGB
Eas
t
Otta
wa
Cen
tral
IGB
Wes
t
Otta
wa
Sou
th
Otta
wa
Wes
t
Num
ber
of tr
uck
trip
s an
d di
rect
ion
LE
GE
ND
48
N
umbe
r of
Orig
ins
and
Des
tinat
ions
for
Dis
tric
t
GE
NE
RA
L M
ER
CH
AN
DIS
E O
RIG
INS
AN
D D
ES
TIN
AT
ION
S A
LL
TR
UC
K T
RIP
S
B
WO
OD
amp W
OO
D P
RO
DU
CT
S O
RIG
INS
AN
D D
ES
TIN
AT
ION
S A
LL
TR
UC
K T
RIP
S
D
PA
PE
R amp
PA
PE
R P
RO
DU
CT
S O
RIG
INS
AN
D D
ES
TIN
AT
ION
S A
LL
TR
UC
K T
RIP
S
C
CO
NS
TR
UC
ITO
N M
AT
ER
IAL
S O
RIG
INS
AN
D D
ES
TIN
AT
ION
S A
LL
TR
UC
K T
RIP
S
A
Queacute
bec
The characteristics as portrayed on the exhibit (Appendix O) are summarized in the following
Construction materials trips are portrayed on Panel A These trips are widely dispersed with the stronger links being from Aylmer to Ottawa Central (56 trips) from Ottawa South to Hull (44) from Ottawa Central to Gatineau West (44) from IGB East to Hull (32) and from IGB East to Gatineau West (23)
General merchandise trips are portrayed on Panel B As would be expected there are no particularly strong orientations The stronger bi-directional desire lines being from Hull to Ottawa West (20+21)from Gatineau West to IGB East (26+13) from Gatineau East to IGB East (11+25) and from Hull to Ottawa South (11+17) Some of the stronger uni-directional desire lines being from IGB East to Hull (27) from Ottawa South to Gatineau East (19) from IGB West to Hull (18) from Ottawa South to Aylmer (17) and from Gatineau West to Ottawa West (14)
Paper and paper products trips are portrayed on Panel C As illustrated there are some strong orientations with the stronger bi-directional desire lines being from Gatineau East to Ottawa South (44+31) from Ottawa East to Hull (41+22) Bi-directional desire lines are also presented from Hull to IGB East (19+17) and from Hull to Ottawa West (18+17) Uni-directional desire lines are presented from IGB East to Gatineau East (13) from Ottawa West to Gatineau East (12) and from Hull to IGB East (11)
Wood and wood products trips are portrayed on Panel D As illustrated strong uni-directional desire lines are from Gatineau West to Ottawa South (48) and from Aylmer to Ottawa South (31) while there is a modestly strong orientation from Ottawa East to Gatineau East (16)
Interprovincial Roadside Truck Survey Technical Appendices
100
T e c h n i c a l M e m o r a n d u m To File Date 20 July 2016 Copy David Hopper Project TO3188TOB From Holly Kerslake
Re Downtown Ottawa Truck Tunnel Feasibility Review of Similar Projects in Other Cities
As identified in the task assignment for this feasibility study a review was undertaken of similar projects in other cities to compare to a potential downtown Ottawa truck tunnel Although the initial task assignment had identified seven cities this was expanded and a total of 24 tunnel sites were selected and evaluated based on their similarly to the potential downtown Ottawa truck tunnel project
The following tunnel projects were examined
1 Port Miami Tunnel 9 Detroit-Windsor Tunnel 17 Ville-Marie and Viger Tunnels (Montreal)
2 Dublin Port Tunnel 10 Louis-Hippolyte Lafontaine 18 Wacker Drive Chicago Bridge-Tunnel
3 Blanka Tunnel Complex 11 Robertson Tri-Met Tunnel 19 Thorold Stone Road Tunnel (Prague) (Portland)
4 Seattle Alaskan Way Viaduct 12 New Portsmouth Midtown 20 Dulles International Airport Replacement Tunnel Immersed Tunnel AeroTrain Tunnel
5 Oakland Caldecott Tunnel 13 George Massey Tunnel 21 Al Salam Street Tunnel (Abu (Vancouver) Dhabi)
6 Auckland Waterview Connection 14 Vancouver Trans-Canada 22 Fraser Canyon Highway Tunnel Cassiar Connector Tunnel Tunnels
7 Brisbane Clem Jones Tunnel 15 Joseph-Samson Tunnel (Quebec 23 East-West Access Road City) (Algeria)
8 Calgary Airport Trail Tunnel 16 Palm Jumeirah Vehicular Tunnel 24 Laerdal Tunnel (Norway) (Dubai)
Although the task assignment identifies a preference for the evaluation of tunnels solely used for trucks no tunnels used exclusively for trucks were found Therefore all the tunnels examined utilize a combination of truck and vehicular traffic However it was individually identified how each type of vehicle is treated as in some cases truck and vehicular traffic is managed differently
Information was primarily collected via the internet All websites where information was collected was recorded In the cases of the ldquoworld famousrdquo or high profile tunnels most information was readily available In the cases of some of the low profile smaller or older tunnel projects some of the information was not found or missing Further investigation such as contacting local agencies would need to be completed in order to attempt to obtain the missing information although it was not felt necessary at this time In the cases of tunnel projects completed by Parsons (such as the East-West Access Road in Algeria) information was available through Parsonsrsquo records
P a g e | 2
The following criteria were included in the evaluation of each of the tunnels
Location City and Country Length Length of the Tunnel in Metres Type Underwater or Underground (also - where available depth of tunnel) AADT Annual Average Daily Traffic utilizing the Tunnel Number of Lanes Total Number of Lanes in the Tunnel Date Constructed Start Date of Tunnel Construction and Date of Tunnel Opening Construction Costs Total Project Cost in Canadian Dollars Construction Method Type of Construction Method Utilized Problem Being Solved Initial Issue triggering the need for a Tunnel Community Impacts How the tunnel has impacted the surrounding community from an economic or social perspective
etc TollingOther Funding Identifies what kind of tolling strategy (if any) the tunnel utilizes and for what types of vehicles this for Operating and affects Maintenance Unforseen Problems Any construction or operational issues the tunnel has experienced and why Dangerous Goods How vehiclestrucks carrying hazardous goods are managed Treatment Inclusion of Vehicles What types of vehicles are permitted to use the tunnel Other than Trucks Permitted Success of the Tunnel Whether the tunnel is considered a success or not and why Other Comments Any other interesting facts or comments found
All information was researched and a table containing all relevant information was completed Example projects were ordered based on similarity to the Downtown Ottawa Truck Tunnel proposed project and qualityquantity of information available
Tunnel Name Photos Location Length Type AADT Number of Lanes Date Constructed Construction Costs Construction Method
Port Miami Tunnel Miami Florida USA 1300m Underwater
Tunnel Depth (Lowest
Elevation) = ~37m
AADT = 7000
Heavy Traffic = ~16
4 Lanes (2 per tunnel) Start of Construction
May 24th 2010
Opened
August 3rd 2014
Total Project Cost = $1
Billion (USD) [$745 Million
CAD]
Design and Construction
Public-Private Partnership (PPP)
2 Tunnels constructed using a Tunnel
Boring Machine (TBM)
Costs = $667 Million (USD)
Dublin Port Tunnel Dublin Ireland Underground AADT = 15000 4 Lanes (2 per tunnel) Start of Construction
June 1st 2001
euro752 Million (Euro) [$11
Billion CAD]
Built in 5 Sections using 3 Methods
- Cut and Cover
Tunnel Depth (Ground Level
to top of Tunnel) = ~21-23m
Heavy Traffic = ~40
Opened
December 20th 2006
Construction Tender Costs
= euro448 Million (Euro)
- Tunnel Boring
- Pipe Jacking (Under existing
Railway)
Blanka Tunnel Complex Prague City Czech
Republic
6400m
(3 Tunnels)
Underground Unknown 4 Lanes (2 in each
direction)
Start of Construction
2006
$37 Billion (Koruna) [$2
Billion CAD]
Driven (mined) and Cut and Cover
(divided into small sections)
Opened
Expected Early 2015
~$15 Billion (USD) Geological Condtions Generally Rock
formed by Sediment (old sea bed)
Seattle Alaskan Way Viaduct
Replacement Tunnel
Seattle Washington
USA
3200m Underground AADT = 110000 4 Lanes (1 Tunnel
Stacked)
Start of Construction
July 30th 2013
$425 Billion (USD) [$57
Billion CAD]
Single TBM (Worlds Largest)
Opening
Unknown (Under
Construction)
Oakland Caldecott Tunnel Oakland California
USA
Bores 1 amp 2 - 1100m
Bore 3 - 1149m
Bore 4 - 1033m
Underground AADT = 160000 8 Lanes (2 per tunnel) Start of Construction
Bores 1 amp 2 - 1929
Bore 3 - 1960
Bore 4 - 2010
Bore 4 = $417 Million (USD)
[$560 Million CAD]
Bore 4 - New Austrian Tunneling
Method (NATM)
Opened
Bores 1 amp 2 - 1937
Bore 3 - 1964
Bore 4 - 2013
Auckland Waterview Aukland New Zealand 2500m Underground Underground AADT (Predicted 2026) = 6 Lanes (2 Tunnels 3 Start of Construction $17 Billion (NZD) [$15 Public-Private Partnership (PPP)
Connection Tunnel 4500m Total Length 83000 Lanes Each) 2013 Billion CAD]
Earth Pressure Balance TBM
Opening
2017
1
Tunnel Name Photos Location Length Type AADT Number of Lanes Date Constructed Construction Costs Construction Method
Brisbane Clem Jones Tunnel Brisbane Australlia 4800m Underground and
Underwater
AADT = 28000
Low due to the high cost
of tolls rated to carry
~60000 vehday
4 Lanes (2 per tunnel) Star of Construction
September 2006
Opened
March 15th 2010
$32 Billion (AUD) [$31
Billion CAD]
Public-Private Partnership (PPP)
The digging was done using a
boring machine
Calgary Airport Trail Tunnel Calgary Alberta
Canada
620m Underground (under Calgary
Airport Runway)
AADT = Designed to
accommodate 75000
6 Lanes (3 in each
direction)
Start of Construction
July 2011
Opened
May 25th 2014
$295 Million (CAD) Cut and cover method was used prior
to the new runway expansion (tunnel
was constructed before the runway)
Detroit-Windsor Tunnel Windsor Ontario
Canada
Detroit Michigan USA
1570m Underwater
Tunnel Depth (Lowest
Elevation) = ~23m
AADT = 13000 2 Lanes (1 in each
direction)
Start of Construction
1927
Opened
November 3rd 1930
$25 Million (USD) [$33
Million CAD]
Immersed Tube (sections of steel tube
floated into place and sunk into a
trench dug in the river bottom)
Louis-Hippolyte Lafontaine
Bridge-Tunnel
Montreal Quebec
Canada
1391m (Tunnel Only)
Total Length = 1800m
Underwater AADT = 120000 6 Lanes (2 Tunnels 3
Lanes Each)
Start of Construction
1963
Opened
March 11th 1967
$75 Million (CAD) Immersed Tube (sections of steel tube
floated into place and sunk into a
trench dug in the river bottom)
Robertson Tri-Met Tunnel Portland Oregon USA 4710m Underground
LRT Tunnel
NA 2 Rail Lines (1 per
tunnel)
Start of Construction
June 1st 1993
Opened
September 12th 1998
$184 Million (USD) [$247
Million CAD]
TBM and Drilling and Blasting
First mile of the west end was
completed using the conventional
mining technique of drilling and
blasting due to the loose mixture of
materials East end construction
began with a TBM
New Portsmouth Midtown
Immersed Tunnel
Portsmouth Virginia
USA
1278m Underwater AADT = 46000 (2007) Existing = 2 Lanes (1 in
each direction)
New 2 Lanes (one-way
traffic)
New tunnel being built
adjacent to old tunnel to
convert from 2 Lanes to
4 Lanes
New Tunnel
Start of Construction
mid-2012
Opened
Planned 2017
$21 Billion (USD) [28
Billion CAD]
The river will be dredged and the
tunnel will be constructed separetly on
a dry dock Each piece will then be
transported to location using tugboats
and dropped in the dredged canel
Once the tunnel is in final place and
connected to adjacent tunnels backfill
is layered around the segment This is
repeated for all 11 tunnel segments
George Massey Tunnel Vancouver British
Columbia Canada
629m Underwater AADT = ~80000 (2012) 4 Lanes (2 in each
direction)
Start of Construction
March 1st 1957
Opened
May 23rd 1959
$25 Million (CAD) The tunnel is made up of six precast
concrete segments Sections were
floated into postion then sunk into a
shallow trench that had been dug into
the river bed The trench and tunnel
were then covered by a protective
layer of rock
2
Tunnel Name Photos Location Length Type AADT Number of Lanes Date Constructed Construction Costs Construction Method
Vancouver Trans-Canada
Cassiar Connector Tunnel
Vancouver British
Columbia Canada
724m Underground Unknown 6 Lanes (3 per tunnel) Start of Construction
Unknown
$115 Million (CAD) Cut and Cover
Originally opened with 4
Lanes but was designed Opened
to accommodate 6
Lanes total (was
expanded ~2005)
January 12th 1992
Joseph-Samson Tunnel Quebec City Quebec
Canada
280m Underground Unknown 3 Lanes (dynamic lane
reversal technology)
Unknown Unknown Unknown
Palm Jumeirah Vehicular Dubai United Arab 1398m Underwater Unknown 6 Lanes (3 per Start of Construction $145 Million (USD) [$194 Cut and Cover with Sheet-Piled
Tunnel Emirates directiontunnel) 2005 Million CAD] Cofferdam to hold back surrounding
Islands estimated visitors seawater
per day is 20000 Opened
2007
Ville-Marie and Viger Tunnels Montreal Quebec 1500m Underground A-720 AADT=~160000 6 Lanes (3 per Start of Construction Unknown Cut and Cover
(Montreal A-720) Canada directiontunnel) plus Late 1960s
single lanes for onoff
ramps Opened
1974
Wacker Drive Chicago Chicago Illinois USA 3500m Double-decked Highway AADT = 65000
Pedestrians = 60000day
Upper Deck
6 Lanes (with Parking -
3 in each direction)
Lower Deck
4 Lanes (2 in each
direction)
Start of Construction
~1909
Opened
1926
East Extensions
- 1963
$8 Million (USD 1926)
$200 Million (USD) 2001
2002 redesign and
reconstruction between
Michigan Ave and Randolph
St
2001-2002 Upper Deck
Reconstruction
Cast-in-place system flat-slab
longitudinally post-tensioned
reinforced high-performance
concrete
- 1975
- 1986-1987
- 2001-2002 (reconst)
- 2010 (reconst)
Thorold Stone Road Tunnel Thorold Ontario
Canada
840m Underwater
Runs under the Welland
Unknown 4 Lanes (2 per tunnel) Start of Construction
1965
Unknown The Canal section of the tunnel was
poured during the winter months when
the tunnel was drained in order to
Canal (near boat locks)
Opened
1967
minimize impacts on shipping
Concrete sections in the shape of
tubes were poured in a trench to
create the tunnel During the summer
months each end of the tunnel was
constructed
3
shy
Tunnel Name Photos Location Length Type AADT Number of Lanes Date Constructed Construction Costs Construction Method
Dulles International Dulles Airport Virginia 6080m Underground NA 2 People Mover Lines (1 Start of Construction $2 Billion (USD) [$27 Billion Cut and Cover for sections adjacent
Airport AeroTrain Tunnel USA per tunnel) 2004 CAD] to existing infrastructure
People Mover
Opened TBM or NATM for sections under
January 26th 2010 taxiways and concourses
Al Salam Street Tunnel Abu Dhabi United 2400m Underground (Roadway) Unknown 8 Lanes (4 per tunnel) Start of Construction $360 Million (USD) [$483 Cut and Cover
(renamed Sheikh Zayed Arab Emirates October 2007 Million CAD]
Tunnel)
Opened
December 4th 2012
Fraser Canyon Highway Fraser Canyon 7 Tunnels Underground Unknown 2 Lanes (1 in each Start of Construction Unknown Unknown (likely dugblasted based on
Tunnels (7 Total) British Columbia direction 1 Tunnel) 1957 old photography)
Canada Shortest 57m
Longest 610m Opened
1964
East-West Access Road Highway stretching the Total Highway Length = HighwayUnderground Unknown 6 Lanes Start of Construction $112 Billion (USD) [$153 12 Tunnels 70 Viaducts 60
Annaba Algeria complete Northern 1216km 2009 Billion CAD] Interchanges
border of Algeria
5 Tunnels Opened Construction Method Unknown
August 2014
Laeligrdal Tunnel Connects the cities 2451km Underground AADT = 1000 2 Lanes (1 in each Start of Construction $1131 Million (USD) Drilling and Blasting
Bergen and Oslo
in Norway
direction 1 Tunnel) 1995 [$1517 CAD]
Opened
2000
4
Tunnel Name Photos Problem Being Solved Community Impacts TollingOther Funding for
Operating and Maintenance Unforseen Problems Dangerous Goods Treament
Port Miami Tunnel Before the tunnel was opened the only
route for Port Miami traffic was through
downtown Miami As future plans to expand
the ports capacity proceeded there was
concern on how the increased truck vehicle
traffic would affect already congested
downtown Miamis economy and growth
Therefore a tunnel was needed to connect
Miami Port traffic directly to the MacArthur
Causeway (which connects to I-95 via Ishy
395)
The port has been losing cruise ship and cargo
traffic to Port Everglades and Fort Lauderdale
over the years due to the port layout and access
issues The new tunnel will help provide better
access to the cruise ship and cargo ports
making them a more competetive port in the
area Also due to the decrease in Port Traffic
through downtown Miami the ecomonic growth
and expansion of the downtown core will not be
hindered
No Toll
Florida Department of Transportation
fully funds the tunnel operation and
maintenance
Miami Access Tunnel (contractor) requested money from
a $150 Million (USD) reserve fund as there was an
unexpected need to grout the limestone beneath the
surface to help the TBM cut more smoothly The FDOT
denied the request for more money to the contractor
Dangerous goods are prohibited
Dublin Port Tunnel To remove heavy goods trucks from
the city-centre streets of Dublin as they
travel to the surrounding highways from the
Dublin Port
The tunnel construction employed 5000 people No Tolls for all commercial vehicles
above 35 tonnes buses with more than
25 seats and vehicles driven by
physically disabled drivers that have
been adapted for physically disabled
drivers
For all other vehicles tolling ranges from
euro3 to euro10 This is to deter non-
commercial vehicles from using this
route
During the hard-rock boring vibration caused some
damage to houses in the Marino Area A total of 241
claims were reimbursed
There was a problem with the height as many critics
argued that the 465m height isnt enough and rather a
55m height would be needed in order to accommodate
all sizes of trucks
Dangerous goods are Prohibited
(they provide a list of restricted
items)
Blanka Tunnel Complex Relieve heavy traffic through the historic
centre of Prague (congestion issues)
Unknown Unknown Political disputes (financial) contributed heavily to delays
(almost 4 years - was originally to be completed by
2011)
Unknown
Seattle Alaskan Way Viaduct Replacing the SR-99 Alaskan Way Viaduct The improved transportation and accessibility Tolled After 3 weeks for drilling the project was already 2 Unknown
Replacement Tunnel which is a 60-year old double-deck highway
that spans Seattles downtown waterfront
Due to a significant earthquake in 2001
(magnitude 68) the existing structure sunk
several inches and needed significant
repairs - which were completed If the
earthquake would have lasted a few
seconds longer engineers say the structure
would have collapsed
will help create better economic and social
prospects for those living in the area
weeks behind schedule due to problems with fiberglass
near the front of the drill and a labor dispute
In Dec 2013 the TBM struck a steel pipe which had been
installed for exploratory drilling in the planning phase of
the project This damaged the TBM requiring a 37m
shaft to be constructed to repair the TBM This delay
lasted over 1 year
Oakland Caldecott Tunnel To ease traffic congestion and end the
process of manually reversing the flow of
traffic twice a day along the middle bore
Unknown No Toll Weather conditions can vary greatly from one end
of the tunnel to the other Weather conditions should be
taken into consideration for safety reasons
Due to the Caldecott Tunnel
fire in 1982 which killed 7 people
it is illegal to transport hazardous
material in a tanker truck through
the tunnel except during the
hours of 300 am and 500 am
(light traffic times)
Auckland Waterview The tunnels will connect the Southwestern 205 houses had to be demolished No Toll Unknown Unknown
Connection Tunnel and Northwestern Motorways to complete
the Western Ring Route - a 27km long
alternative Motorway around the city In
addition the tunnels will take traffic off local
roads
The New Zealand Transportation Agency is
working to keep down construction noise have
minimal traffic impacts and surpress dust and
mud to keep residents happy during
construction
5
Tunnel Name Photos Problem Being Solved Community Impacts TollingOther Funding for
Operating and Maintenance Unforseen Problems Dangerous Goods Treament
Brisbane Clem Jones Tunnel Designed to help alleviate traffic congestion
in the downtown core of the Brisbane
(Central Business District and Fortitude
Valley)
Connects to the Airport Link Tunnel which
connects to Brisbane Airport reducing
travel times
Due to the high cost of tolling only a small
reduction (~5) in vehicles on by-passed areas
was observed while during a free promotion
period a ~10-20 decrease in vehicles in byshy
passed areas was observed
Tolling ranges from $150 to $990
(AUD)
Utilizes an Electronic Tolling System
(vehicles either use a transponder or
license plate technology is implemented)
Due to the high cost of tolling utilization of the tunnels
after opening was signifcantly less than expected
Controversy over environmental hazards from
construction and operations Moreover the expected air
pollution from the ventilation stacks and their proposed
locations
Issues due to difficult drilling conditions were
encountered (Brisbane Tuff Rock)
Dangerous goods are prohibited
Any vehicles carrying commercial
quanities of dangerous goods and
specifically any vehicle displaying
a dangerous goods placard are
prohibited
Calgary Airport Trail Tunnel Improved connectivity to Calgary Airport
Built in response to the Calgary Airport
Runway expansion which would intersect
existing roadwaysairport connections
Improved connectivity between the community
and airport
No major impacts as land was previously farm
land (issues more related to the airport
expansion)
No Toll 55 Month delay due to existing soil conditions
6 Month delay due to electrical scope of work
Dangerous goods are prohibited
Detroit-Windsor Tunnel In the early 1900s private boats and
ferries would carry passangers and freight
between Canada and the USA (particularly
difficult with ice in the winnter) Therefore
building a tunnel or bridge eased access
between the 2 countries
The tunnel has led to an increase in trade and
ease of movement between the 2 countries
Entering the USA there is a $450 (USD)
Toll
Entering Canada there is a $475 (USD)
Toll
Unknown All hazardours products are
prohibited (oil gas paint fuel) in
the tunnel The tunnel is not
dedicated for commercial use
Louis-Hippolyte Lafontaine
Bridge-Tunnel
Constructed to connect the Trans-Canada
Highway (was the last link)
A tunnel was chosen for half the structure
in order to minimize impacts on nearby port
operations
Built in time for Expo-67 which was help in
Montreal in 1967
No Toll Unknown Dangerous goods are prohibited
Robertson Tri-Met Tunnel When the MAX west line was designed it
was originally planned to run adjacent to
the Sunset Highway However due to
weather condition public opinion and
environmental concerns it was determined
that the better alignment was a tunnel
through the Tualatin Mountains
Unknown NA Due to unexpected geological conditions (loose layers of
silt gravel balsalt etc) the tunnel boring machine did
not always work properly contributing heavily to the
project cost moving from $1037 Million to $184 Million
NA
New Portsmouth Midtown
Immersed Tunnel
Due to congestion issues a second tunnel
is needed to help increase capacity for east-
west travel in Portsmouth across the river
Reduced travel time and congestion for east-
west travel
Tolling began February 1 2014 and is
expected to continue until April 13 2017
to help fund the expansion (new tunnel)
project
Rates = $1-3 (USD) each way
Electronic Tolling (E-Z Pass or License
Plate)
Uknown Dangerous goods are prohibited
George Massey Tunnel The tunnel helps to connect the City of
Richmond with the Corporation of Delta
At peak rush hour periods a reversible lane
technology is used to help with congestion
(dynamic arrows and swing gates)
The tunnel is part of the Vancouver to
Tsawwassen Ferry bicycle route Due to bicycle
restrictions this is argued as a major choking
point on the route
There have been no tolls since 1960 The tunnel is reaching its lifespan (~10 years left) The
government of BC has decided to replace the tunnel with
a new bridge with construction slated to begin in 2017
Unknown
6
Tunnel Name Photos Problem Being Solved Community Impacts TollingOther Funding for
Operating and Maintenance Unforseen Problems Dangerous Goods Treament
Vancouver Trans-Canada
Cassiar Connector Tunnel
The tunnel eliminates at-grade intersections
of the Trans Canada Highway and the city
street system and improves traffic flow to
and from the Second Narrows Bridge
The tunnel has led to the removal of the last
remaining traffic lights on the Trans Canada
No Toll Unknown Dangerous goods are prohibited
Exceptions may occur at
specified times and with written
permission
Joseph-Samson Tunnel To connect the east side of downtown
Quebec City the Riviere Saint Charles
Bridge
Unknown No Toll Unknown Dangerous goods are prohibited
Palm Jumeirah Vehicular
Tunnel
A tunnel was needed in order to connect
the spine of The Palm Island to the outter
Crescent
Unknown No Toll Unknown Hazardous loads are not
restricted in the tunnel However
an automatic number plate reader
system is utilized which reads the
hazardous warning plate on a
vehicle when it enters and leaves
the tunnel This system helps
emergency services determine
what type of emergency they are
responding too if an accident was
to occur in one of the tunnels
Ville-Marie and Viger Tunnels
(Montreal A-720)
To create a fast and effective way to move
through the downtown core of Montreal
Unknown No Tolls On July 31st 2011 part of the interior roof collapsed The
tunnel was closed for repairs until August 6th 2011
Dangerous goods are prohibited
Wacker Drive Chicago Originally the highway was built to help
beautify the city and relieve congestion
The highway was built to replace South
Water and River Street
Extension were built in later years to extend
the highway to the east
Unknown No Toll Unknown
Thorold Stone Road Tunnel Highway 58 had to be continued so this
tunnel was constructed underneath the
Welland Canal
Unknown No Tolls During construction the concrete was poured during the
winter months of the year This has led to over-expansion
of the concrete resulting in some cracking Extensive
work has been done to correct this issue during the
summer months of the year which has had impacts on
traffic flow and congestion
Unknown
7
Tunnel Name Photos Problem Being Solved Community Impacts TollingOther Funding for
Operating and Maintenance Unforseen Problems Dangerous Goods Treament
Dulles International The system was built to replace mobile Unknown NA NA
Airport AeroTrain Tunnel lounges (buses) which moved passengers
from the Concourse to the Terminal
Al Salam Street Tunnel
(renamed Sheikh Zayed
Tunnel)
Al Salam Street is the main street in Abu
Dhabi Which connects the downtown
business sector with the 2 main bridges to
Unknown No Toll Unknown Dangerous goods are prohibited
the city Adding a tunnel under the main
road helps with congestion and reducing
travel times along the corridor
Fraser Canyon Highway To complete the Trans Canada Highway Unknown No Toll Unknown Unknown
Tunnels (7 Total) (Highway 1)
Very rural area
East-West Access Road The project will help reduce travel times Construction generated over 100000 jobs Tolled Cost Unknown Unknown Unknown
Annaba Algeria and provide better and safer access to the
north side of the country helping to
stimulate economic development
Laeligrdal Tunnel Due to harsh winters highways and ferries
between the two cities could not remain
Unknown No Tolls Unknown Unknown
open during the winter The tunnel provides
all-season access between the two cities
8
Tunnel Name Photos Inclusion of Vehicles Other than Trucks
Permitted Success of the Tunnel Other Comments
Port Miami Tunnel Trucks use right lane and carsother use left lane
Pedestrians and cyclists are prohibited from the tunnel
The project coincides with other projects which will increase port
traffic such as the Port of Miami Deep Dredge Project and Panama
Canal Expansion
Much public speculation that the project was unnecessary and a
waste of tax payer dollars
Very similar purposeproblem being
resolved to the King Edwards Truck
Tunnel in Ottawa
Dublin Port Tunnel Tolls for all non-truckbus traffic to deter other vehicles
from using the tunnel
The tunnel did in the end remove trucks from the streets of Dublin
but many problems were encountered during construction including
water leaks cost overruns height controversy and house damage
Blanka Tunnel Complex Unknown Tunnel is still under construction Located a few hundred metres from the
protected area of Prague Castle
Seattle Alaskan Way Viaduct
Replacement Tunnel
All types of vehicles permitted Tunnel is still under construction Utilizes the Worlds Largest Tunnel
Boring Machine
Oakland Caldecott Tunnel All types of vehicles permitted
Pedestrians and cyclists are prohibited from the tunnel
Unknown All four bores cross the Hayward Fault
Zone
Auckland Waterview
Connection Tunnel
Unknown Tunnel is still under construction 10th Largest Tunnel Boring Machine
Ever Built
9
Tunnel Name Photos Inclusion of Vehicles Other than Trucks
Permitted Success of the Tunnel Other Comments
Brisbane Clem Jones Tunnel Any vehicles are permitted except the following
- Vehicles and loads exceeding 46m high
- Vehicles carrying commercial quantities of dangerous
goods and specifically any vehicle displaying a
dangerous goods placard
- Mopeds
- Tractors
- Bicycles
Due to the high toll costs and inherent low demand for the tunnel the
bridge has not been as successful as planned due to extremely low
usage
Tunnel was sold in 2013 to Queensland Motorways for $618 Million
(AUD) well below the cost of $31 Billion (AUD) to build it
Very similar situation to Hwy 407 in
Toronto Ontario Canada
Calgary Airport Trail Tunnel All types of vehicles permitted Unknown
Detroit-Windsor Tunnel Motorcyles are prohibited in the tunnel About 13000
vehicles travel throught he tunnel daily 98 of them are
cars
Unknown
Louis-Hippolyte Lafontaine
Bridge-Tunnel
All types of vehicles permitted
Pedestrians and cyclists are prohibited from the tunnel
Unknown
Robertson Tri-Met Tunnel NA Unknown The tunnel is constructed through 16
million year old basalt layers - therefore
the tunnel curves updown and side to
side in order to follow the best rock
construction conditions
New Portsmouth Midtown
Immersed Tunnel
All types of vehicles permitted
Pedestrians and cyclists are prohibited from the tunnel
Tunnel is still under construction
George Massey Tunnel The tunnel is illegal for cyclists or pedestrians to traverse
Shuttle buses operate to provide access through the
tunnel for pedestrians and cyclists (the tunnel is part of
the Tsawwassen Ferry Bicycle Route)
Successful However 50 years later it does have traffic congestion
issues
The Geroge Massey Tunnel was the
first tunnel to use a precast construction
method (precast concrete sections) in
North America
10
Tunnel Name Photos Inclusion of Vehicles Other than Trucks
Permitted Success of the Tunnel Other Comments
Vancouver Trans-Canada
Cassiar Connector Tunnel
All types of vehicles permitted No pedestrians are
permitted
Unknown
Joseph-Samson Tunnel All types of vehicles permitted
Pedestrians and cyclists are prohibited from the tunnel
Unknown
Palm Jumeirah Vehicular
Tunnel
All types of vehicles permitted
Pedestrians and Bicycles are prohibited from the tunnel
Unknown Third tunnel in the world to be equiped
with Traficons Incident Detection
System (includes traffic incident
detection and flow monitoring traffic
data collection and pedestrian
detection)
Ville-Marie and Viger Tunnels
(Montreal A-720)
All types of vehicles permitted Unknown
Wacker Drive Chicago Unknown Unknown
Thorold Stone Road Tunnel All types of vehicles permitted There is a walkway in the
westbound side for pedestrians
Unknown
11
Tunnel Name Photos Inclusion of Vehicles Other than Trucks
Permitted Success of the Tunnel Other Comments
Dulles International
Airport AeroTrain Tunnel
People Mover (AeroTrain) Unknown
Al Salam Street Tunnel
(renamed Sheikh Zayed
Tunnel)
All types of vehicles under 55m and under 25 tonnes
are permitted Pedestrians and cyclists are prohibited
from the tunnel Cameras are used to detect vehicle
height and detect when a vehicle taller than 55m has
entered the tunnel
Unknown
Fraser Canyon Highway
Tunnels (7 Total)
All types of vehicles permitted Cyclists are also
permitted
Unknown Two of the tunnels having warning lights
which cyclists activate prior to entering
the tunnel to notify motorists (due to
winding road conditions)
East-West Access Road
Annaba Algeria
Unknown Uknown
Laeligrdal Tunnel All types of vehicles permitted
Pedestrians and cyclists are prohibited from the tunnel
Tunnel is very rural
Unknown Longest Road Tunnel in the World
Tunnel is divided into 4 segments
seperated by large mountain caves The
main tunnel utilizes white lights while
the caves are different colours to beak
routine They also help with
claustrophobia
12
Tunnel Name Photos Web LINKS
Port Miami Tunnel httpwwwportofmiamitunnelcom
httpenwikipediaorgwikiPort_Miami_Tunnel
Dublin Port Tunnel httpdublintunnelieabout
httpenwikipediaorgwikiDublin_Port_Tunnel
httpwwwengineersjournalieoperations-dublin-tunnel
httpdublintunneliehauliers23_6_2008_Dangerous_Goods_Regspdf
Blanka Tunnel Complex httpwwwradioczensectioncurraffrsmassive-blanka-tunnel-has-been-completed-aftershy
years-of-delays
httpwwwcttaorgFileUploadita2007PdfCH-178pdf
httpwwwsatraczenblanka-tunnel-complex
httpenwikipediaorgwikiBlanka_tunnel_complex
httpwwwita-aitesczenpodzemni_stavbypodzemni_stavby_ve_vystavbeblanka-complexshy
tunnels-praguehtml
Seattle Alaskan Way Viaduct
Replacement Tunnel
httpwwwwsdotwagovProjectsViaductAboutTunneling
httpenwikipediaorgwikiAlaskan_Way_Viaduct_replacement_tunnel
httpwwwworldfinancecominfrastructure-investmentalaskan-way-viaduct-replacement-toshy
reshape-seattles-future
Oakland Caldecott Tunnel httpenwikipediaorgwikiCaldecott_Tunnel
httpwwwcaldecott-tunnelorg
Auckland Waterview
Connection Tunnel
httpwwwnztagovtnzprojectswaterviewconnection
httpenwikipediaorgwikiWaterview_Connection
13
Tunnel Name Photos Web LINKS
Brisbane Clem Jones Tunnel httpwwwclem7comaucontent22338Working-With-Our-Community
httpenwikipediaorgwikiClem_Jones_TunnelPoor_patronage
httpwwwbrisbaneqldgovautraffic-transportroads-infrastructure-bikewaystunnelsshy
bridges-transport-linksclem7-tunnel
httpwwwsmhcomaubusinessturning-3b-into-618m-brisbanes-failed-clem7-tunnel-soldshy
off-20130927-2uihwhtml
Calgary Airport Trail Tunnel httpenwikipediaorgwikiCalgary_International_Airport
httpwwwcalgarycaTransportationTIPagesRoad-projectsAirport-Trail-Tunnelaspx
httpconftac-atccaenglishannualconferencetac2013session10linpdf
httpwwwpclcomprojects-that-inspirepagesairport-trail-underpassaspx
Detroit-Windsor Tunnel httpenwikipediaorgwikiDetroitE28093Windsor_Tunnel
httpwwwdwtunnelcomAboutUsaspx
httpprojectswindsorpubliclibrarycomdigifleetwayhistophplang=enampstory=1
Louis-Hippolyte Lafontaine
Bridge-Tunnel
httpenwikipediaorgwikiLouis-Hippolyte_Lafontaine_BridgeE28093Tunnel
httpwwwmontrealroadscomcrossingslafontaine
httpwwwtrucknewscomfeaturesquebec-to-harmonize-dangerous-goods-regulations
Robertson Tri-Met Tunnel httpenwikipediaorgwikiRobertson_Tunnel
httpconferenceswsueduformsbridgeinspectorspresentations138apdf
New Portsmouth Midtown
Immersed Tunnel
httpwwwfhwadotgovipdproject_profilesva_midtown_tunnelaspx
httpswwwdriveertcomconstructionmidtown-tunnel
httpenwikipediaorgwikiMidtown_Tunnel_(Virginia)
httpwwwtunneltalkcomMidtown-Tunnel-Dec11-PPP-contract-awardedphp
httpwwwroadstothefuturecomMid_Tunn_Port_Norf_MLKhtml
httpswwwdriveertcomfaq
httpwwwdmvnowcomwebdocpdfdmv109pdf
George Massey Tunnel httpenwikipediaorgwikiGeorge_Massey_TunnelConfiguration
httpwww2newsgovbccanews_releases_2013-20172013PREM0095-001430pdf
httpengagegovbccamasseytunnel
14
Tunnel Name Photos Web LINKS
Vancouver Trans-Canada
Cassiar Connector Tunnel
httpswwwgooglecaurlsa=tamprct=jampq=ampesrc=sampsource=webampcd=8ampved=0CD4QFjAHampu
rl=http3A2F2Fwwwtunnelcanadaca2Fdocumentshy
loadphp3Fdir3D199426file3DBruce_et_al_1994pdfampei=VKX4VN6bL5alyAS6hoC
QAQampusg=AFQjCNEdndSmvvPiCZFLpi7FBw-SHAurqgampsig2=rPshy
iZfilrpx_ZhniYW3ypAampbvm=bv87519884daWwampcad=rja
httpenwikipediaorgwikiCassiar_Tunnel
httpwwwquickscribebccasecurepdfs3232pdf
Joseph-Samson Tunnel httpwww2publicationsduquebecgouvqccadynamicSearchtelechargephptype=1ampfile=
5021PDF
httpwwwnyx-hemeracomenprojectsitem45-tunnel-joseph-samson-in-quebec-cityshy
canada
Palm Jumeirah Vehicular
Tunnel
httpwwwparsonscomprojectsPagespalm-jumeirah-vehicular-tunnelaspx
httpwwwdesignbuild-networkcomprojectspalm-jumeirah
httpwwwworldhighwayscomcategoriesroad-highway-structuresfeatureskeepingshy
tunnels-safe
Ville-Marie and Viger Tunnels
(Montreal A-720)
httpstructuraenetstructuresville-marie-tunnel
httpwww2publicationsduquebecgouvqccadynamicSearchtelechargephptype=2ampfile=
2F2FC_24_22FC24_2R43_Ahtm
httpenwikipediaorgwikiQuebec_Autoroute_720
httpwwwmontrealroadscomroadsA-720
Wacker Drive Chicago httpenwikipediaorgwikiMultilevel_streets_in_Chicago
httpenwikipediaorgwikiWacker_Drive
Thorold Stone Road Tunnel httpwwwniagarafrontiercomchr
onohtml
httpenwikipediaorgwikiThorold_Tunnel
httpenwikipediaorgwikiOntario_Highway_58
15
Tunnel Name Photos Web LINKS
Dulles International
Airport AeroTrain Tunnel
httpwwwmetwashairportscomfileaerotrain_paperpdf
Al Salam Street Tunnel
(renamed Sheikh Zayed
Tunnel)
httpwwwparsonscomMedia20LibraryParsons-in-MENApdf
httpwwwlouisberger-francecomennews-and-events76-ouverture-du-tunnel-de-la-rue-alshy
salam-abu-dhabi
httpwwwthenationalaeuaetransportabu-dhabis-sheikh-zayed-tunnel-project-winsshy
prestigious-award
httpwwwthenationalaenewsuae-newssalam-street-tunnel-renamed-and-now-open-toshy
the-public
httpwwwlouisbergergroupcomOurProjectsMiddle20EastSheikh20Zayed20Street
Fraser Canyon Highway
Tunnels (7 Total)
httpenwikipediaorgwikiFraser_CanyonTunnels
httpwwwthgovbccapublicationsfrontiertofreewayfrontiertofreewaypdf
East-West Access Road
Annaba Algeria
httpwwwcetmoorgpdf03Physical20State20Transshy
Maghreb20Motorway20Axis_SUfMpdf
httpenwikipediaorgwikiAlgeria_EastE28093West_Highway
Laeligrdal Tunnel httpenwikipediaorgwikiLC3A6rdal_Tunnel
httpbasementgeographercomlaerdal-tunnel-the-worlds-longest-road-tunnel
httpwwwengineeringcomLibraryArticlesPagetabid85ArticleID60Laerdal-Tunnelaspx
16
Catalogue no 16‑002‑X ISSN 1913‑4320
EnviroStats
Trucking dangerous goods in Canada 2004 to 2012
by Sagal Searag Greg Maloney and Larry McKeown Environment Energy and Transportation Statistics Division
Release date February 11 2015
How to obtain more information For information about this product or the wide range of services and data available from Statistics Canada visit our website wwwstatcangcca
You can also contact us by
email at infostatsstatcangcca
telephone from Monday to Friday 830 am to 430 pm at the following toll‑free numbers
bull Statistical Information Service 1‑800‑263‑1136 bull National telecommunications device for the hearing impaired 1‑800‑363‑7629 bull Fax line 1‑877‑287‑4369
Depository Services Program
bull Inquiries line 1‑800‑635‑7943 bull Fax line 1‑800‑565‑7757
Standards of service to the public Statistics Canada is committed to serving its clients in a prompt reliable and courteous manner To this end Statistics Canada has developed standards of service that its employees observe To obtain a copy of these service standards please contact Statistics Canada toll‑free at 1‑800‑263‑1136 The service standards are also published on wwwstatcangcca under ldquoAbout usrdquo gt ldquoThe agencyrdquo gt ldquoProviding services to Canadiansrdquo
Note of appreciation Canada owes the success of its statistical system to a long‑standing partnership between Statistics Canada the citizens of Canada its businesses governments and other institutions Accurate and timely statistical information could not be produced without their continued co‑operation and goodwill
Standard table symbols The following symbols are used in Statistics Canada publications
not available for any reference period
not available for a specific reference period
not applicable 0 true zero or a value rounded to zero 0s value rounded to 0 (zero) where there is a meaningful
distinction between true zero and the value that was rounded p preliminary r revised x suppressed to meet the confidentiality requirements
of the Statistics Act E use with caution F too unreliable to be published significantly different from reference category (p lt 005)
Published by authority of the Minister responsible for Statistics Canada
copy Minister of Industry 2015
All rights reserved Use of this publication is governed by the Statistics Canada Open Licence Agreement
An HTML version is also available
Cette publication est aussi disponible en franccedilais
Statistics Canada mdash February 2015 EnviroStats 1
Trucking dangerous goods in Canada 2004 to 2012
by Sagal Searag Greg Maloney and Larry McKeown Environment Energy and Transportation Statistics Division
Highlights bull The Canadian for-hire trucking industry moved 650 million tonnes of freight in 2012 of which almost 17 consisted
of dangerous goods
bull In 2012 crude petroleum products accounted for the largest share of dangerous goods at over one-third (38) up from one-quarter (25) in 2004
bull During 2012 the for-hire trucking industry is estimated to have transported approximately four times the dangerous goods by weight than did railways
Introduction Recent events have heightened public awareness concerning the transportation of dangerous goods While economic regulation of Canadarsquos transportation sector has been reduced over the last 25 years the movement of dangerous goods continues to be carefully regulated Compared to other freight shipments of explosives gases flammable liquids flammable solids oxidizing substances poisonous and infectious substances nuclear substances corrosives and other products pose public safety and environmental risks1 The consequences of accidents or spills can be severe particularly if shipments travel through population centres or fragile ecosystems2
Regulations on the movement of dangerous goods can vary by jurisdiction but generally require accurate classification appropriate means of containment and correct marking labelling and documentation In Canada federal legislation currently prohibits the transportation of certain high risk dangerous goods unless an Emergency Response Assistance Plan (ERAP) has been submitted and approved The plan outlines how specialized emergency response personnel will react to
an accident and their overall capacity to respond As dangerous goods are likely to remain a significant portion of the overall freight moved across the country there is a recognized need to further enhance the monitoring of these shipments
For instance in June of 2014 Transport Canada amended the Transportation of Dangerous Goods Regulations to clarify the criteria for displaying safety marks3 The regulation now requires safety marks to be displayed on trucks rail cars and bulk containers used to transport dangerous goods identifying the type of goods and the nature of the risk posed And in August Transport Canada launched the second stage of consultations concerning adequate railway third party liability insurance in order to cover among other costs the spill of contaminants and environmental damage related to railway operation4
Surface transportation (ie road and rail excluding pipelines) is estimated to move almost 95 of the total tonnage of dangerous goods in Canada with trucking accounting for the largest share5 The possibility that accidents might occur at any time or any location
1 Dangerous goods are defined by the Transportation of Dangerous Goods Act 1992 as products substances or organisms in any of these nine classes Based on their inherent nature these goods are further classified from Packing Group I indicating great danger to Packing Group III indicating minor danger
2 For example estimated costs to clean-up the 2010 spill of diluted bitumen into Michiganrsquos Kalamazoo River basin now exceed $1-billion De Souza M 2014 ldquoThe pipeline proposals feeding Harperrsquos oil gridrdquo Power amp Influence The Business Issue Vol 3 no 3 Hill Times Publishing
3 Government of Canada 2014 Regulations Amending the Transportation of Dangerous Goods Regulations (Part 4 Dangerous Goods Safety Marks) PC 2014-684 June 12 2014 SOR2014-159 Canada Gazette Vol 148 no 14 July 2 2014
4 Transport Canada 2014 Comprehensive Review of the Third Party Liability and Compensation Regime for Rail TP 15242 E wwwtcgccamediadocuments policyDiscussion-Paper-Compensation-Liabilitypdf (accessed September 19 2014)
5 Provencher M 2010 The Movement and Handling of Dangerous Goods in Canada for the Year 2008 Transport Canada Transport Dangerous Goods Directorate Ottawa
2 EnviroStats February 2015 mdash Statistics Canada
Trucking dangerous goods in Canada 2004 to 2012
Chart 1 Total goods trucked by type Canada 2004 to 2012
weight (thousands of tonnes)
700000
600000
500000
400000
300000
200000
100000
Other goods Dangerous goods
Source Statistics Canada Environment Energy and Transportation Statistics Division Trucking Commodity Origin and Destination Survey (survey number 2741) various years
2004 2005 2006 2007 2008 2009 2010 2011 2012 0
between the origin and destination raises questions concerning the nature of these types of shipments To provide some perspective this study examines the dangerous goods
transported by the Canadian for-hire trucking industry from 2004 to 2012 focusing on tonnage types of goods and average distance per shipment
Increasing weight shipped
In 2012 the combined weight of all commodities moved by Canadian for-hire trucking establishments reached
What you should know about this study Statistics Canadarsquos Trucking Commodity Origin and Destination Survey (TCOD) targets large (annual revenue gt $13 million) establishments in the Canadian for-hire trucking industry (North American Industry Classification System 484) It excludes foreign-based trucking establishments operating in Canada and non-trucking establishments with their own fleets (ie private trucking) As such TCOD estimates should be considered as a lower boundary of total trucking activity in Canada For comparison for-hire trucking establishments in the United States accounted for just 58 of dangerous goods trucked by weight in 2012 but averaged over 45 times the distance shipped
Over the study period the number of target establishments ranged roughly from 2100 to 2900 in 2012 92 of 2196 establishments responded to the survey Statistics Canada interviewers visit each establishment and using a systematic sample of shipping documents record information on the origin and destination of shipments as well as the weight and type of goods The coefficient of variation (CV) by weight was calculated at less than 5 for all types of shipments in 2012
Commodities are classified to a Standard Classification of Transported Goods (SCTG) aggregation which includes about 500 groups In many cases all commodities in a group are considered dangerous while in other groups some are dangerous and others are not In the second case an algorithm based on Transport Canada information is used to apply a flag that reflects the likelihood that the shipment includes dangerous goods In 2012 97 of shipments by weight flagged as dangerous goods were classified to SCTG groups in which all goods are dangerous such as Petroleum products In comparison shipments of Glues and prepared glues were considered as dangerous 18 of the time
over 650 million tonnes a record amount culminating from steady growth experienced following the 2009 economic downturn (Chart 1) A key portion of these shipments in 2012 consisted of dangerous goods at just over 107 million tonnes (17 of all goods) up from the 81 million tonnes (or 14) trucked in 2004 This represents an increase of 32 since 2004 almost twice the rate of growth of the industryrsquos overall shipments (17) during this same period
Road versus rail Recent derailments have served to increase the level of scrutiny associated with the movement of dangerous goods by rail6 However a larger tonnage of dangerous
6 See for example Winter J 2014 ldquoSafety in Numbers Evaluating Canadian Rail Safety Datardquo SPP Communiqueacute Vol 6 no 2 University of Calgary The School of Public Policy
Trucking dangerous goods in Canada 2004 to 2012
Chart 2 Surface transportation1 of dangerous goods in Canada 2012
20
80
Rail transportation (NAICS 482) 261 million tonnes Truck transportation (NAICS 484) 1074 million tonnes
1 Excluding pipelines Note NAICS North American Industry Classification System Sources Statistics Canada Environment Energy and Transportation Statistics Division Trucking Commodity Origin and Destination Survey (survey number 2741) and Monthly Railway Carloadings Survey (survey number 2732) 2012
goods is transported by truck In 2012 the for-hire trucking industry handled approximately four times the dangerous goods by weight than did the mainline railways (Chart 2)7 In the United States but including private trucking carriers about 93 of the more than 16 billion tons of dangerous goods transported by surface moved by truck8
Despite carrying more dangerous goods by weight the consequences of an accident by truck are limited to a small number of trailers on a per truck basis And moreover the average shipments by truck i n v o l v e s h o r t e r d i s t a n c e s 9
Shipments of dangerous goods by truck and rail would be therefore more comparable on a per tonne-kilometre basis However it should also be noted that most accidents and spills of dangerous goods occur during handling rather than during actual transit10
The top four dangerous goods
Although the top four dangerous goods trucked by weight remained the same over the study period they accounted for almost 80 of the total by 2012 up from 71 in 2004 (Chart 3) The increase was driven largely by the trucking of crude
petroleum products which more than doubled to reach over 40 million tonnes by 2012 accounting for more than one-third (38) of the total
Over the same period shipments of gasoline and aviation turbine fuel rose 11 to 26 million tonnes while fuel oils increased 16 to 124 million tonnes and non-metallic minerals (such as sulphur) rose 43 to 52 million tonnes Fertilizers and fertilizer materials (including nitric acid sulphonitric acids and ammonia) the fifth largest category of dangerous goods trucked in 2012 at 26 million tonnes increased by approximately 180 over the study period
Average distance An interesting factor is the distance that dangerous goods travel to reach their destination From 2004 to 2012 the average distance of all shipments trucked in Canada was estimated to have increased from 608 to 632 kilometres However shipments of dangerous goods declined from an average of 316 to 269 kilometres This decline reflects an increase in energy-related shipments particularly crude petroleum products since on average shipments of these products travelled about one-third (35) of the distance than did other dangerous goods (Table 1)
7 The rail proportion is estimated from the Monthly Railway Carloadings Survey based on the UN dangerous good designation identified by Standard Transportation Commodity Codes for revenue-generated freight moved by the two mainline freight railways only
8 US Department of Transportation Bureau of Transportation Statistics and US Department of Commerce US Census Bureau 2015 Hazardous Materials 2012 Commodity Flow Survey (Draft January) Washington
9 In the United States the average distance per hazardous material shipment by for-hire truck was 150 miles versus 808 by rail (2012 US Commodity Flow Survey)
10 Provencher M 2010 The Movement and Handling of Dangerous Goods in Canada for the Year 2008 Transport Canada Transport Dangerous Goods Directorate Ottawa
Statistics Canada mdash February 2015 EnviroStats 3
Chart 3 Top four dangerous goods trucked in Canada 2004 and 2012
weight (thousands of tonnes)
45000
40000
35000
30000
25000
20000
15000
10000
5000
0 Crude petroleum Gasoline and aviation Fuel oils Non-metallic minerals
products turbine fuel nec
Dangerous goods
2004 2012
Source Statistics Canada Environment Energy and Transportation Statistics Division Trucking Commodity Origin and Destination Survey (survey number 2741) various years
A shorter average distance for trucking crude petroleum products is partly tied to extraction areas in Alberta and Saskatchewan and proximity to trans-loading facilities
For Alberta the oil sands region in the north of the province has limited rail service and pipeline access Consequently heavy oil is often trucked to feeder pipelines which serve consolidation points in the
Edmonton area for rail and further southeast for pipeline11 In 2012 shipments of crude petroleum products were trucked an average distance of 95 km in Alberta
For Saskatchewan although its Bakken region in the south of the province has extensive rail coverage there has been insufficient feeder pipeline infrastructure Although the majority of crude is shipped out
Table 1 Average distance trucked by type of shipment Canada 2012
Shipment type kilometres Dangerous goods
Crude petroleum products 110
Other dangerous goods 313
Non-dangerous goods 665
All shipments 632
Source Statistics Canada Environment Energy and Transportation Statistics Division Trucking Commodity Origin and Destination Survey (survey number 2741) 2012
of the region by rail it must first be trucked to a rail loading facility On average crude petroleum products were trucked a distance of 118 km in Saskatchewan
Provincial perspectives By province of origin Alberta accounted for almost half of the national total weight of dangerous goods transported by truck in 2012 (Chart 4) The province also experienced the largest growth increasing by over 19 million tonnes from 2004 to 2012 Again this growth was driven largely by crude petroleum products as shipments of these products that originated in Alberta more than doubled from almost 15 million tonnes in 2004 to over 30 million tonnes by 2012
Similarly for Saskatchewan crude petroleum products shipped by truck rose from about 5 million tonnes to over 9 million tonnes Combined with increased shipments of gasoline and aviation turbine fuel as well as fuel oils fertilizers and fertilizer materials the weight of dangerous goods shipped in the province reached 147 million tonnes by 2012
Over the study period British Columbia and Manitoba experienced s o m e g r o w t h i n s h i p m e n t s while Ontario and Quebec both experienced a decline in the tonnage of dangerous goods transported by truck
A l though prov inc ia l patterns of dangerous goods shipped by truck will evolve crude petroleum products in the west are likely to continue driving national estimates by weight In Alberta for instance total crude oil production per month
11 See Cairns M 2013 Crude Oil By Rail - Parts I and II Potential for the Movement of Alberta Oil Sands Crude Oil and Related Products by Canadian Railways Canadian Transportation Research Forum Proceedings (June 10 to 12 2013) pages 412 to 433 Halifax
4 EnviroStats February 2015 mdash Statistics Canada
0
Chart 4 Dangerous goods trucked by province of origin 2004 and 2012
weight (thousands of tonnes)
60000
50000
40000
30000
20000
10000
NL PEI NS NB Que Ont Man Sask Alta BC
Province of origin
2004 2012
Source Statistics Canada Environment Energy and Transportation Statistics Division Trucking Commodity Origin and Destination Survey (survey number 2741) various years
has risen from an average of 93 million cubic metres in 2010 to 125 million cubic metres during the first half of 201412 largely from synthetic crude oil and crude bitumen extraction And truck-to-rail delivery is now considered as a medium term alternative to access those areas not served directly by pipelines13
12 Statistics Canada CANSIM table 126-0001 (accessed October 5 2014) 13 Ricciotti L 2013 ldquoRailcars and trucks make a comeback as methods for shipping oilrdquo Alberta Oil Magazine wwwalbertaoilmagazinecom201302railcars-
trucks-make-oil-comeback (accessed September 28 2014)
Statistics Canada mdash February 2015 EnviroStats 5
19992000 INTERPROVINCIAL
ROADSIDE TRUCK SURVEY REPORT
ENQUEcircTE ROUTIEgraveRE INTERPROVINCIALE SUR LE CAMIONNAGE 19992000 RAPPORT
McLean Transportation Engineering Consultants Ltd
TRANS MEMBER AGENCIES
National Capital Commission Mr Arto Keklikian Capital Planning and Real Asset Management
Ministegravere des Transports Queacutebec Monsieur Ghislain Couture Direction reacutegionale de lrsquoOutaouais
Ministry of Transportation Ontario Mr James Wong Transportation Planning Branch
Ville de Gatineau Monsieur Paul-Andreacute Roy Service Urbanisme
City of Ottawa Mr Don Stephens PEng ( Manager TRANS Programme ) Planning Environment and Infrastructure Policy Mr Rob Calladine Planning Environment and Infrastructure Policy
Socieacuteteacute de transport de lOutaouais Monsieur Salah Barj Service Strateacutegies et Deacuteveloppement Monsieur Carmel Dufour Service Strateacutegies et Deacuteveloppement
OCTranspo Mr Colin Leech Service Planning Department
19992000 INTERPROVINCIALROADSIDE TRUCK SURVEY
REPORT
ENQUEcircTE ROUTIEgraveRE INTERPROVINCIALE SUR LE CAMIONNAGE 19992000
RAPPORT
Prepared for Preacutepareacute pour
TRANS A Joint Technical Committee on Transportation Systems Planning
Un Comiteacute technique conjoint sur la planification des systegravemes de transport
By Par McLean Transportation Engineering Consultants Ltd
June juin 2002
ACKNOWLEDGEMENTS TRANS would like to acknowledge the funding support received from the following member Agencies
x National Capital Commission x Ministegravere des Transports du Queacutebec x Ministry of Transportation Ontario x Ville de Gatineau (formerly
Communauteacute Urbain de lrsquoOutaouais) x City of Ottawa (formerly Regional
Municipality of Ottawa-Carleton)
The roadside surveys while funded by TRANS Agencies were carried out in 1999 and 2000 by EarthTech Canada Inc under contract to the Province of Ontario (Ministry of Transportation) for the administration of all the roadside surveys across the province as part of the National Roadside Truck Survey Special thanks to Mr Rob Tardif Coordinator Commercial Vehicle Survey for the Ministry of Transportation of Ontario (MTO) who oversaw the survey work on behalf of TRANS Agencies and to Mr David Smith Manager Data Management and Analysis Office (MTO) for ongoing project support
The ldquo19992000 INTERPROVINCIAL ROADSIDE TRUCK SURVEYrdquo report was prepared by McLean Transportation Engineering Consultants Ltd The consultant acknowledges the invaluable assistance of Mr Petar Grubor of the City of Ottawa in the preparation of tabulations Mr Don Stephens Manager TRANS Programme and the Steering Committee Members in the provision of advice during the preparation of this report
REMERCIEMENTS TRANS souhaite remercier les organismes membres pour leur soutien financier
x La Commission de la Capitale nationale x Le ministegravere des Transports du Queacutebec x Le ministegravere des Transports de
lrsquoOntario x La Ville de Gatineau (autrefois la
Communauteacute urbaine de LrsquoOutaouais) x La Ville drsquoOttawa (autrefois la
Municipaliteacute reacutegionale drsquoOttawa-Carleton)
Lrsquoenquecircte routiegravere bien que financeacutee par les membres du groupe TRANS fucirct exeacutecuteacutee par Earthtech Canada Inc en 1999 et 2000 pour le compte de la province drsquoOntario (ministegravere des Transports) pour effectuer toutes les enquecirctes routiegraveres de la province en tant que participant dans lrsquoenquecircte nationale sur le camionnage Au nom des membres du groupe TRANS nous tenons agrave remercier monsieur Robert Tardif coordonnateur au Service des enquecirctes sur les veacutehicules commerciaux pour le ministegravere des Transports de lrsquoOntario (MTO) pour son travail de supervision dans cette enquecircte Nous tenons agrave remercier eacutegalement monsieur David Smith gestionnaire au Bureau de la gestion des donneacutees et des analyses (MTO) pour son soutien dans ce projet
McLean Transportation Engineering Consultants Ltd qui a prepare le rapport ldquoENQUEcircTE ROUTIEgraveRE INTERPROVINCIALE SUR LE CAMIONNAGE 19992000rdquo remercie monsieur Petar Grubor de la Ville drsquoOttawa pour son aide preacutecieuse dans la preacuteparation des tables monsieur Don Stephens gestionnaire du groupe TRANS ainsi que les membres du comiteacute technique pour leurs conseils lors de la preacuteparation de ce rapport
Interprovincial Roadside Truck Survey Enquecircte routiegravere interprovinciale sur le camionnage Executive Summary Sommaire
EXECUTIVE SUMMARY
Background
In the autumns of 1999 (October) and 2000 (September) surveys co-ordinated by TRANS were undertaken to establish a comprehensive database on interprovincial truck travel characteristics in the National Capital Region Surveys were carried out only on the Chaudiegravere and Macdonald-Cartier bridges as the movement of ldquoheavy trucksrdquo is prohibited on the remaining three bridges - the Alexandra Portage and Champlain bridges The roadside surveys were part of a broader national roadside survey program led by Transport Canada with participation of the provinces
The purpose of this study was the development of a good understanding of the interprovincial movement patterns origins destinations and characteristics of heavy trucks in the National Capital Region and the satisfaction of the TRANS mandate to furnish high quality and meaningful transportation data required for transportation planning and decision making in the National Capital Region In this context the study was undertaken to establish a comprehensive database of information regarding the characteristics of trucks crossing the Ottawa River and thus provide a basis for future studies and analysis In meeting this objective this study does not directly address specific transportation issues but rather provides TRANS Agencies with a database for this purpose Detailed analysis of the comprehensive data base would be necessary to assess the impact of new
SOMMAIRE
Contexte
En octobre 1999 et en septembre 2000 une enquecircte coordonneacutee par le groupe TRANS a eacuteteacute reacutealiseacutee dans le but de constituer une base de donneacutees complegravete au sujet du transport interprovincial de marchandises par camions qui traversent la riviegravere des Outaouais Lrsquoenquecircte routiegravere a eacuteteacute effectueacutee seulement sur les ponts Chaudiegravere et Macdonald-Cartier puisqursquoil est interdit aux poids lourds de circuler sur les trois autres ponts (Alexandra Portage et Champlain) Cette enquecircte srsquoinscrivait dans un programme drsquoeacutetude national dirigeacute par Transports Canada en collaboration avec les provinces
Cette eacutetude visait agrave brosser un tableau de la situation en ce qui a trait aux itineacuteraires aux points de deacutepart aux destinations et aux caracteacuteristiques des camions poids lourds dans la reacutegion de la capitale nationale Elle permettait aussi agrave TRANS de reacuteunir des donneacutees pertinentes et de qualiteacute pouvant faciliter la planification et la prise de deacutecisions concernant le transport dans la reacutegion de la capitale nationale conformeacutement au mandat qui lui avait eacuteteacute confieacute Dans ce contexte lrsquoenquecircte avait pour but de constituer une base de donneacutees exhaustive au sujet des camions qui franchissent la riviegravere des Outaouais et drsquoeacutetablir ainsi un point de deacutepart pour des eacutetudes et des analyses ulteacuterieures Compte tenu de cet objectif le rapport ne traite directement drsquoaucun enjeu preacutecis en matiegravere de transport mais fournit aux organisms de TRANS les donneacutees
i
Interprovincial Roadside Truck Survey Enquecircte routiegravere interprovinciale sur le camionnage Executive Summary Sommaire
or improved infrastructure on interprovincial truck traffic and would be a prerequisite for reaching any meaningful conclusions regarding future interprovincial transport needs
The database which is available for future studies provides significant information regarding the movement of heavy trucks across the Ottawa River historical heavy truck trends their composition in the traffic stream and their associated travel patterns
Roadside driver interview surveys gathered specific data on the characteristics of the trucks the travel patterns including detailed information on the trip origins and destinations and the commoditygoods carried The surveys revealed that approximately 3450 trucks cross the Ottawa River on a daily basis Trip characteristics were obtained from a sample of 143 of the vehicles and this sample was considered to be of sufficient magnitude and strength to allow expansion of the data by bridge and by certain time periods
Truck Classification
The classification system applied three key categories of trucks (heavy trucks) as follows
x 2 axle trucks - which represent trucks with six wheels such as tow trucks large (34 ton 1 ton) pick-up trucks small vans small dump trucks etc defined as heavy trucks
neacutecessaires permettant de se pencher sur la question Il faudrait proceacuteder agrave une analyse deacutetailleacutee de la base de donneacutees exhaustive afin drsquoeacutevaluer les effets de la construction ou de la modernisation drsquoinfrastructures sur le transport interprovincial par camion analyse qui devrait ecirctre effectueacutee avant de pouvoir tirer de conclusions significatives sur les besoins futurs du transport interprovincial
La base de donneacutees qui pourra servir pour de futures eacutetudes contient des renseignements importants sur la circulation des poids lourds qui traversent la riviegravere des Outaouais sur lrsquoeacutevolution de la situation au fil des ans sur la place des poids lourds dans le flot de circulation et sur leurs itineacuteraires
Les camionneurs interrogeacutes ont fourni des donneacutees preacutecises sur les caracteacuteristiques de leurs veacutehicules et sur leurs itineacuteraires y compris leurs points de deacutepart et leurs destinations et la nature de leurs cargaisons Lrsquoenquecircte a reacuteveacuteleacute qursquoenviron 3 450 camions franchissent chaque jour la riviegravere des Outaouais Les caracteristiques des deacuteplacements ont eacuteteacute obtenues agrave partir drsquoun eacutechantillon de 143 des camions Ceci constitue un eacutechantillon de taille et drsquoimportance suffisantes pour effectuer une expansion des reacutesultats par pont et par peacuteriode de la journeacutee
Cateacutegories de camions
Le systegraveme de classement preacutevoyait trois cateacutegories de poids lourds
ii
x 3+ axle trucks - which represent medium size trucks such as large dump trucks straight trucks concrete mix trucks etc which are also defined as heavy trucks
x tractor trailer trucks - which represent the largest trucks such as tractor-trailer trucks flat-bed trucks etc
Of the total of approximately 3450 trucks observed over a 24 hour period as crossing the Ottawa River there were 1550 2 axle (45) 880 3+ axle (25) and 1020 tractor trailer (30) trucks
x camions agrave deux essieux ndash comprenant notamment les camions agrave six roues comme les deacutepanneuses les grosses camionnettes de trois quarts de tonne agrave une tonne les petits camions et les petits camions agrave benne consideacutereacutes comme des poids lourds
x camions agrave trois essieux et plus ndash comprenant notamment les camions de taille moyenne comme les gros camions agrave benne les camions porteurs et les camions malaxeurs consideacutereacutes aussi comme des poids lourds
45
Tractor Trailer Camion gros porteur
30
3+ Axle Truck Camion agrave 3 essieux et plus
252 Axle Truck Camion agrave 2 essieux
STUDY TRUCK CLASSIFICATION b CATEacuteGORIES DE CAMIONSb
x camions gros porteurs ndash comprenant notamment les camions les plus gros comme les semi shyremorques et les camions agrave plateshyforme
Interprovincial Roadside Truck Survey Enquecircte routiegravere interprovinciale sur le camionnage Executive Summary Sommaire iii
Truck Volumes
Daily heavy truck volumes crossing the Ottawa River were in 2000 approximately 3450 which is 5 higher than the recorded ten year average (3285) For comparative purposes overall traffic levels crossing the Ottawa River on all five bridges are about 200000 vehicles per day (traffic counts undertaken in 2000 indicate an average one way volume of approximately 94000 vehicles)
Truck movements are more predominant during the mid-day hours than in the commuter peak hours The mid-day peaking phenomenon may be attributed to the need to meet the expectations of the business day and quite possibly trucker attempt to avoid the commuter peak periods The tractor trailer trucks (which represented about 30 of all interprovincial truck trips) reported longer trip lengths and consequently were as a category responsible for approximately 50 of the total trip distance travelled by all trucks In contrast the 3+ axle trucks (representing 25 of the truck trips) were responsible for 20 of the distance travelled by all trucks while the 2 axle trucks (45 of interprovincial truck trips) were associated with 30 of the distance travelled by trucks
Most truck traffic across the Ottawa River occurs between 0600 and 2100 Approximately 95 of the 3+ axle trucks 93 of the 2 axle trucks and 80 of the tractor trailer crossings of the Ottawa River have occurred by 2100 This suggests that the tractor trailer vehicles tend to be more spread out across the 24 hour period than the other two categories of trucks
Les quelques 3 450 camions qui franchissent quotidiennement la riviegravere des Outaouais se reacutepartissent comme suit 1 550 camions agrave deux essieux (45) 880 camions agrave trois essieux ou plus (25) et 1 020 gros porteurs (30)
Volumes des camions
En 2000 environ 3 450 camions poids lourds franchissaient la riviegravere des Outaouais chaque jour ce qui constituait une leacutegegravere augmentation de 5 par rapport agrave la moyenneenregistreacutee il y a dix ans (3 285) Agrave des fins de comparaison au total pregraves de 200 000 veacutehicules empruntent chaque jour les cinq ponts qui enjambent la riviegravere des Outaouais (les releveacutes effectueacutes en 2000 indiquent quelque 94 000 veacutehicules en moyenne dans une direction)
La circulation des camions est plus dense au milieu de la journeacutee que pendant les heures de pointe Lrsquoheure de pointe qui se forme ainsi en milieu de journeacutee peut ecirctre attribueacutee au besoin de se conformer aux heures drsquoouverture des commerces et peut-ecirctre aussi aux efforts des camionneurs pour eacuteviter les heures drsquoarriveacutee et de deacutepart des navetteurs Ce sont les gros porteurs (environ 30 des deacuteplacements interprovinciaux de camions) qui effectuent les trajets plus longs parcourant agrave eux seuls pregraves de 50 des distances couvertes par des camions toutes cateacutegories confondues Les camions agrave trois essieux ou plus (25 des deacuteplacements interprovinciaux de camions) en parcourent 20 et les camions agrave deux essieux (45 des deacuteplacements interprovinciaux de camions) en parcourent 30
Interprovincial Roadside Truck Survey Enquecircte routiegravere interprovinciale sur le camionnage Executive Summary Sommaire iv
Macdonald Cartier Bridge2580 Trucks
Tractor Trailers17
( 150 )
Chaudiegravere Bridge870 Trucks
2 Axles60
( 520 )
Tractor Trailers34
( 870 )
2 Axles40
( 1030 )
3+ Axles23
( 200 )
3+ Axles26
( 680 )
DAILY TRUCK VOLUMESbBY CLASSIFICATIONb
Pont Macdonald-Cartier Bridge
2580 Trucks Camions Pont Chaudiegravere Bridge870 Trucks Camions
DAILY TRUCK VOLUMES BY CLASSIFICATIONbACHALANDAGE QUOTIDIEN PAR CATEacuteGORIE DE CAMIONSb
The Macdonald-Cartier bridge carried a total of 2580 trucks per day with by far the largest number of the tractor-trailers (870) When compared with the other two classes of trucks the tractor trailers represented about 34 of the total trucks on that bridge On the Chaudiegravere bridge which carried approximately 870 trucks per day in total the 2 axle truck is the largest vehicle class of truck (520) and dominates the composition (60) of the truck stream
shy
3+ AxlesCamions agrave 3 essieux et plus
26 ( 680 )
2 Axles Camions agrave 2 essieux
40 ( 1030 )
Tractor TrailersCamions gros porteurs
34 ( 870 )
Tractor Trailers Camions gros porteurs
17 ( 150 )
2 Axles Camions agrave 2 essieux
60 ( 520 )
3+ Axles Camions agrave 3 essieux et plus
23 ( 200 )
DAILY TRUCK VOLUMES BY CLASSIFICATIONb ACHALANDAGE QUOTIDIEN PAR CATEacuteGORIE DE CAMIONSb
Pont Macdonald-Cartier Bridge 2580 Trucks Camions
Pont Chaudiegravere Bridge 870 Trucks Camions
La plupart des camions franchissent les ponts de la riviegravere des Outaouais entre 06h00 et 21h00 Environ 95 des camions agrave trois essieux ou plus 93 de ceux agrave deux essieux et 80 des gros porteur les franchissent avant 21h00
Ces statistiques portent agrave croire que les deacuteplacements des gros porteurs srsquoeacutechelonnent davantage sur une peacuteriode de vingt-quatre heures que les deux autres cateacutegories de camions
Chaque jour 2 580 camions passent sur le pont Macdonald-Cartier dont 870 gros porteurs ce qui repreacutesente de loin le plus grand nombre de camions Comparativement aux deux autres cateacutegories de camions les gros porteurs constituent environ 34 de la circulation de camions sur ce pont Sur le pont Chaudiegravere ougrave circulent environ 870 camions par jour ce sont les camions agrave deux essieux (520) qui sont les plus nombreux et qui repreacutesentent la
Interprovincial Roadside Truck Survey Enquecircte routiegravere interprovinciale sur le camionnage Executive Summary Sommaire v
Interprovincial Roadside Truck Survey Enquecircte routiegravere interprovinciale sur le camionnage Executive Summary Sommaire vi
-
Travel Patterns
Local trips between the two cities on each side of the Ottawa River are understandably the largest component of travel about two-thirds (2300 trips) of all truck trips
A review of the remaining trips revealed that 975 (28) of the trucks made intershyregional trips (either an origin or a destination outside the National Capital area) while 175 (5) of the trucks made a through trip (neither an origin nor a destination within the National Capital area)
The key characteristics of the trip patterns are
x the dominance of the Hull district part of the new City of Gatineau as an attractorgenerator of truck trips (1360) more than fifty percent of these truck classes are the smaller 2 axle category
x the distribution of generated and attracted trips tofrom the nine remaining districts varies from 400 to 930 truck trips
x the variability of the truck classifications from ldquodistrict to districtrdquo is evident although the two eastern districts one on each side of the Ottawa River which also include origins and destinations outside the National Capital area (eg Montreal) have a large proportion of tractor trailer trucks
The daily distribution of trips (ldquoall trucksrdquo) clearly indicates the strength of the Hull district as compared with each of the other three districts (Aylmer Gatineau West and Gatineau East) on the Queacutebec side of the Ottawa River
plus grande partie (60) de la circulation de camions sur ce pont
Itineacuteraires
Naturellement les deux tiers (2 300) des deacuteplacements des camions srsquoeffectuent entre les deux villes qui se trouvent de chaque cocircteacute de la riviegravere
Lrsquoexamen des autres itineacuteraires permet de constater que 975 camions (28) effectuent des deacuteplacements interreacutegionaux (crsquoest-agrave-dire dont le point de deacutepart ou la destination se trouve agrave lrsquoexteacuterieur de la reacutegion de la capitale nationale-RCN) et que 175 camions (5) ne font que traverser la reacutegion (crsquoest-agrave-dire que ni leur point de deacutepart ni leur destination ne se trouvent dans la RCN) Principales caracteacuteristiques des itineacuteraires
x Crsquoest dans le district de Hull dans la nouvelle ville de Gatineau qursquoon compte le plus grand nombre de points de deacutepart et drsquoarriveacutee (1 360) il srsquoagit dans plus de cinquante pour cent des cas de petits camions agrave deux essieux
x Dans les neuf autres districts le nombre de points de deacutepart et drsquoarriveacutee varie entre 400 et 930
x La dispariteacute des cateacutegories de camions drsquoun district agrave lrsquoautre est eacutevidente toutefois les deux districts ldquoEstrdquo situeacutes de part et drsquoautre de la riviegravere des Outaouais qui comprennent eacutegalement des points de deacutepart et drsquoarriveacutee agrave lrsquoexteacuterieur de la reacutegion de la capitale nationale (ex Montreacuteal) accueillent un pourcentage eacuteleveacute de gros porteurs
1 Ottawa CentralCentre
5 IGB East ICV Est
2 IGB West ICV Ouest
3 Ottawa WestOuest
4 Ottawa SouthSud
6 Ottawa EastEst
7 Hull
8 Aylmer
9 Gatineau WestOuest
10 Gatineau EastEst
Queacutebec
Ontario
xxx
2 Axles Camions agrave deux essieux
3+ Axles Camions agrave trois essieux et plus
Tractor Trailers Camions gros porteurs
Total number of trucks (O+D) for the District Nombre total de camions (points de deacutepart et destinations) pour le district
IGB ndash Inside Green Belt ICV ndash Inteacuterieur de la Ceinture de Verdure
DAILY DISTRIBUTION OF ORIGINS-DESTINATIONS BY CLASSIFICATIONb REacutePARTITION QUOTIDIENNE DES POINTS DE DEacutePART ET DESb
DESTINATIONS PAR CATEacuteGORIE DE CAMIONSb
Commodities
The five most frequently reported commodities carried by trucks crossing the Ottawa River are
bull construction materials (475 trips) bull food and beverage (415 trips) bull general merchandise (360 trips) bull paper and paper products (310 trips) bull wood and wood products (195 trips)
La reacutepartition des itineacuteraires quotidien toutes cateacutegories de camions confondues montre clairement lrsquoimportance du district de Hull par rapport aux trois autres districts (Aylmer Gatineau-Ouest et Gatineau-Est) du cocircteacute queacutebeacutecois de la riviegravere des Outaouais
Cargaison
Voici les cinq types de marchandises transporteacutees le plus souvent par les camions qui franchissent la riviegravere des Outaouais
bull mateacuteriaux de construction (475 deacuteplacements)
bull aliments et boissons (415 deacuteplacements)
Interprovincial Roadside Truck Survey Enquecircte routiegravere interprovinciale sur le camionnage
Executive Summary Sommaire vii
Interprovincial Roadside Truck Survey Enquecircte routiegravere interprovinciale sur le camionnage Executive Summary Sommaire viii
While ldquoconstruction materialsrdquo tops the list of goods carried paper and wood products if taken together as a single group would become the prominent group of commodities
The movement of various commodities across the Ottawa River was identified from the survey results and some key characteristics are
x for construction materials while widely distributed an Aylmer to Ottawa Central trip pattern represented approximately 50 percent of the originsdestinations for that pairing
x for general merchandise a widely dispersed trip pattern was expected and no single prominent origins destinations pairing emerged
x for paperpaper products the dominant interchange of trips exists between Hull and Ottawa (both East and West) and between Gatineau East and Ottawa South
x for woodwood products Aylmer and Gatineau West trips to Ottawa South stand out to the exclusion of other pairings as the primary movements for these commodities
Most frequently reported commodities in the ldquoPetroleumChemicalsrdquo category were gasoline and furnace fuel Other notable petroleum chemicals commodities included propane oxygen and other gases
Detailed information regarding the flow of commodities on each of the two bridges was collected as part of truck roadside survey On the Macdonald-Cartier bridge for example the various commodities for each of 3 truck types indicate that the 1030 2 axle trucks on
x fournitures geacuteneacuterales (360 deacuteplacements)
x papier et produits de papier (310 deacuteplacements)
x bois et produits du bois (195 deacuteplacements)
Bien que les mateacuteriaux de construction dominent cette liste le papier et le bois formeraient la cateacutegorie la plus importante srsquoils eacutetaient consideacutereacutes comme un seul groupe
Lrsquoeacutetude a permis de deacuteterminer lrsquoitineacuteraire de diverses marchandises qui franchissent la riviegravere des Outaouais Voici quelques-unes des caracteacuteristiques principales
x mateacuteriaux de construction bien que les itineacuteraires soient reacutepartis sur lrsquoensemble de la RCN les deacuteplacements entre Aylmer et Ottawa-Centre repreacutesentent agrave eux seuls environ la moitieacute des trajets
x fournitures geacuteneacuterales les points de deacutepartdestinations sont tregraves disperseacutees et aucun point de deacutepart ou drsquoarriveacutee ne se distingue de faccedilon particuliegravere
x papier et produits de papier la plupart des deacuteplacements srsquoeffectuent entre Hull et Ottawa (tant Est que Ouest) et entre Gatineau-Est et Ottawa-Sud
x bois et produits du bois les deacuteplacements srsquoeffectuent pour la plupart drsquoAylmer et de Gatineau-Ouest agrave destination drsquoOttawa-Sud agrave lrsquoexclusion des autres districts
Les cargaisons le plus souvent releveacutees dans la cateacutegorie ldquoproduits chimiquesdeacuteriveacutes du peacutetrolerdquo eacutetaient lrsquoessence ou combustible de chauffage Les autres produits chimiques ou
EXHIBIT 23b COMMODITY FLOWb
- MACDONALD-CARTIER BRIDGEb
Construction Mater als16
Foodamp Beverage
19
General Merchandise18
Empty28
Paper Products10
Business Supplies6
AutoVehic esamp Parts
1
Petro eumChemicals2
2 Axles40
( 1025 )
3 Axles26
( 680 )
Tractor Trailers34
( 870 )
Genera Merchandise
Food amp Beverage6
Empty64
Construction Mater als16
1
PetroleumChemicals2
Wood Products11
Food amp Beverage
12
Construction Mater als12
Paper Products19
Empty30
8
GeneraMerchandise
10AutoVehicles
amp Parts5
Wood ProductsPetroleumChemicals
4
2580 Trucks
( 1030 )
COMMODITY FLOW-MACDONALD-CARTIER BRIDGE TRANSPORT DE MARCHANDISES SUR LE PONT
MACDONALD-CARTIER
i
l
l
l
i
i
l
bbb
2 580 Trucks Camions
DAILY COMMODITY FLOW-MACDONALD-CARTIER BRIDGE b TRANSPORT QUOTIDIEN DE MARCHANDISES SUR LE PONTb
MACDONALD-CARTIERb
Tractor Trailers Gros porteurs
34 ( 870 )
3 AxlesCamions agrave 3 essieux et plus
26 ( 680 )
2 AxlesCamions agrave 2 essieux
40 ( 1030 )
Emptyvide 30
Emptyvide 64
Emptyvide 28
Construction materials Mateacuteriaux de construction
12
Construction materials Mateacuteriaux de construction
16
Construction materials Mateacuteriaux de construction
16
Food amp Beverage Aliments et boissons
8
Food amp Beverage Aliments et boissons
6
Food amp Beverage Aliments et boissons
19
General Merchandise Marchandises geacuteneacuterales
10
General Merchandise Marchandises geacuteneacuterales
1
General Merchandise Marchandises geacuteneacuterales
18
Paper products Produits de papier
19
Paper products Produits de papier
10
W ood Products Produits du bois
12
Wood Products Produits du bois
11
Petroleum amp Chemicals Produits chimiques et
deacuteriveacutes du peacutetrole 4
Petroleum amp Chemicals Produits chimiques et
deacuteriveacutes du peacutetrole 2
Petroleum amp ChemicalsProduits chimiques et deacuteriveacutes du peacutetrole
2
Business Supplies Fournitures de bureau
6
Auto Vehicles amp Parts Veacutehicules automobiles et piegraveces
1
Auto Vehicles amp Parts Veacutehicules automobiles
et piegraveces 5
que 1 030 camions agrave 2 essieux transportent sur ce pont essentiellement lrsquoaliment et la boisson (19) fournitures geacuteneacuterales (18) et les mateacuteriaux de construction (16) Les camions agrave 3 essieux et plus (680) transportent essentiellement les mateacuteriaux de construction (16) et des produits de bois (11) Les camions gros porteurs (870) transportent principalement des produits de papier (19) produits de bois (12) et des mateacuteriaux de construction (12)
this bridge carry mainly food and beverage (19) general merchandise (18) and construction materials (16) The 680 trucks in the 3+ axle classification carry mainly construction materials (16) and wood products (11) while tractor trailers (870) carry predominantly paper products (19) wood products (12) and construction materials (12)
deacuteriveacutes du peacutetrole les plus souvent preacutesents dans les cargaisons eacutetaient le gaz propane lrsquooxygegravene et drsquoautres gaz
Les informations detailleacutees concernant le flot des cargaisons sur chacun des deux ponts eacutetaient recueillis durant lrsquoenquecircte routiegravere Sur le pont Macdonald-Cartier par exemple les diffeacuterentes cargaisons pour chacune des trois sortes de camions indiquent
Interprovincial Roadside Truck Survey Enquecircte routiegravere interprovinciale sur le camionnage Executive Summary Sommaire ix
TABLE OF CONTENTS
EXECUTIVE SUMMARY i SOMMAIRE i 10 BACKGROUND 1 20 STUDY METHODOLOGY 2 30 1989 TRUCK SURVEY 2 40 19992000 SURVEY PROGRAM AND METHODOLOGY 3
41 Historical Vehicle Data 3 42 Driver Interviews 4 43 Vehicular Traffic Classification Count Observations 5 44 Automatic Traffic Recorder (ATR) Counts 7
50 KEY RELATIONSHIPS 8 51 Historical traffic volumes 8 52 Truck Classification and Characteristics 12 53 Automatic Traffic Recorder (ATR) Counts 15
60 ZONEDISTRICT SYSTEM 16 70 DATA EXPANSION 17
71 Expansion Methodology 17 72 Expansion Factors 18
80 TRIP CHARACTERISTICS AND PATTERNS 21 81 Vehicle Types 21 82 Trip Tables 23 83 Travel Patterns 23 84 Origin-Destination Patterns 26 85 Vehicle Loading and Commodities 34
90 SUMMARY 38 100 LIST OF APPENDICES 39
x
LIST OF EXHIBITS
Exhibit 1 Illustration of Survey Station 4
Exhibit 2 Study Truck Classification 7
Exhibit 3 Historical All Vehicle Volumes 8
Exhibit 4 Historical Truck Volumes 10
Exhibit 5 Daily Truck Volumes by Classification 13
Exhibit 6 Hourly Truck Volumes Macdonald-Cartier Bridge 14
Exhibit 7 Hourly Truck Volumes Chaudiegravere Bridge 14
Exhibit 8 Hourly Vehicle Traffic Volumes 15
Exhibit 9 District System 16
Exhibit 10 Sample Size by Time of Day 20
Exhibit 11 Daily Truck Volumes by Classification 22
Exhibit 12 Cumulative Truck Traffic 22
Exhibit 13 Daily truck Composition Macdonald-Cartier Bridge 25
Exhibit 14 Daily Truck Composition Chaudiegravere Bridge 25
Exhibit 15 Trip Itineraries 26
Exhibit 16 Distribution of OriginsDestinations by Classification 27
Exhibit 17 Concentration of Truck Trip OriginsDestinations 28
Exhibit 18 Origin-Destination Desire Lines All Truck Trips (Autumn 2000) 30
Exhibit 19 Origin-Destination Desire Lines 2 Axle Truck Trips (Autumn 2000) 31
Exhibit 20 Origin-Destination Desire Lines 3+ Axle Truck Trips (Autumn 2000) 32
Exhibit 21 Origin-Destination Desire Lines Tractor Trailer Trips (Autumn 2000) 33
Exhibit 22 Goods Carried per Day 35
Exhibit 23 Daily Commodity Flow Macdonald-Cartier Bridge 37
Exhibit 24 Daily Commodity Flow Chaudiegravere Bridge 37
xi
LIST OF TABLES
Table 1 Current and Historical Two Way Truck Traffic Volumes 10
Table 2 Ratio of Peak Hour to 24 Hour Traffic Volumes 1999 to 2000 11
Table 3 Summary of 3+ Axle Trucks by Body Type and Cargo 19
Table 4 Expansion Factors by Bridge by Direction and by Time of Day 20
Table 5 Truck Travel Composition and Trip Distance 23
xii
10 BACKGROUND In the autumns of 1999 (October) and 2000 (September) several types of surveys co-ordinated by TRANS were undertaken to establish a comprehensive database on interprovincial truck travel characteristics in the National Capital Region Surveys were carried out on the Chaudiegravere and Macdonald-Cartier bridges as the movement of ldquoheavy trucksrdquo is prohibited on the remaining three bridges - the Alexandra Portage and Champlain bridges
The roadside surveys which were undertaken were part of a broader national roadside survey program led by Transport Canada with participation of the provinces
TRANS undertook an extensive amount of work in organizing and establishing the database for this project and prepared numerous data tabulations establishing relationships among the various components of the database Coding of the origins and destinations to the traffic zone system currently in use and applying preliminary expansion factors to some of the data were also undertaken by TRANS
The purpose of this study was the development of a good understanding of the interprovincial movement patterns origins destinations and characteristics of heavy trucks in the National Capital Region and the satisfaction of the TRANS mandate to furnish high quality and meaningful transportation data required for transportation planning and decision making in the National Capital Region In this context the study was undertaken to establish a comprehensive database of information regarding the characteristics of trucks crossing the Ottawa River and thus provide a basis for future studies and analysis In meeting this objective this study does not directly address specific transportation issues but rather provides TRANS Agencies with a database for this purpose The database which is available for future studies provides significant information regarding the movement of heavy trucks across the Ottawa River historical heavy truck trends their composition in the traffic stream and their associated travel patterns
In the establishment of the database of truck characteristics and patterns it was relevant to investigate various relationships and rationalize them as appropriate for practical application in transportation planning activities It was also necessary to identify and rationalize other relationships which are valuable in transportation planning activities These relationships are important in the background analytical work necessary to assess the impacts of a future Ottawa River crossing on the movement of goods between the two regions on each side of the Ottawa River
Interprovincial Roadside Truck Survey REPORT 1
Once all relationships were identified the appropriate data tabulations were prepared and evaluated When the findings were complete and valid this report which explains the process and the reliability of the findings was prepared The details of the work are described in this report
The consultant acknowledges the invaluable assistance of the TRANS Agencies staff in the establishment of the survey database as well as the ongoing assistance in preparing tabulations and the provision of advice in the preparation of this report
20 STUDY METHODOLOGY The methodologykey tasks that were involved in carrying out the project involved a collaborative effort on the part of the TRANS Agenciesrsquo staff and the consultant The results are described in this report The methodology included the preparation of several tabulations and graphical representations of the relationships among various elements of the data which were collected This culminated in the information which was deemed to be the most useful and the most effective means of presenting the findings from the analysis
30 1989 TRUCK SURVEY A National Capital Region Goods Movement Study undertaken by Delcan in 1989 produced a report for TRANS in May 1991
In the 1989 Region-wide survey truck origin-destination characteristics were collected for the movement of goods on a Region-wide basis including the movement of goods across the Ottawa River
The 1989 survey differed from the 2000 survey in two key aspects
x As part of the 1989 survey licence plate information (characters) was recorded for 2964 trucks From these trucks a sample of 700 trucks for which registry information was available was drawn to attempt to obtain trip itineraries for this sample Complete information was obtained for 96 trucks From the study information it has been determined that a total of 5955 ldquolocalrdquo (internalinternal) (plus an indeterminate number of external) truck trips was estimated as having crossed the Ottawa River Thus the sample of 96 trucks represented a sampling rate of approximately 16 of the universe of approximately (more than) 6000 trucks As a point of comparison the truck survey in the autumn of 2000 obtained data on 495 trucks in a universe of 3450 trucks (a sample size of 143) observed as having crossed the Ottawa River
Interprovincial Roadside Truck Survey REPORT 2
Interprovincial Roadside Truck Survey REPORT 3
x For the purposes of the 1989 survey vehicles were classified as light trucks (2 axles4 wheels) medium trucks (2 axles6 wheels) and heavy trucks (single unit3+ axles) Any registered commercial vehicle qualified as a candidate to be included in the survey In comparing the previous survey with the current survey the inclusion of two axlefour wheel trucks in the previous survey skewed the results considerably Of importance is the lack of compatibility between the classification system used in the 1989 study and the classification system used in the 19992000 surveys The 2 axle4 wheel truck classification which was included in the 1989 survey is currently a much larger component of the vehicle fleet as a consequence of the increased popularity of SUVs (sport utility vehicles) and vans as a means of personal transport The 19992000 survey applied a more realistic classification system which excluded the 2 axle4 wheel truck from the scope of the survey
The current study is significantly more focussed having been designed to provide more detailed origin-destination information on the flow of trucks across the Ottawa River
In summary aside from other problems related to the sample size comparisons between the 1989 and 19992000 surveys would be difficult particularly since the in-scope vehicles established for each survey are significantly different
40 19992000 SURVEY PROGRAM and METHODOLOGY In this section of the report the survey program and the methodologies applied in the application of the data are described
41 Historical Vehicle Data
The Regional Municipality of Ottawa-Carleton (predecessor of the City of Ottawa) had undertaken annually traffic counts along major travel corridors to establish trends related to vehicle classificationsoccupancy With the exception of the years between 1995 and 1998 inclusive in which years data were collected for an eight hour period these data have been collected for one 12 hour period (0700 to 1900) each year These traffic classification and vehicle occupancy data were available to supplement the data collected as part of the 19992000 survey to create a comprehensive database A significant part of the on-going traffic count program includes the collection of information on interprovincial travel on an annual basis
From the vehicle classification and occupancy surveys for the Chaudiegravere and Macdonald-Cartier bridges the historical data are to varying degrees relevant and have been applied when appropriate
xhibit 1 Illustration of Survey Station
EXHIBIT 1b ILLUSTRATION OFb SURVEY STATIONb
King Edward Av
E
42 Driver Interviews
The purpose of the driver interview surveys was to gather specific data on the characteristics of the trucks the travel patterns including detailed information on the trip origins and destinations and the commoditygoods carried The roadside driver interview surveys were carried out by trained surveyors (under contract to the Ministry of Transportation of Ontario) familiar with the form of data collection programs of the type applied in this study Survey crews were stationed on the south side of the Ottawa River - on King Edward Avenue in the vicinity of Boteler Street and on Booth Street south of the Ottawa River Parkway Bridge over Booth Street - and interviewed drivers of candidate trucks
Illustrations of a typical survey station set-up and lane closures are provided in EXHIBIT 1 - ILLUSTRATION OF SURVEY STATION
Driver interviews were conducted on separate days for northbound and southbound traffic movements The surveys were undertaken as follows
DIRECTIONYEAR 1999 2000
Midnight to midnight 0700 to 0700 (24 hours) (24 hours)
NORTHBOUND October 25th amp 28th September 6th amp 7th
SOUTHBOUND October 26th amp 27th September 7th amp 8th
Interprovincial Roadside Truck Survey REPORT 4
1 Appendix A ndash Survey Database Fields Interprovincial Roadside Truck Survey REPORT 5
From the interview surveys each record in the database contains responses collected from the questionnaire used in the 2000 survey (a modified version of the questionnaire that was used in the 1999 survey) In the 1999 survey the origins and destinations of the truck trip were recorded using a macro description whereas in the 2000 survey trip origins and destinations were recorded in very precise and specific terms in order to apply the existing traffic zone system to yield valid origin-destination information Consequently the roadside surveys carried out in 2000 have been used exclusively to establish trip patterns and trip tables for future analysis
A comprehensive description of the database fields is provided in Appendix A1 The following sections and database fields from the interview surveys are considered to be relevant in varying degrees to the purpose of the study as identified in the Terms of Reference as
the development of a good understanding of the interprovincial movement patterns origins destinations and characteristics of medium and heavy trucks in the National Capital Region and the satisfaction of the TRANS mandate to furnish high quality and meaningful transportation data required for transportation planning and decision making in the National Capital Region
A - the direction of travel of the truck B - the configuration of the truck (number of tiresaxles) C - additional descriptors identifying the configurationbody style of the truck (tractor
trailer straight truck van dangerous goods placards etc) F - commodity information such as cargo on board capacity (availableused)
category and amount origindestination dangerous goods etc H - information on characteristics including number of stops trip origindestination
details trip startend datetime etc J - information on axle groupings of trucks etc
Electronic boards were used to record the responses by the drivers That is there are no paper records of the responses
43 Vehicular Traffic Classification Count Observations
Observers were stationed at the locations described earlier and recorded all (100) of the trucks passing the station
The purpose of the separate classification counts undertaken as part of the project was to provide the identification of vehicles by classification (type) in order to derive expansion factors for application in the study and ensure that the results of the surveys were consistent with the results of the historical on-going program of collecting vehicle classification data
As part of the data collection program truck classification counts were undertaken
BRIDGEYEAR 1999 2000
0500 to 2200 0700 to 0700 (17 hours) (24 hours)
Macdonald-Cartier October 25th to 28th September 6th to 8th
Chaudiegravere October 25th to 28th September 6th to 8th
CumberlandMasson Ferry September 5th to 8th
A graphical representation of the various types of vehicles that are classified in this study as Trucks (Heavy Trucks) is provided in Appendix B2 This truck classification system was used by the (former) Regional Municipality of Ottawa-Carleton and is consistent with that used in the Outaouais Region
The classification system applied by the observers was detailed It was later refined to present information by three key categories of trucks (heavy trucks) as follows
x 2 axle trucks - which represent trucks with six wheels such as tow trucks large (34 ton 1 ton) pick-up trucks small vans small dump trucks etc which create very few traffic operational problems but are defined as heavy trucks
x 3+ (3 or more) axle trucks - which represent medium size single unit trucks such as large dump trucks straight trucks concrete mix trucks etc which contribute to environmental concerns (noise vibration) but do not create undue traffic operational concerns although these are also defined as heavy trucks
x tractor trailer trucks - which represent the largest trucks such as tractor-trailer trucks flat-bed trucks etc which contribute to both environmental concerns and traffic operational concerns due to the time headway utilization (in starting from a stopped position) and the large turning radius (particularly in the case of right turns)
Trucks with four wheels are not included in the study and are considered to be light trucks These include small (12 ton) pick-up trucks such as the Toyota TacomaChevrolet Sonoma or the Jeep or any SUV etc
2 Appendix B ndash Heavy Truck Classification System Interprovincial Roadside Truck Survey REPORT 6
Exhibit 2 Study Truck Classification
A further illustration of the classification of trucks is provided in EXHIBIT 2 - STUDY TRUCK CLASSIFICATION In this study trucks with the truck id as indicated in Appendix B - 1 and 3 are included in the survey (Note - these trucks have six wheels and are considered to be heavy trucks based on the truck classification system discussed earlier)
Tractor Trailer
3+ Axle Truck
2 Axle Truck
EXHIBIT 2b STUDY TRUCKb
CLASSIFICATIONb
44 Automatic Traffic Recorder (ATR) Counts
Automatic traffic recorders are devices which record impulses from tires or vehicle masses passing the site of the detecting devices (road tubes cable loops in the pavement etc) The impulses are translated into vehicle counts and in some cases into a count of vehicles by classification (eg various sizes of trucks) The sensitivity of automatic traffic recorders is affected by the number of lanes of traffic included in a survey When road tubes are used to record vehicles in four or more lanes results can be quite variable
The intended purpose of undertaking traffic counts using automatic traffic recorders during the period 1200 October 17 1999 to 0700 October 31 1999 (fourteen days) was to ensure representativeness of the classification counts which were undertaken during a limited period of time (four days) In 2000 traffic volume information was not collected using automatic traffic recorders as part of the program
Interprovincial Roadside Truck Survey REPORT 7
Exhibit 3 Historical All Vehicle Volumes
1999 2000
50 KEY RELATIONSHIPS
In this section of the report the key relationships identified in respect to the historical data the truck count characteristics and the travel patterns are discussed
51 Historical traffic volumes
From the historical (1991 to 2000) vehicle classification (light trucks heavy trucks passenger cars buses taxis bicycles and others) and occupancy surveys data are available by direction of traffic flow across the Ottawa River bridges by time period (8 or 12 hours morning and afternoon peak periodshours) This enabled the preparation of profiles for various periods of the day
All vehicle historical volumes are presented for each direction of travel (northbound and southbound) for all five bridges across the Ottawa River in EXHIBIT 3 shyHISTORICAL ALL VEHICLE VOLUMES for 12-hour periods (0700-1900) and for 24-hour periods (note that the 12 hour data for 1995 to 1998 have been factored from 8 hour data and the 24 hour data are factored from 8 or 12 hour data)
50000
60000
70000
80000
90000
100000
110000
120000
1991 1992 1993 1994 1995 1996 1997 1998 1999 2000
All Ottawa River Bridges (12 and 24 hour volumes)
12h
24h
Average per direction 105600
Average per direction 93800
Number of vehicles factored to 12 hours from 8 hour counts
Southbound
Northbound
Year
Num
ber
of v
ehic
les
per
dire
ctio
n
EXHIBIT 3b HISTORICALb
ALL VEHICLE VOLUMESb
(Spring)
Factors that were established in the early 1980rsquos from the on-going traffic survey counts conducted by the former Regional Municipality of Ottawa Carleton suggested
Interprovincial Roadside Truck Survey
REPORT 8
that 12 hour traffic volumes could be factored by 139 to represent a daily 24 hour volume This factor has been applied in several studies (including those undertaken by TRANS) to all vehicles including trucks In comparison the data collected in the 2000 surveys determined that an appropriate factor for trucks crossing the Ottawa River would be 127 and this value has been applied in factoring 12 hour historical truck traffic counts to derive 24 hour values
One element to consider in evaluating the data which are presented in this section is the time of year at which the data were collected - in the annual program data are collected in MayJune whereas the data collected for this survey were collected in late October 1999 and in early September 2000
As illustrated in Exhibit 3 daily (24 hour) ldquoall vehiclerdquo traffic volumes in 2000 were at a level similar to that which was experienced 10 years earlier (1991) After a steady growth in the first half of the decade a modest decline was experienced in the latter half
At the peak (1993) there were in the 24 hour period approximately 105600 vehicles (average for each direction) crossing the river while in 2000 there were approximately 93800 vehicles (average for each direction - a decline of approximately 12 from the peak (average for each direction) crossing the river
Relevant to this project are the data for the Chaudiegravere and Macdonald-Cartier bridges which are bridges on which ldquoheavy trucksrdquo are allowed ldquoHeavy trucksrdquo are prohibited on the Alexandra Portage and Champlain bridges
EXHIBIT 4 - HISTORICAL TRUCK VOLUMES presents the historical truck data for the Macdonald-Cartier and the Chaudiegravere bridges collectively
As illustrated in Exhibit 4 daily (24 hour) truck traffic volumes were in both the spring and autumn of 2000 at a level slightly lower than that which was experienced 10 years earlier (1991) The lowest level of approximately 1400 trucks (average number for each direction) occurred in the mid-1990s
After a steady decline in the first half of the decade a modest growth was experienced in the latter half At the peak (1992) there were in the 24 hour period approximately 1950 trucks (average for each direction) crossing the river while in the surveys in the autumn of 2000 there were approximately 1725 trucks (average for each direction) - a decline of approximately 10 from the peak truck traffic crossing the river
The profiles for the truck volumes may appear to be more pronounced because of the relatively low numbers when compared to the all vehicle values
Interprovincial Roadside Truck Survey REPORT 9
Exhibit 4 Historical Truck Volumes
Table 1 Current and Historical Two Way Truck Traffic Volumes
TABLE 1 CURRENT AND HISTORICAL TWO WAY
TRUCK TRAFFIC VOLUMES
NUMBER OF TRUCKS CROSSING THE OTTAWA RIVER
INFORMATION SOURCE MORNING AFTERNOON 24 HOURS COMMUTER COMMUTER
PEAK HOUR PEAK HOUR
2000 SURVEY AUTUMN 3450 205 170
2000 ANNUAL SURVEY SPRING 3335 215 170
5 YEAR AVERAGE (1996-2000) 3120 235 180
10 YEAR AVERAGE (1991-2000) 3285 250 210
12h
24h
Average per direction 1950
Average per direction 1725
Southbound Northbound
Macdonald-Cartier and Chaudiegravere Bridges (12 and 24 hour volumes)
Number of trucks factored to 12 hours from 8 hour counts (Spring) Roadside Truck Survey Data
Num
ber o
f tru
cks
per d
irect
ion
Year
EXHIBIT 4b HISTORICALb
TRUCK VOLUMESb
(Autumn)
0
200
400
600
800
1000
1200
1400
1600
1800
2000
2200
2400
1991 1992 1993 1994 1995 1996 1997 1998 1999 1999 2000 2000
A summary of relevant data for two way truck traffic on the two bridges combined for the 24 hour period and the morning and afternoon peak hours is provided in TABLE 1 - CURRENT AND HISTORICAL TWO WAY TRUCK TRAFFIC VOLUMES
- Ottawa river crossing includes the Macdonald-Cartier and Chaudiegravere Bridges as heavy trucks are prohibited on the Alexandra Portage and Champlain bridges
Interprovincial Roadside Truck Survey REPORT 10
Table 2 Ratio of Peak Hour to 24 Hour Traffic Volumes 1999 to 2000
The 24-hour truck volume levels observed in the autumn of 2000 compare reasonably well with previous counts undertaken over the past ten year period
Further the historical data for the two bridges (Macdonald-Cartier and Chaudiegravere) crossing the Ottawa River have been tabulated for each bridge separately for the two bridges and for all bridges and are provided in Appendix C3 From the historical traffic volume information time period relationships have been determined for the peak hourpeak period peak hour12 hour and peak hour24 hour relationships These are provided in detail in Appendix D4
The most relevant information has been extracted and displayed in TABLE 2 ndash RATIO OF PEAK HOUR TO 24 HOUR TRAFFIC VOLUMES 1991 to 2000 The values for trucks are followed by the values for all vehicles (in parenthesis)
TABLE 2 RATIO OF PEAK HOUR TO 24 HOUR TRAFFIC VOLUMES
1991 to 2000
COMMUTER PEAK24 HOUR RATIO FOR TRUCKS (ALL VEHICLES) BRIDGE
FOR BOTH MORNING AFTERNOON DIRECTIONS
Range 7-11 ( 8-10) 5-8 ( 9-10) Macdonald-Cartier
Weighted Average 8 ( 9) 7 ( 9)
Range 6-9 ( 8-11) 3-8 ( 7-10) Chaudiegravere
Weighted Average 7 ( 9) 6 ( 9)
xx - trucks (yy) - all vehicles
A review of the information in Table 2 and in Appendix D indicates that
- For truck classifications
x in all cases the most stable relationships are the commuter peak hour24shyhour relationships The weighted averages for commuter peak hour24shyhour range from 6 to 8
3 Appendix C ndash Summary of Historical Ottawa River Crossing Truck Traffic Volumes4 Appendix D ndash Time Period Relationships Interprovincial Roadside Truck Survey REPORT 11
Interprovincial Roadside Truck Survey REPORT 12
x the range in the relationships is similar to the ldquoall vehiclerdquo relationships but is in general less variable than the all vehicle relationships when considered by direction
x the relationship of the peak hour24 hour when the directions are considered individually or in combination is quite inconsistent with the conventional rule of thumb relationship [the ldquorule of thumbrdquo suggests that the peak hour can be represented by 10 of the AADT (ANNUAL AVERAGE DAILY TRAFFIC)] and
- For all vehicle classifications
x in all cases the variations in the relationships are reasonably confined
x the average of the relationships over 10 years has been identical and therefore has been consistent particularly when both directions are considered
x the relationship of the peak hour24 hour when both directions are considered is consistent (although not precisely the same as) with the conventional rule of thumb relationship which suggests that the peak hour can be represented by 10 of the AADT
52 Truck Classification and Characteristics
The candidate trucks were grouped into sub-classifications (2 axle 3+ axle [3 or more axle] trucks and tractor trailers as described in Section 43
Of the total of approximately 3450 trucks observed over 24 hour period as crossing the Ottawa River there were 1550 2 axle (45) 880 3+ axle (25) and 1020 tractor trailer (30) trucks
Information on truck volumes as obtained from the classification counts in 1999 and 2000 is presented by direction for each of the Macdonald-Cartier and Chaudiegravere bridges in EXHIBIT 5 ndash DAILY TRUCK VOLUMES BY CLASSIFICATION
For the Macdonald-Cartier Bridge the volume of trucks was significantly higher (approximately 24) in 2000 than was the case in 1999 however the 2000 truck volumes are considered to be more representative for planning purposes (see comparative analysis in Table 1) than the 1999 truck volumes Truck volumes averaged over the two days were consistent in terms of the direction of travel and composition (2 axle 3+ axle and tractor trailers) For the Chaudiegravere Bridge truck volumes in 1999 and 2000 were reasonably consistent in magnitude by direction and by composition As would be expected the foregoing characteristics are also apparent when the volumes from both bridges are combined
Exhibit 5 Daily Truck Volumes by Classification
410
220
375
520
340
430
450
225
400
510
340
440
225
110
60
245
90
75
265
130
65
275
110
75
0
200
400
600
800
1000
1200
1400
1999 2000 1999 2000 1999 2000 1999 2000
Southbound Northbound
Southbound Northbound
2 Axles
3+ Axles
Trailers 1005
1290
1075
1290
395 410 460 460
Dai
ly n
umbe
r of
truc
ks p
er d
irect
ion
Macdonald-Cartier Chaudiegravere Year
EXHIBIT 5b DAILY TRUCK VOLUMESb
BY CLASSIFICATIONb
(Autumn)
The data from the MassonCumberland ferry when included with the totals from the two bridges had a minimal impact in terms of the total number of trucks (65 in each of the northbound and southbound directions) as well as in the 2 axle truck classification (10 in each direction) There is a disproportionate impact in the 3+ axle (30 in each direction) and tractor trailer (25 in each direction) classifications which would suggest that the smaller vehicles have less propensity to use the ferry probably due to its rural location
The recorded number of trucks by hour of the day is presented graphically in EXHIBIT 6 - HOURLY TRUCK VOLUMES MACDONALD-CARTIER BRIDGE and in EXHIBIT 7 - HOURLY TRUCK VOLUMES CHAUDIEgraveRE BRIDGE
It is clear from the exhibits that truck movements are more predominant during the mid-day hours than in the commuter peak hours The mid-day peaking phenomenon is more apparent on the Chaudiegravere Bridge than on the Macdonald-Cartier Bridge It is postulated that this is attributable to the attraction of the Chaudiegravere Bridge for short trips (Central Hull to Ottawa) in particular those made by smaller trucks The need to meet the expectations of the business day no doubt contributes to this phenomenon These characteristics also reinforce the historical trend which indicates that the relationship between the peak hour and the 24-hour volumes is lower for trucks than for mixed traffic The composition of the truck traffic stream is discussed in some detail in Sections 81 and 83 Interprovincial Roadside Truck Survey
REPORT 13
Exhi
Exhibit 7 Hourly
bit 6 Hourly Truck Volumes Macdonald-Cartier Bridge
Truck Volumes Chaudiegravere Bridge
MACDONALD-CARTIER BRIDGEb
0
20
40
60
80
100
120
140
160
180
200
220 1
00
200
300
400
500
600
700
800
900
100
0
110
0
120
0
130
0
140
0
150
0
160
0
170
0
180
0
190
0
200
0
210
0
220
0
230
0
240
0
Hour ending
Num
ber o
f tru
cks
ndash bo
th d
irect
ions
2 Axles
3+ Axles
Trailers
Peak hour 1000-1100 2 Axles = 81 3+ Axles = 69
Trailers = 56
(Autumn 2000)
EXHIBIT 6b HOURLY TRUCK VOLUMESb
0
20
40
60
80
100
120
140
160
180
200
220
100
200
300
400
500
600
700
800
900
100
0
110
0
120
0
130
0
140
0
150
0
160
0
170
0
180
0
190
0
200
0
210
0
220
0
230
0
240
0
Hour ending
Num
ber o
f tru
cks
ndash bo
th d
irect
ions
2 Axles
3+ Axles
Trailers
Peak hour 900-1000 2 Axles = 49 3+ Axles = 23 Trailers = 12
(Autumn 2000)
EXHIBIT 7b HOURLY TRUCK VOLUMESb
CHAUDIEgraveRE BRIDGEb
Interprovincial Roadside Truck Survey REPO RT 14
Exhibit 8 Hourly Vehicle Traffic Volumes
In EXHIBIT 8 - HOURLY VEHICLE TRAFFIC VOLUMES for all Ottawa River Bridges illustrates the typical daily peak traffic periods in the morning and afternoon and more significantly the relatively small proportion of trucks in the total traffic stream particularly during the peak traffic periods
0
2000
4000
6000
8000
10000
12000
14000
16000
18000
20000
100
200
300
400
500
600
700
800
900
100
0
110
0
120
0
130
0
140
0
150
0
160
0
170
0
180
0
190
0
200
0
210
0
220
0
230
0
240
0
Hour ending
Num
ber o
f veh
icle
s-bo
th d
irect
ions
All Ottawa River Bridges
Trucks
Other vehicles
Traffic not recorded Traffic not recorded
EXHIBIT 8b HOURLY VEHICLEb
TRAFFIC VOLUMESb
(Spring 2000)
53 Automatic Traffic Recorder (ATR) Counts
As indicated earlier there are significant challenges in collecting classification data using automatic traffic recorders The all vehicle survey data collected in 1999 are available from the TRANS Agencies however the survey results were not considered to be sufficiently reliable to be subjected to any form of analysis
No truck counts (by ATR) were taken as part of the Interprovincial Roadside Truck Survey in 2000 Any ATR data which are available were obtained from the annual traffic count program undertaken by the Regional Municipality of Ottawa-Carleton
Interprovincial Roadside Truck Survey REPORT 15
Exhibit 9 District System
5 Appendix E ndash Traffic Zones Comprising the Districts Interprovincial Roadside Truck Survey
REPORT 16
60 ZONEDISTRICT SYSTEM
In this report reference is made to the National Capital area This area closely replicates but does not precisely follow the boundaries of the new cities of Ottawa and Gatineau and Municipaliteacute Reacutegionale des Collines de lrsquoOutaouais (MRC) or the boundaries of the National Capital Region
The traffic zone system which has been in use for more than 10 years in the National Capital area is comprised of 258 zones (including 15 external zones) and all origin-destination information was coded to this 258-zone system This zone system has been respected in the development of a district system in all of the analyses which have been undertaken in the context of this study The district system was established to allow the recognition of relevant geographical characteristics and the presentation of relevant travel patterns and is illustrated in EXHIBIT 9 - DISTRICT SYSTEM The zones which comprise each of the ldquodistrictsrdquo are identified in Appendix E5 The districts have been identified by a geographical reference The preface IGB identified with some districts connotes a district which is Inside Green Belt
7 Hull
8 Aylmer
9 Gatineau West
10 Gatineau East
5 IGB East
1 Ottawa Central
6 Ottawa East
4 Ottawa South
2 IGB West
3 Ottawa West
Queacutebec
Ontario
EXHIBIT 9b DISTRICT SYSTEMb
There are ten ldquodistrictsrdquo in the current version of the ldquodistrictrdquo system External traffic zones in what can be considered to be ldquoremoterdquo areas (eg Montreal and contiguous areas in Quebec) have been incorporated into one of the ldquodistrictsrdquo In the presentation of the result of the analysis this factor must be borne in mind Modifications to the ldquodistrictrdquo system can be achieved with little effort for any study related to Interprovincial truck traffic
The ldquodistrictrdquo system was utilized to create origin-destination matrices for all trucks as well as each of the individual classifications of 2 axle 3+ axle and tractor trailer trucks
70 DATA EXPANSION Drivers of 549 trucks were interviewed and the survey yielded 495 (in-scope) valid (and completed) responses representing the characteristics of 3450 trucks - a sample size of 143 The data were considered to be of sufficient magnitude and strength to allow expansion by bridge and by certain time periods The methodology and expansion factors are discussed in the following
71 Expansion Methodology
The interview survey data are available for the morning and afternoon peak hours and peak periods as well as for the 0700 to 1900 [day] and 1900 to 0700 [night] and for the 24 hour period In order to determine the efficacy of utilizing the peak hour or peak period (as distinct from the 12 or 24 hour) data and applying a relationship factor (as discussed in Section 51) to establish origin-destination trip tables for transportation planning purposes two analytical processes have been applied
Origin-destination tables based on the district system were prepared to compare using percentages the results produced by the day data the night data and the full 24 hour data These tabulations were prepared for all trucks and individually for 2 axle trucks 3+ axle trucks and tractor trailers These tabulations are provided in Appendix F6 and Appendix G7
Out of a potential of 100 origin-destination pairs there were
x for all trucks of which there were 47 pairs there were 42 pairs in which the values for the day + night and the 24 hour were the same
x for 2 axle trucks of which there were 42 pairs there were 38 pairs in which the values for the day + night and the 24 hour were the same
6 Appendix F ndash ldquoDistrictrdquo Comparison of Trucks by Number 7 Appendix G ndash ldquoDistrictrdquo Comparison of Trucks by Percent Interprovincial Roadside Truck Survey REPORT 17
x for 3+ axle trucks of which there were 36 pairs there were only 22 pairs in which the values for the day + night and the 24 hour were the same
x for tractor trailer trucks of which there were 44 pairs there were only 28 pairs in which the values for the day + night and the 24 hour were the same
Since peak hour (normally the afternoon peak hour) values are typically used for transportation planning and road design principles it is essential to ensure that the peak hour (in particular the afternoon peak hour) values provide representative information for these purposes
It became apparent that the use of the afternoon peak period matrix would yield less reliable results than would the use of the 24 hour period accompanied by the application of a factor to estimate the peak period values The reliability of this procedure is enhanced by the consistency in the relationships between the peak period and the 24-hour period as determined from the results of the analysis presented earlier (Section 51)
It is apparent that the use of the values derived for all trucks by summing the two twelve hour survey periods 0700 to 1900 [day] and 1900 to 0700 [night]) would yield sufficiently reliable results to which a factor to estimate the peak period values could be applied
In the final analysis acceptable sampling rates were achieved by considering the utilization of the data by bridge and by direction for either one time period (24 hours) or two time periods (0700 to 1900 and 1900 to 0700) combined Intuitively it was collectively considered that the utilization of a process in which the two time periods were factored separately and combined to provide a strong sample would be the superior of the two methods
72 Expansion Factors
Survey expansion factors were required to expand the interview sample to the universe of the trucks observed crossing the Ottawa River Initially expansion factors were developed based on grouping the trucks by bridge by direction of travel by vehicle type and by time period The results indicated a very low (as small as 1) sampling rate for certain classifications of vehicles during certain time periods A sampling rate of 5 would be considered to be acceptable This was as a consequence of for example
x the necessity to discontinue the survey during some peak traffic periods due to the congestion being created by the survey procedures resulting in very few and in some cases no interviews
Interprovincial Roadside Truck Survey REPORT 18
Table 3 Summary of 3+ Axle Trucks by Body Type and Cargo
Interprovincial Roadside Truck Survey REPORT 19
x certain types of trucks (eg 3+ axle trucks such as those used for construction materials empty dump trucks) being directed away from the interview stations on the perception that an interview of the driver was unnecessary This was in particular relevant on the Macdonald-Cartier Bridge
Based on the proportion of empty 3+ axle trucks a further examination of this classification of truck was undertaken TABLE 3 - SUMMARY OF 3+ AXLE TRUCKS BY BODY TYPE AND CARGO provides detailed information on the 3+ axle trucks in terms of the body type and whether or not cargo was being transported A significant number of the 3+ axle trucks are comprised of the dump truck tractor cab body types
TABLE 3 SUMMARY OF 3+ AXLE TRUCKS
BY BODY TYPE AND CARGO
TRUCK BODY TYPE WITH CARGO EMPTY TOTAL
DUMP TRUCK 65 225 290
FLATBED 90 85 175
TANKER 40 10 50
VAN ndash not refridgerated 50 - 50
VAN ndash refridgerated 20 25 45
CONTAINER CARRIER 10 25 35
FLOAT - 50 50
TRACTOR CAB (only) - 95 95
OTHER - 65 25
TOTAL 340 540 880
By utilizing longer time periods for the development of the expansion factors it was possible to achieve better sampling rates and thus provide more reliable results Following on from the foregoing the use of the two twelve hour survey periods (0700 to 1900 [day] and 1900 to 0700 [night]) was examined Sample sizes for the two periods differ There were significantly more trucks included in the 0700 to 1900 survey period while the sample size from the 1900 to 0700 survey period was significantly greater
The expansion factors are presented graphically for the three vehicle classifications for each bridge in the form of the sample size for two 12 hour time periods (0700 to
Exhibit 10 Sample Size by Time of Day
2 Axles
Tractor Trailers
3 Ax es
NB SB NB SB NB SB NB SB
70
l
0
5
10
15
20
25
30
35
40
100
Chaudiegravere Macdonald-Cartier
Night 1900-0700 Day 0700-1900 Night 1900-0700 Day 0700-1900
5 5 5
Tractor Trailers
3 Axles
2 Axles
EXHIBIT 10b SAMPLE SIZEb
BY TIME OF DAYb
Northbound Southbound Northbound Southbound Northbound Southbound Northbound Southbound
Perc
ent o
f tru
cks
(Autumn 2000)
1900 [day] and 1900 to 0700 [night]) in EXHIBIT 10 - SAMPLE SIZE BY TIME OF DAY The large sample size for tractor trailers during the night period on the Chaudiegravere Bridge can be attributed to the small number of tractor trailers using the bridge during this period
The numerical values for the expansion factors are provided in TABLE 4 shyEXPANSION FACTORS BY BRIDGE BY DIRECTION AND BY TIME OF DAY
Table 4 Expansion Factors by Bridge by Direction and by Time of Day
TABLE 4 EXPANSION FACTORS BY BRIDGE
BY DIRECTION AND BY TIME OF DAY
NORTHBOUND SOUTHBOUND BRIDGE PERIOD 2 3+ Tractor 2 3+ Tractor
Axles Axles Trailer Axles Axles Trailer
MACDONALD shy Day (0700ndash1900) 128 157 65 112 482 74CARTIER Night (1900ndash0700) 121 76 39 150 260 30
Day (0700ndash1900) 51 61 36 63 47 32CHAUDIEgraveRE
Night (1900ndash0700) 28 110 10 34 32 14
- Sampling rate less than 5
Interprovincial Roadside Truck Survey REPORT 20
8 Appendix H ndash Survey Expansion Factors Interprovincial Roadside Truck Survey REPORT 21
The complete analysis in tabular as well as in graphical form is provided in Appendix H8 in which the expansion factors are presented graphically for the three vehicle classifications for each bridge in the form of the sample size for various time periods (24 hours 12 hours (0700 to 1900 and 1900 to 0700) the morning peak period [0600 to 1000] the afternoon peak period [1500 to 1900] the mid-day period [1000 to 1500] and the night period [1900 to 0600]
Generally speaking the sample size is adequate particularly in the case of the tractor-trailer classification which is considered to be of the greatest significance of the three truck classifications in the context of this study
The 3+ axle trucks have the lowest sample size (as low as 2 for the southbound direction) The three axle category in particular the dump and tractor-trailer (without a trailer) type trucks dominate the empty trucks identified in the survey and were subjectively considered to form a large part of the trucks (affected by the exclusion actions discussed earlier in this section)
The empty 3+ axle truck aspect has been discussed earlier in Section 72 (Table3)
80 TRIP CHARACTERISTICS AND PATTERNS In this section of the report the vehicle types inter-regionalexternal travel origin-destination information and vehicle loading and commodities are examined to establish trip characteristics and patterns
81 Vehicle Types
As indicated earlier of the total of approximately 3450 trucks per day observed in the surveys as crossing the Ottawa River there were 1550 2 axle (45) 880 3+ axle (25) and 1020 tractor trailer (30) trucks
EXHIBIT 11 - DAILY TRUCK VOLUMES BY CLASSIFICATION illustrates the variation in the number of trucks on the two bridges for the three classifications of trucks
The Macdonald-Cartier bridge carries by far the largest number (870) and proportion (34) of the tractor-trailer classification of truck The 2 axle truck dominates the composition (60) on the Chaudiegravere bridge
Exhibit 11 Daily Truck Volumes by Classification
Exhibit 12 Cumulative Truck Traffic
Macdonald - Cartier Bridge 2580 Trucks
Tractor Trailers 17
( 150 )
Chaudiegravere Bridge 870 Trucks
2 Axles 60
( 520 )
Tractor Trailers 34
( 870 )
2 Axles 40
( 1030 )
3+ Axles 23
( 200 )
3+ Axles 26
( 680 )
EXHIBIT 11b DAILY TRUCK VOLUMESb
BY CLASSIFICATIONb
(Autumn 2000)
EXHIBIT 12 - CUMULATIVE TRUCK TRAFFIC illustrates the profile of the truck travel for all trucks (by each classification) crossing the Ottawa River over the course of the day commencing with the 0600 time point By 2100 95 of the 3+ axle trucks 93 of the 2 axle trucks and 80 of the tractor trailer crossings of the Ottawa River have occurred
0
10
20
30
40
50
60
70
80
90
100
600
700
800
900
100
0
110
0
120
0
130
0
140
0
150
0
160
0
170
0
180
0
190
0
200
0
210
0
220
0
230
0
000
100
200
300
400
500
Time of Day
Tractor Trailer
2 Axles
3+ Axles
EXHIBIT 12b CUMULATIVEb
TRUCK TRAFFICbMacdonald-Cartier and Chaudiegravere Bridges
Per
cent
of t
ruck
s pe
r da
y
(Autumn 2000)
Interprovincial Roadside Truck Survey
REPORT 22
Table 5 Truck Travel Composition and Trip Distance
In TABLE 5 -TRUCK TRAVEL COMPOSITION AND TRIP DISTANCE an analysis of travel by truck classification is provided Data in the table indicate that the composition of the trucks on the network for trucks crossing the Ottawa River is attributable to 2 axle trucks to the extent of 45 to 3+ axle trucks to the extent of 25 and to tractor trailer trucks to the extent of 30 The tractor trailer trucks (which represent only 30 of the total trucks have the longest trip lengths with 50 of the total trip distance compared to 3+ axle trucks with 20 of the total trip distance and 2 axle trucks with 30 of the total trip distance
TABLE 5 TRUCK TRAVEL COMPOSITION AND TRIP DISTANCE
TRUCK CLASSIFICATION TRUCK TRIPS(1) TRIP DISTANCE(2)
2 AXLE 45 30
3+ AXLE 25 20
TRACTOR TRAILER 30 50 (1) As determined from the classification counts
(2) As determined by assigning truck trips to the road system
82 Trip Tables
Origin-destination trip tables based on the district system were prepared solely for the purposes of the analysis presented in this report in order to test the sufficiency of the base data in the context of the district system described earlier The results of this application are discussed in this section of the report The objective of the analysis is for the foregoing purpose only The application of the data for any subsequent transportation planning activity andor project can be undertaken with a much finer level of detail particularly in terms of the zone and district system which can be applied The determination in this regard will be the responsibility of the agencyfirmperson undertaking the activity
83 Travel Patterns
In approximate terms there was a total of 3450 trucks per day in 2000 of which 2580 used the Macdonald-Cartier bridge - 1290 northbound and 1290 southbound shyand 870 used the Chaudiegravere bridge - 460 northbound and 410 southbound
Interprovincial Roadside Truck Survey REPORT 23
9 Appendix I ndash Trip Characteristics Interprovincial Roadside Truck Survey REPORT 24
Three trip types are identified
x a local trip which is also called an internalinternal trip which has both an origin and a destination within the National Capital area A trip from Hull to the west end of Ottawa would be a local trip
x a through trip which is also called an externalexternal trip which has both an origin and a destination outside the National Capital area A trip from Montreal to Maniwaki which crosses the Ottawa River would be a through trip
x an inter-regional trip which is also called either an internalexternal or an externalinternal trip which in the case of an internalexternal trip has an origin within the National Capital area and a destination outside the area (internalexternal) and in the case of an externalinternal trip has an origin outside the National Capital area and a destination within the National Capital area (externalinternal) A trip from Gatineau to Montreal (crossing the Ottawa River) would be an internalexternal trip and a trip from Kingston to Gatineau would be an externalinternal trip with both trips classed as an inter-regional trip
An overview of the trip characteristics reveals that 2300 (67) of the trucks per day made local trips (an origin and destination generally within the National Capital area) 975 (28) of the trucks made inter-regional trips (either an origin or a destination outside the National Capital area) while 175 (5) of the trucks made a through trip (an origin and destination outside the National Capital area) The tabulations of the trips for each bridge separately by direction and by truck classification are provided in Appendix I9
EXHIBIT 13 - DAILY TRUCK COMPOSITION BY CLASSIFICATION shyMACDONALD-CARTIER BRIDGE and EXHIBIT 14 - DAILY TRUCK COMPOSITION BY CLASSIFICATION - CHAUDIEgraveRE BRIDGE illustrate the variation in the trip patterns of trucks on each of the two bridges for the three classifications of trucks
The key characteristics identified are
x 60 of the truck traffic on the Macdonald-Cartier bridge are local trips (ie 40 of the trips have at least one end outside the limits of the National Capital area) while the trucks on the Chaudiegravere bridge are predominantly (87) local trips (internalinternal)
x tractor trailer trucks are dominant on both the Macdonald-Cartier bridge and the Chaudiegravere bridge in the through trip type as well as but in a less prominent way in the inter-regional trip type indicating the fact that the tractor trailer is used for the longer trips
Exhibit 13 Daily truck Composition Macdonald-Cartier Bridge
Exhibit 14 Daily Truck Composition Chaudiegravere Bridge
110 750( 760 )
( 155 )
bull the two axle truck is the most prominent classification for local trips particularly on the Chaudiegravere bridge
EXHIBIT 13b DAILY TRUCK COMPOSITIONb MACDONALD-CARTIER BRIDGEb
2 Axles 50
3 Axles 35
Tractor Trailer 15
3 Axles 15
2 Axles 26
Tractor Trailer 59
17
Tractor Trailer 83
2 Axles
Local 60
( 1550 )
Inter-regional 34
( 865 )
Through 6
2580 Trucks
(Autumn 2000)
165
Local 87
Inter-regional 12
( 105 )
Through 1
( 10 )
2 Axles 66
3 Axles 25
Tractor Trailer 9
2 Axles 25
3 Axles 8Tractor Trailer
67
Tractor Trailer 100
EXHIBIT 14b DAILY TRUCK COMPOSITIONb
CHAUDIEgraveRE BRIDGEb
870 Trucks
750110
(Autumn 2000)
Interprovincial Roadside Truck Survey
REPORT 25
Exhibit 15 Trip Itineraries
EXHIBIT 15 - TRIP ITINERARIES provides the trip end (destination) facility for in one case on the left of the exhibit the trips ending in Ontario and in the other case on the right of the exhibit the trips ending in Queacutebec With the exception of the imbalance in the retail trip ends (10 ending in Ontario and 24 ending in Queacutebec) and the truckrail terminal trip ends (23 ending in Ontario and 14 ending in Queacutebec) the end point of trips is more or less in an equilibrium condition
33
24 10
10
23
28
22 24
12 14
--------------------------------shy Other
----------shy Warehouse Distribution Centre --------------------shy Retail Outlet
Manufacturer Primary Producer
------------shy Truck and Rail Terminal
-------------------------------------shy
------------shy------------------------shy
-----------shy
Trips to Queacutebecfrom Ontario
Trips to Ontario from Queacutebec
EXHIBIT 15B TRIP ITINERARIESB
(Autumn 2000)
84 Origin-Destination Patterns
The most relevant relationships from a transportation planning perspective are the vehicle size and the origindestination information for the various time periods Using this information a database was prepared which is as valid and useful as possible and can be applied at the traffic zone system level (258 zones)
As discussed earlier a 10 district system (an aggregate of the 258 zone system) has been established to present origindestination information in as clear a format as possible In this context originsdestinations beyond the National Capital area have been included in the adjacent district For example the ldquoHullrdquo District includes origindestinations from a large area extending northerly along Highway 5 and likewise ldquoOttawa Eastrdquo includes origindestinations for a large portion of eastern Ontario as well as areas of Queacutebec east of the Queacutebec-Ontario border (eg Montreal)
As an overview of the origins and destinations of all trucks EXHIBIT 16 - DISTRIBUTION OF ORIGINSDESTINATIONS BY CLASSIFICATION illustrates the distribution by district of all of the originsdestinations recorded in the survey There is a reasonably balanced distribution ranging from a low of 400 (Ottawa Centre and IGB West) to a high of 1360 (Hull) originsdestinations based on the district system which has been applied in the study
Interprovincial Roadside Truck Survey REPORT 26
Exhibit 16 Distribution of OriginsDestinations by Classification
10 Appendix J ndash Origins and Destinations of Truck Trips by Direction Interprovincial Roadside Truck Survey
REPORT 27
1 Ottawa Central
5 IGB East
2 IGB West
3 Ottawa West
4 Ottawa South
6 Ottawa East
7 Hull
8 Aylmer
9 Gatineau West
10 Gatineau East
Queacutebec
Ontario 2 Axle Trucks
3+ Axles Trucks
Tractor Trailers
Total number of trucks (rounded) (Origins+Destinatios) for the District
IGB ndash Inside Green Belt
xxx
(Autumn 2000)
EXHIBIT 16b DAILY DISTRIBUTION OF ORIGINSb
DESTINATIONS BY CLASSIFICATIONb
The key characteristics as portrayed on the exhibit are
bull the dominance of the Hull District as an attractorgenerator of truck trips (1360 Origins and Destinations)
bull the distribution of generated and attracted trips tofrom the nine remaining districts varies from 400 to 930 truck trips
bull the variability of the truck classifications from ldquodistrict to districtrdquo is evident although the two eastern districts one on each side of the Ottawa River which also include origins and destinations outside the National Capital area (eg Montreal) have a large proportion of tractor trailer trucks
Additional data and information are presented graphically in Appendix J10 for the northbound and southbound trips individually
The concentration of the origins and destinations for individual traffic zones is portrayed in EXHIBIT 17 DAILY CONCENTRATION OF TRUCK TRIP ORIGINS AND DESTINATIONS As would be expected truck trip ends (at least one) are
Exhibit 17 Concentration of Truck Trip OriginsDestinations
11 Appendix K ndash Concentration of Truck Trip Ends Interprovincial Roadside Truck Survey REPORT 28
focussed in lands used for industrial purposes - notably in the Industrial Avenue area in business parks in Ottawa and in the industrial areas of the former cities of Aylmer Hull and Gatineau
Thirteen of the 220 urban traffic zones account for approximately 40 of all truck trip ends and a further twenty urban traffic zones account for a further 20 of all truck trip ends
The data are presented in tabular form in Appendix K11
b b
(Autumn 2000)
gt100 Truck Trips (13 zones of All Truck Trips)
50 to 100 Truck Trips (20 zones of All Truck Trips)
lt 50 Truck Trips of All Truck Trips)
Truck Trips outside Study Area of All Truck Trips)
20
21
19
40 ndash
-
(
(
EXHIBIT 17 DAILY CONCENTRATION OF TRUCK
TRIP ORIGINS AND DESTINATIONSb
Daily Origin-Destination desire lines for all trucks as well as for each truck type are presented in the following four four-panel exhibits
x EXHIBIT 18 - DAILY ORIGIN-DESTINATION DESIRE LINES ALL TRUCK TRIPS ( AUTUMN 2000)
x EXHIBIT 19 - DAILY ORIGIN-DESTINATION DESIRE LINES 2 AXLE TRUCK TRIPS ( AUTUMN 2000)
x EXHIBIT 20 - DAILY ORIGIN-DESTINATION DESIRE LINES 3+ AXLE TRUCK TRIPS ( AUTUMN 2000)
x EXHIBIT 21 - DAILY ORIGIN-DESTINATION DESIRE LINES TRACTOR TRAILER TRIPS ( AUTUMN 2000)
On each of these four-panel exhibits each panel illustrates the desire lines (daily) for trucks to and from each of the four ldquodistrictsrdquo on the north side of the Ottawa River from and to each of the six ldquodistrictsrdquo on the south side of the Ottawa River in the autumn of 2000 The information is also provided numerically in Appendix L12
The ldquoall trucksrdquo trip patterns (Exhibit 18) highlight the role of Hull as a major generatorattractor of truck trips when compared with Aylmer Gatineau West and Gatineau East The exhibit also presents trip interchanges with each of six districts on the Ottawa side of the Ottawa River
Two axle truck patterns (Exhibit 19) are similar to the patterns of ldquoall trucksrdquo with downtown Hull again dominating the generation and attraction of trips East Gatineau trips have an orientation to the eastern ldquodistrictsrdquo in Ottawa
Three axle trucks (Exhibit 20) seem to have an ldquoaffinityrdquo for the corresponding ldquodistrictsrdquo on the opposite side of the river That is west ldquodistrictsrdquo on the north side of the Ottawa River attract trips tofrom west ldquodistrictsrdquo on the south side of the Ottawa River Similarly east ldquodistrictsrdquo on the north side attract trips tofrom east ldquodistrictsrdquo on the south side of the Ottawa River
For tractor trailers (Exhibit 21) Hull again has the largest number of trips with strong interchanges with Ottawa East and Ottawa West Gatineau East and to a slightly less extent Aylmer are also prominent with strong interchanges with Ottawa East Ottawa West and Ottawa South
The Ottawa Central ldquodistrictrdquo serves as a destination for the fewest number of tractor trailer trips
More detailed comments are provided in Appendix M13
12 Appendix L ndash Tabulations of Trip Origins-Destinations by Truck Classification 13 Appendix M - Detailed Comments on Trip Origins and Destinations
Interprovincial Roadside Truck Survey REPORT 29
Queacute
bec
Ont
ario
Ont
ario
Queacute
bec
Queacute
bec
Ont
ario
Ont
ario
Ayl
mer
H
ull
Gat
inea
u W
est
Gat
inea
u E
ast
Otta
wa
Eas
t
IGB
Eas
t
Otta
wa
Cen
tral
IGB
Wes
t
Otta
wa
Sou
thO
ttaw
a W
est
Gat
inea
u E
ast
Gat
inea
u W
est
Hul
l
Ayl
mer
Otta
wa
Eas
t
IGB
Eas
t O
ttaw
a C
entr
al
IGB
Wes
t
Otta
wa
Sou
th
Otta
wa
Wes
t
Gat
inea
u E
ast
Gat
inea
u W
est
Hul
l
Ayl
mer
Otta
wa
Eas
t
IGB
Eas
t
Otta
wa
Cen
tral
IGB
Wes
t
Otta
wa
Sou
thO
ttaw
a W
est
EX
HIB
IT 1
8 O
RIG
IN-D
ES
TIN
AT
ION
DE
SIR
E L
INE
S A
LL
TR
UC
K T
RIP
S (
AU
TU
MN
200
0)
124
Ayl
mer
Hul
l Gat
inea
u W
est
Gat
inea
u E
ast
Otta
wa
Eas
t
IGB
Eas
t
Otta
wa
Cen
tral
IGB
Wes
t
Otta
wa
Sou
thO
ttaw
a W
est
Num
ber
of tr
uck
trip
s an
d di
rect
ion
LE
GE
ND
70
7 N
umbe
r of
O-D
rsquos fo
r D
istr
ict
HU
LL
OR
IGIN
S A
ND
DE
ST
INA
TIO
NS
AL
L T
RU
CK
TR
IPS
B
GA
TIN
EA
U E
AS
T O
RIG
INS
AN
D D
ES
TIN
AT
ION
S A
LL
TR
UC
K T
RIP
S
D
GA
TIN
EA
U W
ES
T O
RIG
INS
AN
D D
ES
TIN
AT
ION
S A
LL
TR
UC
K T
RIP
S
C
AY
LM
ER
OR
IGIN
S A
ND
DE
ST
INA
TIO
NS
AL
L T
RU
CK
TR
IPS
A
Queacute
bec
Inte
rpro
vinc
ial R
oads
ideT
ruck
Sur
vey
RE
PO
RT
30
Queacute
bec
Ont
ario
Ont
ario
Queacute
bec
Queacute
bec
Ont
ario
Ont
ario
Ayl
mer
H
ull
Gat
inea
u W
est
Gat
inea
u E
ast
Otta
wa
Eas
t
IGB
Eas
t
Otta
wa
Cen
tral
IGB
Wes
t
Otta
wa
Sou
thO
ttaw
a W
est
Gat
inea
u E
ast
Gat
inea
u W
est
Hul
l
Ayl
mer
Otta
wa
Eas
t
IGB
Eas
t
Otta
wa
Cen
tral
IGB
Wes
t
Otta
wa
Sou
th
Otta
wa
Wes
t
Gat
inea
u E
ast
Gat
inea
u W
est
Hul
l
Ayl
mer
Otta
wa
Eas
t
IGB
Eas
t
Otta
wa
Cen
tral
IGB
Wes
t
Otta
wa
Sou
thO
ttaw
a W
est
EX
HIB
IT 1
9 O
RIG
IN-D
ES
TIN
AT
ION
DE
SIR
E L
INE
S 2
AX
LE
TR
UC
K T
RIP
S (
AU
TU
MN
200
0)
33
Ayl
mer
Hul
l Gat
inea
u W
est
Gat
inea
u E
ast
Otta
wa
Eas
t
IGB
Eas
t
Otta
wa
Cen
tral
IGB
Wes
t
Otta
wa
Sou
thO
ttaw
a W
est
Num
ber
of tr
uck
trip
s an
d di
rect
ion
LE
GE
ND
26
5 N
umbe
r of
O-D
rsquos fo
r D
istr
ict
HU
LL
OR
IGIN
S A
ND
DE
ST
INA
TIO
NS
2 A
XL
E T
RU
CK
TR
IPS
B
GA
TIN
EA
U E
AS
T O
RIG
INS
AN
D D
ES
TIN
AT
ION
S 2
AX
LE
TR
UC
K T
RIP
S
D
GA
TIN
EA
U W
ES
T O
RIG
INS
AN
D D
ES
TIN
AT
ION
S 2
AX
LE
TR
UC
K T
RIP
S
C
AY
LM
ER
OR
IGIN
S A
ND
DE
ST
INA
TIO
NS
2 A
XL
E T
RU
CK
TR
IPS
A
Queacute
bec
Inte
rpro
vinc
ial R
oads
ideT
ruck
Sur
vey
RE
PO
RT
31
Queacute
bec
Ont
ario
Ont
ario
Queacute
bec
Queacute
bec
Ont
ario
Ont
ario
Ayl
mer
H
ull
Gat
inea
u W
est
Gat
inea
u E
ast
Otta
wa
Eas
t
IGB
Eas
t
Otta
wa
Cen
tral
IGB
Wes
t
Otta
wa
Sou
thO
ttaw
a W
est
Gat
inea
u E
ast
Gat
inea
u W
est
Hul
l
Ayl
mer
Otta
wa
Eas
t
IGB
Eas
t
IGB
Wes
t
Otta
wa
Sou
th
Otta
wa
Wes
t
Gat
inea
u E
ast
Gat
inea
u W
est
Hul
l
Ayl
mer
Otta
wa
Eas
t
IGB
Eas
t
Otta
wa
Cen
tral
IGB
Wes
t
Otta
wa
Sou
thO
ttaw
a W
est
EX
HIB
IT 2
0 O
RIG
IN-D
ES
TIN
AT
ION
DE
SIR
E L
INE
S 3
+ A
XL
E T
RU
CK
TR
IPS
(A
UT
UM
N 2
000)
26
Ayl
mer
Hul
l Gat
inea
u W
est
Gat
inea
u E
ast
Otta
wa
Eas
t
IGB
Eas
t
Otta
wa
Cen
tral
IGB
Wes
t
Otta
wa
Sou
thO
ttaw
a W
est
Num
ber
of tr
uck
trip
s an
d di
rect
ion
LE
GE
ND
12
0 N
umbe
r of
O-D
rsquos fo
r D
istr
ict
HU
LL
OR
IGIN
S A
ND
DE
ST
INA
TIO
NS
3+
AX
LE
TR
UC
K T
RIP
S
B
GA
TIN
EA
U E
AS
T O
RIG
INS
AN
D D
ES
TIN
AT
ION
S 3
+ A
XL
E T
RU
CK
TR
IPS
D
G
AT
INE
AU
WE
ST
OR
IGIN
S A
ND
DE
ST
INA
TIO
NS
3+
AX
LE
TR
UC
K T
RIP
S
C
AY
LM
ER
OR
IGIN
S A
ND
DE
ST
INA
TIO
NS
3+
AX
LE
TR
UC
K T
RIP
S
A
Queacute
bec
Otta
wa
Cen
tral
Inte
rpro
vinc
ial R
oads
ideT
ruck
Sur
vey
RE
PO
RT
32
Queacute
bec
Ont
ario
Ont
ario
Queacute
bec
Queacute
bec
Ont
ario
Ont
ario
Ayl
mer
H
ull
Gat
inea
u W
est
Gat
inea
u E
ast
Otta
wa
Eas
t
IGB
Eas
t
Otta
wa
Cen
tral
IGB
Wes
t
Otta
wa
Sou
thO
ttaw
a W
est
Gat
inea
u E
ast
Gat
inea
u W
est
Hul
l
Ayl
mer
Otta
wa
Eas
t
IGB
Eas
t
IGB
Wes
t
Otta
wa
Sou
th
Otta
wa
Wes
t
Gat
inea
u E
ast
Gat
inea
u W
est
Hul
l
Ayl
mer
Otta
wa
Eas
t
IGB
Eas
t
Otta
wa
Cen
tral
IGB
Wes
t
Otta
wa
Sou
thO
ttaw
a W
est
EX
HIB
IT 2
1 O
RIG
IN-D
ES
TIN
AT
ION
DE
SIR
E L
INE
S T
RA
CT
OR
TR
AIL
ER
TR
IPS
(A
UT
UM
N 2
000)
65
Ayl
mer
Hul
l Gat
inea
u W
est
Gat
inea
u E
ast
Otta
wa
Eas
t
IGB
Eas
t
Otta
wa
Cen
tral
IGB
Wes
t
Otta
wa
Sou
thO
ttaw
a W
est
Num
ber
of tr
uck
trip
s an
d di
rect
ion
LE
GE
ND
32
3 N
umbe
r of
O-D
rsquos fo
r D
istr
ict
HU
LL
OR
IGIN
S A
ND
DE
ST
INA
TIO
NS
TR
AC
TO
R T
RA
ILE
R T
RIP
S
B
GA
TIN
EA
U E
AS
T O
RIG
INS
AN
D D
ES
TIN
AT
ION
S T
RA
CT
OR
TR
AIL
ER
TR
IPS
D
G
AT
INE
AU
WE
ST
OR
IGIN
S A
ND
DE
ST
INA
TIO
NS
TR
AC
TO
R T
RA
ILE
R T
RIP
S
C
AY
LM
ER
OR
IGIN
S A
ND
DE
ST
INA
TIO
NS
TR
AC
TO
R T
RA
ILE
R T
RIP
S
A
Queacute
bec
Otta
wa
Cen
tral
Inte
rpro
vinc
ial R
oads
ideT
ruck
Sur
vey
RE
PO
RT
33
85 Vehicle Loading and Commodities
The survey reported that 2075 trucks were carrying goods while 1375 trucks were empty for a total of 3450 trucks per day
Of those drivers responding to the type of commodity carried 185 different commodities were identified The commodities were grouped into eight categories A complete listing of the commodities and the group with which the commodity is categorized is provided in Appendix N14
A graphical and numerical representation of the frequency with which a particular commodity was identified as having been carried is provided subdivided into the three truck classifications in EXHIBIT 22 ndash GOODS CARRIED PER DAY
Also indicated on Exhibit 22 are the distributions of the truck classificationcommodity by time of travel [day (0700 to 1900) and night (1900 to 0700)]
The five most frequently reported commodities as illustrated in Exhibit 22 for all trucks are
x construction materials (475 trips)
x food and beverage (415 trips)
x general merchandise (360 trips)
x paper and paper products (310 trips)
x wood and wood products (195 trips)
Origin-destination trip tables have been prepared for those commodities for which it was deemed likely to provide some defined pattern of desire lines - construction materials general merchandise paperpaper products and woodwood products
The exclusion of the food and beverage category was based on the expected widely dispersed trip patterns associated with this category The purpose here is to highlight significant differences among the trip patterns associated with the major commodity groups and is not intended to influence the perception of anyone who will conduct a more thorough analysis of the data
The key characteristics for individual commodities are as follows
x for construction materials the dominance of the Aylmer to Ottawa Central trip pattern
14 Appendix N ndash Categories of Commodities Interprovincial Roadside Truck Survey REPORT 34
Exh
ibit
22G
oods
Car
ried
per
Day
EX
HIB
IT 2
2G
OO
DS
CA
RR
IED
E
XH
IBIT
22b
G
OO
DS
CA
RR
IED
PE
R D
AY
b
2 A
XL
E T
RU
CK
S
95
5
45
10
105
20
5
15
200
195
205
50
GO
OD
S C
AR
RIE
D
Otta
wa
Riv
er C
ross
ing
by T
ruck
Typ
e
(Au
tum
n 2
000)
3+ A
XL
E T
RU
CK
S
90
4
0
10 7
0
5
10
25
10
15
155
Com
mod
ity
1 =
Co
nst
ruct
ion
Mat
eria
ls
2 =
Fo
od
an
d B
ever
age
3 =
Gen
eral
Mer
chan
dis
e
4 =
Pap
er amp
Pap
er P
rod
uct
s
5 =
Wo
od
amp W
oo
d P
rod
uct
s
6 =
Pet
role
um
Ch
emic
als
7 =
Bu
sin
ess
Su
pp
lies
8 =
Au
to V
ehic
les
amp P
arts
Tru
cks
wit
h C
om
mo
dit
ies
Tru
cks
wit
ho
ut
Co
mm
od
itie
s
To
tal T
ruck
s
LE
GE
ND
Co
mm
od
ity
gro
up
ing
s
TO
TA
L
TR
AC
TO
R T
RA
ILE
RS
N
o
Day
470
285
260
205
150
90
105
55
1620
1090
2710
Nig
ht
5
130
100
105
45
55
15
455
285
740
24H
115
5
50
30
55
40
105
75
35
20
30
35
10
1 2 3
90
4 5 6 7 8
50
100
150
200
25
0 30
0 5
0 1
00 1
50
Num
ber
of tr
ucks
N
umbe
r of
tru
cks
Day
N
ight
(2
4H)
Day
N
ight
(2
4H)
870
170
1040
29
5 4
5
340
385
125
510
465
75
54
0
1255
29
5 15
50
760
120
880
50
100
150
200
N
umbe
r of
tru
cks
Day
N
ight
(2
4H)
455
240
695
240
85
325
695
325
1020
1 =
Con
stru
ctio
n M
ater
ials
( d
ryw
allc
oncr
ete
win
dow
s tr
usse
s)
5 =
Woo
d amp
Woo
d P
rodu
cts
( lu
mbe
r lo
gs c
hip
boar
d )
2 =
Foo
d an
d B
ever
age
(pro
cess
ed fo
od a
nd b
ever
age)
6
= P
etro
leum
Che
mic
als
( ga
solin
efu
els
altl
ime)
3
= G
ener
al M
erch
andi
se (
mix
ed fr
eigh
t fu
rnitu
re b
oxes
) 7
= B
usin
ess
Sup
plie
s (
prin
ting
supp
lies
offi
ce fu
rnitu
re g
over
nmen
t rec
ords
)
4 =
Pap
er amp
Pap
er P
rodu
cts
( pa
per
new
sprin
t to
ilet p
aper
) 8
= A
uto
Veh
icle
s amp
Par
ts (
car
s a
uto
part
s ti
res)
Day
tim
e (
700
- 1
900
)
Nig
ht ti
me
( 19
00
- 7
00)
3450
2075
1375
105
70
195
145
360
310
475
415
Inte
rpro
vinc
ial R
oads
ide
Truc
k S
urve
y
RE
PO
RT
35
x for general merchandise the expected widely dispersed trip patterns
x for paperpaper products the dominant interchange of trips between Hull and Ottawa (both East and West) and between Gatineau East and Ottawa South
x for woodwood products the dominance of the Aylmer and Gatineau West trips to Ottawa South
Additional information on commodity patterns is presented in Appendix O15
EXHIBIT 23 -DAILY COMMODITY FLOW - MACDONALD-CARTIER BRIDGE and EXHIBIT 24 -DAILY COMMODITY FLOW - CHAUDIEgraveRE BRIDGE illustrates commodity flow for each bridge by the three truck classifications and by the type of commodity carried (including empty trucks) Of particular interest is
x the proportion of tractor trailers in the truck stream on the Macdonald-Cartier Bridge (34) compared to the Chaudiegravere Bridge (17)
x the approximately equal proportions of 3+ axle trucks in the truck stream on each of the Macdonald-Cartier Bridge and Chaudiegravere Bridge
x the proportion of trucks carrying petroleumchemical products hauled by 3+ axle trucks is 13 and by tractor trailers is 11 on the Chaudiegravere Bridge
x the proportion of the tractor trailer trucks hauling paper products is 19 on the Macdonald-Cartier and 17 on the Chaudiegravere Bridge
x the proportion of tractor trailer trucks carrying wood products on the Macdonald-Cartier Bridge is 12
x the proportion of the empty trucks notably the 3+ axle trucks is 64 on the Macdonald-Cartier and 54 on the Chaudiegravere Bridge as discussed in Section 72
15 Appendix O ndash Trip Origins and Destinations for Specific Commodities and Detailed Comments Interprovincial Roadside Truck Survey REPORT 36
Exhibit 23 Daily Commodity Flow Macdonald-Cartier Bridge
EXHIBIT 23 COMMODITY FLOW
- MACDONALD-CARTIER BRIDGE
( 1025 )
b b b
Construction Materials 16
Food amp Beverage
19
General Merchandise 18
Empty 28
Paper Products 10
Business Supplies 6
AutoVehicles amp Parts
1
PetroleumChemicals 2
2 Axles 40
3 Axles 26
( 680 )
Tractor Trailers 34
( 870 )
General Merchandise
Food amp Beverage 6
Empty 64
Construction Materials 16
1
PetroleumChemicals 2
Wood Products 11
Food amp Beverage
12
Construction Materials 12
Paper Products 19
Empty 30
8
General Merchandise
10
AutoVehicles amp Parts
5
Wood Products PetroleumChemicals
4
2580 Trucks
( 1030 )
EXHIBIT 23b DAILY COMMODITY FLOWb
-MACDONALD-CARTIER BRIDGEb
(Autumn 2000)
Exhibit 24 Daily Commodity Flow Chaudiegravere Bridge
520
EXHIBIT 24 COMMODITY FLOW- CHAUDIEgraveRE BRIDGE
( 525 )
2 Axles 60
3 Axles 23
(200 )
Tractor Trailers 17
( 150 )
Construction Materials 6 Food amp Beverage
17 Empty 45
Paper Products
2
General Merchandise 14
Business Suppl ies
8
AutoVehicles amp Parts
2
Wood Products
1
Petroleum Chemicals
5
Construction Materials 22
Food amp Beverage 5
Empty 54
PetroleumChemicals 13
Wood Products 3
Paper Products 3
Food amp Beverage 6
Paper Products 17
Empty 40
Construction Materials 14
General Merchandise 8
Petroleum Chemicals
11 Wood Products
3
AutoVehicles amp Parts
1
870 Trucks
b b b
EXHIBIT 24b DAILY COMMODITY FLOWb
-CHAUDIEgraveRE BRIDGEb
(Autumn 2000)
520
Interprovincial Roadside Truck Survey
REPORT 37
90 SUMMARY
Information in this report is presented at the most aggregate level with the purpose of developing a good understanding of the interprovincial trip patterns origins destinations and characteristics of trucks in Canadarsquos Capital Region This report is not intended to deal with specific interprovincial transportation issuess Detailed analysis of the comprehensive data base would be necessary to assess the impact of new or improved infrastrucure on interprovincial truck traffic and would be a prerequisite for reaching any meaningful conclusions regarding future interprovincial transport needs
The 1999 2000 Interprovincial roadside truck survey provides
bull An effective database of high quality strong and meaningful information for application in future transportation planning activities
bull The basis for a more thorough understanding of interprovincial truck movements
bull An efficient means of evaluating costs and benefits in assessing alternative solutions to interprovincial truck travel issuess
bull A thorough understanding of the interprovincial movement patterns origins and destinatioons and characteristics of heavy trucks in the National Capital Region
Interprovincial Roadside Truck Survey
REPORT 38
100 LIST OF APPENDICES The 19992000 Interprovincial Roadside Truck Survey Technical Appendiceshave been bound separately and contain the following
Appendix A Survey Database Fields
Appendix B Heavy Truck Classification System
Appendix C Summary of Historical Ottawa River Crossing Truck Traffic Volumes
Appendix D Time Period Relationships
Appendix E Traffic Zones Comprising the Districts
Appendix F ldquoDistrictrdquo Comparison of Trucks by Number
Appendix G ldquoDistrictrdquo Comparison of Trucks by Percent
Appendix H Survey Expansion Factors
Appendix I Trip Characteristics
Appendix J Origin and Destination of Truck Trips by Direction
Appendix K Concentration of Truck Trip Ends
Appendix L Tabulations of Trip Origins-Destinations by Truck Classification
Appendix M Detailed Comments on Trip Origins and Destinations
Appendix N Categories of Commodities
Appendix O Trip Origins and Destinations for Specific Commodities and Detailed Comments
Interprovincial Roadside Truck Survey REPORT 39
19992000INTERPROVINCIAL
ROADSIDE TRUCK SURVEY TECHNICAL APPENDICES
ENQUEcircTE ROUTIEgraveRE INTERPROVINCIALE SUR LE CAMIONNAGE 19992000 ANNEXES
McLean Transportation Engineering Consultants Ltd
TRANS MEMBER AGENCIES
National Capital Commission
Mr Arto KeklikianCapital Planning and Real Asset Management
Ministegravere des Transports Queacutebec
Monsieur Ghislain CoutureDirection reacutegionale de lrsquoOutaouais
Ministry of Transportation Ontario
Mr James WongTransportation Planning Branch
Ville de Gatineau
Monsieur Paul-Andreacute Roy Service Urbanisme
City of Ottawa
Mr Don Stephens PEng ( Manager TRANS Programme ) Planning Environment and Infrastructure Policy
Mr Rob Calladine Planning Environment and Infrastructure Policy
Socieacuteteacute de transport de lOutaouais
Monsieur Salah Barj Service Strateacutegies et Deacuteveloppement
Monsieur Carmel Dufour Service Strateacutegies et Deacuteveloppement
OCTranspo
Mr Colin LeechService Planning Department
19992000INTERPROVINCIAL ROADSIDE
TRUCK SURVEY
TECHNICAL APPENDICES
Prepared for
TRANS A Joint Technical Committee on Transportation Systems Planning
By
McLean Transportation Engineering Consultants Ltd
June 2002
LIST OF APPENDICES
Appendix A Survey Database Fields 1
Appendix B Heavy Truck Classification System 52
Appendix C Summary of Historical Ottawa River Crossing Truck Traffic Volumes 54
Appendix D Time Period Relationships 56
Appendix E Traffic Zones Comprising the Districts 58
Appendix F District Comparisons of Trucks by Number 61
Appendix G District Comparisons of Trucks by Percent 70
Appendix H Survey Expansion Factors 73
Appendix I Trip Characteristics 75
Appendix J Origins and Destinations of Truck Trips by Direction 77
Appendix K Concentration of Truck Trip Ends 79
Appendix L Tabulations of Trip Origins and Destinations by Truck Classification 83
Appendix M Detailed Comments on Trip Origins and Destinations 85
Appendix N Categories of Commodities 88
Appendix O Trip Origins and Destinations for Specific Commoditiesand Detailed Comments 98
Interprovincial Roadside Truck Survey Technical Appendices i
Appendix A Survey Database Fields
Interprovincial Roadside Truck Survey Technical Appendices 1
SURVEY DATABASE FIELDS-DETAILEDINFORMATION
(Same as 1999 NRS)
Answer Output Database
Note This version of the description includes the field and answer changes made in July 1999 when the questionnaire was shortened
Each record in the answer output database contains the answers collected from one questionnaire The fields of the database which is named STUDYDBF are explained in the table at the end of this appendix For each field the table lists the following information
Reference A cross-reference between the field and other documents bull Questionnaire A code of format cnn that denotes the question on the 1999
Questionnaire to which the field corresponds where bull c is the section of the questionnaire (eg section ldquoBrdquo is the
Scope section) and bull nn is the question number in the section (eg rdquo01rdquo ldquo02rdquo
etc) bull
Field Field specification bull Name A code of format ldquoaaabbbbbbbrdquo where
bull ldquoaaardquo is the number of the question on the 1999 Questionnaire to which the field corresponds (the same number ldquocnnrdquo as discussed above except that the ldquordquo is not included) and
bull ldquobbbbbbbrdquo represents 1 or more words that describe the related question and the field contents The following rules are applied when creating ldquobbbbbbbrdquo
bull A word is presented in full or as a short form the short form being
bull the first 1 letter bull the first 3 letters or bull the first 6 letters
bull ldquoSrdquo as the last letter usually means that the field marks the ldquostatusrdquo of the contents of another field
bull ldquoDrdquo as the last letter usually means that the field contains a hand-written ldquodescriptionrdquo that has been entered because the predetermined list of answers does not capture the actual answer
bull ldquoUrdquo as the last letter usually means that the field records the ldquounits of measurementrdquo that apply to the contents of another field
bull Type Type of information stored (N=numeric C=character L=logic ldquoDrdquo=Date)
bull Length Length of the field (total number of digits or characters (including the ldquordquo used for floating point numbers but excluding the ldquordquo that appears in dates)
bull Decimals Number of digits after the decimal point (valid only for a numeric field)
Interprovincial Roadside Truck Survey Technical Appendices 2
bull Index Whether the field is used in an index (N=no Y=yes) Information A description of the field and the values that can legitimately appear in the
field Whether Question Depends Flags cases where the question pertaining to the field is conditional The on Previous Answers question may be active (asked) or inactive (skipped) depending on the
answers to previous questions The actual dependency relationships are described in Appendix F
Whether Answer is Flags cases where the answer in numeric fields is checked for plausibility Checked for Plausibility against criteria The actual plausibility checks are described in
Appendix G
Following are notes on various aspects of the table
Concerning Field Order The order in which the fields are listed in the table matches the order of the questions on the questionnaire to which the fields relate The software internal fields (fields used by the software that are not related to particular questions) are listed at the beginning of the table
Concerning Answer Codes There are several codes used in answers that are reserved for specific situations (to the extent possible) These are listed below
Reserved Answer Codes Code Meaning of Answer
When Field is When Field is Numeric Alphanumeric
95 Other (the answer is not one of the choices specifically identified by the question)
96 X Not Applicable (the question was not asked because it was not applicable) 97 T Terminated (driver terminated interview before this question could be
asked) 98 R Refused (driver refused to answer this question) 99 D Donrsquot Know (driversurveyor did not know the answer to the question)
Concerning the Usability of the Record The state of a record is marked by answers stored in 2 fields These answers are used to identify whether the record contains a valid observation for the NRS
bull QTYPE -- This marks whether the record was generated by a ldquoliverdquo questionnaire (actual observation of a truck that is part of the NRS data collection) or by a ldquopracticerdquo questionnaire (completed for training purposes)
bull QSTATUS -- This marks whether the record was ldquostudy usablerdquo (questionnaire completed by answering the necessary questions (specifically the ldquoConfirm Completionrdquo screen was reached)) ldquoabandoned (questionnaire not completed by surveyorrsquos choice to use ldquoabandonmentrdquo button) or ldquofailurerdquo (questionnaire not completed because of computer malfunction)
Concerning Date and Time Stamp Fields Certain fields contain dates and times that are entered automatically by the QS using values from the handheld computerrsquos internal clock Values are entered into these fields only during the original entry of answers session with the
Interprovincial Roadside Truck Survey Technical Appendices 3
questionnaire During subsequent editing of answers sessions with the questionnaire the date and time fields are not changed by the QS and can not be changed by the surveyor with the exception of the A05QSDATE A06HOUR and A06MIN field values The date and time stamp fields are described below
bull A05QSDATE A06HOUR A06MIN -- These contain the datetime at which the questionnaire was started Specifically the datetime at which the QS reached the first screen of the Scope section of the questionnaire (the screen that asks if the truck is a cargo type etc) The purpose of this datetime is to mark when the truck was observed The values are automatically entered by the QS but the values can be edited by the surveyor during the original entry of answers session or during subsequent editing of answers sessions
bull PA05QSDATE PA06HOUR PA06MIN -- These permanently contain the first values that were automatically entered by the QS to A05QSDATE A06HOUR and A06MIN
bull QEDATE QEHOUR QEMINUTE -- These contain the datetime at which the original entry of answers session ended Specifically the datetime at which the QS passed the ldquoConfirm Completionrdquo screen
bull ISTDATE ISTHOUR ISTMINUTE -- These contain the datetime at which the driver interview started Specifically the datetime at which the QS reached the first screen of the Interview Start section of the questionnaire (the screen that asks for the drivers participationrefusal)
bull IENDDATE IENDHOUR IENDMINUTE -- These contain the datetime at which the driver interview ended Specifically the datetime at which the QS exits the driver interview sections of the survey by the surveyor either (1) pressing the End Survey button option on any of the screens or (2) pressing the Next Screen button after completing the last screen (the screen that asks about the drivers recent training)
Concerning Geographic Coordinates Format bull Longitude -- Longitude is expressed in decimal degrees The values range from -180
to +180 A positive value denotes a location west of the prime meridian A negative value denotes a location east of the prime meridian
bull Latitude -- Latitude is expressed in decimal degrees The values range from -90 to +90 A positive value denotes a location in the northern hemisphere A negative value denotes a location in the southern hemisphere
Concerning Out-of-Scope Trucks Trucks in the scope of the NRS are heavy cargo trucks which are defined as trucks
bull of a type normally used to move cargo from one point to another point bull that meets the definition of commercial vehicle under the National Safety Code
(meaning a truck tractor or combination thereof with a registered gross vehicle weight greater than 4500 kilograms)
Interprovincial Roadside Truck Survey Technical Appendices 4
Concerning the size of a heavy truck the following two practical definitions will be used bull To facilitate visual identification heavy trucks will consist of trucks that have 6 or
more tires bull To facilitate identification by automatic vehicle classifier equipment that use vehicle
length as the basis for differentiating between sizes of vehicle heavy trucks will consist of trucks that are longer than 20 feet
Therefore trucks are out of the scope of the NRS for the following reasons bull Light trucks of 4500 kilograms or less which is defined as any straight truck with 4
tires (with or without a trailer) bull Non-cargo type trucks which include
bull mobile machines (any straight truck without a trailer that has a permanently attached machine (ie the truck exists to move the machine around) -shyexamples include
bull crane bull drill rig bull seismic rig bull boomcherry pickerladder bull curbroadsidewalk cutter bull concrete pump bull rock crusher bull carnival ride
bull emergency truck -- examples include bull fire truck bull ambulance bull police vehicle
bull service truck -- examples include bull hydro truck bull road painter bull snow plow bull road sweeper
bull a tow truck (with or without vehicle) that moves a vehicle by means of a slinghook mounted at the back (ie some of the vehicles wheels are on the road)
But if any of the above listed trucks has a trailer attached that can be used to carry cargo then the truck is a cargo truck for the purposes of the NRS For example a hydro service truck that is pulling a trailer loaded with telephone poles is a cargo truck
Note that cargo truck includes bull any tractor pulling a trailer regardless of the trailer (for example the trailer could be a
permanently attached machine) bull a concrete mixer and bull a sewer cleaning truck if it has a holding tank
Interprovincial Roadside Truck Survey Technical Appendices 5
Concerning Definition of a Trip -- Refer to Reference 6
Concerning Border Crossings -- Refer to Reference 6
Interprovincial Roadside Truck Survey Technical Appendices 6
Answer Output Database Fields Reference Field Information
Questi- Name Type Length onnaire Decimals Index
Z Software Internal Fields (not related to questions on the Study Questionnaire) QID C 8 0 N Questionnaire IDentifier -- Uniquely identifies one
questionnaire among all questionnaires generated on all computers used in the NRS
QSTATUS C 1 0 N Questionnaire STATUS -- Marks whether the ldquonecessaryrdquo questions were completed in the original entry of answers session S = Study usable (completed) A = Abandoned (not completed -- ldquoabandonrdquo button used) F = Failure (did not pass ldquoConfirm Completionrdquo screen)
QTYPE C 1 0 N Questionnaire Type -- Marks why the questionnaire was entered L = Live (actual observation of a truck for the NRS) P = Practice (training)
DISTATUS C 1 0 N Driver Interview STATUS -- Marks whether all the driver interview questions were asked (conversely whether the driver terminated the interview) A = All questions asked I = Incomplete interview (driver terminated before all questions asked)
DILAST C 3 0 N Driver Interview LAST questions completed -shyIdentifies the last screen of questions completed before the driver terminated the interview blank = not applicable (driver interview not terminated) ccc = section letter and tab number for the last screen with all answers completed (eg ldquoF02rdquo)
PA01JUR C 4 0 N Permanent copy of the original value of A01JUR PA02SITE C 8 0 N Permanent copy of the original value of A02SITE PA02DCSSEL C 75 0 N Permanent copy of the original value of A02DCSSEL PA04DIRECT C 1 0 N Permanent copy of the original value of A04DIRECT PA05QSDATE D 8 0 N Permanent copy of the original value of A05QSDATE PA06QSHOUR N 2 0 N Permanent copy of the original value of
A06QSHOUR PA06QSMIN N 2 0 N Permanent copy of the original value of A06QSMIN QEDATE D 8 0 N Questionnaire End DATE -- When questionnaire
completed Format YYYYMMDD See description of date and time fields that precedes this table
QEHOUR N 2 0 N Questionnaire End HOUR -- When questionnaire completed Format 24 hour clock See description of date and time fields that precedes this table
QEMINUTE N 2 0 N Questionnaire End MINUTE -- When questionnaire completed See description of date and time fields that precedes this table
Interprovincial Roadside Truck Survey Technical Appendices 7
Answer Output Database Fields Reference Field Information
Questi- Name Type Length onnaire Decimals Index
ISTDATE D 8 0 N Interview STart DATE - When driver interview section of questionnaire started Format YYYYMMDD See description of date and time fields that precedes this table
ISTHOUR N 2 0 N Interview SSart HOUR - When driver interview section of questionnaire started Format 24 hour clock See description of date and time fields that precedes this table
ISTMINUTE N 2 0 N Interview STart MINUTE - When driver interview section of questionnaire started See description of date and time fields that precedes this table
IENDDATE D 8 0 N Interview END DATE - When driver interview sections of questionnaire completed Format YYYYMMDD See description of date and time fields that precedes this table
IENDHOUR N 2 0 N Interview END HOUR - When driver interview sections of questionnaire completed Format 24 hour clock See description of date and time fields that precedes this table
IENDMINUTE N 2 0 N Interview END MINUTE - When driver interview sections of questionnaire completed See description of date and time fields that precedes this table
XOBSERV L 1 0 N Questionnaire Observations Section F (or 0) = not started T (or 1) = partially or completely filled in
XSCOPE L 1 0 N Scope Section Results -- Whether truck is in-scope F (or 0) = not-in-scope T (or 1) = in-scope
XWEIGHTS L 1 0 N Questionnaire Weights and Measures Section Same answers as for Questionnaire Observations Section
A Identification Section A01 A01JUR C 4 0 N JURisdiction -- Provinceterritory in which DCS is
located The codes are listed in Appendix H A02 A02SITE C 8 0 N SITE ID -- Unique identifier assigned to the DCS
The codes are listed in Appendix H Note Identifier is filled automatically by the computer when DCSSEL is selected from the pick-list
A02 A02DCSSEL C 75 0 N DCS SELector -- Specification of the DCS that is used for selection (the pick-list entry) Format DCS name + traffic direction description
A02 A02DCSLON N 11 6 N DCS LONgitude -- Longitude of the DCS Format defined in description of geographic coordinates that precedes this table Note Longitude is filled automatically by the computer when DCSSEL is selected from the pick-list
Interprovincial Roadside Truck Survey Technical Appendices 8
Answer Output Database Fields Reference Field Information
Questi- Name Type Length onnaire Decimals Index A02 A02DCSLAT N 11 6 N DCS LATitude -- Latitude of the DCS Format
defined in description of geographic coordinates that precedes this table Note Latitude is filled automatically by the computer when DCSSEL is selected from the pick-list
A03 A03SURVEY C 3 0 N SURVEYor - ID assigned to the surveyor filling-in the questionnaire Unique at the DCS
A04 A04DIRECT C 1 0 N DIRECTion -- Direction of traffic being interviewed at DCS N = Northbound E = Eastbound S = Southbound W = Westbound
A05 A05QSDATE D 8 0 N Questionnaire Start DATE -- When questionnaire started Format YYYYMMDD See description of date and time fields that precedes this table
A06 A06QSHOUR N 2 0 N Questionnaire Start HOUR -- When questionnaire started Format 24 hour clock See description of date and time fields that precedes this table
A06 A06QSMIN N 2 0 N Questionnaire Start MINute -- When questionnaire started See description of date and time fields that precedes this table
B Scope Section B01 B01CARTYP C 1 0 N CARgo TYPe truck -- Whether the type of truck or
type of truck body is capable of carrying cargo or usually used for carrying cargo Y = Yes N = No Note ldquoNrdquo marks an out-of-scope truck Note See description of out-of-scope trucks that precedes this table
B02 B02OOSTYP C 20 0 N Out-Of-Scope truck TYPe blank = not applicable (truck is cargo type) something = description of the non-cargo type truck Note See description of out-of-scope trucks that precedes this table
B03 B03STR4T C 1 0 N STRaight truck with 4 Tires -- Whether truck is a straight truck with 4 tires (with or without a trailer) Y = Yes N = No Note ldquoYrdquo marks an out-of-scope truck
Interprovincial Roadside Truck Survey Technical Appendices 9
Answer Output Database Fields Reference Field Information
Questi- Name Type Length onnaire Decimals Index B04 B04AXLOOS N 2 0 N AXLes on Out-Of-Scope truck -- Number of axles on
the truck if it is out-of-scope (all axles on the straight trucktractor and trailers) 2 to 12 = number of axles 96 = not applicable (truck is in-scope)
C Observations Section C01 C01CONF N 2 0 N CONFiguration of truck -- Type of configuration
1 = tractor amp 1 trailer 2 = tractor amp 2 trailers 3 = tractor amp 3 trailers 4 = straight truck 5 = straight truck amp trailer 6 = tractor only 95 = other Note Type ldquo6rdquo applies only if the tractor is ldquobob tailrdquo If a tractor is towingcarrying other tractors or if tractor is towingcarrying trucks or if a tractor is carrying a trailer piggyback then the type is ldquo95rdquo Note Type ldquo95rdquo covers tractor towingcarrying other tractors tractor towingcarrying a truck and tractor carrying a trailer piggyback Note A jeepbooster used to support heavy loads is treated as part of the trailer
C02 C02CONFD C 20 0 N CONFiguration Description blank = not applicable (truck fits a predefined configuration) something = description of the ldquootherrdquo configuration
C03 C03HITCH C 1 0 N HITCH -- Type of connection used to join the 1st and 2nd trailer in a truck train (a tractor pulling 2 or 3 trailers) A = A train B = B train C = C train X = not applicable (not truck train)
C04 C04CAB C 1 0 N CAB style -- Type of the driver cab C = Conventional (long nose or cab after engine) O = cab-Over-engine
Interprovincial Roadside Truck Survey Technical Appendices 10
Answer Output Database Fields Reference Field Information
Questi- Name Type Length onnaire Decimals Index C05 C05BODY1 N 2 0 N BODY 1 style -- Classification of the style or
intended freight or intended use of the 1st cargo unit of the truck The 1st cargo unit is either a straight truck the first trailer pulled by a tractor or a tractor without a trailer 1 = van -- not refrigerated 2 = van -- refrigerated 3 = container carrier 4 = van -- soft sided 5 = flatbed 6 = stakerack 7 = float 8 = tanker 9 = hopper 10 = dump 11 = chip 12 = garbage truck 13 = vehicle carrier 14 = animal carrier 15 = none (applies only when the truck consists of a ldquobob tailrdquo tractor that is a tractor neither pulling a trailer nor towingcarrying other tractors) 95 = other Note Concerning the assignment of unusual body styles bull a flatbed or stakerack with a mounted loading
crane as a ldquoflatbedrdquo or ldquostakerackrdquo bull a deckless frame used to carry logspolls as a
stakerack bull a glass carrier as other bull a boat carrying frame as other bull a permanently attached machine as other bull a concrete mixer as other bull a sewer cleaner as other (a sewer cleaning
truck would be in-scope if it had a holding tank would be out-of-scope if it was only a pump)
bull a pick-up truck box as other C06 C06BODY1D C 20 0 N BODY 1 style Description
blank = not applicable (1st cargo unit fits predefined style) something = description of ldquootherrdquo style of 1st cargo unit
Interprovincial Roadside Truck Survey Technical Appendices 11
Answer Output Database Fields Reference Field Information
Questi- Name Type Length onnaire Decimals Index C07 C07BODY2 N 2 0 N BODY 2 style -- Classification of the style or
intended freight or intended use of the 2nd cargo unit of the truck The 2nd cargo unit is either the trailer pulled by a straight truck or the 2nd trailer pulled by a tractor 1 = van -- not refrigerated 2 = van -- refrigerated 3 = container carrier 4 = van -- soft sided 5 = flatbed 6 = stakerack 7 = float 8 = tanker 9 = hopper 10 = dump 11 = chip 12 = garbage truck 13 = vehicle carrier 14 = animal carrier 15 = none (no such unit on the truck) 95 = other Note See note under BODY 1 style
C08 C08BODY2D C 20 0 N BODY 2 style Description blank = not applicable (2nd cargo unit fits predefined style or no 2nd cargo unit) something = description of ldquootherrdquo style of 2nd
cargo unit C09 C09BODY3 N 2 0 N BODY 3 style -- Classification of the style or
intended freight or intended use of the 3rd cargo unit of the truck The 3rd cargo unit is the 3rd trailer pulled by a tractor 1 = van -- not refrigerated 2 = van -- refrigerated 3 = container carrier 4 = van -- soft sided 5 = flatbed 6 = stakerack 7 = float 8 = tanker 9 = hopper 10 = dump 11 = chip 12 = garbage truck 13 = vehicle carrier 14 = animal carrier 15 = none (no such unit on the truck) 95 = other Note See note under BODY 1 style
Interprovincial Roadside Truck Survey Technical Appendices 12
Answer Output Database Fields Reference Field Information
Questi- Name Type Length onnaire Decimals Index C10 C10BODY3D C 20 0 N BODY 3 style Description
blank = not applicable (3rd cargo unit fits predefined style or no 3rd cargo unit) something = description of ldquootherrdquo style of 3rd
cargo unit C11 C11LIGHTS C 1 0 N LIGHTS on -- Whether the headlights are on
Y = Yes N = No X = not applicable Note ldquoNot applicablerdquo because the question was not asked after being eliminated from the questionnaire
C12 C12SLEEP C 1 0 N SLEEPer -- Whether the tractorstraight truck has a sleeper (a compartment immediately behind the driver cab that contains a bed) Y = Yes N = No
C13 C13DROME C 1 0 N DROME -- Whether the tractor has a drome (a box for carrying cargo that is mounded on a tractor in front of the fifth wheel) Y = Yes N = No
C14 C14REFLEC C 1 0 N REFLECTive markers -- Whether the truck has reflective markers on the back and sites (reflective tape on the edges that increases truck visibility at night) Y = Yes N = No
C15 C15UNDER C 1 0 N UNDER-ride guard -- Whether the truck has a rear under-ride guard (beam that prevents a car from sliding under the back of the truck) Y = Yes N = No
C16 C16DGP1 N 2 0 N Dangerous Goods Placard 1 -- If there is at least 1 dangerous goods placard or placard holder what is onin the 1st placardplacard holder 1 to 9 = class marked on placard 10 = placard holder is empty 11 = no such placard or holder 95 = other class (not 1 through 9) 96 = not applicable 99 = unable to determine class Note ldquoNot applicablerdquo because the question was not asked after being eliminated from the questionnaire
Interprovincial Roadside Truck Survey Technical Appendices 13
Answer Output Database Fields Reference Field Information
Questi- Name Type Length onnaire Decimals Index C17 C17DGP2 N 2 0 N Dangerous Goods Placard 2 -- If there are at least 2
dangerous goods placards or placard holders what is onin the 2nd placardplacard holder 1 to 9 = class marked on placard 10 = placard holder is empty 11 = no such placard or holder 95 = other class (not 1 through 9) 96 = not applicable 99 = unable to determine class Note ldquoNot applicablerdquo because the question was not asked after being eliminated from the questionnaire
C18 C18DGP3 N 2 0 N Dangerous Goods Placard 3 -- If there are at least 3 dangerous goods placards or placard holders what is onin the 3rd placardplacard holder 1 to 9 = class marked on placard 10 = placard holder is empty 11 = no such placard or holder 95 = other class (not 1 through 9) 96 = not applicable 99 = unable to determine class Note ldquoNot applicablerdquo because the question was not asked after being eliminated from the questionnaire
C19 C19FLPJURS C 1 0 N Front Licence Plate JURisdiction Status -- Whether the identity of the jurisdiction (Canadian province territory US state Mexico) that issued the front licence plate of the straight truck or tractor is available Y = Yes N = No (unable to read)
C19 C19FLPJUR C 4 0 N Front Licence Plate JURisdiction -- The jurisdiction that issued the front licence plate blank = not available (see status field) cccc = jurisdiction code The codes are listed in Appendix H Note If a truck has 2 or more places select according to the following reules bull first choice -- a plate issued by the province in
which the DCS is located bull second choice -- the left most plate (driver side
plate) if plates are arranged horizontally and the top plate if plates are arranged vertically
C20 C20FLPNUMS C 1 0 N Front Licence Plate NUMber Status -- Whether the number on the front licence plate is available Y = Yes N = No (unable to read) X = not applicable Note ldquoNot applicablerdquo because the question was not asked after being eliminated from the questionnaire
Interprovincial Roadside Truck Survey Technical Appendices 14
Answer Output Database Fields Reference Field Information
Questi- Name Type Length onnaire Decimals Index C20 C20FLPNUM C 7 0 N Front Licence Plate NUMber -- The number on the
front licence plate blank = not available (see status field) ccccccc = number
C21 C21RLPJURS C 1 0 N Rear Licence Plate JURisdiction Status -- Whether the identity of the jurisdiction (Canadian province territory US state Mexico) that issued the rear licence plate on the last trailer of the truck is available Y = Yes N = No (unable to read) X = not applicable Note ldquoNot applicablerdquo if no trailer or because the question was not asked after being eliminated from the questionnaire
C21 C21RLPJUR C 4 0 N Rear Licence Plate JURisdiction -- The jurisdiction that issued the rear licence plate blank = not availableapplicable (see status field) cccc = jurisdiction code The codes are listed in Appendix H
C22 C22RLPNUMS C 1 0 N Rear Licence Plate NUMber Status -- Whether the number on the rear licence plate is available Y = Yes N = No (unable to read) X = not applicable Note ldquoNot applicablerdquo if no trailer or because the question was not asked after being eliminated from the questionnaire
C22 C22RLPNUM C 7 0 N Rear Licence Plate NUMber -- The number on the rear licence plate blank = not availableapplicable (see status field) ccccccc = number
C23 C23COMNAMS C 1 0 N COMpany NAMe Status -- Whether there is a truck company name on the driver door of the straight truck or tractor Y = Yes N = No X = not applicable Note ldquoNot applicablerdquo if jurisdiction containing the DCS does not require that the question be asked
C23 C23COMNAM C 50 0 N COMpany NAMe -- Truck company name on the driver door blank = not applicable (see status field) something = company name
Interprovincial Roadside Truck Survey Technical Appendices 15
Answer Output Database Fields Reference Field Information
Questi- Name Type Length onnaire Decimals Index C23 C23COMID C 10 0 N COMpany name ID -- Unique identifier assigned to
the record containing the company name blank = not applicable (see status field) something = identifier Note Identifier is filled automatically by the computer but only if the company name is selected from the pick-list
C24 C24LOCH1 N 2 0 N LOCation of Hitch 1 -- Point on the straight truck or tractor where the 1st trailer connects 237 = sequence number assigned to the axle group related to the connection 96 = not applicable (no trailers) Note The location point is identified by specifying the axle group above which or immediately after which the trailer hitch or king pin connects
C24 C24LOCH2 N 2 0 N LOCation of Hitch 2 -- Point on the first trailer where the 2nd trailer connects 347 = sequence number assigned to the axle group related to the connection 96 = not applicable (no 2nd trailer)
C24 C24LOCH3 N 2 0 N LOCation of Hitch 3 -- Point on the second trailer where the 3rd trailer connects 457 = sequence number assigned to the axle group related to the connection 96 = not applicable (no 3rd trailer)
C25 C25AXLAG1 N 1 0 N AXLes in Axle Group 1 -- Number of axles in the 1st
group of axles on the truck 12 = number of axles Note Axle groups are numbered sequentially beginning at the front of the truck Note An axle group consists of 1 2 3 or 4 axles Each axle on the truck is assigned to a group Two or more axles are assigned to the same group if they are closely spaced and attached to the truck in such a way that each axle is carrying approximately the same load Each axle on the truck is assigned to a group though
C25 C25AXLAG2 N 1 0 N AXLes in Axle Group 2 -- Number of axles in the 2st
group of axles on the truck 12 = number of axles
C25 C25AXLAG3 N 2 0 N AXLes in Axle Group 3 -- Number of axles in the 3rd group of axles on the truck 0 = not applicable (no 3rd group) 12 = number of axles
C25 C25AXLAG4 N 2 0 N AXLes in Axle Group 4 --Same answers as for AXLes in Axle Group 3
C25 C25AXLAG5 N 2 0 N AXLes in Axle Group 5 --Same answers as for AXLes in Axle Group 3
C25 C25AXLAG6 N 2 0 N AXLes in Axle Group 6 --Same answers as for AXLes in Axle Group 3
Interprovincial Roadside Truck Survey Technical Appendices 16
Answer Output Database Fields Reference Field Information
Questi- Name Type Length onnaire Decimals Index C25 C25AXLAG7 N 2 0 N AXLes in Axle Group 7 --Same answers as for
AXLes in Axle Group 3 C25 C25AXLAG8 N 2 0 N AXLes in Axle Group 8 --Same answers as for
AXLes in Axle Group 3 C25 C25AXLALL N 2 0 N AXLes ALL -- Total number of axles on the truck
1212 = Number of axles C26 C26UPAG1 N 1 0 N UP axles in Axle Group 1 -- Number of axles that
are lifted (raised so they are not in contact with the ground) in the 1st group of axles on the truck 0 = no axles are lifted 12 = number of axles lifted
C26 C26UPAG2 N 1 0 N UP axles in Axle Group 2 -- Same answers as for UP axles in Axle Group 1
C26 C26UPAG3 N 2 0 N UP axles in Axle Group 3 -- Number of axles that are lifted in the 3rd group of axles on the truck 0 = no axles are lifted or not applicable (no 3rd
group) 12 = number of axles lifted Note To decide whether ldquo0rdquo means ldquono axles liftedrdquo or means ldquonot applicablerdquo check C25AXLAG3 to determine if the 3rd axle group exists
C26 C26UPAG4 N 2 0 N UP axles in Axle Group 4 -- Same answers as for UP axles in Axle Group 3
C26 C26UPAG5 N 2 0 N UP axles in Axle Group 5 -- Same answers as for UP axles in Axle Group 3
C26 C26UPAG6 N 2 0 N UP axles in Axle Group 6 -- Same answers as for UP axles in Axle Group 3
C26 C26UPAG7 N 2 0 N UP axles in Axle Group 7 -- Same answers as for UP axles in Axle Group 3
C26 C26UPAG8 N 2 0 N UP axles in Axle Group 8 -- Same answers as for UP axles in Axle Group 3
C26 C26UPALL N 1 0 N UP axles ALL -- Total number of axles that are lifted on the truck 0 = no axles are lifted 129 = number of axles lifted
D Interview Start Section
D01 D01AGREE C 1 0 N AGREEs to interview -- Whether driver agrees to participate in an interview Y = Yes N = No
D02 D02REFUSE C 40 0 N REFUSE -- Reason given by driver for refusing to be interviewed blank = not applicable (driver agreed to interview) something = reason for refusing
Interprovincial Roadside Truck Survey Technical Appendices 17
Answer Output Database Fields Reference Field Information
Questi- Name Type Length onnaire Decimals Index D03 D03LANG C 1 0 N LANGuage of driver -- Drivers choice for the
language of the interview E = English F = French
E Interview Part 1 - Vehicle Profile Section E01 E01TBS C 1 0 N Truck Base Status -- Whether an answer is available
Y = Yes (driver identified a base) N = No base (driverrsquos answer) R = driver Refused to answer T = driver Terminated interview before question asked Note The base is the place in Canada US or Mexico where the straight truck or tractor is usually garaged or serviced or the operating centre to which it is assigned Some trucks may not be based at a specific place
E01 E01TBJUR C 4 0 N Truck Base JURisdiction -- The jurisdiction in which the truck base is located blank = not applicable (see status field) something = jurisdiction code The codes are listed in Appendix H
E01 E01TBPLA C 50 0 N Truck Base PLAce -- The name of the place in which the truck base is located blank = not applicable (see status field) something = place name
E01 E01TBID C 11 0 N Truck Base ID -- Unique identifier assigned to the record containing the place name blank = not applicable (see status field) something = identifier Note Identifier is filled automatically by the computer but only if the place is selected from the pick-list
E01 E01TBLON N 11 6 N Truck Base LONgitude -- Longitude of the place 0 = not applicable (see status field) something = longitude Format defined in description of geographic coordinates that precedes this table Note Longitude is filled automatically by the computer but only if the place is selected from the pick-list
E01 E01TBLAT N 11 6 N Truck Base LATitude -- Latitude of the place 0 = not applicable (see status field) something = latitude Format defined in description of geographic coordinates that precedes this table Note Latitude is filled automatically by the computer but only if the place is selected from the pick-list
Interprovincial Roadside Truck Survey Technical Appendices 18
Answer Output Database Fields Reference Field Information
Questishyonnaire
Name Type Length Decimals Index
E02 E02LIFTS C 1 0 N LIFT Status -- Whether the answer is available for the total number of liftable axles on the truck Y = Yes (driver answered 1 or more) N = None (driver answered no lift axles) D = driver Doesnrsquot know the answer R = driver Refused to answer T = driver Terminated interview before question asked Note Liftable axles are counted whether they are currently raised (off the ground) or lowered (on the ground)
E02 E02LIFT N 1 0 N LIFT -- Total number of liftable axles 0 = none or not available (see status field) 12 = total number of liftable axles
E03 E03LENT1S C 1 0 N LENgth of Trailer 1 Status -- Whether the answer is available for the length of the 1st trailer Y = Yes D = driver Doesnrsquot know the answer R = driver Refused to answer T = driver Terminated interview before question asked X = not applicable (no such trailer)
E03 E03LENT1 N 5 2 N LENgth of Trailer 1 -- Length of the 1st trailer 0 = not applicable (see status field) something = length Note Units of measurement are defined in field E06LENTU
E04 E04LENT2S C 1 0 N LENgth of Trailer 2 Status -- Same answers as for LENgth of Trailer 1 Status
E04 E04LENT2 N 5 2 N LENgth of Trailer 2 -- Same answers as for LENgth of Trailer 1
E05 E05LENT3S C 1 0 N LENgth of Trailer 3 Status -- Same answers as for LENgth of Trailer 1 Status
E05 E05LENT3 N 5 2 N LENgth of Trailer 3 -- Same answers as for LENgth of Trailer 1
E06 E06LENTU C 1 0 N LENgth of Trailer Units -- Units in which the length of the trailers are measured F = Feetinches (digits before the decimal point are feet digits after the decimal point are inches) M = Metres X = not applicable (no trailers or no measurements) T = driver Terminated interview before question asked
Interprovincial Roadside Truck Survey Technical Appendices 19
Answer Output Database Fields Reference Field Information
Questi- Name Type Length onnaire Decimals Index E07 E07LENC1S C 1 0 N LENgth of Container 1 Status -- Whether the answer
is available for the length of the 1st container carried by the truck Y = Yes D = driver Doesnrsquot know the answer R = driver Refused to answer T = driver Terminated interview before question asked X = not applicable Note ldquoNot applicablerdquo if no such container or because the question not asked after being eliminated from the questionnaire
E07 E07LENC1 N 5 2 N LENgth of Container 1 -- Length of the 1st
container 0 = not applicable (see status field) something = length Note Units of measurement are defined in field E10LENCU
E08 E08LENC2S C 1 0 N LENgth of Container 2 Status -- Same answers as for LENgth of Container 1 Status
E08 E08LENC2 N 5 2 N LENgth of Container 2 -- Same answers as for LENgth of Container 1
E09 E09LENC3S C 1 0 N LENgth of Container 3 Status -- Same answers as for LENgth of Container 1 Status
E09 E09LENC3 N 5 2 N LENgth of Container 3 -- Same answers as for LENgth of Container 1
E10 E10LENCU C 1 0 N LENgth of Container Units -- Units in which the length of the containers are measured F = Feetinches (digits before the decimal point are feet digits after the decimal point are inches) M = Metres X = not applicable (no containers or no measurements) T = driver Terminated interview before question asked
E11 E11TACHOG C 1 0 N TACHOGraph -- Whether there is a tachograph on-board the truck Y = Yes N = No R = driver Refused to answer T = driver Terminated interview before question asked Note A tachograph is a mechanical device that records truck speed engine speed and distance travelled It operates by drawing thin lines on a circular card each card covering 24 hours
Interprovincial Roadside Truck Survey Technical Appendices 20
Answer Output Database Fields Reference Field Information
Questi- Name Type Length onnaire Decimals Index E12 E12LOG C 1 0 N electronic drive LOG -- Same answers as for
TACHOGraph Note An electronic drive log is a device that automatically records the hours of oepration of the vehicle in some type of memory Usually it has a keyboard so the driver can enter events that occur
E13 E13COMPUT C 1 0 N COMPUTer -- Same answers as for TACHOGraph Note A computer that is adapted to the environment of the driver cab It is used to enter information on the events of the day
E14 E14TAG C 1 0 N electronic vehicle identification TAG -- Same answers as for TACHOGraph Note An electronic vehicle identification tag is a magnetically encoded device that can be read by equipment located in the roadway or at the roadside The tag contains information about the identity of the truck and the load
E15 E15SATELL C 1 0 N SATELLite -- Same answers as for TACHOGraph Note Satellite based communications use a transmitter-receiver that is usually curcular in shape approximately 15 to 30 centimetres in diameter and located on the roof of the driver cab ovten behind the wind deflector It is used by a carrier to track the location of its truck If equipped with a keyboard and screen in the cab the driver can send and receive information
E16 E16CELLPH C 1 0 N CELLular telePHone -- Same answers as for TACHOGraph Note This covers standard cellular telephones There may or may not be an antenna mounted on the truck
E17 E17PAGER C 1 0 N PAGER -- Same answers as for TACHOGraph Note This covers standard pagers
E18 E18RADIO C 1 0 N company RADIO -- Same answers as for TACHOGraph Note Company radio means a two-way radio that operates on a private frequency dedicated to the company It is used for voice messages between the driver and dispatcher
E19 E19MASTER C 1 0 N tripMASTER -- Same answers as for TACHOGraph Note A TripMaster provides the driver with information about the best route for a trip
Interprovincial Roadside Truck Survey Technical Appendices 21
Answer Output Database Fields Reference Field Information
Questi- Name Type Length onnaire Decimals Index E20 E20OTHER C 1 0 N OTHER electronic equipment Whether there is other
electronic equipment on-board the truck Y = Yes N = No R = driver Refused to answer T = driver Terminated interview before question asked X = not applicable Note ldquoNot applicablerdquo because the question was not asked after being eliminated from the questionnaire Note Other electronic equipment covers communications information or recording equipment except electronics equipment that has to do with the operation of the engine transmission suspension or other vehicle systems radar detectors or CB radios
E21 E21OTHERD C 20 0 N OTHER electronic equipment Description blank = not applicable (no ldquootherrdquo) something = description of the ldquootherrdquo electronic equipment
E22 E22MSAS C 1 0 N Manual Slack Adjustors Status -- Whether there are manual slack adjustors on the truck Y = Yes N = No D = driver Doesnrsquot know the answer R = driver Refused to answer T = driver Terminated interview before question asked
E23 E23MSAU1 C 1 0 N Manual Slack Adjustors on Unit 1 -- Whether there are manual slack adjusters on the 1st unit of the truck (straight truck or tractor) Y = Yes N = No D = driver Doesnrsquot know the answer R = driver Refused to answer T = driver Terminated interview before question asked X = not applicable Note ldquoNot applicablerdquo if no manual slack adjusters on truck or if driver refused doesnrsquot know previous answer whether manual slack adjusters on truck
Interprovincial Roadside Truck Survey Technical Appendices 22
Answer Output Database Fields Reference Field Information
Questi- Name Type Length onnaire Decimals Index E24 E24MSAU2 C 1 0 N Manual Slack Adjustors on Unit 2 -- Whether there
are manual slack adjustors on the 2nd unit of the truck (first trailer) Y = Yes N = No D = driver Doesnrsquot know the answer R = driver Refused to answer T = driver Terminated interview before question asked X = not applicable Note ldquoNot applicablerdquo if no 2nd unit on truck or if no manual slack adjusters on truck or if driver refused doesnrsquot know previous answer whether manual slack adjusters on truck
E25 E25MSAU3 C 1 0 N Manual Slack Adjustors on Unit 3 -- Whether there are manual slack adjustors on the 3rd unit of the truck (second trailer) Same answers as for Manual Slack Adjustors on Unit 2
E26 E26MSAU4 C 1 0 N Manual Slack Adjustors on Unit 4 -- Whether there are manual slack adjustors on the 4th unit of the truck (third trailer) Same answers as for Manual Slack Adjustors on Unit 2
E27 E27MSADK C 1 0 N Manual Slack Adjustments Driver Knowledge -shyWhether the driver knows how to make manual slack adjustments Y = Yes N = No R = driver Refused to answer T = driver Terminated interview before question asked Note All drivers are asked even drivers of trucks without manual slack adjusters
E28 E28MSACP C 1 0 N Manual Slack Adjustment Company Policy -shyWhether the truck company allows a driver to make manual slack adjustments Y = Yes N = No D = driver Doesnrsquot know the answer R = driver Refused to answer T = driver Terminated interview before question asked Note All drivers are asked even drivers who do not know how to make manual slack adjustments
Interprovincial Roadside Truck Survey Technical Appendices 23
Answer Output Database Fields Reference Field Information
Questi- Name Type Length onnaire Decimals Index E29 E29ALBS C 1 0 N Anti-Lock Brakes Status -- Whether there are anti-
lock brakes on the truck Y = Yes N = No D = driver Doesnrsquot know the answer R = driver Refused to answer T = driver Terminated interview before question asked
E30 E30ALBU1 C 1 0 N Anti-Lock Brakes on Unit 1 -- Whether there are anti-lock brakes on the 1st unit of the truck (straight truck or tractor) Y = Yes N = No D = driver Doesnrsquot know the answer R = driver Refused to answer T = driver Terminated interview before question asked X = not applicable Note ldquoNot applicablerdquo if no anti-lock brakes on truck or if driver refused doesnrsquot know previous answer whether anti-lock brakes on truck
E31 E31ALBU2 C 1 0 N Anti-Lock Brakes on Unit 2 -- Whether there are anti-lock brakes on the 2nd unit of the truck (first trailer) Y = Yes N = No D = driver Doesnrsquot know the answer R = driver Refused to answer T = driver Terminated interview before question asked X = not applicable Note ldquoNot applicablerdquo if no 2nd unit on truck or if no anti-lock brakes on truck or if driver refused doesnrsquot know previous answer whether anti-lock brakes on truck
E32 E32ALBU3 C 1 0 N Anti-Lock Brakes on Unit 3 -- Whether there are anti-lock brakes on the 3rd unit of the truck (second trailer) Same answers as for Anti-Lock Brakes on Unit 2
E33 E33ALBU4 C 1 0 N Anti-Lock Brakes on Unit 4 -- Whether there are anti-lock brakes on the 4th unit of the truck (third trailer) Same answers as for Anti-Lock Brakes on Unit 2
Interprovincial Roadside Truck Survey Technical Appendices 24
E34
Reference Questishyonnaire
E34ASS
Name
C 1 0 N
Answer Output Database Fields Field
Type Length Decimals Index
Air Suspension Status -- Whether there is air suspension on the truck Y = Yes N = No D = driver Doesnrsquot know the answer R = driver Refused to answer T = driver Terminated interview before question asked
Information
E35 E35ASU1 C 1 0 N Air Suspension on Unit 1 -- Whether there is air suspension on the 1st unit of the truck (straight truck or tractor) Y = Yes N = No D = driver Doesnrsquot know the answer R = driver Refused to answer T = driver Terminated interview before question asked X = not applicable Note ldquoNot applicablerdquo if no air suspension on truck or if driver refused doesnrsquot know previous answer whether air suspension on truck
E36 E36ASU2 C 1 0 N Air Suspension on Unit 2 -- Whether there is air suspension on the 2nd unit of the truck (first trailer) Y = Yes N = No D = driver Doesnrsquot know the answer R = driver Refused to answer T = driver Terminated interview before question asked X = not applicable Note ldquoNot applicablerdquo if no 2nd unit on truck or if no air suspension on truck or if driver refused doesnrsquot know previous answer whether air suspension on truck
E37 E37ASU3 C 1 0 N Air Suspension on Unit 3 -- Whether there is air suspension on the 3rd unit of the truck (second trailer) Same answers as for Air Suspension on Unit 2
E38
F
E38ASU4 C
Interview Part 2 - Commodity Information Section
1 0 N Air Suspension on Unit 4 -- Whether there is air suspension on the 4th unit of the truck (third trailer) Same answers as for Air Suspension on Unit 2
F01 F01CARGO C 1 0 N CARGO -- Whether the truck is carrying cargo Y = Yes N = No D = driver Doesnrsquot know the answer R = driver Refused to answer T = driver Terminated interview before question asked
Interprovincial Roadside Truck Survey Technical Appendices 25
Answer Output Database Fields Reference Field Information
Questi- Name Type Length onnaire Decimals Index F02 F02CAPUSE N 2 0 N CAPacity USEd -- How much of the truckrsquos cargo
capacity is used 1 = frac14 full 2 = frac12full 3 = frac34full 4 = full 96 = not applicable 97 = driver terminated interview before question asked 98 = driver refused to answer 99 = driver does not know the answer Note ldquoNot applicablerdquo if truck is empty or if unknown whether cargo is on-board
F03 F03SPACE C 1 0 N SPACE -- Whether the truck is fully loaded because the space limit has been reached Y = Yes N = No D = driver Doesnrsquot know the answer R = driver Refused to answer X = not applicable T = driver Terminated interview before question asked Note ldquoNot applicablerdquo if truck is not full or if truck is empty or if unknown whether cargo is on-board or if driver refused doesnrsquot know previous answer on capacity used
F04 F04WEIGHT C 1 0 N WEIGHT -- Whether the truck is fully loaded because the weight limit has been reached Same answers as for SPACE
F05 F05PICKUP C 1 0 N PICK-UP -- Whether the cargo was picked up at one address (location) Y = Yes N = No D = driver Doesnrsquot know the answer R = driver Refused to answer X = not applicable T = driver Terminated interview before question asked Note ldquoNot applicablerdquo if truck is empty or if unknown whether cargo is on-board
F06 F06DELIVE C 1 0 N DELIVEred -- Whether the cargo will be delivered to one address (location) Same answers as for PICKshyUP
Interprovincial Roadside Truck Survey Technical Appendices 26
Answer Output Database Fields Reference Field Information
Questi- Name Type Length onnaire Decimals Index F07 F07SHIPS C 1 0 N SHIPments Status -- Whether the number of
shipments on-board is available Y = Yes D = driver Doesnrsquot know the answer R = driver Refused to answer X = not applicable T = driver Terminated interview before question asked Note A shipment is a load going from one shipper to one receiver and may consist of one commodity or several commodities Note A load consisting of one commodity is may or may not be a single shipment It is multiple shipments if the load was collected from more than one shipper or if the load will be delivered to more than one receiver Note ldquoNot applicablerdquo if truck is empty or if unknown whether cargo is on-board
F07 F07SHIP N 4 0 N SHIPments -- Number of shipments 0 = not applicable (see status field) something = Number
F08 F08AMOACS C 1 0 N AMOunt of All Cargo Status -- Whether a measurement of the amount of all cargo on-board is available Y = Yes D = driver Doesnrsquot know the answer R = driver Refused to answer X = not applicable T = driver Terminated interview before question asked Note ldquoNot applicablerdquo if truck is empty or if unknown whether cargo is on-board
F08 F08AMOAC N 6 0 N AMOunt of All Cargo -- The weight or volume of all cargo on-board 0 = not applicable (see status field) something = amount Note Units of measurement are defined in field F09AMOACU
F09 F09AMOACU N 2 0 N AMOunt of All Cargo Units -- Units in which the amount of cargo is measured 1 = kilograms 2 = pounds 3 = litres 4 = gallons 96 = not applicable (see status field) 97 = driver Terminated interview before question asked
Interprovincial Roadside Truck Survey Technical Appendices 27
Answer Output Database Fields Reference Field Information
Questi- Name Type Length onnaire Decimals Index F10 F10ONECOM C 1 0 N ONE COMmodity -- Whether the cargo consists of
one commodity Y = Yes N = No D = driver Doesnrsquot know the answer R = driver Refused to answer X = not applicable T = driver Terminated interview before question asked Note ldquoNot applicablerdquo if truck is empty or if unknown whether cargo is on-board
F11 F11CATC1S C 1 0 N CATegory of Commodity 1 Status -- Whether the category of the 1st largest commodity on-board is available Y = Yes D = driver Doesnrsquot know the answer R = driver Refused to answer X = not applicable T = driver Terminated interview before question asked Note Size (ldquolargerdquo) is measured by amount of the commodity Note ldquoNot applicablerdquo if truck is empty or if unknown whether cargo is on-board
F11 F11CATC1 C 40 0 N CATegory of Commodity 1 -- Description of the category of the 1st largest commodity blank = not applicable (see status field) something = description
F12 F12AMOC1S C 1 0 N AMOunt of Commodity 1 -- Whether a measurement of the amount of the 1st largest commodity is available Y = Yes D = driver Doesnrsquot know the answer R = driver Refused to answer X = not applicable T = driver Terminated interview before question asked Note ldquoNot applicablerdquo if truck is empty or if unknown whether cargo is on-board
F12 F12AMOC1 N 6 0 N AMOunt of Commodity 1 -- The weight or volume of the 1st largest commodity 0 = not applicable (see status field) something = amount Note Units of measurement are defined in field F13AMOC1U
Interprovincial Roadside Truck Survey Technical Appendices 28
Answer Output Database Fields Reference Field Information
Questi- Name Type Length onnaire Decimals Index F13 F13AMOC1U N 2 0 N AMOunt of Commodity 1 Units -- Units in which
the amount of the 1st largest commodity is measured 1 = kilograms 2 = pounds 3 = litres 4 = gallons 96 = not applicable (see status field) 97 = driver Terminated interview before question asked
F14 F14OC1S C 1 0 N Origin of Commodity 1 Status -- Whether the origin of shipment of the 1st largest commodity is available Y = Yes D = driver Doesnrsquot know the answer R = driver Refused to answer X = not applicable T = driver Terminated interview before question asked Note The origin is the place in the world where the shipper put the cargo on the transportation system The waybill or the bill of lading should list the origin Note ldquoNot applicablerdquo if truck is empty or if unknown whether cargo is on-board
F14 F14OC1JUR C 4 0 N Origin of Commodity 1 JURisdiction -- The jurisdiction in which the shipment origin is located blank = not applicable (see status field) something = jurisdiction code The codes are listed in Appendix H
F14 F14OC1PLA C 50 0 N Origin of Commodity 1 PLAce -- The name of the place in which the shipment origin is located blank = not applicable (see status field) something = place name
F14 F14OC1ID C 11 0 N Origin of Commodity 1 ID -- Unique identifier assigned to the record containing the place name blank = not applicable (see status field) something = identifier Note Identifier is filled automatically by the computer but only if the place is selected from the pick-list
F14 F14OC1LON N 11 6 N Origin of Commodity 1 LONgitude -- Longitude of the place 0 = not applicable (see status field) something = longitude Format defined in description of geographic coordinates that precedes this table Note Longitude is filled automatically by the computer but only if the place is selected from the pick-list
Interprovincial Roadside Truck Survey Technical Appendices 29
Answer Output Database Fields Reference Field Information
Questi- Name Type Length onnaire Decimals Index F14 F14OC1LAT N 11 6 N Origin of Commodity 1 LATitude -- Latitude of the
place 0 = not applicable (see status field) something = latitude Format defined in description of geographic coordinates that precedes this table Note Latitude is filled automatically by the computer but only if the place is selected from the pick-list
F15 F15DC1S C 1 0 N Destination of Commodity 1 Status -- Same answers as for Origin of Commodity 1 Status Note The destination is the place in the world where the receiver will remove the cargo from the transportation system The waybill or the bill of lading should list the destination
F15 F15DC1JUR C 4 0 N Destination of Commodity 1 JURisdiction -- Same answers as for Origin of Commodity 1 JURisdiction
F15 F15DC1PLA C 50 0 N Destination of Commodity 1 PLAce -- Same answers as for Origin of Commodity 1 PLAce
F15 F15DC1ID C 11 0 N Destination of Commodity 1 ID -- Same answers as for Origin of Commodity 1 ID
F15 F15DC1LON N 11 6 N Destination of Commodity 1 LONgitude -- Same answers as for Origin of Commodity 1 LONgitude
F15 F15DC1LAT N 11 6 N Destination of Commodity 1 LATitude -- Same answers as for Origin of Commodity 1 LATitude
F16 F16DGOB C 1 0 N Dangerous Goods On-Board -- Whether there are dangerous goods on-board Y = Yes N = No D = driver Doesnrsquot know the answer R = driver Refused to answer answer X = not applicable T = driver Terminated interview before question asked Note ldquoNot applicablerdquo if truck is empty or if unknown whether cargo is on-board
Interprovincial Roadside Truck Survey Technical Appendices 30
Answer Output Database Fields Reference Field Information
Questi- Name Type Length onnaire Decimals Index F17 F17DGC1CS C 1 0 N Dangerous Goods Commodity 1 Class Status -shy
Whether the class of the 1st largest dangerous goods commodity is available Y = Yes D = driver Doesnrsquot know the answer R = driver Refused to answer answer X = not applicable blank = not applicable Note ldquoNot applicable=Xrdquo if no dangerous goods on-board or if truck is empty or if driver refused doesnrsquot know previous answer whether dangerous goods on-board Note ldquoNot applicable=blankrdquo because the question was not asked until being added to the questionnaire software
F17 F17DGC1C N 3 1 N Dangerous Goods Commodity 1 Class -- The class of the 1st largest dangerous goods commodity 00 = unknown or not applicable something = class Dangerous goods classes are listed in Appendix H Note See note under Dangerous Goods Commodity 1 UN number Note Size (ldquolargerdquo) is measured by amount of the commodity Note ldquoNot applicablerdquo if no dangerous goods on-board or if truck is empty or if unknown whether cargo is on-board or if driver refused doesnrsquot know previous answer whether dangerous goods on-board or if interview terminated
F18 F17DGC1UNS C 1 0 N Dangerous Goods Commodity 1 UN number Status shy- Whether the UN number of the 1st largest dangerous goods commodity is available Y = Yes D = driver Doesnrsquot know the answer R = driver Refused to answer answer X = not applicable blank = not applicable Note ldquoNot applicablerdquo if no dangerous goods on-board or if truck is empty or if driver refused doesnrsquot know previous answer whether dangerous goods on-board Note ldquoNot applicable=blankrdquo because the question was not asked until being added to the questionnaire software
Interprovincial Roadside Truck Survey Technical Appendices 31
Answer Output Database Fields Reference Field Information
Questi- Name Type Length onnaire Decimals Index F18 F18DGC1UN C 8 0 N Dangerous Goods Commodity 1 UN number -- The
UN number of the 1st largest dangerous goods commodity blank = not applicable something = number or the word UNKNOWN Dangerous goods UN numbers are listed in Appendix H Note The computer program requires that a UN Number or a Class be entered if the answer to Dangerous Goods On-Board is Yes If neither the UN number nor the class is known the surveyors are been directed to enter UNKNOWN in the UN number field Note ldquoNot applicablerdquo if no dangerous goods on-board or if truck is empty or if unknown whether cargo is on-board or if driver refused doesnrsquot know previous answer whether dangerous goods on-board or if interview terminated
G Interview Part 3 - Carrier Information Section G01 G01CTYPE N 2 0 N Company TYPE -- Type of trucking company
1 = for-hire 2 = private 97 = driver Terminated interview before question asked 98 = driver Refused to answer 99 = driver Doesnrsquot know the answer Note A for-hire trucking company earns its money by transporting cargo belonging to someone else A private trucking company is part of a parent company such as a retailer or a manufacturer and exists to transport cargo belonging to the parent company
G02 G02PRIFH C 1 0 N PRIvate company carrying cargo For-Hire -- Whether the private trucking company is carrying cargo for-hire on this trip Y = Yes N = No D = driver Doesnrsquot know the answer R = driver Refused to answer X = not applicable Note A private trucking company is mainly engaged in transporting the cargo of its parent company but on occasion will carry cargo on a for-hire basis (to minimize empty mileage) Note ldquoNot applicablerdquo if trucking company is for-hire or if truck is empty or if unknown whether cargo is on-board or if driver refused doesnrsquot know previous answer on company type or if interview terminated
Interprovincial Roadside Truck Survey Technical Appendices 32
Answer Output Database Fields Reference Field Information
Questi- Name Type Length onnaire Decimals Index G03 G03CDS C 1 0 N Company Dispatch centre Status -- Whether an
answer is available Y = Yes (driver identified a base) N = No dispatch centre (driverrsquos answer) R = driver Refused to answer T = driver Terminated interview before question asked X = not applicable Note ldquoNot applicablerdquo because the question was not asked after being eliminated from the questionnaire Note The dispatch centre is the trucking company office that coordinates the driverrsquos work (provides instructions on where to pick-up and deliver cargo tracks the progress of the cargo) It is located in Canada US or Mexico A driver does not necessarily deal with a dispatch centre
G03 G03CDJUR C 4 0 N Company Dispatch centre JURisdiction -- The jurisdiction in which the dispatch centre is located blank = not applicable (see status field) something = jurisdiction code The codes are listed in Appendix H
G03 G03CDPLA C 50 0 N Company Dispatch centre PLAce -- The name of the place in which the dispatch centre is located blank = not applicable (see status field) something = place name
G03 G03CDID C 11 0 N Company Dispatch centre ID -- Unique identifier assigned to the record containing the place name blank = not applicable (see status field) something = identifier Note Identifier is filled automatically by the computer but only if the place is selected from the pick-list
G03 G03CDLON N 11 6 N Company Dispatch centre LONgitude -- Longitude of the place 0 = not applicable (see status field) something = longitude Format defined in description of geographic coordinates that precedes this table Note Longitude is filled automatically by the computer but only if the place is selected from the pick-list
G03 G03CDLAT N 11 6 N Company Dispatch centre LATitude -- Latitude of the place 0 = not applicable (see status field) something = latitude Format defined in description of geographic coordinates that precedes this table Note Latitude is filled automatically by the computer but only if the place is selected from the pick-list
Interprovincial Roadside Truck Survey Technical Appendices 33
Answer Output Database Fields Reference Field Information
Questi- Name Type Length onnaire Decimals Index
H Interview Part 4 - Trip Information Section H01 H01TRITYP C 1 0 N TRIp TYPe -- Whether the trip is a linehaul or a
peddle run P = Peddle run L = Linehaul R = driver Refused to answer T = driver Terminated interview before question asked Note A linehaul trip transports the entire cargo load from one point to another point A peddle run makes stops for cargo pick-up and delivery between its first cargo pick-up point and last cargo delivery point See discussion of trip definition that precedes this table
H02 H02TRISTOS C 1 0 N TRIp STOps Status -- Whether the number of stops on the peddle run is available Y = Yes D = driver Doesnrsquot know the answer R = driver Refused to answer X = not applicable T = driver Terminated interview before question asked Note ldquoNot applicablerdquo if not a peddle run or if driver refused previous answer on trip type
H02 H02TRISTO N 2 0 N TRIp STOps -- Number of stops on the peddle run 0 = not applicable (see status field) something = number
H03 H03SECOND C 1 0 N SECOND -- Whether there is a second driver on-board the truck so that the trip is being driven by a driver team Y = Yes N = No R = driver Refused to answer T = driver Terminated interview before question asked
H04 H04TOS C 1 0 N Trip Origin Status -- Whether an answer is available Y = Yes (driver identified a base) D = driver Doesnrsquot know the answer R = driver Refused to answer T = driver Terminated interview before question asked Note The trip origin is a location in Canada US or Mexico See discussion of trip definition that preceeds this table
H04 H04TOJUR C 4 0 N Trip Origin JURisdiction -- The jurisdiction in which the trip origin is located blank = not applicable (see status field) something = jurisdiction code The codes are listed in Appendix H
Interprovincial Roadside Truck Survey Technical Appendices 34
Answer Output Database Fields Reference Field Information
Questi- Name Type Length onnaire Decimals Index H04 H04TOPLA C 50 0 N Trip Origin PLAce -- The name of the place in which
the trip origin is located blank = not applicable (see status field) something = place name
H04 H04TOID C 11 0 N Trip Origin ID -- Unique identifier assigned to the record containing the place name blank = not applicable (see status field) something = identifier Note Identifier is filled automatically by the computer but only if the place is selected from the pick-list
H04 H04TOLON N 11 6 N Trip Origin LONgitude -- Longitude of the place 0 = not applicable (see status field) something = longitude Format defined in description of geographic coordinates that precedes this table Note Longitude is filled automatically by the computer but only if the place is selected from the pick-list
H04 H04TOLAT N 11 6 N Trip Origin LATitude -- Latitude of the place 0 = not applicable (see status field) something = latitude Format defined in description of geographic coordinates that precedes this table Note Latitude is filled automatically by the computer but only if the place is selected from the pick-list
H05 H05TOADDS C 1 0 N Trip Origin ADDress Status -- Whether the trip origin address is available or needed Y = Yes D = driver Doesnrsquot know the answer R = driver Refused to answer T = driver Terminated interview before question asked X = not applicable Note ldquoNot applicablerdquo if origin place does not require that the question be asked or if driver refused doesnrsquot know previous answer on origin place
H05 H05TOADD1 C 40 0 N Trip Origin ADDress line 1 blank = not applicable (see status field) something = part of address
H05 H05TOADD2 C 40 0 N Trip Origin ADDress line 2 Same answers as for Trip Origin ADDress line 1
H05 H05TOADD3 C 40 0 N Trip Origin ADDress line 3 Same answers as for Trip Origin ADDress line 1
H06 H06TDS C 1 0 N Trip Destination Status -- Same answers as for Trip Origin Status Note The trip destination is a location in Canada US or Mexico See discussion of trip definition that preceeds this table
Interprovincial Roadside Truck Survey Technical Appendices 35
Answer Output Database Fields Reference Field Information
Questi- Name Type Length onnaire Decimals Index H06 H06TDJUR C 4 0 N Trip Destination JURisdiction -- Same answers as for
Trip Origin JURisdiction H06 H06TDPLA C 50 0 N Trip Destination PLAce -- Same answers as for Trip
Origin PLAce H06 H06TDID C 11 0 N Trip Destination ID -- Same answers as for Trip
Origin ID H06 H06TDLON N 11 6 N Trip Destination LONgitude -- Same answers as for
Trip Origin LONgitude H06 H06TDLAT N 11 6 N Trip Destination LATitude -- Same answers as for
Trip Origin LATitude H07 H07TDADDS C 1 0 N Trip Destination ADDress Status Same answers as
for Trip Origin ADDressStatus H07 H07TDADD1 C 40 0 N Trip Destination ADDress line 1 Same answers as
for Trip Origin ADDress line 1 H07 H07TDADD2 C 40 0 N Trip Destination ADDress line 2 Same answers as
for Trip Origin ADDress line 2 H07 H07TDADD3 C 40 0 N Trip Destination ADDress line 3 Same answers as
for Trip Origin ADDress line 3 H08 H08LSS C 1 0 N Last Stop Status -- Whether an answer is available on
the location of the last stop made before the DCS Y = Yes (driver identified a base) D = driver Doesnrsquot know the answer R = driver Refused to answer T = driver Terminated interview before question asked Note The last stop is a location in Canada US or Mexico See discussion of trip definition that preceeds this table
H08 H08LSJUR C 4 0 N Last Stop JURisdiction -- The jurisdiction in which the last stop was made blank = not applicable (see status field) something = jurisdiction code The codes are listed in Appendix H
H08 H08LSPLA C 50 0 N Last Stop PLAce -- The name of the place in which the last stop was made blank = not applicable (see status field) something = place name
H08 H08LSID C 11 0 N Last Stop ID -- Unique identifier assigned to the record containing the place name blank = not applicable (see status field) something = identifier Note Identifier is filled automatically by the computer but only if the place is selected from the pick-list
Interprovincial Roadside Truck Survey Technical Appendices 36
Answer Output Database Fields Reference Field Information
Questi- Name Type Length onnaire Decimals Index H08 H08LSLON N 11 6 N Last Stop LONgitude -- Longitude of the place
0 = not applicable (see status field) something = longitude Format defined in description of geographic coordinates that precedes this table Note Longitude is filled automatically by the computer but only if the place is selected from the pick-list
H08 H08LSLAT N 11 6 N Last Stop LATitude -- Latitude of the place 0 = not applicable (see status field) something = latitude Format defined in description of geographic coordinates that precedes this table Note Latitude is filled automatically by the computer but only if the place is selected from the pick-list
H09 H09NSS C 1 0 N Next Stop Status -- Same answers as for Last Stop Status Note The next stop is a location in Canada US or Mexico See discussion of trip definition that preceeds this table
H09 H09NSJUR C 4 0 N Next Stop JURisdiction -- Same answers as for Last Stop JURisdiction
H09 H09NSPLA C 50 0 N Next Stop PLAce -- Same answers as for Last Stop PLAce
H09 H09NSID C 11 0 N Next Stop ID -- Same answers as for Last Stop ID H09 H09NSLON N 11 6 N Next Stop LONgitude -- Same answers as for Last
Stop LONgitude H09 H09NSLAT N 11 6 N Next Stop LATitude -- Same answers as for Last Stop
LATitude H10 H10EPS C 1 0 N Entered Province crossing Status -- Whether the trip
entered the province territory containing the DCS from another jurisdiction Y = Yes D = driver Doesnrsquot know the answer R = driver Refused to answer X = not applicable (not entering province territory) T = driver Terminated interview before question asked Note The border crossing could be domestic (between Canadian jursidictions) or international (between Canada and the US) Note See discussion of border crossings that precedes this table
Interprovincial Roadside Truck Survey Technical Appendices 37
Answer Output Database Fields Reference Field Information
Questi- Name Type Length onnaire Decimals Index H10 H10EPPLA C 60 0 N Entered Province crossing PLAce -- Description of
the border crossing blank = not applicable (see status field) something = description Note Crossing could be between Canadian two jurisdictions or between a Canadian and a US jurisdiction Note Description consists of name of facility or jurisdiction and place or jurisdiction and highway number from the perspective of either side of the border)
H10 H10EPID C 10 0 N Entered Province crossing ID -- Unique identifier assigned to the border crossing 0 = not applicable (see status field) something = identifier Note Identifier is filled automatically by the computer but only if the location is selected from the pick-list
H10 H10EPLON N 10 6 N Entered Province crossing LONgitude -- Longitude of the border crossing 0 = not applicable (see status field) something = longitude Format defined in description of geographic coordinates that precedes this table Note Longitude is filled automatically by the computer but only if the location is selected from the pick-list
H10 H10EPLAT N 10 6 N Entered Province crossing LATitude -- Latitude of the border crossing 0 = not applicable (see status field) something = latitude Format defined in description of geographic coordinates that precedes this table Note Latitude is filled automatically by the computer but only if the location is selected from the pick-list
Interprovincial Roadside Truck Survey Technical Appendices 38
Answer Output Database Fields Reference Field Information
Questi- Name Type Length onnaire Decimals Index H11 H11LPS C 1 0 N Leaving Province crossing Status -- Whether the trip
will leave the province territory containing the DCS for another jurisdiction Y = Yes D = driver Doesnrsquot know the answer R = driver Refused to answer X = not applicable (not leaving province territory) T = driver Terminated interview before question asked Note The border crossing could be domestic (between Canadian jursidictions) or international (between Canada and the US) Note See discussion of border crossings that precedes this table
H11 H11LPPLA C 60 0 N Leaving Province crossing PLAce Same answers as for Entered Province PLAce
H11 H11LPID C 10 0 N Leaving Province crossing ID -- Same answers as for Entered Province ID
H11 H11LPLON N 10 6 N Leaving Province crossing LONgitude -- Same answers as for Entered Province LONgitude
H11 H11LPLAT N 10 6 N Leaving Province crossing LATitude -- Same answers as for Entered Province LATitude
H12 H12EC1S C 1 0 N Entered Canada crossing 1 Status -- Whether the trip entered Canada from the US at a crossing in a province territory other than the provinceterritory containing the DCS Y = Yes D = driver Doesnrsquot know the answer R = driver Refused to answer X = not applicable (no such crossing) T = driver Terminated interview before question asked Note See discussion of border crossings that precedes this table
H12 H12EC1PLA C 60 0 N Entered Canada crossing 1 PLAce Same answers as for Entered Province PLAce
H12 H12EC1ID C 10 0 N Entered Canada crossing 1 ID -- Same answers as for Entered Province ID
H12 H12EC1LON N 10 6 N Entered Canada crossing 1 LONgitude -- Same answers as for Entered Province LONgitude
H12 H12EC1LAT N 10 6 N Entered Canada crossing 1 LATitude -- Same answers as for Entered Province LATitude
Interprovincial Roadside Truck Survey Technical Appendices 39
Answer Output Database Fields Reference Field Information
Questi- Name Type Length onnaire Decimals Index H13 H13EC2S C 1 0 N Entered Canada crossing 2 Status -- Whether the
trip entered Canada from the US at a 2nd crossing in a province territory other than the provinceterritory containing the DCS Y = Yes D = driver Doesnrsquot know the answer R = driver Refused to answer X = not applicable (no such crossing) T = driver Terminated interview before question asked Note See discussion of border crossings that precedes this table
H13 H13EC2PLA C 60 0 N Entered Canada crossing 2 PLAce Same answers as for Entered Province PLAce
H13 H13EC2ID C 10 0 N Entered Canada crossing 2 ID -- Same answers as for Entered Province ID
H13 H13EC2LON N 10 6 N Entered Canada crossing 2 LONgitude -- Same answers as for Entered Province LONgitude
H13 H13EC2LAT N 10 6 N Entered Canada crossing 2 LATitude -- Same answers as for Entered Province LATitude
H14 H14LC1S C 1 0 N Leaving Canada crossing 1 Status -- Whether the trip will leave Canada for the US at a crossing in a province territory other than the provinceterritory containing the DCS Y = Yes D = driver Doesnrsquot know the answer R = driver Refused to answer X = not applicable (no such crossing) T = driver Terminated interview before question asked Note See discussion of border crossings that precedes this table
H14 H14LC1PLA C 60 0 N Leaving Canada crossing 1 PLAce Same answers as for Entered Province PLAce
H14 H14LC1ID C 10 0 N Leaving Canada crossing 1 ID -- Same answers as for Entered Province ID
H14 H14LC1LON N 10 6 N Leaving Canada crossing 1 LONgitude -- Same answers as for Entered Province LONgitude
H14 H14LC1LAT N 10 6 N Leaving Canada crossing 1 LATitude -- Same answers as for Entered Province LATitude
Interprovincial Roadside Truck Survey Technical Appendices 40
Answer Output Database Fields Reference Field Information
Questi- Name Type Length onnaire Decimals Index H15 H15LC2S C 1 0 N Leaving Canada crossing 2 Status -- Whether the
trip will leave Canada for the US at a 2nd crossing in a province territory other than the provinceterritory containing the DCS Y = Yes D = driver Doesnrsquot know the answer R = driver Refused to answer X = not applicable (no such crossing) T = driver Terminated interview before question asked Note See discussion of border crossings that precedes this table
H15 H15LC2PLA C 60 0 N Leaving Canada crossing 2 PLAce Same answers as for Entered Province PLAce
H15 H15LC2ID C 10 0 N Leaving Canada crossing 2 ID -- Same answers as for Entered Province ID
H15 H15LC2LON N 10 6 N Leaving Canada crossing 2 LONgitude -- Same answers as for Entered Province LONgitude
H15 H15LC2LAT N 10 6 N Leaving Canada crossing 2 LATitude -- Same answers as for Entered Province LATitude
H16 H16UM1S C 1 0 N UsMexico crossing 1 Status -- Whether the trip will cross the USMexico border Y = Yes D = driver Doesnrsquot know the answer R = driver Refused to answer X = not applicable (no such crossing) T = driver Terminated interview before question asked Note See discussion of border crossings that precedes this table
H16 H16UM1PLA C 60 0 N UsMexico crossing 1 PLAce Same answers as for Entered Province PLAce
H16 H16UM1ID C 10 0 N UsMexico crossing 1 ID -- Same answers as for Entered Province ID
H16 H16UM1LON N 10 6 N UsMexico crossing 1 LONgitude -- Same answers as for Entered Province LONgitude
H16 H16UM1LAT N 10 6 N UsMexico crossing 1 LATitude -- Same answers as for Entered Province LATitude
H17 H17HWYS C 1 0 N HighWaY route Status -- Whether the highways on the trip route are available Y = Yes D = driver Doesnrsquot know the answer R = driver Refused to answer T = driver Terminated interview before question asked X = not applicable Note ldquoNot applicablerdquo if jurisdiction containing the DCS does not require that the question be asked Note ldquoYesrdquo is triggered if something has been entered in H17HWY1
Interprovincial Roadside Truck Survey Technical Appendices 41
Answer Output Database Fields Reference Field Information
Questi- Name Type Length onnaire Decimals Index H17 H17HWY1 C 40 0 N HighWaY route line 1
blank = not applicable (see status field) something = highway description
H17 H17HWY2 C 40 0 N HighWaY route line 2 blank = none or not applicable (see status field) something = highway description
H17 H17HWY3 C 40 0 N HighWaY route line 3 Same answers as for HighWaY route line 2
H17 H17HWY4 C 40 0 N HighWaY route line 4 Same answers as for HighWaY route line 2
H17 H17HWY5 C 40 0 N HighWaY route line 5 Same answers as for HighWaY route line 2
H17 H17HWY6 C 40 0 N HighWaY route line 6 Same answers as for HighWaY route line 2
H17 H17HWY7 C 40 0 N HighWaY route line 7 Same answers as for HighWaY route line 2
H18 H18PTOD C 1 0 N Previous Trip Origin and Destination -- Whether the origin and destination of the previous trip were the same as the origin and destination of the current trip Y = Yes N = No D = driver Doesnrsquot know the answer R = driver Refused to answer T = driver Terminated interview before question asked X = not applicable Note ldquoNot applicablerdquo because the question was not asked after being eliminated from the questionnaire
H19 H19PTHWY C 1 0 N Previous Trip HighWaYs -- Whether the highways used on the previous trip were the sme as the highways used on the current trip Y = Yes N = No D = driver Doesnrsquot know the answer R = driver Refused to answer X = not applicable T = driver Terminated interview before question asked Note ldquoNot applicablerdquo if previous trip origin or destination different or if driver refused doesnrsquot know previous answer on previous trip origin destination or if previous question was not asked
Interprovincial Roadside Truck Survey Technical Appendices 42
Answer Output Database Fields Reference Field Information
Questi- Name Type Length onnaire Decimals Index H20 H20TSDATES C 1 0 N Trip Start DATE Status -- Whether the date on which
the trip started from the trip origin is available Y = Yes D = driver Doesnrsquot know the answer R = driver Refused to answer T = driver Terminated interview before question asked X = not applicable Note ldquoNot applicablerdquo because the question was not asked after being eliminated from the questionnaire
H20 H20TSDATE D 8 0 N Trip Start DATE blank = not applicable (see status field) something = date Format YYYYMMDD
H21 H21TSHOURS C 1 0 N Trip Start HOUR Status -- Whether the hour during which the trip started from the trip origin is available Y = Yes D = driver Doesnrsquot know the answer R = driver Refused to answer T = driver Terminated interview before question asked X = not applicable Note ldquoNot applicablerdquo because the question was not asked after being eliminated from the questionnaire
H21 H21TSHOUR N 2 0 N Trip Start HOUR blank = not applicable (see status field) something = hour Format 24 hour clock
H22 H22TSINT C 1 0 N Trip Start cargo INTerlined -- Whether the cargo picked-up at the trip start was received from another trucking company Y = Yes N = No D = driver Doesnrsquot know the answer R = driver Refused to answer X = not applicable T = driver Terminated interview before question asked Note ldquoNot applicablerdquo if no cargo on-board or because the question was not asked after being eliminated from the questionnaire Note The interlining could be accomplished by transferring the cargo itself from one truck to another or by transfering the trailer containing the cargo from one company to another
Interprovincial Roadside Truck Survey Technical Appendices 43
Answer Output Database Fields Reference Field Information
Questi- Name Type Length onnaire Decimals Index H23 H23TSFAC N 2 0 N Trip Start FACility -- The type of facility at which the
trip started 1 = Truck Terminal - Your Carrier 2 = Truck Terminal - Another Carrier 3 = Rail Terminal 4 = Marine Terminal 5 = Airport Terminal 6 = Primary Producer 7 = Manufacturer 8 = WarehouseDistribution Centre 9 = Retail Outlet 95 = Other 97 = driver Terminated interview before question asked 98 = driver Refused to answer 99 = driver Doesnrsquot know the answer
H24 H24TSFACD C 20 0 N Trip Start FACility Description blank = not applicable (see status field) something = description of ldquootherrdquo type of facility
H25 H25TEDATES C 1 0 N Trip End DATE Status -- Whether the date on which the trip will end at the trip destination is available Same answers as for Trip Start DATE Status
H25 H25TEDATE D 8 0 N Trip End DATE -- Same answers as for Trip Start DATE
H26 H26TEHOURS C 1 0 N Trip End HOUR Status -- Same answers as for Trip Start HOUR Status
H26 H26TEHOUR N 2 0 N Trip End HOUR -- Same answers as for Trip Start HOUR
H27 H27TEINT C 1 0 N Trip End cargo INTerlined -- Same answers as for Trip End cargo INTerlined
H28 H28TEFAC N 2 0 N Trip End FACility -- Same answers as for Trip Start FACility
H29 H29TEFACD C 20 0 N Trip End FACility Description -- Same answers as for Trip Start FACility Description
I Interview Part 5 - Driver Information Section I01 I01DBS C 1 0 N Driver Base Status -- Whether an answer is available
Y = Yes (driver identified a base) N = No base (driverrsquos answer) R = driver Refused to answer T = driver Terminated interview before question asked Note The base is the place in Canada US or Mexico where the driver lives
Interprovincial Roadside Truck Survey Technical Appendices 44
Answer Output Database Fields Reference Field Information
Questi- Name Type Length onnaire Decimals Index I01 I01DBJUR C 4 0 N Driver Base JURisdiction -- The jurisdiction in which
the driver base is located blank = not applicable (see status field) something = jurisdiction code The codes are listed in Appendix H
I01 I01DBPLA C 50 0 N Truck Base PLAce -- The name of the place in which the driver base is located blank = not applicable (see status field) something = place name
I01 I01DBID C 11 0 N Driver Base ID -- Unique identifier assigned to the record containing the place name blank = not applicable (see status field) something = identifier Note Identifier is filled automatically by the computer but only if the place is selected from the pick-list
I01 I01DBLON N 11 6 N Driver Base LONgitude -- Longitude of the place 0 = not applicable (see status field) something = longitude Format defined in description of geographic coordinates that precedes this table Note Longitude is filled automatically by the computer but only if the place is selected from the pick-list
I01 I01DBLAT N 11 6 N Driver Base LATitude -- Latitude of the place 0 = not applicable (see status field) something = latitude Format defined in description of geographic coordinates that precedes this table Note Latitude is filled automatically by the computer but only if the place is selected from the pick-list
I02 I02OWNER C 1 0 N OWNER -- Whether driver owns the straight truck or tractor Y = Yes N = No R = driver Refused to answer T = driver Terminated interview before question asked
Interprovincial Roadside Truck Survey Technical Appendices 45
Answer Output Database Fields Reference Field Information
Questi- Name Type Length onnaire Decimals Index I03 I03CONTRA C 1 0 N CONTRAct -- Whether the driver-owner of the truck
has a contract with a trucking company to haul cargo for that company Y = Yes N = No R = driver Refused to answer X = not applicable T = driver Terminated interview before question asked Note ldquoNot applicablerdquo if the driver is not the owner of the truck or if the driver refused to answer the previous question on truck ownership
I04 I04EMPLOY C 1 0 N EMPLOYer -- What type of company is the employer of a driver-non-owner C = Trucking Company L = Leasing Agency O = Other R = driver Refused to answer X = not applicable T = driver Terminated interview before question asked Note ldquoNot applicablerdquo if the driver is the owner of the truck or if the driver refused to answer the previous question on truck ownership
I05 I05OTHER C 20 0 N OTHER -- Description of the employer type if it was classified as Other blank = not applicable something = description
I06 I06AGES C 1 0 N AGE Status -- Whether the driverrsquos age is available Y = Yes R = driver Refused to answer T = driver Terminated interview before question asked
I06 I06AGE N 2 0 N AGE 0 = not applicable (see status field) something = age in years
I07 I07DRITOTS C 1 0 N DRIving TOTal Status -- Availability of how many years the driver has driven a truck for a living Y = Yes L = yes -- Less than 1 year D = driver Doesnrsquot know the answer R = driver Refused to answer T = driver Terminated interview before question asked
I07 I07DRITOT N 2 0 N DRIving TOTal 0 = none or less than 1 or not available (see status field) something = years of driving
Interprovincial Roadside Truck Survey Technical Appendices 46
Answer Output Database Fields Reference Field Information
Questi- Name Type Length onnaire Decimals Index I08 I08DRICONS C 1 0 N DRIving CONfiguration Status -- Availability of how
many years the driver has driven the observed configuration of truck for a living Y = Yes L = yes -- Less than 1 year D = driver Doesnrsquot know the answer R = driver Refused to answer X = not applicable T = driver Terminated interview before question asked Note ldquoNot applicablerdquo if truck configuration is not a tractor or a tractor-trailer combination
I08 I08DRICON N 2 0 N DRIving CONfiguration 0 = none or less than 1 or not available or not applicable (see status field) something = years of driving
I09 I09NSCRTR C 1 0 N National Safety Code Requirements TRaining -shyWhether in the past 3 years the driver has received at least 1 day of training on the requirements of the National Safety Code Y = Yes N = No R = driver Refused to answer T = driver Terminated interview before question asked Note Training could cover topics such as licences necessary maintaining an hours of service log and performing a daily vehicle trip inspection
I10 I10NSCRSP C 1 0 N National Safety Code Requirements SPonsor -shyWhether the driverrsquos employer sponsored the training Y = Yes N = No X = not applicable R = driver Refused to answer T = driver Terminated interview before question asked Note The driverrsquos employer sponsored the training if the employer paid the cost of the training outside of working hours or if the training occurred during working hours while the driver was being paid Note ldquoNot applicablerdquo if no training or if driver refused previous answer whether training received or because the question was not asked after being eliminated from the questionnaire
Interprovincial Roadside Truck Survey Technical Appendices 47
Answer Output Database Fields Reference Field Information
Questi- Name Type Length onnaire Decimals Index I11 I11DGHTR C 1 0 N Dangerous Goods Handling TRaining -shy Same
answers as for National Safety Code Requirements TRaining Note Training could cover topics such as documents and safety markings necessary handling characteristics of the product and responding to an emergency
I12 I12DGHSP C 1 0 N Dangerous Goods Handling SPonsor -shy Same answers as for National Safety Code Requirements SPonsor
I13 I13DSTR C 1 0 N Driving Skills TRaining -shy Same answers as for National Safety Code Requirements TRaining Note Training culd cover topics such as recognizing unsafe practices handling characteristics of the vehicle configuration and driving techniques to increase efficiency Not included is vehicle maintenance training
I14 I14DSSP C 1 0 N Driving Skills SPonsor -shy Same answers as for National Safety Code Requirements SPonsor
I15 I15BSTR C 1 0 N Business Skills TRaining -shy Same answers as for National Safety Code Requirements TRaining Note Training could cover topics such as dealing with customers tracking and analysing costs and revenues and understanding contracts
I16 I16BSSP C 1 0 N Business Skills SPonsor -shy Same answers as for National Safety Code Requirements SPonsor
I17 I17EEUTR C 1 0 N Electronic Equipment Usage TRaining -shy Same answers as for National Safety Code Requirements TRaining Note Training could cover topics such as purpose and use of communications and information recording equipment
I18 I18EEUSP C 1 0 N Electronic Equipment Usage SPonsor -shy Same answers as for National Safety Code Requirements SPonsor
J Weights and Measures Section J01 J01COUS C 1 0 N COUnt of axle groupings weighed Status -- Whether
the axles are weighted in groups that are the same as or different from the groups recorded in C25AXLAG1 through C25AXLAG8 M = Modified (weighed groupings of axles different from recorded axle groups) S = Same (weighed in same groupings) X = not applicable (no weight information available)
Interprovincial Roadside Truck Survey Technical Appendices 48
Answer Output Database Fields Reference Field Information
Questi- Name Type Length onnaire Decimals Index J01 J01COUAG1 N 1 0 N COUnt of Axles in weighed Grouping 1 -- How
many axles are in the 1st grouping to be weighed 12 = number of axles (including lifted axles) Note The number of axles includes any axles in the grouping that are lifted at the time of the weighing
J01 J01COUAG2 N 1 0 N COUnt of Axles in weighed Grouping 2 -- Same answers as for COUnt of Axles in weighed Group 1
J01 J01COUAG3 N 2 0 N COUnt of Axles in weighed Grouping 3 How many axles are in the 3rd grouping to be weighed 12 = number of axles 96 = not applicable (no 3rd group)
J01 J01COUAG4 N 2 0 N COUnt of Axles in weighed Grouping 4 -- Same answers as for COUnt of Axles in weighed Group 3
J01 J01COUAG5 N 2 0 N COUnt of Axles in weighed Grouping 5 -- Same answers as for COUnt of Axles in weighed Group 3
J01 J01COUAG6 N 2 0 N COUnt of Axles in weighed Grouping 6 -- Same answers as for COUnt of Axles in weighed Group 3
J01 J01COUAG7 N 2 0 N COUnt of Axles in weighed Grouping 7 -- Same answers as for COUnt of Axles in weighed Group 3
J01 J01COUAG8 N 2 0 N COUnt of Axles in weighed Grouping 8 -- Same answers as for COUnt of Axles in weighed Group 3
J02 J02WEIS C 1 0 N WEIght Status -- Whether the weight of the truck is available Y = Yes N = No
J02 J02WEIAG1 N 5 0 N WEIght for Axles in Grouping 1 -- Weight of the 1st
grouping of axles to be weighed 0 = not applicable (see status field) something = weight Note Units of measurement are defined in field J02WEIU
J02 J02WEIAG2 N 5 0 N WEIght for Axles in Grouping 2 -- Weight of the 2nd
grouping of axles to be weighed 0 = zero or not applicable something = weight Note Units of measurement are defined in field J02WEIU Note ldquoZerordquo means that all axles in the grouping are lifted Note ldquoNot applicablerdquo if no such grouping or if weight not available (see status field)
J02 J02WEIAG3 N 5 0 N WEIght for Axles in Grouping 3 -- Same answers as for WEIght for Axles in Groupint 2
J02 J02WEIAG4 N 5 0 N WEIght for Axles in Grouping 4 -- Same answers as for WEIght for Axles in Groupint 2
J02 J02WEIAG5 N 5 0 N WEIght for Axles in Grouping 5 -- Same answers as for WEIght for Axles in Groupint 2
J02 J02WEIAG6 N 5 0 N WEIght for Axles in Grouping 6 -- Same answers as for WEIght for Axles in Groupint 2
Interprovincial Roadside Truck Survey Technical Appendices 49
Answer Output Database Fields Reference Field Information
Questi- Name Type Length onnaire Decimals Index J02 J02WEIAG7 N 5 0 N WEIght for Axles in Grouping 7 -- Same answers
as for WEIght for Axles in Groupint 2 J02 J02WEIAG8 N 5 0 N WEIght for Axles in Grouping 8 -- Same answers
as for WEIght for Axles in Groupint 2 J02 J02WEIALL N 6 0 N WEIght of ALL axles -- Total weight of the truck
0 = not applicable (see status field) something = weight Note Units of measurement are defined in field J02WEIU
J03 J03WEIU C 1 0 N WEIght Units -- Units in which the weight of the truck is measured K = Kilograms P = Pounds X = not applicable (no measurements)
J04 J04MS C 1 0 N Measurement of length Status -- Whether the measurements of the truck length are available Y = Yes N = No
J04 J04MFB N 6 2 N Measurement for Front Bumper -- Reading on the measuring tape for the location of the front bumper 0 = not applicable (see status field) something = reading on tape Note Units of measurement are defined in field J04MU
J04 J04MAXL1 N 6 2 N Measurement for Axle 1 -- Reading on the measuring tape for the location of the 1st axle 0 = not applicable (see status field) something = reading on tape Note Units of measurement are defined in field J04MU
J04 J04MAXL2 N 6 2 N Measurement for Axle 2 Same answers as for Measurement for Axle 1
J04 J04MAXL3 N 6 2 N Measurement for Axle 3 -- Reading on the measuring tape for the location of the 3rd axle 0 = not applicable something = reading on tape Note Units of measurement are defined in field J04MU Note ldquoNot applicablerdquo if no such axle or if measurement not available (see status field)
J04 J04MAXL4 N 6 2 N Measurement for AXLe 4 Same answers as for Measurement for AXLe 1
J04 J04MAXL5 N 6 2 N Measurement for AXLe 5 Same answers as for Measurement for AXLe 1
J04 J04MAXL6 N 6 2 N Measurement for AXLe 6 Same answers as for Measurement for AXLe 1
J04 J04MAXL7 N 6 2 N Measurement for AXLe 7 Same answers as for Measurement for AXLe 1
Interprovincial Roadside Truck Survey Technical Appendices 50
J04
Reference Questishyonnaire J04
J04
J04
J04
J04
J04MBB
Name
J04MAXL8
J04MAXL9
J04MAXL10
J04MAXL11
J04MAXL12
N 6 2 N
Answer Output Database Fields Field
Type Length Decimals Index N 6 2 N
N 6 2 N
N 6 2 N
N 6 2 N
N 6 2 N
Measurement for Back Bumper -- Reading on the measuring tape for the location of the back bumper 0 = not applicable (see status field) something = reading on tape Note Units of measurement are defined in field J04MU
Information
Measurement for AXLe 8 Same answers as for Measurement for AXLe 1 Measurement for AXLe 9 Same answers as for Measurement for AXLe 1 Measurement for AXLe 10 Same answers as for Measurement for AXLe 1 Measurement for AXLe 11 Same answers as for Measurement for AXLe 1 Measurement for AXLe 12 Same answers as for Measurement for AXLe 1
J05 J05MU C 1 0 N Measurement Units -- Units in which the truck length is measured M = Metres F = Feetinches (digits before the decimal point are feet digits after the decimal point are inches) X = not applicable (no measurements)
J06
K K01 K02
J06WEICHES
Early Interview Termination Section
C 1 0 N WEIght CHEck Status -- Whether the check of truck weight against the minimum and maximum criteria for that configuration is active Y = Yes N = No blank = not applicable Note ldquoNot applicablerdquo because the question was not asked before being added to the questionnaire software
See Software Internal Fields section of table See Software Internal Fields section of table
Interprovincial Roadside Truck Survey Technical Appendices 51
Appendix B Heavy Truck Classification System
Interprovincial Roadside Truck Survey Technical Appendices 52
Truck ID Truck Description
1 Tow truck with 2 axles
2 Tow truck with 3 or more axles
3 frac34 or 1 ton pick-up truck with 2 axles
4 Single unit with 2 axles Cube van step van small dump trucks Some types include soft drink companies cabs without trailers amp flatshybed tow trucks
5 Single unit with 3 axles Includes dump trucks cabs without trailers garbage trucks flat-bed trucks with hydraulic arms
6 Single unit truck with 4 or more axles
7 Single unit truck with ldquopuprdquo Usually a 3 or 4 axle truck pulling a 2 or 3 axle pup Also includes some single flat-beds with attached trailer
8 Single trailer with 4 or less axles
9 Single trailer with 5 axles
10 Single trailer with 6 or more axles
11 Multi-trailer with 5 or less axles
12 Multi-trailer with 6 axles
13 Multi-trailer with 7 or more axles
14 Other truck style If a particular heavy truck does not fit any of the above-noted configurations indicate by 14 on your field sheet
Note This truck classification system was used by the former Regional Municipality of Ottawa-Carleton and is consistent with that used in the Outaouais Region
Interprovincial Roadside Truck Survey Technical Appendices 53
Appendix C Summary of Historical Ottawa River Crossing Truck Traffic Volumes
Interprovincial Roadside Truck Survey Technical Appendices 54
Interprovincial Roadside Truck Survey Technical Appendices 55
Heavy Trucks on the Macdonald-Cartier Bridge HEAVY_TRUCKS_Southbound (12H) (24H) HEAVY_TRUCKS_Northbound (12H) (24H) List of count dates
YEAR 2A 3A TT Southbound Southbound 2A 3A TT Northbound Northbound Year Date Day 1991 1071 1360 1083 1375 1991 22 May Wednesday 1992 1133 1439 1017 1292 1992 23 June Tuesday 1993 1004 1275 887 1126 1993 16 June Wednesday 1994 890 1130 1024 1300 1994 21 June Tuesday 1995 848 1077 730 927 1995 22 June Thursday 1996 806 1024 826 1049 1996 4 June Tuesday 1997 981 1246 887 1126 1997 4 June Wednesday 1998 823 1045 920 1169 1998 2 June Tuesday 1999 872 1107 940 1194 1999 2 June Wednesday
1999 323 173 295 791 1005 354 177 315 846 1075 2000 1 June Thursday 2000 988 1255 980 1245
2000 409 268 339 1016 1290 398 268 346 1012 1285
Heavy Trucks on the Chaudiegravere Bridge HEAVY_TRUCKS_Southbound (12H) (24H) HEAVY_TRUCKS_Northbound (12H) (24H) List of count dates
YEAR 2A 3A TT Southbound Southbound 2A 3A TT Northbound Northbound Year Date Day 1991 382 485 423 537 1991 22 May Wednesday 1992 456 579 474 602 1992 23 June Tuesday 1993 335 425 403 512 1993 16 June Wednesday 1994 311 395 339 431 1994 21 June Tuesday 1995 356 452 396 503 1995 22 June Thursday 1996 303 385 336 427 1996 4 June Tuesday 1997 317 403 381 484 1997 3 June Tuesday 1998 236 300 299 380 1998 2 June Tuesday 1999 329 418 405 514 1999 2 June Wednesday
1999 177 87 47 311 395 209 102 51 362 460 2000 1 June Thursday
2000 304 386 355 451 2000 193 71 59 323 410 217 87 59 362 460
Heavy Trucks on the Macdonald-Cartier and Chaudiegravere bridges HEAVY_TRUCKS_Southbound (12H) (24H) HEAVY_TRUCKS_Northbound (12H) (24H)
YEAR 2A 3A TT Southbound Southbound 2A 3A TT Northbound Northbound
1991 1453 1845 1506 1913 1992 1589 2018 1491 1894 1993 1339 1701 1290 1638 1994 1201 1525 1363 1731 1995 1204 1529 1126 1430 1996 1109 1409 1162 1475 1997 1298 1649 1268 1610 1998 1059 1345 1219 1548 1999 1201 1525 1345 1708
1999 500 260 343 1102 1400 563 280 366 1209 1535 2000 1292 1641 1335 1695
2000 602 339 398 1339 1700 614 354 406 1374 1745
Heavy Trucks on the all 5 bridges HEAVY_TRUCKS_Southbound (12H) HEAVY_TRUCKS_Northbound (12H)
YEAR 2A 3A TT Southbound 2A 3A TT Northbound
1991 1681 1741 1992 1771 1834 1993 1514 1522 1994 1473 1636 1995 1346 1366 1996 1252 1300 1997 1444 1440 1998 1195 1369 1999 1347 1486 2000 1411 1456
Source of data Annual Classification and Occupancy Counts Number of vehicles factored to 12 hours from 8 hour counts Roadside Truck Survey Data
Appendix D Time Period Relationships
Interprovincial Roadside Truck Survey Technical Appendices 56
TIME PERIOD RELATIONSHIPS FOR ALL VEHICLES RELATIONSHIP DIRECTION OF TRAVEL-MORNING DIRECTION OF TRAVEL-AFTERNOON BRDIGE NORTHBOUND SOUTHBOUND BOTH NBampSB NORTHBOUND SOUTHBOUND BOTH NBampSB
Peak HourPeak Period Macdonald-Cartier Chaudiegravere
43-47 43-48
47-52 43-52
46-50 43-49
44-47 41-48
42-46 39-46
43-46 40-47
Peak Hour12 Hours Macdonald-Cartier Chaudiegravere
6-8 9-11
16-19 13-18
11-13 11-14
17-19 13-16
8-9 7-11
12-14 1013
Peak Hour24 Hours Macdonald-Cartier Chaudiegravere
5 6-8
11-14 10-13
8-10 8-10
12-14 9-11
5-6 5-8
9-10 7-10
TIME PERIOD RELATIONSHIPS FOR TRUCKS RELATIONSHIP BRDIGE
DIRECTION OF TRAVEL-MORNING DIRECTION OF TRAVEL-AFTERNOON NORTHBOUND SOUTHBOUND BOTH NBampSB NORTHBOUND SOUTHBOUND BOTH NBampSB
Peak HourPeak Period Macdonald-Cartier Chaudiegravere
37-47 33-53
35-67 34-46
36-58 34-47
33-48 31-52
38-53 33-51
39-48 36-51
Peak Hour12 Hours Macdonald-Cartier Chaudiegravere
8-12 7-14
7-18 7-12
8-14 7-12
7-10 5-11
5-11 4-10
7-10 5-11
Peak Hour24 Hours Macdonald-Cartier Chaudiegravere
6-10 5-11
6-14 6-10
6-11 6-9
5-8 4-9
4-9 3-8
5-7 4-8
Interprovincial Roadside Truck Survey Technical Appendices 57
Appendix E Traffic Zones Comprising the Districts
Interprovincial Roadside Truck Survey Technical Appendices 58
LIST OF TRAFFIC ZONES BY DISTRICT DISTRICT TRAFFIC ZONES
1 Ottawa Central 1 2 3 4 5 6 7 8 9 10 11 12 13 14 15 16 17 18 19 20 21 22 23 24 25 201
2 IGB West
26 27 28 29 30 31 32 33 34 35 36 37 38 39 40 41 42 43 44 45 57 58 59 60 61 62 63 64 65 66 67 120
3 Ottawa West
46 47 48 49 50 51 52 53 54 55 56 121 122 123 124 125 126 127
128 129 130 131 132 133 134 135 136 137 138 190 191 192 193 194 195 206 207 208 209 210 211 212 213 214 215 216 217 218 219 220 221 222 223 224 225 226
4 Ottawa South
68 69 70 71 72 73 74 75 76 77 78 79 80 84 85 87 111 112 113 114 115 116 117 118 119 139 140 196 197 200 205 227 228 229 230 231 232 233
5 IGB East
81 82 83 86 88 89 90 91 92 93 94 95 96 97 98 99 100 101
102 103 104 105 106 107 108 109 110 234
6 Ottawa East 141 142 143 144 145 189 198 199 202 203 204 235 236 237 238 239 240 241 242 243 244 245 246 247
7 Hull 151 152 153 154 155 156 157 158 159 160 161 162 163 164 184 254 255
8 Aylmer 146 147 148 149 150 182 183 186 187 256 257 258
9 Gatineau West 165 166 167 168 169 170 177 185 252 253
10 Gatineau East 171 172 173 174 175 176 178 179 180 181 188 248 249 250 251
IGB - Inside Green Belt
Interprovincial Roadside Truck Survey Technical Appendices 59
Inte
rpro
vinc
ial R
oads
ide
Truc
k Su
rvey
T
echn
ical
App
endi
ces
60
Appendix F District Comparisons of Trucks by Number
Interprovincial Roadside Truck Survey Technical Appendices 61
Interprovincial Roadside Truck Survey Technical Appendices 62
TOTAL NUMBER OF ALL TRUCKS (12 HOURS_DAY)
ZONE GROUP O 1-O
ttaw
a C
ente
r
2-IG
B W
est
3-O
ttaw
a W
est
4-O
ttaw
a So
uth
5-IG
B-E
ast
6-O
ttaw
a E
ast
7-H
ull
8-A
ylm
er
9-G
atin
eau
Wes
t
10-G
atin
eau
Eas
t
TO
TA
L
1-Ottawa Center 3 13 3 50 13 49 5 137 2-IGB West 86 31 20 16 153 3-Ottawa West 4 6 72 45 21 54 201 4-Ottawa South 4 143 28 49 223 5-IGB-East 11 6 178 50 109 89 444 6-Ottawa East 7 11 22 22 19 92 42 13 80 308 7-Hull 69 63 100 50 159 48 490 8-Aylmer 77 81 33 35 32 11 269 9-Gatineau West 72 18 16 66 77 29 277 10-Gatineau East 11 3 45 65 63 15 6 208 TOTAL 244 172 208 251 356 138 620 208 212 300 2709 IGB-Inside Green Belt
TOTAL NUMBER OF 2A TRUCKS (12 HOURS_DAY)
ZONE GROUP O 1-O
ttaw
a C
ente
r
2-IG
B W
est
3-O
ttaw
a W
est
4-O
ttaw
a So
uth
5-IG
B-E
ast
6-O
ttaw
a E
ast
7-H
ull
8-A
ylm
er
9-G
atin
eau
Wes
t
10-G
atin
eau
Eas
t
TO
TA
L
1-Ottawa Center 31 13 18 5 66 2-IGB-West 38 15 10 64 3-Ottawa West 33 5 5 43 4-Ottawa South 51 18 23 92 5-IGB-East 5 120 28 59 51 263 6-Ottawa East 22 13 56 13 13 38 155 7-Hull 53 49 51 40 81 22 296 8-Aylmer 13 6 24 6 18 11 78 9-Gatineau West 24 18 11 18 29 29 127 10-Gatineau East 6 11 18 40 75 TOTAL 100 73 97 81 190 75 329 92 105 117 1260
TOTAL NUMBER OF 3A+ TRUCKS (12 HOURS_DAY)
ZONE GROUP O 1-O
ttaw
a C
ente
r
2-IG
B W
est
3-O
ttaw
a W
est
4-O
ttaw
a So
uth
5-IG
B-E
ast
6-O
ttaw
a E
ast
7-H
ull
8-A
ylm
er
9-G
atin
eau
Wes
t
10-G
atin
eau
Eas
t
TO
TA
L
1-Ottawa Center 12 31 44 2-IGB-West 38 12 6 6 62 3-Ottawa West 22 16 16 16 69 4-Ottawa South 79 6 85 5-IGB-East 6 18 16 44 31 115 6-Ottawa East 6 16 22 7-Hull 9 14 5 48 76 8-Aylmer 58 58 9 124 9-Gatineau West 48 5 48 48 149 10-Gatineau East 5 5 5 14 TOTAL 126 72 23 48 101 175 50 97 69 761
TOTAL NUMBER OF TRACTOR TRAILERS (12 HOURS_DAY)
ZONE GROUP O 1-O
ttaw
a C
ente
r
2-IG
B W
est
3-O
ttaw
a W
est
4-O
ttaw
a So
uth
5-IG
B-E
ast
6-O
ttaw
a E
ast
7-H
ull
8-A
ylm
er
9-G
atin
eau
Wes
t
10-G
atin
eau
Eas
t
TO
TA
L
1-Ottawa Center 3 13 3 7 26 2-IGB-West 10 4 4 10 27 3-Ottawa West 4 6 16 24 39 89 4-Ottawa South 4 13 4 26 46 5-IGB-East 6 39 6 6 6 65 6-Ottawa East 7 11 22 6 29 29 26 131 7-Hull 7 44 11 30 25 117 8-Aylmer 6 17 29 15 67 9-Gatineau West 10-Gatineau East 3 30 47 18 15 6 119 TOTAL 17 28 88 122 65 63 115 67 10 113 688
Interprovincial Roadside Truck Survey Technical Appendices 63
TOTAL NUMBER OF ALL TRUCKS (12 HOURS_NIGHT)
ZONE GROUP O 1-O
ttaw
a C
ente
r
2-IG
B W
est
3-O
ttaw
a W
est
4-O
ttaw
a So
uth
5-IG
B-E
ast
6-O
ttaw
a E
ast
7-H
ull
8-A
ylm
er
9-G
atin
eau
Wes
t
10-G
atin
eau
Eas
t
TO
TA
L
1-Ottawa Center 1 1 3 6 2-IGB West 14 5 1 12 31 3-Ottawa West 32 16 20 68 4-Ottawa South 12 7 4 48 71 5-IGB-East 8 31 23 11 26 99 6-Ottawa East 1 6 3 34 8 16 19 86 7-Hull 27 6 23 13 54 3 125 8-Aylmer 3 7 13 33 45 100 9-Gatineau West 3 4 27 15 15 3 67 10-Gatineau East 4 3 6 59 3 12 87 TOTAL 11 41 53 136 34 121 126 61 32 125 741 IGB-Inside Green Belt
TOTAL NUMBER OF 2A TRUCKS (12 HOURS_NIGHT)
ZONE GROUP O 1-O
ttaw
a C
ente
r
2-IG
B W
est
3-O
ttaw
a W
est
4-O
ttaw
a So
uth
5-IG
B-E
ast
6-O
ttaw
a E
ast
7-H
ull
8-A
ylm
er
9-G
atin
eau
Wes
t
10-G
atin
eau
Eas
t
TO
TA
L
1-Ottawa Center 3 3 2-IGB West 3 3 3-Ottawa West 3 12 15 4-Ottawa South 12 6 12 30 5-IGB-East 3 18 15 36 6-Ottawa East 6 12 15 33 7-Hull 15 18 7 30 70 8-Aylmer 7 3 15 7 32 9-Gatineau West 24 15 15 54 10-Gatineau East 3 15 18 TOTAL 22 30 63 22 37 29 23 12 54 293
TOTAL NUMBER OF 3A+ TRUCKS (12 HOURS_NIGHT)
ZONE GROUP O 1-O
ttaw
a C
ente
r
2-IG
B W
est
3-O
ttaw
a W
est
4-O
ttaw
a So
uth
5-IG
B-E
ast
6-O
ttaw
a E
ast
7-H
ull
8-A
ylm
er
9-G
atin
eau
Wes
t
10-G
atin
eau
Eas
t
TO
TA
L
1-Ottawa Center 2-IGB West 11 11 3-Ottawa West 8 8 4-Ottawa South 5-IGB-East 8 8 8 8 30 6-Ottawa East 7-Hull 3 3 6 8-Aylmer 3 3 26 32 9-Gatineau West 10-Gatineau East 3 26 29 TOTAL 6 3 3 26 37 19 8 8 8 117
TOTAL NUMBER OF TRACTOR TRAILERS (12 HOURS_NIGHT)
ZONE GROUP O 1-O
ttaw
a C
ente
r
2-IG
B W
est
3-O
ttaw
a W
est
4-O
ttaw
a So
uth
5-IG
B-E
ast
6-O
ttaw
a E
ast
7-H
ull
8-A
ylm
er
9-G
atin
eau
Wes
t
10-G
atin
eau
Eas
t
TO
TA
L
1-Ottawa Center 1 1 3 2-IGB West 5 1 12 18 3-Ottawa West 29 9 8 46 4-Ottawa South 1 4 36 41 5-IGB-East 20 5 4 4 33 6-Ottawa East 1 6 3 28 8 4 4 54 7-Hull 9 6 4 6 21 3 49 8-Aylmer 6 18 12 36 9-Gatineau West 3 4 3 3 13 10-Gatineau East 1 3 3 18 3 12 40 TOTAL 5 16 19 47 12 48 78 30 13 63 331
TOTAL NUMBER OF ALL TRUCKS (12 HOURS_DAY+12 HOURS_NIGHT)
ZONE GROUP O 1-O
ttaw
a C
ente
r
2-IG
B W
est
3-O
ttaw
a W
est
4-O
ttaw
a So
uth
5-IG
B-E
ast
6-O
ttaw
a E
ast
7-H
ull
8-A
ylm
er
9-G
atin
eau
Wes
t
10-G
atin
eau
Eas
t
TO
TA
L
1-Ottawa Center 5 14 3 53 13 49 5 142 2-IGB West 100 36 21 28 185 3-Ottawa West 4 6 104 61 21 74 270 4-Ottawa South 4 155 34 4 97 293 5-IGB-East 11 14 209 73 120 115 543 6-Ottawa East 1 7 11 28 25 19 126 50 29 99 395 7-Hull 69 90 106 73 172 102 3 615 8-Aylmer 80 88 46 68 32 56 369 9-Gatineau West 75 22 42 81 92 32 344 10-Gatineau East 15 6 52 124 66 27 6 295 TOTAL 255 213 261 387 390 259 745 270 244 425 3450 IGB-Inside Green Belt
TOTAL NUMBER OF 2A TRUCKS (12 HOURS_DAY+12 HOURS_NIGHT)
ZONE GROUP O 1-O
ttaw
a C
ente
r
2-IG
B W
est
3-O
ttaw
a W
est
4-O
ttaw
a So
uth
5-IG
B-E
ast
6-O
ttaw
a E
ast
7-H
ull
8-A
ylm
er
9-G
atin
eau
Wes
t
10-G
atin
eau
Eas
t
TO
TA
L
1-Ottawa Center 33 13 18 5 69 2-IGB West 41 15 10 67 3-Ottawa West 36 5 5 12 58 4-Ottawa South 63 24 35 122 5-IGB-East 5 123 46 59 66 298 6-Ottawa East 22 13 62 13 25 53 188 7-Hull 53 64 51 58 88 52 366 8-Aylmer 13 13 27 21 18 18 110 9-Gatineau West 24 18 35 33 44 29 181 10-Gatineau East 6 15 33 40 93 TOTAL 100 95 128 145 212 112 358 115 117 172 1553
TOTAL NUMBER OF 3A+ TRUCKS (12 HOURS_DAY+12 HOURS_NIGHT)
ZONE GROUP O 1-O
ttaw
a C
ente
r
2-IG
B W
est
3-O
ttaw
a W
est
4-O
ttaw
a So
uth
5-IG
B-E
ast
6-O
ttaw
a E
ast
7-H
ull
8-A
ylm
er
9-G
atin
eau
Wes
t
10-G
atin
eau
Eas
t
TO
TA
L
1-Ottawa Center 12 31 44 2-IGB West 49 12 6 6 73 3-Ottawa West 22 23 16 16 77 4-Ottawa South 79 6 85 5-IGB-East 6 8 26 16 51 39 146 6-Ottawa East 6 16 22 7-Hull 9 17 5 48 3 83 8-Aylmer 61 58 13 26 157 9-Gatineau West 48 5 48 48 149 10-Gatineau East 8 5 26 5 43 TOTAL 132 75 27 74 101 37 193 57 105 77 878
TOTAL NUMBER OF TRACTOR TRAILERS (12 HOURS_DAY+12 HOURS_NIGHT)
ZONE GROUP O 1-O
ttaw
a C
ente
r
2-IG
B W
est
3-O
ttaw
a W
est
4-O
ttaw
a So
uth
5-IG
B-E
ast
6-O
ttaw
a E
ast
7-H
ull
8-A
ylm
er
9-G
atin
eau
Wes
t
10-G
atin
eau
Eas
t
TO
TA
L
1-Ottawa Center 5 14 3 7 29 2-IGB West 10 8 5 22 45 3-Ottawa West 4 6 46 32 46 135 4-Ottawa South 4 13 5 4 62 87 5-IGB-East 6 60 11 10 10 98 6-Ottawa East 1 7 11 28 3 6 58 37 4 30 185 7-Hull 7 9 50 15 35 46 3 166 8-Aylmer 6 17 6 46 15 12 102 9-Gatineau West 3 4 3 3 13 10-Gatineau East 1 6 32 65 21 27 6 159 TOTAL 22 44 107 169 77 111 193 97 23 176 1019
Interprovincial Roadside Truck Survey Technical Appendices 64
TOTAL NUMBER OF ALL TRUCKS (24 HOURS)
ZONE GROUP O 1-O
ttaw
a C
ente
r
2-IG
B W
est
3-O
ttaw
a W
est
4-O
ttaw
a So
uth
5-IG
B-E
ast
6-O
ttaw
a E
ast
7-H
ull
8-A
ylm
er
9-G
atin
eau
Wes
t
10-G
atin
eau
Eas
t
TO
TA
L
1-Ottawa Center 5 13 3 50 13 45 5 134 2-IGB West 89 37 21 29 176 3-Ottawa West 3 5 110 63 19 68 268 4-Ottawa South 3 142 38 5 104 291 5-IGB-East 11 19 213 75 122 120 561 6-Ottawa East 3 5 8 25 29 18 133 46 30 95 391 7-Hull 65 88 98 73 164 105 5 599 8-Aylmer 71 80 51 68 27 85 383 9-Gatineau West 70 25 59 72 84 34 343 10-Gatineau East 17 8 47 135 63 30 5 304 TOTAL 240 206 267 386 370 299 737 277 242 426 3450 IGB-Inside Green Belt
TOTAL NUMBER OF 2A TRUCKS (24 HOURS)
ZONE GROUP O 1-O
ttaw
a C
ente
r
2-IG
B W
est
3-O
ttaw
a W
est
4-O
ttaw
a So
uth
5-IG
B-E
ast
6-O
ttaw
a E
ast
7-H
ull
8-A
ylm
er
9-G
atin
eau
Wes
t
10-G
atin
eau
Eas
t
TO
TA
L
1-Ottawa Center 33 13 17 5 67 2-IGB West 41 14 9 64 3-Ottawa West 36 5 5 13 58 4-Ottawa South 61 27 35 122 5-IGB-East 5 121 49 57 68 299 6-Ottawa East 24 13 65 13 25 55 194 7-Hull 52 56 53 58 91 48 357 8-Aylmer 11 16 28 17 17 23 111 9-Gatineau West 23 17 49 29 41 29 188 10-Gatineau East 5 17 29 41 93 TOTAL 95 89 147 134 214 112 356 119 113 175 1553
TOTAL NUMBER OF 3A+ TRUCKS (24 HOURS)
ZONE GROUP O 1-O
ttaw
a C
ente
r
2-IG
B W
est
3-O
ttaw
a W
est
4-O
ttaw
a So
uth
5-IG
B-E
ast
6-O
ttaw
a E
ast
7-H
ull
8-A
ylm
er
9-G
atin
eau
Wes
t
10-G
atin
eau
Eas
t
TO
TA
L
1-Ottawa Center 13 28 41 2-IGB West 41 13 6 6 67 3-Ottawa West 20 28 14 14 77 4-Ottawa South 70 6 77 5-IGB-East 6 14 33 14 55 42 165 6-Ottawa East 6 14 20 7-Hull 9 17 4 43 4 77 8-Aylmer 56 51 13 43 163 9-Gatineau West 43 4 43 43 132 10-Gatineau East 9 4 43 4 60 TOTAL 122 69 26 85 90 61 184 61 103 77 878
TOTAL NUMBER OF TRACTOR TRAILERS (24 HOURS)
ZONE GROUP O 1-O
ttaw
a C
ente
r
2-IG
B W
est
3-O
ttaw
a W
est
4-O
ttaw
a So
uth
5-IG
B-E
ast
6-O
ttaw
a E
ast
7-H
ull
8-A
ylm
er
9-G
atin
eau
Wes
t
10-G
atin
eau
Eas
t
TO
TA
L
1-Ottawa Center 5 13 3 5 26 2-IGB West 8 10 5 23 46 3-Ottawa West 3 5 54 31 41 133 4-Ottawa South 3 10 5 5 69 92 5-IGB-East 5 59 13 10 10 97 6-Ottawa East 3 5 8 25 5 5 62 33 5 26 176 7-Hull 5 15 40 15 30 53 5 164 8-Aylmer 5 13 10 51 10 20 109 9-Gatineau West 5 8 5 5 23 10-Gatineau East 3 8 25 63 18 30 5 152 TOTAL 23 48 94 167 66 127 197 97 26 175 1019
Interprovincial Roadside Truck Survey Technical Appendices 65
DIFFERENCE BETWEEN TOTAL NUMBERS OF ALL TRUCKS [(12 HOURS_DAY+12 HOURS_NIGHT)-24 HOURS]
ZONE GROUP O 1-O
ttaw
a C
ente
r
2-IG
B W
est
3-O
ttaw
a W
est
4-O
ttaw
a So
uth
5-IG
B-E
ast
6-O
ttaw
a E
ast
7-H
ull
8-A
ylm
er
9-G
atin
eau
Wes
t
10-G
atin
eau
Eas
t
TO
TA
L
1-Ottawa Center -1 1 1 3 0 4 0 8 2-IGB West 11 -1 0 -2 8 3-Ottawa West 1 1 -7 -2 2 7 2 4-Ottawa South 1 13 -4 -1 -7 2 5-IGB-East 0 -5 -5 -2 -1 -5 -18 6-Ottawa East -2 2 3 3 -3 1 -7 4 -2 4 4 7-Hull 4 2 8 0 7 -3 -2 16 8-Aylmer 8 8 -5 0 5 -29 -14 9-Gatineau West 5 -3 -16 9 8 -2 1 10-Gatineau East -1 -1 5 -11 2 -4 1 -9 TOTAL 16 7 -5 1 20 -40 8 -8 2 -2 0 IGB-Inside Green Belt
DIFFERENCE BETWEEN TOTAL NUMBERS OF 2A TRUCKS [(12 HOURS_DAY+12 HOURS_NIGHT)-24 HOURS]
ZONE GROUP O 1-O
ttaw
a C
ente
r
2-IG
B W
est
3-O
ttaw
a W
est
4-O
ttaw
a So
uth
5-IG
B-E
ast
6-O
ttaw
a E
ast
7-H
ull
8-A
ylm
er
9-G
atin
eau
Wes
t
10-G
atin
eau
Eas
t
TO
TA
L
1-Ottawa Center 1 0 1 0 2 2-IGB West 1 1 1 3 3-Ottawa West 0 0 0 -1 1 4-Ottawa South 2 -3 1 -1 5-IGB-East 0 2 -3 2 -2 0 6-Ottawa East -1 0 -3 0 0 -2 -6 7-Hull 1 8 -2 0 -3 5 9 8-Aylmer 2 -3 -1 4 0 -5 -2 9-Gatineau West 1 0 -14 3 3 0 -7 10-Gatineau East 1 -3 3 -1 1 TOTAL 6 6 -19 11 -3 0 3 -4 4 -3 0
DIFFERENCE BETWEEN TOTAL NUMBERS OF 3A+ TRUCKS [(12 HOURS_DAY+12 HOURS_NIGHT)-24 HOURS]
ZONE GROUP O 1-O
ttaw
a C
ente
r
2-IG
B W
est
3-O
ttaw
a W
est
4-O
ttaw
a So
uth
5-IG
B-E
ast
6-O
ttaw
a E
ast
7-H
ull
8-A
ylm
er
9-G
atin
eau
Wes
t
10-G
atin
eau
Eas
t
TO
TA
L
1-Ottawa Center -1 3 3 2-IGB West 8 -1 0 0 7 3-Ottawa West 1 -5 2 2 0 4-Ottawa South 8 0 8 5-IGB-East 0 -6 -7 2 -4 -3 -19 6-Ottawa East 0 2 1 7-Hull 1 0 0 6 -1 5 8-Aylmer 5 6 0 -17 -6 9-Gatineau West 6 0 6 6 17 10-Gatineau East -1 0 -17 0 -17 TOTAL 10 6 1 -11 11 -24 9 -4 1 0 0
DIFFERENCE BETWEEN TOTAL NUMBERS OF TRACTOR TRAILERS [(12 HOURS_DAY+12 HOURS_NIGHT)-24 HOURS]
ZONE GROUP O 1-O
ttaw
a C
ente
r
2-IG
B W
est
3-O
ttaw
a W
est
4-O
ttaw
a So
uth
5-IG
B-E
ast
6-O
ttaw
a E
ast
7-H
ull
8-A
ylm
er
9-G
atin
eau
Wes
t
10-G
atin
eau
Eas
t
TO
TA
L
1-Ottawa Center -1 1 1 2 4 2-IGB West 2 -2 0 -1 -1 3-Ottawa West 1 1 -8 2 5 1 4-Ottawa South 1 3 0 -1 -8 -6 5-IGB-East 1 1 -1 0 0 1 6-Ottawa East -2 2 3 3 -2 1 -4 4 -1 4 8 7-Hull 2 -7 10 0 5 -7 -2 2 8-Aylmer 1 4 -4 -4 5 -8 -7 9-Gatineau West -2 -3 -2 -2 -9
10-Gatineau East -2 -1 7 2 3 -4 1 7 TOTAL 0 -5 13 1 12 -16 -4 0 -3 2 0
Interprovincial Roadside Truck Survey Technical Appendices 66
Interprovincial Roadside Truck Survey Technical Appendices 67
ABSOLUTE DIFFERENCE BETWEEN TOTAL NUMBERS OF ALL TRUCKS [(12H_DAY+12H_NIGHT)-24H]
ZONE GROUP O 1-O
ttaw
a C
ente
r
2-IG
B W
est
3-O
ttaw
a W
est
4-O
ttaw
a So
uth
5-IG
B-E
ast
6-O
ttaw
a E
ast
7-H
ull
8-A
ylm
er
9-G
atin
eau
Wes
t
10-G
atin
eau
Eas
t
TO
TA
L (
AB
S)
1-Ottawa Center -1 1 1 3 0 4 0 10 2-IGB West 11 -1 0 -2 13 3-Ottawa West 1 1 -7 -2 2 7 20 4-Ottawa South 1 13 -4 -1 -7 26 5-IGB-East 0 -5 -5 -2 -1 -5 19 6-Ottawa East -2 2 3 3 -3 1 -7 4 -2 4 31 7-Hull 4 2 8 0 7 -3 -2 27 8-Aylmer 8 8 -5 0 5 -29 56 9-Gatineau West 5 -3 -16 9 8 -2 43 10-Gatineau East -1 -1 5 -11 2 -4 1 26 TOTAL (ABS) 21 16 38 25 27 48 45 16 11 26 272 IGB-Inside Green Belt
ABSOLUTE DIFFERENCE BETWEEN TOTAL NUMBERS OF 2A TRUCKS [(12H_DAY+12H_NIGHT)-24H]
ZONE GROUP O 1-O
ttaw
a C
ente
r
2-IG
B W
est
3-O
ttaw
a W
est
4-O
ttaw
a So
uth
5-IG
B-E
ast
6-O
ttaw
a E
ast
7-H
ull
8-A
ylm
er
9-G
atin
eau
Wes
t
10-G
atin
eau
Eas
t
TO
TA
L (
AB
S)
1-Ottawa Center 1 0 1 0 2 2-IGB West 1 1 1 3 3-Ottawa West 0 0 0 -1 2 4-Ottawa South 2 -3 1 6 5-IGB-East 0 2 -3 2 -2 9 6-Ottawa East -1 0 -3 0 0 -2 7 7-Hull 1 8 -2 0 -3 5 19 8-Aylmer 2 -3 -1 4 0 -5 15 9-Gatineau West 1 0 -14 3 3 0 22 10-Gatineau East 1 -3 3 -1 8 TOTAL (ABS) 6 12 19 11 9 10 8 8 5 5 92
ABSOLUTE DIFFERENCE BETWEEN TOTAL NUMBERS OF 3A+ TRUCKS [(12H_DAY+12H_NIGHT)-24H]
ZONE GROUP O 1-O
ttaw
a C
ente
r
2-IG
B W
est
3-O
ttaw
a W
est
4-O
ttaw
a So
uth
5-IG
B-E
ast
6-O
ttaw
a E
ast
7-H
ull
8-A
ylm
er
9-G
atin
eau
Wes
t
10-G
atin
eau
Eas
t
TO
TA
L (
AB
S)
1-Ottawa Center -1 3 4 2-IGB West 8 -1 0 0 9 3-Ottawa West 1 -5 2 2 10 4-Ottawa South 8 0 9 5-IGB-East 0 -6 -7 2 -4 -3 22 6-Ottawa East 0 2 2 7-Hull 1 0 0 6 -1 8 8-Aylmer 5 6 0 -17 28 9-Gatineau West 6 0 6 6 17 10-Gatineau East -1 0 -17 0 18 TOTAL (ABS) 12 6 1 22 11 24 26 7 9 7 127
ABSOLUTE DIFFERENCE BETWEEN TOTAL NUMBERS OF TRACTOR TRAILERS [(12H_DAY+12H_NIGHT)-24H]
ZONE GROUP O 1-O
ttaw
a C
ente
r
2-IG
B W
est
3-O
ttaw
a W
est
4-O
ttaw
a So
uth
5-IG
B-E
ast
6-O
ttaw
a E
ast
7-H
ull
8-A
ylm
er
9-G
atin
eau
Wes
t
10-G
atin
eau
Eas
t
TO
TA
L (
AB
S)
1-Ottawa Center -1 1 1 2 5 2-IGB West 2 -2 0 -1 6 3-Ottawa West 1 1 -8 2 5 18 4-Ottawa South 1 3 0 -1 -8 13 5-IGB-East 1 1 -1 0 0 4 6-Ottawa East -2 2 3 3 -2 1 -4 4 -1 4 26 7-Hull 2 -7 10 0 5 -7 -2 33 8-Aylmer 1 4 -4 -4 5 -8 27 9-Gatineau West -2 -3 -2 -2 9 10-Gatineau East -2 -1 7 2 3 -4 1 20 TOTAL (ABS) 10 18 27 11 16 26 20 11 3 20 161
Interprovincial Roadside Truck Survey Technical Appendices 68
COMPARISON OF TOTAL NUMBER OF ALL TRUCKS FOR DIFFERENT PERIOD OF TIME
ZONE GROUP O 1-O
ttaw
a C
ente
r
2-IG
B W
est
3-O
ttaw
a W
est
4-O
ttaw
a So
uth
5-IG
B E
ast
6-O
ttaw
a E
ast
D N D+N 24H D N D+N 24H D N D+N 24H D N D+N 24H D N D+N 24H D N D+N 24H
1-Ottawa Center 3 1 5 5 13 1 14 13 3 3 3 2-IGB West 3-Ottawa West 4 4 3 6 6 5 4-Ottawa South 4 4 3 5-IGB East 11 11 11 6 8 14 19 6-Ottawa East 1 1 3 7 7 5 11 11 8 22 6 28 25 22 3 25 29 19 19 18 7-Hull 69 69 65 63 27 90 88 100 6 106 98 50 23 73 73 159 13 172 164 48 54 102 105 8-Aylmer 77 3 80 71 81 7 88 80 33 13 46 51 35 33 68 68 32 32 27 11 45 56 85 9-Gatineau West 72 3 75 70 18 4 22 25 16 27 42 59 66 15 81 72 77 15 92 84 29 3 32 34 10-Gatineau East 11 4 15 17 3 3 6 8 45 6 52 47 65 59 124 135 63 3 66 63 15 12 27 30 TOTAL 244 11 255 240 172 41 213 206 208 53 261 267 251 136 387 386 356 34 390 370 138 121 259 299
ZONE GROUP O 7-H
ull
8-A
ylm
er
9-G
atin
eau
Wes
t
10-G
atin
eau
Eas
t
TO
TA
L
D N D+N 24H D N D+N 24H D N D+N 24H D N D+N 24H D N D+N 24H 1-Ottawa Center 50 3 53 50 13 13 13 49 49 45 5 5 5 137 6 142 134 2-IGB West 86 14 100 89 31 5 36 37 20 1 21 21 16 12 28 29 153 31 185 176 3-Ottawa West 72 32 104 110 45 16 61 63 21 21 19 54 20 74 68 201 68 270 268 4-Ottawa South 143 12 155 142 28 7 34 38 4 4 5 49 48 97 104 223 71 293 291 5-IGB East 178 31 209 213 50 23 73 75 109 11 120 122 89 26 115 120 444 99 543 561 6-Ottawa East 92 34 126 133 42 8 50 46 13 16 29 30 80 19 99 95 308 86 395 391 7-Hull 3 3 5 490 125 615 599 8-Aylmer 269 100 369 383 9-Gatineau West 277 67 344 343 10-Gatineau East 6 6 5 208 87 295 304 TOTAL 620 126 745 737 208 61 270 277 212 32 244 242 300 125 425 426 2709 741 3450 3450 IGB-Inside Green Belt D - DAY (700 - 1700) N - NIGHT (1900 - 700) 24H - 24 HOUR PERIOD
COMPARISON OF TOTAL NUMBER OF 2A TRUCKS FOR DIFFERENT PERIOD OF TIME
ZONE GROUP O 1-O
ttaw
a C
ente
r
2-IG
B W
est
3-O
ttaw
a W
est
4-O
ttaw
a So
uth
5-IG
B E
ast
6-O
ttaw
a E
ast
D N D+N 24H D N D+N 24H D N D+N 24H D N D+N 24H D N D+N 24H D N D+N 24H
1-Ottawa Center 2-IGB West 3-Ottawa West 4-Ottawa South 5-IGB East 5 5 5 6-Ottawa East 22 22 24 13 13 13 7-Hull 53 53 52 49 15 64 56 51 51 53 40 18 58 58 81 7 88 91 22 30 52 48 8-Aylmer 13 13 11 6 7 13 16 24 3 27 28 6 15 21 17 18 18 17 11 7 18 23 9-Gatineau West 24 24 23 18 18 17 11 24 35 49 18 15 33 29 29 15 44 41 29 29 29 10-Gatineau East 6 6 5 11 3 15 17 18 15 33 29 40 40 41 TOTAL 100 100 95 73 22 95 89 97 30 128 147 81 63 145 134 190 22 212 214 75 37 112 112
ZONE GROUP O 7-H
ull
8-A
ylm
er
9-G
atin
eau
Wes
t
10-G
atin
eau
Eas
t
TO
TA
L
D N D+N 24H D N D+N 24H D N D+N 24H D N D+N 24H D N D+N 24H 1-Ottawa Center 31 3 33 33 13 13 13 18 18 17 5 5 5 66 3 69 67 2-IGB West 38 3 41 41 15 15 14 10 10 9 64 3 67 64 3-Ottawa West 33 3 36 36 5 5 5 5 5 5 12 12 13 43 15 58 58 4-Ottawa South 51 12 63 61 18 6 24 27 23 12 35 35 92 30 122 122 5-IGB East 120 3 123 121 28 18 46 49 59 59 57 51 15 66 68 263 36 298 299 6-Ottawa East 56 6 62 65 13 13 13 13 12 25 25 38 15 53 55 155 33 188 194 7-Hull 296 70 366 357 8-Aylmer 78 32 110 111 9-Gatineau West 127 54 181 188 10-Gatineau East 75 18 93 93 TOTAL 329 29 358 356 92 23 115 119 105 12 117 113 117 54 172 175 1260 293 1553 1553
COMPARISON OF TOTAL NUMBER OF 3A+ TRUCKS FOR DIFFERENT PERIOD OF TIME
ZONE GROUP O 1-O
ttaw
a C
ente
r
2-IG
B W
est
3-O
ttaw
a W
est
4-O
ttaw
a So
uth
5-IG
B E
ast
6-O
ttaw
a E
ast
D N D+N 24H D N D+N 24H D N D+N 24H D N D+N 24H D N D+N 24H D N D+N 24H 1-Ottawa Center 2-IGB West 3-Ottawa West 4-Ottawa South 5-IGB East 6 6 6 8 8 14 6-Ottawa East 7-Hull 9 9 9 14 3 17 17 5 5 4 48 48 43 3 3 4 8-Aylmer 58 3 61 56 58 58 51 9 3 13 13 26 26 43 9-Gatineau West 48 48 43 5 5 4 48 48 43 48 48 43 10-Gatineau East 5 3 8 9 5 5 4 26 26 43 5 5 4 TOTAL 126 6 132 122 72 3 75 69 23 3 27 26 48 26 74 85 101 101 90 37 37 61
ZONE GROUP O 7-H
ull
8-A
ylm
er
9-G
atin
eau
Wes
t
10-G
atin
eau
Eas
t
TO
TA
L
D N D+N 24H D N D+N 24H D N D+N 24H D N D+N 24H D N D+N 24H 1-Ottawa Center 12 12 13 31 31 28 44 44 41 2-IGB West 38 11 49 41 12 12 13 6 6 6 6 6 6 62 11 73 67 3-Ottawa West 22 22 20 16 8 23 28 16 16 14 16 16 14 69 8 77 77 4-Ottawa South 79 79 70 6 6 6 85 85 77 5-IGB East 18 8 26 33 16 16 14 44 8 51 55 31 8 39 42 115 30 146 165 6-Ottawa East 6 6 6 16 16 14 22 22 20 7-Hull 76 6 83 77 8-Aylmer 124 32 157 163 9-Gatineau West 149 149 132 10-Gatineau East 14 29 43 60 TOTAL 175 19 193 184 50 8 57 61 97 8 105 103 69 8 77 77 761 117 878 878
COMPARISON OF TOTAL NUMBER OF TRACTOR TRAILERS FOR DIFFERENT PERIOD OF TIME
ZONE GROUP O 1-O
ttaw
a C
ente
r
2-IG
B W
est
3-O
ttaw
a W
est
4-O
ttaw
a So
uth
5-IG
B E
ast
6-O
ttaw
a E
ast
D N D+N 24H D N D+N 24H D N D+N 24H D N D+N 24H D N D+N 24H D N D+N 24H 1-Ottawa Center 3 1 5 5 13 1 14 13 3 3 3 2-IGB West 3-Ottawa West 4 4 3 6 6 5 4-Ottawa South 4 4 3 5-IGB East 6 6 5 6-Ottawa East 1 1 3 7 7 5 11 11 8 22 6 28 25 3 3 5 6 6 5 7-Hull 7 7 5 9 9 15 44 6 50 40 11 4 15 15 30 6 35 30 25 21 46 53 8-Aylmer 6 6 5 17 17 13 6 6 10 29 18 46 51 15 15 10 12 12 20 9-Gatineau West 3 3 5 4 4 8 3 3 5 3 3 5 10-Gatineau East 1 1 3 3 3 6 8 30 3 32 25 47 18 65 63 18 3 21 18 15 12 27 30 TOTAL 17 5 22 23 28 16 44 48 88 19 107 94 122 47 169 167 65 12 77 66 63 48 111 127
ZONE GROUP O 7-H
ull
8-A
ylm
er
9-G
atin
eau
Wes
t
10-G
atin
eau
Eas
t
TO
TA
L
D N D+N 24H D N D+N 24H D N D+N 24H D N D+N 24H D N D+N 24H 1-Ottawa Center 7 7 5 26 3 29 26 2-IGB West 10 10 8 4 5 8 10 4 1 5 5 10 12 22 23 27 18 45 46 3-Ottawa West 16 29 46 54 24 9 32 31 39 8 46 41 89 46 135 133 4-Ottawa South 13 13 10 4 1 5 5 4 4 5 26 36 62 69 46 41 87 92 5-IGB East 39 20 60 59 6 5 11 13 6 4 10 10 6 4 10 10 65 33 98 97 6-Ottawa East 29 28 58 62 29 8 37 33 4 4 5 26 4 30 26 131 54 185 176 7-Hull 3 3 5 117 49 166 164 8-Aylmer 67 36 102 109 9-Gatineau West 13 13 23 10-Gatineau East 6 6 5 119 40 159 152 TOTAL 115 78 193 197 67 30 97 97 10 13 23 26 113 63 176 175 688 331 1019 1019
Interprovincial Roadside Truck Survey Technical Appendices 69
Appendix G District Comparisons of Trucks by Percent
Interprovincial Roadside Truck Survey Technical Appendices 70
Interprovincial Roadside Truck Survey Technical Appendices 71
COMPARISON OF PERCENTS OF ALL TRUCKS FOR DIFFERENT PERIOD OF TIME ()
ZONE GROUP O 1-O
ttaw
a C
ente
r
2-IG
B W
est
3-O
ttaw
a W
est
4-O
ttaw
a So
uth
5-IG
B E
ast
6-O
ttaw
a E
ast
D N D+N 24H D N D+N 24H D N D+N 24H D N D+N 24H D N D+N 24H D N D+N 24H
1-Ottawa Center 0 0 0 0 0 0 0 0 0 0 0 2-IGB West 3-Ottawa West 0 0 0 0 0 0 4-Ottawa South 0 0 0 5-IGB East 0 0 0 0 1 0 1 6-Ottawa East 0 0 0 0 0 0 0 0 0 1 1 1 1 1 0 1 1 1 1 1 7-Hull 3 2 2 2 4 3 3 4 1 3 3 2 3 2 2 6 2 5 5 2 7 3 3 8-Aylmer 3 0 2 2 3 1 3 2 1 2 1 1 1 4 2 2 1 1 1 0 6 2 2 9-Gatineau West 3 0 2 2 1 1 1 1 1 4 1 2 2 2 2 2 3 2 3 2 1 0 1 1 10-Gatineau East 0 1 0 0 0 0 0 0 2 1 1 1 2 8 4 4 2 0 2 2 1 2 1 1 TOTAL 9 2 7 7 6 6 6 6 8 7 8 8 9 18 11 11 13 5 11 11 5 16 8 9
ZONE GROUP O 7-H
ull
8-A
ylm
er
9-G
atin
eau
Wes
t
10-G
atin
eau
Eas
t
TO
TA
L
D N D+N 24H D N D+N 24H D N D+N 24H D N D+N 24H D N D+N 24H
1-Ottawa Center 2 0 2 1 0 0 0 2 1 1 0 0 0 5 1 4 4 2-IGB West 3 2 3 3 1 1 1 1 1 0 1 1 1 2 1 1 6 4 5 5 3-Ottawa West 3 4 3 3 2 2 2 2 1 1 1 2 3 2 2 7 9 8 8 4-Ottawa South 5 2 4 4 1 1 1 1 1 0 0 2 6 3 3 8 10 9 8 5-IGB East 7 4 6 6 2 3 2 2 4 2 3 4 3 4 3 3 16 13 16 16 6-Ottawa East 3 5 4 4 2 1 1 1 0 2 1 1 3 3 3 3 11 12 11 11 7-Hull 0 0 0 18 17 18 17 8-Aylmer 10 13 11 11 9-Gatineau West 10 9 10 10 10-Gatineau East 0 0 0 8 12 9 9 TOTAL 23 17 22 21 8 8 8 8 8 4 7 7 11 17 12 12 100 100 100 100 IGB-Inside Green Belt D - DAY (700 - 1700) N - NIGHT (1900 - 700) 24H - 24 HOURS
COMPARISON OF PERCENTS OF 2A TRUCKS FOR DIFFERENT PERIOD OF TIME ()
ZONE GROUP O 1-O
ttaw
a C
ente
r
2-IG
B W
est
3-O
ttaw
a W
est
4-O
ttaw
a So
uth
5-IG
B E
ast
6-O
ttaw
a E
ast
D N D+N 24H D N D+N 24H D N D+N 24H D N D+N 24H D N D+N 24H D N D+N 24H
1-Ottawa Center 2-IGB West 3-Ottawa West 4-Ottawa South 5-IGB East 0 0 0 6-Ottawa East 2 1 2 1 1 1 7-Hull 4 3 3 4 5 4 4 4 3 3 3 6 4 4 6 2 6 6 2 10 3 3 8-Aylmer 1 1 1 1 2 1 1 2 1 2 2 1 5 1 1 1 1 1 1 2 1 1 9-Gatineau West 2 2 1 1 1 1 1 8 2 3 1 5 2 2 2 5 3 3 2 2 2 10-Gatineau East 1 0 0 1 1 1 1 1 5 2 2 3 3 3 TOTAL 8 6 6 6 7 6 6 8 10 8 9 6 22 9 9 15 7 14 14 6 13 7 7
ZONE GROUP O 7-H
ull
8-A
ylm
er
9-G
atin
eau
Wes
t
10-G
atin
eau
Eas
t
TO
TA
L
D N D+N 24H D N D+N 24H D N D+N 24H D N D+N 24H D N D+N 24H 1-Ottawa Center 2 1 2 2 1 1 1 1 1 1 0 0 0 5 1 4 4 2-IGB West 3 1 3 3 1 1 1 1 1 1 5 1 4 4 3-Ottawa West 3 1 2 2 0 0 0 0 0 0 4 1 1 3 5 4 4 4-Ottawa South 4 4 4 4 1 2 2 2 2 4 2 2 7 10 8 8 5-IGB East 10 1 8 8 2 6 3 3 5 4 4 4 5 4 4 21 12 19 19 6-Ottawa East 4 2 4 4 1 1 1 1 4 2 2 3 5 3 4 12 11 12 13 7-Hull 24 24 24 23 8-Aylmer 6 11 7 7 9-Gatineau West 10 18 12 12 10-Gatineau East 6 6 6 6 TOTAL 26 10 23 23 7 8 7 8 8 4 8 7 9 19 11 11 100 100 100 100
Interprovincial Roadside Truck Survey Technical Appendices 72
COMPARISON OF PERCENTS OF 3A+ TRUCKS FOR DIFFERENT PERIOD OF TIME ()
ZONE GROUP O 1-O
ttaw
a C
ente
r
2-IG
B W
est
3-O
ttaw
a W
est
4-O
ttaw
a So
uth
5-IG
B E
ast
6-O
ttaw
a E
ast
D N D+N 24H D N D+N 24H D N D+N 24H D N D+N 24H D N D+N 24H D N D+N 24H 1-Ottawa Center 2-IGB West 3-Ottawa West 4-Ottawa South 5-IGB East 1 1 1 6 1 2 6-Ottawa East 7-Hull 1 1 1 2 3 2 2 1 1 0 6 5 5 3 0 0 8-Aylmer 8 3 7 6 8 7 6 1 3 1 1 22 3 5 9-Gatineau West 6 5 5 1 1 0 6 5 5 6 5 5 10-Gatineau East 1 3 1 1 1 1 0 22 3 5 1 1 0 TOTAL 17 5 15 14 9 3 9 8 3 3 3 3 6 22 8 10 13 12 10 31 4 7
ZONE GROUP O 7-H
ull
8-A
ylm
er
9-G
atin
eau
Wes
t
10-G
atin
eau
Eas
t
TO
TA
L
D N D+N 24H D N D+N 24H D N D+N 24H D N D+N 24H D N D+N 24H 1-Ottawa Center 2 1 1 4 4 3 6 5 5 2-IGB West 5 9 6 5 2 1 1 1 1 1 1 1 1 8 9 8 8 3-Ottawa West 3 2 2 2 6 3 3 2 2 2 2 2 2 9 6 9 9 4-Ottawa South 10 9 8 1 1 1 11 10 9 5-IGB East 2 6 3 4 2 2 2 6 6 6 6 4 6 4 5 15 26 17 19 6-Ottawa East 1 1 1 2 2 2 3 2 2 7-Hull 10 5 9 9 8-Aylmer 16 28 18 19 9-Gatineau West 20 17 15 10-Gatineau East 2 25 5 7 TOTAL 23 16 22 21 7 6 7 7 13 6 12 12 9 6 9 9 100 100 100 100
COMPARISON OF PERCENTS OF TRACTOR TRAILERS FOR DIFFERENT PERIOD OF TIME ()
ZONE GROUP O 1-O
ttaw
a C
ente
r
2-IG
B W
est
3-O
ttaw
a W
est
4-O
ttaw
a So
uth
5-IG
B E
ast
6-O
ttaw
a E
ast
D N D+N 24H D N D+N 24H D N D+N 24H D N D+N 24H D N D+N 24H D N D+N 24H 1-Ottawa Center 0 0 0 1 2 0 1 1 0 0 0 2-IGB West 3-Ottawa West 1 0 0 1 1 1 4-Ottawa South 1 0 0 5-IGB East 1 1 1 6-Ottawa East 0 0 0 1 1 0 2 1 1 3 2 3 2 1 0 0 1 1 1 7-Hull 1 1 0 3 1 1 6 2 5 4 2 1 1 1 4 2 3 3 4 6 5 5 8-Aylmer 1 1 1 2 2 1 2 1 1 4 5 5 5 2 1 1 4 1 2 9-Gatineau West 1 0 0 1 0 1 1 0 0 1 0 0 10-Gatineau East 0 0 0 0 1 1 1 4 1 3 2 7 5 6 6 3 1 2 2 2 4 3 3 TOTAL 3 2 2 2 4 5 4 5 13 6 10 9 18 14 17 16 10 4 8 6 9 14 11 12
ZONE GROUP O 7-H
ull
8-A
ylm
er
9-G
atin
eau
Wes
t
10-G
atin
eau
Eas
t
TO
TA
L
D N D+N 24H D N D+N 24H D N D+N 24H D N D+N 24H D N D+N 24H 1-Ottawa Center 1 1 0 4 1 3 3 2-IGB West 1 1 1 1 1 1 1 1 0 0 0 1 4 2 2 4 5 4 5 3-Ottawa West 2 9 4 5 3 3 3 3 6 2 5 4 13 14 13 13 4-Ottawa South 2 1 1 1 0 0 0 1 0 1 4 11 6 7 7 12 9 9 5-IGB East 6 6 6 6 1 1 1 1 1 1 1 1 1 1 1 1 9 10 10 10 6-Ottawa East 4 9 6 6 4 2 4 3 1 0 1 4 1 3 3 19 16 18 17 7-Hull 1 0 0 17 15 16 16 8-Aylmer 10 11 10 11 9-Gatineau West 4 1 2 10-Gatineau East 1 1 1 17 12 16 15 TOTAL 17 24 19 19 10 9 10 10 1 4 2 3 16 19 17 17 100 100 100 100
Appendix H Survey Expansion Factors
Interprovincial Roadside Truck Survey Technical Appendices 73
Interprovincial Roadside Truck Survey Technical Appendices
74
NB SB NB SB NB SB NB SB NB SB NB SB NB SB NB SB NB SB NB SB NB SB NB SB NB SB NB SB
2000 Interprovincial Roadside Truck Survey Sample Size by Time of Day
Sam
ple
Siz
e
100
90
80
70
60
50
40
30
20
10
0
24 HR PERIOD
NIGHT (1900-600)
AM PEAK (600-1000)
MIDDAY (1000-1500)
PM PEAK (1500-1900)
NIGHT (1900-700)
DAY (700-1900)
100
90
80
70
60
50
40
30
20
10
0
Chaudiegravere Chaudiegravere Chaudiegravere Chaudiegravere Chaudiegravere Chaudiegravere Chaudiegravere
Macdonald- Macdonald- Macdonald- Macdonald- Macdonald-Macdonald-Macdonald-
Cartier Cartier Cartier Cartier Cartier CartierCartier
2A Trucks 3A Trucks T Trailers
EXPANSION FACTORS FOR TRUCKS BY BRIDGE DIRECTION TIME PERIOD AND TYPE OF TRUCKS BRIDGE DIRECTION PERIOD 2A Trucks 3A+ Trucks Tractor Trailers
Chaudiegravere Northbound
24 HOUR TOTAL 464 641 252 NIGHT (1900-700) 283 1100 100 DAY (700-1900) 511 613 359 ALL OTHER 270 1100 091 AM PEAK(600-1000) 384 667 214 MIDDAY(1000-1500) 622 600 388 PM PEAK(1500-1900) 517 600 567
Chaudiegravere Southbound
24 HOUR TOTAL 532 433 259 NIGHT (1900-700) 338 320 140 DAY (700-1900) 632 469 321 ALL OTHER 283 200 130 AM PEAK(600-1000) 428 533 243 MIDDAY(1000-1500) 850 475 1350 PM PEAK(1500-1900) 740 433 180
Macdonald-Cartier Northbound
24 HOUR TOTAL 1265 1404 514 NIGHT (1900-700) 1214 760 389 DAY (700-1900) 1276 1574 645 ALL OTHER 1083 967 356 AM PEAK(600-1000) 1489 940 606 MIDDAY(1000-1500) 1244 1825 813 PM PEAK(1500-1900) 1200 2267 507
Macdonald-Cartier Southbound
24 HOUR TOTAL 1189 4263 505 NIGHT (1900-700) 1500 2600 298 DAY (700-1900) 1119 4817 738 ALL OTHER 1171 3000 263 AM PEAK(600-1000) 7900 12200 1620 MIDDAY(1000-1500) 958 3750 865 PM PEAK(1500-1900) 631 1950 423
Appendix I Trip Characteristics
Interprovincial Roadside Truck Survey Technical Appendices
75
Truck trip characteristics
BRIDGE DIRECTION Location O Location D SUM 2A SUM 3A+ SUM Trailer SUM TRUCKS Chaudiegravere Northbound EXTERNAL EXTERNAL 755 755
EXTERNAL INTERNAL 929 641 2769 4339
INTERNAL EXTERNAL 464 464
INTERNAL INTERNAL 26007 10259 3776 40041
Summary for DIRECTION = Northbound
Sum 27400 10900 7300 45600 Chaudiegravere Southbound EXTERNAL EXTERNAL 517 517
EXTERNAL INTERNAL 1064 1293 2357
INTERNAL EXTERNAL 532 433 2845 3810
INTERNAL INTERNAL 23404 8667 2845 34916
Summary for DIRECTION = Southbound
Sum 25000 9100 7500 41600 Summary for BRIDGE = Chaudiegravere
Sum 52400 20000 14800 87200 Macdonald-Cartier Northbound EXTERNAL EXTERNAL 2530 6167 8697
EXTERNAL INTERNAL 8855 2808 23128 34791 INTERNAL EXTERNAL 3795 1404 2056 7255
INTERNAL INTERNAL 35420 29488 12849 77756
Summary for DIRECTION = Northbound
Sum 50600 33700 44200 128500 Macdonald-Cartier Southbound EXTERNAL EXTERNAL 1189 6561 7750
EXTERNAL INTERNAL 4755 4263 7571 16588
INTERNAL EXTERNAL 4755 4263 18674 27691
INTERNAL INTERNAL 41602 25575 10094 77271
Summary for DIRECTION = Southbound
Sum 52300 34100 42900 129300 Summary for BRIDGE = Macdonald-Cartier
Sum 102900 67800 87100 257800
Grand Total 155300 87800 101900 345000
Interprovincial Roadside Truck Survey Technical Appendices
76
Appendix J Origins and Destinations of Truck Trips by Direction
Interprovincial Roadside Truck Survey Technical Appendices
77
Interprovincial Roadside Truck Survey Technical Appendices
78
Origins and Destinations of Truck Trips (Northbound direction)
1 Ottawa Central
5 IGB East
2 IGB West
3 Ottawa West
4 Ottawa South
6 Ottawa East
7 Hull
8 Aylmer
9 Gatineau West
10 Gatineau East
Queacutebec
Ontario
2 Axle Trucks
3+ Axles Trucks
Tractor Trailers
Total number of trucks (Origins in Ontario Destinatios in Queacutebec)
IGB ndash Inside Green Belt
xxx
(Autumn 2000)
Origins and Destinations of Truck Trips (Southbound Direction)
1 Ottawa Central
5 IGB East
2 IGB West
3 Ottawa West
4 Ottawa South
6 Ottawa East
7 Hull
8 Aylmer
9 Gatineau West
10 Gatineau East
Queacutebec
Ontario
2 Axle Trucks
3+ Axles Trucks
Tractor Trailers
Total number of trucks (Origins in Queacutebec Destinatios in Ontario)
IGB ndash Inside Green Belt
xxx
(Autumn 2000)
Appendix K Concentration of Truck Trip Ends
Interprovincial Roadside Truck Survey Technical Appendices
79
Number of trucks by traffic zone (Origin+Destination) 13 traffic zones accounted for 40 of all trucks (O+D)
No Zone Trucks Trucks_cumul Trucks_cumul ()
1 162 578 578 8 2 88 463 1041 15 3 189 358 1399 20 4 120 246 1645 24 5 158 194 1839 27 6 167 182 2021 29 7 89 176 2197 32 8 200 163 2360 34 9 174 157 2517 36 10 146 148 2665 39 11 83 147 2812 41 12 190 139 2951 43 13 111 132 3083 45 14 187 132 3215 47 15 168 118 3333 48 16 186 103 3436 50 17 184 101 3537 51 18 164 101 3638 53 19 161 98 3736 54 20 198 98 3834 56 21 188 95 3929 57 22 8 91 4020 58 23 171 91 4111 60 24 177 86 4197 61 25 179 84 4281 62 26 169 82 4363 63 27 55 76 4439 64 28 173 75 4514 65 29 155 71 4585 66 30 159 70 4655 67 31 257 69 4724 68 32 116 65 4789 69 33 10 56 4845 70 34 16 55 4900 71 35 147 55 4955 72 36 183 51 5006 73 37 172 51 5057 73 38 180 51 5108 74 39 251 50 5158 75 40 205 50 5208 75 41 139 48 5256 76 42 191 46 5302 77 43 93 42 5344 77 44 1 40 5384 78 45 154 39 5423 79 46 196 39 5462 79 47 199 37 5499 80 48 121 37 5536 80 49 193 36 5572 81 50 192 35 5607 81 51 150 35 5642 82 52 252 32 5674 82 53 153 30 5704 83 54 237 30 5734 83 55 141 30 5764 84 56 166 29 5793 84 57 254 27 5820 84
No Zone Trucks Trucks_cumul Trucks_cumul ()
1 162 578 578 8 2 88 463 1041 15 3 120 246 1287 19 4 158 194 1481 21 5 167 182 1663 24 6 89 176 1839 27 7 174 157 1996 29 8 146 148 2144 31 9 83 147 2291 33
10 111 132 2423 35 11 168 118 2541 37 12 184 101 2642 38 13 164 101 2743 40
20 traffic zones accounted for 20 of all trucks (O+D)
No Zone Trucks Trucks_cumul Trucks_cumul ()
1 161 98 98 1 2 8 91 189 3 3 171 91 280 4 4 177 86 366 5 5 179 84 450 7 6 169 82 532 8 7 55 76 608 9 8 173 75 683 10 9 155 71 754 11
10 159 70 824 12 11 257 69 893 13 12 116 65 958 14 13 10 56 1014 15 14 16 55 1069 15 15 147 55 1124 16 16 183 51 1175 17 17 172 51 1226 18 18 180 51 1277 19 19 251 50 1327 19 20 205 50 1377 20
15 external traffic zones accounted for 19 of all trucks (O+D)
No Zone Trucks Trucks_cumul Trucks_cumul ()
1 189 358 358 5 2 200 163 521 8 3 190 139 660 10 4 187 132 792 11 5 186 103 895 13 6 198 98 993 14 7 188 95 1088 16 8 191 46 1134 16 9 196 39 1173 17
10 199 37 1210 18 11 193 36 1246 18 12 192 35 1281 19 13 194 9 1290 19 14 195 7 1297 19 15 197 3 1300 19
Interprovincial Roadside Truck Survey Technical Appendices
80
Number of trucks by traffic zone (Origin+Destination) No Zone Trucks Trucks_cumul Trucks_cumul () 58 204 27 5847 85 59 90 26 5873 85 60 143 26 5899 85 61 80 26 5925 86 62 119 24 5949 86 63 238 24 5973 87 64 253 24 5997 87 65 175 23 6020 87 66 136 23 6043 88 67 151 23 6066 88 68 233 23 6089 88 69 54 22 6111 89 70 249 22 6133 89 71 258 22 6155 89 72 39 21 6176 90 73 115 21 6197 90 74 66 21 6218 90 75 130 20 6238 90 76 4 19 6257 91 77 165 18 6275 91 78 117 17 6292 91 79 17 17 6309 91 80 170 17 6326 92 81 20 17 6343 92 82 12 16 6359 92 83 7 16 6375 92 84 75 16 6391 93 85 97 15 6406 93 86 107 14 6420 93 87 76 14 6434 93 88 110 14 6448 93 89 22 13 6461 94 90 145 13 6474 94 91 26 13 6487 94 92 125 13 6500 94 93 35 13 6513 94 94 19 13 6526 95 95 37 13 6539 95 96 28 13 6552 95 97 255 12 6564 95 98 70 12 6576 95 99 134 11 6587 95 100 176 11 6598 96 101 91 11 6609 96 102 135 11 6620 96 103 140 11 6631 96 104 2 10 6641 96 105 51 10 6651 96 106 148 10 6661 97 107 40 9 6670 97
Interprovincial Roadside Truck Survey Technical Appendices
81
Number of trucks by traffic zone (Origin+Destination) No Zone Trucks Trucks_cumul Trucks_cumul ()
108 194 9 6679 97 109 157 9 6688 97 110 63 8 6696 97 111 250 8 6704 97 112 41 8 6712 97 113 24 8 6720 97 114 210 8 6728 98 115 105 7 6735 98 116 149 7 6742 98 117 195 7 6749 98 118 239 7 6756 98 119 256 6 6762 98 120 103 6 6768 98 121 11 6 6774 98 122 29 6 6780 98 123 43 6 6786 98 124 50 6 6792 98 125 57 6 6798 99 126 220 6 6804 99 127 126 6 6810 99 128 6 5 6815 99 129 156 5 6820 99 130 207 5 6825 99 131 34 5 6830 99 132 42 5 6835 99 133 67 5 6840 99 134 3 5 6845 99 135 112 5 6850 99 136 123 5 6855 99 137 77 5 6860 99 138 18 5 6865 99 139 98 5 6870 100 140 230 3 6873 100 141 9 3 6876 100 142 197 3 6879 100 143 95 3 6882 100 144 106 3 6885 100 145 73 3 6888 100 146 152 3 6891 100 147 240 3 6894 100 148 23 3 6897 100 149 178 3 6900 100
Interprovincial Roadside Truck Survey Technical Appendices
82
Appendix L Tabulations of Trip Origins and Destinations by Truck Classification
Interprovincial Roadside Truck Survey Technical Appendices
83
TOTAL NUMBER OF ALL TRUCKS (12 HOURS_DAY+12 HOURS_NIGHT)
ZONE GROUP O 1-O
ttaw
a C
ente
r
2-IG
B W
est
3-O
ttaw
a W
est
4-O
ttaw
a So
uth
5-IG
B-E
ast
6-O
ttaw
a E
ast
7-H
ull
8-A
ylm
er
9-G
atin
eau
Wes
t
10-G
atin
eau
Eas
t
TO
TA
L
1-Ottawa Center 5 14 3 53 13 49 5 142 2-IGB West 100 36 21 28 185 3-Ottawa West 4 6 104 61 21 74 270 4-Ottawa South 4 155 34 4 97 293 5-IGB-East 11 14 209 73 120 115 543 6-Ottawa East 1 7 11 28 25 19 126 50 29 99 395 7-Hull 69 90 106 73 172 102 3 615 8-Aylmer 80 88 46 68 32 56 369 9-Gatineau West 75 22 42 81 92 32 344 10-Gatineau East 15 6 52 124 66 27 6 295 TOTAL 255 213 261 387 390 259 745 270 244 425 3450 IGB-Inside Green Belt
TOTAL NUMBER OF 2A TRUCKS (12 HOURS_DAY+12 HOURS_NIGHT)
ZONE GROUP O 1-O
ttaw
a C
ente
r
2-IG
B W
est
3-O
ttaw
a W
est
4-O
ttaw
a So
uth
5-IG
B-E
ast
6-O
ttaw
a E
ast
7-H
ull
8-A
ylm
er
9-G
atin
eau
Wes
t
10-G
atin
eau
Eas
t
TO
TA
L
1-Ottawa Center 33 13 18 5 69 2-IGB West 41 15 10 67 3-Ottawa West 36 5 5 12 58 4-Ottawa South 63 24 35 122 5-IGB-East 5 123 46 59 66 298 6-Ottawa East 22 13 62 13 25 53 188 7-Hull 53 64 51 58 88 52 366 8-Aylmer 13 13 27 21 18 18 110 9-Gatineau West 24 18 35 33 44 29 181 10-Gatineau East 6 15 33 40 93 TOTAL 100 95 128 145 212 112 358 115 117 172 1553
TOTAL NUMBER OF 3A+ TRUCKS (12 HOURS_DAY+12 HOURS_NIGHT)
ZONE GROUP O 1-O
ttaw
a C
ente
r
2-IG
B W
est
3-O
ttaw
a W
est
4-O
ttaw
a So
uth
5-IG
B-E
ast
6-O
ttaw
a E
ast
7-H
ull
8-A
ylm
er
9-G
atin
eau
Wes
t
10-G
atin
eau
Eas
t
TO
TA
L
1-Ottawa Center 12 31 44 2-IGB West 49 12 6 6 73 3-Ottawa West 22 23 16 16 77 4-Ottawa South 79 6 85 5-IGB-East 6 8 26 16 51 39 146 6-Ottawa East 6 16 22 7-Hull 9 17 5 48 3 83 8-Aylmer 61 58 13 26 157 9-Gatineau West 48 5 48 48 149 10-Gatineau East 8 5 26 5 43 TOTAL 132 75 27 74 101 37 193 57 105 77 878
TOTAL NUMBER OF TRACTOR TRAILERS (12 HOURS_DAY+12 HOURS_NIGHT)
ZONE GROUP O 1-O
ttaw
a C
ente
r
2-IG
B W
est
3-O
ttaw
a W
est
4-O
ttaw
a So
uth
5-IG
B-E
ast
6-O
ttaw
a E
ast
7-H
ull
8-A
ylm
er
9-G
atin
eau
Wes
t
10-G
atin
eau
Eas
t
TO
TA
L
1-Ottawa Center 5 14 3 7 29 2-IGB West 10 8 5 22 45 3-Ottawa West 4 6 46 32 46 135 4-Ottawa South 4 13 5 4 62 87 5-IGB-East 6 60 11 10 10 98 6-Ottawa East 1 7 11 28 3 6 58 37 4 30 185 7-Hull 7 9 50 15 35 46 3 166 8-Aylmer 6 17 6 46 15 12 102 9-Gatineau West 3 4 3 3 13
10-Gatineau East 1 6 32 65 21 27 6 159 TOTAL 22 44 107 169 77 111 193 97 23 176 1019
Interprovincial Roadside Truck Survey Technical Appendices
84
Appendix M Detailed Comments on Trip Origins and Destinations
Interprovincial Roadside Truck Survey Technical Appendices
85
DETAILED COMMENTS ON TRIPS ORIGINS AND DESTINATIONS
Detailed daily origin-destination desire lines are presented in the Report in Exhibit 18 for all truck trips in Exhibit 19 for 2 axle truck trips in Exhibit 20 for 3+ axle truck trips and in Exhibit 21 for tractor trailer trips Here are summarized some key characteristics
The number of truck trips higher than 50 for all truck classifications collectively or individually is considered to represent strong orientation while 25-50 truck trips are considered to represent a modestly strong orientation Number of truck trips is presented in parenthesis
EXHIBIT 18 (all truck trips) as illustrated in exhibit panel A ndash Trips from the Aylmer district demonstrate a strong orientation to Ottawa East (56) Ottawa Central (80) Ottawa South (68) and IGB West (88) Trips to Aylmer district demonstrate a strong orientation from IGB East (73) and from Ottawa West (61) The trips to Aylmer demonstrate a modestly strong orientation from Ottawa South (34) and from IGB West (36) The Modestly strong orientation of truck trips from Aylmer is demonstrated to IGB East (32) and to Ottawa West (46) B ndash Trips from the Hull district demonstrate a strong orientation to Ottawa Central (69) Ottawa South (73) IGB West (90) Ottawa East (102) Ottawa West (106) IGB East (172) Trips to Hull district demonstrate a strong orientation from Ottawa Central (53) IGB West (100) Ottawa West (104) Ottawa East (126) Ottawa South (155) and IGB East (209) C ndash Trips from the Gatineau West district demonstrate a strong orientation to Ottawa Central (75) Ottawa South (81) and IGB East (92) The trips to Gatineau West demonstrate strong orientation from IGB East (120) Modestly strong orientation is demonstrated from Gatineau West to Ottawa East (32) and Ottawa West (43) In other direction a modestly strong orientation is demonstrated to Gatineau West from Ottawa East (29) and Ottawa Central (49) D ndash Trips from the Gatineau East district demonstrate a strong orientation to Ottawa West (52) IGB East (66) and Ottawa South (124) The trips to Gatineau East demonstrate a strong orientation from Ottawa West (74) Ottawa South (97) Ottawa East (99) and IGB East (115) Modestly strong orientation is demonstrated from Gatineau East to Ottawa East (27) and from IGB West to Gatineau East (28)
EXHIBIT 19 (2 axle truck trips) as illustrated in exhibit panel A ndash Modestly strong orientation of trips from the Aylmer district is demonstrated to Ottawa West (27) as well as from IGB East to Aylmer (46) B ndash Trips from Hull district demonstrate a strong orientation to Ottawa West (51) Ottawa East (52) Ottawa Central (53) Ottawa South (58) IGB West (64) and IGB East (88) The trips to Hull demonstrate a strong orientation from Ottawa East (62) Ottawa South (63) and IGB East (123) Modestly strong orientation is demonstrated to Hull from Ottawa Central (33) Ottawa West (36) and IGB West (41) C ndash Trips to the Gatineau West district demonstrate a strong orientation from IGB East (59)
Interprovincial Roadside Truck Survey Technical Appendices
86
Modestly strong orientation is demonstrated from Gatineau West to Ottawa East (29) Ottawa South (33) Ottawa West (35) and IGB East (44) In opposite direction a modestly strong orientation is demonstrated from Ottawa East to Gatineau West (25) D ndash Trips to the Gatineau East district demonstrate a strong orientation from Ottawa East (53) and from IGB East (66) Modestly strong orientation of trips is demonstrated from Gatineau East to Ottawa South (33) and IGB East (40) as well as from Ottawa South to Gatineau East (35)
EXHIBIT 20 (3+ axle truck trips) as illustrated in exhibit panel A ndash Trips from the Aylmer district demonstrate a strong orientation to IGB West (58) and Ottawa Central (61) while a modestly strong orientation is demonstrated from Aylmer to Ottawa East (26) B ndash Trips to Hull district demonstrate a strong orientation from Ottawa South (79) Modestly strong orientation is demonstrated to Hull from IGB East (26) and from IGB West (49) as well as from Hull to IGB East (48) C ndash Trips to the Gatineau West district demonstrate a strong orientation from IGB East (51) Modestly strong orientation is demonstrated from Gatineau West to IGB East (48) Ottawa South (48) and Ottawa Central (48) as well as from Ottawa Central to Gatineau West (31) D ndash Modestly strong orientation of trips is demonstrated from Gatineau East to Ottawa South (26) and from IGB East to Gatineau East (39)
EXHIBIT 21 (tractor trailer trips) as illustrated in exhibit panel A ndash Trips to the Aylmer district demonstrate a modestly strong orientation from Ottawa West (32) and from Ottawa East (37) In opposite direction a modestly strong orientation is demonstrated from Aylmer to Ottawa South (46) B ndash Trips to Hull district demonstrate a strong orientation from Ottawa East (58) and from IGB East (60) Modestly strong orientation is demonstrated to Hull from Ottawa West (46) as well as from Hull to Ottawa West (50) C ndash There is no a strong or modestly strong orientation of trips tofrom the Gatineau West district tofrom the districts on the Ottawa side of the National Capital Region D ndash Trips to Gatineau East district demonstrate a strong orientation from Ottawa South (62) In the opposite direction a strong orientation of trips is demonstrated from Gatineau East to Ottawa South (65) Modestly strong orientation of trips is demonstrated from Gatineau East to Ottawa East (27) and Ottawa West (33) In the opposite direction a modestly strong orientation of trips is demonstrated to Gatineau East from Ottawa East (30) and from Ottawa West (46)
Interprovincial Roadside Truck Survey Technical Appendices
87
Appendix N Categories of Commodities
Interprovincial Roadside Truck Survey Technical Appendices
88
10
20
30
40
50
Commodity carried and number of All trucks during the day (700-1900)
No COMMODITY NAME NUMBER OF
TRUCKS COMMODITY CATEGORY
NUMBER OF TRUCKS PER COMMODITY CATEGORY
Empty Trucks 1092 1092
1 ALUMINUMS 8 1
472
2 ASPHALT 4 1 3 BRICKS 4 1 4 CARDBOARD TUBES 7 1 5 CEMENT 86 1 6 CEMENT POWDERED 7 1 7 CLAY 33 1 8 CONCRETE 42 1 9 CONSTRUCTION EQUIPMENT 20 1
CONSTRUCTION MATERIALS 7 1 11 DEBRIS 12 1 12 DOOR 8 1 13 DRYWALL 11 1 14 ELECTRICAL MANHOLES 7 1 15 FOAM 7 1 16 KITCHEN CABINETS 13 1 17 LIGHT FIXTURES 5 1 18 MANHOLE COVER FORMS 7 1 19 METAL BEAMS 11 1
METAL SHEETS 16 1 21 NEW JERSEY CEMENT BARRIERS 8 1 22 PAINTING CANVASS 13 1 23 PHONE FOR HYDRO 13 1 24 PLUMBING SUPPLIES 38 1 25 POOL EQUIPMENT 13 1 26 ROOFING MATERIALS 5 1 27 SAND 4 1 28 SHEET METAL 6 1 29 TELEPHONE POLES 7 1
TRANSFORMER 8 1 31 TREE 7 1 32 TRUSS 7 1 33 WINDOWS 21 1 34 WOOD ROOF TRUSS 12 1
35 BAKED GOODS 6 2 36 BOTTLED WATER 11 2 37 BREAD 12 2 38 CAKES 5 2 39 CANNED FOOD 13 2
CHICKEN 20 2 41 CHIPS 11 2 42 COOKIES BISCUITS 12 2 43 COOKIES AND CRACKERS 7 2 44 EGGS 13 2 45 FOOD 21 2 46 FOOD FROZEN 35 2 47 FRIES 7 2 48 MEAT BEEF AND FROZEN GOODS 7 2 49 NESTLE ICE TEA 7 2
PEPSI PRODUCT 16 2
Interprovincial Roadside Truck Survey Technical Appendices
89
No COMMODITY NAME NUMBER OF
TRUCKS COMMODITY CATEGORY
NUMBER OF TRUCKS PER COMMODITY CATEGORY
51 POTATO CHIPS 5 2
285
52 POTATOES 12 2 53 PRODUCE APPLES 5 2 54 PRODUCE MOSTLY BANANAS 3 2 55 SOFT DRINKS 16 2 56 SOYA MILK 12 2 57 VEGETABLES 5 2 58 WATER 25 2
59 ANIMAL FEED 4 3
259
60 BEDROOM FURNITURE 7 3 61 BRAS 5 3 62 CHAIRS 13 3 63 CLEANING SUPPLIES 25 3 64 CLOTHING RACKS 13 3 65 EMPTY PEPSI CANS 12 3 66 FURNITURE 37 3 67 GARBAGE CONTAINERS 12 3 68 HOUSE CONTENTS 13 3 69 HOUSEHOLD GOODS 13 3 70 MAIL 25 3 71 MIRRORS 7 3 72 PARCELS AND PACKAGES 5 3 73 PLANTS 4 3 74 POLY BAGS 7 3 75 SHELVING 5 3 76 SOAP 8 3 77 TABLES 11 3 78 TENT 5 3 79 TOBACCO 7 3 80 TOOLS 13 3 81 TV AND VCRS 7 3 82 USED HOUSEHOLD GOODS 4 3
83 BOXES 26 4
202
84 CARDBOARD BOXES 13 4 85 NEWSPAPERS 12 4 86 NEWSPAPERS SHEETS 8 4 87 NEWSPRINT 8 4 88 PAPER 84 4 89 PAPER PREMIUM 8 4 90 PAPER RECYCLED 12 4 91 PAPER ROLLS 18 4 92 TOILET PAPER 8 4 93 WASTE NEWSPRINT 7 4
94 LUMBER 14 5
152
95 PRESSURE TREATED LUMBER 50 5 96 SAWDUST WOODCHIPS 6 5 97 WOOD 43 5 98 WOOD BOARDS 8 5 99 WOOD CHIPS AND BLOCKS 8 5 100 WOOD PELLETS 8 5 101 WOOD PLANKS 15 5
Interprovincial Roadside Truck Survey Technical Appendices
90
No COMMODITY NAME NUMBER OF
TRUCKS COMMODITY CATEGORY
NUMBER OF TRUCKS PER COMMODITY CATEGORY
102 3 QUARTERS WATER 1 QUARTER ACID 3 6
90
103 ASPHALT WASTE 5 6 104 COMPRESSED GASES OXYGEN 7 6 105 FURNACE OIL 5 6 106 GAS AND LIQUID CO2 13 6 107 GASNO LEAD REG 7 6 108 LIME 3 6 109 LIQUID FERTILER 5 6 110 PESTICIDES 7 6 111 PETROLEUM 7 6 112 PROPANE 16 6 113 PROPANE TANKS 5 6 114 WASTE OIL 6 6
115 ARCHIVES 5 7
103
116 BINDERS 5 7 117 COMPUTER EQUIPMENT 5 7 118 COMPUTERS 28 7 119 ELECTRONIC CASH PRODUCT 5 7 120 GOVERNMENT RECORDS 7 7 121 OFFICE EQUIPMENT 12 7 122 OFFICE FURNITURE 12 7 123 OFFICE SUPPLIES 5 7 124 PRINTING SUPPLIES 13 7 125 STATIONARY 5 7
126 AUTO PARTS 7 8
54
127 BOB CAT 8 8 128 CARS 7 8 129 EQUIPMENT TO FIX TRAILERS 7 8 130 TIRES 20 8 131 TRUCK CABS 7 8
TOTAL 2709 2709 Where Drivers reported some commodity 1617
Empty trucks 1092 ) Commodity names are modified in some cases because of typing errors in the questionnaire
Interprovincial Roadside Truck Survey Technical Appendices
91
5
10
15
20
25
30
35
40
45
50
Commodity carried and number of All trucks during the night (1900-700)
No COMMODITY NAME NUMBER OF
TRUCKS COMMODITY CATEGORY
NUMBER OF TRUCKS PER COMMODITY CATEGORY
Empty trucks 286 286 1 INSULATION 8 1 8
2 BAKERY PRODUCTS 12 2
131
3 BREAD 13 2 4 CHEESE 8 2
DAIRY PRODUCTS 8 2 6 FOOD 3 2 7 FOOD FROZEN 4 2 8 FOOD-DESSERTS 3 2 9 GROCERIES 19 2
JOS LOUIS CAKES 15 2 11 MILK 6 2 12 PICK LES 3 2 13 POULTRY 3 2 14 PRODUCE 5 2
SANDWICH MEATS 12 2 16 SNACK FOODS 15 2
17 ART 3 3
99
18 CLEANING SUPPLIES 1 3 19 DRUG STORE PRODUCTS 4 3
FLOWERS 8 3 21 FRIDGE 15 3 22 FURNITURE 6 3 23 HARDWARE 4 3 24 HOUSEHOLD FURNITURE 3 3
LTL MIXED FREIGHT 3 3 26 MAIL 12 3 27 MIXED FREIGHT 4 3 28 PHARMACEUTICALS 4 3 29 SHOES 4 3
SNOW BLOWER 4 3 31 SPRING MACHINE 12 3 32 STEDMANS MERCHANDISE 3 3 33 STORE SUPPLIES 4 3 34 TOWELS 3 3
FLYERS 4 4
104
36 KLEENEX BOXES 4 4 37 LABELS 4 4 38 NEWSPAPERS 15 4 39 NEWSPRINT 6 4
OLD NEWSPAPER 4 4 41 PAPER 31 4 42 PAPER NEWSPRINT 3 4 43 PAPER PRODUCTS 3 4 44 PAPER RECYCLED 8 4
PAPER ROLLS 6 4 46 SCRAP PAPER 12 4 47 TOILET PAPER 3 4
48 ASPEN IT E 3 5 49 CHIP BOARD 3 5
LOGS 4 5
Interprovincial Roadside Truck Survey Technical Appendices
92
No COMMODITY NAME NUMBER OF
TRUCKS COMMODITY CATEGORY
NUMBER OF TRUCKS PER COMMODITY CATEGORY
51 LUMBER 11 5
44
52 MDF BOARD 3 5 53 WHIFFLE BOARD 3 5 54 WOOD 10 5 55 WOOD PANELS 3 5 56 WOOD PRODUCTS 3 5
57 CALCIUM CARBONATE 1 6
56
58 CHLORATE SODIUM 3 6 59 COLOURED DIESEL 3 6 60 FURNACE FUEL 11 6 61 GAS 4 6 62 GASOLINE 9 6 63 HYDRATED LIME 4 6 64 OMYAFILL SLURRY 1 6 65 OXYGEN 12 6 66 PASTE 3 6 67 SALT 4 6
68 AUTO PARTS 1 8
13
69 CARS 4 8 70 TIRES 3 8 71 VEHICLES 4 8
TOTAL Where Drivers reported some commodity
Empty trucks
741 455 286
741
) Commodity names are modified in some cases because of typing errors in the questionnaire
Interprovincial Roadside Truck Survey Technical Appendices
93
10
20
30
40
50
Commodity carried and number of All trucks during the 24 hour period
No COMMODITY NAME NUMBER OF
TRUCKS COMMODITY CATEGORY
NUMBER OF TRUCKS PER COMMODITY CATEGORY
Empty Trucks 1378 1378 1 ALUMINUMS 8 1
480
2 ASPHALT 4 1 3 BRICKS 4 1 4 CARDBOARD TUBES 7 1 5 CEMENT 86 1 6 CEMENT POWDERED 7 1 7 CLAY 33 1 8 CONCRETE 42 1 9 CONSTRUCTION EQUIPMENT 20 1
CONSTRUCTION MATERIALS 7 1 11 DEBRIS 12 1 12 DOOR 8 1 13 DRYWALL 11 1 14 ELECTRICAL MANHOLES 7 1 15 FOAM 7 1 16 INSULATION 8 1 17 KITCHEN CABINETS 13 1 18 LIGHT FIXTURES 5 1 19 MANHOLE COVER FORMS 7 1
METAL BEAMS 11 1 21 METAL SHEETS 16 1 22 NEW JERSEY CEMENT BARRIERS 8 1 23 PAINTING CANVASS 13 1 24 PHONE FOR HYDRO 13 1 25 PLUMBING SUPPLIES 38 1 26 POOL EQUIPMENT 13 1 27 ROOFING MATERIALS 5 1 28 SAND 4 1 29 SHEET METAL 6 1
TELEPHONE POLES 7 1 31 TRANSFORMER 8 1 32 TREE 7 1 33 TRUSS 7 1 34 WINDOWS 21 1 35 WOOD ROOF TRUSS 12 1
36 BAKED GOODS 6 2 37 BAKERY PRODUCTS 12 2 38 BOTTLED WATER 11 2 39 BREAD 25 2
CAKES 5 2 41 CANNED FOOD 13 2 42 CHEESE 8 2 43 CHICKEN 20 2 44 CHIPS 11 2 45 COOKIES BISCUITS 12 2 46 COOKIES AND CRACKERS 7 2 47 DAIRY PRODUCTS 8 2 48 EGGS 13 2 49 FOOD 24 2
FOOD FROZEN 39 2
Interprovincial Roadside Truck Survey Technical Appendices
94
No COMMODITY NAME NUMBER OF
TRUCKS COMMODITY CATEGORY
NUMBER OF TRUCKS PER COMMODITY CATEGORY
51 FOOD-DESSERTS 3 2
416
52 FRIES 7 2 53 GROCERIES 19 2 54 JOS LOUIS CAKES 15 2 55 MEAT BEEF AND FROZEN GOODS 7 2 56 MILK 6 2 57 NESTLE ICE TEA 7 2 58 PEPSI PRODUCT 16 2 59 PICK LES 3 2 60 POTATO CHIPS 5 2 61 POTATOES 12 2 62 POULTRY 3 2 63 PRODUCE 5 2 64 PRODUCE APPLES 5 2 65 PRODUCE MOSTLY BANANAS 3 2 66 SANDWICH MEATS 12 2 67 SNACK FOODS 15 2 68 SOFT DRINKS 16 2 69 SOYA MILK 12 2 70 VEGETABLES 5 2 71 WATER 25 2 72 ANIMAL FEED 4 3 73 ART 3 3 74 BEDROOM FURNITURE 7 3 75 BRAS 5 3 76 CHAIRS 13 3 77 CLEANING SUPPLIES 26 3 78 CLOTHING RACKS 13 3 79 DRUG STORE PRODUCTS 4 3 80 EMPTY PEPSI CANS 12 3 81 FLOWERS 8 3 82 FRIDGE 15 3 83 FURNITURE 43 3 84 GARBAGE CONTAINERS 12 3 85 HARDWARE 4 3 86 HOUSE CONTENTS 13 3 87 HOUSEHOLD FURNITURE 3 3 88 HOUSEHOLD GOODS 13 3 89 LTL MIXED FREIGHT 3 3 90 MAIL 37 3 91 MIRRORS 7 3 92 MIXED FREIGHT 4 3 93 PARCELS AND PACKAGES 5 3 94 PHARMACEUTICALS 4 3 95 PLANTS 4 3 96 POLY BAGS 7 3 97 SHELVING 5 3 98 SHOES 4 3 99 SNOW BLOWER 4 3 100 SOAP 8 3
Interprovincial Roadside Truck Survey Technical Appendices
95
No COMMODITY NAME NUMBER OF
TRUCKS COMMODITY CATEGORY
NUMBER OF TRUCKS PER COMMODITY CATEGORY
101 SPRING MACHINE 12 3
358
102 STEDMANS MERCHANDISE 3 3 103 STORE SUPPLIES 4 3 104 TABLES 11 3 105 TENT 5 3 106 TOBACCO 7 3 107 TOOLS 13 3 108 TOWELS 3 3 109 TV AND VCRS 7 3 110 USED HOUSEHOLD GOODS 4 3 111 BOXES 26 4
306
112 CARDBOARD BOXES 13 4 113 FLYERS 4 4 114 KLEENEX BOXES 4 4 115 LABELS 4 4 116 NEWSPAPERS 27 4 117 NEWSPAPERS SHEETS 8 4 118 NEWSPRINT 14 4 119 OLD NEWSPAPER 4 4 120 PAPER 115 4 121 PAPER NEWSPRINT 3 4 122 PAPER PREMIUM 8 4 123 PAPER PRODUCTS 3 4 124 PAPER RECYCLED 20 4 125 PAPER ROLLS 24 4 126 SCRAP PAPER 12 4 127 TOILET PAPER 11 4 128 WASTE NEWSPRINT 7 4
129 ASPEN IT E 3 5
195
130 CHIP BOARD 3 5 131 LOGS 4 5 132 LUMBER 25 5 133 MDF BOARD 3 5 134 PRESSURE TREATED LUMBER 50 5 135 SAWDUST WOODCHIPS 6 5 136 WHIFFLE BOARD 3 5 137 WOOD 53 5 138 WOOD BOARDS 8 5 139 WOOD CHIPS AND BLOCKS 8 5 140 WOOD PANELS 3 5 141 WOOD PELLETS 8 5 142 WOOD PLANKS 15 5 143 WOOD PRODUCTS 3 5
144 3 QUARTERS WATER 1 QUARTER ACID 3 6 145 ASPHALT WASTE 5 6 146 CALCIUM CARBONATE 1 6 147 CHLORATE SODIUM 3 6 148 COLOURED DIESEL 3 6 149 COMPRESSED GASES OXYGEN 7 6 150 FURNACE FUEL 11 6
Interprovincial Roadside Truck Survey Technical Appendices
96
No COMMODITY NAME NUMBER OF
TRUCKS COMMODITY CATEGORY
NUMBER OF TRUCKS PER COMMODITY CATEGORY
151 FURNACE OIL 5 6
147
152 GAS 4 6 153 GAS AND LIQUID CO2 13 6 154 GASNO LEAD REG 7 6 155 GASOLINE 9 6 156 HYDRATED LIME 4 6 157 LIME 3 6 158 LIQUID FERTILER 5 6 159 OMYAFILL SLURRY 1 6 160 OXYGEN 12 6 161 PASTE 3 6 162 PESTICIDES 7 6 163 PETROLEUM 7 6 164 PROPANE 16 6 165 PROPANE TANKS 5 6 166 SALT 4 6 167 WASTE OIL 6 6
168 ARCHIVES 5 7
103
169 BINDERS 5 7 170 COMPUTER EQUIPMENT 5 7 171 COMPUTERS 28 7 172 ELECTRONIC CASH PRODUCT 5 7 173 GOVERNMENT RECORDS 7 7 174 OFFICE EQUIPMENT 12 7 175 OFFICE FURNITURE 12 7 176 OFFICE SUPPLIES 5 7 177 PRINTING SUPPLIES 13 7 178 STATIONARY 5 7 179 AUTO PARTS 8 8
67
180 BOB CAT 8 8 181 CARS 11 8 182 EQUIPMENT TO FIX TRAILERS 7 8 183 TIRES 23 8 184 TRUCK CABS 7 8 185 VEHICLES 4 8
TOTAL 3450 3450 Where Drivers reported some commodity 2072
Empty trucks 1378
) Commodity names are modified in some cases because of typing errors in the questionnaire
Interprovincial Roadside Truck Survey Technical Appendices
97
Appendix O Trip Origins and Destinations for Specific Commodities and Detailed Comments
Interprovincial Roadside Truck Survey Technical Appendices
98
Inte
rpro
vinc
ial R
oads
ide
Truc
k Su
rvey
T
echn
ical
App
endi
ces
99
Queacute
be
c Ont
ario
O
ntar
io
Queacute
bec
Queacute
bec
Ont
ario
O
ntar
io
Ayl
mer
Hul
l
Gat
inea
u W
est
Gat
inea
u E
ast
Otta
wa
Eas
t
IGB
Eas
t
Otta
wa
Cen
tral
IGB
Wes
t
Otta
wa
Sou
thO
ttaw
a W
est
Gat
inea
u E
ast
Gat
inea
u W
est
Hul
l
Ayl
mer
Otta
wa
Eas
t
IGB
Eas
tO
ttaw
a C
entr
al
IGB
Wes
t
Otta
wa
Sou
th
Otta
wa
Wes
t
Gat
inea
u E
ast
Gat
inea
u W
est
Hul
l
Ayl
mer
Otta
wa
Eas
t
IGB
Eas
t
Otta
wa
Cen
tral
IGB
Wes
t
Otta
wa
Sou
thO
ttaw
a W
est
Ap
pen
dix
O D
aily
Ori
gin
s an
d D
esti
nat
ion
s fo
r S
pec
ific
C
om
mo
dit
ies
- A
ll T
ruck
Tri
ps
(AU
TU
MN
200
0)
48
Ayl
mer
Hul
l
Gat
inea
u W
est
Gat
inea
u E
ast
Otta
wa
Eas
t
IGB
Eas
t
Otta
wa
Cen
tral
IGB
Wes
t
Otta
wa
Sou
th
Otta
wa
Wes
t
Num
ber
of tr
uck
trip
s an
d di
rect
ion
LE
GE
ND
48
N
umbe
r of
Orig
ins
and
Des
tinat
ions
for
Dis
tric
t
GE
NE
RA
L M
ER
CH
AN
DIS
E O
RIG
INS
AN
D D
ES
TIN
AT
ION
S A
LL
TR
UC
K T
RIP
S
B
WO
OD
amp W
OO
D P
RO
DU
CT
S O
RIG
INS
AN
D D
ES
TIN
AT
ION
S A
LL
TR
UC
K T
RIP
S
D
PA
PE
R amp
PA
PE
R P
RO
DU
CT
S O
RIG
INS
AN
D D
ES
TIN
AT
ION
S A
LL
TR
UC
K T
RIP
S
C
CO
NS
TR
UC
ITO
N M
AT
ER
IAL
S O
RIG
INS
AN
D D
ES
TIN
AT
ION
S A
LL
TR
UC
K T
RIP
S
A
Queacute
bec
The characteristics as portrayed on the exhibit (Appendix O) are summarized in the following
Construction materials trips are portrayed on Panel A These trips are widely dispersed with the stronger links being from Aylmer to Ottawa Central (56 trips) from Ottawa South to Hull (44) from Ottawa Central to Gatineau West (44) from IGB East to Hull (32) and from IGB East to Gatineau West (23)
General merchandise trips are portrayed on Panel B As would be expected there are no particularly strong orientations The stronger bi-directional desire lines being from Hull to Ottawa West (20+21)from Gatineau West to IGB East (26+13) from Gatineau East to IGB East (11+25) and from Hull to Ottawa South (11+17) Some of the stronger uni-directional desire lines being from IGB East to Hull (27) from Ottawa South to Gatineau East (19) from IGB West to Hull (18) from Ottawa South to Aylmer (17) and from Gatineau West to Ottawa West (14)
Paper and paper products trips are portrayed on Panel C As illustrated there are some strong orientations with the stronger bi-directional desire lines being from Gatineau East to Ottawa South (44+31) from Ottawa East to Hull (41+22) Bi-directional desire lines are also presented from Hull to IGB East (19+17) and from Hull to Ottawa West (18+17) Uni-directional desire lines are presented from IGB East to Gatineau East (13) from Ottawa West to Gatineau East (12) and from Hull to IGB East (11)
Wood and wood products trips are portrayed on Panel D As illustrated strong uni-directional desire lines are from Gatineau West to Ottawa South (48) and from Aylmer to Ottawa South (31) while there is a modestly strong orientation from Ottawa East to Gatineau East (16)
Interprovincial Roadside Truck Survey Technical Appendices
100

Tunnel Name Photos Location Length Type AADT Number of Lanes Date Constructed Construction Costs Construction Method
Port Miami Tunnel Miami Florida USA 1300m Underwater
Tunnel Depth (Lowest
Elevation) = ~37m
AADT = 7000
Heavy Traffic = ~16
4 Lanes (2 per tunnel) Start of Construction
May 24th 2010
Opened
August 3rd 2014
Total Project Cost = $1
Billion (USD) [$745 Million
CAD]
Design and Construction
Public-Private Partnership (PPP)
2 Tunnels constructed using a Tunnel
Boring Machine (TBM)
Costs = $667 Million (USD)
Dublin Port Tunnel Dublin Ireland Underground AADT = 15000 4 Lanes (2 per tunnel) Start of Construction
June 1st 2001
euro752 Million (Euro) [$11
Billion CAD]
Built in 5 Sections using 3 Methods
- Cut and Cover
Tunnel Depth (Ground Level
to top of Tunnel) = ~21-23m
Heavy Traffic = ~40
Opened
December 20th 2006
Construction Tender Costs
= euro448 Million (Euro)
- Tunnel Boring
- Pipe Jacking (Under existing
Railway)
Blanka Tunnel Complex Prague City Czech
Republic
6400m
(3 Tunnels)
Underground Unknown 4 Lanes (2 in each
direction)
Start of Construction
2006
$37 Billion (Koruna) [$2
Billion CAD]
Driven (mined) and Cut and Cover
(divided into small sections)
Opened
Expected Early 2015
~$15 Billion (USD) Geological Condtions Generally Rock
formed by Sediment (old sea bed)
Seattle Alaskan Way Viaduct
Replacement Tunnel
Seattle Washington
USA
3200m Underground AADT = 110000 4 Lanes (1 Tunnel
Stacked)
Start of Construction
July 30th 2013
$425 Billion (USD) [$57
Billion CAD]
Single TBM (Worlds Largest)
Opening
Unknown (Under
Construction)
Oakland Caldecott Tunnel Oakland California
USA
Bores 1 amp 2 - 1100m
Bore 3 - 1149m
Bore 4 - 1033m
Underground AADT = 160000 8 Lanes (2 per tunnel) Start of Construction
Bores 1 amp 2 - 1929
Bore 3 - 1960
Bore 4 - 2010
Bore 4 = $417 Million (USD)
[$560 Million CAD]
Bore 4 - New Austrian Tunneling
Method (NATM)
Opened
Bores 1 amp 2 - 1937
Bore 3 - 1964
Bore 4 - 2013
Auckland Waterview Aukland New Zealand 2500m Underground Underground AADT (Predicted 2026) = 6 Lanes (2 Tunnels 3 Start of Construction $17 Billion (NZD) [$15 Public-Private Partnership (PPP)
Connection Tunnel 4500m Total Length 83000 Lanes Each) 2013 Billion CAD]
Earth Pressure Balance TBM
Opening
2017
1
Tunnel Name Photos Location Length Type AADT Number of Lanes Date Constructed Construction Costs Construction Method
Brisbane Clem Jones Tunnel Brisbane Australlia 4800m Underground and
Underwater
AADT = 28000
Low due to the high cost
of tolls rated to carry
~60000 vehday
4 Lanes (2 per tunnel) Star of Construction
September 2006
Opened
March 15th 2010
$32 Billion (AUD) [$31
Billion CAD]
Public-Private Partnership (PPP)
The digging was done using a
boring machine
Calgary Airport Trail Tunnel Calgary Alberta
Canada
620m Underground (under Calgary
Airport Runway)
AADT = Designed to
accommodate 75000
6 Lanes (3 in each
direction)
Start of Construction
July 2011
Opened
May 25th 2014
$295 Million (CAD) Cut and cover method was used prior
to the new runway expansion (tunnel
was constructed before the runway)
Detroit-Windsor Tunnel Windsor Ontario
Canada
Detroit Michigan USA
1570m Underwater
Tunnel Depth (Lowest
Elevation) = ~23m
AADT = 13000 2 Lanes (1 in each
direction)
Start of Construction
1927
Opened
November 3rd 1930
$25 Million (USD) [$33
Million CAD]
Immersed Tube (sections of steel tube
floated into place and sunk into a
trench dug in the river bottom)
Louis-Hippolyte Lafontaine
Bridge-Tunnel
Montreal Quebec
Canada
1391m (Tunnel Only)
Total Length = 1800m
Underwater AADT = 120000 6 Lanes (2 Tunnels 3
Lanes Each)
Start of Construction
1963
Opened
March 11th 1967
$75 Million (CAD) Immersed Tube (sections of steel tube
floated into place and sunk into a
trench dug in the river bottom)
Robertson Tri-Met Tunnel Portland Oregon USA 4710m Underground
LRT Tunnel
NA 2 Rail Lines (1 per
tunnel)
Start of Construction
June 1st 1993
Opened
September 12th 1998
$184 Million (USD) [$247
Million CAD]
TBM and Drilling and Blasting
First mile of the west end was
completed using the conventional
mining technique of drilling and
blasting due to the loose mixture of
materials East end construction
began with a TBM
New Portsmouth Midtown
Immersed Tunnel
Portsmouth Virginia
USA
1278m Underwater AADT = 46000 (2007) Existing = 2 Lanes (1 in
each direction)
New 2 Lanes (one-way
traffic)
New tunnel being built
adjacent to old tunnel to
convert from 2 Lanes to
4 Lanes
New Tunnel
Start of Construction
mid-2012
Opened
Planned 2017
$21 Billion (USD) [28
Billion CAD]
The river will be dredged and the
tunnel will be constructed separetly on
a dry dock Each piece will then be
transported to location using tugboats
and dropped in the dredged canel
Once the tunnel is in final place and
connected to adjacent tunnels backfill
is layered around the segment This is
repeated for all 11 tunnel segments
George Massey Tunnel Vancouver British
Columbia Canada
629m Underwater AADT = ~80000 (2012) 4 Lanes (2 in each
direction)
Start of Construction
March 1st 1957
Opened
May 23rd 1959
$25 Million (CAD) The tunnel is made up of six precast
concrete segments Sections were
floated into postion then sunk into a
shallow trench that had been dug into
the river bed The trench and tunnel
were then covered by a protective
layer of rock
2
Tunnel Name Photos Location Length Type AADT Number of Lanes Date Constructed Construction Costs Construction Method
Vancouver Trans-Canada
Cassiar Connector Tunnel
Vancouver British
Columbia Canada
724m Underground Unknown 6 Lanes (3 per tunnel) Start of Construction
Unknown
$115 Million (CAD) Cut and Cover
Originally opened with 4
Lanes but was designed Opened
to accommodate 6
Lanes total (was
expanded ~2005)
January 12th 1992
Joseph-Samson Tunnel Quebec City Quebec
Canada
280m Underground Unknown 3 Lanes (dynamic lane
reversal technology)
Unknown Unknown Unknown
Palm Jumeirah Vehicular Dubai United Arab 1398m Underwater Unknown 6 Lanes (3 per Start of Construction $145 Million (USD) [$194 Cut and Cover with Sheet-Piled
Tunnel Emirates directiontunnel) 2005 Million CAD] Cofferdam to hold back surrounding
Islands estimated visitors seawater
per day is 20000 Opened
2007
Ville-Marie and Viger Tunnels Montreal Quebec 1500m Underground A-720 AADT=~160000 6 Lanes (3 per Start of Construction Unknown Cut and Cover
(Montreal A-720) Canada directiontunnel) plus Late 1960s
single lanes for onoff
ramps Opened
1974
Wacker Drive Chicago Chicago Illinois USA 3500m Double-decked Highway AADT = 65000
Pedestrians = 60000day
Upper Deck
6 Lanes (with Parking -
3 in each direction)
Lower Deck
4 Lanes (2 in each
direction)
Start of Construction
~1909
Opened
1926
East Extensions
- 1963
$8 Million (USD 1926)
$200 Million (USD) 2001
2002 redesign and
reconstruction between
Michigan Ave and Randolph
St
2001-2002 Upper Deck
Reconstruction
Cast-in-place system flat-slab
longitudinally post-tensioned
reinforced high-performance
concrete
- 1975
- 1986-1987
- 2001-2002 (reconst)
- 2010 (reconst)
Thorold Stone Road Tunnel Thorold Ontario
Canada
840m Underwater
Runs under the Welland
Unknown 4 Lanes (2 per tunnel) Start of Construction
1965
Unknown The Canal section of the tunnel was
poured during the winter months when
the tunnel was drained in order to
Canal (near boat locks)
Opened
1967
minimize impacts on shipping
Concrete sections in the shape of
tubes were poured in a trench to
create the tunnel During the summer
months each end of the tunnel was
constructed
3
shy
Tunnel Name Photos Location Length Type AADT Number of Lanes Date Constructed Construction Costs Construction Method
Dulles International Dulles Airport Virginia 6080m Underground NA 2 People Mover Lines (1 Start of Construction $2 Billion (USD) [$27 Billion Cut and Cover for sections adjacent
Airport AeroTrain Tunnel USA per tunnel) 2004 CAD] to existing infrastructure
People Mover
Opened TBM or NATM for sections under
January 26th 2010 taxiways and concourses
Al Salam Street Tunnel Abu Dhabi United 2400m Underground (Roadway) Unknown 8 Lanes (4 per tunnel) Start of Construction $360 Million (USD) [$483 Cut and Cover
(renamed Sheikh Zayed Arab Emirates October 2007 Million CAD]
Tunnel)
Opened
December 4th 2012
Fraser Canyon Highway Fraser Canyon 7 Tunnels Underground Unknown 2 Lanes (1 in each Start of Construction Unknown Unknown (likely dugblasted based on
Tunnels (7 Total) British Columbia direction 1 Tunnel) 1957 old photography)
Canada Shortest 57m
Longest 610m Opened
1964
East-West Access Road Highway stretching the Total Highway Length = HighwayUnderground Unknown 6 Lanes Start of Construction $112 Billion (USD) [$153 12 Tunnels 70 Viaducts 60
Annaba Algeria complete Northern 1216km 2009 Billion CAD] Interchanges
border of Algeria
5 Tunnels Opened Construction Method Unknown
August 2014
Laeligrdal Tunnel Connects the cities 2451km Underground AADT = 1000 2 Lanes (1 in each Start of Construction $1131 Million (USD) Drilling and Blasting
Bergen and Oslo
in Norway
direction 1 Tunnel) 1995 [$1517 CAD]
Opened
2000
4
Tunnel Name Photos Problem Being Solved Community Impacts TollingOther Funding for
Operating and Maintenance Unforseen Problems Dangerous Goods Treament
Port Miami Tunnel Before the tunnel was opened the only
route for Port Miami traffic was through
downtown Miami As future plans to expand
the ports capacity proceeded there was
concern on how the increased truck vehicle
traffic would affect already congested
downtown Miamis economy and growth
Therefore a tunnel was needed to connect
Miami Port traffic directly to the MacArthur
Causeway (which connects to I-95 via Ishy
395)
The port has been losing cruise ship and cargo
traffic to Port Everglades and Fort Lauderdale
over the years due to the port layout and access
issues The new tunnel will help provide better
access to the cruise ship and cargo ports
making them a more competetive port in the
area Also due to the decrease in Port Traffic
through downtown Miami the ecomonic growth
and expansion of the downtown core will not be
hindered
No Toll
Florida Department of Transportation
fully funds the tunnel operation and
maintenance
Miami Access Tunnel (contractor) requested money from
a $150 Million (USD) reserve fund as there was an
unexpected need to grout the limestone beneath the
surface to help the TBM cut more smoothly The FDOT
denied the request for more money to the contractor
Dangerous goods are prohibited
Dublin Port Tunnel To remove heavy goods trucks from
the city-centre streets of Dublin as they
travel to the surrounding highways from the
Dublin Port
The tunnel construction employed 5000 people No Tolls for all commercial vehicles
above 35 tonnes buses with more than
25 seats and vehicles driven by
physically disabled drivers that have
been adapted for physically disabled
drivers
For all other vehicles tolling ranges from
euro3 to euro10 This is to deter non-
commercial vehicles from using this
route
During the hard-rock boring vibration caused some
damage to houses in the Marino Area A total of 241
claims were reimbursed
There was a problem with the height as many critics
argued that the 465m height isnt enough and rather a
55m height would be needed in order to accommodate
all sizes of trucks
Dangerous goods are Prohibited
(they provide a list of restricted
items)
Blanka Tunnel Complex Relieve heavy traffic through the historic
centre of Prague (congestion issues)
Unknown Unknown Political disputes (financial) contributed heavily to delays
(almost 4 years - was originally to be completed by
2011)
Unknown
Seattle Alaskan Way Viaduct Replacing the SR-99 Alaskan Way Viaduct The improved transportation and accessibility Tolled After 3 weeks for drilling the project was already 2 Unknown
Replacement Tunnel which is a 60-year old double-deck highway
that spans Seattles downtown waterfront
Due to a significant earthquake in 2001
(magnitude 68) the existing structure sunk
several inches and needed significant
repairs - which were completed If the
earthquake would have lasted a few
seconds longer engineers say the structure
would have collapsed
will help create better economic and social
prospects for those living in the area
weeks behind schedule due to problems with fiberglass
near the front of the drill and a labor dispute
In Dec 2013 the TBM struck a steel pipe which had been
installed for exploratory drilling in the planning phase of
the project This damaged the TBM requiring a 37m
shaft to be constructed to repair the TBM This delay
lasted over 1 year
Oakland Caldecott Tunnel To ease traffic congestion and end the
process of manually reversing the flow of
traffic twice a day along the middle bore
Unknown No Toll Weather conditions can vary greatly from one end
of the tunnel to the other Weather conditions should be
taken into consideration for safety reasons
Due to the Caldecott Tunnel
fire in 1982 which killed 7 people
it is illegal to transport hazardous
material in a tanker truck through
the tunnel except during the
hours of 300 am and 500 am
(light traffic times)
Auckland Waterview The tunnels will connect the Southwestern 205 houses had to be demolished No Toll Unknown Unknown
Connection Tunnel and Northwestern Motorways to complete
the Western Ring Route - a 27km long
alternative Motorway around the city In
addition the tunnels will take traffic off local
roads
The New Zealand Transportation Agency is
working to keep down construction noise have
minimal traffic impacts and surpress dust and
mud to keep residents happy during
construction
5
Tunnel Name Photos Problem Being Solved Community Impacts TollingOther Funding for
Operating and Maintenance Unforseen Problems Dangerous Goods Treament
Brisbane Clem Jones Tunnel Designed to help alleviate traffic congestion
in the downtown core of the Brisbane
(Central Business District and Fortitude
Valley)
Connects to the Airport Link Tunnel which
connects to Brisbane Airport reducing
travel times
Due to the high cost of tolling only a small
reduction (~5) in vehicles on by-passed areas
was observed while during a free promotion
period a ~10-20 decrease in vehicles in byshy
passed areas was observed
Tolling ranges from $150 to $990
(AUD)
Utilizes an Electronic Tolling System
(vehicles either use a transponder or
license plate technology is implemented)
Due to the high cost of tolling utilization of the tunnels
after opening was signifcantly less than expected
Controversy over environmental hazards from
construction and operations Moreover the expected air
pollution from the ventilation stacks and their proposed
locations
Issues due to difficult drilling conditions were
encountered (Brisbane Tuff Rock)
Dangerous goods are prohibited
Any vehicles carrying commercial
quanities of dangerous goods and
specifically any vehicle displaying
a dangerous goods placard are
prohibited
Calgary Airport Trail Tunnel Improved connectivity to Calgary Airport
Built in response to the Calgary Airport
Runway expansion which would intersect
existing roadwaysairport connections
Improved connectivity between the community
and airport
No major impacts as land was previously farm
land (issues more related to the airport
expansion)
No Toll 55 Month delay due to existing soil conditions
6 Month delay due to electrical scope of work
Dangerous goods are prohibited
Detroit-Windsor Tunnel In the early 1900s private boats and
ferries would carry passangers and freight
between Canada and the USA (particularly
difficult with ice in the winnter) Therefore
building a tunnel or bridge eased access
between the 2 countries
The tunnel has led to an increase in trade and
ease of movement between the 2 countries
Entering the USA there is a $450 (USD)
Toll
Entering Canada there is a $475 (USD)
Toll
Unknown All hazardours products are
prohibited (oil gas paint fuel) in
the tunnel The tunnel is not
dedicated for commercial use
Louis-Hippolyte Lafontaine
Bridge-Tunnel
Constructed to connect the Trans-Canada
Highway (was the last link)
A tunnel was chosen for half the structure
in order to minimize impacts on nearby port
operations
Built in time for Expo-67 which was help in
Montreal in 1967
No Toll Unknown Dangerous goods are prohibited
Robertson Tri-Met Tunnel When the MAX west line was designed it
was originally planned to run adjacent to
the Sunset Highway However due to
weather condition public opinion and
environmental concerns it was determined
that the better alignment was a tunnel
through the Tualatin Mountains
Unknown NA Due to unexpected geological conditions (loose layers of
silt gravel balsalt etc) the tunnel boring machine did
not always work properly contributing heavily to the
project cost moving from $1037 Million to $184 Million
NA
New Portsmouth Midtown
Immersed Tunnel
Due to congestion issues a second tunnel
is needed to help increase capacity for east-
west travel in Portsmouth across the river
Reduced travel time and congestion for east-
west travel
Tolling began February 1 2014 and is
expected to continue until April 13 2017
to help fund the expansion (new tunnel)
project
Rates = $1-3 (USD) each way
Electronic Tolling (E-Z Pass or License
Plate)
Uknown Dangerous goods are prohibited
George Massey Tunnel The tunnel helps to connect the City of
Richmond with the Corporation of Delta
At peak rush hour periods a reversible lane
technology is used to help with congestion
(dynamic arrows and swing gates)
The tunnel is part of the Vancouver to
Tsawwassen Ferry bicycle route Due to bicycle
restrictions this is argued as a major choking
point on the route
There have been no tolls since 1960 The tunnel is reaching its lifespan (~10 years left) The
government of BC has decided to replace the tunnel with
a new bridge with construction slated to begin in 2017
Unknown
6
Tunnel Name Photos Problem Being Solved Community Impacts TollingOther Funding for
Operating and Maintenance Unforseen Problems Dangerous Goods Treament
Vancouver Trans-Canada
Cassiar Connector Tunnel
The tunnel eliminates at-grade intersections
of the Trans Canada Highway and the city
street system and improves traffic flow to
and from the Second Narrows Bridge
The tunnel has led to the removal of the last
remaining traffic lights on the Trans Canada
No Toll Unknown Dangerous goods are prohibited
Exceptions may occur at
specified times and with written
permission
Joseph-Samson Tunnel To connect the east side of downtown
Quebec City the Riviere Saint Charles
Bridge
Unknown No Toll Unknown Dangerous goods are prohibited
Palm Jumeirah Vehicular
Tunnel
A tunnel was needed in order to connect
the spine of The Palm Island to the outter
Crescent
Unknown No Toll Unknown Hazardous loads are not
restricted in the tunnel However
an automatic number plate reader
system is utilized which reads the
hazardous warning plate on a
vehicle when it enters and leaves
the tunnel This system helps
emergency services determine
what type of emergency they are
responding too if an accident was
to occur in one of the tunnels
Ville-Marie and Viger Tunnels
(Montreal A-720)
To create a fast and effective way to move
through the downtown core of Montreal
Unknown No Tolls On July 31st 2011 part of the interior roof collapsed The
tunnel was closed for repairs until August 6th 2011
Dangerous goods are prohibited
Wacker Drive Chicago Originally the highway was built to help
beautify the city and relieve congestion
The highway was built to replace South
Water and River Street
Extension were built in later years to extend
the highway to the east
Unknown No Toll Unknown
Thorold Stone Road Tunnel Highway 58 had to be continued so this
tunnel was constructed underneath the
Welland Canal
Unknown No Tolls During construction the concrete was poured during the
winter months of the year This has led to over-expansion
of the concrete resulting in some cracking Extensive
work has been done to correct this issue during the
summer months of the year which has had impacts on
traffic flow and congestion
Unknown
7
Tunnel Name Photos Problem Being Solved Community Impacts TollingOther Funding for
Operating and Maintenance Unforseen Problems Dangerous Goods Treament
Dulles International The system was built to replace mobile Unknown NA NA
Airport AeroTrain Tunnel lounges (buses) which moved passengers
from the Concourse to the Terminal
Al Salam Street Tunnel
(renamed Sheikh Zayed
Tunnel)
Al Salam Street is the main street in Abu
Dhabi Which connects the downtown
business sector with the 2 main bridges to
Unknown No Toll Unknown Dangerous goods are prohibited
the city Adding a tunnel under the main
road helps with congestion and reducing
travel times along the corridor
Fraser Canyon Highway To complete the Trans Canada Highway Unknown No Toll Unknown Unknown
Tunnels (7 Total) (Highway 1)
Very rural area
East-West Access Road The project will help reduce travel times Construction generated over 100000 jobs Tolled Cost Unknown Unknown Unknown
Annaba Algeria and provide better and safer access to the
north side of the country helping to
stimulate economic development
Laeligrdal Tunnel Due to harsh winters highways and ferries
between the two cities could not remain
Unknown No Tolls Unknown Unknown
open during the winter The tunnel provides
all-season access between the two cities
8
Tunnel Name Photos Inclusion of Vehicles Other than Trucks
Permitted Success of the Tunnel Other Comments
Port Miami Tunnel Trucks use right lane and carsother use left lane
Pedestrians and cyclists are prohibited from the tunnel
The project coincides with other projects which will increase port
traffic such as the Port of Miami Deep Dredge Project and Panama
Canal Expansion
Much public speculation that the project was unnecessary and a
waste of tax payer dollars
Very similar purposeproblem being
resolved to the King Edwards Truck
Tunnel in Ottawa
Dublin Port Tunnel Tolls for all non-truckbus traffic to deter other vehicles
from using the tunnel
The tunnel did in the end remove trucks from the streets of Dublin
but many problems were encountered during construction including
water leaks cost overruns height controversy and house damage
Blanka Tunnel Complex Unknown Tunnel is still under construction Located a few hundred metres from the
protected area of Prague Castle
Seattle Alaskan Way Viaduct
Replacement Tunnel
All types of vehicles permitted Tunnel is still under construction Utilizes the Worlds Largest Tunnel
Boring Machine
Oakland Caldecott Tunnel All types of vehicles permitted
Pedestrians and cyclists are prohibited from the tunnel
Unknown All four bores cross the Hayward Fault
Zone
Auckland Waterview
Connection Tunnel
Unknown Tunnel is still under construction 10th Largest Tunnel Boring Machine
Ever Built
9
Tunnel Name Photos Inclusion of Vehicles Other than Trucks
Permitted Success of the Tunnel Other Comments
Brisbane Clem Jones Tunnel Any vehicles are permitted except the following
- Vehicles and loads exceeding 46m high
- Vehicles carrying commercial quantities of dangerous
goods and specifically any vehicle displaying a
dangerous goods placard
- Mopeds
- Tractors
- Bicycles
Due to the high toll costs and inherent low demand for the tunnel the
bridge has not been as successful as planned due to extremely low
usage
Tunnel was sold in 2013 to Queensland Motorways for $618 Million
(AUD) well below the cost of $31 Billion (AUD) to build it
Very similar situation to Hwy 407 in
Toronto Ontario Canada
Calgary Airport Trail Tunnel All types of vehicles permitted Unknown
Detroit-Windsor Tunnel Motorcyles are prohibited in the tunnel About 13000
vehicles travel throught he tunnel daily 98 of them are
cars
Unknown
Louis-Hippolyte Lafontaine
Bridge-Tunnel
All types of vehicles permitted
Pedestrians and cyclists are prohibited from the tunnel
Unknown
Robertson Tri-Met Tunnel NA Unknown The tunnel is constructed through 16
million year old basalt layers - therefore
the tunnel curves updown and side to
side in order to follow the best rock
construction conditions
New Portsmouth Midtown
Immersed Tunnel
All types of vehicles permitted
Pedestrians and cyclists are prohibited from the tunnel
Tunnel is still under construction
George Massey Tunnel The tunnel is illegal for cyclists or pedestrians to traverse
Shuttle buses operate to provide access through the
tunnel for pedestrians and cyclists (the tunnel is part of
the Tsawwassen Ferry Bicycle Route)
Successful However 50 years later it does have traffic congestion
issues
The Geroge Massey Tunnel was the
first tunnel to use a precast construction
method (precast concrete sections) in
North America
10
Tunnel Name Photos Inclusion of Vehicles Other than Trucks
Permitted Success of the Tunnel Other Comments
Vancouver Trans-Canada
Cassiar Connector Tunnel
All types of vehicles permitted No pedestrians are
permitted
Unknown
Joseph-Samson Tunnel All types of vehicles permitted
Pedestrians and cyclists are prohibited from the tunnel
Unknown
Palm Jumeirah Vehicular
Tunnel
All types of vehicles permitted
Pedestrians and Bicycles are prohibited from the tunnel
Unknown Third tunnel in the world to be equiped
with Traficons Incident Detection
System (includes traffic incident
detection and flow monitoring traffic
data collection and pedestrian
detection)
Ville-Marie and Viger Tunnels
(Montreal A-720)
All types of vehicles permitted Unknown
Wacker Drive Chicago Unknown Unknown
Thorold Stone Road Tunnel All types of vehicles permitted There is a walkway in the
westbound side for pedestrians
Unknown
11
Tunnel Name Photos Inclusion of Vehicles Other than Trucks
Permitted Success of the Tunnel Other Comments
Dulles International
Airport AeroTrain Tunnel
People Mover (AeroTrain) Unknown
Al Salam Street Tunnel
(renamed Sheikh Zayed
Tunnel)
All types of vehicles under 55m and under 25 tonnes
are permitted Pedestrians and cyclists are prohibited
from the tunnel Cameras are used to detect vehicle
height and detect when a vehicle taller than 55m has
entered the tunnel
Unknown
Fraser Canyon Highway
Tunnels (7 Total)
All types of vehicles permitted Cyclists are also
permitted
Unknown Two of the tunnels having warning lights
which cyclists activate prior to entering
the tunnel to notify motorists (due to
winding road conditions)
East-West Access Road
Annaba Algeria
Unknown Uknown
Laeligrdal Tunnel All types of vehicles permitted
Pedestrians and cyclists are prohibited from the tunnel
Tunnel is very rural
Unknown Longest Road Tunnel in the World
Tunnel is divided into 4 segments
seperated by large mountain caves The
main tunnel utilizes white lights while
the caves are different colours to beak
routine They also help with
claustrophobia
12
Tunnel Name Photos Web LINKS
Port Miami Tunnel httpwwwportofmiamitunnelcom
httpenwikipediaorgwikiPort_Miami_Tunnel
Dublin Port Tunnel httpdublintunnelieabout
httpenwikipediaorgwikiDublin_Port_Tunnel
httpwwwengineersjournalieoperations-dublin-tunnel
httpdublintunneliehauliers23_6_2008_Dangerous_Goods_Regspdf
Blanka Tunnel Complex httpwwwradioczensectioncurraffrsmassive-blanka-tunnel-has-been-completed-aftershy
years-of-delays
httpwwwcttaorgFileUploadita2007PdfCH-178pdf
httpwwwsatraczenblanka-tunnel-complex
httpenwikipediaorgwikiBlanka_tunnel_complex
httpwwwita-aitesczenpodzemni_stavbypodzemni_stavby_ve_vystavbeblanka-complexshy
tunnels-praguehtml
Seattle Alaskan Way Viaduct
Replacement Tunnel
httpwwwwsdotwagovProjectsViaductAboutTunneling
httpenwikipediaorgwikiAlaskan_Way_Viaduct_replacement_tunnel
httpwwwworldfinancecominfrastructure-investmentalaskan-way-viaduct-replacement-toshy
reshape-seattles-future
Oakland Caldecott Tunnel httpenwikipediaorgwikiCaldecott_Tunnel
httpwwwcaldecott-tunnelorg
Auckland Waterview
Connection Tunnel
httpwwwnztagovtnzprojectswaterviewconnection
httpenwikipediaorgwikiWaterview_Connection
13
Tunnel Name Photos Web LINKS
Brisbane Clem Jones Tunnel httpwwwclem7comaucontent22338Working-With-Our-Community
httpenwikipediaorgwikiClem_Jones_TunnelPoor_patronage
httpwwwbrisbaneqldgovautraffic-transportroads-infrastructure-bikewaystunnelsshy
bridges-transport-linksclem7-tunnel
httpwwwsmhcomaubusinessturning-3b-into-618m-brisbanes-failed-clem7-tunnel-soldshy
off-20130927-2uihwhtml
Calgary Airport Trail Tunnel httpenwikipediaorgwikiCalgary_International_Airport
httpwwwcalgarycaTransportationTIPagesRoad-projectsAirport-Trail-Tunnelaspx
httpconftac-atccaenglishannualconferencetac2013session10linpdf
httpwwwpclcomprojects-that-inspirepagesairport-trail-underpassaspx
Detroit-Windsor Tunnel httpenwikipediaorgwikiDetroitE28093Windsor_Tunnel
httpwwwdwtunnelcomAboutUsaspx
httpprojectswindsorpubliclibrarycomdigifleetwayhistophplang=enampstory=1
Louis-Hippolyte Lafontaine
Bridge-Tunnel
httpenwikipediaorgwikiLouis-Hippolyte_Lafontaine_BridgeE28093Tunnel
httpwwwmontrealroadscomcrossingslafontaine
httpwwwtrucknewscomfeaturesquebec-to-harmonize-dangerous-goods-regulations
Robertson Tri-Met Tunnel httpenwikipediaorgwikiRobertson_Tunnel
httpconferenceswsueduformsbridgeinspectorspresentations138apdf
New Portsmouth Midtown
Immersed Tunnel
httpwwwfhwadotgovipdproject_profilesva_midtown_tunnelaspx
httpswwwdriveertcomconstructionmidtown-tunnel
httpenwikipediaorgwikiMidtown_Tunnel_(Virginia)
httpwwwtunneltalkcomMidtown-Tunnel-Dec11-PPP-contract-awardedphp
httpwwwroadstothefuturecomMid_Tunn_Port_Norf_MLKhtml
httpswwwdriveertcomfaq
httpwwwdmvnowcomwebdocpdfdmv109pdf
George Massey Tunnel httpenwikipediaorgwikiGeorge_Massey_TunnelConfiguration
httpwww2newsgovbccanews_releases_2013-20172013PREM0095-001430pdf
httpengagegovbccamasseytunnel
14
Tunnel Name Photos Web LINKS
Vancouver Trans-Canada
Cassiar Connector Tunnel
httpswwwgooglecaurlsa=tamprct=jampq=ampesrc=sampsource=webampcd=8ampved=0CD4QFjAHampu
rl=http3A2F2Fwwwtunnelcanadaca2Fdocumentshy
loadphp3Fdir3D199426file3DBruce_et_al_1994pdfampei=VKX4VN6bL5alyAS6hoC
QAQampusg=AFQjCNEdndSmvvPiCZFLpi7FBw-SHAurqgampsig2=rPshy
iZfilrpx_ZhniYW3ypAampbvm=bv87519884daWwampcad=rja
httpenwikipediaorgwikiCassiar_Tunnel
httpwwwquickscribebccasecurepdfs3232pdf
Joseph-Samson Tunnel httpwww2publicationsduquebecgouvqccadynamicSearchtelechargephptype=1ampfile=
5021PDF
httpwwwnyx-hemeracomenprojectsitem45-tunnel-joseph-samson-in-quebec-cityshy
canada
Palm Jumeirah Vehicular
Tunnel
httpwwwparsonscomprojectsPagespalm-jumeirah-vehicular-tunnelaspx
httpwwwdesignbuild-networkcomprojectspalm-jumeirah
httpwwwworldhighwayscomcategoriesroad-highway-structuresfeatureskeepingshy
tunnels-safe
Ville-Marie and Viger Tunnels
(Montreal A-720)
httpstructuraenetstructuresville-marie-tunnel
httpwww2publicationsduquebecgouvqccadynamicSearchtelechargephptype=2ampfile=
2F2FC_24_22FC24_2R43_Ahtm
httpenwikipediaorgwikiQuebec_Autoroute_720
httpwwwmontrealroadscomroadsA-720
Wacker Drive Chicago httpenwikipediaorgwikiMultilevel_streets_in_Chicago
httpenwikipediaorgwikiWacker_Drive
Thorold Stone Road Tunnel httpwwwniagarafrontiercomchr
onohtml
httpenwikipediaorgwikiThorold_Tunnel
httpenwikipediaorgwikiOntario_Highway_58
15
Tunnel Name Photos Web LINKS
Dulles International
Airport AeroTrain Tunnel
httpwwwmetwashairportscomfileaerotrain_paperpdf
Al Salam Street Tunnel
(renamed Sheikh Zayed
Tunnel)
httpwwwparsonscomMedia20LibraryParsons-in-MENApdf
httpwwwlouisberger-francecomennews-and-events76-ouverture-du-tunnel-de-la-rue-alshy
salam-abu-dhabi
httpwwwthenationalaeuaetransportabu-dhabis-sheikh-zayed-tunnel-project-winsshy
prestigious-award
httpwwwthenationalaenewsuae-newssalam-street-tunnel-renamed-and-now-open-toshy
the-public
httpwwwlouisbergergroupcomOurProjectsMiddle20EastSheikh20Zayed20Street
Fraser Canyon Highway
Tunnels (7 Total)
httpenwikipediaorgwikiFraser_CanyonTunnels
httpwwwthgovbccapublicationsfrontiertofreewayfrontiertofreewaypdf
East-West Access Road
Annaba Algeria
httpwwwcetmoorgpdf03Physical20State20Transshy
Maghreb20Motorway20Axis_SUfMpdf
httpenwikipediaorgwikiAlgeria_EastE28093West_Highway
Laeligrdal Tunnel httpenwikipediaorgwikiLC3A6rdal_Tunnel
httpbasementgeographercomlaerdal-tunnel-the-worlds-longest-road-tunnel
httpwwwengineeringcomLibraryArticlesPagetabid85ArticleID60Laerdal-Tunnelaspx
16
Catalogue no 16‑002‑X ISSN 1913‑4320
EnviroStats
Trucking dangerous goods in Canada 2004 to 2012
by Sagal Searag Greg Maloney and Larry McKeown Environment Energy and Transportation Statistics Division
Release date February 11 2015
How to obtain more information For information about this product or the wide range of services and data available from Statistics Canada visit our website wwwstatcangcca
You can also contact us by
email at infostatsstatcangcca
telephone from Monday to Friday 830 am to 430 pm at the following toll‑free numbers
bull Statistical Information Service 1‑800‑263‑1136 bull National telecommunications device for the hearing impaired 1‑800‑363‑7629 bull Fax line 1‑877‑287‑4369
Depository Services Program
bull Inquiries line 1‑800‑635‑7943 bull Fax line 1‑800‑565‑7757
Standards of service to the public Statistics Canada is committed to serving its clients in a prompt reliable and courteous manner To this end Statistics Canada has developed standards of service that its employees observe To obtain a copy of these service standards please contact Statistics Canada toll‑free at 1‑800‑263‑1136 The service standards are also published on wwwstatcangcca under ldquoAbout usrdquo gt ldquoThe agencyrdquo gt ldquoProviding services to Canadiansrdquo
Note of appreciation Canada owes the success of its statistical system to a long‑standing partnership between Statistics Canada the citizens of Canada its businesses governments and other institutions Accurate and timely statistical information could not be produced without their continued co‑operation and goodwill
Standard table symbols The following symbols are used in Statistics Canada publications
not available for any reference period
not available for a specific reference period
not applicable 0 true zero or a value rounded to zero 0s value rounded to 0 (zero) where there is a meaningful
distinction between true zero and the value that was rounded p preliminary r revised x suppressed to meet the confidentiality requirements
of the Statistics Act E use with caution F too unreliable to be published significantly different from reference category (p lt 005)
Published by authority of the Minister responsible for Statistics Canada
copy Minister of Industry 2015
All rights reserved Use of this publication is governed by the Statistics Canada Open Licence Agreement
An HTML version is also available
Cette publication est aussi disponible en franccedilais
Statistics Canada mdash February 2015 EnviroStats 1
Trucking dangerous goods in Canada 2004 to 2012
by Sagal Searag Greg Maloney and Larry McKeown Environment Energy and Transportation Statistics Division
Highlights bull The Canadian for-hire trucking industry moved 650 million tonnes of freight in 2012 of which almost 17 consisted
of dangerous goods
bull In 2012 crude petroleum products accounted for the largest share of dangerous goods at over one-third (38) up from one-quarter (25) in 2004
bull During 2012 the for-hire trucking industry is estimated to have transported approximately four times the dangerous goods by weight than did railways
Introduction Recent events have heightened public awareness concerning the transportation of dangerous goods While economic regulation of Canadarsquos transportation sector has been reduced over the last 25 years the movement of dangerous goods continues to be carefully regulated Compared to other freight shipments of explosives gases flammable liquids flammable solids oxidizing substances poisonous and infectious substances nuclear substances corrosives and other products pose public safety and environmental risks1 The consequences of accidents or spills can be severe particularly if shipments travel through population centres or fragile ecosystems2
Regulations on the movement of dangerous goods can vary by jurisdiction but generally require accurate classification appropriate means of containment and correct marking labelling and documentation In Canada federal legislation currently prohibits the transportation of certain high risk dangerous goods unless an Emergency Response Assistance Plan (ERAP) has been submitted and approved The plan outlines how specialized emergency response personnel will react to
an accident and their overall capacity to respond As dangerous goods are likely to remain a significant portion of the overall freight moved across the country there is a recognized need to further enhance the monitoring of these shipments
For instance in June of 2014 Transport Canada amended the Transportation of Dangerous Goods Regulations to clarify the criteria for displaying safety marks3 The regulation now requires safety marks to be displayed on trucks rail cars and bulk containers used to transport dangerous goods identifying the type of goods and the nature of the risk posed And in August Transport Canada launched the second stage of consultations concerning adequate railway third party liability insurance in order to cover among other costs the spill of contaminants and environmental damage related to railway operation4
Surface transportation (ie road and rail excluding pipelines) is estimated to move almost 95 of the total tonnage of dangerous goods in Canada with trucking accounting for the largest share5 The possibility that accidents might occur at any time or any location
1 Dangerous goods are defined by the Transportation of Dangerous Goods Act 1992 as products substances or organisms in any of these nine classes Based on their inherent nature these goods are further classified from Packing Group I indicating great danger to Packing Group III indicating minor danger
2 For example estimated costs to clean-up the 2010 spill of diluted bitumen into Michiganrsquos Kalamazoo River basin now exceed $1-billion De Souza M 2014 ldquoThe pipeline proposals feeding Harperrsquos oil gridrdquo Power amp Influence The Business Issue Vol 3 no 3 Hill Times Publishing
3 Government of Canada 2014 Regulations Amending the Transportation of Dangerous Goods Regulations (Part 4 Dangerous Goods Safety Marks) PC 2014-684 June 12 2014 SOR2014-159 Canada Gazette Vol 148 no 14 July 2 2014
4 Transport Canada 2014 Comprehensive Review of the Third Party Liability and Compensation Regime for Rail TP 15242 E wwwtcgccamediadocuments policyDiscussion-Paper-Compensation-Liabilitypdf (accessed September 19 2014)
5 Provencher M 2010 The Movement and Handling of Dangerous Goods in Canada for the Year 2008 Transport Canada Transport Dangerous Goods Directorate Ottawa
2 EnviroStats February 2015 mdash Statistics Canada
Trucking dangerous goods in Canada 2004 to 2012
Chart 1 Total goods trucked by type Canada 2004 to 2012
weight (thousands of tonnes)
700000
600000
500000
400000
300000
200000
100000
Other goods Dangerous goods
Source Statistics Canada Environment Energy and Transportation Statistics Division Trucking Commodity Origin and Destination Survey (survey number 2741) various years
2004 2005 2006 2007 2008 2009 2010 2011 2012 0
between the origin and destination raises questions concerning the nature of these types of shipments To provide some perspective this study examines the dangerous goods
transported by the Canadian for-hire trucking industry from 2004 to 2012 focusing on tonnage types of goods and average distance per shipment
Increasing weight shipped
In 2012 the combined weight of all commodities moved by Canadian for-hire trucking establishments reached
What you should know about this study Statistics Canadarsquos Trucking Commodity Origin and Destination Survey (TCOD) targets large (annual revenue gt $13 million) establishments in the Canadian for-hire trucking industry (North American Industry Classification System 484) It excludes foreign-based trucking establishments operating in Canada and non-trucking establishments with their own fleets (ie private trucking) As such TCOD estimates should be considered as a lower boundary of total trucking activity in Canada For comparison for-hire trucking establishments in the United States accounted for just 58 of dangerous goods trucked by weight in 2012 but averaged over 45 times the distance shipped
Over the study period the number of target establishments ranged roughly from 2100 to 2900 in 2012 92 of 2196 establishments responded to the survey Statistics Canada interviewers visit each establishment and using a systematic sample of shipping documents record information on the origin and destination of shipments as well as the weight and type of goods The coefficient of variation (CV) by weight was calculated at less than 5 for all types of shipments in 2012
Commodities are classified to a Standard Classification of Transported Goods (SCTG) aggregation which includes about 500 groups In many cases all commodities in a group are considered dangerous while in other groups some are dangerous and others are not In the second case an algorithm based on Transport Canada information is used to apply a flag that reflects the likelihood that the shipment includes dangerous goods In 2012 97 of shipments by weight flagged as dangerous goods were classified to SCTG groups in which all goods are dangerous such as Petroleum products In comparison shipments of Glues and prepared glues were considered as dangerous 18 of the time
over 650 million tonnes a record amount culminating from steady growth experienced following the 2009 economic downturn (Chart 1) A key portion of these shipments in 2012 consisted of dangerous goods at just over 107 million tonnes (17 of all goods) up from the 81 million tonnes (or 14) trucked in 2004 This represents an increase of 32 since 2004 almost twice the rate of growth of the industryrsquos overall shipments (17) during this same period
Road versus rail Recent derailments have served to increase the level of scrutiny associated with the movement of dangerous goods by rail6 However a larger tonnage of dangerous
6 See for example Winter J 2014 ldquoSafety in Numbers Evaluating Canadian Rail Safety Datardquo SPP Communiqueacute Vol 6 no 2 University of Calgary The School of Public Policy
Trucking dangerous goods in Canada 2004 to 2012
Chart 2 Surface transportation1 of dangerous goods in Canada 2012
20
80
Rail transportation (NAICS 482) 261 million tonnes Truck transportation (NAICS 484) 1074 million tonnes
1 Excluding pipelines Note NAICS North American Industry Classification System Sources Statistics Canada Environment Energy and Transportation Statistics Division Trucking Commodity Origin and Destination Survey (survey number 2741) and Monthly Railway Carloadings Survey (survey number 2732) 2012
goods is transported by truck In 2012 the for-hire trucking industry handled approximately four times the dangerous goods by weight than did the mainline railways (Chart 2)7 In the United States but including private trucking carriers about 93 of the more than 16 billion tons of dangerous goods transported by surface moved by truck8
Despite carrying more dangerous goods by weight the consequences of an accident by truck are limited to a small number of trailers on a per truck basis And moreover the average shipments by truck i n v o l v e s h o r t e r d i s t a n c e s 9
Shipments of dangerous goods by truck and rail would be therefore more comparable on a per tonne-kilometre basis However it should also be noted that most accidents and spills of dangerous goods occur during handling rather than during actual transit10
The top four dangerous goods
Although the top four dangerous goods trucked by weight remained the same over the study period they accounted for almost 80 of the total by 2012 up from 71 in 2004 (Chart 3) The increase was driven largely by the trucking of crude
petroleum products which more than doubled to reach over 40 million tonnes by 2012 accounting for more than one-third (38) of the total
Over the same period shipments of gasoline and aviation turbine fuel rose 11 to 26 million tonnes while fuel oils increased 16 to 124 million tonnes and non-metallic minerals (such as sulphur) rose 43 to 52 million tonnes Fertilizers and fertilizer materials (including nitric acid sulphonitric acids and ammonia) the fifth largest category of dangerous goods trucked in 2012 at 26 million tonnes increased by approximately 180 over the study period
Average distance An interesting factor is the distance that dangerous goods travel to reach their destination From 2004 to 2012 the average distance of all shipments trucked in Canada was estimated to have increased from 608 to 632 kilometres However shipments of dangerous goods declined from an average of 316 to 269 kilometres This decline reflects an increase in energy-related shipments particularly crude petroleum products since on average shipments of these products travelled about one-third (35) of the distance than did other dangerous goods (Table 1)
7 The rail proportion is estimated from the Monthly Railway Carloadings Survey based on the UN dangerous good designation identified by Standard Transportation Commodity Codes for revenue-generated freight moved by the two mainline freight railways only
8 US Department of Transportation Bureau of Transportation Statistics and US Department of Commerce US Census Bureau 2015 Hazardous Materials 2012 Commodity Flow Survey (Draft January) Washington
9 In the United States the average distance per hazardous material shipment by for-hire truck was 150 miles versus 808 by rail (2012 US Commodity Flow Survey)
10 Provencher M 2010 The Movement and Handling of Dangerous Goods in Canada for the Year 2008 Transport Canada Transport Dangerous Goods Directorate Ottawa
Statistics Canada mdash February 2015 EnviroStats 3
Chart 3 Top four dangerous goods trucked in Canada 2004 and 2012
weight (thousands of tonnes)
45000
40000
35000
30000
25000
20000
15000
10000
5000
0 Crude petroleum Gasoline and aviation Fuel oils Non-metallic minerals
products turbine fuel nec
Dangerous goods
2004 2012
Source Statistics Canada Environment Energy and Transportation Statistics Division Trucking Commodity Origin and Destination Survey (survey number 2741) various years
A shorter average distance for trucking crude petroleum products is partly tied to extraction areas in Alberta and Saskatchewan and proximity to trans-loading facilities
For Alberta the oil sands region in the north of the province has limited rail service and pipeline access Consequently heavy oil is often trucked to feeder pipelines which serve consolidation points in the
Edmonton area for rail and further southeast for pipeline11 In 2012 shipments of crude petroleum products were trucked an average distance of 95 km in Alberta
For Saskatchewan although its Bakken region in the south of the province has extensive rail coverage there has been insufficient feeder pipeline infrastructure Although the majority of crude is shipped out
Table 1 Average distance trucked by type of shipment Canada 2012
Shipment type kilometres Dangerous goods
Crude petroleum products 110
Other dangerous goods 313
Non-dangerous goods 665
All shipments 632
Source Statistics Canada Environment Energy and Transportation Statistics Division Trucking Commodity Origin and Destination Survey (survey number 2741) 2012
of the region by rail it must first be trucked to a rail loading facility On average crude petroleum products were trucked a distance of 118 km in Saskatchewan
Provincial perspectives By province of origin Alberta accounted for almost half of the national total weight of dangerous goods transported by truck in 2012 (Chart 4) The province also experienced the largest growth increasing by over 19 million tonnes from 2004 to 2012 Again this growth was driven largely by crude petroleum products as shipments of these products that originated in Alberta more than doubled from almost 15 million tonnes in 2004 to over 30 million tonnes by 2012
Similarly for Saskatchewan crude petroleum products shipped by truck rose from about 5 million tonnes to over 9 million tonnes Combined with increased shipments of gasoline and aviation turbine fuel as well as fuel oils fertilizers and fertilizer materials the weight of dangerous goods shipped in the province reached 147 million tonnes by 2012
Over the study period British Columbia and Manitoba experienced s o m e g r o w t h i n s h i p m e n t s while Ontario and Quebec both experienced a decline in the tonnage of dangerous goods transported by truck
A l though prov inc ia l patterns of dangerous goods shipped by truck will evolve crude petroleum products in the west are likely to continue driving national estimates by weight In Alberta for instance total crude oil production per month
11 See Cairns M 2013 Crude Oil By Rail - Parts I and II Potential for the Movement of Alberta Oil Sands Crude Oil and Related Products by Canadian Railways Canadian Transportation Research Forum Proceedings (June 10 to 12 2013) pages 412 to 433 Halifax
4 EnviroStats February 2015 mdash Statistics Canada
0
Chart 4 Dangerous goods trucked by province of origin 2004 and 2012
weight (thousands of tonnes)
60000
50000
40000
30000
20000
10000
NL PEI NS NB Que Ont Man Sask Alta BC
Province of origin
2004 2012
Source Statistics Canada Environment Energy and Transportation Statistics Division Trucking Commodity Origin and Destination Survey (survey number 2741) various years
has risen from an average of 93 million cubic metres in 2010 to 125 million cubic metres during the first half of 201412 largely from synthetic crude oil and crude bitumen extraction And truck-to-rail delivery is now considered as a medium term alternative to access those areas not served directly by pipelines13
12 Statistics Canada CANSIM table 126-0001 (accessed October 5 2014) 13 Ricciotti L 2013 ldquoRailcars and trucks make a comeback as methods for shipping oilrdquo Alberta Oil Magazine wwwalbertaoilmagazinecom201302railcars-
trucks-make-oil-comeback (accessed September 28 2014)
Statistics Canada mdash February 2015 EnviroStats 5
19992000 INTERPROVINCIAL
ROADSIDE TRUCK SURVEY REPORT
ENQUEcircTE ROUTIEgraveRE INTERPROVINCIALE SUR LE CAMIONNAGE 19992000 RAPPORT
McLean Transportation Engineering Consultants Ltd
TRANS MEMBER AGENCIES
National Capital Commission Mr Arto Keklikian Capital Planning and Real Asset Management
Ministegravere des Transports Queacutebec Monsieur Ghislain Couture Direction reacutegionale de lrsquoOutaouais
Ministry of Transportation Ontario Mr James Wong Transportation Planning Branch
Ville de Gatineau Monsieur Paul-Andreacute Roy Service Urbanisme
City of Ottawa Mr Don Stephens PEng ( Manager TRANS Programme ) Planning Environment and Infrastructure Policy Mr Rob Calladine Planning Environment and Infrastructure Policy
Socieacuteteacute de transport de lOutaouais Monsieur Salah Barj Service Strateacutegies et Deacuteveloppement Monsieur Carmel Dufour Service Strateacutegies et Deacuteveloppement
OCTranspo Mr Colin Leech Service Planning Department
19992000 INTERPROVINCIALROADSIDE TRUCK SURVEY
REPORT
ENQUEcircTE ROUTIEgraveRE INTERPROVINCIALE SUR LE CAMIONNAGE 19992000
RAPPORT
Prepared for Preacutepareacute pour
TRANS A Joint Technical Committee on Transportation Systems Planning
Un Comiteacute technique conjoint sur la planification des systegravemes de transport
By Par McLean Transportation Engineering Consultants Ltd
June juin 2002
ACKNOWLEDGEMENTS TRANS would like to acknowledge the funding support received from the following member Agencies
x National Capital Commission x Ministegravere des Transports du Queacutebec x Ministry of Transportation Ontario x Ville de Gatineau (formerly
Communauteacute Urbain de lrsquoOutaouais) x City of Ottawa (formerly Regional
Municipality of Ottawa-Carleton)
The roadside surveys while funded by TRANS Agencies were carried out in 1999 and 2000 by EarthTech Canada Inc under contract to the Province of Ontario (Ministry of Transportation) for the administration of all the roadside surveys across the province as part of the National Roadside Truck Survey Special thanks to Mr Rob Tardif Coordinator Commercial Vehicle Survey for the Ministry of Transportation of Ontario (MTO) who oversaw the survey work on behalf of TRANS Agencies and to Mr David Smith Manager Data Management and Analysis Office (MTO) for ongoing project support
The ldquo19992000 INTERPROVINCIAL ROADSIDE TRUCK SURVEYrdquo report was prepared by McLean Transportation Engineering Consultants Ltd The consultant acknowledges the invaluable assistance of Mr Petar Grubor of the City of Ottawa in the preparation of tabulations Mr Don Stephens Manager TRANS Programme and the Steering Committee Members in the provision of advice during the preparation of this report
REMERCIEMENTS TRANS souhaite remercier les organismes membres pour leur soutien financier
x La Commission de la Capitale nationale x Le ministegravere des Transports du Queacutebec x Le ministegravere des Transports de
lrsquoOntario x La Ville de Gatineau (autrefois la
Communauteacute urbaine de LrsquoOutaouais) x La Ville drsquoOttawa (autrefois la
Municipaliteacute reacutegionale drsquoOttawa-Carleton)
Lrsquoenquecircte routiegravere bien que financeacutee par les membres du groupe TRANS fucirct exeacutecuteacutee par Earthtech Canada Inc en 1999 et 2000 pour le compte de la province drsquoOntario (ministegravere des Transports) pour effectuer toutes les enquecirctes routiegraveres de la province en tant que participant dans lrsquoenquecircte nationale sur le camionnage Au nom des membres du groupe TRANS nous tenons agrave remercier monsieur Robert Tardif coordonnateur au Service des enquecirctes sur les veacutehicules commerciaux pour le ministegravere des Transports de lrsquoOntario (MTO) pour son travail de supervision dans cette enquecircte Nous tenons agrave remercier eacutegalement monsieur David Smith gestionnaire au Bureau de la gestion des donneacutees et des analyses (MTO) pour son soutien dans ce projet
McLean Transportation Engineering Consultants Ltd qui a prepare le rapport ldquoENQUEcircTE ROUTIEgraveRE INTERPROVINCIALE SUR LE CAMIONNAGE 19992000rdquo remercie monsieur Petar Grubor de la Ville drsquoOttawa pour son aide preacutecieuse dans la preacuteparation des tables monsieur Don Stephens gestionnaire du groupe TRANS ainsi que les membres du comiteacute technique pour leurs conseils lors de la preacuteparation de ce rapport
Interprovincial Roadside Truck Survey Enquecircte routiegravere interprovinciale sur le camionnage Executive Summary Sommaire
EXECUTIVE SUMMARY
Background
In the autumns of 1999 (October) and 2000 (September) surveys co-ordinated by TRANS were undertaken to establish a comprehensive database on interprovincial truck travel characteristics in the National Capital Region Surveys were carried out only on the Chaudiegravere and Macdonald-Cartier bridges as the movement of ldquoheavy trucksrdquo is prohibited on the remaining three bridges - the Alexandra Portage and Champlain bridges The roadside surveys were part of a broader national roadside survey program led by Transport Canada with participation of the provinces
The purpose of this study was the development of a good understanding of the interprovincial movement patterns origins destinations and characteristics of heavy trucks in the National Capital Region and the satisfaction of the TRANS mandate to furnish high quality and meaningful transportation data required for transportation planning and decision making in the National Capital Region In this context the study was undertaken to establish a comprehensive database of information regarding the characteristics of trucks crossing the Ottawa River and thus provide a basis for future studies and analysis In meeting this objective this study does not directly address specific transportation issues but rather provides TRANS Agencies with a database for this purpose Detailed analysis of the comprehensive data base would be necessary to assess the impact of new
SOMMAIRE
Contexte
En octobre 1999 et en septembre 2000 une enquecircte coordonneacutee par le groupe TRANS a eacuteteacute reacutealiseacutee dans le but de constituer une base de donneacutees complegravete au sujet du transport interprovincial de marchandises par camions qui traversent la riviegravere des Outaouais Lrsquoenquecircte routiegravere a eacuteteacute effectueacutee seulement sur les ponts Chaudiegravere et Macdonald-Cartier puisqursquoil est interdit aux poids lourds de circuler sur les trois autres ponts (Alexandra Portage et Champlain) Cette enquecircte srsquoinscrivait dans un programme drsquoeacutetude national dirigeacute par Transports Canada en collaboration avec les provinces
Cette eacutetude visait agrave brosser un tableau de la situation en ce qui a trait aux itineacuteraires aux points de deacutepart aux destinations et aux caracteacuteristiques des camions poids lourds dans la reacutegion de la capitale nationale Elle permettait aussi agrave TRANS de reacuteunir des donneacutees pertinentes et de qualiteacute pouvant faciliter la planification et la prise de deacutecisions concernant le transport dans la reacutegion de la capitale nationale conformeacutement au mandat qui lui avait eacuteteacute confieacute Dans ce contexte lrsquoenquecircte avait pour but de constituer une base de donneacutees exhaustive au sujet des camions qui franchissent la riviegravere des Outaouais et drsquoeacutetablir ainsi un point de deacutepart pour des eacutetudes et des analyses ulteacuterieures Compte tenu de cet objectif le rapport ne traite directement drsquoaucun enjeu preacutecis en matiegravere de transport mais fournit aux organisms de TRANS les donneacutees
i
Interprovincial Roadside Truck Survey Enquecircte routiegravere interprovinciale sur le camionnage Executive Summary Sommaire
or improved infrastructure on interprovincial truck traffic and would be a prerequisite for reaching any meaningful conclusions regarding future interprovincial transport needs
The database which is available for future studies provides significant information regarding the movement of heavy trucks across the Ottawa River historical heavy truck trends their composition in the traffic stream and their associated travel patterns
Roadside driver interview surveys gathered specific data on the characteristics of the trucks the travel patterns including detailed information on the trip origins and destinations and the commoditygoods carried The surveys revealed that approximately 3450 trucks cross the Ottawa River on a daily basis Trip characteristics were obtained from a sample of 143 of the vehicles and this sample was considered to be of sufficient magnitude and strength to allow expansion of the data by bridge and by certain time periods
Truck Classification
The classification system applied three key categories of trucks (heavy trucks) as follows
x 2 axle trucks - which represent trucks with six wheels such as tow trucks large (34 ton 1 ton) pick-up trucks small vans small dump trucks etc defined as heavy trucks
neacutecessaires permettant de se pencher sur la question Il faudrait proceacuteder agrave une analyse deacutetailleacutee de la base de donneacutees exhaustive afin drsquoeacutevaluer les effets de la construction ou de la modernisation drsquoinfrastructures sur le transport interprovincial par camion analyse qui devrait ecirctre effectueacutee avant de pouvoir tirer de conclusions significatives sur les besoins futurs du transport interprovincial
La base de donneacutees qui pourra servir pour de futures eacutetudes contient des renseignements importants sur la circulation des poids lourds qui traversent la riviegravere des Outaouais sur lrsquoeacutevolution de la situation au fil des ans sur la place des poids lourds dans le flot de circulation et sur leurs itineacuteraires
Les camionneurs interrogeacutes ont fourni des donneacutees preacutecises sur les caracteacuteristiques de leurs veacutehicules et sur leurs itineacuteraires y compris leurs points de deacutepart et leurs destinations et la nature de leurs cargaisons Lrsquoenquecircte a reacuteveacuteleacute qursquoenviron 3 450 camions franchissent chaque jour la riviegravere des Outaouais Les caracteristiques des deacuteplacements ont eacuteteacute obtenues agrave partir drsquoun eacutechantillon de 143 des camions Ceci constitue un eacutechantillon de taille et drsquoimportance suffisantes pour effectuer une expansion des reacutesultats par pont et par peacuteriode de la journeacutee
Cateacutegories de camions
Le systegraveme de classement preacutevoyait trois cateacutegories de poids lourds
ii
x 3+ axle trucks - which represent medium size trucks such as large dump trucks straight trucks concrete mix trucks etc which are also defined as heavy trucks
x tractor trailer trucks - which represent the largest trucks such as tractor-trailer trucks flat-bed trucks etc
Of the total of approximately 3450 trucks observed over a 24 hour period as crossing the Ottawa River there were 1550 2 axle (45) 880 3+ axle (25) and 1020 tractor trailer (30) trucks
x camions agrave deux essieux ndash comprenant notamment les camions agrave six roues comme les deacutepanneuses les grosses camionnettes de trois quarts de tonne agrave une tonne les petits camions et les petits camions agrave benne consideacutereacutes comme des poids lourds
x camions agrave trois essieux et plus ndash comprenant notamment les camions de taille moyenne comme les gros camions agrave benne les camions porteurs et les camions malaxeurs consideacutereacutes aussi comme des poids lourds
45
Tractor Trailer Camion gros porteur
30
3+ Axle Truck Camion agrave 3 essieux et plus
252 Axle Truck Camion agrave 2 essieux
STUDY TRUCK CLASSIFICATION b CATEacuteGORIES DE CAMIONSb
x camions gros porteurs ndash comprenant notamment les camions les plus gros comme les semi shyremorques et les camions agrave plateshyforme
Interprovincial Roadside Truck Survey Enquecircte routiegravere interprovinciale sur le camionnage Executive Summary Sommaire iii
Truck Volumes
Daily heavy truck volumes crossing the Ottawa River were in 2000 approximately 3450 which is 5 higher than the recorded ten year average (3285) For comparative purposes overall traffic levels crossing the Ottawa River on all five bridges are about 200000 vehicles per day (traffic counts undertaken in 2000 indicate an average one way volume of approximately 94000 vehicles)
Truck movements are more predominant during the mid-day hours than in the commuter peak hours The mid-day peaking phenomenon may be attributed to the need to meet the expectations of the business day and quite possibly trucker attempt to avoid the commuter peak periods The tractor trailer trucks (which represented about 30 of all interprovincial truck trips) reported longer trip lengths and consequently were as a category responsible for approximately 50 of the total trip distance travelled by all trucks In contrast the 3+ axle trucks (representing 25 of the truck trips) were responsible for 20 of the distance travelled by all trucks while the 2 axle trucks (45 of interprovincial truck trips) were associated with 30 of the distance travelled by trucks
Most truck traffic across the Ottawa River occurs between 0600 and 2100 Approximately 95 of the 3+ axle trucks 93 of the 2 axle trucks and 80 of the tractor trailer crossings of the Ottawa River have occurred by 2100 This suggests that the tractor trailer vehicles tend to be more spread out across the 24 hour period than the other two categories of trucks
Les quelques 3 450 camions qui franchissent quotidiennement la riviegravere des Outaouais se reacutepartissent comme suit 1 550 camions agrave deux essieux (45) 880 camions agrave trois essieux ou plus (25) et 1 020 gros porteurs (30)
Volumes des camions
En 2000 environ 3 450 camions poids lourds franchissaient la riviegravere des Outaouais chaque jour ce qui constituait une leacutegegravere augmentation de 5 par rapport agrave la moyenneenregistreacutee il y a dix ans (3 285) Agrave des fins de comparaison au total pregraves de 200 000 veacutehicules empruntent chaque jour les cinq ponts qui enjambent la riviegravere des Outaouais (les releveacutes effectueacutes en 2000 indiquent quelque 94 000 veacutehicules en moyenne dans une direction)
La circulation des camions est plus dense au milieu de la journeacutee que pendant les heures de pointe Lrsquoheure de pointe qui se forme ainsi en milieu de journeacutee peut ecirctre attribueacutee au besoin de se conformer aux heures drsquoouverture des commerces et peut-ecirctre aussi aux efforts des camionneurs pour eacuteviter les heures drsquoarriveacutee et de deacutepart des navetteurs Ce sont les gros porteurs (environ 30 des deacuteplacements interprovinciaux de camions) qui effectuent les trajets plus longs parcourant agrave eux seuls pregraves de 50 des distances couvertes par des camions toutes cateacutegories confondues Les camions agrave trois essieux ou plus (25 des deacuteplacements interprovinciaux de camions) en parcourent 20 et les camions agrave deux essieux (45 des deacuteplacements interprovinciaux de camions) en parcourent 30
Interprovincial Roadside Truck Survey Enquecircte routiegravere interprovinciale sur le camionnage Executive Summary Sommaire iv
Macdonald Cartier Bridge2580 Trucks
Tractor Trailers17
( 150 )
Chaudiegravere Bridge870 Trucks
2 Axles60
( 520 )
Tractor Trailers34
( 870 )
2 Axles40
( 1030 )
3+ Axles23
( 200 )
3+ Axles26
( 680 )
DAILY TRUCK VOLUMESbBY CLASSIFICATIONb
Pont Macdonald-Cartier Bridge
2580 Trucks Camions Pont Chaudiegravere Bridge870 Trucks Camions
DAILY TRUCK VOLUMES BY CLASSIFICATIONbACHALANDAGE QUOTIDIEN PAR CATEacuteGORIE DE CAMIONSb
The Macdonald-Cartier bridge carried a total of 2580 trucks per day with by far the largest number of the tractor-trailers (870) When compared with the other two classes of trucks the tractor trailers represented about 34 of the total trucks on that bridge On the Chaudiegravere bridge which carried approximately 870 trucks per day in total the 2 axle truck is the largest vehicle class of truck (520) and dominates the composition (60) of the truck stream
shy
3+ AxlesCamions agrave 3 essieux et plus
26 ( 680 )
2 Axles Camions agrave 2 essieux
40 ( 1030 )
Tractor TrailersCamions gros porteurs
34 ( 870 )
Tractor Trailers Camions gros porteurs
17 ( 150 )
2 Axles Camions agrave 2 essieux
60 ( 520 )
3+ Axles Camions agrave 3 essieux et plus
23 ( 200 )
DAILY TRUCK VOLUMES BY CLASSIFICATIONb ACHALANDAGE QUOTIDIEN PAR CATEacuteGORIE DE CAMIONSb
Pont Macdonald-Cartier Bridge 2580 Trucks Camions
Pont Chaudiegravere Bridge 870 Trucks Camions
La plupart des camions franchissent les ponts de la riviegravere des Outaouais entre 06h00 et 21h00 Environ 95 des camions agrave trois essieux ou plus 93 de ceux agrave deux essieux et 80 des gros porteur les franchissent avant 21h00
Ces statistiques portent agrave croire que les deacuteplacements des gros porteurs srsquoeacutechelonnent davantage sur une peacuteriode de vingt-quatre heures que les deux autres cateacutegories de camions
Chaque jour 2 580 camions passent sur le pont Macdonald-Cartier dont 870 gros porteurs ce qui repreacutesente de loin le plus grand nombre de camions Comparativement aux deux autres cateacutegories de camions les gros porteurs constituent environ 34 de la circulation de camions sur ce pont Sur le pont Chaudiegravere ougrave circulent environ 870 camions par jour ce sont les camions agrave deux essieux (520) qui sont les plus nombreux et qui repreacutesentent la
Interprovincial Roadside Truck Survey Enquecircte routiegravere interprovinciale sur le camionnage Executive Summary Sommaire v
Interprovincial Roadside Truck Survey Enquecircte routiegravere interprovinciale sur le camionnage Executive Summary Sommaire vi
-
Travel Patterns
Local trips between the two cities on each side of the Ottawa River are understandably the largest component of travel about two-thirds (2300 trips) of all truck trips
A review of the remaining trips revealed that 975 (28) of the trucks made intershyregional trips (either an origin or a destination outside the National Capital area) while 175 (5) of the trucks made a through trip (neither an origin nor a destination within the National Capital area)
The key characteristics of the trip patterns are
x the dominance of the Hull district part of the new City of Gatineau as an attractorgenerator of truck trips (1360) more than fifty percent of these truck classes are the smaller 2 axle category
x the distribution of generated and attracted trips tofrom the nine remaining districts varies from 400 to 930 truck trips
x the variability of the truck classifications from ldquodistrict to districtrdquo is evident although the two eastern districts one on each side of the Ottawa River which also include origins and destinations outside the National Capital area (eg Montreal) have a large proportion of tractor trailer trucks
The daily distribution of trips (ldquoall trucksrdquo) clearly indicates the strength of the Hull district as compared with each of the other three districts (Aylmer Gatineau West and Gatineau East) on the Queacutebec side of the Ottawa River
plus grande partie (60) de la circulation de camions sur ce pont
Itineacuteraires
Naturellement les deux tiers (2 300) des deacuteplacements des camions srsquoeffectuent entre les deux villes qui se trouvent de chaque cocircteacute de la riviegravere
Lrsquoexamen des autres itineacuteraires permet de constater que 975 camions (28) effectuent des deacuteplacements interreacutegionaux (crsquoest-agrave-dire dont le point de deacutepart ou la destination se trouve agrave lrsquoexteacuterieur de la reacutegion de la capitale nationale-RCN) et que 175 camions (5) ne font que traverser la reacutegion (crsquoest-agrave-dire que ni leur point de deacutepart ni leur destination ne se trouvent dans la RCN) Principales caracteacuteristiques des itineacuteraires
x Crsquoest dans le district de Hull dans la nouvelle ville de Gatineau qursquoon compte le plus grand nombre de points de deacutepart et drsquoarriveacutee (1 360) il srsquoagit dans plus de cinquante pour cent des cas de petits camions agrave deux essieux
x Dans les neuf autres districts le nombre de points de deacutepart et drsquoarriveacutee varie entre 400 et 930
x La dispariteacute des cateacutegories de camions drsquoun district agrave lrsquoautre est eacutevidente toutefois les deux districts ldquoEstrdquo situeacutes de part et drsquoautre de la riviegravere des Outaouais qui comprennent eacutegalement des points de deacutepart et drsquoarriveacutee agrave lrsquoexteacuterieur de la reacutegion de la capitale nationale (ex Montreacuteal) accueillent un pourcentage eacuteleveacute de gros porteurs
1 Ottawa CentralCentre
5 IGB East ICV Est
2 IGB West ICV Ouest
3 Ottawa WestOuest
4 Ottawa SouthSud
6 Ottawa EastEst
7 Hull
8 Aylmer
9 Gatineau WestOuest
10 Gatineau EastEst
Queacutebec
Ontario
xxx
2 Axles Camions agrave deux essieux
3+ Axles Camions agrave trois essieux et plus
Tractor Trailers Camions gros porteurs
Total number of trucks (O+D) for the District Nombre total de camions (points de deacutepart et destinations) pour le district
IGB ndash Inside Green Belt ICV ndash Inteacuterieur de la Ceinture de Verdure
DAILY DISTRIBUTION OF ORIGINS-DESTINATIONS BY CLASSIFICATIONb REacutePARTITION QUOTIDIENNE DES POINTS DE DEacutePART ET DESb
DESTINATIONS PAR CATEacuteGORIE DE CAMIONSb
Commodities
The five most frequently reported commodities carried by trucks crossing the Ottawa River are
bull construction materials (475 trips) bull food and beverage (415 trips) bull general merchandise (360 trips) bull paper and paper products (310 trips) bull wood and wood products (195 trips)
La reacutepartition des itineacuteraires quotidien toutes cateacutegories de camions confondues montre clairement lrsquoimportance du district de Hull par rapport aux trois autres districts (Aylmer Gatineau-Ouest et Gatineau-Est) du cocircteacute queacutebeacutecois de la riviegravere des Outaouais
Cargaison
Voici les cinq types de marchandises transporteacutees le plus souvent par les camions qui franchissent la riviegravere des Outaouais
bull mateacuteriaux de construction (475 deacuteplacements)
bull aliments et boissons (415 deacuteplacements)
Interprovincial Roadside Truck Survey Enquecircte routiegravere interprovinciale sur le camionnage
Executive Summary Sommaire vii
Interprovincial Roadside Truck Survey Enquecircte routiegravere interprovinciale sur le camionnage Executive Summary Sommaire viii
While ldquoconstruction materialsrdquo tops the list of goods carried paper and wood products if taken together as a single group would become the prominent group of commodities
The movement of various commodities across the Ottawa River was identified from the survey results and some key characteristics are
x for construction materials while widely distributed an Aylmer to Ottawa Central trip pattern represented approximately 50 percent of the originsdestinations for that pairing
x for general merchandise a widely dispersed trip pattern was expected and no single prominent origins destinations pairing emerged
x for paperpaper products the dominant interchange of trips exists between Hull and Ottawa (both East and West) and between Gatineau East and Ottawa South
x for woodwood products Aylmer and Gatineau West trips to Ottawa South stand out to the exclusion of other pairings as the primary movements for these commodities
Most frequently reported commodities in the ldquoPetroleumChemicalsrdquo category were gasoline and furnace fuel Other notable petroleum chemicals commodities included propane oxygen and other gases
Detailed information regarding the flow of commodities on each of the two bridges was collected as part of truck roadside survey On the Macdonald-Cartier bridge for example the various commodities for each of 3 truck types indicate that the 1030 2 axle trucks on
x fournitures geacuteneacuterales (360 deacuteplacements)
x papier et produits de papier (310 deacuteplacements)
x bois et produits du bois (195 deacuteplacements)
Bien que les mateacuteriaux de construction dominent cette liste le papier et le bois formeraient la cateacutegorie la plus importante srsquoils eacutetaient consideacutereacutes comme un seul groupe
Lrsquoeacutetude a permis de deacuteterminer lrsquoitineacuteraire de diverses marchandises qui franchissent la riviegravere des Outaouais Voici quelques-unes des caracteacuteristiques principales
x mateacuteriaux de construction bien que les itineacuteraires soient reacutepartis sur lrsquoensemble de la RCN les deacuteplacements entre Aylmer et Ottawa-Centre repreacutesentent agrave eux seuls environ la moitieacute des trajets
x fournitures geacuteneacuterales les points de deacutepartdestinations sont tregraves disperseacutees et aucun point de deacutepart ou drsquoarriveacutee ne se distingue de faccedilon particuliegravere
x papier et produits de papier la plupart des deacuteplacements srsquoeffectuent entre Hull et Ottawa (tant Est que Ouest) et entre Gatineau-Est et Ottawa-Sud
x bois et produits du bois les deacuteplacements srsquoeffectuent pour la plupart drsquoAylmer et de Gatineau-Ouest agrave destination drsquoOttawa-Sud agrave lrsquoexclusion des autres districts
Les cargaisons le plus souvent releveacutees dans la cateacutegorie ldquoproduits chimiquesdeacuteriveacutes du peacutetrolerdquo eacutetaient lrsquoessence ou combustible de chauffage Les autres produits chimiques ou
EXHIBIT 23b COMMODITY FLOWb
- MACDONALD-CARTIER BRIDGEb
Construction Mater als16
Foodamp Beverage
19
General Merchandise18
Empty28
Paper Products10
Business Supplies6
AutoVehic esamp Parts
1
Petro eumChemicals2
2 Axles40
( 1025 )
3 Axles26
( 680 )
Tractor Trailers34
( 870 )
Genera Merchandise
Food amp Beverage6
Empty64
Construction Mater als16
1
PetroleumChemicals2
Wood Products11
Food amp Beverage
12
Construction Mater als12
Paper Products19
Empty30
8
GeneraMerchandise
10AutoVehicles
amp Parts5
Wood ProductsPetroleumChemicals
4
2580 Trucks
( 1030 )
COMMODITY FLOW-MACDONALD-CARTIER BRIDGE TRANSPORT DE MARCHANDISES SUR LE PONT
MACDONALD-CARTIER
i
l
l
l
i
i
l
bbb
2 580 Trucks Camions
DAILY COMMODITY FLOW-MACDONALD-CARTIER BRIDGE b TRANSPORT QUOTIDIEN DE MARCHANDISES SUR LE PONTb
MACDONALD-CARTIERb
Tractor Trailers Gros porteurs
34 ( 870 )
3 AxlesCamions agrave 3 essieux et plus
26 ( 680 )
2 AxlesCamions agrave 2 essieux
40 ( 1030 )
Emptyvide 30
Emptyvide 64
Emptyvide 28
Construction materials Mateacuteriaux de construction
12
Construction materials Mateacuteriaux de construction
16
Construction materials Mateacuteriaux de construction
16
Food amp Beverage Aliments et boissons
8
Food amp Beverage Aliments et boissons
6
Food amp Beverage Aliments et boissons
19
General Merchandise Marchandises geacuteneacuterales
10
General Merchandise Marchandises geacuteneacuterales
1
General Merchandise Marchandises geacuteneacuterales
18
Paper products Produits de papier
19
Paper products Produits de papier
10
W ood Products Produits du bois
12
Wood Products Produits du bois
11
Petroleum amp Chemicals Produits chimiques et
deacuteriveacutes du peacutetrole 4
Petroleum amp Chemicals Produits chimiques et
deacuteriveacutes du peacutetrole 2
Petroleum amp ChemicalsProduits chimiques et deacuteriveacutes du peacutetrole
2
Business Supplies Fournitures de bureau
6
Auto Vehicles amp Parts Veacutehicules automobiles et piegraveces
1
Auto Vehicles amp Parts Veacutehicules automobiles
et piegraveces 5
que 1 030 camions agrave 2 essieux transportent sur ce pont essentiellement lrsquoaliment et la boisson (19) fournitures geacuteneacuterales (18) et les mateacuteriaux de construction (16) Les camions agrave 3 essieux et plus (680) transportent essentiellement les mateacuteriaux de construction (16) et des produits de bois (11) Les camions gros porteurs (870) transportent principalement des produits de papier (19) produits de bois (12) et des mateacuteriaux de construction (12)
this bridge carry mainly food and beverage (19) general merchandise (18) and construction materials (16) The 680 trucks in the 3+ axle classification carry mainly construction materials (16) and wood products (11) while tractor trailers (870) carry predominantly paper products (19) wood products (12) and construction materials (12)
deacuteriveacutes du peacutetrole les plus souvent preacutesents dans les cargaisons eacutetaient le gaz propane lrsquooxygegravene et drsquoautres gaz
Les informations detailleacutees concernant le flot des cargaisons sur chacun des deux ponts eacutetaient recueillis durant lrsquoenquecircte routiegravere Sur le pont Macdonald-Cartier par exemple les diffeacuterentes cargaisons pour chacune des trois sortes de camions indiquent
Interprovincial Roadside Truck Survey Enquecircte routiegravere interprovinciale sur le camionnage Executive Summary Sommaire ix
TABLE OF CONTENTS
EXECUTIVE SUMMARY i SOMMAIRE i 10 BACKGROUND 1 20 STUDY METHODOLOGY 2 30 1989 TRUCK SURVEY 2 40 19992000 SURVEY PROGRAM AND METHODOLOGY 3
41 Historical Vehicle Data 3 42 Driver Interviews 4 43 Vehicular Traffic Classification Count Observations 5 44 Automatic Traffic Recorder (ATR) Counts 7
50 KEY RELATIONSHIPS 8 51 Historical traffic volumes 8 52 Truck Classification and Characteristics 12 53 Automatic Traffic Recorder (ATR) Counts 15
60 ZONEDISTRICT SYSTEM 16 70 DATA EXPANSION 17
71 Expansion Methodology 17 72 Expansion Factors 18
80 TRIP CHARACTERISTICS AND PATTERNS 21 81 Vehicle Types 21 82 Trip Tables 23 83 Travel Patterns 23 84 Origin-Destination Patterns 26 85 Vehicle Loading and Commodities 34
90 SUMMARY 38 100 LIST OF APPENDICES 39
x
LIST OF EXHIBITS
Exhibit 1 Illustration of Survey Station 4
Exhibit 2 Study Truck Classification 7
Exhibit 3 Historical All Vehicle Volumes 8
Exhibit 4 Historical Truck Volumes 10
Exhibit 5 Daily Truck Volumes by Classification 13
Exhibit 6 Hourly Truck Volumes Macdonald-Cartier Bridge 14
Exhibit 7 Hourly Truck Volumes Chaudiegravere Bridge 14
Exhibit 8 Hourly Vehicle Traffic Volumes 15
Exhibit 9 District System 16
Exhibit 10 Sample Size by Time of Day 20
Exhibit 11 Daily Truck Volumes by Classification 22
Exhibit 12 Cumulative Truck Traffic 22
Exhibit 13 Daily truck Composition Macdonald-Cartier Bridge 25
Exhibit 14 Daily Truck Composition Chaudiegravere Bridge 25
Exhibit 15 Trip Itineraries 26
Exhibit 16 Distribution of OriginsDestinations by Classification 27
Exhibit 17 Concentration of Truck Trip OriginsDestinations 28
Exhibit 18 Origin-Destination Desire Lines All Truck Trips (Autumn 2000) 30
Exhibit 19 Origin-Destination Desire Lines 2 Axle Truck Trips (Autumn 2000) 31
Exhibit 20 Origin-Destination Desire Lines 3+ Axle Truck Trips (Autumn 2000) 32
Exhibit 21 Origin-Destination Desire Lines Tractor Trailer Trips (Autumn 2000) 33
Exhibit 22 Goods Carried per Day 35
Exhibit 23 Daily Commodity Flow Macdonald-Cartier Bridge 37
Exhibit 24 Daily Commodity Flow Chaudiegravere Bridge 37
xi
LIST OF TABLES
Table 1 Current and Historical Two Way Truck Traffic Volumes 10
Table 2 Ratio of Peak Hour to 24 Hour Traffic Volumes 1999 to 2000 11
Table 3 Summary of 3+ Axle Trucks by Body Type and Cargo 19
Table 4 Expansion Factors by Bridge by Direction and by Time of Day 20
Table 5 Truck Travel Composition and Trip Distance 23
xii
10 BACKGROUND In the autumns of 1999 (October) and 2000 (September) several types of surveys co-ordinated by TRANS were undertaken to establish a comprehensive database on interprovincial truck travel characteristics in the National Capital Region Surveys were carried out on the Chaudiegravere and Macdonald-Cartier bridges as the movement of ldquoheavy trucksrdquo is prohibited on the remaining three bridges - the Alexandra Portage and Champlain bridges
The roadside surveys which were undertaken were part of a broader national roadside survey program led by Transport Canada with participation of the provinces
TRANS undertook an extensive amount of work in organizing and establishing the database for this project and prepared numerous data tabulations establishing relationships among the various components of the database Coding of the origins and destinations to the traffic zone system currently in use and applying preliminary expansion factors to some of the data were also undertaken by TRANS
The purpose of this study was the development of a good understanding of the interprovincial movement patterns origins destinations and characteristics of heavy trucks in the National Capital Region and the satisfaction of the TRANS mandate to furnish high quality and meaningful transportation data required for transportation planning and decision making in the National Capital Region In this context the study was undertaken to establish a comprehensive database of information regarding the characteristics of trucks crossing the Ottawa River and thus provide a basis for future studies and analysis In meeting this objective this study does not directly address specific transportation issues but rather provides TRANS Agencies with a database for this purpose The database which is available for future studies provides significant information regarding the movement of heavy trucks across the Ottawa River historical heavy truck trends their composition in the traffic stream and their associated travel patterns
In the establishment of the database of truck characteristics and patterns it was relevant to investigate various relationships and rationalize them as appropriate for practical application in transportation planning activities It was also necessary to identify and rationalize other relationships which are valuable in transportation planning activities These relationships are important in the background analytical work necessary to assess the impacts of a future Ottawa River crossing on the movement of goods between the two regions on each side of the Ottawa River
Interprovincial Roadside Truck Survey REPORT 1
Once all relationships were identified the appropriate data tabulations were prepared and evaluated When the findings were complete and valid this report which explains the process and the reliability of the findings was prepared The details of the work are described in this report
The consultant acknowledges the invaluable assistance of the TRANS Agencies staff in the establishment of the survey database as well as the ongoing assistance in preparing tabulations and the provision of advice in the preparation of this report
20 STUDY METHODOLOGY The methodologykey tasks that were involved in carrying out the project involved a collaborative effort on the part of the TRANS Agenciesrsquo staff and the consultant The results are described in this report The methodology included the preparation of several tabulations and graphical representations of the relationships among various elements of the data which were collected This culminated in the information which was deemed to be the most useful and the most effective means of presenting the findings from the analysis
30 1989 TRUCK SURVEY A National Capital Region Goods Movement Study undertaken by Delcan in 1989 produced a report for TRANS in May 1991
In the 1989 Region-wide survey truck origin-destination characteristics were collected for the movement of goods on a Region-wide basis including the movement of goods across the Ottawa River
The 1989 survey differed from the 2000 survey in two key aspects
x As part of the 1989 survey licence plate information (characters) was recorded for 2964 trucks From these trucks a sample of 700 trucks for which registry information was available was drawn to attempt to obtain trip itineraries for this sample Complete information was obtained for 96 trucks From the study information it has been determined that a total of 5955 ldquolocalrdquo (internalinternal) (plus an indeterminate number of external) truck trips was estimated as having crossed the Ottawa River Thus the sample of 96 trucks represented a sampling rate of approximately 16 of the universe of approximately (more than) 6000 trucks As a point of comparison the truck survey in the autumn of 2000 obtained data on 495 trucks in a universe of 3450 trucks (a sample size of 143) observed as having crossed the Ottawa River
Interprovincial Roadside Truck Survey REPORT 2
Interprovincial Roadside Truck Survey REPORT 3
x For the purposes of the 1989 survey vehicles were classified as light trucks (2 axles4 wheels) medium trucks (2 axles6 wheels) and heavy trucks (single unit3+ axles) Any registered commercial vehicle qualified as a candidate to be included in the survey In comparing the previous survey with the current survey the inclusion of two axlefour wheel trucks in the previous survey skewed the results considerably Of importance is the lack of compatibility between the classification system used in the 1989 study and the classification system used in the 19992000 surveys The 2 axle4 wheel truck classification which was included in the 1989 survey is currently a much larger component of the vehicle fleet as a consequence of the increased popularity of SUVs (sport utility vehicles) and vans as a means of personal transport The 19992000 survey applied a more realistic classification system which excluded the 2 axle4 wheel truck from the scope of the survey
The current study is significantly more focussed having been designed to provide more detailed origin-destination information on the flow of trucks across the Ottawa River
In summary aside from other problems related to the sample size comparisons between the 1989 and 19992000 surveys would be difficult particularly since the in-scope vehicles established for each survey are significantly different
40 19992000 SURVEY PROGRAM and METHODOLOGY In this section of the report the survey program and the methodologies applied in the application of the data are described
41 Historical Vehicle Data
The Regional Municipality of Ottawa-Carleton (predecessor of the City of Ottawa) had undertaken annually traffic counts along major travel corridors to establish trends related to vehicle classificationsoccupancy With the exception of the years between 1995 and 1998 inclusive in which years data were collected for an eight hour period these data have been collected for one 12 hour period (0700 to 1900) each year These traffic classification and vehicle occupancy data were available to supplement the data collected as part of the 19992000 survey to create a comprehensive database A significant part of the on-going traffic count program includes the collection of information on interprovincial travel on an annual basis
From the vehicle classification and occupancy surveys for the Chaudiegravere and Macdonald-Cartier bridges the historical data are to varying degrees relevant and have been applied when appropriate
xhibit 1 Illustration of Survey Station
EXHIBIT 1b ILLUSTRATION OFb SURVEY STATIONb
King Edward Av
E
42 Driver Interviews
The purpose of the driver interview surveys was to gather specific data on the characteristics of the trucks the travel patterns including detailed information on the trip origins and destinations and the commoditygoods carried The roadside driver interview surveys were carried out by trained surveyors (under contract to the Ministry of Transportation of Ontario) familiar with the form of data collection programs of the type applied in this study Survey crews were stationed on the south side of the Ottawa River - on King Edward Avenue in the vicinity of Boteler Street and on Booth Street south of the Ottawa River Parkway Bridge over Booth Street - and interviewed drivers of candidate trucks
Illustrations of a typical survey station set-up and lane closures are provided in EXHIBIT 1 - ILLUSTRATION OF SURVEY STATION
Driver interviews were conducted on separate days for northbound and southbound traffic movements The surveys were undertaken as follows
DIRECTIONYEAR 1999 2000
Midnight to midnight 0700 to 0700 (24 hours) (24 hours)
NORTHBOUND October 25th amp 28th September 6th amp 7th
SOUTHBOUND October 26th amp 27th September 7th amp 8th
Interprovincial Roadside Truck Survey REPORT 4
1 Appendix A ndash Survey Database Fields Interprovincial Roadside Truck Survey REPORT 5
From the interview surveys each record in the database contains responses collected from the questionnaire used in the 2000 survey (a modified version of the questionnaire that was used in the 1999 survey) In the 1999 survey the origins and destinations of the truck trip were recorded using a macro description whereas in the 2000 survey trip origins and destinations were recorded in very precise and specific terms in order to apply the existing traffic zone system to yield valid origin-destination information Consequently the roadside surveys carried out in 2000 have been used exclusively to establish trip patterns and trip tables for future analysis
A comprehensive description of the database fields is provided in Appendix A1 The following sections and database fields from the interview surveys are considered to be relevant in varying degrees to the purpose of the study as identified in the Terms of Reference as
the development of a good understanding of the interprovincial movement patterns origins destinations and characteristics of medium and heavy trucks in the National Capital Region and the satisfaction of the TRANS mandate to furnish high quality and meaningful transportation data required for transportation planning and decision making in the National Capital Region
A - the direction of travel of the truck B - the configuration of the truck (number of tiresaxles) C - additional descriptors identifying the configurationbody style of the truck (tractor
trailer straight truck van dangerous goods placards etc) F - commodity information such as cargo on board capacity (availableused)
category and amount origindestination dangerous goods etc H - information on characteristics including number of stops trip origindestination
details trip startend datetime etc J - information on axle groupings of trucks etc
Electronic boards were used to record the responses by the drivers That is there are no paper records of the responses
43 Vehicular Traffic Classification Count Observations
Observers were stationed at the locations described earlier and recorded all (100) of the trucks passing the station
The purpose of the separate classification counts undertaken as part of the project was to provide the identification of vehicles by classification (type) in order to derive expansion factors for application in the study and ensure that the results of the surveys were consistent with the results of the historical on-going program of collecting vehicle classification data
As part of the data collection program truck classification counts were undertaken
BRIDGEYEAR 1999 2000
0500 to 2200 0700 to 0700 (17 hours) (24 hours)
Macdonald-Cartier October 25th to 28th September 6th to 8th
Chaudiegravere October 25th to 28th September 6th to 8th
CumberlandMasson Ferry September 5th to 8th
A graphical representation of the various types of vehicles that are classified in this study as Trucks (Heavy Trucks) is provided in Appendix B2 This truck classification system was used by the (former) Regional Municipality of Ottawa-Carleton and is consistent with that used in the Outaouais Region
The classification system applied by the observers was detailed It was later refined to present information by three key categories of trucks (heavy trucks) as follows
x 2 axle trucks - which represent trucks with six wheels such as tow trucks large (34 ton 1 ton) pick-up trucks small vans small dump trucks etc which create very few traffic operational problems but are defined as heavy trucks
x 3+ (3 or more) axle trucks - which represent medium size single unit trucks such as large dump trucks straight trucks concrete mix trucks etc which contribute to environmental concerns (noise vibration) but do not create undue traffic operational concerns although these are also defined as heavy trucks
x tractor trailer trucks - which represent the largest trucks such as tractor-trailer trucks flat-bed trucks etc which contribute to both environmental concerns and traffic operational concerns due to the time headway utilization (in starting from a stopped position) and the large turning radius (particularly in the case of right turns)
Trucks with four wheels are not included in the study and are considered to be light trucks These include small (12 ton) pick-up trucks such as the Toyota TacomaChevrolet Sonoma or the Jeep or any SUV etc
2 Appendix B ndash Heavy Truck Classification System Interprovincial Roadside Truck Survey REPORT 6
Exhibit 2 Study Truck Classification
A further illustration of the classification of trucks is provided in EXHIBIT 2 - STUDY TRUCK CLASSIFICATION In this study trucks with the truck id as indicated in Appendix B - 1 and 3 are included in the survey (Note - these trucks have six wheels and are considered to be heavy trucks based on the truck classification system discussed earlier)
Tractor Trailer
3+ Axle Truck
2 Axle Truck
EXHIBIT 2b STUDY TRUCKb
CLASSIFICATIONb
44 Automatic Traffic Recorder (ATR) Counts
Automatic traffic recorders are devices which record impulses from tires or vehicle masses passing the site of the detecting devices (road tubes cable loops in the pavement etc) The impulses are translated into vehicle counts and in some cases into a count of vehicles by classification (eg various sizes of trucks) The sensitivity of automatic traffic recorders is affected by the number of lanes of traffic included in a survey When road tubes are used to record vehicles in four or more lanes results can be quite variable
The intended purpose of undertaking traffic counts using automatic traffic recorders during the period 1200 October 17 1999 to 0700 October 31 1999 (fourteen days) was to ensure representativeness of the classification counts which were undertaken during a limited period of time (four days) In 2000 traffic volume information was not collected using automatic traffic recorders as part of the program
Interprovincial Roadside Truck Survey REPORT 7
Exhibit 3 Historical All Vehicle Volumes
1999 2000
50 KEY RELATIONSHIPS
In this section of the report the key relationships identified in respect to the historical data the truck count characteristics and the travel patterns are discussed
51 Historical traffic volumes
From the historical (1991 to 2000) vehicle classification (light trucks heavy trucks passenger cars buses taxis bicycles and others) and occupancy surveys data are available by direction of traffic flow across the Ottawa River bridges by time period (8 or 12 hours morning and afternoon peak periodshours) This enabled the preparation of profiles for various periods of the day
All vehicle historical volumes are presented for each direction of travel (northbound and southbound) for all five bridges across the Ottawa River in EXHIBIT 3 shyHISTORICAL ALL VEHICLE VOLUMES for 12-hour periods (0700-1900) and for 24-hour periods (note that the 12 hour data for 1995 to 1998 have been factored from 8 hour data and the 24 hour data are factored from 8 or 12 hour data)
50000
60000
70000
80000
90000
100000
110000
120000
1991 1992 1993 1994 1995 1996 1997 1998 1999 2000
All Ottawa River Bridges (12 and 24 hour volumes)
12h
24h
Average per direction 105600
Average per direction 93800
Number of vehicles factored to 12 hours from 8 hour counts
Southbound
Northbound
Year
Num
ber
of v
ehic
les
per
dire
ctio
n
EXHIBIT 3b HISTORICALb
ALL VEHICLE VOLUMESb
(Spring)
Factors that were established in the early 1980rsquos from the on-going traffic survey counts conducted by the former Regional Municipality of Ottawa Carleton suggested
Interprovincial Roadside Truck Survey
REPORT 8
that 12 hour traffic volumes could be factored by 139 to represent a daily 24 hour volume This factor has been applied in several studies (including those undertaken by TRANS) to all vehicles including trucks In comparison the data collected in the 2000 surveys determined that an appropriate factor for trucks crossing the Ottawa River would be 127 and this value has been applied in factoring 12 hour historical truck traffic counts to derive 24 hour values
One element to consider in evaluating the data which are presented in this section is the time of year at which the data were collected - in the annual program data are collected in MayJune whereas the data collected for this survey were collected in late October 1999 and in early September 2000
As illustrated in Exhibit 3 daily (24 hour) ldquoall vehiclerdquo traffic volumes in 2000 were at a level similar to that which was experienced 10 years earlier (1991) After a steady growth in the first half of the decade a modest decline was experienced in the latter half
At the peak (1993) there were in the 24 hour period approximately 105600 vehicles (average for each direction) crossing the river while in 2000 there were approximately 93800 vehicles (average for each direction - a decline of approximately 12 from the peak (average for each direction) crossing the river
Relevant to this project are the data for the Chaudiegravere and Macdonald-Cartier bridges which are bridges on which ldquoheavy trucksrdquo are allowed ldquoHeavy trucksrdquo are prohibited on the Alexandra Portage and Champlain bridges
EXHIBIT 4 - HISTORICAL TRUCK VOLUMES presents the historical truck data for the Macdonald-Cartier and the Chaudiegravere bridges collectively
As illustrated in Exhibit 4 daily (24 hour) truck traffic volumes were in both the spring and autumn of 2000 at a level slightly lower than that which was experienced 10 years earlier (1991) The lowest level of approximately 1400 trucks (average number for each direction) occurred in the mid-1990s
After a steady decline in the first half of the decade a modest growth was experienced in the latter half At the peak (1992) there were in the 24 hour period approximately 1950 trucks (average for each direction) crossing the river while in the surveys in the autumn of 2000 there were approximately 1725 trucks (average for each direction) - a decline of approximately 10 from the peak truck traffic crossing the river
The profiles for the truck volumes may appear to be more pronounced because of the relatively low numbers when compared to the all vehicle values
Interprovincial Roadside Truck Survey REPORT 9
Exhibit 4 Historical Truck Volumes
Table 1 Current and Historical Two Way Truck Traffic Volumes
TABLE 1 CURRENT AND HISTORICAL TWO WAY
TRUCK TRAFFIC VOLUMES
NUMBER OF TRUCKS CROSSING THE OTTAWA RIVER
INFORMATION SOURCE MORNING AFTERNOON 24 HOURS COMMUTER COMMUTER
PEAK HOUR PEAK HOUR
2000 SURVEY AUTUMN 3450 205 170
2000 ANNUAL SURVEY SPRING 3335 215 170
5 YEAR AVERAGE (1996-2000) 3120 235 180
10 YEAR AVERAGE (1991-2000) 3285 250 210
12h
24h
Average per direction 1950
Average per direction 1725
Southbound Northbound
Macdonald-Cartier and Chaudiegravere Bridges (12 and 24 hour volumes)
Number of trucks factored to 12 hours from 8 hour counts (Spring) Roadside Truck Survey Data
Num
ber o
f tru
cks
per d
irect
ion
Year
EXHIBIT 4b HISTORICALb
TRUCK VOLUMESb
(Autumn)
0
200
400
600
800
1000
1200
1400
1600
1800
2000
2200
2400
1991 1992 1993 1994 1995 1996 1997 1998 1999 1999 2000 2000
A summary of relevant data for two way truck traffic on the two bridges combined for the 24 hour period and the morning and afternoon peak hours is provided in TABLE 1 - CURRENT AND HISTORICAL TWO WAY TRUCK TRAFFIC VOLUMES
- Ottawa river crossing includes the Macdonald-Cartier and Chaudiegravere Bridges as heavy trucks are prohibited on the Alexandra Portage and Champlain bridges
Interprovincial Roadside Truck Survey REPORT 10
Table 2 Ratio of Peak Hour to 24 Hour Traffic Volumes 1999 to 2000
The 24-hour truck volume levels observed in the autumn of 2000 compare reasonably well with previous counts undertaken over the past ten year period
Further the historical data for the two bridges (Macdonald-Cartier and Chaudiegravere) crossing the Ottawa River have been tabulated for each bridge separately for the two bridges and for all bridges and are provided in Appendix C3 From the historical traffic volume information time period relationships have been determined for the peak hourpeak period peak hour12 hour and peak hour24 hour relationships These are provided in detail in Appendix D4
The most relevant information has been extracted and displayed in TABLE 2 ndash RATIO OF PEAK HOUR TO 24 HOUR TRAFFIC VOLUMES 1991 to 2000 The values for trucks are followed by the values for all vehicles (in parenthesis)
TABLE 2 RATIO OF PEAK HOUR TO 24 HOUR TRAFFIC VOLUMES
1991 to 2000
COMMUTER PEAK24 HOUR RATIO FOR TRUCKS (ALL VEHICLES) BRIDGE
FOR BOTH MORNING AFTERNOON DIRECTIONS
Range 7-11 ( 8-10) 5-8 ( 9-10) Macdonald-Cartier
Weighted Average 8 ( 9) 7 ( 9)
Range 6-9 ( 8-11) 3-8 ( 7-10) Chaudiegravere
Weighted Average 7 ( 9) 6 ( 9)
xx - trucks (yy) - all vehicles
A review of the information in Table 2 and in Appendix D indicates that
- For truck classifications
x in all cases the most stable relationships are the commuter peak hour24shyhour relationships The weighted averages for commuter peak hour24shyhour range from 6 to 8
3 Appendix C ndash Summary of Historical Ottawa River Crossing Truck Traffic Volumes4 Appendix D ndash Time Period Relationships Interprovincial Roadside Truck Survey REPORT 11
Interprovincial Roadside Truck Survey REPORT 12
x the range in the relationships is similar to the ldquoall vehiclerdquo relationships but is in general less variable than the all vehicle relationships when considered by direction
x the relationship of the peak hour24 hour when the directions are considered individually or in combination is quite inconsistent with the conventional rule of thumb relationship [the ldquorule of thumbrdquo suggests that the peak hour can be represented by 10 of the AADT (ANNUAL AVERAGE DAILY TRAFFIC)] and
- For all vehicle classifications
x in all cases the variations in the relationships are reasonably confined
x the average of the relationships over 10 years has been identical and therefore has been consistent particularly when both directions are considered
x the relationship of the peak hour24 hour when both directions are considered is consistent (although not precisely the same as) with the conventional rule of thumb relationship which suggests that the peak hour can be represented by 10 of the AADT
52 Truck Classification and Characteristics
The candidate trucks were grouped into sub-classifications (2 axle 3+ axle [3 or more axle] trucks and tractor trailers as described in Section 43
Of the total of approximately 3450 trucks observed over 24 hour period as crossing the Ottawa River there were 1550 2 axle (45) 880 3+ axle (25) and 1020 tractor trailer (30) trucks
Information on truck volumes as obtained from the classification counts in 1999 and 2000 is presented by direction for each of the Macdonald-Cartier and Chaudiegravere bridges in EXHIBIT 5 ndash DAILY TRUCK VOLUMES BY CLASSIFICATION
For the Macdonald-Cartier Bridge the volume of trucks was significantly higher (approximately 24) in 2000 than was the case in 1999 however the 2000 truck volumes are considered to be more representative for planning purposes (see comparative analysis in Table 1) than the 1999 truck volumes Truck volumes averaged over the two days were consistent in terms of the direction of travel and composition (2 axle 3+ axle and tractor trailers) For the Chaudiegravere Bridge truck volumes in 1999 and 2000 were reasonably consistent in magnitude by direction and by composition As would be expected the foregoing characteristics are also apparent when the volumes from both bridges are combined
Exhibit 5 Daily Truck Volumes by Classification
410
220
375
520
340
430
450
225
400
510
340
440
225
110
60
245
90
75
265
130
65
275
110
75
0
200
400
600
800
1000
1200
1400
1999 2000 1999 2000 1999 2000 1999 2000
Southbound Northbound
Southbound Northbound
2 Axles
3+ Axles
Trailers 1005
1290
1075
1290
395 410 460 460
Dai
ly n
umbe
r of
truc
ks p
er d
irect
ion
Macdonald-Cartier Chaudiegravere Year
EXHIBIT 5b DAILY TRUCK VOLUMESb
BY CLASSIFICATIONb
(Autumn)
The data from the MassonCumberland ferry when included with the totals from the two bridges had a minimal impact in terms of the total number of trucks (65 in each of the northbound and southbound directions) as well as in the 2 axle truck classification (10 in each direction) There is a disproportionate impact in the 3+ axle (30 in each direction) and tractor trailer (25 in each direction) classifications which would suggest that the smaller vehicles have less propensity to use the ferry probably due to its rural location
The recorded number of trucks by hour of the day is presented graphically in EXHIBIT 6 - HOURLY TRUCK VOLUMES MACDONALD-CARTIER BRIDGE and in EXHIBIT 7 - HOURLY TRUCK VOLUMES CHAUDIEgraveRE BRIDGE
It is clear from the exhibits that truck movements are more predominant during the mid-day hours than in the commuter peak hours The mid-day peaking phenomenon is more apparent on the Chaudiegravere Bridge than on the Macdonald-Cartier Bridge It is postulated that this is attributable to the attraction of the Chaudiegravere Bridge for short trips (Central Hull to Ottawa) in particular those made by smaller trucks The need to meet the expectations of the business day no doubt contributes to this phenomenon These characteristics also reinforce the historical trend which indicates that the relationship between the peak hour and the 24-hour volumes is lower for trucks than for mixed traffic The composition of the truck traffic stream is discussed in some detail in Sections 81 and 83 Interprovincial Roadside Truck Survey
REPORT 13
Exhi
Exhibit 7 Hourly
bit 6 Hourly Truck Volumes Macdonald-Cartier Bridge
Truck Volumes Chaudiegravere Bridge
MACDONALD-CARTIER BRIDGEb
0
20
40
60
80
100
120
140
160
180
200
220 1
00
200
300
400
500
600
700
800
900
100
0
110
0
120
0
130
0
140
0
150
0
160
0
170
0
180
0
190
0
200
0
210
0
220
0
230
0
240
0
Hour ending
Num
ber o
f tru
cks
ndash bo
th d
irect
ions
2 Axles
3+ Axles
Trailers
Peak hour 1000-1100 2 Axles = 81 3+ Axles = 69
Trailers = 56
(Autumn 2000)
EXHIBIT 6b HOURLY TRUCK VOLUMESb
0
20
40
60
80
100
120
140
160
180
200
220
100
200
300
400
500
600
700
800
900
100
0
110
0
120
0
130
0
140
0
150
0
160
0
170
0
180
0
190
0
200
0
210
0
220
0
230
0
240
0
Hour ending
Num
ber o
f tru
cks
ndash bo
th d
irect
ions
2 Axles
3+ Axles
Trailers
Peak hour 900-1000 2 Axles = 49 3+ Axles = 23 Trailers = 12
(Autumn 2000)
EXHIBIT 7b HOURLY TRUCK VOLUMESb
CHAUDIEgraveRE BRIDGEb
Interprovincial Roadside Truck Survey REPO RT 14
Exhibit 8 Hourly Vehicle Traffic Volumes
In EXHIBIT 8 - HOURLY VEHICLE TRAFFIC VOLUMES for all Ottawa River Bridges illustrates the typical daily peak traffic periods in the morning and afternoon and more significantly the relatively small proportion of trucks in the total traffic stream particularly during the peak traffic periods
0
2000
4000
6000
8000
10000
12000
14000
16000
18000
20000
100
200
300
400
500
600
700
800
900
100
0
110
0
120
0
130
0
140
0
150
0
160
0
170
0
180
0
190
0
200
0
210
0
220
0
230
0
240
0
Hour ending
Num
ber o
f veh
icle
s-bo
th d
irect
ions
All Ottawa River Bridges
Trucks
Other vehicles
Traffic not recorded Traffic not recorded
EXHIBIT 8b HOURLY VEHICLEb
TRAFFIC VOLUMESb
(Spring 2000)
53 Automatic Traffic Recorder (ATR) Counts
As indicated earlier there are significant challenges in collecting classification data using automatic traffic recorders The all vehicle survey data collected in 1999 are available from the TRANS Agencies however the survey results were not considered to be sufficiently reliable to be subjected to any form of analysis
No truck counts (by ATR) were taken as part of the Interprovincial Roadside Truck Survey in 2000 Any ATR data which are available were obtained from the annual traffic count program undertaken by the Regional Municipality of Ottawa-Carleton
Interprovincial Roadside Truck Survey REPORT 15
Exhibit 9 District System
5 Appendix E ndash Traffic Zones Comprising the Districts Interprovincial Roadside Truck Survey
REPORT 16
60 ZONEDISTRICT SYSTEM
In this report reference is made to the National Capital area This area closely replicates but does not precisely follow the boundaries of the new cities of Ottawa and Gatineau and Municipaliteacute Reacutegionale des Collines de lrsquoOutaouais (MRC) or the boundaries of the National Capital Region
The traffic zone system which has been in use for more than 10 years in the National Capital area is comprised of 258 zones (including 15 external zones) and all origin-destination information was coded to this 258-zone system This zone system has been respected in the development of a district system in all of the analyses which have been undertaken in the context of this study The district system was established to allow the recognition of relevant geographical characteristics and the presentation of relevant travel patterns and is illustrated in EXHIBIT 9 - DISTRICT SYSTEM The zones which comprise each of the ldquodistrictsrdquo are identified in Appendix E5 The districts have been identified by a geographical reference The preface IGB identified with some districts connotes a district which is Inside Green Belt
7 Hull
8 Aylmer
9 Gatineau West
10 Gatineau East
5 IGB East
1 Ottawa Central
6 Ottawa East
4 Ottawa South
2 IGB West
3 Ottawa West
Queacutebec
Ontario
EXHIBIT 9b DISTRICT SYSTEMb
There are ten ldquodistrictsrdquo in the current version of the ldquodistrictrdquo system External traffic zones in what can be considered to be ldquoremoterdquo areas (eg Montreal and contiguous areas in Quebec) have been incorporated into one of the ldquodistrictsrdquo In the presentation of the result of the analysis this factor must be borne in mind Modifications to the ldquodistrictrdquo system can be achieved with little effort for any study related to Interprovincial truck traffic
The ldquodistrictrdquo system was utilized to create origin-destination matrices for all trucks as well as each of the individual classifications of 2 axle 3+ axle and tractor trailer trucks
70 DATA EXPANSION Drivers of 549 trucks were interviewed and the survey yielded 495 (in-scope) valid (and completed) responses representing the characteristics of 3450 trucks - a sample size of 143 The data were considered to be of sufficient magnitude and strength to allow expansion by bridge and by certain time periods The methodology and expansion factors are discussed in the following
71 Expansion Methodology
The interview survey data are available for the morning and afternoon peak hours and peak periods as well as for the 0700 to 1900 [day] and 1900 to 0700 [night] and for the 24 hour period In order to determine the efficacy of utilizing the peak hour or peak period (as distinct from the 12 or 24 hour) data and applying a relationship factor (as discussed in Section 51) to establish origin-destination trip tables for transportation planning purposes two analytical processes have been applied
Origin-destination tables based on the district system were prepared to compare using percentages the results produced by the day data the night data and the full 24 hour data These tabulations were prepared for all trucks and individually for 2 axle trucks 3+ axle trucks and tractor trailers These tabulations are provided in Appendix F6 and Appendix G7
Out of a potential of 100 origin-destination pairs there were
x for all trucks of which there were 47 pairs there were 42 pairs in which the values for the day + night and the 24 hour were the same
x for 2 axle trucks of which there were 42 pairs there were 38 pairs in which the values for the day + night and the 24 hour were the same
6 Appendix F ndash ldquoDistrictrdquo Comparison of Trucks by Number 7 Appendix G ndash ldquoDistrictrdquo Comparison of Trucks by Percent Interprovincial Roadside Truck Survey REPORT 17
x for 3+ axle trucks of which there were 36 pairs there were only 22 pairs in which the values for the day + night and the 24 hour were the same
x for tractor trailer trucks of which there were 44 pairs there were only 28 pairs in which the values for the day + night and the 24 hour were the same
Since peak hour (normally the afternoon peak hour) values are typically used for transportation planning and road design principles it is essential to ensure that the peak hour (in particular the afternoon peak hour) values provide representative information for these purposes
It became apparent that the use of the afternoon peak period matrix would yield less reliable results than would the use of the 24 hour period accompanied by the application of a factor to estimate the peak period values The reliability of this procedure is enhanced by the consistency in the relationships between the peak period and the 24-hour period as determined from the results of the analysis presented earlier (Section 51)
It is apparent that the use of the values derived for all trucks by summing the two twelve hour survey periods 0700 to 1900 [day] and 1900 to 0700 [night]) would yield sufficiently reliable results to which a factor to estimate the peak period values could be applied
In the final analysis acceptable sampling rates were achieved by considering the utilization of the data by bridge and by direction for either one time period (24 hours) or two time periods (0700 to 1900 and 1900 to 0700) combined Intuitively it was collectively considered that the utilization of a process in which the two time periods were factored separately and combined to provide a strong sample would be the superior of the two methods
72 Expansion Factors
Survey expansion factors were required to expand the interview sample to the universe of the trucks observed crossing the Ottawa River Initially expansion factors were developed based on grouping the trucks by bridge by direction of travel by vehicle type and by time period The results indicated a very low (as small as 1) sampling rate for certain classifications of vehicles during certain time periods A sampling rate of 5 would be considered to be acceptable This was as a consequence of for example
x the necessity to discontinue the survey during some peak traffic periods due to the congestion being created by the survey procedures resulting in very few and in some cases no interviews
Interprovincial Roadside Truck Survey REPORT 18
Table 3 Summary of 3+ Axle Trucks by Body Type and Cargo
Interprovincial Roadside Truck Survey REPORT 19
x certain types of trucks (eg 3+ axle trucks such as those used for construction materials empty dump trucks) being directed away from the interview stations on the perception that an interview of the driver was unnecessary This was in particular relevant on the Macdonald-Cartier Bridge
Based on the proportion of empty 3+ axle trucks a further examination of this classification of truck was undertaken TABLE 3 - SUMMARY OF 3+ AXLE TRUCKS BY BODY TYPE AND CARGO provides detailed information on the 3+ axle trucks in terms of the body type and whether or not cargo was being transported A significant number of the 3+ axle trucks are comprised of the dump truck tractor cab body types
TABLE 3 SUMMARY OF 3+ AXLE TRUCKS
BY BODY TYPE AND CARGO
TRUCK BODY TYPE WITH CARGO EMPTY TOTAL
DUMP TRUCK 65 225 290
FLATBED 90 85 175
TANKER 40 10 50
VAN ndash not refridgerated 50 - 50
VAN ndash refridgerated 20 25 45
CONTAINER CARRIER 10 25 35
FLOAT - 50 50
TRACTOR CAB (only) - 95 95
OTHER - 65 25
TOTAL 340 540 880
By utilizing longer time periods for the development of the expansion factors it was possible to achieve better sampling rates and thus provide more reliable results Following on from the foregoing the use of the two twelve hour survey periods (0700 to 1900 [day] and 1900 to 0700 [night]) was examined Sample sizes for the two periods differ There were significantly more trucks included in the 0700 to 1900 survey period while the sample size from the 1900 to 0700 survey period was significantly greater
The expansion factors are presented graphically for the three vehicle classifications for each bridge in the form of the sample size for two 12 hour time periods (0700 to
Exhibit 10 Sample Size by Time of Day
2 Axles
Tractor Trailers
3 Ax es
NB SB NB SB NB SB NB SB
70
l
0
5
10
15
20
25
30
35
40
100
Chaudiegravere Macdonald-Cartier
Night 1900-0700 Day 0700-1900 Night 1900-0700 Day 0700-1900
5 5 5
Tractor Trailers
3 Axles
2 Axles
EXHIBIT 10b SAMPLE SIZEb
BY TIME OF DAYb
Northbound Southbound Northbound Southbound Northbound Southbound Northbound Southbound
Perc
ent o
f tru
cks
(Autumn 2000)
1900 [day] and 1900 to 0700 [night]) in EXHIBIT 10 - SAMPLE SIZE BY TIME OF DAY The large sample size for tractor trailers during the night period on the Chaudiegravere Bridge can be attributed to the small number of tractor trailers using the bridge during this period
The numerical values for the expansion factors are provided in TABLE 4 shyEXPANSION FACTORS BY BRIDGE BY DIRECTION AND BY TIME OF DAY
Table 4 Expansion Factors by Bridge by Direction and by Time of Day
TABLE 4 EXPANSION FACTORS BY BRIDGE
BY DIRECTION AND BY TIME OF DAY
NORTHBOUND SOUTHBOUND BRIDGE PERIOD 2 3+ Tractor 2 3+ Tractor
Axles Axles Trailer Axles Axles Trailer
MACDONALD shy Day (0700ndash1900) 128 157 65 112 482 74CARTIER Night (1900ndash0700) 121 76 39 150 260 30
Day (0700ndash1900) 51 61 36 63 47 32CHAUDIEgraveRE
Night (1900ndash0700) 28 110 10 34 32 14
- Sampling rate less than 5
Interprovincial Roadside Truck Survey REPORT 20
8 Appendix H ndash Survey Expansion Factors Interprovincial Roadside Truck Survey REPORT 21
The complete analysis in tabular as well as in graphical form is provided in Appendix H8 in which the expansion factors are presented graphically for the three vehicle classifications for each bridge in the form of the sample size for various time periods (24 hours 12 hours (0700 to 1900 and 1900 to 0700) the morning peak period [0600 to 1000] the afternoon peak period [1500 to 1900] the mid-day period [1000 to 1500] and the night period [1900 to 0600]
Generally speaking the sample size is adequate particularly in the case of the tractor-trailer classification which is considered to be of the greatest significance of the three truck classifications in the context of this study
The 3+ axle trucks have the lowest sample size (as low as 2 for the southbound direction) The three axle category in particular the dump and tractor-trailer (without a trailer) type trucks dominate the empty trucks identified in the survey and were subjectively considered to form a large part of the trucks (affected by the exclusion actions discussed earlier in this section)
The empty 3+ axle truck aspect has been discussed earlier in Section 72 (Table3)
80 TRIP CHARACTERISTICS AND PATTERNS In this section of the report the vehicle types inter-regionalexternal travel origin-destination information and vehicle loading and commodities are examined to establish trip characteristics and patterns
81 Vehicle Types
As indicated earlier of the total of approximately 3450 trucks per day observed in the surveys as crossing the Ottawa River there were 1550 2 axle (45) 880 3+ axle (25) and 1020 tractor trailer (30) trucks
EXHIBIT 11 - DAILY TRUCK VOLUMES BY CLASSIFICATION illustrates the variation in the number of trucks on the two bridges for the three classifications of trucks
The Macdonald-Cartier bridge carries by far the largest number (870) and proportion (34) of the tractor-trailer classification of truck The 2 axle truck dominates the composition (60) on the Chaudiegravere bridge
Exhibit 11 Daily Truck Volumes by Classification
Exhibit 12 Cumulative Truck Traffic
Macdonald - Cartier Bridge 2580 Trucks
Tractor Trailers 17
( 150 )
Chaudiegravere Bridge 870 Trucks
2 Axles 60
( 520 )
Tractor Trailers 34
( 870 )
2 Axles 40
( 1030 )
3+ Axles 23
( 200 )
3+ Axles 26
( 680 )
EXHIBIT 11b DAILY TRUCK VOLUMESb
BY CLASSIFICATIONb
(Autumn 2000)
EXHIBIT 12 - CUMULATIVE TRUCK TRAFFIC illustrates the profile of the truck travel for all trucks (by each classification) crossing the Ottawa River over the course of the day commencing with the 0600 time point By 2100 95 of the 3+ axle trucks 93 of the 2 axle trucks and 80 of the tractor trailer crossings of the Ottawa River have occurred
0
10
20
30
40
50
60
70
80
90
100
600
700
800
900
100
0
110
0
120
0
130
0
140
0
150
0
160
0
170
0
180
0
190
0
200
0
210
0
220
0
230
0
000
100
200
300
400
500
Time of Day
Tractor Trailer
2 Axles
3+ Axles
EXHIBIT 12b CUMULATIVEb
TRUCK TRAFFICbMacdonald-Cartier and Chaudiegravere Bridges
Per
cent
of t
ruck
s pe
r da
y
(Autumn 2000)
Interprovincial Roadside Truck Survey
REPORT 22
Table 5 Truck Travel Composition and Trip Distance
In TABLE 5 -TRUCK TRAVEL COMPOSITION AND TRIP DISTANCE an analysis of travel by truck classification is provided Data in the table indicate that the composition of the trucks on the network for trucks crossing the Ottawa River is attributable to 2 axle trucks to the extent of 45 to 3+ axle trucks to the extent of 25 and to tractor trailer trucks to the extent of 30 The tractor trailer trucks (which represent only 30 of the total trucks have the longest trip lengths with 50 of the total trip distance compared to 3+ axle trucks with 20 of the total trip distance and 2 axle trucks with 30 of the total trip distance
TABLE 5 TRUCK TRAVEL COMPOSITION AND TRIP DISTANCE
TRUCK CLASSIFICATION TRUCK TRIPS(1) TRIP DISTANCE(2)
2 AXLE 45 30
3+ AXLE 25 20
TRACTOR TRAILER 30 50 (1) As determined from the classification counts
(2) As determined by assigning truck trips to the road system
82 Trip Tables
Origin-destination trip tables based on the district system were prepared solely for the purposes of the analysis presented in this report in order to test the sufficiency of the base data in the context of the district system described earlier The results of this application are discussed in this section of the report The objective of the analysis is for the foregoing purpose only The application of the data for any subsequent transportation planning activity andor project can be undertaken with a much finer level of detail particularly in terms of the zone and district system which can be applied The determination in this regard will be the responsibility of the agencyfirmperson undertaking the activity
83 Travel Patterns
In approximate terms there was a total of 3450 trucks per day in 2000 of which 2580 used the Macdonald-Cartier bridge - 1290 northbound and 1290 southbound shyand 870 used the Chaudiegravere bridge - 460 northbound and 410 southbound
Interprovincial Roadside Truck Survey REPORT 23
9 Appendix I ndash Trip Characteristics Interprovincial Roadside Truck Survey REPORT 24
Three trip types are identified
x a local trip which is also called an internalinternal trip which has both an origin and a destination within the National Capital area A trip from Hull to the west end of Ottawa would be a local trip
x a through trip which is also called an externalexternal trip which has both an origin and a destination outside the National Capital area A trip from Montreal to Maniwaki which crosses the Ottawa River would be a through trip
x an inter-regional trip which is also called either an internalexternal or an externalinternal trip which in the case of an internalexternal trip has an origin within the National Capital area and a destination outside the area (internalexternal) and in the case of an externalinternal trip has an origin outside the National Capital area and a destination within the National Capital area (externalinternal) A trip from Gatineau to Montreal (crossing the Ottawa River) would be an internalexternal trip and a trip from Kingston to Gatineau would be an externalinternal trip with both trips classed as an inter-regional trip
An overview of the trip characteristics reveals that 2300 (67) of the trucks per day made local trips (an origin and destination generally within the National Capital area) 975 (28) of the trucks made inter-regional trips (either an origin or a destination outside the National Capital area) while 175 (5) of the trucks made a through trip (an origin and destination outside the National Capital area) The tabulations of the trips for each bridge separately by direction and by truck classification are provided in Appendix I9
EXHIBIT 13 - DAILY TRUCK COMPOSITION BY CLASSIFICATION shyMACDONALD-CARTIER BRIDGE and EXHIBIT 14 - DAILY TRUCK COMPOSITION BY CLASSIFICATION - CHAUDIEgraveRE BRIDGE illustrate the variation in the trip patterns of trucks on each of the two bridges for the three classifications of trucks
The key characteristics identified are
x 60 of the truck traffic on the Macdonald-Cartier bridge are local trips (ie 40 of the trips have at least one end outside the limits of the National Capital area) while the trucks on the Chaudiegravere bridge are predominantly (87) local trips (internalinternal)
x tractor trailer trucks are dominant on both the Macdonald-Cartier bridge and the Chaudiegravere bridge in the through trip type as well as but in a less prominent way in the inter-regional trip type indicating the fact that the tractor trailer is used for the longer trips
Exhibit 13 Daily truck Composition Macdonald-Cartier Bridge
Exhibit 14 Daily Truck Composition Chaudiegravere Bridge
110 750( 760 )
( 155 )
bull the two axle truck is the most prominent classification for local trips particularly on the Chaudiegravere bridge
EXHIBIT 13b DAILY TRUCK COMPOSITIONb MACDONALD-CARTIER BRIDGEb
2 Axles 50
3 Axles 35
Tractor Trailer 15
3 Axles 15
2 Axles 26
Tractor Trailer 59
17
Tractor Trailer 83
2 Axles
Local 60
( 1550 )
Inter-regional 34
( 865 )
Through 6
2580 Trucks
(Autumn 2000)
165
Local 87
Inter-regional 12
( 105 )
Through 1
( 10 )
2 Axles 66
3 Axles 25
Tractor Trailer 9
2 Axles 25
3 Axles 8Tractor Trailer
67
Tractor Trailer 100
EXHIBIT 14b DAILY TRUCK COMPOSITIONb
CHAUDIEgraveRE BRIDGEb
870 Trucks
750110
(Autumn 2000)
Interprovincial Roadside Truck Survey
REPORT 25
Exhibit 15 Trip Itineraries
EXHIBIT 15 - TRIP ITINERARIES provides the trip end (destination) facility for in one case on the left of the exhibit the trips ending in Ontario and in the other case on the right of the exhibit the trips ending in Queacutebec With the exception of the imbalance in the retail trip ends (10 ending in Ontario and 24 ending in Queacutebec) and the truckrail terminal trip ends (23 ending in Ontario and 14 ending in Queacutebec) the end point of trips is more or less in an equilibrium condition
33
24 10
10
23
28
22 24
12 14
--------------------------------shy Other
----------shy Warehouse Distribution Centre --------------------shy Retail Outlet
Manufacturer Primary Producer
------------shy Truck and Rail Terminal
-------------------------------------shy
------------shy------------------------shy
-----------shy
Trips to Queacutebecfrom Ontario
Trips to Ontario from Queacutebec
EXHIBIT 15B TRIP ITINERARIESB
(Autumn 2000)
84 Origin-Destination Patterns
The most relevant relationships from a transportation planning perspective are the vehicle size and the origindestination information for the various time periods Using this information a database was prepared which is as valid and useful as possible and can be applied at the traffic zone system level (258 zones)
As discussed earlier a 10 district system (an aggregate of the 258 zone system) has been established to present origindestination information in as clear a format as possible In this context originsdestinations beyond the National Capital area have been included in the adjacent district For example the ldquoHullrdquo District includes origindestinations from a large area extending northerly along Highway 5 and likewise ldquoOttawa Eastrdquo includes origindestinations for a large portion of eastern Ontario as well as areas of Queacutebec east of the Queacutebec-Ontario border (eg Montreal)
As an overview of the origins and destinations of all trucks EXHIBIT 16 - DISTRIBUTION OF ORIGINSDESTINATIONS BY CLASSIFICATION illustrates the distribution by district of all of the originsdestinations recorded in the survey There is a reasonably balanced distribution ranging from a low of 400 (Ottawa Centre and IGB West) to a high of 1360 (Hull) originsdestinations based on the district system which has been applied in the study
Interprovincial Roadside Truck Survey REPORT 26
Exhibit 16 Distribution of OriginsDestinations by Classification
10 Appendix J ndash Origins and Destinations of Truck Trips by Direction Interprovincial Roadside Truck Survey
REPORT 27
1 Ottawa Central
5 IGB East
2 IGB West
3 Ottawa West
4 Ottawa South
6 Ottawa East
7 Hull
8 Aylmer
9 Gatineau West
10 Gatineau East
Queacutebec
Ontario 2 Axle Trucks
3+ Axles Trucks
Tractor Trailers
Total number of trucks (rounded) (Origins+Destinatios) for the District
IGB ndash Inside Green Belt
xxx
(Autumn 2000)
EXHIBIT 16b DAILY DISTRIBUTION OF ORIGINSb
DESTINATIONS BY CLASSIFICATIONb
The key characteristics as portrayed on the exhibit are
bull the dominance of the Hull District as an attractorgenerator of truck trips (1360 Origins and Destinations)
bull the distribution of generated and attracted trips tofrom the nine remaining districts varies from 400 to 930 truck trips
bull the variability of the truck classifications from ldquodistrict to districtrdquo is evident although the two eastern districts one on each side of the Ottawa River which also include origins and destinations outside the National Capital area (eg Montreal) have a large proportion of tractor trailer trucks
Additional data and information are presented graphically in Appendix J10 for the northbound and southbound trips individually
The concentration of the origins and destinations for individual traffic zones is portrayed in EXHIBIT 17 DAILY CONCENTRATION OF TRUCK TRIP ORIGINS AND DESTINATIONS As would be expected truck trip ends (at least one) are
Exhibit 17 Concentration of Truck Trip OriginsDestinations
11 Appendix K ndash Concentration of Truck Trip Ends Interprovincial Roadside Truck Survey REPORT 28
focussed in lands used for industrial purposes - notably in the Industrial Avenue area in business parks in Ottawa and in the industrial areas of the former cities of Aylmer Hull and Gatineau
Thirteen of the 220 urban traffic zones account for approximately 40 of all truck trip ends and a further twenty urban traffic zones account for a further 20 of all truck trip ends
The data are presented in tabular form in Appendix K11
b b
(Autumn 2000)
gt100 Truck Trips (13 zones of All Truck Trips)
50 to 100 Truck Trips (20 zones of All Truck Trips)
lt 50 Truck Trips of All Truck Trips)
Truck Trips outside Study Area of All Truck Trips)
20
21
19
40 ndash
-
(
(
EXHIBIT 17 DAILY CONCENTRATION OF TRUCK
TRIP ORIGINS AND DESTINATIONSb
Daily Origin-Destination desire lines for all trucks as well as for each truck type are presented in the following four four-panel exhibits
x EXHIBIT 18 - DAILY ORIGIN-DESTINATION DESIRE LINES ALL TRUCK TRIPS ( AUTUMN 2000)
x EXHIBIT 19 - DAILY ORIGIN-DESTINATION DESIRE LINES 2 AXLE TRUCK TRIPS ( AUTUMN 2000)
x EXHIBIT 20 - DAILY ORIGIN-DESTINATION DESIRE LINES 3+ AXLE TRUCK TRIPS ( AUTUMN 2000)
x EXHIBIT 21 - DAILY ORIGIN-DESTINATION DESIRE LINES TRACTOR TRAILER TRIPS ( AUTUMN 2000)
On each of these four-panel exhibits each panel illustrates the desire lines (daily) for trucks to and from each of the four ldquodistrictsrdquo on the north side of the Ottawa River from and to each of the six ldquodistrictsrdquo on the south side of the Ottawa River in the autumn of 2000 The information is also provided numerically in Appendix L12
The ldquoall trucksrdquo trip patterns (Exhibit 18) highlight the role of Hull as a major generatorattractor of truck trips when compared with Aylmer Gatineau West and Gatineau East The exhibit also presents trip interchanges with each of six districts on the Ottawa side of the Ottawa River
Two axle truck patterns (Exhibit 19) are similar to the patterns of ldquoall trucksrdquo with downtown Hull again dominating the generation and attraction of trips East Gatineau trips have an orientation to the eastern ldquodistrictsrdquo in Ottawa
Three axle trucks (Exhibit 20) seem to have an ldquoaffinityrdquo for the corresponding ldquodistrictsrdquo on the opposite side of the river That is west ldquodistrictsrdquo on the north side of the Ottawa River attract trips tofrom west ldquodistrictsrdquo on the south side of the Ottawa River Similarly east ldquodistrictsrdquo on the north side attract trips tofrom east ldquodistrictsrdquo on the south side of the Ottawa River
For tractor trailers (Exhibit 21) Hull again has the largest number of trips with strong interchanges with Ottawa East and Ottawa West Gatineau East and to a slightly less extent Aylmer are also prominent with strong interchanges with Ottawa East Ottawa West and Ottawa South
The Ottawa Central ldquodistrictrdquo serves as a destination for the fewest number of tractor trailer trips
More detailed comments are provided in Appendix M13
12 Appendix L ndash Tabulations of Trip Origins-Destinations by Truck Classification 13 Appendix M - Detailed Comments on Trip Origins and Destinations
Interprovincial Roadside Truck Survey REPORT 29
Queacute
bec
Ont
ario
Ont
ario
Queacute
bec
Queacute
bec
Ont
ario
Ont
ario
Ayl
mer
H
ull
Gat
inea
u W
est
Gat
inea
u E
ast
Otta
wa
Eas
t
IGB
Eas
t
Otta
wa
Cen
tral
IGB
Wes
t
Otta
wa
Sou
thO
ttaw
a W
est
Gat
inea
u E
ast
Gat
inea
u W
est
Hul
l
Ayl
mer
Otta
wa
Eas
t
IGB
Eas
t O
ttaw
a C
entr
al
IGB
Wes
t
Otta
wa
Sou
th
Otta
wa
Wes
t
Gat
inea
u E
ast
Gat
inea
u W
est
Hul
l
Ayl
mer
Otta
wa
Eas
t
IGB
Eas
t
Otta
wa
Cen
tral
IGB
Wes
t
Otta
wa
Sou
thO
ttaw
a W
est
EX
HIB
IT 1
8 O
RIG
IN-D
ES
TIN
AT
ION
DE
SIR
E L
INE
S A
LL
TR
UC
K T
RIP
S (
AU
TU
MN
200
0)
124
Ayl
mer
Hul
l Gat
inea
u W
est
Gat
inea
u E
ast
Otta
wa
Eas
t
IGB
Eas
t
Otta
wa
Cen
tral
IGB
Wes
t
Otta
wa
Sou
thO
ttaw
a W
est
Num
ber
of tr
uck
trip
s an
d di
rect
ion
LE
GE
ND
70
7 N
umbe
r of
O-D
rsquos fo
r D
istr
ict
HU
LL
OR
IGIN
S A
ND
DE
ST
INA
TIO
NS
AL
L T
RU
CK
TR
IPS
B
GA
TIN
EA
U E
AS
T O
RIG
INS
AN
D D
ES
TIN
AT
ION
S A
LL
TR
UC
K T
RIP
S
D
GA
TIN
EA
U W
ES
T O
RIG
INS
AN
D D
ES
TIN
AT
ION
S A
LL
TR
UC
K T
RIP
S
C
AY
LM
ER
OR
IGIN
S A
ND
DE
ST
INA
TIO
NS
AL
L T
RU
CK
TR
IPS
A
Queacute
bec
Inte
rpro
vinc
ial R
oads
ideT
ruck
Sur
vey
RE
PO
RT
30
Queacute
bec
Ont
ario
Ont
ario
Queacute
bec
Queacute
bec
Ont
ario
Ont
ario
Ayl
mer
H
ull
Gat
inea
u W
est
Gat
inea
u E
ast
Otta
wa
Eas
t
IGB
Eas
t
Otta
wa
Cen
tral
IGB
Wes
t
Otta
wa
Sou
thO
ttaw
a W
est
Gat
inea
u E
ast
Gat
inea
u W
est
Hul
l
Ayl
mer
Otta
wa
Eas
t
IGB
Eas
t
Otta
wa
Cen
tral
IGB
Wes
t
Otta
wa
Sou
th
Otta
wa
Wes
t
Gat
inea
u E
ast
Gat
inea
u W
est
Hul
l
Ayl
mer
Otta
wa
Eas
t
IGB
Eas
t
Otta
wa
Cen
tral
IGB
Wes
t
Otta
wa
Sou
thO
ttaw
a W
est
EX
HIB
IT 1
9 O
RIG
IN-D
ES
TIN
AT
ION
DE
SIR
E L
INE
S 2
AX
LE
TR
UC
K T
RIP
S (
AU
TU
MN
200
0)
33
Ayl
mer
Hul
l Gat
inea
u W
est
Gat
inea
u E
ast
Otta
wa
Eas
t
IGB
Eas
t
Otta
wa
Cen
tral
IGB
Wes
t
Otta
wa
Sou
thO
ttaw
a W
est
Num
ber
of tr
uck
trip
s an
d di
rect
ion
LE
GE
ND
26
5 N
umbe
r of
O-D
rsquos fo
r D
istr
ict
HU
LL
OR
IGIN
S A
ND
DE
ST
INA
TIO
NS
2 A
XL
E T
RU
CK
TR
IPS
B
GA
TIN
EA
U E
AS
T O
RIG
INS
AN
D D
ES
TIN
AT
ION
S 2
AX
LE
TR
UC
K T
RIP
S
D
GA
TIN
EA
U W
ES
T O
RIG
INS
AN
D D
ES
TIN
AT
ION
S 2
AX
LE
TR
UC
K T
RIP
S
C
AY
LM
ER
OR
IGIN
S A
ND
DE
ST
INA
TIO
NS
2 A
XL
E T
RU
CK
TR
IPS
A
Queacute
bec
Inte
rpro
vinc
ial R
oads
ideT
ruck
Sur
vey
RE
PO
RT
31
Queacute
bec
Ont
ario
Ont
ario
Queacute
bec
Queacute
bec
Ont
ario
Ont
ario
Ayl
mer
H
ull
Gat
inea
u W
est
Gat
inea
u E
ast
Otta
wa
Eas
t
IGB
Eas
t
Otta
wa
Cen
tral
IGB
Wes
t
Otta
wa
Sou
thO
ttaw
a W
est
Gat
inea
u E
ast
Gat
inea
u W
est
Hul
l
Ayl
mer
Otta
wa
Eas
t
IGB
Eas
t
IGB
Wes
t
Otta
wa
Sou
th
Otta
wa
Wes
t
Gat
inea
u E
ast
Gat
inea
u W
est
Hul
l
Ayl
mer
Otta
wa
Eas
t
IGB
Eas
t
Otta
wa
Cen
tral
IGB
Wes
t
Otta
wa
Sou
thO
ttaw
a W
est
EX
HIB
IT 2
0 O
RIG
IN-D
ES
TIN
AT
ION
DE
SIR
E L
INE
S 3
+ A
XL
E T
RU
CK
TR
IPS
(A
UT
UM
N 2
000)
26
Ayl
mer
Hul
l Gat
inea
u W
est
Gat
inea
u E
ast
Otta
wa
Eas
t
IGB
Eas
t
Otta
wa
Cen
tral
IGB
Wes
t
Otta
wa
Sou
thO
ttaw
a W
est
Num
ber
of tr
uck
trip
s an
d di
rect
ion
LE
GE
ND
12
0 N
umbe
r of
O-D
rsquos fo
r D
istr
ict
HU
LL
OR
IGIN
S A
ND
DE
ST
INA
TIO
NS
3+
AX
LE
TR
UC
K T
RIP
S
B
GA
TIN
EA
U E
AS
T O
RIG
INS
AN
D D
ES
TIN
AT
ION
S 3
+ A
XL
E T
RU
CK
TR
IPS
D
G
AT
INE
AU
WE
ST
OR
IGIN
S A
ND
DE
ST
INA
TIO
NS
3+
AX
LE
TR
UC
K T
RIP
S
C
AY
LM
ER
OR
IGIN
S A
ND
DE
ST
INA
TIO
NS
3+
AX
LE
TR
UC
K T
RIP
S
A
Queacute
bec
Otta
wa
Cen
tral
Inte
rpro
vinc
ial R
oads
ideT
ruck
Sur
vey
RE
PO
RT
32
Queacute
bec
Ont
ario
Ont
ario
Queacute
bec
Queacute
bec
Ont
ario
Ont
ario
Ayl
mer
H
ull
Gat
inea
u W
est
Gat
inea
u E
ast
Otta
wa
Eas
t
IGB
Eas
t
Otta
wa
Cen
tral
IGB
Wes
t
Otta
wa
Sou
thO
ttaw
a W
est
Gat
inea
u E
ast
Gat
inea
u W
est
Hul
l
Ayl
mer
Otta
wa
Eas
t
IGB
Eas
t
IGB
Wes
t
Otta
wa
Sou
th
Otta
wa
Wes
t
Gat
inea
u E
ast
Gat
inea
u W
est
Hul
l
Ayl
mer
Otta
wa
Eas
t
IGB
Eas
t
Otta
wa
Cen
tral
IGB
Wes
t
Otta
wa
Sou
thO
ttaw
a W
est
EX
HIB
IT 2
1 O
RIG
IN-D
ES
TIN
AT
ION
DE
SIR
E L
INE
S T
RA
CT
OR
TR
AIL
ER
TR
IPS
(A
UT
UM
N 2
000)
65
Ayl
mer
Hul
l Gat
inea
u W
est
Gat
inea
u E
ast
Otta
wa
Eas
t
IGB
Eas
t
Otta
wa
Cen
tral
IGB
Wes
t
Otta
wa
Sou
thO
ttaw
a W
est
Num
ber
of tr
uck
trip
s an
d di
rect
ion
LE
GE
ND
32
3 N
umbe
r of
O-D
rsquos fo
r D
istr
ict
HU
LL
OR
IGIN
S A
ND
DE
ST
INA
TIO
NS
TR
AC
TO
R T
RA
ILE
R T
RIP
S
B
GA
TIN
EA
U E
AS
T O
RIG
INS
AN
D D
ES
TIN
AT
ION
S T
RA
CT
OR
TR
AIL
ER
TR
IPS
D
G
AT
INE
AU
WE
ST
OR
IGIN
S A
ND
DE
ST
INA
TIO
NS
TR
AC
TO
R T
RA
ILE
R T
RIP
S
C
AY
LM
ER
OR
IGIN
S A
ND
DE
ST
INA
TIO
NS
TR
AC
TO
R T
RA
ILE
R T
RIP
S
A
Queacute
bec
Otta
wa
Cen
tral
Inte
rpro
vinc
ial R
oads
ideT
ruck
Sur
vey
RE
PO
RT
33
85 Vehicle Loading and Commodities
The survey reported that 2075 trucks were carrying goods while 1375 trucks were empty for a total of 3450 trucks per day
Of those drivers responding to the type of commodity carried 185 different commodities were identified The commodities were grouped into eight categories A complete listing of the commodities and the group with which the commodity is categorized is provided in Appendix N14
A graphical and numerical representation of the frequency with which a particular commodity was identified as having been carried is provided subdivided into the three truck classifications in EXHIBIT 22 ndash GOODS CARRIED PER DAY
Also indicated on Exhibit 22 are the distributions of the truck classificationcommodity by time of travel [day (0700 to 1900) and night (1900 to 0700)]
The five most frequently reported commodities as illustrated in Exhibit 22 for all trucks are
x construction materials (475 trips)
x food and beverage (415 trips)
x general merchandise (360 trips)
x paper and paper products (310 trips)
x wood and wood products (195 trips)
Origin-destination trip tables have been prepared for those commodities for which it was deemed likely to provide some defined pattern of desire lines - construction materials general merchandise paperpaper products and woodwood products
The exclusion of the food and beverage category was based on the expected widely dispersed trip patterns associated with this category The purpose here is to highlight significant differences among the trip patterns associated with the major commodity groups and is not intended to influence the perception of anyone who will conduct a more thorough analysis of the data
The key characteristics for individual commodities are as follows
x for construction materials the dominance of the Aylmer to Ottawa Central trip pattern
14 Appendix N ndash Categories of Commodities Interprovincial Roadside Truck Survey REPORT 34
Exh
ibit
22G
oods
Car
ried
per
Day
EX
HIB
IT 2
2G
OO
DS
CA
RR
IED
E
XH
IBIT
22b
G
OO
DS
CA
RR
IED
PE
R D
AY
b
2 A
XL
E T
RU
CK
S
95
5
45
10
105
20
5
15
200
195
205
50
GO
OD
S C
AR
RIE
D
Otta
wa
Riv
er C
ross
ing
by T
ruck
Typ
e
(Au
tum
n 2
000)
3+ A
XL
E T
RU
CK
S
90
4
0
10 7
0
5
10
25
10
15
155
Com
mod
ity
1 =
Co
nst
ruct
ion
Mat
eria
ls
2 =
Fo
od
an
d B
ever
age
3 =
Gen
eral
Mer
chan
dis
e
4 =
Pap
er amp
Pap
er P
rod
uct
s
5 =
Wo
od
amp W
oo
d P
rod
uct
s
6 =
Pet
role
um
Ch
emic
als
7 =
Bu
sin
ess
Su
pp
lies
8 =
Au
to V
ehic
les
amp P
arts
Tru
cks
wit
h C
om
mo
dit
ies
Tru
cks
wit
ho
ut
Co
mm
od
itie
s
To
tal T
ruck
s
LE
GE
ND
Co
mm
od
ity
gro
up
ing
s
TO
TA
L
TR
AC
TO
R T
RA
ILE
RS
N
o
Day
470
285
260
205
150
90
105
55
1620
1090
2710
Nig
ht
5
130
100
105
45
55
15
455
285
740
24H
115
5
50
30
55
40
105
75
35
20
30
35
10
1 2 3
90
4 5 6 7 8
50
100
150
200
25
0 30
0 5
0 1
00 1
50
Num
ber
of tr
ucks
N
umbe
r of
tru
cks
Day
N
ight
(2
4H)
Day
N
ight
(2
4H)
870
170
1040
29
5 4
5
340
385
125
510
465
75
54
0
1255
29
5 15
50
760
120
880
50
100
150
200
N
umbe
r of
tru
cks
Day
N
ight
(2
4H)
455
240
695
240
85
325
695
325
1020
1 =
Con
stru
ctio
n M
ater
ials
( d
ryw
allc
oncr
ete
win
dow
s tr
usse
s)
5 =
Woo
d amp
Woo
d P
rodu
cts
( lu
mbe
r lo
gs c
hip
boar
d )
2 =
Foo
d an
d B
ever
age
(pro
cess
ed fo
od a
nd b
ever
age)
6
= P
etro
leum
Che
mic
als
( ga
solin
efu
els
altl
ime)
3
= G
ener
al M
erch
andi
se (
mix
ed fr
eigh
t fu
rnitu
re b
oxes
) 7
= B
usin
ess
Sup
plie
s (
prin
ting
supp
lies
offi
ce fu
rnitu
re g
over
nmen
t rec
ords
)
4 =
Pap
er amp
Pap
er P
rodu
cts
( pa
per
new
sprin
t to
ilet p
aper
) 8
= A
uto
Veh
icle
s amp
Par
ts (
car
s a
uto
part
s ti
res)
Day
tim
e (
700
- 1
900
)
Nig
ht ti
me
( 19
00
- 7
00)
3450
2075
1375
105
70
195
145
360
310
475
415
Inte
rpro
vinc
ial R
oads
ide
Truc
k S
urve
y
RE
PO
RT
35
x for general merchandise the expected widely dispersed trip patterns
x for paperpaper products the dominant interchange of trips between Hull and Ottawa (both East and West) and between Gatineau East and Ottawa South
x for woodwood products the dominance of the Aylmer and Gatineau West trips to Ottawa South
Additional information on commodity patterns is presented in Appendix O15
EXHIBIT 23 -DAILY COMMODITY FLOW - MACDONALD-CARTIER BRIDGE and EXHIBIT 24 -DAILY COMMODITY FLOW - CHAUDIEgraveRE BRIDGE illustrates commodity flow for each bridge by the three truck classifications and by the type of commodity carried (including empty trucks) Of particular interest is
x the proportion of tractor trailers in the truck stream on the Macdonald-Cartier Bridge (34) compared to the Chaudiegravere Bridge (17)
x the approximately equal proportions of 3+ axle trucks in the truck stream on each of the Macdonald-Cartier Bridge and Chaudiegravere Bridge
x the proportion of trucks carrying petroleumchemical products hauled by 3+ axle trucks is 13 and by tractor trailers is 11 on the Chaudiegravere Bridge
x the proportion of the tractor trailer trucks hauling paper products is 19 on the Macdonald-Cartier and 17 on the Chaudiegravere Bridge
x the proportion of tractor trailer trucks carrying wood products on the Macdonald-Cartier Bridge is 12
x the proportion of the empty trucks notably the 3+ axle trucks is 64 on the Macdonald-Cartier and 54 on the Chaudiegravere Bridge as discussed in Section 72
15 Appendix O ndash Trip Origins and Destinations for Specific Commodities and Detailed Comments Interprovincial Roadside Truck Survey REPORT 36
Exhibit 23 Daily Commodity Flow Macdonald-Cartier Bridge
EXHIBIT 23 COMMODITY FLOW
- MACDONALD-CARTIER BRIDGE
( 1025 )
b b b
Construction Materials 16
Food amp Beverage
19
General Merchandise 18
Empty 28
Paper Products 10
Business Supplies 6
AutoVehicles amp Parts
1
PetroleumChemicals 2
2 Axles 40
3 Axles 26
( 680 )
Tractor Trailers 34
( 870 )
General Merchandise
Food amp Beverage 6
Empty 64
Construction Materials 16
1
PetroleumChemicals 2
Wood Products 11
Food amp Beverage
12
Construction Materials 12
Paper Products 19
Empty 30
8
General Merchandise
10
AutoVehicles amp Parts
5
Wood Products PetroleumChemicals
4
2580 Trucks
( 1030 )
EXHIBIT 23b DAILY COMMODITY FLOWb
-MACDONALD-CARTIER BRIDGEb
(Autumn 2000)
Exhibit 24 Daily Commodity Flow Chaudiegravere Bridge
520
EXHIBIT 24 COMMODITY FLOW- CHAUDIEgraveRE BRIDGE
( 525 )
2 Axles 60
3 Axles 23
(200 )
Tractor Trailers 17
( 150 )
Construction Materials 6 Food amp Beverage
17 Empty 45
Paper Products
2
General Merchandise 14
Business Suppl ies
8
AutoVehicles amp Parts
2
Wood Products
1
Petroleum Chemicals
5
Construction Materials 22
Food amp Beverage 5
Empty 54
PetroleumChemicals 13
Wood Products 3
Paper Products 3
Food amp Beverage 6
Paper Products 17
Empty 40
Construction Materials 14
General Merchandise 8
Petroleum Chemicals
11 Wood Products
3
AutoVehicles amp Parts
1
870 Trucks
b b b
EXHIBIT 24b DAILY COMMODITY FLOWb
-CHAUDIEgraveRE BRIDGEb
(Autumn 2000)
520
Interprovincial Roadside Truck Survey
REPORT 37
90 SUMMARY
Information in this report is presented at the most aggregate level with the purpose of developing a good understanding of the interprovincial trip patterns origins destinations and characteristics of trucks in Canadarsquos Capital Region This report is not intended to deal with specific interprovincial transportation issuess Detailed analysis of the comprehensive data base would be necessary to assess the impact of new or improved infrastrucure on interprovincial truck traffic and would be a prerequisite for reaching any meaningful conclusions regarding future interprovincial transport needs
The 1999 2000 Interprovincial roadside truck survey provides
bull An effective database of high quality strong and meaningful information for application in future transportation planning activities
bull The basis for a more thorough understanding of interprovincial truck movements
bull An efficient means of evaluating costs and benefits in assessing alternative solutions to interprovincial truck travel issuess
bull A thorough understanding of the interprovincial movement patterns origins and destinatioons and characteristics of heavy trucks in the National Capital Region
Interprovincial Roadside Truck Survey
REPORT 38
100 LIST OF APPENDICES The 19992000 Interprovincial Roadside Truck Survey Technical Appendiceshave been bound separately and contain the following
Appendix A Survey Database Fields
Appendix B Heavy Truck Classification System
Appendix C Summary of Historical Ottawa River Crossing Truck Traffic Volumes
Appendix D Time Period Relationships
Appendix E Traffic Zones Comprising the Districts
Appendix F ldquoDistrictrdquo Comparison of Trucks by Number
Appendix G ldquoDistrictrdquo Comparison of Trucks by Percent
Appendix H Survey Expansion Factors
Appendix I Trip Characteristics
Appendix J Origin and Destination of Truck Trips by Direction
Appendix K Concentration of Truck Trip Ends
Appendix L Tabulations of Trip Origins-Destinations by Truck Classification
Appendix M Detailed Comments on Trip Origins and Destinations
Appendix N Categories of Commodities
Appendix O Trip Origins and Destinations for Specific Commodities and Detailed Comments
Interprovincial Roadside Truck Survey REPORT 39
19992000INTERPROVINCIAL
ROADSIDE TRUCK SURVEY TECHNICAL APPENDICES
ENQUEcircTE ROUTIEgraveRE INTERPROVINCIALE SUR LE CAMIONNAGE 19992000 ANNEXES
McLean Transportation Engineering Consultants Ltd
TRANS MEMBER AGENCIES
National Capital Commission
Mr Arto KeklikianCapital Planning and Real Asset Management
Ministegravere des Transports Queacutebec
Monsieur Ghislain CoutureDirection reacutegionale de lrsquoOutaouais
Ministry of Transportation Ontario
Mr James WongTransportation Planning Branch
Ville de Gatineau
Monsieur Paul-Andreacute Roy Service Urbanisme
City of Ottawa
Mr Don Stephens PEng ( Manager TRANS Programme ) Planning Environment and Infrastructure Policy
Mr Rob Calladine Planning Environment and Infrastructure Policy
Socieacuteteacute de transport de lOutaouais
Monsieur Salah Barj Service Strateacutegies et Deacuteveloppement
Monsieur Carmel Dufour Service Strateacutegies et Deacuteveloppement
OCTranspo
Mr Colin LeechService Planning Department
19992000INTERPROVINCIAL ROADSIDE
TRUCK SURVEY
TECHNICAL APPENDICES
Prepared for
TRANS A Joint Technical Committee on Transportation Systems Planning
By
McLean Transportation Engineering Consultants Ltd
June 2002
LIST OF APPENDICES
Appendix A Survey Database Fields 1
Appendix B Heavy Truck Classification System 52
Appendix C Summary of Historical Ottawa River Crossing Truck Traffic Volumes 54
Appendix D Time Period Relationships 56
Appendix E Traffic Zones Comprising the Districts 58
Appendix F District Comparisons of Trucks by Number 61
Appendix G District Comparisons of Trucks by Percent 70
Appendix H Survey Expansion Factors 73
Appendix I Trip Characteristics 75
Appendix J Origins and Destinations of Truck Trips by Direction 77
Appendix K Concentration of Truck Trip Ends 79
Appendix L Tabulations of Trip Origins and Destinations by Truck Classification 83
Appendix M Detailed Comments on Trip Origins and Destinations 85
Appendix N Categories of Commodities 88
Appendix O Trip Origins and Destinations for Specific Commoditiesand Detailed Comments 98
Interprovincial Roadside Truck Survey Technical Appendices i
Appendix A Survey Database Fields
Interprovincial Roadside Truck Survey Technical Appendices 1
SURVEY DATABASE FIELDS-DETAILEDINFORMATION
(Same as 1999 NRS)
Answer Output Database
Note This version of the description includes the field and answer changes made in July 1999 when the questionnaire was shortened
Each record in the answer output database contains the answers collected from one questionnaire The fields of the database which is named STUDYDBF are explained in the table at the end of this appendix For each field the table lists the following information
Reference A cross-reference between the field and other documents bull Questionnaire A code of format cnn that denotes the question on the 1999
Questionnaire to which the field corresponds where bull c is the section of the questionnaire (eg section ldquoBrdquo is the
Scope section) and bull nn is the question number in the section (eg rdquo01rdquo ldquo02rdquo
etc) bull
Field Field specification bull Name A code of format ldquoaaabbbbbbbrdquo where
bull ldquoaaardquo is the number of the question on the 1999 Questionnaire to which the field corresponds (the same number ldquocnnrdquo as discussed above except that the ldquordquo is not included) and
bull ldquobbbbbbbrdquo represents 1 or more words that describe the related question and the field contents The following rules are applied when creating ldquobbbbbbbrdquo
bull A word is presented in full or as a short form the short form being
bull the first 1 letter bull the first 3 letters or bull the first 6 letters
bull ldquoSrdquo as the last letter usually means that the field marks the ldquostatusrdquo of the contents of another field
bull ldquoDrdquo as the last letter usually means that the field contains a hand-written ldquodescriptionrdquo that has been entered because the predetermined list of answers does not capture the actual answer
bull ldquoUrdquo as the last letter usually means that the field records the ldquounits of measurementrdquo that apply to the contents of another field
bull Type Type of information stored (N=numeric C=character L=logic ldquoDrdquo=Date)
bull Length Length of the field (total number of digits or characters (including the ldquordquo used for floating point numbers but excluding the ldquordquo that appears in dates)
bull Decimals Number of digits after the decimal point (valid only for a numeric field)
Interprovincial Roadside Truck Survey Technical Appendices 2
bull Index Whether the field is used in an index (N=no Y=yes) Information A description of the field and the values that can legitimately appear in the
field Whether Question Depends Flags cases where the question pertaining to the field is conditional The on Previous Answers question may be active (asked) or inactive (skipped) depending on the
answers to previous questions The actual dependency relationships are described in Appendix F
Whether Answer is Flags cases where the answer in numeric fields is checked for plausibility Checked for Plausibility against criteria The actual plausibility checks are described in
Appendix G
Following are notes on various aspects of the table
Concerning Field Order The order in which the fields are listed in the table matches the order of the questions on the questionnaire to which the fields relate The software internal fields (fields used by the software that are not related to particular questions) are listed at the beginning of the table
Concerning Answer Codes There are several codes used in answers that are reserved for specific situations (to the extent possible) These are listed below
Reserved Answer Codes Code Meaning of Answer
When Field is When Field is Numeric Alphanumeric
95 Other (the answer is not one of the choices specifically identified by the question)
96 X Not Applicable (the question was not asked because it was not applicable) 97 T Terminated (driver terminated interview before this question could be
asked) 98 R Refused (driver refused to answer this question) 99 D Donrsquot Know (driversurveyor did not know the answer to the question)
Concerning the Usability of the Record The state of a record is marked by answers stored in 2 fields These answers are used to identify whether the record contains a valid observation for the NRS
bull QTYPE -- This marks whether the record was generated by a ldquoliverdquo questionnaire (actual observation of a truck that is part of the NRS data collection) or by a ldquopracticerdquo questionnaire (completed for training purposes)
bull QSTATUS -- This marks whether the record was ldquostudy usablerdquo (questionnaire completed by answering the necessary questions (specifically the ldquoConfirm Completionrdquo screen was reached)) ldquoabandoned (questionnaire not completed by surveyorrsquos choice to use ldquoabandonmentrdquo button) or ldquofailurerdquo (questionnaire not completed because of computer malfunction)
Concerning Date and Time Stamp Fields Certain fields contain dates and times that are entered automatically by the QS using values from the handheld computerrsquos internal clock Values are entered into these fields only during the original entry of answers session with the
Interprovincial Roadside Truck Survey Technical Appendices 3
questionnaire During subsequent editing of answers sessions with the questionnaire the date and time fields are not changed by the QS and can not be changed by the surveyor with the exception of the A05QSDATE A06HOUR and A06MIN field values The date and time stamp fields are described below
bull A05QSDATE A06HOUR A06MIN -- These contain the datetime at which the questionnaire was started Specifically the datetime at which the QS reached the first screen of the Scope section of the questionnaire (the screen that asks if the truck is a cargo type etc) The purpose of this datetime is to mark when the truck was observed The values are automatically entered by the QS but the values can be edited by the surveyor during the original entry of answers session or during subsequent editing of answers sessions
bull PA05QSDATE PA06HOUR PA06MIN -- These permanently contain the first values that were automatically entered by the QS to A05QSDATE A06HOUR and A06MIN
bull QEDATE QEHOUR QEMINUTE -- These contain the datetime at which the original entry of answers session ended Specifically the datetime at which the QS passed the ldquoConfirm Completionrdquo screen
bull ISTDATE ISTHOUR ISTMINUTE -- These contain the datetime at which the driver interview started Specifically the datetime at which the QS reached the first screen of the Interview Start section of the questionnaire (the screen that asks for the drivers participationrefusal)
bull IENDDATE IENDHOUR IENDMINUTE -- These contain the datetime at which the driver interview ended Specifically the datetime at which the QS exits the driver interview sections of the survey by the surveyor either (1) pressing the End Survey button option on any of the screens or (2) pressing the Next Screen button after completing the last screen (the screen that asks about the drivers recent training)
Concerning Geographic Coordinates Format bull Longitude -- Longitude is expressed in decimal degrees The values range from -180
to +180 A positive value denotes a location west of the prime meridian A negative value denotes a location east of the prime meridian
bull Latitude -- Latitude is expressed in decimal degrees The values range from -90 to +90 A positive value denotes a location in the northern hemisphere A negative value denotes a location in the southern hemisphere
Concerning Out-of-Scope Trucks Trucks in the scope of the NRS are heavy cargo trucks which are defined as trucks
bull of a type normally used to move cargo from one point to another point bull that meets the definition of commercial vehicle under the National Safety Code
(meaning a truck tractor or combination thereof with a registered gross vehicle weight greater than 4500 kilograms)
Interprovincial Roadside Truck Survey Technical Appendices 4
Concerning the size of a heavy truck the following two practical definitions will be used bull To facilitate visual identification heavy trucks will consist of trucks that have 6 or
more tires bull To facilitate identification by automatic vehicle classifier equipment that use vehicle
length as the basis for differentiating between sizes of vehicle heavy trucks will consist of trucks that are longer than 20 feet
Therefore trucks are out of the scope of the NRS for the following reasons bull Light trucks of 4500 kilograms or less which is defined as any straight truck with 4
tires (with or without a trailer) bull Non-cargo type trucks which include
bull mobile machines (any straight truck without a trailer that has a permanently attached machine (ie the truck exists to move the machine around) -shyexamples include
bull crane bull drill rig bull seismic rig bull boomcherry pickerladder bull curbroadsidewalk cutter bull concrete pump bull rock crusher bull carnival ride
bull emergency truck -- examples include bull fire truck bull ambulance bull police vehicle
bull service truck -- examples include bull hydro truck bull road painter bull snow plow bull road sweeper
bull a tow truck (with or without vehicle) that moves a vehicle by means of a slinghook mounted at the back (ie some of the vehicles wheels are on the road)
But if any of the above listed trucks has a trailer attached that can be used to carry cargo then the truck is a cargo truck for the purposes of the NRS For example a hydro service truck that is pulling a trailer loaded with telephone poles is a cargo truck
Note that cargo truck includes bull any tractor pulling a trailer regardless of the trailer (for example the trailer could be a
permanently attached machine) bull a concrete mixer and bull a sewer cleaning truck if it has a holding tank
Interprovincial Roadside Truck Survey Technical Appendices 5
Concerning Definition of a Trip -- Refer to Reference 6
Concerning Border Crossings -- Refer to Reference 6
Interprovincial Roadside Truck Survey Technical Appendices 6
Answer Output Database Fields Reference Field Information
Questi- Name Type Length onnaire Decimals Index
Z Software Internal Fields (not related to questions on the Study Questionnaire) QID C 8 0 N Questionnaire IDentifier -- Uniquely identifies one
questionnaire among all questionnaires generated on all computers used in the NRS
QSTATUS C 1 0 N Questionnaire STATUS -- Marks whether the ldquonecessaryrdquo questions were completed in the original entry of answers session S = Study usable (completed) A = Abandoned (not completed -- ldquoabandonrdquo button used) F = Failure (did not pass ldquoConfirm Completionrdquo screen)
QTYPE C 1 0 N Questionnaire Type -- Marks why the questionnaire was entered L = Live (actual observation of a truck for the NRS) P = Practice (training)
DISTATUS C 1 0 N Driver Interview STATUS -- Marks whether all the driver interview questions were asked (conversely whether the driver terminated the interview) A = All questions asked I = Incomplete interview (driver terminated before all questions asked)
DILAST C 3 0 N Driver Interview LAST questions completed -shyIdentifies the last screen of questions completed before the driver terminated the interview blank = not applicable (driver interview not terminated) ccc = section letter and tab number for the last screen with all answers completed (eg ldquoF02rdquo)
PA01JUR C 4 0 N Permanent copy of the original value of A01JUR PA02SITE C 8 0 N Permanent copy of the original value of A02SITE PA02DCSSEL C 75 0 N Permanent copy of the original value of A02DCSSEL PA04DIRECT C 1 0 N Permanent copy of the original value of A04DIRECT PA05QSDATE D 8 0 N Permanent copy of the original value of A05QSDATE PA06QSHOUR N 2 0 N Permanent copy of the original value of
A06QSHOUR PA06QSMIN N 2 0 N Permanent copy of the original value of A06QSMIN QEDATE D 8 0 N Questionnaire End DATE -- When questionnaire
completed Format YYYYMMDD See description of date and time fields that precedes this table
QEHOUR N 2 0 N Questionnaire End HOUR -- When questionnaire completed Format 24 hour clock See description of date and time fields that precedes this table
QEMINUTE N 2 0 N Questionnaire End MINUTE -- When questionnaire completed See description of date and time fields that precedes this table
Interprovincial Roadside Truck Survey Technical Appendices 7
Answer Output Database Fields Reference Field Information
Questi- Name Type Length onnaire Decimals Index
ISTDATE D 8 0 N Interview STart DATE - When driver interview section of questionnaire started Format YYYYMMDD See description of date and time fields that precedes this table
ISTHOUR N 2 0 N Interview SSart HOUR - When driver interview section of questionnaire started Format 24 hour clock See description of date and time fields that precedes this table
ISTMINUTE N 2 0 N Interview STart MINUTE - When driver interview section of questionnaire started See description of date and time fields that precedes this table
IENDDATE D 8 0 N Interview END DATE - When driver interview sections of questionnaire completed Format YYYYMMDD See description of date and time fields that precedes this table
IENDHOUR N 2 0 N Interview END HOUR - When driver interview sections of questionnaire completed Format 24 hour clock See description of date and time fields that precedes this table
IENDMINUTE N 2 0 N Interview END MINUTE - When driver interview sections of questionnaire completed See description of date and time fields that precedes this table
XOBSERV L 1 0 N Questionnaire Observations Section F (or 0) = not started T (or 1) = partially or completely filled in
XSCOPE L 1 0 N Scope Section Results -- Whether truck is in-scope F (or 0) = not-in-scope T (or 1) = in-scope
XWEIGHTS L 1 0 N Questionnaire Weights and Measures Section Same answers as for Questionnaire Observations Section
A Identification Section A01 A01JUR C 4 0 N JURisdiction -- Provinceterritory in which DCS is
located The codes are listed in Appendix H A02 A02SITE C 8 0 N SITE ID -- Unique identifier assigned to the DCS
The codes are listed in Appendix H Note Identifier is filled automatically by the computer when DCSSEL is selected from the pick-list
A02 A02DCSSEL C 75 0 N DCS SELector -- Specification of the DCS that is used for selection (the pick-list entry) Format DCS name + traffic direction description
A02 A02DCSLON N 11 6 N DCS LONgitude -- Longitude of the DCS Format defined in description of geographic coordinates that precedes this table Note Longitude is filled automatically by the computer when DCSSEL is selected from the pick-list
Interprovincial Roadside Truck Survey Technical Appendices 8
Answer Output Database Fields Reference Field Information
Questi- Name Type Length onnaire Decimals Index A02 A02DCSLAT N 11 6 N DCS LATitude -- Latitude of the DCS Format
defined in description of geographic coordinates that precedes this table Note Latitude is filled automatically by the computer when DCSSEL is selected from the pick-list
A03 A03SURVEY C 3 0 N SURVEYor - ID assigned to the surveyor filling-in the questionnaire Unique at the DCS
A04 A04DIRECT C 1 0 N DIRECTion -- Direction of traffic being interviewed at DCS N = Northbound E = Eastbound S = Southbound W = Westbound
A05 A05QSDATE D 8 0 N Questionnaire Start DATE -- When questionnaire started Format YYYYMMDD See description of date and time fields that precedes this table
A06 A06QSHOUR N 2 0 N Questionnaire Start HOUR -- When questionnaire started Format 24 hour clock See description of date and time fields that precedes this table
A06 A06QSMIN N 2 0 N Questionnaire Start MINute -- When questionnaire started See description of date and time fields that precedes this table
B Scope Section B01 B01CARTYP C 1 0 N CARgo TYPe truck -- Whether the type of truck or
type of truck body is capable of carrying cargo or usually used for carrying cargo Y = Yes N = No Note ldquoNrdquo marks an out-of-scope truck Note See description of out-of-scope trucks that precedes this table
B02 B02OOSTYP C 20 0 N Out-Of-Scope truck TYPe blank = not applicable (truck is cargo type) something = description of the non-cargo type truck Note See description of out-of-scope trucks that precedes this table
B03 B03STR4T C 1 0 N STRaight truck with 4 Tires -- Whether truck is a straight truck with 4 tires (with or without a trailer) Y = Yes N = No Note ldquoYrdquo marks an out-of-scope truck
Interprovincial Roadside Truck Survey Technical Appendices 9
Answer Output Database Fields Reference Field Information
Questi- Name Type Length onnaire Decimals Index B04 B04AXLOOS N 2 0 N AXLes on Out-Of-Scope truck -- Number of axles on
the truck if it is out-of-scope (all axles on the straight trucktractor and trailers) 2 to 12 = number of axles 96 = not applicable (truck is in-scope)
C Observations Section C01 C01CONF N 2 0 N CONFiguration of truck -- Type of configuration
1 = tractor amp 1 trailer 2 = tractor amp 2 trailers 3 = tractor amp 3 trailers 4 = straight truck 5 = straight truck amp trailer 6 = tractor only 95 = other Note Type ldquo6rdquo applies only if the tractor is ldquobob tailrdquo If a tractor is towingcarrying other tractors or if tractor is towingcarrying trucks or if a tractor is carrying a trailer piggyback then the type is ldquo95rdquo Note Type ldquo95rdquo covers tractor towingcarrying other tractors tractor towingcarrying a truck and tractor carrying a trailer piggyback Note A jeepbooster used to support heavy loads is treated as part of the trailer
C02 C02CONFD C 20 0 N CONFiguration Description blank = not applicable (truck fits a predefined configuration) something = description of the ldquootherrdquo configuration
C03 C03HITCH C 1 0 N HITCH -- Type of connection used to join the 1st and 2nd trailer in a truck train (a tractor pulling 2 or 3 trailers) A = A train B = B train C = C train X = not applicable (not truck train)
C04 C04CAB C 1 0 N CAB style -- Type of the driver cab C = Conventional (long nose or cab after engine) O = cab-Over-engine
Interprovincial Roadside Truck Survey Technical Appendices 10
Answer Output Database Fields Reference Field Information
Questi- Name Type Length onnaire Decimals Index C05 C05BODY1 N 2 0 N BODY 1 style -- Classification of the style or
intended freight or intended use of the 1st cargo unit of the truck The 1st cargo unit is either a straight truck the first trailer pulled by a tractor or a tractor without a trailer 1 = van -- not refrigerated 2 = van -- refrigerated 3 = container carrier 4 = van -- soft sided 5 = flatbed 6 = stakerack 7 = float 8 = tanker 9 = hopper 10 = dump 11 = chip 12 = garbage truck 13 = vehicle carrier 14 = animal carrier 15 = none (applies only when the truck consists of a ldquobob tailrdquo tractor that is a tractor neither pulling a trailer nor towingcarrying other tractors) 95 = other Note Concerning the assignment of unusual body styles bull a flatbed or stakerack with a mounted loading
crane as a ldquoflatbedrdquo or ldquostakerackrdquo bull a deckless frame used to carry logspolls as a
stakerack bull a glass carrier as other bull a boat carrying frame as other bull a permanently attached machine as other bull a concrete mixer as other bull a sewer cleaner as other (a sewer cleaning
truck would be in-scope if it had a holding tank would be out-of-scope if it was only a pump)
bull a pick-up truck box as other C06 C06BODY1D C 20 0 N BODY 1 style Description
blank = not applicable (1st cargo unit fits predefined style) something = description of ldquootherrdquo style of 1st cargo unit
Interprovincial Roadside Truck Survey Technical Appendices 11
Answer Output Database Fields Reference Field Information
Questi- Name Type Length onnaire Decimals Index C07 C07BODY2 N 2 0 N BODY 2 style -- Classification of the style or
intended freight or intended use of the 2nd cargo unit of the truck The 2nd cargo unit is either the trailer pulled by a straight truck or the 2nd trailer pulled by a tractor 1 = van -- not refrigerated 2 = van -- refrigerated 3 = container carrier 4 = van -- soft sided 5 = flatbed 6 = stakerack 7 = float 8 = tanker 9 = hopper 10 = dump 11 = chip 12 = garbage truck 13 = vehicle carrier 14 = animal carrier 15 = none (no such unit on the truck) 95 = other Note See note under BODY 1 style
C08 C08BODY2D C 20 0 N BODY 2 style Description blank = not applicable (2nd cargo unit fits predefined style or no 2nd cargo unit) something = description of ldquootherrdquo style of 2nd
cargo unit C09 C09BODY3 N 2 0 N BODY 3 style -- Classification of the style or
intended freight or intended use of the 3rd cargo unit of the truck The 3rd cargo unit is the 3rd trailer pulled by a tractor 1 = van -- not refrigerated 2 = van -- refrigerated 3 = container carrier 4 = van -- soft sided 5 = flatbed 6 = stakerack 7 = float 8 = tanker 9 = hopper 10 = dump 11 = chip 12 = garbage truck 13 = vehicle carrier 14 = animal carrier 15 = none (no such unit on the truck) 95 = other Note See note under BODY 1 style
Interprovincial Roadside Truck Survey Technical Appendices 12
Answer Output Database Fields Reference Field Information
Questi- Name Type Length onnaire Decimals Index C10 C10BODY3D C 20 0 N BODY 3 style Description
blank = not applicable (3rd cargo unit fits predefined style or no 3rd cargo unit) something = description of ldquootherrdquo style of 3rd
cargo unit C11 C11LIGHTS C 1 0 N LIGHTS on -- Whether the headlights are on
Y = Yes N = No X = not applicable Note ldquoNot applicablerdquo because the question was not asked after being eliminated from the questionnaire
C12 C12SLEEP C 1 0 N SLEEPer -- Whether the tractorstraight truck has a sleeper (a compartment immediately behind the driver cab that contains a bed) Y = Yes N = No
C13 C13DROME C 1 0 N DROME -- Whether the tractor has a drome (a box for carrying cargo that is mounded on a tractor in front of the fifth wheel) Y = Yes N = No
C14 C14REFLEC C 1 0 N REFLECTive markers -- Whether the truck has reflective markers on the back and sites (reflective tape on the edges that increases truck visibility at night) Y = Yes N = No
C15 C15UNDER C 1 0 N UNDER-ride guard -- Whether the truck has a rear under-ride guard (beam that prevents a car from sliding under the back of the truck) Y = Yes N = No
C16 C16DGP1 N 2 0 N Dangerous Goods Placard 1 -- If there is at least 1 dangerous goods placard or placard holder what is onin the 1st placardplacard holder 1 to 9 = class marked on placard 10 = placard holder is empty 11 = no such placard or holder 95 = other class (not 1 through 9) 96 = not applicable 99 = unable to determine class Note ldquoNot applicablerdquo because the question was not asked after being eliminated from the questionnaire
Interprovincial Roadside Truck Survey Technical Appendices 13
Answer Output Database Fields Reference Field Information
Questi- Name Type Length onnaire Decimals Index C17 C17DGP2 N 2 0 N Dangerous Goods Placard 2 -- If there are at least 2
dangerous goods placards or placard holders what is onin the 2nd placardplacard holder 1 to 9 = class marked on placard 10 = placard holder is empty 11 = no such placard or holder 95 = other class (not 1 through 9) 96 = not applicable 99 = unable to determine class Note ldquoNot applicablerdquo because the question was not asked after being eliminated from the questionnaire
C18 C18DGP3 N 2 0 N Dangerous Goods Placard 3 -- If there are at least 3 dangerous goods placards or placard holders what is onin the 3rd placardplacard holder 1 to 9 = class marked on placard 10 = placard holder is empty 11 = no such placard or holder 95 = other class (not 1 through 9) 96 = not applicable 99 = unable to determine class Note ldquoNot applicablerdquo because the question was not asked after being eliminated from the questionnaire
C19 C19FLPJURS C 1 0 N Front Licence Plate JURisdiction Status -- Whether the identity of the jurisdiction (Canadian province territory US state Mexico) that issued the front licence plate of the straight truck or tractor is available Y = Yes N = No (unable to read)
C19 C19FLPJUR C 4 0 N Front Licence Plate JURisdiction -- The jurisdiction that issued the front licence plate blank = not available (see status field) cccc = jurisdiction code The codes are listed in Appendix H Note If a truck has 2 or more places select according to the following reules bull first choice -- a plate issued by the province in
which the DCS is located bull second choice -- the left most plate (driver side
plate) if plates are arranged horizontally and the top plate if plates are arranged vertically
C20 C20FLPNUMS C 1 0 N Front Licence Plate NUMber Status -- Whether the number on the front licence plate is available Y = Yes N = No (unable to read) X = not applicable Note ldquoNot applicablerdquo because the question was not asked after being eliminated from the questionnaire
Interprovincial Roadside Truck Survey Technical Appendices 14
Answer Output Database Fields Reference Field Information
Questi- Name Type Length onnaire Decimals Index C20 C20FLPNUM C 7 0 N Front Licence Plate NUMber -- The number on the
front licence plate blank = not available (see status field) ccccccc = number
C21 C21RLPJURS C 1 0 N Rear Licence Plate JURisdiction Status -- Whether the identity of the jurisdiction (Canadian province territory US state Mexico) that issued the rear licence plate on the last trailer of the truck is available Y = Yes N = No (unable to read) X = not applicable Note ldquoNot applicablerdquo if no trailer or because the question was not asked after being eliminated from the questionnaire
C21 C21RLPJUR C 4 0 N Rear Licence Plate JURisdiction -- The jurisdiction that issued the rear licence plate blank = not availableapplicable (see status field) cccc = jurisdiction code The codes are listed in Appendix H
C22 C22RLPNUMS C 1 0 N Rear Licence Plate NUMber Status -- Whether the number on the rear licence plate is available Y = Yes N = No (unable to read) X = not applicable Note ldquoNot applicablerdquo if no trailer or because the question was not asked after being eliminated from the questionnaire
C22 C22RLPNUM C 7 0 N Rear Licence Plate NUMber -- The number on the rear licence plate blank = not availableapplicable (see status field) ccccccc = number
C23 C23COMNAMS C 1 0 N COMpany NAMe Status -- Whether there is a truck company name on the driver door of the straight truck or tractor Y = Yes N = No X = not applicable Note ldquoNot applicablerdquo if jurisdiction containing the DCS does not require that the question be asked
C23 C23COMNAM C 50 0 N COMpany NAMe -- Truck company name on the driver door blank = not applicable (see status field) something = company name
Interprovincial Roadside Truck Survey Technical Appendices 15
Answer Output Database Fields Reference Field Information
Questi- Name Type Length onnaire Decimals Index C23 C23COMID C 10 0 N COMpany name ID -- Unique identifier assigned to
the record containing the company name blank = not applicable (see status field) something = identifier Note Identifier is filled automatically by the computer but only if the company name is selected from the pick-list
C24 C24LOCH1 N 2 0 N LOCation of Hitch 1 -- Point on the straight truck or tractor where the 1st trailer connects 237 = sequence number assigned to the axle group related to the connection 96 = not applicable (no trailers) Note The location point is identified by specifying the axle group above which or immediately after which the trailer hitch or king pin connects
C24 C24LOCH2 N 2 0 N LOCation of Hitch 2 -- Point on the first trailer where the 2nd trailer connects 347 = sequence number assigned to the axle group related to the connection 96 = not applicable (no 2nd trailer)
C24 C24LOCH3 N 2 0 N LOCation of Hitch 3 -- Point on the second trailer where the 3rd trailer connects 457 = sequence number assigned to the axle group related to the connection 96 = not applicable (no 3rd trailer)
C25 C25AXLAG1 N 1 0 N AXLes in Axle Group 1 -- Number of axles in the 1st
group of axles on the truck 12 = number of axles Note Axle groups are numbered sequentially beginning at the front of the truck Note An axle group consists of 1 2 3 or 4 axles Each axle on the truck is assigned to a group Two or more axles are assigned to the same group if they are closely spaced and attached to the truck in such a way that each axle is carrying approximately the same load Each axle on the truck is assigned to a group though
C25 C25AXLAG2 N 1 0 N AXLes in Axle Group 2 -- Number of axles in the 2st
group of axles on the truck 12 = number of axles
C25 C25AXLAG3 N 2 0 N AXLes in Axle Group 3 -- Number of axles in the 3rd group of axles on the truck 0 = not applicable (no 3rd group) 12 = number of axles
C25 C25AXLAG4 N 2 0 N AXLes in Axle Group 4 --Same answers as for AXLes in Axle Group 3
C25 C25AXLAG5 N 2 0 N AXLes in Axle Group 5 --Same answers as for AXLes in Axle Group 3
C25 C25AXLAG6 N 2 0 N AXLes in Axle Group 6 --Same answers as for AXLes in Axle Group 3
Interprovincial Roadside Truck Survey Technical Appendices 16
Answer Output Database Fields Reference Field Information
Questi- Name Type Length onnaire Decimals Index C25 C25AXLAG7 N 2 0 N AXLes in Axle Group 7 --Same answers as for
AXLes in Axle Group 3 C25 C25AXLAG8 N 2 0 N AXLes in Axle Group 8 --Same answers as for
AXLes in Axle Group 3 C25 C25AXLALL N 2 0 N AXLes ALL -- Total number of axles on the truck
1212 = Number of axles C26 C26UPAG1 N 1 0 N UP axles in Axle Group 1 -- Number of axles that
are lifted (raised so they are not in contact with the ground) in the 1st group of axles on the truck 0 = no axles are lifted 12 = number of axles lifted
C26 C26UPAG2 N 1 0 N UP axles in Axle Group 2 -- Same answers as for UP axles in Axle Group 1
C26 C26UPAG3 N 2 0 N UP axles in Axle Group 3 -- Number of axles that are lifted in the 3rd group of axles on the truck 0 = no axles are lifted or not applicable (no 3rd
group) 12 = number of axles lifted Note To decide whether ldquo0rdquo means ldquono axles liftedrdquo or means ldquonot applicablerdquo check C25AXLAG3 to determine if the 3rd axle group exists
C26 C26UPAG4 N 2 0 N UP axles in Axle Group 4 -- Same answers as for UP axles in Axle Group 3
C26 C26UPAG5 N 2 0 N UP axles in Axle Group 5 -- Same answers as for UP axles in Axle Group 3
C26 C26UPAG6 N 2 0 N UP axles in Axle Group 6 -- Same answers as for UP axles in Axle Group 3
C26 C26UPAG7 N 2 0 N UP axles in Axle Group 7 -- Same answers as for UP axles in Axle Group 3
C26 C26UPAG8 N 2 0 N UP axles in Axle Group 8 -- Same answers as for UP axles in Axle Group 3
C26 C26UPALL N 1 0 N UP axles ALL -- Total number of axles that are lifted on the truck 0 = no axles are lifted 129 = number of axles lifted
D Interview Start Section
D01 D01AGREE C 1 0 N AGREEs to interview -- Whether driver agrees to participate in an interview Y = Yes N = No
D02 D02REFUSE C 40 0 N REFUSE -- Reason given by driver for refusing to be interviewed blank = not applicable (driver agreed to interview) something = reason for refusing
Interprovincial Roadside Truck Survey Technical Appendices 17
Answer Output Database Fields Reference Field Information
Questi- Name Type Length onnaire Decimals Index D03 D03LANG C 1 0 N LANGuage of driver -- Drivers choice for the
language of the interview E = English F = French
E Interview Part 1 - Vehicle Profile Section E01 E01TBS C 1 0 N Truck Base Status -- Whether an answer is available
Y = Yes (driver identified a base) N = No base (driverrsquos answer) R = driver Refused to answer T = driver Terminated interview before question asked Note The base is the place in Canada US or Mexico where the straight truck or tractor is usually garaged or serviced or the operating centre to which it is assigned Some trucks may not be based at a specific place
E01 E01TBJUR C 4 0 N Truck Base JURisdiction -- The jurisdiction in which the truck base is located blank = not applicable (see status field) something = jurisdiction code The codes are listed in Appendix H
E01 E01TBPLA C 50 0 N Truck Base PLAce -- The name of the place in which the truck base is located blank = not applicable (see status field) something = place name
E01 E01TBID C 11 0 N Truck Base ID -- Unique identifier assigned to the record containing the place name blank = not applicable (see status field) something = identifier Note Identifier is filled automatically by the computer but only if the place is selected from the pick-list
E01 E01TBLON N 11 6 N Truck Base LONgitude -- Longitude of the place 0 = not applicable (see status field) something = longitude Format defined in description of geographic coordinates that precedes this table Note Longitude is filled automatically by the computer but only if the place is selected from the pick-list
E01 E01TBLAT N 11 6 N Truck Base LATitude -- Latitude of the place 0 = not applicable (see status field) something = latitude Format defined in description of geographic coordinates that precedes this table Note Latitude is filled automatically by the computer but only if the place is selected from the pick-list
Interprovincial Roadside Truck Survey Technical Appendices 18
Answer Output Database Fields Reference Field Information
Questishyonnaire
Name Type Length Decimals Index
E02 E02LIFTS C 1 0 N LIFT Status -- Whether the answer is available for the total number of liftable axles on the truck Y = Yes (driver answered 1 or more) N = None (driver answered no lift axles) D = driver Doesnrsquot know the answer R = driver Refused to answer T = driver Terminated interview before question asked Note Liftable axles are counted whether they are currently raised (off the ground) or lowered (on the ground)
E02 E02LIFT N 1 0 N LIFT -- Total number of liftable axles 0 = none or not available (see status field) 12 = total number of liftable axles
E03 E03LENT1S C 1 0 N LENgth of Trailer 1 Status -- Whether the answer is available for the length of the 1st trailer Y = Yes D = driver Doesnrsquot know the answer R = driver Refused to answer T = driver Terminated interview before question asked X = not applicable (no such trailer)
E03 E03LENT1 N 5 2 N LENgth of Trailer 1 -- Length of the 1st trailer 0 = not applicable (see status field) something = length Note Units of measurement are defined in field E06LENTU
E04 E04LENT2S C 1 0 N LENgth of Trailer 2 Status -- Same answers as for LENgth of Trailer 1 Status
E04 E04LENT2 N 5 2 N LENgth of Trailer 2 -- Same answers as for LENgth of Trailer 1
E05 E05LENT3S C 1 0 N LENgth of Trailer 3 Status -- Same answers as for LENgth of Trailer 1 Status
E05 E05LENT3 N 5 2 N LENgth of Trailer 3 -- Same answers as for LENgth of Trailer 1
E06 E06LENTU C 1 0 N LENgth of Trailer Units -- Units in which the length of the trailers are measured F = Feetinches (digits before the decimal point are feet digits after the decimal point are inches) M = Metres X = not applicable (no trailers or no measurements) T = driver Terminated interview before question asked
Interprovincial Roadside Truck Survey Technical Appendices 19
Answer Output Database Fields Reference Field Information
Questi- Name Type Length onnaire Decimals Index E07 E07LENC1S C 1 0 N LENgth of Container 1 Status -- Whether the answer
is available for the length of the 1st container carried by the truck Y = Yes D = driver Doesnrsquot know the answer R = driver Refused to answer T = driver Terminated interview before question asked X = not applicable Note ldquoNot applicablerdquo if no such container or because the question not asked after being eliminated from the questionnaire
E07 E07LENC1 N 5 2 N LENgth of Container 1 -- Length of the 1st
container 0 = not applicable (see status field) something = length Note Units of measurement are defined in field E10LENCU
E08 E08LENC2S C 1 0 N LENgth of Container 2 Status -- Same answers as for LENgth of Container 1 Status
E08 E08LENC2 N 5 2 N LENgth of Container 2 -- Same answers as for LENgth of Container 1
E09 E09LENC3S C 1 0 N LENgth of Container 3 Status -- Same answers as for LENgth of Container 1 Status
E09 E09LENC3 N 5 2 N LENgth of Container 3 -- Same answers as for LENgth of Container 1
E10 E10LENCU C 1 0 N LENgth of Container Units -- Units in which the length of the containers are measured F = Feetinches (digits before the decimal point are feet digits after the decimal point are inches) M = Metres X = not applicable (no containers or no measurements) T = driver Terminated interview before question asked
E11 E11TACHOG C 1 0 N TACHOGraph -- Whether there is a tachograph on-board the truck Y = Yes N = No R = driver Refused to answer T = driver Terminated interview before question asked Note A tachograph is a mechanical device that records truck speed engine speed and distance travelled It operates by drawing thin lines on a circular card each card covering 24 hours
Interprovincial Roadside Truck Survey Technical Appendices 20
Answer Output Database Fields Reference Field Information
Questi- Name Type Length onnaire Decimals Index E12 E12LOG C 1 0 N electronic drive LOG -- Same answers as for
TACHOGraph Note An electronic drive log is a device that automatically records the hours of oepration of the vehicle in some type of memory Usually it has a keyboard so the driver can enter events that occur
E13 E13COMPUT C 1 0 N COMPUTer -- Same answers as for TACHOGraph Note A computer that is adapted to the environment of the driver cab It is used to enter information on the events of the day
E14 E14TAG C 1 0 N electronic vehicle identification TAG -- Same answers as for TACHOGraph Note An electronic vehicle identification tag is a magnetically encoded device that can be read by equipment located in the roadway or at the roadside The tag contains information about the identity of the truck and the load
E15 E15SATELL C 1 0 N SATELLite -- Same answers as for TACHOGraph Note Satellite based communications use a transmitter-receiver that is usually curcular in shape approximately 15 to 30 centimetres in diameter and located on the roof of the driver cab ovten behind the wind deflector It is used by a carrier to track the location of its truck If equipped with a keyboard and screen in the cab the driver can send and receive information
E16 E16CELLPH C 1 0 N CELLular telePHone -- Same answers as for TACHOGraph Note This covers standard cellular telephones There may or may not be an antenna mounted on the truck
E17 E17PAGER C 1 0 N PAGER -- Same answers as for TACHOGraph Note This covers standard pagers
E18 E18RADIO C 1 0 N company RADIO -- Same answers as for TACHOGraph Note Company radio means a two-way radio that operates on a private frequency dedicated to the company It is used for voice messages between the driver and dispatcher
E19 E19MASTER C 1 0 N tripMASTER -- Same answers as for TACHOGraph Note A TripMaster provides the driver with information about the best route for a trip
Interprovincial Roadside Truck Survey Technical Appendices 21
Answer Output Database Fields Reference Field Information
Questi- Name Type Length onnaire Decimals Index E20 E20OTHER C 1 0 N OTHER electronic equipment Whether there is other
electronic equipment on-board the truck Y = Yes N = No R = driver Refused to answer T = driver Terminated interview before question asked X = not applicable Note ldquoNot applicablerdquo because the question was not asked after being eliminated from the questionnaire Note Other electronic equipment covers communications information or recording equipment except electronics equipment that has to do with the operation of the engine transmission suspension or other vehicle systems radar detectors or CB radios
E21 E21OTHERD C 20 0 N OTHER electronic equipment Description blank = not applicable (no ldquootherrdquo) something = description of the ldquootherrdquo electronic equipment
E22 E22MSAS C 1 0 N Manual Slack Adjustors Status -- Whether there are manual slack adjustors on the truck Y = Yes N = No D = driver Doesnrsquot know the answer R = driver Refused to answer T = driver Terminated interview before question asked
E23 E23MSAU1 C 1 0 N Manual Slack Adjustors on Unit 1 -- Whether there are manual slack adjusters on the 1st unit of the truck (straight truck or tractor) Y = Yes N = No D = driver Doesnrsquot know the answer R = driver Refused to answer T = driver Terminated interview before question asked X = not applicable Note ldquoNot applicablerdquo if no manual slack adjusters on truck or if driver refused doesnrsquot know previous answer whether manual slack adjusters on truck
Interprovincial Roadside Truck Survey Technical Appendices 22
Answer Output Database Fields Reference Field Information
Questi- Name Type Length onnaire Decimals Index E24 E24MSAU2 C 1 0 N Manual Slack Adjustors on Unit 2 -- Whether there
are manual slack adjustors on the 2nd unit of the truck (first trailer) Y = Yes N = No D = driver Doesnrsquot know the answer R = driver Refused to answer T = driver Terminated interview before question asked X = not applicable Note ldquoNot applicablerdquo if no 2nd unit on truck or if no manual slack adjusters on truck or if driver refused doesnrsquot know previous answer whether manual slack adjusters on truck
E25 E25MSAU3 C 1 0 N Manual Slack Adjustors on Unit 3 -- Whether there are manual slack adjustors on the 3rd unit of the truck (second trailer) Same answers as for Manual Slack Adjustors on Unit 2
E26 E26MSAU4 C 1 0 N Manual Slack Adjustors on Unit 4 -- Whether there are manual slack adjustors on the 4th unit of the truck (third trailer) Same answers as for Manual Slack Adjustors on Unit 2
E27 E27MSADK C 1 0 N Manual Slack Adjustments Driver Knowledge -shyWhether the driver knows how to make manual slack adjustments Y = Yes N = No R = driver Refused to answer T = driver Terminated interview before question asked Note All drivers are asked even drivers of trucks without manual slack adjusters
E28 E28MSACP C 1 0 N Manual Slack Adjustment Company Policy -shyWhether the truck company allows a driver to make manual slack adjustments Y = Yes N = No D = driver Doesnrsquot know the answer R = driver Refused to answer T = driver Terminated interview before question asked Note All drivers are asked even drivers who do not know how to make manual slack adjustments
Interprovincial Roadside Truck Survey Technical Appendices 23
Answer Output Database Fields Reference Field Information
Questi- Name Type Length onnaire Decimals Index E29 E29ALBS C 1 0 N Anti-Lock Brakes Status -- Whether there are anti-
lock brakes on the truck Y = Yes N = No D = driver Doesnrsquot know the answer R = driver Refused to answer T = driver Terminated interview before question asked
E30 E30ALBU1 C 1 0 N Anti-Lock Brakes on Unit 1 -- Whether there are anti-lock brakes on the 1st unit of the truck (straight truck or tractor) Y = Yes N = No D = driver Doesnrsquot know the answer R = driver Refused to answer T = driver Terminated interview before question asked X = not applicable Note ldquoNot applicablerdquo if no anti-lock brakes on truck or if driver refused doesnrsquot know previous answer whether anti-lock brakes on truck
E31 E31ALBU2 C 1 0 N Anti-Lock Brakes on Unit 2 -- Whether there are anti-lock brakes on the 2nd unit of the truck (first trailer) Y = Yes N = No D = driver Doesnrsquot know the answer R = driver Refused to answer T = driver Terminated interview before question asked X = not applicable Note ldquoNot applicablerdquo if no 2nd unit on truck or if no anti-lock brakes on truck or if driver refused doesnrsquot know previous answer whether anti-lock brakes on truck
E32 E32ALBU3 C 1 0 N Anti-Lock Brakes on Unit 3 -- Whether there are anti-lock brakes on the 3rd unit of the truck (second trailer) Same answers as for Anti-Lock Brakes on Unit 2
E33 E33ALBU4 C 1 0 N Anti-Lock Brakes on Unit 4 -- Whether there are anti-lock brakes on the 4th unit of the truck (third trailer) Same answers as for Anti-Lock Brakes on Unit 2
Interprovincial Roadside Truck Survey Technical Appendices 24
E34
Reference Questishyonnaire
E34ASS
Name
C 1 0 N
Answer Output Database Fields Field
Type Length Decimals Index
Air Suspension Status -- Whether there is air suspension on the truck Y = Yes N = No D = driver Doesnrsquot know the answer R = driver Refused to answer T = driver Terminated interview before question asked
Information
E35 E35ASU1 C 1 0 N Air Suspension on Unit 1 -- Whether there is air suspension on the 1st unit of the truck (straight truck or tractor) Y = Yes N = No D = driver Doesnrsquot know the answer R = driver Refused to answer T = driver Terminated interview before question asked X = not applicable Note ldquoNot applicablerdquo if no air suspension on truck or if driver refused doesnrsquot know previous answer whether air suspension on truck
E36 E36ASU2 C 1 0 N Air Suspension on Unit 2 -- Whether there is air suspension on the 2nd unit of the truck (first trailer) Y = Yes N = No D = driver Doesnrsquot know the answer R = driver Refused to answer T = driver Terminated interview before question asked X = not applicable Note ldquoNot applicablerdquo if no 2nd unit on truck or if no air suspension on truck or if driver refused doesnrsquot know previous answer whether air suspension on truck
E37 E37ASU3 C 1 0 N Air Suspension on Unit 3 -- Whether there is air suspension on the 3rd unit of the truck (second trailer) Same answers as for Air Suspension on Unit 2
E38
F
E38ASU4 C
Interview Part 2 - Commodity Information Section
1 0 N Air Suspension on Unit 4 -- Whether there is air suspension on the 4th unit of the truck (third trailer) Same answers as for Air Suspension on Unit 2
F01 F01CARGO C 1 0 N CARGO -- Whether the truck is carrying cargo Y = Yes N = No D = driver Doesnrsquot know the answer R = driver Refused to answer T = driver Terminated interview before question asked
Interprovincial Roadside Truck Survey Technical Appendices 25
Answer Output Database Fields Reference Field Information
Questi- Name Type Length onnaire Decimals Index F02 F02CAPUSE N 2 0 N CAPacity USEd -- How much of the truckrsquos cargo
capacity is used 1 = frac14 full 2 = frac12full 3 = frac34full 4 = full 96 = not applicable 97 = driver terminated interview before question asked 98 = driver refused to answer 99 = driver does not know the answer Note ldquoNot applicablerdquo if truck is empty or if unknown whether cargo is on-board
F03 F03SPACE C 1 0 N SPACE -- Whether the truck is fully loaded because the space limit has been reached Y = Yes N = No D = driver Doesnrsquot know the answer R = driver Refused to answer X = not applicable T = driver Terminated interview before question asked Note ldquoNot applicablerdquo if truck is not full or if truck is empty or if unknown whether cargo is on-board or if driver refused doesnrsquot know previous answer on capacity used
F04 F04WEIGHT C 1 0 N WEIGHT -- Whether the truck is fully loaded because the weight limit has been reached Same answers as for SPACE
F05 F05PICKUP C 1 0 N PICK-UP -- Whether the cargo was picked up at one address (location) Y = Yes N = No D = driver Doesnrsquot know the answer R = driver Refused to answer X = not applicable T = driver Terminated interview before question asked Note ldquoNot applicablerdquo if truck is empty or if unknown whether cargo is on-board
F06 F06DELIVE C 1 0 N DELIVEred -- Whether the cargo will be delivered to one address (location) Same answers as for PICKshyUP
Interprovincial Roadside Truck Survey Technical Appendices 26
Answer Output Database Fields Reference Field Information
Questi- Name Type Length onnaire Decimals Index F07 F07SHIPS C 1 0 N SHIPments Status -- Whether the number of
shipments on-board is available Y = Yes D = driver Doesnrsquot know the answer R = driver Refused to answer X = not applicable T = driver Terminated interview before question asked Note A shipment is a load going from one shipper to one receiver and may consist of one commodity or several commodities Note A load consisting of one commodity is may or may not be a single shipment It is multiple shipments if the load was collected from more than one shipper or if the load will be delivered to more than one receiver Note ldquoNot applicablerdquo if truck is empty or if unknown whether cargo is on-board
F07 F07SHIP N 4 0 N SHIPments -- Number of shipments 0 = not applicable (see status field) something = Number
F08 F08AMOACS C 1 0 N AMOunt of All Cargo Status -- Whether a measurement of the amount of all cargo on-board is available Y = Yes D = driver Doesnrsquot know the answer R = driver Refused to answer X = not applicable T = driver Terminated interview before question asked Note ldquoNot applicablerdquo if truck is empty or if unknown whether cargo is on-board
F08 F08AMOAC N 6 0 N AMOunt of All Cargo -- The weight or volume of all cargo on-board 0 = not applicable (see status field) something = amount Note Units of measurement are defined in field F09AMOACU
F09 F09AMOACU N 2 0 N AMOunt of All Cargo Units -- Units in which the amount of cargo is measured 1 = kilograms 2 = pounds 3 = litres 4 = gallons 96 = not applicable (see status field) 97 = driver Terminated interview before question asked
Interprovincial Roadside Truck Survey Technical Appendices 27
Answer Output Database Fields Reference Field Information
Questi- Name Type Length onnaire Decimals Index F10 F10ONECOM C 1 0 N ONE COMmodity -- Whether the cargo consists of
one commodity Y = Yes N = No D = driver Doesnrsquot know the answer R = driver Refused to answer X = not applicable T = driver Terminated interview before question asked Note ldquoNot applicablerdquo if truck is empty or if unknown whether cargo is on-board
F11 F11CATC1S C 1 0 N CATegory of Commodity 1 Status -- Whether the category of the 1st largest commodity on-board is available Y = Yes D = driver Doesnrsquot know the answer R = driver Refused to answer X = not applicable T = driver Terminated interview before question asked Note Size (ldquolargerdquo) is measured by amount of the commodity Note ldquoNot applicablerdquo if truck is empty or if unknown whether cargo is on-board
F11 F11CATC1 C 40 0 N CATegory of Commodity 1 -- Description of the category of the 1st largest commodity blank = not applicable (see status field) something = description
F12 F12AMOC1S C 1 0 N AMOunt of Commodity 1 -- Whether a measurement of the amount of the 1st largest commodity is available Y = Yes D = driver Doesnrsquot know the answer R = driver Refused to answer X = not applicable T = driver Terminated interview before question asked Note ldquoNot applicablerdquo if truck is empty or if unknown whether cargo is on-board
F12 F12AMOC1 N 6 0 N AMOunt of Commodity 1 -- The weight or volume of the 1st largest commodity 0 = not applicable (see status field) something = amount Note Units of measurement are defined in field F13AMOC1U
Interprovincial Roadside Truck Survey Technical Appendices 28
Answer Output Database Fields Reference Field Information
Questi- Name Type Length onnaire Decimals Index F13 F13AMOC1U N 2 0 N AMOunt of Commodity 1 Units -- Units in which
the amount of the 1st largest commodity is measured 1 = kilograms 2 = pounds 3 = litres 4 = gallons 96 = not applicable (see status field) 97 = driver Terminated interview before question asked
F14 F14OC1S C 1 0 N Origin of Commodity 1 Status -- Whether the origin of shipment of the 1st largest commodity is available Y = Yes D = driver Doesnrsquot know the answer R = driver Refused to answer X = not applicable T = driver Terminated interview before question asked Note The origin is the place in the world where the shipper put the cargo on the transportation system The waybill or the bill of lading should list the origin Note ldquoNot applicablerdquo if truck is empty or if unknown whether cargo is on-board
F14 F14OC1JUR C 4 0 N Origin of Commodity 1 JURisdiction -- The jurisdiction in which the shipment origin is located blank = not applicable (see status field) something = jurisdiction code The codes are listed in Appendix H
F14 F14OC1PLA C 50 0 N Origin of Commodity 1 PLAce -- The name of the place in which the shipment origin is located blank = not applicable (see status field) something = place name
F14 F14OC1ID C 11 0 N Origin of Commodity 1 ID -- Unique identifier assigned to the record containing the place name blank = not applicable (see status field) something = identifier Note Identifier is filled automatically by the computer but only if the place is selected from the pick-list
F14 F14OC1LON N 11 6 N Origin of Commodity 1 LONgitude -- Longitude of the place 0 = not applicable (see status field) something = longitude Format defined in description of geographic coordinates that precedes this table Note Longitude is filled automatically by the computer but only if the place is selected from the pick-list
Interprovincial Roadside Truck Survey Technical Appendices 29
Answer Output Database Fields Reference Field Information
Questi- Name Type Length onnaire Decimals Index F14 F14OC1LAT N 11 6 N Origin of Commodity 1 LATitude -- Latitude of the
place 0 = not applicable (see status field) something = latitude Format defined in description of geographic coordinates that precedes this table Note Latitude is filled automatically by the computer but only if the place is selected from the pick-list
F15 F15DC1S C 1 0 N Destination of Commodity 1 Status -- Same answers as for Origin of Commodity 1 Status Note The destination is the place in the world where the receiver will remove the cargo from the transportation system The waybill or the bill of lading should list the destination
F15 F15DC1JUR C 4 0 N Destination of Commodity 1 JURisdiction -- Same answers as for Origin of Commodity 1 JURisdiction
F15 F15DC1PLA C 50 0 N Destination of Commodity 1 PLAce -- Same answers as for Origin of Commodity 1 PLAce
F15 F15DC1ID C 11 0 N Destination of Commodity 1 ID -- Same answers as for Origin of Commodity 1 ID
F15 F15DC1LON N 11 6 N Destination of Commodity 1 LONgitude -- Same answers as for Origin of Commodity 1 LONgitude
F15 F15DC1LAT N 11 6 N Destination of Commodity 1 LATitude -- Same answers as for Origin of Commodity 1 LATitude
F16 F16DGOB C 1 0 N Dangerous Goods On-Board -- Whether there are dangerous goods on-board Y = Yes N = No D = driver Doesnrsquot know the answer R = driver Refused to answer answer X = not applicable T = driver Terminated interview before question asked Note ldquoNot applicablerdquo if truck is empty or if unknown whether cargo is on-board
Interprovincial Roadside Truck Survey Technical Appendices 30
Answer Output Database Fields Reference Field Information
Questi- Name Type Length onnaire Decimals Index F17 F17DGC1CS C 1 0 N Dangerous Goods Commodity 1 Class Status -shy
Whether the class of the 1st largest dangerous goods commodity is available Y = Yes D = driver Doesnrsquot know the answer R = driver Refused to answer answer X = not applicable blank = not applicable Note ldquoNot applicable=Xrdquo if no dangerous goods on-board or if truck is empty or if driver refused doesnrsquot know previous answer whether dangerous goods on-board Note ldquoNot applicable=blankrdquo because the question was not asked until being added to the questionnaire software
F17 F17DGC1C N 3 1 N Dangerous Goods Commodity 1 Class -- The class of the 1st largest dangerous goods commodity 00 = unknown or not applicable something = class Dangerous goods classes are listed in Appendix H Note See note under Dangerous Goods Commodity 1 UN number Note Size (ldquolargerdquo) is measured by amount of the commodity Note ldquoNot applicablerdquo if no dangerous goods on-board or if truck is empty or if unknown whether cargo is on-board or if driver refused doesnrsquot know previous answer whether dangerous goods on-board or if interview terminated
F18 F17DGC1UNS C 1 0 N Dangerous Goods Commodity 1 UN number Status shy- Whether the UN number of the 1st largest dangerous goods commodity is available Y = Yes D = driver Doesnrsquot know the answer R = driver Refused to answer answer X = not applicable blank = not applicable Note ldquoNot applicablerdquo if no dangerous goods on-board or if truck is empty or if driver refused doesnrsquot know previous answer whether dangerous goods on-board Note ldquoNot applicable=blankrdquo because the question was not asked until being added to the questionnaire software
Interprovincial Roadside Truck Survey Technical Appendices 31
Answer Output Database Fields Reference Field Information
Questi- Name Type Length onnaire Decimals Index F18 F18DGC1UN C 8 0 N Dangerous Goods Commodity 1 UN number -- The
UN number of the 1st largest dangerous goods commodity blank = not applicable something = number or the word UNKNOWN Dangerous goods UN numbers are listed in Appendix H Note The computer program requires that a UN Number or a Class be entered if the answer to Dangerous Goods On-Board is Yes If neither the UN number nor the class is known the surveyors are been directed to enter UNKNOWN in the UN number field Note ldquoNot applicablerdquo if no dangerous goods on-board or if truck is empty or if unknown whether cargo is on-board or if driver refused doesnrsquot know previous answer whether dangerous goods on-board or if interview terminated
G Interview Part 3 - Carrier Information Section G01 G01CTYPE N 2 0 N Company TYPE -- Type of trucking company
1 = for-hire 2 = private 97 = driver Terminated interview before question asked 98 = driver Refused to answer 99 = driver Doesnrsquot know the answer Note A for-hire trucking company earns its money by transporting cargo belonging to someone else A private trucking company is part of a parent company such as a retailer or a manufacturer and exists to transport cargo belonging to the parent company
G02 G02PRIFH C 1 0 N PRIvate company carrying cargo For-Hire -- Whether the private trucking company is carrying cargo for-hire on this trip Y = Yes N = No D = driver Doesnrsquot know the answer R = driver Refused to answer X = not applicable Note A private trucking company is mainly engaged in transporting the cargo of its parent company but on occasion will carry cargo on a for-hire basis (to minimize empty mileage) Note ldquoNot applicablerdquo if trucking company is for-hire or if truck is empty or if unknown whether cargo is on-board or if driver refused doesnrsquot know previous answer on company type or if interview terminated
Interprovincial Roadside Truck Survey Technical Appendices 32
Answer Output Database Fields Reference Field Information
Questi- Name Type Length onnaire Decimals Index G03 G03CDS C 1 0 N Company Dispatch centre Status -- Whether an
answer is available Y = Yes (driver identified a base) N = No dispatch centre (driverrsquos answer) R = driver Refused to answer T = driver Terminated interview before question asked X = not applicable Note ldquoNot applicablerdquo because the question was not asked after being eliminated from the questionnaire Note The dispatch centre is the trucking company office that coordinates the driverrsquos work (provides instructions on where to pick-up and deliver cargo tracks the progress of the cargo) It is located in Canada US or Mexico A driver does not necessarily deal with a dispatch centre
G03 G03CDJUR C 4 0 N Company Dispatch centre JURisdiction -- The jurisdiction in which the dispatch centre is located blank = not applicable (see status field) something = jurisdiction code The codes are listed in Appendix H
G03 G03CDPLA C 50 0 N Company Dispatch centre PLAce -- The name of the place in which the dispatch centre is located blank = not applicable (see status field) something = place name
G03 G03CDID C 11 0 N Company Dispatch centre ID -- Unique identifier assigned to the record containing the place name blank = not applicable (see status field) something = identifier Note Identifier is filled automatically by the computer but only if the place is selected from the pick-list
G03 G03CDLON N 11 6 N Company Dispatch centre LONgitude -- Longitude of the place 0 = not applicable (see status field) something = longitude Format defined in description of geographic coordinates that precedes this table Note Longitude is filled automatically by the computer but only if the place is selected from the pick-list
G03 G03CDLAT N 11 6 N Company Dispatch centre LATitude -- Latitude of the place 0 = not applicable (see status field) something = latitude Format defined in description of geographic coordinates that precedes this table Note Latitude is filled automatically by the computer but only if the place is selected from the pick-list
Interprovincial Roadside Truck Survey Technical Appendices 33
Answer Output Database Fields Reference Field Information
Questi- Name Type Length onnaire Decimals Index
H Interview Part 4 - Trip Information Section H01 H01TRITYP C 1 0 N TRIp TYPe -- Whether the trip is a linehaul or a
peddle run P = Peddle run L = Linehaul R = driver Refused to answer T = driver Terminated interview before question asked Note A linehaul trip transports the entire cargo load from one point to another point A peddle run makes stops for cargo pick-up and delivery between its first cargo pick-up point and last cargo delivery point See discussion of trip definition that precedes this table
H02 H02TRISTOS C 1 0 N TRIp STOps Status -- Whether the number of stops on the peddle run is available Y = Yes D = driver Doesnrsquot know the answer R = driver Refused to answer X = not applicable T = driver Terminated interview before question asked Note ldquoNot applicablerdquo if not a peddle run or if driver refused previous answer on trip type
H02 H02TRISTO N 2 0 N TRIp STOps -- Number of stops on the peddle run 0 = not applicable (see status field) something = number
H03 H03SECOND C 1 0 N SECOND -- Whether there is a second driver on-board the truck so that the trip is being driven by a driver team Y = Yes N = No R = driver Refused to answer T = driver Terminated interview before question asked
H04 H04TOS C 1 0 N Trip Origin Status -- Whether an answer is available Y = Yes (driver identified a base) D = driver Doesnrsquot know the answer R = driver Refused to answer T = driver Terminated interview before question asked Note The trip origin is a location in Canada US or Mexico See discussion of trip definition that preceeds this table
H04 H04TOJUR C 4 0 N Trip Origin JURisdiction -- The jurisdiction in which the trip origin is located blank = not applicable (see status field) something = jurisdiction code The codes are listed in Appendix H
Interprovincial Roadside Truck Survey Technical Appendices 34
Answer Output Database Fields Reference Field Information
Questi- Name Type Length onnaire Decimals Index H04 H04TOPLA C 50 0 N Trip Origin PLAce -- The name of the place in which
the trip origin is located blank = not applicable (see status field) something = place name
H04 H04TOID C 11 0 N Trip Origin ID -- Unique identifier assigned to the record containing the place name blank = not applicable (see status field) something = identifier Note Identifier is filled automatically by the computer but only if the place is selected from the pick-list
H04 H04TOLON N 11 6 N Trip Origin LONgitude -- Longitude of the place 0 = not applicable (see status field) something = longitude Format defined in description of geographic coordinates that precedes this table Note Longitude is filled automatically by the computer but only if the place is selected from the pick-list
H04 H04TOLAT N 11 6 N Trip Origin LATitude -- Latitude of the place 0 = not applicable (see status field) something = latitude Format defined in description of geographic coordinates that precedes this table Note Latitude is filled automatically by the computer but only if the place is selected from the pick-list
H05 H05TOADDS C 1 0 N Trip Origin ADDress Status -- Whether the trip origin address is available or needed Y = Yes D = driver Doesnrsquot know the answer R = driver Refused to answer T = driver Terminated interview before question asked X = not applicable Note ldquoNot applicablerdquo if origin place does not require that the question be asked or if driver refused doesnrsquot know previous answer on origin place
H05 H05TOADD1 C 40 0 N Trip Origin ADDress line 1 blank = not applicable (see status field) something = part of address
H05 H05TOADD2 C 40 0 N Trip Origin ADDress line 2 Same answers as for Trip Origin ADDress line 1
H05 H05TOADD3 C 40 0 N Trip Origin ADDress line 3 Same answers as for Trip Origin ADDress line 1
H06 H06TDS C 1 0 N Trip Destination Status -- Same answers as for Trip Origin Status Note The trip destination is a location in Canada US or Mexico See discussion of trip definition that preceeds this table
Interprovincial Roadside Truck Survey Technical Appendices 35
Answer Output Database Fields Reference Field Information
Questi- Name Type Length onnaire Decimals Index H06 H06TDJUR C 4 0 N Trip Destination JURisdiction -- Same answers as for
Trip Origin JURisdiction H06 H06TDPLA C 50 0 N Trip Destination PLAce -- Same answers as for Trip
Origin PLAce H06 H06TDID C 11 0 N Trip Destination ID -- Same answers as for Trip
Origin ID H06 H06TDLON N 11 6 N Trip Destination LONgitude -- Same answers as for
Trip Origin LONgitude H06 H06TDLAT N 11 6 N Trip Destination LATitude -- Same answers as for
Trip Origin LATitude H07 H07TDADDS C 1 0 N Trip Destination ADDress Status Same answers as
for Trip Origin ADDressStatus H07 H07TDADD1 C 40 0 N Trip Destination ADDress line 1 Same answers as
for Trip Origin ADDress line 1 H07 H07TDADD2 C 40 0 N Trip Destination ADDress line 2 Same answers as
for Trip Origin ADDress line 2 H07 H07TDADD3 C 40 0 N Trip Destination ADDress line 3 Same answers as
for Trip Origin ADDress line 3 H08 H08LSS C 1 0 N Last Stop Status -- Whether an answer is available on
the location of the last stop made before the DCS Y = Yes (driver identified a base) D = driver Doesnrsquot know the answer R = driver Refused to answer T = driver Terminated interview before question asked Note The last stop is a location in Canada US or Mexico See discussion of trip definition that preceeds this table
H08 H08LSJUR C 4 0 N Last Stop JURisdiction -- The jurisdiction in which the last stop was made blank = not applicable (see status field) something = jurisdiction code The codes are listed in Appendix H
H08 H08LSPLA C 50 0 N Last Stop PLAce -- The name of the place in which the last stop was made blank = not applicable (see status field) something = place name
H08 H08LSID C 11 0 N Last Stop ID -- Unique identifier assigned to the record containing the place name blank = not applicable (see status field) something = identifier Note Identifier is filled automatically by the computer but only if the place is selected from the pick-list
Interprovincial Roadside Truck Survey Technical Appendices 36
Answer Output Database Fields Reference Field Information
Questi- Name Type Length onnaire Decimals Index H08 H08LSLON N 11 6 N Last Stop LONgitude -- Longitude of the place
0 = not applicable (see status field) something = longitude Format defined in description of geographic coordinates that precedes this table Note Longitude is filled automatically by the computer but only if the place is selected from the pick-list
H08 H08LSLAT N 11 6 N Last Stop LATitude -- Latitude of the place 0 = not applicable (see status field) something = latitude Format defined in description of geographic coordinates that precedes this table Note Latitude is filled automatically by the computer but only if the place is selected from the pick-list
H09 H09NSS C 1 0 N Next Stop Status -- Same answers as for Last Stop Status Note The next stop is a location in Canada US or Mexico See discussion of trip definition that preceeds this table
H09 H09NSJUR C 4 0 N Next Stop JURisdiction -- Same answers as for Last Stop JURisdiction
H09 H09NSPLA C 50 0 N Next Stop PLAce -- Same answers as for Last Stop PLAce
H09 H09NSID C 11 0 N Next Stop ID -- Same answers as for Last Stop ID H09 H09NSLON N 11 6 N Next Stop LONgitude -- Same answers as for Last
Stop LONgitude H09 H09NSLAT N 11 6 N Next Stop LATitude -- Same answers as for Last Stop
LATitude H10 H10EPS C 1 0 N Entered Province crossing Status -- Whether the trip
entered the province territory containing the DCS from another jurisdiction Y = Yes D = driver Doesnrsquot know the answer R = driver Refused to answer X = not applicable (not entering province territory) T = driver Terminated interview before question asked Note The border crossing could be domestic (between Canadian jursidictions) or international (between Canada and the US) Note See discussion of border crossings that precedes this table
Interprovincial Roadside Truck Survey Technical Appendices 37
Answer Output Database Fields Reference Field Information
Questi- Name Type Length onnaire Decimals Index H10 H10EPPLA C 60 0 N Entered Province crossing PLAce -- Description of
the border crossing blank = not applicable (see status field) something = description Note Crossing could be between Canadian two jurisdictions or between a Canadian and a US jurisdiction Note Description consists of name of facility or jurisdiction and place or jurisdiction and highway number from the perspective of either side of the border)
H10 H10EPID C 10 0 N Entered Province crossing ID -- Unique identifier assigned to the border crossing 0 = not applicable (see status field) something = identifier Note Identifier is filled automatically by the computer but only if the location is selected from the pick-list
H10 H10EPLON N 10 6 N Entered Province crossing LONgitude -- Longitude of the border crossing 0 = not applicable (see status field) something = longitude Format defined in description of geographic coordinates that precedes this table Note Longitude is filled automatically by the computer but only if the location is selected from the pick-list
H10 H10EPLAT N 10 6 N Entered Province crossing LATitude -- Latitude of the border crossing 0 = not applicable (see status field) something = latitude Format defined in description of geographic coordinates that precedes this table Note Latitude is filled automatically by the computer but only if the location is selected from the pick-list
Interprovincial Roadside Truck Survey Technical Appendices 38
Answer Output Database Fields Reference Field Information
Questi- Name Type Length onnaire Decimals Index H11 H11LPS C 1 0 N Leaving Province crossing Status -- Whether the trip
will leave the province territory containing the DCS for another jurisdiction Y = Yes D = driver Doesnrsquot know the answer R = driver Refused to answer X = not applicable (not leaving province territory) T = driver Terminated interview before question asked Note The border crossing could be domestic (between Canadian jursidictions) or international (between Canada and the US) Note See discussion of border crossings that precedes this table
H11 H11LPPLA C 60 0 N Leaving Province crossing PLAce Same answers as for Entered Province PLAce
H11 H11LPID C 10 0 N Leaving Province crossing ID -- Same answers as for Entered Province ID
H11 H11LPLON N 10 6 N Leaving Province crossing LONgitude -- Same answers as for Entered Province LONgitude
H11 H11LPLAT N 10 6 N Leaving Province crossing LATitude -- Same answers as for Entered Province LATitude
H12 H12EC1S C 1 0 N Entered Canada crossing 1 Status -- Whether the trip entered Canada from the US at a crossing in a province territory other than the provinceterritory containing the DCS Y = Yes D = driver Doesnrsquot know the answer R = driver Refused to answer X = not applicable (no such crossing) T = driver Terminated interview before question asked Note See discussion of border crossings that precedes this table
H12 H12EC1PLA C 60 0 N Entered Canada crossing 1 PLAce Same answers as for Entered Province PLAce
H12 H12EC1ID C 10 0 N Entered Canada crossing 1 ID -- Same answers as for Entered Province ID
H12 H12EC1LON N 10 6 N Entered Canada crossing 1 LONgitude -- Same answers as for Entered Province LONgitude
H12 H12EC1LAT N 10 6 N Entered Canada crossing 1 LATitude -- Same answers as for Entered Province LATitude
Interprovincial Roadside Truck Survey Technical Appendices 39
Answer Output Database Fields Reference Field Information
Questi- Name Type Length onnaire Decimals Index H13 H13EC2S C 1 0 N Entered Canada crossing 2 Status -- Whether the
trip entered Canada from the US at a 2nd crossing in a province territory other than the provinceterritory containing the DCS Y = Yes D = driver Doesnrsquot know the answer R = driver Refused to answer X = not applicable (no such crossing) T = driver Terminated interview before question asked Note See discussion of border crossings that precedes this table
H13 H13EC2PLA C 60 0 N Entered Canada crossing 2 PLAce Same answers as for Entered Province PLAce
H13 H13EC2ID C 10 0 N Entered Canada crossing 2 ID -- Same answers as for Entered Province ID
H13 H13EC2LON N 10 6 N Entered Canada crossing 2 LONgitude -- Same answers as for Entered Province LONgitude
H13 H13EC2LAT N 10 6 N Entered Canada crossing 2 LATitude -- Same answers as for Entered Province LATitude
H14 H14LC1S C 1 0 N Leaving Canada crossing 1 Status -- Whether the trip will leave Canada for the US at a crossing in a province territory other than the provinceterritory containing the DCS Y = Yes D = driver Doesnrsquot know the answer R = driver Refused to answer X = not applicable (no such crossing) T = driver Terminated interview before question asked Note See discussion of border crossings that precedes this table
H14 H14LC1PLA C 60 0 N Leaving Canada crossing 1 PLAce Same answers as for Entered Province PLAce
H14 H14LC1ID C 10 0 N Leaving Canada crossing 1 ID -- Same answers as for Entered Province ID
H14 H14LC1LON N 10 6 N Leaving Canada crossing 1 LONgitude -- Same answers as for Entered Province LONgitude
H14 H14LC1LAT N 10 6 N Leaving Canada crossing 1 LATitude -- Same answers as for Entered Province LATitude
Interprovincial Roadside Truck Survey Technical Appendices 40
Answer Output Database Fields Reference Field Information
Questi- Name Type Length onnaire Decimals Index H15 H15LC2S C 1 0 N Leaving Canada crossing 2 Status -- Whether the
trip will leave Canada for the US at a 2nd crossing in a province territory other than the provinceterritory containing the DCS Y = Yes D = driver Doesnrsquot know the answer R = driver Refused to answer X = not applicable (no such crossing) T = driver Terminated interview before question asked Note See discussion of border crossings that precedes this table
H15 H15LC2PLA C 60 0 N Leaving Canada crossing 2 PLAce Same answers as for Entered Province PLAce
H15 H15LC2ID C 10 0 N Leaving Canada crossing 2 ID -- Same answers as for Entered Province ID
H15 H15LC2LON N 10 6 N Leaving Canada crossing 2 LONgitude -- Same answers as for Entered Province LONgitude
H15 H15LC2LAT N 10 6 N Leaving Canada crossing 2 LATitude -- Same answers as for Entered Province LATitude
H16 H16UM1S C 1 0 N UsMexico crossing 1 Status -- Whether the trip will cross the USMexico border Y = Yes D = driver Doesnrsquot know the answer R = driver Refused to answer X = not applicable (no such crossing) T = driver Terminated interview before question asked Note See discussion of border crossings that precedes this table
H16 H16UM1PLA C 60 0 N UsMexico crossing 1 PLAce Same answers as for Entered Province PLAce
H16 H16UM1ID C 10 0 N UsMexico crossing 1 ID -- Same answers as for Entered Province ID
H16 H16UM1LON N 10 6 N UsMexico crossing 1 LONgitude -- Same answers as for Entered Province LONgitude
H16 H16UM1LAT N 10 6 N UsMexico crossing 1 LATitude -- Same answers as for Entered Province LATitude
H17 H17HWYS C 1 0 N HighWaY route Status -- Whether the highways on the trip route are available Y = Yes D = driver Doesnrsquot know the answer R = driver Refused to answer T = driver Terminated interview before question asked X = not applicable Note ldquoNot applicablerdquo if jurisdiction containing the DCS does not require that the question be asked Note ldquoYesrdquo is triggered if something has been entered in H17HWY1
Interprovincial Roadside Truck Survey Technical Appendices 41
Answer Output Database Fields Reference Field Information
Questi- Name Type Length onnaire Decimals Index H17 H17HWY1 C 40 0 N HighWaY route line 1
blank = not applicable (see status field) something = highway description
H17 H17HWY2 C 40 0 N HighWaY route line 2 blank = none or not applicable (see status field) something = highway description
H17 H17HWY3 C 40 0 N HighWaY route line 3 Same answers as for HighWaY route line 2
H17 H17HWY4 C 40 0 N HighWaY route line 4 Same answers as for HighWaY route line 2
H17 H17HWY5 C 40 0 N HighWaY route line 5 Same answers as for HighWaY route line 2
H17 H17HWY6 C 40 0 N HighWaY route line 6 Same answers as for HighWaY route line 2
H17 H17HWY7 C 40 0 N HighWaY route line 7 Same answers as for HighWaY route line 2
H18 H18PTOD C 1 0 N Previous Trip Origin and Destination -- Whether the origin and destination of the previous trip were the same as the origin and destination of the current trip Y = Yes N = No D = driver Doesnrsquot know the answer R = driver Refused to answer T = driver Terminated interview before question asked X = not applicable Note ldquoNot applicablerdquo because the question was not asked after being eliminated from the questionnaire
H19 H19PTHWY C 1 0 N Previous Trip HighWaYs -- Whether the highways used on the previous trip were the sme as the highways used on the current trip Y = Yes N = No D = driver Doesnrsquot know the answer R = driver Refused to answer X = not applicable T = driver Terminated interview before question asked Note ldquoNot applicablerdquo if previous trip origin or destination different or if driver refused doesnrsquot know previous answer on previous trip origin destination or if previous question was not asked
Interprovincial Roadside Truck Survey Technical Appendices 42
Answer Output Database Fields Reference Field Information
Questi- Name Type Length onnaire Decimals Index H20 H20TSDATES C 1 0 N Trip Start DATE Status -- Whether the date on which
the trip started from the trip origin is available Y = Yes D = driver Doesnrsquot know the answer R = driver Refused to answer T = driver Terminated interview before question asked X = not applicable Note ldquoNot applicablerdquo because the question was not asked after being eliminated from the questionnaire
H20 H20TSDATE D 8 0 N Trip Start DATE blank = not applicable (see status field) something = date Format YYYYMMDD
H21 H21TSHOURS C 1 0 N Trip Start HOUR Status -- Whether the hour during which the trip started from the trip origin is available Y = Yes D = driver Doesnrsquot know the answer R = driver Refused to answer T = driver Terminated interview before question asked X = not applicable Note ldquoNot applicablerdquo because the question was not asked after being eliminated from the questionnaire
H21 H21TSHOUR N 2 0 N Trip Start HOUR blank = not applicable (see status field) something = hour Format 24 hour clock
H22 H22TSINT C 1 0 N Trip Start cargo INTerlined -- Whether the cargo picked-up at the trip start was received from another trucking company Y = Yes N = No D = driver Doesnrsquot know the answer R = driver Refused to answer X = not applicable T = driver Terminated interview before question asked Note ldquoNot applicablerdquo if no cargo on-board or because the question was not asked after being eliminated from the questionnaire Note The interlining could be accomplished by transferring the cargo itself from one truck to another or by transfering the trailer containing the cargo from one company to another
Interprovincial Roadside Truck Survey Technical Appendices 43
Answer Output Database Fields Reference Field Information
Questi- Name Type Length onnaire Decimals Index H23 H23TSFAC N 2 0 N Trip Start FACility -- The type of facility at which the
trip started 1 = Truck Terminal - Your Carrier 2 = Truck Terminal - Another Carrier 3 = Rail Terminal 4 = Marine Terminal 5 = Airport Terminal 6 = Primary Producer 7 = Manufacturer 8 = WarehouseDistribution Centre 9 = Retail Outlet 95 = Other 97 = driver Terminated interview before question asked 98 = driver Refused to answer 99 = driver Doesnrsquot know the answer
H24 H24TSFACD C 20 0 N Trip Start FACility Description blank = not applicable (see status field) something = description of ldquootherrdquo type of facility
H25 H25TEDATES C 1 0 N Trip End DATE Status -- Whether the date on which the trip will end at the trip destination is available Same answers as for Trip Start DATE Status
H25 H25TEDATE D 8 0 N Trip End DATE -- Same answers as for Trip Start DATE
H26 H26TEHOURS C 1 0 N Trip End HOUR Status -- Same answers as for Trip Start HOUR Status
H26 H26TEHOUR N 2 0 N Trip End HOUR -- Same answers as for Trip Start HOUR
H27 H27TEINT C 1 0 N Trip End cargo INTerlined -- Same answers as for Trip End cargo INTerlined
H28 H28TEFAC N 2 0 N Trip End FACility -- Same answers as for Trip Start FACility
H29 H29TEFACD C 20 0 N Trip End FACility Description -- Same answers as for Trip Start FACility Description
I Interview Part 5 - Driver Information Section I01 I01DBS C 1 0 N Driver Base Status -- Whether an answer is available
Y = Yes (driver identified a base) N = No base (driverrsquos answer) R = driver Refused to answer T = driver Terminated interview before question asked Note The base is the place in Canada US or Mexico where the driver lives
Interprovincial Roadside Truck Survey Technical Appendices 44
Answer Output Database Fields Reference Field Information
Questi- Name Type Length onnaire Decimals Index I01 I01DBJUR C 4 0 N Driver Base JURisdiction -- The jurisdiction in which
the driver base is located blank = not applicable (see status field) something = jurisdiction code The codes are listed in Appendix H
I01 I01DBPLA C 50 0 N Truck Base PLAce -- The name of the place in which the driver base is located blank = not applicable (see status field) something = place name
I01 I01DBID C 11 0 N Driver Base ID -- Unique identifier assigned to the record containing the place name blank = not applicable (see status field) something = identifier Note Identifier is filled automatically by the computer but only if the place is selected from the pick-list
I01 I01DBLON N 11 6 N Driver Base LONgitude -- Longitude of the place 0 = not applicable (see status field) something = longitude Format defined in description of geographic coordinates that precedes this table Note Longitude is filled automatically by the computer but only if the place is selected from the pick-list
I01 I01DBLAT N 11 6 N Driver Base LATitude -- Latitude of the place 0 = not applicable (see status field) something = latitude Format defined in description of geographic coordinates that precedes this table Note Latitude is filled automatically by the computer but only if the place is selected from the pick-list
I02 I02OWNER C 1 0 N OWNER -- Whether driver owns the straight truck or tractor Y = Yes N = No R = driver Refused to answer T = driver Terminated interview before question asked
Interprovincial Roadside Truck Survey Technical Appendices 45
Answer Output Database Fields Reference Field Information
Questi- Name Type Length onnaire Decimals Index I03 I03CONTRA C 1 0 N CONTRAct -- Whether the driver-owner of the truck
has a contract with a trucking company to haul cargo for that company Y = Yes N = No R = driver Refused to answer X = not applicable T = driver Terminated interview before question asked Note ldquoNot applicablerdquo if the driver is not the owner of the truck or if the driver refused to answer the previous question on truck ownership
I04 I04EMPLOY C 1 0 N EMPLOYer -- What type of company is the employer of a driver-non-owner C = Trucking Company L = Leasing Agency O = Other R = driver Refused to answer X = not applicable T = driver Terminated interview before question asked Note ldquoNot applicablerdquo if the driver is the owner of the truck or if the driver refused to answer the previous question on truck ownership
I05 I05OTHER C 20 0 N OTHER -- Description of the employer type if it was classified as Other blank = not applicable something = description
I06 I06AGES C 1 0 N AGE Status -- Whether the driverrsquos age is available Y = Yes R = driver Refused to answer T = driver Terminated interview before question asked
I06 I06AGE N 2 0 N AGE 0 = not applicable (see status field) something = age in years
I07 I07DRITOTS C 1 0 N DRIving TOTal Status -- Availability of how many years the driver has driven a truck for a living Y = Yes L = yes -- Less than 1 year D = driver Doesnrsquot know the answer R = driver Refused to answer T = driver Terminated interview before question asked
I07 I07DRITOT N 2 0 N DRIving TOTal 0 = none or less than 1 or not available (see status field) something = years of driving
Interprovincial Roadside Truck Survey Technical Appendices 46
Answer Output Database Fields Reference Field Information
Questi- Name Type Length onnaire Decimals Index I08 I08DRICONS C 1 0 N DRIving CONfiguration Status -- Availability of how
many years the driver has driven the observed configuration of truck for a living Y = Yes L = yes -- Less than 1 year D = driver Doesnrsquot know the answer R = driver Refused to answer X = not applicable T = driver Terminated interview before question asked Note ldquoNot applicablerdquo if truck configuration is not a tractor or a tractor-trailer combination
I08 I08DRICON N 2 0 N DRIving CONfiguration 0 = none or less than 1 or not available or not applicable (see status field) something = years of driving
I09 I09NSCRTR C 1 0 N National Safety Code Requirements TRaining -shyWhether in the past 3 years the driver has received at least 1 day of training on the requirements of the National Safety Code Y = Yes N = No R = driver Refused to answer T = driver Terminated interview before question asked Note Training could cover topics such as licences necessary maintaining an hours of service log and performing a daily vehicle trip inspection
I10 I10NSCRSP C 1 0 N National Safety Code Requirements SPonsor -shyWhether the driverrsquos employer sponsored the training Y = Yes N = No X = not applicable R = driver Refused to answer T = driver Terminated interview before question asked Note The driverrsquos employer sponsored the training if the employer paid the cost of the training outside of working hours or if the training occurred during working hours while the driver was being paid Note ldquoNot applicablerdquo if no training or if driver refused previous answer whether training received or because the question was not asked after being eliminated from the questionnaire
Interprovincial Roadside Truck Survey Technical Appendices 47
Answer Output Database Fields Reference Field Information
Questi- Name Type Length onnaire Decimals Index I11 I11DGHTR C 1 0 N Dangerous Goods Handling TRaining -shy Same
answers as for National Safety Code Requirements TRaining Note Training could cover topics such as documents and safety markings necessary handling characteristics of the product and responding to an emergency
I12 I12DGHSP C 1 0 N Dangerous Goods Handling SPonsor -shy Same answers as for National Safety Code Requirements SPonsor
I13 I13DSTR C 1 0 N Driving Skills TRaining -shy Same answers as for National Safety Code Requirements TRaining Note Training culd cover topics such as recognizing unsafe practices handling characteristics of the vehicle configuration and driving techniques to increase efficiency Not included is vehicle maintenance training
I14 I14DSSP C 1 0 N Driving Skills SPonsor -shy Same answers as for National Safety Code Requirements SPonsor
I15 I15BSTR C 1 0 N Business Skills TRaining -shy Same answers as for National Safety Code Requirements TRaining Note Training could cover topics such as dealing with customers tracking and analysing costs and revenues and understanding contracts
I16 I16BSSP C 1 0 N Business Skills SPonsor -shy Same answers as for National Safety Code Requirements SPonsor
I17 I17EEUTR C 1 0 N Electronic Equipment Usage TRaining -shy Same answers as for National Safety Code Requirements TRaining Note Training could cover topics such as purpose and use of communications and information recording equipment
I18 I18EEUSP C 1 0 N Electronic Equipment Usage SPonsor -shy Same answers as for National Safety Code Requirements SPonsor
J Weights and Measures Section J01 J01COUS C 1 0 N COUnt of axle groupings weighed Status -- Whether
the axles are weighted in groups that are the same as or different from the groups recorded in C25AXLAG1 through C25AXLAG8 M = Modified (weighed groupings of axles different from recorded axle groups) S = Same (weighed in same groupings) X = not applicable (no weight information available)
Interprovincial Roadside Truck Survey Technical Appendices 48
Answer Output Database Fields Reference Field Information
Questi- Name Type Length onnaire Decimals Index J01 J01COUAG1 N 1 0 N COUnt of Axles in weighed Grouping 1 -- How
many axles are in the 1st grouping to be weighed 12 = number of axles (including lifted axles) Note The number of axles includes any axles in the grouping that are lifted at the time of the weighing
J01 J01COUAG2 N 1 0 N COUnt of Axles in weighed Grouping 2 -- Same answers as for COUnt of Axles in weighed Group 1
J01 J01COUAG3 N 2 0 N COUnt of Axles in weighed Grouping 3 How many axles are in the 3rd grouping to be weighed 12 = number of axles 96 = not applicable (no 3rd group)
J01 J01COUAG4 N 2 0 N COUnt of Axles in weighed Grouping 4 -- Same answers as for COUnt of Axles in weighed Group 3
J01 J01COUAG5 N 2 0 N COUnt of Axles in weighed Grouping 5 -- Same answers as for COUnt of Axles in weighed Group 3
J01 J01COUAG6 N 2 0 N COUnt of Axles in weighed Grouping 6 -- Same answers as for COUnt of Axles in weighed Group 3
J01 J01COUAG7 N 2 0 N COUnt of Axles in weighed Grouping 7 -- Same answers as for COUnt of Axles in weighed Group 3
J01 J01COUAG8 N 2 0 N COUnt of Axles in weighed Grouping 8 -- Same answers as for COUnt of Axles in weighed Group 3
J02 J02WEIS C 1 0 N WEIght Status -- Whether the weight of the truck is available Y = Yes N = No
J02 J02WEIAG1 N 5 0 N WEIght for Axles in Grouping 1 -- Weight of the 1st
grouping of axles to be weighed 0 = not applicable (see status field) something = weight Note Units of measurement are defined in field J02WEIU
J02 J02WEIAG2 N 5 0 N WEIght for Axles in Grouping 2 -- Weight of the 2nd
grouping of axles to be weighed 0 = zero or not applicable something = weight Note Units of measurement are defined in field J02WEIU Note ldquoZerordquo means that all axles in the grouping are lifted Note ldquoNot applicablerdquo if no such grouping or if weight not available (see status field)
J02 J02WEIAG3 N 5 0 N WEIght for Axles in Grouping 3 -- Same answers as for WEIght for Axles in Groupint 2
J02 J02WEIAG4 N 5 0 N WEIght for Axles in Grouping 4 -- Same answers as for WEIght for Axles in Groupint 2
J02 J02WEIAG5 N 5 0 N WEIght for Axles in Grouping 5 -- Same answers as for WEIght for Axles in Groupint 2
J02 J02WEIAG6 N 5 0 N WEIght for Axles in Grouping 6 -- Same answers as for WEIght for Axles in Groupint 2
Interprovincial Roadside Truck Survey Technical Appendices 49
Answer Output Database Fields Reference Field Information
Questi- Name Type Length onnaire Decimals Index J02 J02WEIAG7 N 5 0 N WEIght for Axles in Grouping 7 -- Same answers
as for WEIght for Axles in Groupint 2 J02 J02WEIAG8 N 5 0 N WEIght for Axles in Grouping 8 -- Same answers
as for WEIght for Axles in Groupint 2 J02 J02WEIALL N 6 0 N WEIght of ALL axles -- Total weight of the truck
0 = not applicable (see status field) something = weight Note Units of measurement are defined in field J02WEIU
J03 J03WEIU C 1 0 N WEIght Units -- Units in which the weight of the truck is measured K = Kilograms P = Pounds X = not applicable (no measurements)
J04 J04MS C 1 0 N Measurement of length Status -- Whether the measurements of the truck length are available Y = Yes N = No
J04 J04MFB N 6 2 N Measurement for Front Bumper -- Reading on the measuring tape for the location of the front bumper 0 = not applicable (see status field) something = reading on tape Note Units of measurement are defined in field J04MU
J04 J04MAXL1 N 6 2 N Measurement for Axle 1 -- Reading on the measuring tape for the location of the 1st axle 0 = not applicable (see status field) something = reading on tape Note Units of measurement are defined in field J04MU
J04 J04MAXL2 N 6 2 N Measurement for Axle 2 Same answers as for Measurement for Axle 1
J04 J04MAXL3 N 6 2 N Measurement for Axle 3 -- Reading on the measuring tape for the location of the 3rd axle 0 = not applicable something = reading on tape Note Units of measurement are defined in field J04MU Note ldquoNot applicablerdquo if no such axle or if measurement not available (see status field)
J04 J04MAXL4 N 6 2 N Measurement for AXLe 4 Same answers as for Measurement for AXLe 1
J04 J04MAXL5 N 6 2 N Measurement for AXLe 5 Same answers as for Measurement for AXLe 1
J04 J04MAXL6 N 6 2 N Measurement for AXLe 6 Same answers as for Measurement for AXLe 1
J04 J04MAXL7 N 6 2 N Measurement for AXLe 7 Same answers as for Measurement for AXLe 1
Interprovincial Roadside Truck Survey Technical Appendices 50
J04
Reference Questishyonnaire J04
J04
J04
J04
J04
J04MBB
Name
J04MAXL8
J04MAXL9
J04MAXL10
J04MAXL11
J04MAXL12
N 6 2 N
Answer Output Database Fields Field
Type Length Decimals Index N 6 2 N
N 6 2 N
N 6 2 N
N 6 2 N
N 6 2 N
Measurement for Back Bumper -- Reading on the measuring tape for the location of the back bumper 0 = not applicable (see status field) something = reading on tape Note Units of measurement are defined in field J04MU
Information
Measurement for AXLe 8 Same answers as for Measurement for AXLe 1 Measurement for AXLe 9 Same answers as for Measurement for AXLe 1 Measurement for AXLe 10 Same answers as for Measurement for AXLe 1 Measurement for AXLe 11 Same answers as for Measurement for AXLe 1 Measurement for AXLe 12 Same answers as for Measurement for AXLe 1
J05 J05MU C 1 0 N Measurement Units -- Units in which the truck length is measured M = Metres F = Feetinches (digits before the decimal point are feet digits after the decimal point are inches) X = not applicable (no measurements)
J06
K K01 K02
J06WEICHES
Early Interview Termination Section
C 1 0 N WEIght CHEck Status -- Whether the check of truck weight against the minimum and maximum criteria for that configuration is active Y = Yes N = No blank = not applicable Note ldquoNot applicablerdquo because the question was not asked before being added to the questionnaire software
See Software Internal Fields section of table See Software Internal Fields section of table
Interprovincial Roadside Truck Survey Technical Appendices 51
Appendix B Heavy Truck Classification System
Interprovincial Roadside Truck Survey Technical Appendices 52
Truck ID Truck Description
1 Tow truck with 2 axles
2 Tow truck with 3 or more axles
3 frac34 or 1 ton pick-up truck with 2 axles
4 Single unit with 2 axles Cube van step van small dump trucks Some types include soft drink companies cabs without trailers amp flatshybed tow trucks
5 Single unit with 3 axles Includes dump trucks cabs without trailers garbage trucks flat-bed trucks with hydraulic arms
6 Single unit truck with 4 or more axles
7 Single unit truck with ldquopuprdquo Usually a 3 or 4 axle truck pulling a 2 or 3 axle pup Also includes some single flat-beds with attached trailer
8 Single trailer with 4 or less axles
9 Single trailer with 5 axles
10 Single trailer with 6 or more axles
11 Multi-trailer with 5 or less axles
12 Multi-trailer with 6 axles
13 Multi-trailer with 7 or more axles
14 Other truck style If a particular heavy truck does not fit any of the above-noted configurations indicate by 14 on your field sheet
Note This truck classification system was used by the former Regional Municipality of Ottawa-Carleton and is consistent with that used in the Outaouais Region
Interprovincial Roadside Truck Survey Technical Appendices 53
Appendix C Summary of Historical Ottawa River Crossing Truck Traffic Volumes
Interprovincial Roadside Truck Survey Technical Appendices 54
Interprovincial Roadside Truck Survey Technical Appendices 55
Heavy Trucks on the Macdonald-Cartier Bridge HEAVY_TRUCKS_Southbound (12H) (24H) HEAVY_TRUCKS_Northbound (12H) (24H) List of count dates
YEAR 2A 3A TT Southbound Southbound 2A 3A TT Northbound Northbound Year Date Day 1991 1071 1360 1083 1375 1991 22 May Wednesday 1992 1133 1439 1017 1292 1992 23 June Tuesday 1993 1004 1275 887 1126 1993 16 June Wednesday 1994 890 1130 1024 1300 1994 21 June Tuesday 1995 848 1077 730 927 1995 22 June Thursday 1996 806 1024 826 1049 1996 4 June Tuesday 1997 981 1246 887 1126 1997 4 June Wednesday 1998 823 1045 920 1169 1998 2 June Tuesday 1999 872 1107 940 1194 1999 2 June Wednesday
1999 323 173 295 791 1005 354 177 315 846 1075 2000 1 June Thursday 2000 988 1255 980 1245
2000 409 268 339 1016 1290 398 268 346 1012 1285
Heavy Trucks on the Chaudiegravere Bridge HEAVY_TRUCKS_Southbound (12H) (24H) HEAVY_TRUCKS_Northbound (12H) (24H) List of count dates
YEAR 2A 3A TT Southbound Southbound 2A 3A TT Northbound Northbound Year Date Day 1991 382 485 423 537 1991 22 May Wednesday 1992 456 579 474 602 1992 23 June Tuesday 1993 335 425 403 512 1993 16 June Wednesday 1994 311 395 339 431 1994 21 June Tuesday 1995 356 452 396 503 1995 22 June Thursday 1996 303 385 336 427 1996 4 June Tuesday 1997 317 403 381 484 1997 3 June Tuesday 1998 236 300 299 380 1998 2 June Tuesday 1999 329 418 405 514 1999 2 June Wednesday
1999 177 87 47 311 395 209 102 51 362 460 2000 1 June Thursday
2000 304 386 355 451 2000 193 71 59 323 410 217 87 59 362 460
Heavy Trucks on the Macdonald-Cartier and Chaudiegravere bridges HEAVY_TRUCKS_Southbound (12H) (24H) HEAVY_TRUCKS_Northbound (12H) (24H)
YEAR 2A 3A TT Southbound Southbound 2A 3A TT Northbound Northbound
1991 1453 1845 1506 1913 1992 1589 2018 1491 1894 1993 1339 1701 1290 1638 1994 1201 1525 1363 1731 1995 1204 1529 1126 1430 1996 1109 1409 1162 1475 1997 1298 1649 1268 1610 1998 1059 1345 1219 1548 1999 1201 1525 1345 1708
1999 500 260 343 1102 1400 563 280 366 1209 1535 2000 1292 1641 1335 1695
2000 602 339 398 1339 1700 614 354 406 1374 1745
Heavy Trucks on the all 5 bridges HEAVY_TRUCKS_Southbound (12H) HEAVY_TRUCKS_Northbound (12H)
YEAR 2A 3A TT Southbound 2A 3A TT Northbound
1991 1681 1741 1992 1771 1834 1993 1514 1522 1994 1473 1636 1995 1346 1366 1996 1252 1300 1997 1444 1440 1998 1195 1369 1999 1347 1486 2000 1411 1456
Source of data Annual Classification and Occupancy Counts Number of vehicles factored to 12 hours from 8 hour counts Roadside Truck Survey Data
Appendix D Time Period Relationships
Interprovincial Roadside Truck Survey Technical Appendices 56
TIME PERIOD RELATIONSHIPS FOR ALL VEHICLES RELATIONSHIP DIRECTION OF TRAVEL-MORNING DIRECTION OF TRAVEL-AFTERNOON BRDIGE NORTHBOUND SOUTHBOUND BOTH NBampSB NORTHBOUND SOUTHBOUND BOTH NBampSB
Peak HourPeak Period Macdonald-Cartier Chaudiegravere
43-47 43-48
47-52 43-52
46-50 43-49
44-47 41-48
42-46 39-46
43-46 40-47
Peak Hour12 Hours Macdonald-Cartier Chaudiegravere
6-8 9-11
16-19 13-18
11-13 11-14
17-19 13-16
8-9 7-11
12-14 1013
Peak Hour24 Hours Macdonald-Cartier Chaudiegravere
5 6-8
11-14 10-13
8-10 8-10
12-14 9-11
5-6 5-8
9-10 7-10
TIME PERIOD RELATIONSHIPS FOR TRUCKS RELATIONSHIP BRDIGE
DIRECTION OF TRAVEL-MORNING DIRECTION OF TRAVEL-AFTERNOON NORTHBOUND SOUTHBOUND BOTH NBampSB NORTHBOUND SOUTHBOUND BOTH NBampSB
Peak HourPeak Period Macdonald-Cartier Chaudiegravere
37-47 33-53
35-67 34-46
36-58 34-47
33-48 31-52
38-53 33-51
39-48 36-51
Peak Hour12 Hours Macdonald-Cartier Chaudiegravere
8-12 7-14
7-18 7-12
8-14 7-12
7-10 5-11
5-11 4-10
7-10 5-11
Peak Hour24 Hours Macdonald-Cartier Chaudiegravere
6-10 5-11
6-14 6-10
6-11 6-9
5-8 4-9
4-9 3-8
5-7 4-8
Interprovincial Roadside Truck Survey Technical Appendices 57
Appendix E Traffic Zones Comprising the Districts
Interprovincial Roadside Truck Survey Technical Appendices 58
LIST OF TRAFFIC ZONES BY DISTRICT DISTRICT TRAFFIC ZONES
1 Ottawa Central 1 2 3 4 5 6 7 8 9 10 11 12 13 14 15 16 17 18 19 20 21 22 23 24 25 201
2 IGB West
26 27 28 29 30 31 32 33 34 35 36 37 38 39 40 41 42 43 44 45 57 58 59 60 61 62 63 64 65 66 67 120
3 Ottawa West
46 47 48 49 50 51 52 53 54 55 56 121 122 123 124 125 126 127
128 129 130 131 132 133 134 135 136 137 138 190 191 192 193 194 195 206 207 208 209 210 211 212 213 214 215 216 217 218 219 220 221 222 223 224 225 226
4 Ottawa South
68 69 70 71 72 73 74 75 76 77 78 79 80 84 85 87 111 112 113 114 115 116 117 118 119 139 140 196 197 200 205 227 228 229 230 231 232 233
5 IGB East
81 82 83 86 88 89 90 91 92 93 94 95 96 97 98 99 100 101
102 103 104 105 106 107 108 109 110 234
6 Ottawa East 141 142 143 144 145 189 198 199 202 203 204 235 236 237 238 239 240 241 242 243 244 245 246 247
7 Hull 151 152 153 154 155 156 157 158 159 160 161 162 163 164 184 254 255
8 Aylmer 146 147 148 149 150 182 183 186 187 256 257 258
9 Gatineau West 165 166 167 168 169 170 177 185 252 253
10 Gatineau East 171 172 173 174 175 176 178 179 180 181 188 248 249 250 251
IGB - Inside Green Belt
Interprovincial Roadside Truck Survey Technical Appendices 59
Inte
rpro
vinc
ial R
oads
ide
Truc
k Su
rvey
T
echn
ical
App
endi
ces
60
Appendix F District Comparisons of Trucks by Number
Interprovincial Roadside Truck Survey Technical Appendices 61
Interprovincial Roadside Truck Survey Technical Appendices 62
TOTAL NUMBER OF ALL TRUCKS (12 HOURS_DAY)
ZONE GROUP O 1-O
ttaw
a C
ente
r
2-IG
B W
est
3-O
ttaw
a W
est
4-O
ttaw
a So
uth
5-IG
B-E
ast
6-O
ttaw
a E
ast
7-H
ull
8-A
ylm
er
9-G
atin
eau
Wes
t
10-G
atin
eau
Eas
t
TO
TA
L
1-Ottawa Center 3 13 3 50 13 49 5 137 2-IGB West 86 31 20 16 153 3-Ottawa West 4 6 72 45 21 54 201 4-Ottawa South 4 143 28 49 223 5-IGB-East 11 6 178 50 109 89 444 6-Ottawa East 7 11 22 22 19 92 42 13 80 308 7-Hull 69 63 100 50 159 48 490 8-Aylmer 77 81 33 35 32 11 269 9-Gatineau West 72 18 16 66 77 29 277 10-Gatineau East 11 3 45 65 63 15 6 208 TOTAL 244 172 208 251 356 138 620 208 212 300 2709 IGB-Inside Green Belt
TOTAL NUMBER OF 2A TRUCKS (12 HOURS_DAY)
ZONE GROUP O 1-O
ttaw
a C
ente
r
2-IG
B W
est
3-O
ttaw
a W
est
4-O
ttaw
a So
uth
5-IG
B-E
ast
6-O
ttaw
a E
ast
7-H
ull
8-A
ylm
er
9-G
atin
eau
Wes
t
10-G
atin
eau
Eas
t
TO
TA
L
1-Ottawa Center 31 13 18 5 66 2-IGB-West 38 15 10 64 3-Ottawa West 33 5 5 43 4-Ottawa South 51 18 23 92 5-IGB-East 5 120 28 59 51 263 6-Ottawa East 22 13 56 13 13 38 155 7-Hull 53 49 51 40 81 22 296 8-Aylmer 13 6 24 6 18 11 78 9-Gatineau West 24 18 11 18 29 29 127 10-Gatineau East 6 11 18 40 75 TOTAL 100 73 97 81 190 75 329 92 105 117 1260
TOTAL NUMBER OF 3A+ TRUCKS (12 HOURS_DAY)
ZONE GROUP O 1-O
ttaw
a C
ente
r
2-IG
B W
est
3-O
ttaw
a W
est
4-O
ttaw
a So
uth
5-IG
B-E
ast
6-O
ttaw
a E
ast
7-H
ull
8-A
ylm
er
9-G
atin
eau
Wes
t
10-G
atin
eau
Eas
t
TO
TA
L
1-Ottawa Center 12 31 44 2-IGB-West 38 12 6 6 62 3-Ottawa West 22 16 16 16 69 4-Ottawa South 79 6 85 5-IGB-East 6 18 16 44 31 115 6-Ottawa East 6 16 22 7-Hull 9 14 5 48 76 8-Aylmer 58 58 9 124 9-Gatineau West 48 5 48 48 149 10-Gatineau East 5 5 5 14 TOTAL 126 72 23 48 101 175 50 97 69 761
TOTAL NUMBER OF TRACTOR TRAILERS (12 HOURS_DAY)
ZONE GROUP O 1-O
ttaw
a C
ente
r
2-IG
B W
est
3-O
ttaw
a W
est
4-O
ttaw
a So
uth
5-IG
B-E
ast
6-O
ttaw
a E
ast
7-H
ull
8-A
ylm
er
9-G
atin
eau
Wes
t
10-G
atin
eau
Eas
t
TO
TA
L
1-Ottawa Center 3 13 3 7 26 2-IGB-West 10 4 4 10 27 3-Ottawa West 4 6 16 24 39 89 4-Ottawa South 4 13 4 26 46 5-IGB-East 6 39 6 6 6 65 6-Ottawa East 7 11 22 6 29 29 26 131 7-Hull 7 44 11 30 25 117 8-Aylmer 6 17 29 15 67 9-Gatineau West 10-Gatineau East 3 30 47 18 15 6 119 TOTAL 17 28 88 122 65 63 115 67 10 113 688
Interprovincial Roadside Truck Survey Technical Appendices 63
TOTAL NUMBER OF ALL TRUCKS (12 HOURS_NIGHT)
ZONE GROUP O 1-O
ttaw
a C
ente
r
2-IG
B W
est
3-O
ttaw
a W
est
4-O
ttaw
a So
uth
5-IG
B-E
ast
6-O
ttaw
a E
ast
7-H
ull
8-A
ylm
er
9-G
atin
eau
Wes
t
10-G
atin
eau
Eas
t
TO
TA
L
1-Ottawa Center 1 1 3 6 2-IGB West 14 5 1 12 31 3-Ottawa West 32 16 20 68 4-Ottawa South 12 7 4 48 71 5-IGB-East 8 31 23 11 26 99 6-Ottawa East 1 6 3 34 8 16 19 86 7-Hull 27 6 23 13 54 3 125 8-Aylmer 3 7 13 33 45 100 9-Gatineau West 3 4 27 15 15 3 67 10-Gatineau East 4 3 6 59 3 12 87 TOTAL 11 41 53 136 34 121 126 61 32 125 741 IGB-Inside Green Belt
TOTAL NUMBER OF 2A TRUCKS (12 HOURS_NIGHT)
ZONE GROUP O 1-O
ttaw
a C
ente
r
2-IG
B W
est
3-O
ttaw
a W
est
4-O
ttaw
a So
uth
5-IG
B-E
ast
6-O
ttaw
a E
ast
7-H
ull
8-A
ylm
er
9-G
atin
eau
Wes
t
10-G
atin
eau
Eas
t
TO
TA
L
1-Ottawa Center 3 3 2-IGB West 3 3 3-Ottawa West 3 12 15 4-Ottawa South 12 6 12 30 5-IGB-East 3 18 15 36 6-Ottawa East 6 12 15 33 7-Hull 15 18 7 30 70 8-Aylmer 7 3 15 7 32 9-Gatineau West 24 15 15 54 10-Gatineau East 3 15 18 TOTAL 22 30 63 22 37 29 23 12 54 293
TOTAL NUMBER OF 3A+ TRUCKS (12 HOURS_NIGHT)
ZONE GROUP O 1-O
ttaw
a C
ente
r
2-IG
B W
est
3-O
ttaw
a W
est
4-O
ttaw
a So
uth
5-IG
B-E
ast
6-O
ttaw
a E
ast
7-H
ull
8-A
ylm
er
9-G
atin
eau
Wes
t
10-G
atin
eau
Eas
t
TO
TA
L
1-Ottawa Center 2-IGB West 11 11 3-Ottawa West 8 8 4-Ottawa South 5-IGB-East 8 8 8 8 30 6-Ottawa East 7-Hull 3 3 6 8-Aylmer 3 3 26 32 9-Gatineau West 10-Gatineau East 3 26 29 TOTAL 6 3 3 26 37 19 8 8 8 117
TOTAL NUMBER OF TRACTOR TRAILERS (12 HOURS_NIGHT)
ZONE GROUP O 1-O
ttaw
a C
ente
r
2-IG
B W
est
3-O
ttaw
a W
est
4-O
ttaw
a So
uth
5-IG
B-E
ast
6-O
ttaw
a E
ast
7-H
ull
8-A
ylm
er
9-G
atin
eau
Wes
t
10-G
atin
eau
Eas
t
TO
TA
L
1-Ottawa Center 1 1 3 2-IGB West 5 1 12 18 3-Ottawa West 29 9 8 46 4-Ottawa South 1 4 36 41 5-IGB-East 20 5 4 4 33 6-Ottawa East 1 6 3 28 8 4 4 54 7-Hull 9 6 4 6 21 3 49 8-Aylmer 6 18 12 36 9-Gatineau West 3 4 3 3 13 10-Gatineau East 1 3 3 18 3 12 40 TOTAL 5 16 19 47 12 48 78 30 13 63 331
TOTAL NUMBER OF ALL TRUCKS (12 HOURS_DAY+12 HOURS_NIGHT)
ZONE GROUP O 1-O
ttaw
a C
ente
r
2-IG
B W
est
3-O
ttaw
a W
est
4-O
ttaw
a So
uth
5-IG
B-E
ast
6-O
ttaw
a E
ast
7-H
ull
8-A
ylm
er
9-G
atin
eau
Wes
t
10-G
atin
eau
Eas
t
TO
TA
L
1-Ottawa Center 5 14 3 53 13 49 5 142 2-IGB West 100 36 21 28 185 3-Ottawa West 4 6 104 61 21 74 270 4-Ottawa South 4 155 34 4 97 293 5-IGB-East 11 14 209 73 120 115 543 6-Ottawa East 1 7 11 28 25 19 126 50 29 99 395 7-Hull 69 90 106 73 172 102 3 615 8-Aylmer 80 88 46 68 32 56 369 9-Gatineau West 75 22 42 81 92 32 344 10-Gatineau East 15 6 52 124 66 27 6 295 TOTAL 255 213 261 387 390 259 745 270 244 425 3450 IGB-Inside Green Belt
TOTAL NUMBER OF 2A TRUCKS (12 HOURS_DAY+12 HOURS_NIGHT)
ZONE GROUP O 1-O
ttaw
a C
ente
r
2-IG
B W
est
3-O
ttaw
a W
est
4-O
ttaw
a So
uth
5-IG
B-E
ast
6-O
ttaw
a E
ast
7-H
ull
8-A
ylm
er
9-G
atin
eau
Wes
t
10-G
atin
eau
Eas
t
TO
TA
L
1-Ottawa Center 33 13 18 5 69 2-IGB West 41 15 10 67 3-Ottawa West 36 5 5 12 58 4-Ottawa South 63 24 35 122 5-IGB-East 5 123 46 59 66 298 6-Ottawa East 22 13 62 13 25 53 188 7-Hull 53 64 51 58 88 52 366 8-Aylmer 13 13 27 21 18 18 110 9-Gatineau West 24 18 35 33 44 29 181 10-Gatineau East 6 15 33 40 93 TOTAL 100 95 128 145 212 112 358 115 117 172 1553
TOTAL NUMBER OF 3A+ TRUCKS (12 HOURS_DAY+12 HOURS_NIGHT)
ZONE GROUP O 1-O
ttaw
a C
ente
r
2-IG
B W
est
3-O
ttaw
a W
est
4-O
ttaw
a So
uth
5-IG
B-E
ast
6-O
ttaw
a E
ast
7-H
ull
8-A
ylm
er
9-G
atin
eau
Wes
t
10-G
atin
eau
Eas
t
TO
TA
L
1-Ottawa Center 12 31 44 2-IGB West 49 12 6 6 73 3-Ottawa West 22 23 16 16 77 4-Ottawa South 79 6 85 5-IGB-East 6 8 26 16 51 39 146 6-Ottawa East 6 16 22 7-Hull 9 17 5 48 3 83 8-Aylmer 61 58 13 26 157 9-Gatineau West 48 5 48 48 149 10-Gatineau East 8 5 26 5 43 TOTAL 132 75 27 74 101 37 193 57 105 77 878
TOTAL NUMBER OF TRACTOR TRAILERS (12 HOURS_DAY+12 HOURS_NIGHT)
ZONE GROUP O 1-O
ttaw
a C
ente
r
2-IG
B W
est
3-O
ttaw
a W
est
4-O
ttaw
a So
uth
5-IG
B-E
ast
6-O
ttaw
a E
ast
7-H
ull
8-A
ylm
er
9-G
atin
eau
Wes
t
10-G
atin
eau
Eas
t
TO
TA
L
1-Ottawa Center 5 14 3 7 29 2-IGB West 10 8 5 22 45 3-Ottawa West 4 6 46 32 46 135 4-Ottawa South 4 13 5 4 62 87 5-IGB-East 6 60 11 10 10 98 6-Ottawa East 1 7 11 28 3 6 58 37 4 30 185 7-Hull 7 9 50 15 35 46 3 166 8-Aylmer 6 17 6 46 15 12 102 9-Gatineau West 3 4 3 3 13 10-Gatineau East 1 6 32 65 21 27 6 159 TOTAL 22 44 107 169 77 111 193 97 23 176 1019
Interprovincial Roadside Truck Survey Technical Appendices 64
TOTAL NUMBER OF ALL TRUCKS (24 HOURS)
ZONE GROUP O 1-O
ttaw
a C
ente
r
2-IG
B W
est
3-O
ttaw
a W
est
4-O
ttaw
a So
uth
5-IG
B-E
ast
6-O
ttaw
a E
ast
7-H
ull
8-A
ylm
er
9-G
atin
eau
Wes
t
10-G
atin
eau
Eas
t
TO
TA
L
1-Ottawa Center 5 13 3 50 13 45 5 134 2-IGB West 89 37 21 29 176 3-Ottawa West 3 5 110 63 19 68 268 4-Ottawa South 3 142 38 5 104 291 5-IGB-East 11 19 213 75 122 120 561 6-Ottawa East 3 5 8 25 29 18 133 46 30 95 391 7-Hull 65 88 98 73 164 105 5 599 8-Aylmer 71 80 51 68 27 85 383 9-Gatineau West 70 25 59 72 84 34 343 10-Gatineau East 17 8 47 135 63 30 5 304 TOTAL 240 206 267 386 370 299 737 277 242 426 3450 IGB-Inside Green Belt
TOTAL NUMBER OF 2A TRUCKS (24 HOURS)
ZONE GROUP O 1-O
ttaw
a C
ente
r
2-IG
B W
est
3-O
ttaw
a W
est
4-O
ttaw
a So
uth
5-IG
B-E
ast
6-O
ttaw
a E
ast
7-H
ull
8-A
ylm
er
9-G
atin
eau
Wes
t
10-G
atin
eau
Eas
t
TO
TA
L
1-Ottawa Center 33 13 17 5 67 2-IGB West 41 14 9 64 3-Ottawa West 36 5 5 13 58 4-Ottawa South 61 27 35 122 5-IGB-East 5 121 49 57 68 299 6-Ottawa East 24 13 65 13 25 55 194 7-Hull 52 56 53 58 91 48 357 8-Aylmer 11 16 28 17 17 23 111 9-Gatineau West 23 17 49 29 41 29 188 10-Gatineau East 5 17 29 41 93 TOTAL 95 89 147 134 214 112 356 119 113 175 1553
TOTAL NUMBER OF 3A+ TRUCKS (24 HOURS)
ZONE GROUP O 1-O
ttaw
a C
ente
r
2-IG
B W
est
3-O
ttaw
a W
est
4-O
ttaw
a So
uth
5-IG
B-E
ast
6-O
ttaw
a E
ast
7-H
ull
8-A
ylm
er
9-G
atin
eau
Wes
t
10-G
atin
eau
Eas
t
TO
TA
L
1-Ottawa Center 13 28 41 2-IGB West 41 13 6 6 67 3-Ottawa West 20 28 14 14 77 4-Ottawa South 70 6 77 5-IGB-East 6 14 33 14 55 42 165 6-Ottawa East 6 14 20 7-Hull 9 17 4 43 4 77 8-Aylmer 56 51 13 43 163 9-Gatineau West 43 4 43 43 132 10-Gatineau East 9 4 43 4 60 TOTAL 122 69 26 85 90 61 184 61 103 77 878
TOTAL NUMBER OF TRACTOR TRAILERS (24 HOURS)
ZONE GROUP O 1-O
ttaw
a C
ente
r
2-IG
B W
est
3-O
ttaw
a W
est
4-O
ttaw
a So
uth
5-IG
B-E
ast
6-O
ttaw
a E
ast
7-H
ull
8-A
ylm
er
9-G
atin
eau
Wes
t
10-G
atin
eau
Eas
t
TO
TA
L
1-Ottawa Center 5 13 3 5 26 2-IGB West 8 10 5 23 46 3-Ottawa West 3 5 54 31 41 133 4-Ottawa South 3 10 5 5 69 92 5-IGB-East 5 59 13 10 10 97 6-Ottawa East 3 5 8 25 5 5 62 33 5 26 176 7-Hull 5 15 40 15 30 53 5 164 8-Aylmer 5 13 10 51 10 20 109 9-Gatineau West 5 8 5 5 23 10-Gatineau East 3 8 25 63 18 30 5 152 TOTAL 23 48 94 167 66 127 197 97 26 175 1019
Interprovincial Roadside Truck Survey Technical Appendices 65
DIFFERENCE BETWEEN TOTAL NUMBERS OF ALL TRUCKS [(12 HOURS_DAY+12 HOURS_NIGHT)-24 HOURS]
ZONE GROUP O 1-O
ttaw
a C
ente
r
2-IG
B W
est
3-O
ttaw
a W
est
4-O
ttaw
a So
uth
5-IG
B-E
ast
6-O
ttaw
a E
ast
7-H
ull
8-A
ylm
er
9-G
atin
eau
Wes
t
10-G
atin
eau
Eas
t
TO
TA
L
1-Ottawa Center -1 1 1 3 0 4 0 8 2-IGB West 11 -1 0 -2 8 3-Ottawa West 1 1 -7 -2 2 7 2 4-Ottawa South 1 13 -4 -1 -7 2 5-IGB-East 0 -5 -5 -2 -1 -5 -18 6-Ottawa East -2 2 3 3 -3 1 -7 4 -2 4 4 7-Hull 4 2 8 0 7 -3 -2 16 8-Aylmer 8 8 -5 0 5 -29 -14 9-Gatineau West 5 -3 -16 9 8 -2 1 10-Gatineau East -1 -1 5 -11 2 -4 1 -9 TOTAL 16 7 -5 1 20 -40 8 -8 2 -2 0 IGB-Inside Green Belt
DIFFERENCE BETWEEN TOTAL NUMBERS OF 2A TRUCKS [(12 HOURS_DAY+12 HOURS_NIGHT)-24 HOURS]
ZONE GROUP O 1-O
ttaw
a C
ente
r
2-IG
B W
est
3-O
ttaw
a W
est
4-O
ttaw
a So
uth
5-IG
B-E
ast
6-O
ttaw
a E
ast
7-H
ull
8-A
ylm
er
9-G
atin
eau
Wes
t
10-G
atin
eau
Eas
t
TO
TA
L
1-Ottawa Center 1 0 1 0 2 2-IGB West 1 1 1 3 3-Ottawa West 0 0 0 -1 1 4-Ottawa South 2 -3 1 -1 5-IGB-East 0 2 -3 2 -2 0 6-Ottawa East -1 0 -3 0 0 -2 -6 7-Hull 1 8 -2 0 -3 5 9 8-Aylmer 2 -3 -1 4 0 -5 -2 9-Gatineau West 1 0 -14 3 3 0 -7 10-Gatineau East 1 -3 3 -1 1 TOTAL 6 6 -19 11 -3 0 3 -4 4 -3 0
DIFFERENCE BETWEEN TOTAL NUMBERS OF 3A+ TRUCKS [(12 HOURS_DAY+12 HOURS_NIGHT)-24 HOURS]
ZONE GROUP O 1-O
ttaw
a C
ente
r
2-IG
B W
est
3-O
ttaw
a W
est
4-O
ttaw
a So
uth
5-IG
B-E
ast
6-O
ttaw
a E
ast
7-H
ull
8-A
ylm
er
9-G
atin
eau
Wes
t
10-G
atin
eau
Eas
t
TO
TA
L
1-Ottawa Center -1 3 3 2-IGB West 8 -1 0 0 7 3-Ottawa West 1 -5 2 2 0 4-Ottawa South 8 0 8 5-IGB-East 0 -6 -7 2 -4 -3 -19 6-Ottawa East 0 2 1 7-Hull 1 0 0 6 -1 5 8-Aylmer 5 6 0 -17 -6 9-Gatineau West 6 0 6 6 17 10-Gatineau East -1 0 -17 0 -17 TOTAL 10 6 1 -11 11 -24 9 -4 1 0 0
DIFFERENCE BETWEEN TOTAL NUMBERS OF TRACTOR TRAILERS [(12 HOURS_DAY+12 HOURS_NIGHT)-24 HOURS]
ZONE GROUP O 1-O
ttaw
a C
ente
r
2-IG
B W
est
3-O
ttaw
a W
est
4-O
ttaw
a So
uth
5-IG
B-E
ast
6-O
ttaw
a E
ast
7-H
ull
8-A
ylm
er
9-G
atin
eau
Wes
t
10-G
atin
eau
Eas
t
TO
TA
L
1-Ottawa Center -1 1 1 2 4 2-IGB West 2 -2 0 -1 -1 3-Ottawa West 1 1 -8 2 5 1 4-Ottawa South 1 3 0 -1 -8 -6 5-IGB-East 1 1 -1 0 0 1 6-Ottawa East -2 2 3 3 -2 1 -4 4 -1 4 8 7-Hull 2 -7 10 0 5 -7 -2 2 8-Aylmer 1 4 -4 -4 5 -8 -7 9-Gatineau West -2 -3 -2 -2 -9
10-Gatineau East -2 -1 7 2 3 -4 1 7 TOTAL 0 -5 13 1 12 -16 -4 0 -3 2 0
Interprovincial Roadside Truck Survey Technical Appendices 66
Interprovincial Roadside Truck Survey Technical Appendices 67
ABSOLUTE DIFFERENCE BETWEEN TOTAL NUMBERS OF ALL TRUCKS [(12H_DAY+12H_NIGHT)-24H]
ZONE GROUP O 1-O
ttaw
a C
ente
r
2-IG
B W
est
3-O
ttaw
a W
est
4-O
ttaw
a So
uth
5-IG
B-E
ast
6-O
ttaw
a E
ast
7-H
ull
8-A
ylm
er
9-G
atin
eau
Wes
t
10-G
atin
eau
Eas
t
TO
TA
L (
AB
S)
1-Ottawa Center -1 1 1 3 0 4 0 10 2-IGB West 11 -1 0 -2 13 3-Ottawa West 1 1 -7 -2 2 7 20 4-Ottawa South 1 13 -4 -1 -7 26 5-IGB-East 0 -5 -5 -2 -1 -5 19 6-Ottawa East -2 2 3 3 -3 1 -7 4 -2 4 31 7-Hull 4 2 8 0 7 -3 -2 27 8-Aylmer 8 8 -5 0 5 -29 56 9-Gatineau West 5 -3 -16 9 8 -2 43 10-Gatineau East -1 -1 5 -11 2 -4 1 26 TOTAL (ABS) 21 16 38 25 27 48 45 16 11 26 272 IGB-Inside Green Belt
ABSOLUTE DIFFERENCE BETWEEN TOTAL NUMBERS OF 2A TRUCKS [(12H_DAY+12H_NIGHT)-24H]
ZONE GROUP O 1-O
ttaw
a C
ente
r
2-IG
B W
est
3-O
ttaw
a W
est
4-O
ttaw
a So
uth
5-IG
B-E
ast
6-O
ttaw
a E
ast
7-H
ull
8-A
ylm
er
9-G
atin
eau
Wes
t
10-G
atin
eau
Eas
t
TO
TA
L (
AB
S)
1-Ottawa Center 1 0 1 0 2 2-IGB West 1 1 1 3 3-Ottawa West 0 0 0 -1 2 4-Ottawa South 2 -3 1 6 5-IGB-East 0 2 -3 2 -2 9 6-Ottawa East -1 0 -3 0 0 -2 7 7-Hull 1 8 -2 0 -3 5 19 8-Aylmer 2 -3 -1 4 0 -5 15 9-Gatineau West 1 0 -14 3 3 0 22 10-Gatineau East 1 -3 3 -1 8 TOTAL (ABS) 6 12 19 11 9 10 8 8 5 5 92
ABSOLUTE DIFFERENCE BETWEEN TOTAL NUMBERS OF 3A+ TRUCKS [(12H_DAY+12H_NIGHT)-24H]
ZONE GROUP O 1-O
ttaw
a C
ente
r
2-IG
B W
est
3-O
ttaw
a W
est
4-O
ttaw
a So
uth
5-IG
B-E
ast
6-O
ttaw
a E
ast
7-H
ull
8-A
ylm
er
9-G
atin
eau
Wes
t
10-G
atin
eau
Eas
t
TO
TA
L (
AB
S)
1-Ottawa Center -1 3 4 2-IGB West 8 -1 0 0 9 3-Ottawa West 1 -5 2 2 10 4-Ottawa South 8 0 9 5-IGB-East 0 -6 -7 2 -4 -3 22 6-Ottawa East 0 2 2 7-Hull 1 0 0 6 -1 8 8-Aylmer 5 6 0 -17 28 9-Gatineau West 6 0 6 6 17 10-Gatineau East -1 0 -17 0 18 TOTAL (ABS) 12 6 1 22 11 24 26 7 9 7 127
ABSOLUTE DIFFERENCE BETWEEN TOTAL NUMBERS OF TRACTOR TRAILERS [(12H_DAY+12H_NIGHT)-24H]
ZONE GROUP O 1-O
ttaw
a C
ente
r
2-IG
B W
est
3-O
ttaw
a W
est
4-O
ttaw
a So
uth
5-IG
B-E
ast
6-O
ttaw
a E
ast
7-H
ull
8-A
ylm
er
9-G
atin
eau
Wes
t
10-G
atin
eau
Eas
t
TO
TA
L (
AB
S)
1-Ottawa Center -1 1 1 2 5 2-IGB West 2 -2 0 -1 6 3-Ottawa West 1 1 -8 2 5 18 4-Ottawa South 1 3 0 -1 -8 13 5-IGB-East 1 1 -1 0 0 4 6-Ottawa East -2 2 3 3 -2 1 -4 4 -1 4 26 7-Hull 2 -7 10 0 5 -7 -2 33 8-Aylmer 1 4 -4 -4 5 -8 27 9-Gatineau West -2 -3 -2 -2 9 10-Gatineau East -2 -1 7 2 3 -4 1 20 TOTAL (ABS) 10 18 27 11 16 26 20 11 3 20 161
Interprovincial Roadside Truck Survey Technical Appendices 68
COMPARISON OF TOTAL NUMBER OF ALL TRUCKS FOR DIFFERENT PERIOD OF TIME
ZONE GROUP O 1-O
ttaw
a C
ente
r
2-IG
B W
est
3-O
ttaw
a W
est
4-O
ttaw
a So
uth
5-IG
B E
ast
6-O
ttaw
a E
ast
D N D+N 24H D N D+N 24H D N D+N 24H D N D+N 24H D N D+N 24H D N D+N 24H
1-Ottawa Center 3 1 5 5 13 1 14 13 3 3 3 2-IGB West 3-Ottawa West 4 4 3 6 6 5 4-Ottawa South 4 4 3 5-IGB East 11 11 11 6 8 14 19 6-Ottawa East 1 1 3 7 7 5 11 11 8 22 6 28 25 22 3 25 29 19 19 18 7-Hull 69 69 65 63 27 90 88 100 6 106 98 50 23 73 73 159 13 172 164 48 54 102 105 8-Aylmer 77 3 80 71 81 7 88 80 33 13 46 51 35 33 68 68 32 32 27 11 45 56 85 9-Gatineau West 72 3 75 70 18 4 22 25 16 27 42 59 66 15 81 72 77 15 92 84 29 3 32 34 10-Gatineau East 11 4 15 17 3 3 6 8 45 6 52 47 65 59 124 135 63 3 66 63 15 12 27 30 TOTAL 244 11 255 240 172 41 213 206 208 53 261 267 251 136 387 386 356 34 390 370 138 121 259 299
ZONE GROUP O 7-H
ull
8-A
ylm
er
9-G
atin
eau
Wes
t
10-G
atin
eau
Eas
t
TO
TA
L
D N D+N 24H D N D+N 24H D N D+N 24H D N D+N 24H D N D+N 24H 1-Ottawa Center 50 3 53 50 13 13 13 49 49 45 5 5 5 137 6 142 134 2-IGB West 86 14 100 89 31 5 36 37 20 1 21 21 16 12 28 29 153 31 185 176 3-Ottawa West 72 32 104 110 45 16 61 63 21 21 19 54 20 74 68 201 68 270 268 4-Ottawa South 143 12 155 142 28 7 34 38 4 4 5 49 48 97 104 223 71 293 291 5-IGB East 178 31 209 213 50 23 73 75 109 11 120 122 89 26 115 120 444 99 543 561 6-Ottawa East 92 34 126 133 42 8 50 46 13 16 29 30 80 19 99 95 308 86 395 391 7-Hull 3 3 5 490 125 615 599 8-Aylmer 269 100 369 383 9-Gatineau West 277 67 344 343 10-Gatineau East 6 6 5 208 87 295 304 TOTAL 620 126 745 737 208 61 270 277 212 32 244 242 300 125 425 426 2709 741 3450 3450 IGB-Inside Green Belt D - DAY (700 - 1700) N - NIGHT (1900 - 700) 24H - 24 HOUR PERIOD
COMPARISON OF TOTAL NUMBER OF 2A TRUCKS FOR DIFFERENT PERIOD OF TIME
ZONE GROUP O 1-O
ttaw
a C
ente
r
2-IG
B W
est
3-O
ttaw
a W
est
4-O
ttaw
a So
uth
5-IG
B E
ast
6-O
ttaw
a E
ast
D N D+N 24H D N D+N 24H D N D+N 24H D N D+N 24H D N D+N 24H D N D+N 24H
1-Ottawa Center 2-IGB West 3-Ottawa West 4-Ottawa South 5-IGB East 5 5 5 6-Ottawa East 22 22 24 13 13 13 7-Hull 53 53 52 49 15 64 56 51 51 53 40 18 58 58 81 7 88 91 22 30 52 48 8-Aylmer 13 13 11 6 7 13 16 24 3 27 28 6 15 21 17 18 18 17 11 7 18 23 9-Gatineau West 24 24 23 18 18 17 11 24 35 49 18 15 33 29 29 15 44 41 29 29 29 10-Gatineau East 6 6 5 11 3 15 17 18 15 33 29 40 40 41 TOTAL 100 100 95 73 22 95 89 97 30 128 147 81 63 145 134 190 22 212 214 75 37 112 112
ZONE GROUP O 7-H
ull
8-A
ylm
er
9-G
atin
eau
Wes
t
10-G
atin
eau
Eas
t
TO
TA
L
D N D+N 24H D N D+N 24H D N D+N 24H D N D+N 24H D N D+N 24H 1-Ottawa Center 31 3 33 33 13 13 13 18 18 17 5 5 5 66 3 69 67 2-IGB West 38 3 41 41 15 15 14 10 10 9 64 3 67 64 3-Ottawa West 33 3 36 36 5 5 5 5 5 5 12 12 13 43 15 58 58 4-Ottawa South 51 12 63 61 18 6 24 27 23 12 35 35 92 30 122 122 5-IGB East 120 3 123 121 28 18 46 49 59 59 57 51 15 66 68 263 36 298 299 6-Ottawa East 56 6 62 65 13 13 13 13 12 25 25 38 15 53 55 155 33 188 194 7-Hull 296 70 366 357 8-Aylmer 78 32 110 111 9-Gatineau West 127 54 181 188 10-Gatineau East 75 18 93 93 TOTAL 329 29 358 356 92 23 115 119 105 12 117 113 117 54 172 175 1260 293 1553 1553
COMPARISON OF TOTAL NUMBER OF 3A+ TRUCKS FOR DIFFERENT PERIOD OF TIME
ZONE GROUP O 1-O
ttaw
a C
ente
r
2-IG
B W
est
3-O
ttaw
a W
est
4-O
ttaw
a So
uth
5-IG
B E
ast
6-O
ttaw
a E
ast
D N D+N 24H D N D+N 24H D N D+N 24H D N D+N 24H D N D+N 24H D N D+N 24H 1-Ottawa Center 2-IGB West 3-Ottawa West 4-Ottawa South 5-IGB East 6 6 6 8 8 14 6-Ottawa East 7-Hull 9 9 9 14 3 17 17 5 5 4 48 48 43 3 3 4 8-Aylmer 58 3 61 56 58 58 51 9 3 13 13 26 26 43 9-Gatineau West 48 48 43 5 5 4 48 48 43 48 48 43 10-Gatineau East 5 3 8 9 5 5 4 26 26 43 5 5 4 TOTAL 126 6 132 122 72 3 75 69 23 3 27 26 48 26 74 85 101 101 90 37 37 61
ZONE GROUP O 7-H
ull
8-A
ylm
er
9-G
atin
eau
Wes
t
10-G
atin
eau
Eas
t
TO
TA
L
D N D+N 24H D N D+N 24H D N D+N 24H D N D+N 24H D N D+N 24H 1-Ottawa Center 12 12 13 31 31 28 44 44 41 2-IGB West 38 11 49 41 12 12 13 6 6 6 6 6 6 62 11 73 67 3-Ottawa West 22 22 20 16 8 23 28 16 16 14 16 16 14 69 8 77 77 4-Ottawa South 79 79 70 6 6 6 85 85 77 5-IGB East 18 8 26 33 16 16 14 44 8 51 55 31 8 39 42 115 30 146 165 6-Ottawa East 6 6 6 16 16 14 22 22 20 7-Hull 76 6 83 77 8-Aylmer 124 32 157 163 9-Gatineau West 149 149 132 10-Gatineau East 14 29 43 60 TOTAL 175 19 193 184 50 8 57 61 97 8 105 103 69 8 77 77 761 117 878 878
COMPARISON OF TOTAL NUMBER OF TRACTOR TRAILERS FOR DIFFERENT PERIOD OF TIME
ZONE GROUP O 1-O
ttaw
a C
ente
r
2-IG
B W
est
3-O
ttaw
a W
est
4-O
ttaw
a So
uth
5-IG
B E
ast
6-O
ttaw
a E
ast
D N D+N 24H D N D+N 24H D N D+N 24H D N D+N 24H D N D+N 24H D N D+N 24H 1-Ottawa Center 3 1 5 5 13 1 14 13 3 3 3 2-IGB West 3-Ottawa West 4 4 3 6 6 5 4-Ottawa South 4 4 3 5-IGB East 6 6 5 6-Ottawa East 1 1 3 7 7 5 11 11 8 22 6 28 25 3 3 5 6 6 5 7-Hull 7 7 5 9 9 15 44 6 50 40 11 4 15 15 30 6 35 30 25 21 46 53 8-Aylmer 6 6 5 17 17 13 6 6 10 29 18 46 51 15 15 10 12 12 20 9-Gatineau West 3 3 5 4 4 8 3 3 5 3 3 5 10-Gatineau East 1 1 3 3 3 6 8 30 3 32 25 47 18 65 63 18 3 21 18 15 12 27 30 TOTAL 17 5 22 23 28 16 44 48 88 19 107 94 122 47 169 167 65 12 77 66 63 48 111 127
ZONE GROUP O 7-H
ull
8-A
ylm
er
9-G
atin
eau
Wes
t
10-G
atin
eau
Eas
t
TO
TA
L
D N D+N 24H D N D+N 24H D N D+N 24H D N D+N 24H D N D+N 24H 1-Ottawa Center 7 7 5 26 3 29 26 2-IGB West 10 10 8 4 5 8 10 4 1 5 5 10 12 22 23 27 18 45 46 3-Ottawa West 16 29 46 54 24 9 32 31 39 8 46 41 89 46 135 133 4-Ottawa South 13 13 10 4 1 5 5 4 4 5 26 36 62 69 46 41 87 92 5-IGB East 39 20 60 59 6 5 11 13 6 4 10 10 6 4 10 10 65 33 98 97 6-Ottawa East 29 28 58 62 29 8 37 33 4 4 5 26 4 30 26 131 54 185 176 7-Hull 3 3 5 117 49 166 164 8-Aylmer 67 36 102 109 9-Gatineau West 13 13 23 10-Gatineau East 6 6 5 119 40 159 152 TOTAL 115 78 193 197 67 30 97 97 10 13 23 26 113 63 176 175 688 331 1019 1019
Interprovincial Roadside Truck Survey Technical Appendices 69
Appendix G District Comparisons of Trucks by Percent
Interprovincial Roadside Truck Survey Technical Appendices 70
Interprovincial Roadside Truck Survey Technical Appendices 71
COMPARISON OF PERCENTS OF ALL TRUCKS FOR DIFFERENT PERIOD OF TIME ()
ZONE GROUP O 1-O
ttaw
a C
ente
r
2-IG
B W
est
3-O
ttaw
a W
est
4-O
ttaw
a So
uth
5-IG
B E
ast
6-O
ttaw
a E
ast
D N D+N 24H D N D+N 24H D N D+N 24H D N D+N 24H D N D+N 24H D N D+N 24H
1-Ottawa Center 0 0 0 0 0 0 0 0 0 0 0 2-IGB West 3-Ottawa West 0 0 0 0 0 0 4-Ottawa South 0 0 0 5-IGB East 0 0 0 0 1 0 1 6-Ottawa East 0 0 0 0 0 0 0 0 0 1 1 1 1 1 0 1 1 1 1 1 7-Hull 3 2 2 2 4 3 3 4 1 3 3 2 3 2 2 6 2 5 5 2 7 3 3 8-Aylmer 3 0 2 2 3 1 3 2 1 2 1 1 1 4 2 2 1 1 1 0 6 2 2 9-Gatineau West 3 0 2 2 1 1 1 1 1 4 1 2 2 2 2 2 3 2 3 2 1 0 1 1 10-Gatineau East 0 1 0 0 0 0 0 0 2 1 1 1 2 8 4 4 2 0 2 2 1 2 1 1 TOTAL 9 2 7 7 6 6 6 6 8 7 8 8 9 18 11 11 13 5 11 11 5 16 8 9
ZONE GROUP O 7-H
ull
8-A
ylm
er
9-G
atin
eau
Wes
t
10-G
atin
eau
Eas
t
TO
TA
L
D N D+N 24H D N D+N 24H D N D+N 24H D N D+N 24H D N D+N 24H
1-Ottawa Center 2 0 2 1 0 0 0 2 1 1 0 0 0 5 1 4 4 2-IGB West 3 2 3 3 1 1 1 1 1 0 1 1 1 2 1 1 6 4 5 5 3-Ottawa West 3 4 3 3 2 2 2 2 1 1 1 2 3 2 2 7 9 8 8 4-Ottawa South 5 2 4 4 1 1 1 1 1 0 0 2 6 3 3 8 10 9 8 5-IGB East 7 4 6 6 2 3 2 2 4 2 3 4 3 4 3 3 16 13 16 16 6-Ottawa East 3 5 4 4 2 1 1 1 0 2 1 1 3 3 3 3 11 12 11 11 7-Hull 0 0 0 18 17 18 17 8-Aylmer 10 13 11 11 9-Gatineau West 10 9 10 10 10-Gatineau East 0 0 0 8 12 9 9 TOTAL 23 17 22 21 8 8 8 8 8 4 7 7 11 17 12 12 100 100 100 100 IGB-Inside Green Belt D - DAY (700 - 1700) N - NIGHT (1900 - 700) 24H - 24 HOURS
COMPARISON OF PERCENTS OF 2A TRUCKS FOR DIFFERENT PERIOD OF TIME ()
ZONE GROUP O 1-O
ttaw
a C
ente
r
2-IG
B W
est
3-O
ttaw
a W
est
4-O
ttaw
a So
uth
5-IG
B E
ast
6-O
ttaw
a E
ast
D N D+N 24H D N D+N 24H D N D+N 24H D N D+N 24H D N D+N 24H D N D+N 24H
1-Ottawa Center 2-IGB West 3-Ottawa West 4-Ottawa South 5-IGB East 0 0 0 6-Ottawa East 2 1 2 1 1 1 7-Hull 4 3 3 4 5 4 4 4 3 3 3 6 4 4 6 2 6 6 2 10 3 3 8-Aylmer 1 1 1 1 2 1 1 2 1 2 2 1 5 1 1 1 1 1 1 2 1 1 9-Gatineau West 2 2 1 1 1 1 1 8 2 3 1 5 2 2 2 5 3 3 2 2 2 10-Gatineau East 1 0 0 1 1 1 1 1 5 2 2 3 3 3 TOTAL 8 6 6 6 7 6 6 8 10 8 9 6 22 9 9 15 7 14 14 6 13 7 7
ZONE GROUP O 7-H
ull
8-A
ylm
er
9-G
atin
eau
Wes
t
10-G
atin
eau
Eas
t
TO
TA
L
D N D+N 24H D N D+N 24H D N D+N 24H D N D+N 24H D N D+N 24H 1-Ottawa Center 2 1 2 2 1 1 1 1 1 1 0 0 0 5 1 4 4 2-IGB West 3 1 3 3 1 1 1 1 1 1 5 1 4 4 3-Ottawa West 3 1 2 2 0 0 0 0 0 0 4 1 1 3 5 4 4 4-Ottawa South 4 4 4 4 1 2 2 2 2 4 2 2 7 10 8 8 5-IGB East 10 1 8 8 2 6 3 3 5 4 4 4 5 4 4 21 12 19 19 6-Ottawa East 4 2 4 4 1 1 1 1 4 2 2 3 5 3 4 12 11 12 13 7-Hull 24 24 24 23 8-Aylmer 6 11 7 7 9-Gatineau West 10 18 12 12 10-Gatineau East 6 6 6 6 TOTAL 26 10 23 23 7 8 7 8 8 4 8 7 9 19 11 11 100 100 100 100
Interprovincial Roadside Truck Survey Technical Appendices 72
COMPARISON OF PERCENTS OF 3A+ TRUCKS FOR DIFFERENT PERIOD OF TIME ()
ZONE GROUP O 1-O
ttaw
a C
ente
r
2-IG
B W
est
3-O
ttaw
a W
est
4-O
ttaw
a So
uth
5-IG
B E
ast
6-O
ttaw
a E
ast
D N D+N 24H D N D+N 24H D N D+N 24H D N D+N 24H D N D+N 24H D N D+N 24H 1-Ottawa Center 2-IGB West 3-Ottawa West 4-Ottawa South 5-IGB East 1 1 1 6 1 2 6-Ottawa East 7-Hull 1 1 1 2 3 2 2 1 1 0 6 5 5 3 0 0 8-Aylmer 8 3 7 6 8 7 6 1 3 1 1 22 3 5 9-Gatineau West 6 5 5 1 1 0 6 5 5 6 5 5 10-Gatineau East 1 3 1 1 1 1 0 22 3 5 1 1 0 TOTAL 17 5 15 14 9 3 9 8 3 3 3 3 6 22 8 10 13 12 10 31 4 7
ZONE GROUP O 7-H
ull
8-A
ylm
er
9-G
atin
eau
Wes
t
10-G
atin
eau
Eas
t
TO
TA
L
D N D+N 24H D N D+N 24H D N D+N 24H D N D+N 24H D N D+N 24H 1-Ottawa Center 2 1 1 4 4 3 6 5 5 2-IGB West 5 9 6 5 2 1 1 1 1 1 1 1 1 8 9 8 8 3-Ottawa West 3 2 2 2 6 3 3 2 2 2 2 2 2 9 6 9 9 4-Ottawa South 10 9 8 1 1 1 11 10 9 5-IGB East 2 6 3 4 2 2 2 6 6 6 6 4 6 4 5 15 26 17 19 6-Ottawa East 1 1 1 2 2 2 3 2 2 7-Hull 10 5 9 9 8-Aylmer 16 28 18 19 9-Gatineau West 20 17 15 10-Gatineau East 2 25 5 7 TOTAL 23 16 22 21 7 6 7 7 13 6 12 12 9 6 9 9 100 100 100 100
COMPARISON OF PERCENTS OF TRACTOR TRAILERS FOR DIFFERENT PERIOD OF TIME ()
ZONE GROUP O 1-O
ttaw
a C
ente
r
2-IG
B W
est
3-O
ttaw
a W
est
4-O
ttaw
a So
uth
5-IG
B E
ast
6-O
ttaw
a E
ast
D N D+N 24H D N D+N 24H D N D+N 24H D N D+N 24H D N D+N 24H D N D+N 24H 1-Ottawa Center 0 0 0 1 2 0 1 1 0 0 0 2-IGB West 3-Ottawa West 1 0 0 1 1 1 4-Ottawa South 1 0 0 5-IGB East 1 1 1 6-Ottawa East 0 0 0 1 1 0 2 1 1 3 2 3 2 1 0 0 1 1 1 7-Hull 1 1 0 3 1 1 6 2 5 4 2 1 1 1 4 2 3 3 4 6 5 5 8-Aylmer 1 1 1 2 2 1 2 1 1 4 5 5 5 2 1 1 4 1 2 9-Gatineau West 1 0 0 1 0 1 1 0 0 1 0 0 10-Gatineau East 0 0 0 0 1 1 1 4 1 3 2 7 5 6 6 3 1 2 2 2 4 3 3 TOTAL 3 2 2 2 4 5 4 5 13 6 10 9 18 14 17 16 10 4 8 6 9 14 11 12
ZONE GROUP O 7-H
ull
8-A
ylm
er
9-G
atin
eau
Wes
t
10-G
atin
eau
Eas
t
TO
TA
L
D N D+N 24H D N D+N 24H D N D+N 24H D N D+N 24H D N D+N 24H 1-Ottawa Center 1 1 0 4 1 3 3 2-IGB West 1 1 1 1 1 1 1 1 0 0 0 1 4 2 2 4 5 4 5 3-Ottawa West 2 9 4 5 3 3 3 3 6 2 5 4 13 14 13 13 4-Ottawa South 2 1 1 1 0 0 0 1 0 1 4 11 6 7 7 12 9 9 5-IGB East 6 6 6 6 1 1 1 1 1 1 1 1 1 1 1 1 9 10 10 10 6-Ottawa East 4 9 6 6 4 2 4 3 1 0 1 4 1 3 3 19 16 18 17 7-Hull 1 0 0 17 15 16 16 8-Aylmer 10 11 10 11 9-Gatineau West 4 1 2 10-Gatineau East 1 1 1 17 12 16 15 TOTAL 17 24 19 19 10 9 10 10 1 4 2 3 16 19 17 17 100 100 100 100
Appendix H Survey Expansion Factors
Interprovincial Roadside Truck Survey Technical Appendices 73
Interprovincial Roadside Truck Survey Technical Appendices
74
NB SB NB SB NB SB NB SB NB SB NB SB NB SB NB SB NB SB NB SB NB SB NB SB NB SB NB SB
2000 Interprovincial Roadside Truck Survey Sample Size by Time of Day
Sam
ple
Siz
e
100
90
80
70
60
50
40
30
20
10
0
24 HR PERIOD
NIGHT (1900-600)
AM PEAK (600-1000)
MIDDAY (1000-1500)
PM PEAK (1500-1900)
NIGHT (1900-700)
DAY (700-1900)
100
90
80
70
60
50
40
30
20
10
0
Chaudiegravere Chaudiegravere Chaudiegravere Chaudiegravere Chaudiegravere Chaudiegravere Chaudiegravere
Macdonald- Macdonald- Macdonald- Macdonald- Macdonald-Macdonald-Macdonald-
Cartier Cartier Cartier Cartier Cartier CartierCartier
2A Trucks 3A Trucks T Trailers
EXPANSION FACTORS FOR TRUCKS BY BRIDGE DIRECTION TIME PERIOD AND TYPE OF TRUCKS BRIDGE DIRECTION PERIOD 2A Trucks 3A+ Trucks Tractor Trailers
Chaudiegravere Northbound
24 HOUR TOTAL 464 641 252 NIGHT (1900-700) 283 1100 100 DAY (700-1900) 511 613 359 ALL OTHER 270 1100 091 AM PEAK(600-1000) 384 667 214 MIDDAY(1000-1500) 622 600 388 PM PEAK(1500-1900) 517 600 567
Chaudiegravere Southbound
24 HOUR TOTAL 532 433 259 NIGHT (1900-700) 338 320 140 DAY (700-1900) 632 469 321 ALL OTHER 283 200 130 AM PEAK(600-1000) 428 533 243 MIDDAY(1000-1500) 850 475 1350 PM PEAK(1500-1900) 740 433 180
Macdonald-Cartier Northbound
24 HOUR TOTAL 1265 1404 514 NIGHT (1900-700) 1214 760 389 DAY (700-1900) 1276 1574 645 ALL OTHER 1083 967 356 AM PEAK(600-1000) 1489 940 606 MIDDAY(1000-1500) 1244 1825 813 PM PEAK(1500-1900) 1200 2267 507
Macdonald-Cartier Southbound
24 HOUR TOTAL 1189 4263 505 NIGHT (1900-700) 1500 2600 298 DAY (700-1900) 1119 4817 738 ALL OTHER 1171 3000 263 AM PEAK(600-1000) 7900 12200 1620 MIDDAY(1000-1500) 958 3750 865 PM PEAK(1500-1900) 631 1950 423
Appendix I Trip Characteristics
Interprovincial Roadside Truck Survey Technical Appendices
75
Truck trip characteristics
BRIDGE DIRECTION Location O Location D SUM 2A SUM 3A+ SUM Trailer SUM TRUCKS Chaudiegravere Northbound EXTERNAL EXTERNAL 755 755
EXTERNAL INTERNAL 929 641 2769 4339
INTERNAL EXTERNAL 464 464
INTERNAL INTERNAL 26007 10259 3776 40041
Summary for DIRECTION = Northbound
Sum 27400 10900 7300 45600 Chaudiegravere Southbound EXTERNAL EXTERNAL 517 517
EXTERNAL INTERNAL 1064 1293 2357
INTERNAL EXTERNAL 532 433 2845 3810
INTERNAL INTERNAL 23404 8667 2845 34916
Summary for DIRECTION = Southbound
Sum 25000 9100 7500 41600 Summary for BRIDGE = Chaudiegravere
Sum 52400 20000 14800 87200 Macdonald-Cartier Northbound EXTERNAL EXTERNAL 2530 6167 8697
EXTERNAL INTERNAL 8855 2808 23128 34791 INTERNAL EXTERNAL 3795 1404 2056 7255
INTERNAL INTERNAL 35420 29488 12849 77756
Summary for DIRECTION = Northbound
Sum 50600 33700 44200 128500 Macdonald-Cartier Southbound EXTERNAL EXTERNAL 1189 6561 7750
EXTERNAL INTERNAL 4755 4263 7571 16588
INTERNAL EXTERNAL 4755 4263 18674 27691
INTERNAL INTERNAL 41602 25575 10094 77271
Summary for DIRECTION = Southbound
Sum 52300 34100 42900 129300 Summary for BRIDGE = Macdonald-Cartier
Sum 102900 67800 87100 257800
Grand Total 155300 87800 101900 345000
Interprovincial Roadside Truck Survey Technical Appendices
76
Appendix J Origins and Destinations of Truck Trips by Direction
Interprovincial Roadside Truck Survey Technical Appendices
77
Interprovincial Roadside Truck Survey Technical Appendices
78
Origins and Destinations of Truck Trips (Northbound direction)
1 Ottawa Central
5 IGB East
2 IGB West
3 Ottawa West
4 Ottawa South
6 Ottawa East
7 Hull
8 Aylmer
9 Gatineau West
10 Gatineau East
Queacutebec
Ontario
2 Axle Trucks
3+ Axles Trucks
Tractor Trailers
Total number of trucks (Origins in Ontario Destinatios in Queacutebec)
IGB ndash Inside Green Belt
xxx
(Autumn 2000)
Origins and Destinations of Truck Trips (Southbound Direction)
1 Ottawa Central
5 IGB East
2 IGB West
3 Ottawa West
4 Ottawa South
6 Ottawa East
7 Hull
8 Aylmer
9 Gatineau West
10 Gatineau East
Queacutebec
Ontario
2 Axle Trucks
3+ Axles Trucks
Tractor Trailers
Total number of trucks (Origins in Queacutebec Destinatios in Ontario)
IGB ndash Inside Green Belt
xxx
(Autumn 2000)
Appendix K Concentration of Truck Trip Ends
Interprovincial Roadside Truck Survey Technical Appendices
79
Number of trucks by traffic zone (Origin+Destination) 13 traffic zones accounted for 40 of all trucks (O+D)
No Zone Trucks Trucks_cumul Trucks_cumul ()
1 162 578 578 8 2 88 463 1041 15 3 189 358 1399 20 4 120 246 1645 24 5 158 194 1839 27 6 167 182 2021 29 7 89 176 2197 32 8 200 163 2360 34 9 174 157 2517 36 10 146 148 2665 39 11 83 147 2812 41 12 190 139 2951 43 13 111 132 3083 45 14 187 132 3215 47 15 168 118 3333 48 16 186 103 3436 50 17 184 101 3537 51 18 164 101 3638 53 19 161 98 3736 54 20 198 98 3834 56 21 188 95 3929 57 22 8 91 4020 58 23 171 91 4111 60 24 177 86 4197 61 25 179 84 4281 62 26 169 82 4363 63 27 55 76 4439 64 28 173 75 4514 65 29 155 71 4585 66 30 159 70 4655 67 31 257 69 4724 68 32 116 65 4789 69 33 10 56 4845 70 34 16 55 4900 71 35 147 55 4955 72 36 183 51 5006 73 37 172 51 5057 73 38 180 51 5108 74 39 251 50 5158 75 40 205 50 5208 75 41 139 48 5256 76 42 191 46 5302 77 43 93 42 5344 77 44 1 40 5384 78 45 154 39 5423 79 46 196 39 5462 79 47 199 37 5499 80 48 121 37 5536 80 49 193 36 5572 81 50 192 35 5607 81 51 150 35 5642 82 52 252 32 5674 82 53 153 30 5704 83 54 237 30 5734 83 55 141 30 5764 84 56 166 29 5793 84 57 254 27 5820 84
No Zone Trucks Trucks_cumul Trucks_cumul ()
1 162 578 578 8 2 88 463 1041 15 3 120 246 1287 19 4 158 194 1481 21 5 167 182 1663 24 6 89 176 1839 27 7 174 157 1996 29 8 146 148 2144 31 9 83 147 2291 33
10 111 132 2423 35 11 168 118 2541 37 12 184 101 2642 38 13 164 101 2743 40
20 traffic zones accounted for 20 of all trucks (O+D)
No Zone Trucks Trucks_cumul Trucks_cumul ()
1 161 98 98 1 2 8 91 189 3 3 171 91 280 4 4 177 86 366 5 5 179 84 450 7 6 169 82 532 8 7 55 76 608 9 8 173 75 683 10 9 155 71 754 11
10 159 70 824 12 11 257 69 893 13 12 116 65 958 14 13 10 56 1014 15 14 16 55 1069 15 15 147 55 1124 16 16 183 51 1175 17 17 172 51 1226 18 18 180 51 1277 19 19 251 50 1327 19 20 205 50 1377 20
15 external traffic zones accounted for 19 of all trucks (O+D)
No Zone Trucks Trucks_cumul Trucks_cumul ()
1 189 358 358 5 2 200 163 521 8 3 190 139 660 10 4 187 132 792 11 5 186 103 895 13 6 198 98 993 14 7 188 95 1088 16 8 191 46 1134 16 9 196 39 1173 17
10 199 37 1210 18 11 193 36 1246 18 12 192 35 1281 19 13 194 9 1290 19 14 195 7 1297 19 15 197 3 1300 19
Interprovincial Roadside Truck Survey Technical Appendices
80
Number of trucks by traffic zone (Origin+Destination) No Zone Trucks Trucks_cumul Trucks_cumul () 58 204 27 5847 85 59 90 26 5873 85 60 143 26 5899 85 61 80 26 5925 86 62 119 24 5949 86 63 238 24 5973 87 64 253 24 5997 87 65 175 23 6020 87 66 136 23 6043 88 67 151 23 6066 88 68 233 23 6089 88 69 54 22 6111 89 70 249 22 6133 89 71 258 22 6155 89 72 39 21 6176 90 73 115 21 6197 90 74 66 21 6218 90 75 130 20 6238 90 76 4 19 6257 91 77 165 18 6275 91 78 117 17 6292 91 79 17 17 6309 91 80 170 17 6326 92 81 20 17 6343 92 82 12 16 6359 92 83 7 16 6375 92 84 75 16 6391 93 85 97 15 6406 93 86 107 14 6420 93 87 76 14 6434 93 88 110 14 6448 93 89 22 13 6461 94 90 145 13 6474 94 91 26 13 6487 94 92 125 13 6500 94 93 35 13 6513 94 94 19 13 6526 95 95 37 13 6539 95 96 28 13 6552 95 97 255 12 6564 95 98 70 12 6576 95 99 134 11 6587 95 100 176 11 6598 96 101 91 11 6609 96 102 135 11 6620 96 103 140 11 6631 96 104 2 10 6641 96 105 51 10 6651 96 106 148 10 6661 97 107 40 9 6670 97
Interprovincial Roadside Truck Survey Technical Appendices
81
Number of trucks by traffic zone (Origin+Destination) No Zone Trucks Trucks_cumul Trucks_cumul ()
108 194 9 6679 97 109 157 9 6688 97 110 63 8 6696 97 111 250 8 6704 97 112 41 8 6712 97 113 24 8 6720 97 114 210 8 6728 98 115 105 7 6735 98 116 149 7 6742 98 117 195 7 6749 98 118 239 7 6756 98 119 256 6 6762 98 120 103 6 6768 98 121 11 6 6774 98 122 29 6 6780 98 123 43 6 6786 98 124 50 6 6792 98 125 57 6 6798 99 126 220 6 6804 99 127 126 6 6810 99 128 6 5 6815 99 129 156 5 6820 99 130 207 5 6825 99 131 34 5 6830 99 132 42 5 6835 99 133 67 5 6840 99 134 3 5 6845 99 135 112 5 6850 99 136 123 5 6855 99 137 77 5 6860 99 138 18 5 6865 99 139 98 5 6870 100 140 230 3 6873 100 141 9 3 6876 100 142 197 3 6879 100 143 95 3 6882 100 144 106 3 6885 100 145 73 3 6888 100 146 152 3 6891 100 147 240 3 6894 100 148 23 3 6897 100 149 178 3 6900 100
Interprovincial Roadside Truck Survey Technical Appendices
82
Appendix L Tabulations of Trip Origins and Destinations by Truck Classification
Interprovincial Roadside Truck Survey Technical Appendices
83
TOTAL NUMBER OF ALL TRUCKS (12 HOURS_DAY+12 HOURS_NIGHT)
ZONE GROUP O 1-O
ttaw
a C
ente
r
2-IG
B W
est
3-O
ttaw
a W
est
4-O
ttaw
a So
uth
5-IG
B-E
ast
6-O
ttaw
a E
ast
7-H
ull
8-A
ylm
er
9-G
atin
eau
Wes
t
10-G
atin
eau
Eas
t
TO
TA
L
1-Ottawa Center 5 14 3 53 13 49 5 142 2-IGB West 100 36 21 28 185 3-Ottawa West 4 6 104 61 21 74 270 4-Ottawa South 4 155 34 4 97 293 5-IGB-East 11 14 209 73 120 115 543 6-Ottawa East 1 7 11 28 25 19 126 50 29 99 395 7-Hull 69 90 106 73 172 102 3 615 8-Aylmer 80 88 46 68 32 56 369 9-Gatineau West 75 22 42 81 92 32 344 10-Gatineau East 15 6 52 124 66 27 6 295 TOTAL 255 213 261 387 390 259 745 270 244 425 3450 IGB-Inside Green Belt
TOTAL NUMBER OF 2A TRUCKS (12 HOURS_DAY+12 HOURS_NIGHT)
ZONE GROUP O 1-O
ttaw
a C
ente
r
2-IG
B W
est
3-O
ttaw
a W
est
4-O
ttaw
a So
uth
5-IG
B-E
ast
6-O
ttaw
a E
ast
7-H
ull
8-A
ylm
er
9-G
atin
eau
Wes
t
10-G
atin
eau
Eas
t
TO
TA
L
1-Ottawa Center 33 13 18 5 69 2-IGB West 41 15 10 67 3-Ottawa West 36 5 5 12 58 4-Ottawa South 63 24 35 122 5-IGB-East 5 123 46 59 66 298 6-Ottawa East 22 13 62 13 25 53 188 7-Hull 53 64 51 58 88 52 366 8-Aylmer 13 13 27 21 18 18 110 9-Gatineau West 24 18 35 33 44 29 181 10-Gatineau East 6 15 33 40 93 TOTAL 100 95 128 145 212 112 358 115 117 172 1553
TOTAL NUMBER OF 3A+ TRUCKS (12 HOURS_DAY+12 HOURS_NIGHT)
ZONE GROUP O 1-O
ttaw
a C
ente
r
2-IG
B W
est
3-O
ttaw
a W
est
4-O
ttaw
a So
uth
5-IG
B-E
ast
6-O
ttaw
a E
ast
7-H
ull
8-A
ylm
er
9-G
atin
eau
Wes
t
10-G
atin
eau
Eas
t
TO
TA
L
1-Ottawa Center 12 31 44 2-IGB West 49 12 6 6 73 3-Ottawa West 22 23 16 16 77 4-Ottawa South 79 6 85 5-IGB-East 6 8 26 16 51 39 146 6-Ottawa East 6 16 22 7-Hull 9 17 5 48 3 83 8-Aylmer 61 58 13 26 157 9-Gatineau West 48 5 48 48 149 10-Gatineau East 8 5 26 5 43 TOTAL 132 75 27 74 101 37 193 57 105 77 878
TOTAL NUMBER OF TRACTOR TRAILERS (12 HOURS_DAY+12 HOURS_NIGHT)
ZONE GROUP O 1-O
ttaw
a C
ente
r
2-IG
B W
est
3-O
ttaw
a W
est
4-O
ttaw
a So
uth
5-IG
B-E
ast
6-O
ttaw
a E
ast
7-H
ull
8-A
ylm
er
9-G
atin
eau
Wes
t
10-G
atin
eau
Eas
t
TO
TA
L
1-Ottawa Center 5 14 3 7 29 2-IGB West 10 8 5 22 45 3-Ottawa West 4 6 46 32 46 135 4-Ottawa South 4 13 5 4 62 87 5-IGB-East 6 60 11 10 10 98 6-Ottawa East 1 7 11 28 3 6 58 37 4 30 185 7-Hull 7 9 50 15 35 46 3 166 8-Aylmer 6 17 6 46 15 12 102 9-Gatineau West 3 4 3 3 13
10-Gatineau East 1 6 32 65 21 27 6 159 TOTAL 22 44 107 169 77 111 193 97 23 176 1019
Interprovincial Roadside Truck Survey Technical Appendices
84
Appendix M Detailed Comments on Trip Origins and Destinations
Interprovincial Roadside Truck Survey Technical Appendices
85
DETAILED COMMENTS ON TRIPS ORIGINS AND DESTINATIONS
Detailed daily origin-destination desire lines are presented in the Report in Exhibit 18 for all truck trips in Exhibit 19 for 2 axle truck trips in Exhibit 20 for 3+ axle truck trips and in Exhibit 21 for tractor trailer trips Here are summarized some key characteristics
The number of truck trips higher than 50 for all truck classifications collectively or individually is considered to represent strong orientation while 25-50 truck trips are considered to represent a modestly strong orientation Number of truck trips is presented in parenthesis
EXHIBIT 18 (all truck trips) as illustrated in exhibit panel A ndash Trips from the Aylmer district demonstrate a strong orientation to Ottawa East (56) Ottawa Central (80) Ottawa South (68) and IGB West (88) Trips to Aylmer district demonstrate a strong orientation from IGB East (73) and from Ottawa West (61) The trips to Aylmer demonstrate a modestly strong orientation from Ottawa South (34) and from IGB West (36) The Modestly strong orientation of truck trips from Aylmer is demonstrated to IGB East (32) and to Ottawa West (46) B ndash Trips from the Hull district demonstrate a strong orientation to Ottawa Central (69) Ottawa South (73) IGB West (90) Ottawa East (102) Ottawa West (106) IGB East (172) Trips to Hull district demonstrate a strong orientation from Ottawa Central (53) IGB West (100) Ottawa West (104) Ottawa East (126) Ottawa South (155) and IGB East (209) C ndash Trips from the Gatineau West district demonstrate a strong orientation to Ottawa Central (75) Ottawa South (81) and IGB East (92) The trips to Gatineau West demonstrate strong orientation from IGB East (120) Modestly strong orientation is demonstrated from Gatineau West to Ottawa East (32) and Ottawa West (43) In other direction a modestly strong orientation is demonstrated to Gatineau West from Ottawa East (29) and Ottawa Central (49) D ndash Trips from the Gatineau East district demonstrate a strong orientation to Ottawa West (52) IGB East (66) and Ottawa South (124) The trips to Gatineau East demonstrate a strong orientation from Ottawa West (74) Ottawa South (97) Ottawa East (99) and IGB East (115) Modestly strong orientation is demonstrated from Gatineau East to Ottawa East (27) and from IGB West to Gatineau East (28)
EXHIBIT 19 (2 axle truck trips) as illustrated in exhibit panel A ndash Modestly strong orientation of trips from the Aylmer district is demonstrated to Ottawa West (27) as well as from IGB East to Aylmer (46) B ndash Trips from Hull district demonstrate a strong orientation to Ottawa West (51) Ottawa East (52) Ottawa Central (53) Ottawa South (58) IGB West (64) and IGB East (88) The trips to Hull demonstrate a strong orientation from Ottawa East (62) Ottawa South (63) and IGB East (123) Modestly strong orientation is demonstrated to Hull from Ottawa Central (33) Ottawa West (36) and IGB West (41) C ndash Trips to the Gatineau West district demonstrate a strong orientation from IGB East (59)
Interprovincial Roadside Truck Survey Technical Appendices
86
Modestly strong orientation is demonstrated from Gatineau West to Ottawa East (29) Ottawa South (33) Ottawa West (35) and IGB East (44) In opposite direction a modestly strong orientation is demonstrated from Ottawa East to Gatineau West (25) D ndash Trips to the Gatineau East district demonstrate a strong orientation from Ottawa East (53) and from IGB East (66) Modestly strong orientation of trips is demonstrated from Gatineau East to Ottawa South (33) and IGB East (40) as well as from Ottawa South to Gatineau East (35)
EXHIBIT 20 (3+ axle truck trips) as illustrated in exhibit panel A ndash Trips from the Aylmer district demonstrate a strong orientation to IGB West (58) and Ottawa Central (61) while a modestly strong orientation is demonstrated from Aylmer to Ottawa East (26) B ndash Trips to Hull district demonstrate a strong orientation from Ottawa South (79) Modestly strong orientation is demonstrated to Hull from IGB East (26) and from IGB West (49) as well as from Hull to IGB East (48) C ndash Trips to the Gatineau West district demonstrate a strong orientation from IGB East (51) Modestly strong orientation is demonstrated from Gatineau West to IGB East (48) Ottawa South (48) and Ottawa Central (48) as well as from Ottawa Central to Gatineau West (31) D ndash Modestly strong orientation of trips is demonstrated from Gatineau East to Ottawa South (26) and from IGB East to Gatineau East (39)
EXHIBIT 21 (tractor trailer trips) as illustrated in exhibit panel A ndash Trips to the Aylmer district demonstrate a modestly strong orientation from Ottawa West (32) and from Ottawa East (37) In opposite direction a modestly strong orientation is demonstrated from Aylmer to Ottawa South (46) B ndash Trips to Hull district demonstrate a strong orientation from Ottawa East (58) and from IGB East (60) Modestly strong orientation is demonstrated to Hull from Ottawa West (46) as well as from Hull to Ottawa West (50) C ndash There is no a strong or modestly strong orientation of trips tofrom the Gatineau West district tofrom the districts on the Ottawa side of the National Capital Region D ndash Trips to Gatineau East district demonstrate a strong orientation from Ottawa South (62) In the opposite direction a strong orientation of trips is demonstrated from Gatineau East to Ottawa South (65) Modestly strong orientation of trips is demonstrated from Gatineau East to Ottawa East (27) and Ottawa West (33) In the opposite direction a modestly strong orientation of trips is demonstrated to Gatineau East from Ottawa East (30) and from Ottawa West (46)
Interprovincial Roadside Truck Survey Technical Appendices
87
Appendix N Categories of Commodities
Interprovincial Roadside Truck Survey Technical Appendices
88
10
20
30
40
50
Commodity carried and number of All trucks during the day (700-1900)
No COMMODITY NAME NUMBER OF
TRUCKS COMMODITY CATEGORY
NUMBER OF TRUCKS PER COMMODITY CATEGORY
Empty Trucks 1092 1092
1 ALUMINUMS 8 1
472
2 ASPHALT 4 1 3 BRICKS 4 1 4 CARDBOARD TUBES 7 1 5 CEMENT 86 1 6 CEMENT POWDERED 7 1 7 CLAY 33 1 8 CONCRETE 42 1 9 CONSTRUCTION EQUIPMENT 20 1
CONSTRUCTION MATERIALS 7 1 11 DEBRIS 12 1 12 DOOR 8 1 13 DRYWALL 11 1 14 ELECTRICAL MANHOLES 7 1 15 FOAM 7 1 16 KITCHEN CABINETS 13 1 17 LIGHT FIXTURES 5 1 18 MANHOLE COVER FORMS 7 1 19 METAL BEAMS 11 1
METAL SHEETS 16 1 21 NEW JERSEY CEMENT BARRIERS 8 1 22 PAINTING CANVASS 13 1 23 PHONE FOR HYDRO 13 1 24 PLUMBING SUPPLIES 38 1 25 POOL EQUIPMENT 13 1 26 ROOFING MATERIALS 5 1 27 SAND 4 1 28 SHEET METAL 6 1 29 TELEPHONE POLES 7 1
TRANSFORMER 8 1 31 TREE 7 1 32 TRUSS 7 1 33 WINDOWS 21 1 34 WOOD ROOF TRUSS 12 1
35 BAKED GOODS 6 2 36 BOTTLED WATER 11 2 37 BREAD 12 2 38 CAKES 5 2 39 CANNED FOOD 13 2
CHICKEN 20 2 41 CHIPS 11 2 42 COOKIES BISCUITS 12 2 43 COOKIES AND CRACKERS 7 2 44 EGGS 13 2 45 FOOD 21 2 46 FOOD FROZEN 35 2 47 FRIES 7 2 48 MEAT BEEF AND FROZEN GOODS 7 2 49 NESTLE ICE TEA 7 2
PEPSI PRODUCT 16 2
Interprovincial Roadside Truck Survey Technical Appendices
89
No COMMODITY NAME NUMBER OF
TRUCKS COMMODITY CATEGORY
NUMBER OF TRUCKS PER COMMODITY CATEGORY
51 POTATO CHIPS 5 2
285
52 POTATOES 12 2 53 PRODUCE APPLES 5 2 54 PRODUCE MOSTLY BANANAS 3 2 55 SOFT DRINKS 16 2 56 SOYA MILK 12 2 57 VEGETABLES 5 2 58 WATER 25 2
59 ANIMAL FEED 4 3
259
60 BEDROOM FURNITURE 7 3 61 BRAS 5 3 62 CHAIRS 13 3 63 CLEANING SUPPLIES 25 3 64 CLOTHING RACKS 13 3 65 EMPTY PEPSI CANS 12 3 66 FURNITURE 37 3 67 GARBAGE CONTAINERS 12 3 68 HOUSE CONTENTS 13 3 69 HOUSEHOLD GOODS 13 3 70 MAIL 25 3 71 MIRRORS 7 3 72 PARCELS AND PACKAGES 5 3 73 PLANTS 4 3 74 POLY BAGS 7 3 75 SHELVING 5 3 76 SOAP 8 3 77 TABLES 11 3 78 TENT 5 3 79 TOBACCO 7 3 80 TOOLS 13 3 81 TV AND VCRS 7 3 82 USED HOUSEHOLD GOODS 4 3
83 BOXES 26 4
202
84 CARDBOARD BOXES 13 4 85 NEWSPAPERS 12 4 86 NEWSPAPERS SHEETS 8 4 87 NEWSPRINT 8 4 88 PAPER 84 4 89 PAPER PREMIUM 8 4 90 PAPER RECYCLED 12 4 91 PAPER ROLLS 18 4 92 TOILET PAPER 8 4 93 WASTE NEWSPRINT 7 4
94 LUMBER 14 5
152
95 PRESSURE TREATED LUMBER 50 5 96 SAWDUST WOODCHIPS 6 5 97 WOOD 43 5 98 WOOD BOARDS 8 5 99 WOOD CHIPS AND BLOCKS 8 5 100 WOOD PELLETS 8 5 101 WOOD PLANKS 15 5
Interprovincial Roadside Truck Survey Technical Appendices
90
No COMMODITY NAME NUMBER OF
TRUCKS COMMODITY CATEGORY
NUMBER OF TRUCKS PER COMMODITY CATEGORY
102 3 QUARTERS WATER 1 QUARTER ACID 3 6
90
103 ASPHALT WASTE 5 6 104 COMPRESSED GASES OXYGEN 7 6 105 FURNACE OIL 5 6 106 GAS AND LIQUID CO2 13 6 107 GASNO LEAD REG 7 6 108 LIME 3 6 109 LIQUID FERTILER 5 6 110 PESTICIDES 7 6 111 PETROLEUM 7 6 112 PROPANE 16 6 113 PROPANE TANKS 5 6 114 WASTE OIL 6 6
115 ARCHIVES 5 7
103
116 BINDERS 5 7 117 COMPUTER EQUIPMENT 5 7 118 COMPUTERS 28 7 119 ELECTRONIC CASH PRODUCT 5 7 120 GOVERNMENT RECORDS 7 7 121 OFFICE EQUIPMENT 12 7 122 OFFICE FURNITURE 12 7 123 OFFICE SUPPLIES 5 7 124 PRINTING SUPPLIES 13 7 125 STATIONARY 5 7
126 AUTO PARTS 7 8
54
127 BOB CAT 8 8 128 CARS 7 8 129 EQUIPMENT TO FIX TRAILERS 7 8 130 TIRES 20 8 131 TRUCK CABS 7 8
TOTAL 2709 2709 Where Drivers reported some commodity 1617
Empty trucks 1092 ) Commodity names are modified in some cases because of typing errors in the questionnaire
Interprovincial Roadside Truck Survey Technical Appendices
91
5
10
15
20
25
30
35
40
45
50
Commodity carried and number of All trucks during the night (1900-700)
No COMMODITY NAME NUMBER OF
TRUCKS COMMODITY CATEGORY
NUMBER OF TRUCKS PER COMMODITY CATEGORY
Empty trucks 286 286 1 INSULATION 8 1 8
2 BAKERY PRODUCTS 12 2
131
3 BREAD 13 2 4 CHEESE 8 2
DAIRY PRODUCTS 8 2 6 FOOD 3 2 7 FOOD FROZEN 4 2 8 FOOD-DESSERTS 3 2 9 GROCERIES 19 2
JOS LOUIS CAKES 15 2 11 MILK 6 2 12 PICK LES 3 2 13 POULTRY 3 2 14 PRODUCE 5 2
SANDWICH MEATS 12 2 16 SNACK FOODS 15 2
17 ART 3 3
99
18 CLEANING SUPPLIES 1 3 19 DRUG STORE PRODUCTS 4 3
FLOWERS 8 3 21 FRIDGE 15 3 22 FURNITURE 6 3 23 HARDWARE 4 3 24 HOUSEHOLD FURNITURE 3 3
LTL MIXED FREIGHT 3 3 26 MAIL 12 3 27 MIXED FREIGHT 4 3 28 PHARMACEUTICALS 4 3 29 SHOES 4 3
SNOW BLOWER 4 3 31 SPRING MACHINE 12 3 32 STEDMANS MERCHANDISE 3 3 33 STORE SUPPLIES 4 3 34 TOWELS 3 3
FLYERS 4 4
104
36 KLEENEX BOXES 4 4 37 LABELS 4 4 38 NEWSPAPERS 15 4 39 NEWSPRINT 6 4
OLD NEWSPAPER 4 4 41 PAPER 31 4 42 PAPER NEWSPRINT 3 4 43 PAPER PRODUCTS 3 4 44 PAPER RECYCLED 8 4
PAPER ROLLS 6 4 46 SCRAP PAPER 12 4 47 TOILET PAPER 3 4
48 ASPEN IT E 3 5 49 CHIP BOARD 3 5
LOGS 4 5
Interprovincial Roadside Truck Survey Technical Appendices
92
No COMMODITY NAME NUMBER OF
TRUCKS COMMODITY CATEGORY
NUMBER OF TRUCKS PER COMMODITY CATEGORY
51 LUMBER 11 5
44
52 MDF BOARD 3 5 53 WHIFFLE BOARD 3 5 54 WOOD 10 5 55 WOOD PANELS 3 5 56 WOOD PRODUCTS 3 5
57 CALCIUM CARBONATE 1 6
56
58 CHLORATE SODIUM 3 6 59 COLOURED DIESEL 3 6 60 FURNACE FUEL 11 6 61 GAS 4 6 62 GASOLINE 9 6 63 HYDRATED LIME 4 6 64 OMYAFILL SLURRY 1 6 65 OXYGEN 12 6 66 PASTE 3 6 67 SALT 4 6
68 AUTO PARTS 1 8
13
69 CARS 4 8 70 TIRES 3 8 71 VEHICLES 4 8
TOTAL Where Drivers reported some commodity
Empty trucks
741 455 286
741
) Commodity names are modified in some cases because of typing errors in the questionnaire
Interprovincial Roadside Truck Survey Technical Appendices
93
10
20
30
40
50
Commodity carried and number of All trucks during the 24 hour period
No COMMODITY NAME NUMBER OF
TRUCKS COMMODITY CATEGORY
NUMBER OF TRUCKS PER COMMODITY CATEGORY
Empty Trucks 1378 1378 1 ALUMINUMS 8 1
480
2 ASPHALT 4 1 3 BRICKS 4 1 4 CARDBOARD TUBES 7 1 5 CEMENT 86 1 6 CEMENT POWDERED 7 1 7 CLAY 33 1 8 CONCRETE 42 1 9 CONSTRUCTION EQUIPMENT 20 1
CONSTRUCTION MATERIALS 7 1 11 DEBRIS 12 1 12 DOOR 8 1 13 DRYWALL 11 1 14 ELECTRICAL MANHOLES 7 1 15 FOAM 7 1 16 INSULATION 8 1 17 KITCHEN CABINETS 13 1 18 LIGHT FIXTURES 5 1 19 MANHOLE COVER FORMS 7 1
METAL BEAMS 11 1 21 METAL SHEETS 16 1 22 NEW JERSEY CEMENT BARRIERS 8 1 23 PAINTING CANVASS 13 1 24 PHONE FOR HYDRO 13 1 25 PLUMBING SUPPLIES 38 1 26 POOL EQUIPMENT 13 1 27 ROOFING MATERIALS 5 1 28 SAND 4 1 29 SHEET METAL 6 1
TELEPHONE POLES 7 1 31 TRANSFORMER 8 1 32 TREE 7 1 33 TRUSS 7 1 34 WINDOWS 21 1 35 WOOD ROOF TRUSS 12 1
36 BAKED GOODS 6 2 37 BAKERY PRODUCTS 12 2 38 BOTTLED WATER 11 2 39 BREAD 25 2
CAKES 5 2 41 CANNED FOOD 13 2 42 CHEESE 8 2 43 CHICKEN 20 2 44 CHIPS 11 2 45 COOKIES BISCUITS 12 2 46 COOKIES AND CRACKERS 7 2 47 DAIRY PRODUCTS 8 2 48 EGGS 13 2 49 FOOD 24 2
FOOD FROZEN 39 2
Interprovincial Roadside Truck Survey Technical Appendices
94
No COMMODITY NAME NUMBER OF
TRUCKS COMMODITY CATEGORY
NUMBER OF TRUCKS PER COMMODITY CATEGORY
51 FOOD-DESSERTS 3 2
416
52 FRIES 7 2 53 GROCERIES 19 2 54 JOS LOUIS CAKES 15 2 55 MEAT BEEF AND FROZEN GOODS 7 2 56 MILK 6 2 57 NESTLE ICE TEA 7 2 58 PEPSI PRODUCT 16 2 59 PICK LES 3 2 60 POTATO CHIPS 5 2 61 POTATOES 12 2 62 POULTRY 3 2 63 PRODUCE 5 2 64 PRODUCE APPLES 5 2 65 PRODUCE MOSTLY BANANAS 3 2 66 SANDWICH MEATS 12 2 67 SNACK FOODS 15 2 68 SOFT DRINKS 16 2 69 SOYA MILK 12 2 70 VEGETABLES 5 2 71 WATER 25 2 72 ANIMAL FEED 4 3 73 ART 3 3 74 BEDROOM FURNITURE 7 3 75 BRAS 5 3 76 CHAIRS 13 3 77 CLEANING SUPPLIES 26 3 78 CLOTHING RACKS 13 3 79 DRUG STORE PRODUCTS 4 3 80 EMPTY PEPSI CANS 12 3 81 FLOWERS 8 3 82 FRIDGE 15 3 83 FURNITURE 43 3 84 GARBAGE CONTAINERS 12 3 85 HARDWARE 4 3 86 HOUSE CONTENTS 13 3 87 HOUSEHOLD FURNITURE 3 3 88 HOUSEHOLD GOODS 13 3 89 LTL MIXED FREIGHT 3 3 90 MAIL 37 3 91 MIRRORS 7 3 92 MIXED FREIGHT 4 3 93 PARCELS AND PACKAGES 5 3 94 PHARMACEUTICALS 4 3 95 PLANTS 4 3 96 POLY BAGS 7 3 97 SHELVING 5 3 98 SHOES 4 3 99 SNOW BLOWER 4 3 100 SOAP 8 3
Interprovincial Roadside Truck Survey Technical Appendices
95
No COMMODITY NAME NUMBER OF
TRUCKS COMMODITY CATEGORY
NUMBER OF TRUCKS PER COMMODITY CATEGORY
101 SPRING MACHINE 12 3
358
102 STEDMANS MERCHANDISE 3 3 103 STORE SUPPLIES 4 3 104 TABLES 11 3 105 TENT 5 3 106 TOBACCO 7 3 107 TOOLS 13 3 108 TOWELS 3 3 109 TV AND VCRS 7 3 110 USED HOUSEHOLD GOODS 4 3 111 BOXES 26 4
306
112 CARDBOARD BOXES 13 4 113 FLYERS 4 4 114 KLEENEX BOXES 4 4 115 LABELS 4 4 116 NEWSPAPERS 27 4 117 NEWSPAPERS SHEETS 8 4 118 NEWSPRINT 14 4 119 OLD NEWSPAPER 4 4 120 PAPER 115 4 121 PAPER NEWSPRINT 3 4 122 PAPER PREMIUM 8 4 123 PAPER PRODUCTS 3 4 124 PAPER RECYCLED 20 4 125 PAPER ROLLS 24 4 126 SCRAP PAPER 12 4 127 TOILET PAPER 11 4 128 WASTE NEWSPRINT 7 4
129 ASPEN IT E 3 5
195
130 CHIP BOARD 3 5 131 LOGS 4 5 132 LUMBER 25 5 133 MDF BOARD 3 5 134 PRESSURE TREATED LUMBER 50 5 135 SAWDUST WOODCHIPS 6 5 136 WHIFFLE BOARD 3 5 137 WOOD 53 5 138 WOOD BOARDS 8 5 139 WOOD CHIPS AND BLOCKS 8 5 140 WOOD PANELS 3 5 141 WOOD PELLETS 8 5 142 WOOD PLANKS 15 5 143 WOOD PRODUCTS 3 5
144 3 QUARTERS WATER 1 QUARTER ACID 3 6 145 ASPHALT WASTE 5 6 146 CALCIUM CARBONATE 1 6 147 CHLORATE SODIUM 3 6 148 COLOURED DIESEL 3 6 149 COMPRESSED GASES OXYGEN 7 6 150 FURNACE FUEL 11 6
Interprovincial Roadside Truck Survey Technical Appendices
96
No COMMODITY NAME NUMBER OF
TRUCKS COMMODITY CATEGORY
NUMBER OF TRUCKS PER COMMODITY CATEGORY
151 FURNACE OIL 5 6
147
152 GAS 4 6 153 GAS AND LIQUID CO2 13 6 154 GASNO LEAD REG 7 6 155 GASOLINE 9 6 156 HYDRATED LIME 4 6 157 LIME 3 6 158 LIQUID FERTILER 5 6 159 OMYAFILL SLURRY 1 6 160 OXYGEN 12 6 161 PASTE 3 6 162 PESTICIDES 7 6 163 PETROLEUM 7 6 164 PROPANE 16 6 165 PROPANE TANKS 5 6 166 SALT 4 6 167 WASTE OIL 6 6
168 ARCHIVES 5 7
103
169 BINDERS 5 7 170 COMPUTER EQUIPMENT 5 7 171 COMPUTERS 28 7 172 ELECTRONIC CASH PRODUCT 5 7 173 GOVERNMENT RECORDS 7 7 174 OFFICE EQUIPMENT 12 7 175 OFFICE FURNITURE 12 7 176 OFFICE SUPPLIES 5 7 177 PRINTING SUPPLIES 13 7 178 STATIONARY 5 7 179 AUTO PARTS 8 8
67
180 BOB CAT 8 8 181 CARS 11 8 182 EQUIPMENT TO FIX TRAILERS 7 8 183 TIRES 23 8 184 TRUCK CABS 7 8 185 VEHICLES 4 8
TOTAL 3450 3450 Where Drivers reported some commodity 2072
Empty trucks 1378
) Commodity names are modified in some cases because of typing errors in the questionnaire
Interprovincial Roadside Truck Survey Technical Appendices
97
Appendix O Trip Origins and Destinations for Specific Commodities and Detailed Comments
Interprovincial Roadside Truck Survey Technical Appendices
98
Inte
rpro
vinc
ial R
oads
ide
Truc
k Su
rvey
T
echn
ical
App
endi
ces
99
Queacute
be
c Ont
ario
O
ntar
io
Queacute
bec
Queacute
bec
Ont
ario
O
ntar
io
Ayl
mer
Hul
l
Gat
inea
u W
est
Gat
inea
u E
ast
Otta
wa
Eas
t
IGB
Eas
t
Otta
wa
Cen
tral
IGB
Wes
t
Otta
wa
Sou
thO
ttaw
a W
est
Gat
inea
u E
ast
Gat
inea
u W
est
Hul
l
Ayl
mer
Otta
wa
Eas
t
IGB
Eas
tO
ttaw
a C
entr
al
IGB
Wes
t
Otta
wa
Sou
th
Otta
wa
Wes
t
Gat
inea
u E
ast
Gat
inea
u W
est
Hul
l
Ayl
mer
Otta
wa
Eas
t
IGB
Eas
t
Otta
wa
Cen
tral
IGB
Wes
t
Otta
wa
Sou
thO
ttaw
a W
est
Ap
pen
dix
O D
aily
Ori
gin
s an
d D
esti
nat
ion
s fo
r S
pec
ific
C
om
mo
dit
ies
- A
ll T
ruck
Tri
ps
(AU
TU
MN
200
0)
48
Ayl
mer
Hul
l
Gat
inea
u W
est
Gat
inea
u E
ast
Otta
wa
Eas
t
IGB
Eas
t
Otta
wa
Cen
tral
IGB
Wes
t
Otta
wa
Sou
th
Otta
wa
Wes
t
Num
ber
of tr
uck
trip
s an
d di
rect
ion
LE
GE
ND
48
N
umbe
r of
Orig
ins
and
Des
tinat
ions
for
Dis
tric
t
GE
NE
RA
L M
ER
CH
AN
DIS
E O
RIG
INS
AN
D D
ES
TIN
AT
ION
S A
LL
TR
UC
K T
RIP
S
B
WO
OD
amp W
OO
D P
RO
DU
CT
S O
RIG
INS
AN
D D
ES
TIN
AT
ION
S A
LL
TR
UC
K T
RIP
S
D
PA
PE
R amp
PA
PE
R P
RO
DU
CT
S O
RIG
INS
AN
D D
ES
TIN
AT
ION
S A
LL
TR
UC
K T
RIP
S
C
CO
NS
TR
UC
ITO
N M
AT
ER
IAL
S O
RIG
INS
AN
D D
ES
TIN
AT
ION
S A
LL
TR
UC
K T
RIP
S
A
Queacute
bec
The characteristics as portrayed on the exhibit (Appendix O) are summarized in the following
Construction materials trips are portrayed on Panel A These trips are widely dispersed with the stronger links being from Aylmer to Ottawa Central (56 trips) from Ottawa South to Hull (44) from Ottawa Central to Gatineau West (44) from IGB East to Hull (32) and from IGB East to Gatineau West (23)
General merchandise trips are portrayed on Panel B As would be expected there are no particularly strong orientations The stronger bi-directional desire lines being from Hull to Ottawa West (20+21)from Gatineau West to IGB East (26+13) from Gatineau East to IGB East (11+25) and from Hull to Ottawa South (11+17) Some of the stronger uni-directional desire lines being from IGB East to Hull (27) from Ottawa South to Gatineau East (19) from IGB West to Hull (18) from Ottawa South to Aylmer (17) and from Gatineau West to Ottawa West (14)
Paper and paper products trips are portrayed on Panel C As illustrated there are some strong orientations with the stronger bi-directional desire lines being from Gatineau East to Ottawa South (44+31) from Ottawa East to Hull (41+22) Bi-directional desire lines are also presented from Hull to IGB East (19+17) and from Hull to Ottawa West (18+17) Uni-directional desire lines are presented from IGB East to Gatineau East (13) from Ottawa West to Gatineau East (12) and from Hull to IGB East (11)
Wood and wood products trips are portrayed on Panel D As illustrated strong uni-directional desire lines are from Gatineau West to Ottawa South (48) and from Aylmer to Ottawa South (31) while there is a modestly strong orientation from Ottawa East to Gatineau East (16)
Interprovincial Roadside Truck Survey Technical Appendices
100