Embed Size (px)
Citation preview

APPENDIX A. SELECTED METRIC TABLES
Mode 1998 2010 2020 1998 2010 2020 Total 13,854 19,392 23,449 9,312 18,339 29,954 Domestic 12,232 17,073 20,445 7,876 15,152 24,075
Air 8 16 24 545 1,308 2,246 Highway 9,470 13,544 16,447 6,656 12,746 20,241 Rail 1,773 2,293 2,625 530 848 1,230 Water 982 1,220 1,349 146 250 358
International 1,621 2,319 3,004 1,436 3,187 5,879 Air 8 15 22 530 1,182 2,259 Highway 380 665 970 772 1,724 3,131 Rail 325 470 634 116 248 432 Water 123 181 236 17 34 57
Other 1 784 989 1,142 NA NA NA
Metric Tonnes (millions) Value ($ billions)
1997 2000 2004
ModeTruck 323 NA 429 NA 395 164 453 NARail 70 NA 94 NA 93 88 108 NAAir 28 <1 45 <1 37 <1 32 <1Water 22 173 33 194 29 194 46 222Pipeline 14 NA 24 NA 26 72 39 NAOther 19 NA 29 NA 31 1 34 NATotal 475 479 653 526 612 519 712 NA
2001
Value($ billions)
Weight(millions of
metric tonnes)Value
($ billions)
Weight(millions of
metric tonnes)Value
($ billions)
Weight(millions of
metric tonnes)Value
($ billions)
Weight(millions of
metric tonnes)
TABLE 2-1M. FREIGHT SHIPMENTS BY WEIGHT AND VALUE
Source: U.S. Department of Transportation, Federal Highway Administration, Freight Analysis Framework, 2002.
TABLE 2-3M. U.S. MERCHANDISE TRADE WITH CANADA AND MEXICO BY TRANSPORTATION MODE
Source: U.S. Department of Transportation, Bureau of Transportation Statistics; U.S. Department of Commerce,Census Bureau; Statistics Canada; Transport Canada; Instituto Mexicano del Transporte; Instituto Nacional deEstadistica, Geografia e Informatica; Secretaria de Communicaciones y Transportes; North American Trade StatisticsDatabase, tables 6-1c and 6-2c, available at http://nats.sct.gob.mx as of November 2, 2005.
45
Table 2-1M. Freight Shipments by Weight and Value
Table 2-3M. U.S. Merchandise Trade with Canada and Mexico by Transportation Mode
Key: NA = Not available.1Other includes international shipments that moved via pipeline or by an unspecified mode.Notes: Domestic shipments by pipeline are excluded. Modal numbers may not add to totals due to rounding. 1 ton = 0.91 metric tonne.
Key: NA = not available.12001 data are from the U.S. Department of Transportation, Bureau of Transportation Statistics, International Trade and FreightTransportation Trends (Washington, DC: 2003), tables 22 and C-11, available at www.bts.gov as of July 12, 2004. “Other” includes“flyaway aircraft” (i.e., aircraft moving from the manufacturer to a customer and not carrying any freight), vessels moving under theirown power, pedestrians carrying freight, and miscellaneous.Notes: Individual modal totals may not sum to exact totals due to rounding. 1 ton = 0.91 metric tonne. For value, “Other” includesthe difference between the total value and the sum of the modes.
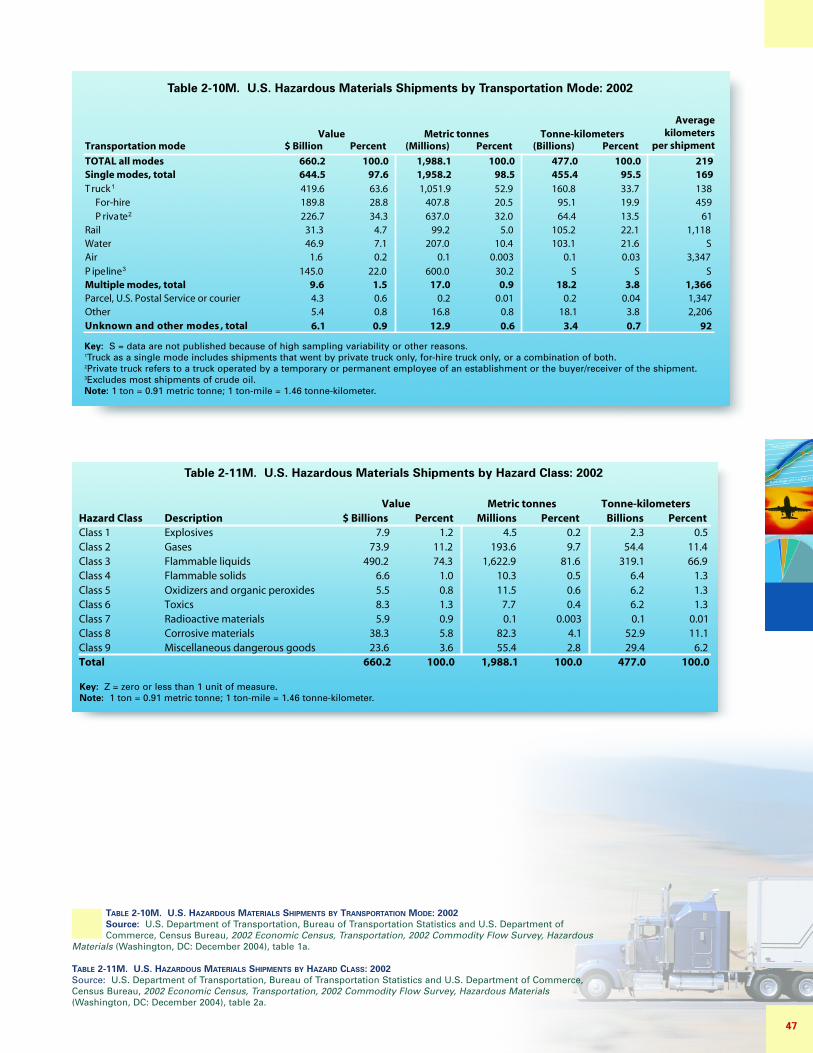
Value Metric tonnes Tonne-kilometersTransportation mode $ Billion Percent (Millions) Percent (Billions) Percent
TOTAL all modes 660.2 100.0 1,988.1 100.0 477.0 100.0 219Single modes, total 644.5 97.6 1,958.2 98.5 455.4 95.5 169
419.6 63.6 1,051.9 52.9 160.8 33.7 138For-hire 189.8 28.8 407.8 20.5 95.1 19.9 459
226.7 34.3 637.0 32.0 64.4 13.5 61Rail 31.3 4.7 99.2 5.0 105.2 22.1 1,118Water 46.9 7.1 207.0 10.4 103.1 21.6 SAir 1.6 0.2 0.1 0.003 0.1 0.03 3,347
145.0 22.0 600.0 30.2 S S SMultiple modes, total 9.6 1.5 17.0 0.9 18.2 3.8 1,366Parcel, U.S. Postal Service or courier 4.3 0.6 0.2 0.01 0.2 0.04 1,347Other 5.4 0.8 16.8 0.8 18.1 3.8 2,206
6.1 0.9 12.9 0.6 3.4 0.7 92
T ruck
P rivate
P ipeline
Unknown and other modes , total
Averagekilometers
per shipment
Value Metric tonnes Tonne-kilometersHazard Class Description $ Billions Percent Millions Percent Billions PercentClass 1 Explosives 7.9 1.2 4.5 0.2 2.3 0.5Class 2 Gases 73.9 11.2 193.6 9.7 54.4 11.4Class 3 Flammable liquids 490.2 74.3 1,622.9 81.6 319.1 66.9Class 4 Flammable solids 6.6 1.0 10.3 0.5 6.4 1.3Class 5 Oxidizers and organic peroxides 5.5 0.8 11.5 0.6 6.2 1.3Class 6 Toxics 8.3 1.3 7.7 0.4 6.2 1.3Class 7 Radioactive materials 5.9 0.9 0.1 0.003 0.1 0.01Class 8 Corrosive materials 38.3 5.8 82.3 4.1 52.9 11.1Class 9 Miscellaneous dangerous goods 23.6 3.6 55.4 2.8 29.4 6.2Total 660.2 100.0 1,988.1 100.0 477.0 100.0
TABLE 2-10M. U.S. HAZARDOUS MATERIALS SHIPMENTS BY TRANSPORTATION MODE: 2002Source: U.S. Department of Transportation, Bureau of Transportation Statistics and U.S. Department ofCommerce, Census Bureau, 2002 Economic Census, Transportation, 2002 Commodity Flow Survey, Hazardous
Materials (Washington, DC: December 2004), table 1a.
TABLE 2-11M. U.S. HAZARDOUS MATERIALS SHIPMENTS BY HAZARD CLASS: 2002Source: U.S. Department of Transportation, Bureau of Transportation Statistics and U.S. Department of Commerce,Census Bureau, 2002 Economic Census, Transportation, 2002 Commodity Flow Survey, Hazardous Materials(Washington, DC: December 2004), table 2a.
47
Table 2-10M. U.S. Hazardous Materials Shipments by Transportation Mode: 2002
Table 2-11M. U.S. Hazardous Materials Shipments by Hazard Class: 2002
Key: S = data are not published because of high sampling variability or other reasons.1Truck as a single mode includes shipments that went by private truck only, for-hire truck only, or a combination of both.2Private truck refers to a truck operated by a temporary or permanent employee of an establishment or the buyer/receiver of the shipment.3Excludes most shipments of crude oil. Note: 1 ton = 0.91 metric tonne; 1 ton-mile = 1.46 tonne-kilometer.
Key: Z = zero or less than 1 unit of measure.Note: 1 ton = 0.91 metric tonne; 1 ton-mile = 1.46 tonne-kilometer.
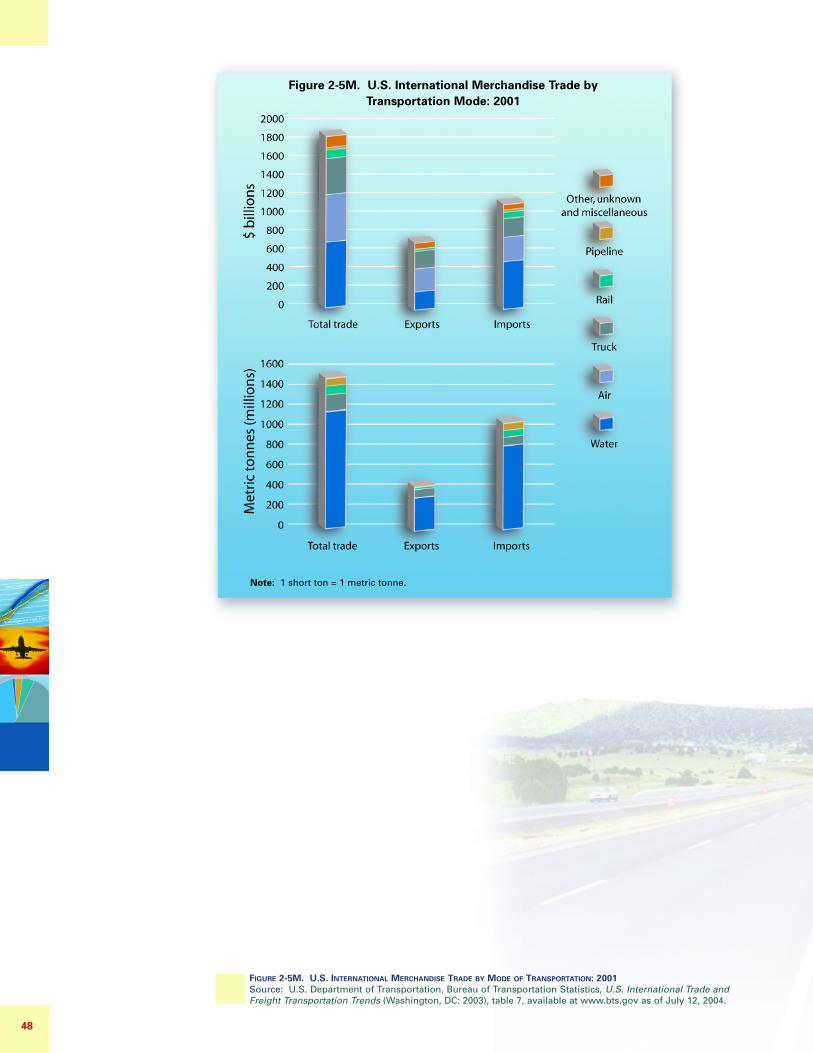
FIGURE 2-5M. U.S. INTERNATIONAL MERCHANDISE TRADE BY MODE OF TRANSPORTATION: 2001Source: U.S. Department of Transportation, Bureau of Transportation Statistics, U.S. International Trade andFreight Transportation Trends (Washington, DC: 2003), table 7, available at www.bts.gov as of July 12, 2004.
48
Figure 2-5M. U.S. International Merchandise Trade by Transportation Mode: 2001
Note: 1 short ton = 1 metric tonne.
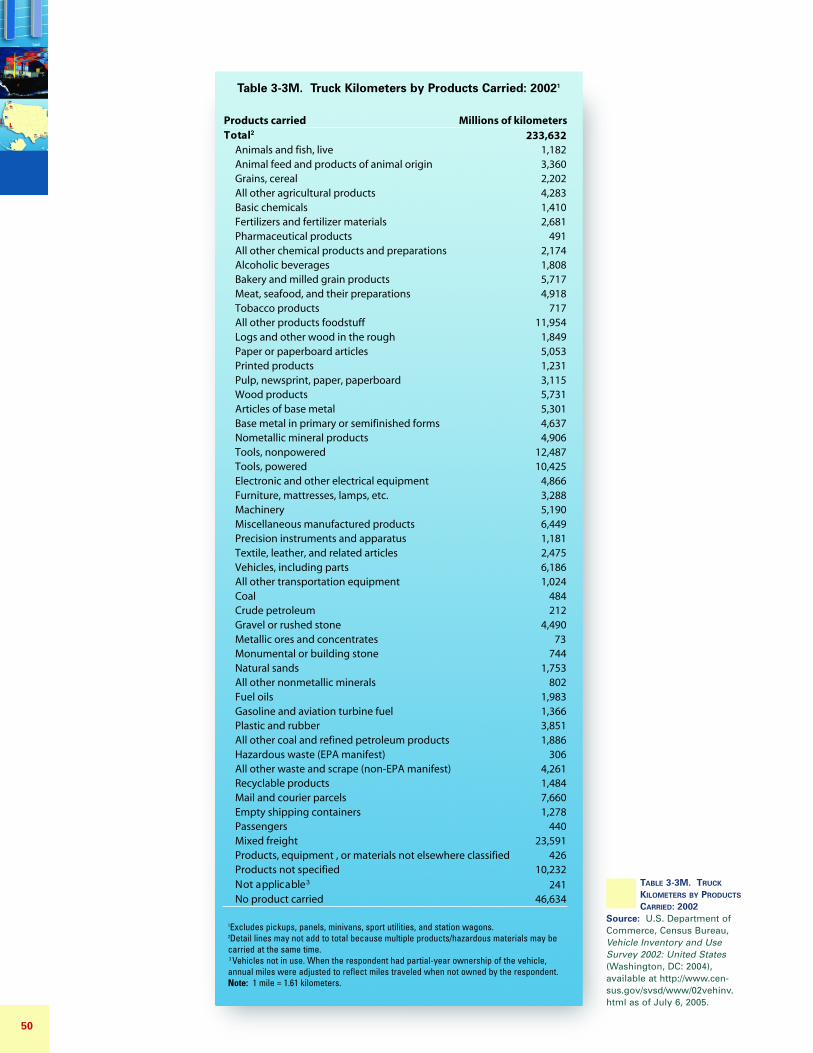
Products carried Millions of kilometers233,632
Animals and fish, live 1,182Animal feed and products of animal origin 3,360Grains, cereal 2,202All other agricultural products 4,283Basic chemicals 1,410Fertilizers and fertilizer materials 2,681Pharmaceutical products 491All other chemical products and preparations 2,174Alcoholic beverages 1,808Bakery and milled grain products 5,717Meat, seafood, and their preparations 4,918Tobacco products 717All other products foodstuff 11,954Logs and other wood in the rough 1,849Paper or paperboard articles 5,053Printed products 1,231Pulp, newsprint, paper, paperboard 3,115Wood products 5,731Articles of base metal 5,301Base metal in primary or semifinished forms 4,637Nometallic mineral products 4,906Tools, nonpowered 12,487Tools, powered 10,425Electronic and other electrical equipment 4,866Furniture, mattresses, lamps, etc. 3,288Machinery 5,190Miscellaneous manufactured products 6,449Precision instruments and apparatus 1,181Textile, leather, and related articles 2,475Vehicles, including parts 6,186All other transportation equipment 1,024Coal 484Crude petroleum 212Gravel or rushed stone 4,490Metallic ores and concentrates 73Monumental or building stone 744Natural sands 1,753All other nonmetallic minerals 802Fuel oils 1,983Gasoline and aviation turbine fuel 1,366Plastic and rubber 3,851All other coal and refined petroleum products 1,886Hazardous waste (EPA manifest) 306All other waste and scrape (non-EPA manifest) 4,261Recyclable products 1,484Mail and courier parcels 7,660Empty shipping containers 1,278Passengers 440Mixed freight 23,591Products, equipment , or materials not elsewhere classified 426Products not specified 10,232
241No product carried 46,634
Total
Not applicable TABLE 3-3M. TRUCK
KILOMETERS BY PRODUCTS
CARRIED: 2002Source: U.S. Department ofCommerce, Census Bureau,Vehicle Inventory and UseSurvey 2002: United States(Washington, DC: 2004), available at http://www.cen-sus.gov/svsd/www/02vehinv.html as of July 6, 2005.
50
Table 3-3M. Truck Kilometers by Products Carried: 20021
1Excludes pickups, panels, minivans, sport utilities, and station wagons. 2Detail lines may not add to total because multiple products/hazardous materials may becarried at the same time. 3 Vehicles not in use. When the respondent had partial-year ownership of the vehicle,annual miles were adjusted to reflect miles traveled when not owned by the respondent. Note: 1 mile = 1.61 kilometers.
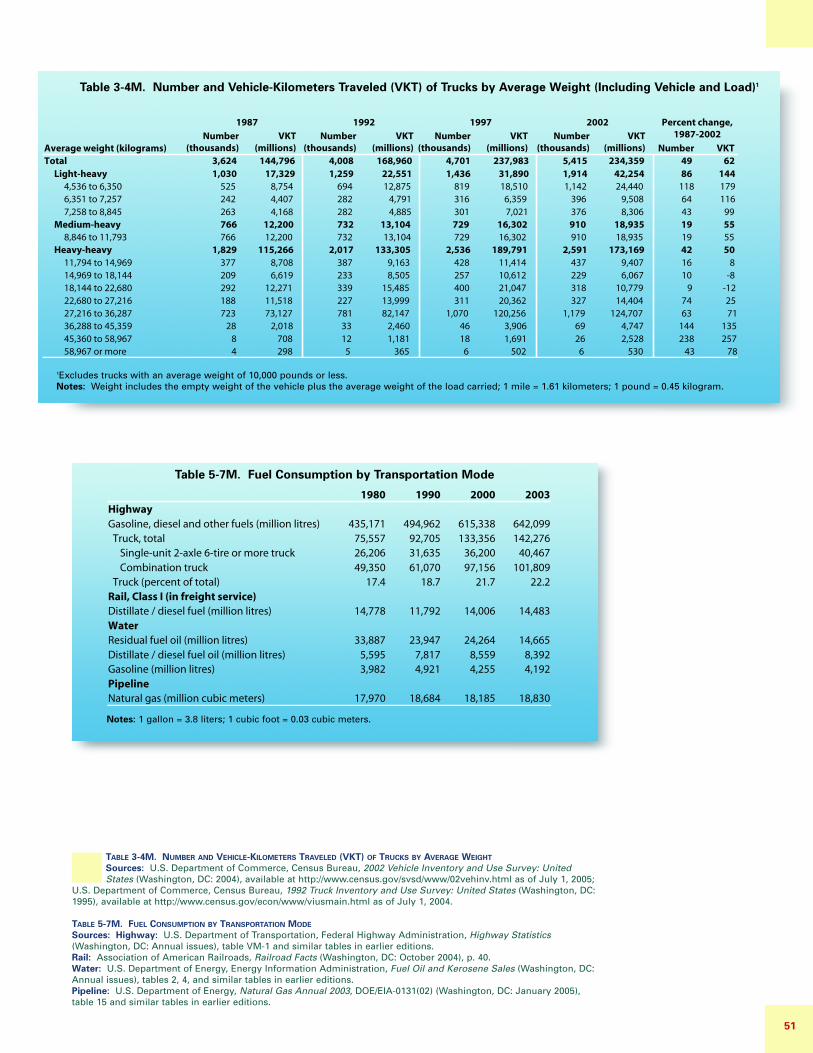
1980 1990 2000 2003HighwayGasoline, diesel and other fuels (million litres) 435,171 494,962 615,338 642,099 Truck, total 75,557 92,705 133,356 142,276 Single-unit 2-axle 6-tire or more truck 26,206 31,635 36,200 40,467 Combination truck 49,350 61,070 97,156 101,809 Truck (percent of total) 17.4 18.7 21.7 22.2Rail, Class I (in freight service)Distillate / diesel fuel (million litres) 14,778 11,792 14,006 14,483WaterResidual fuel oil (million litres) 33,887 23,947 24,264 14,665Distillate / diesel fuel oil (million litres) 5,595 7,817 8,559 8,392Gasoline (million litres) 3,982 4,921 4,255 4,192PipelineNatural gas (million cubic meters) 17,970 18,684 18,185 18,830
Average weight (kilograms)
1987 1992 1997 2002
Total 3,624 144,796 4,008 168,960 4,701 237,983 5,415 234,359Light-heavy 1,030 17,329 1,259 22,551 1,436 31,890 1,914 42,254
4,536 to 6,350 525 8,754 694 12,875 819 18,510 1,142 24,4406,351 to 7,257 242 4,407 282 4,791 316 6,359 396 9,5087,258 to 8,845 263 4,168 282 4,885 301 7,021 376 8,306
Medium-heavy 766 12,200 732 13,104 729 16,302 910 18,9358,846 to 11,793 766 12,200 732 13,104 729 16,302 910 18,935
Heavy-heavy 1,829 115,266 2,017 133,305 2,536 189,791 2,591 173,16911,794 to 14,969 377 8,708 387 9,163 428 11,414 437 9,40714,969 to 18,144 209 6,619 233 8,505 257 10,612 229 6,06718,144 to 22,680 292 12,271 339 15,485 400 21,047 318 10,77922,680 to 27,216 188 11,518 227 13,999 311 20,362 327 14,40427,216 to 36,287 723 73,127 781 82,147 1,070 120,256 1,179 124,70736,288 to 45,359 28 2,018 33 2,460 46 3,906 69 4,74745,360 to 58,967 8 708 12 1,181 18 1,691 26 2,52858,967 or more 4 298 5 365 6 502 6 530
Number(thousands)
VKT(millions)
Number(thousands)
VKT(millions)
Number(thousands)
VKT(millions)
Number(thousands)
VKT(millions)
Percent change,1987-2002
Number VKT49 6286 144
118 17964 11643 9919 5519 5542 5016 810 -8
9 -1274 2563 71
144 135238 257
43 78
TABLE 3-4M. NUMBER AND VEHICLE-KILOMETERS TRAVELED (VKT) OF TRUCKS BY AVERAGE WEIGHT
Sources: U.S. Department of Commerce, Census Bureau, 2002 Vehicle Inventory and Use Survey: UnitedStates (Washington, DC: 2004), available at http://www.census.gov/svsd/www/02vehinv.html as of July 1, 2005;
U.S. Department of Commerce, Census Bureau, 1992 Truck Inventory and Use Survey: United States (Washington, DC:1995), available at http://www.census.gov/econ/www/viusmain.html as of July 1, 2004.
TABLE 5-7M. FUEL CONSUMPTION BY TRANSPORTATION MODE
Sources: Highway: U.S. Department of Transportation, Federal Highway Administration, Highway Statistics(Washington, DC: Annual issues), table VM-1 and similar tables in earlier editions.Rail: Association of American Railroads, Railroad Facts (Washington, DC: October 2004), p. 40.Water: U.S. Department of Energy, Energy Information Administration, Fuel Oil and Kerosene Sales (Washington, DC:Annual issues), tables 2, 4, and similar tables in earlier editions.Pipeline: U.S. Department of Energy, Natural Gas Annual 2003, DOE/EIA-0131(02) (Washington, DC: January 2005),table 15 and similar tables in earlier editions.
51
Table 3-4M. Number and Vehicle-Kilometers Traveled (VKT) of Trucks by Average Weight (Including Vehicle and Load)1
Table 5-7M. Fuel Consumption by Transportation Mode
1Excludes trucks with an average weight of 10,000 pounds or less.Notes: Weight includes the empty weight of the vehicle plus the average weight of the load carried; 1 mile = 1.61 kilometers; 1 pound = 0.45 kilogram.
Notes: 1 gallon = 3.8 liters; 1 cubic foot = 0.03 cubic meters.
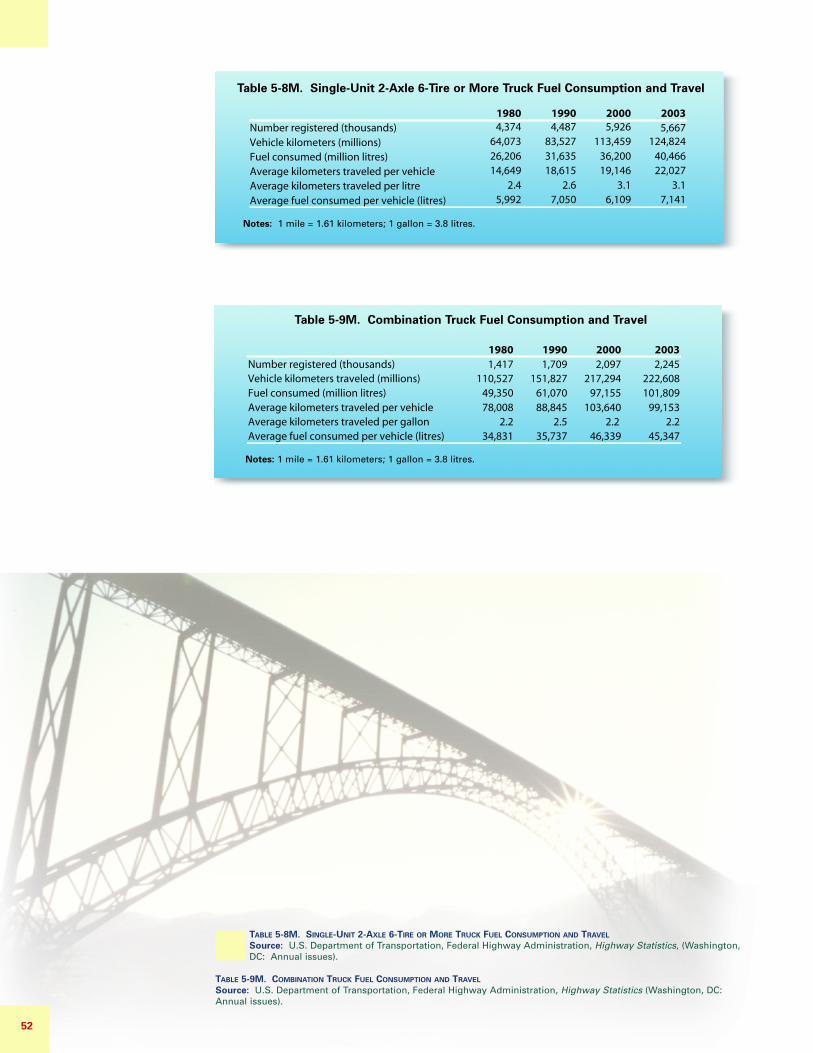
TABLE 5-8M. SINGLE-UNIT 2-AXLE 6-TIRE OR MORE TRUCK FUEL CONSUMPTION AND TRAVEL
Source: U.S. Department of Transportation, Federal Highway Administration, Highway Statistics, (Washington,DC: Annual issues).
TABLE 5-9M. COMBINATION TRUCK FUEL CONSUMPTION AND TRAVEL
Source: U.S. Department of Transportation, Federal Highway Administration, Highway Statistics (Washington, DC:Annual issues).
1980 1990 2000 2003Number registered (thousands) 4,374 4,487 5,926 5,667Vehicle kilometers (millions) 64,073 83,527 113,459 124,824
Fuel consumed (million litres) 26,206 31,635 36,200 40,466
Average kilometers traveled per vehicle 14,649 18,615 19,146 22,027
Average kilometers traveled per litre 2.4 2.6 3.1 3.1
Average fuel consumed per vehicle (litres) 5,992 7,050 6,109 7,141
1980 1990 2000 2003Number registered (thousands) 1,417 1,709 2,097 2,245Vehicle kilometers traveled (millions) 110,527 151,827 217,294 222,608Fuel consumed (million litres) 49,350 61,070 97,155 101,809Average kilometers traveled per vehicle 78,008 88,845 103,640 99,153Average kilometers traveled per gallon 2.2 2.5 2.2 2.2Average fuel consumed per vehicle (litres) 34,831 35,737 46,339 45,347
52
Table 5-8M. Single-Unit 2-Axle 6-Tire or More Truck Fuel Consumption and Travel
Table 5-9M. Combination Truck Fuel Consumption and Travel
Notes: 1 mile = 1.61 kilometers; 1 gallon = 3.8 litres.
Notes: 1 mile = 1.61 kilometers; 1 gallon = 3.8 litres.