Embed Size (px)
Citation preview

Appendix A
PREVIOUS INVESTIGATIONS IN THE REGION

Page 1 Project No. G1606 (Bylong)
A1. MT PENNY COAL PROJECT
The closest project is the Mt Penny Coal Project (MPCP), located directly to the north west of the Bylong Project. A preliminary environmental assessment was published in February 2011 outlining the MPCP and summarises the anticipated key environmental issues for the development. Mount Penny Coal (MPC) engaged Hydroilex Pty Ltd to evaluate existing groundwater resources of the area. Hydroilex installed 21 piezometers within the Project area to evaluate groundwater resources. The piezometers were located to provide a geographic spread of monitoring sites across the Project area and to collect hydrogeological data on the Goulburn River, Ulan and Coggan coal seam intervals, as well as the inter-burden and underburden sediments. Packer testing (Falling Head) in the sedimentary rock formations revealed that the only significant permeability occurs in the Ulan Lower Seam. The Marrangaroo Formation has low permeability, which contrasts with areas further to the west where it is known to be porous and forms a productive aquifer. At the confluence of the Bylong and Coggan Creeks, the alluvials have high permeability, elsewhere, the Coggan Creek alluvials are dry. Groundwater levels from screened intervals in the Ulan Lower Seam range from around 300 mAHD near the southern end of the resource area to approximately 230 mAHD at its northern end. This fall is consistent with seam structure and topography, which dips to the north and north east, at comparable grade (Wells Environmental Services, 2011). A2. WILPINJONG COAL PROJECT
Wilpinjong coal mine is located 25 km north west of Bylong and commenced production in 2006. GeoTerra carried out a baseline groundwater investigation in 2004 prior to mining. The studies collated available groundwater data and provided preliminary assessment of the hydrogeological regime within the lease area. Test bores were drilled, pumping tests undertaken and the data interpreted to provide hydraulic parameters. AGE developed a conceptual groundwater model of the area in 2005, based on the results of a site visit and review of available geological, hydrogeological and other data relevant to the site and the environment. The conceptual hydrogeological model was used to develop a numerical groundwater model of the area to simulate mine dewatering and a groundwater supply borefield. Hydraulic properties for the model were sourced from insitu permeability testing conducted on the monitoring bores. Various hydraulic tests including pump-out and slug tests were undertaken within the Project area by GeoTerra (2004). Analysis of the hydraulic tests indicated similar hydraulic conductivity in the Ulan Seam and underlying Marrangaroo Sandstone. A numerical groundwater model was developed to allow simulation of dewatering of a groundwater supply borefield. The model utilised the MODFLOW code and comprised of a refined grid of 70 m x 70 m in the area of the proposed pits, to 500 m x 1050 m in the extremities of the model. The model comprises of five layers, as follows:
• Layer 1 – Narrabeen Group;
• Layer 2 – Alluvium and Narrabeen Group;
• Layer 3 – Narrabeen Group and Illawara Coal Measures;
• Layer 4 – Ulan Seam; and
• Layer 5 – Marrangaroo Sandstone. The model was calibrated to steady state conditions using water level data from June-July 2004 monitoring bore water levels. The predicted response of the groundwater system to the proposed

Page 2 Project No. G1606 (Bylong)
mining schedule and operation of the borefield was assessed by running the model for 21 years in 42 stress periods. The mine has not needed to proceed with a borefield and a number of updates to the model have been undertaken. The major outputs from the model domain, in order of significance are:
• discharge to the creeks and Goulburn River (3.3 ML/day);
• mine dewatering (2.5 ML/day);
• borefield extraction (2.2 ML/day); and
• 1 m drawdown extent of 6 km to the northeast. A3. MOOLARBEN COAL PROJECT
Moolarben Coal, located 7 km north west of the Wilpinjong Project, started open cut production in May 2010. As part of the EIS process, a groundwater model was developed. A network of 42 piezometers was installed across the study area, establishing a geographic spread of monitoring points in the major hydrogeological units. An on-going baseline monitoring program was implemented, comprising monthly measurements of water levels and three-monthly sampling of groundwater for laboratory analysis from all piezometers. Four test production bores were constructed, and extended pumping tests carried out to determine aquifer hydraulic properties. Short pumping tests were also carried out on the piezometers. A number of permeability tests were conducted on existing monitoring and production bores to estimate the hydraulic properties of the key hydrostratigraphic layers. The only significant permeability occurs in the Ulan Seam and some parts of the overburden coal measures sediments within the Permian, and the Tertiary palaeo-channel alluvium. A numerical groundwater model was developed using MODFLOW with the objective of simulating potential impacts of the Moolarben Coal Project. The model comprised of five layers at a uniform cell size of 100 m x 100 m, viz:
• Layer 1 – Alluvial deposits and Narrabeen Group mainly, but also representing Illawarra Coal Measures and Basement where they occur in outcrop;
• Layers 2 and 3 – Illawarra Coal Measures containing interbedded coal, siltstone and mudstones, and basement lithologies in areas of outcrop;
• Layer 4 – Ulan Coal Seam, and basement lithologies in areas of outcrop; and
• Layer 5 – Shoalhaven Group and basement outcrop. The model was calibrated to transient groundwater level observations by representing historical pumping at the Ulan mining area. Open cut and underground mining was simulated using drain cells. There was no change to the hydraulic parameters of the mined areas (e.g. goafing and spoil emplacement) throughout the predictive mining simulation (Dundon, 2006). A stage 2 model was constructed using MODFLOW SURFACT code to simulate impacts of proposed additional mining activities (RPS Aquaterra, 2008, 2011). The model layers were refined as follows:
• Layer 1 – Quaternary Alluvium, Tertiary Alluvium, Regolith;
• Layer 2 – Triassic (Upper);
• Layer 3 – Triassic (lower);
• Layer 4 – Permian (upper);

Page 3 Project No. G1606 (Bylong)
• Layer 5 – Permian (middle);
• Layer 6 – Permian (lower);
• Layer 7 – Ulan Seam; and
• Layer 8 – Marangaroo sandstone, Ulan Granite, Volcanics. At the completion of mining, the predicted drawdowns 10 km east of the Project are 5 m in the Ulan Seam and 0.5 m in the undisturbed overlying coal measures. Lesser impacts are predicted associated with the three open cuts. Small localised drawdowns are predicted to occur in the Triassic Narrabeen Group aquifers, ranging up to 0.75 m by the completion of the Moolarben Project over a small area to the east. No adverse impacts are expected on any groundwater dependent ecosystems (GDEs), other than a possible disturbance to the present groundwater flow paths leading to one ephemeral seepage zone above the northern end. Existing groundwater supplies derived from the Quaternary alluvium and the basement granite and volcanics were predicted to be un-affected by the Project (RPS Aquaterra, 2008, 2011). A4. ULAN COAL PROJECT
Ulan Coal Mines Limited (UCML) is seeking approval to modify currently approved mining operations from five additional longwall panels within an area known as North 1. It is also proposing to modify the footprint of a number of panels in both the Underground 3 and Ulan West areas. Mining of coal at UCML has been conducted since the early 1920s. Current open cut and underground mining operations commenced in 1982 and 1986 respectively. Open cut mining ceased in 2008 due to approved coal reserves being exhausted but future open cut operations were addressed as part of the Environmental Assessment for continued operations lodged in 2009. A numerical groundwater model was developed using MODFLOW SURFACT to simulate the extent of groundwater impacts following the onset of mine dewatering (Mackie 2009, 2011). The progression of the mining workings was simulated using SURFACT drain cells. The model comprised 11 layers at a cell resolution of 50 m x 50 m to 200 m x 200 m, defined as follows:
• Layer 1 – Regolith, weathered bedrock, and alluvial infill deposits;
• Layers 2 and 3 – Jurassic sandstones-siltstones;
• Layers 4 and 5 – Triassic quartzose sandstones;
• Layer 6 – Triassic lithic sandstones;
• Layer 7 – Upper Permian coal measures;
• Layer 8 – Middle Permian coal measures;
• Layer 9 – Ulan Seam;
• Layer 10 – Lower Permian coal measures; and
• Layer 11 – Granite and meta sediments. Hydraulic conductivities assigned to each layer had been calculated through correlation to geologically logged rock types. Specific storage estimates were calculated from core laboratory measurements of Youngs Modulus and measurements of porosity. Specific yield estimates were derived from the permeability-porosity relationship developed from core tests. Permian interburden is predicted to depressurise to distances of 5 km to 15 km while Triassic strata are likely to depressurise generally to distances of about 4 km to 6 km (Mackie, 2009, 2011).

Appendix B
FIELD INVESTIGATION REPORT
Report on Hydrogeological Investigation and Monitoring -
August 2011 to October 2013
Proposed Coal MineBylong, Mid-Western NSW
Prepared for Cockatoo Coal Limited
Project 49761.03-07November 2013

Document History
Document details Project No. 49761.03 Document No. 7 Document title Report on Hydrogeological Investigation and Monitoring –
August 2011 to October 2013 Site address Proposed Coal Mine, Bylong, Mid-Western NSW Report prepared for Cockatoo Coal Limited File name P:\49761.03\Docs\49761.03-07.docx
Document status and review Revision Prepared by Reviewed by Date issued
0 Dana Wilson Will Wright 1 November 2013
Distribution of copies Revision Electronic Paper Issued to
0 1 0 Mr Shaun Smith, Cockatoo Coal Limited Mr Jason Princehorn, Cockatoo Coal Limited
The undersigned, on behalf of Douglas Partners Pty Ltd, confirm that this document and all attached drawings, logs and test results have been checked and reviewed for errors, omissions and inaccuracies.
Signature Date
Author
Reviewer
Douglas Partners Pty Ltd ABN 75 053 980 117
www.douglaspartners.com.au 15 Callistemon Close
Warabrook NSW 2304 PO Box 324
Hunter Region MC NSW 2310 Phone (02) 4960 9600
Fax (02) 4960 9601
Report on Hydrogeological Investigation and Monitoring, August 2011 October 2013 Project 49761.03-07Proposed Coal Mine, Bylong, Mid-Western NSW November 2013
Table of Contents
Page
1. Introduction ...................................................................................................................... 1
2. Geology ........................................................................................................................... 2
3. Drilling and Piezometer Installation ................................................................................. 3
3.1 Overview ............................................................................................................... 3
3.2 Methods ................................................................................................................ 4
3.3 Piezometer Completion Details ............................................................................. 4
4. Packer Testing ................................................................................................................ 6
4.1 Overview ............................................................................................................... 6
4.2 Methods ................................................................................................................ 6
4.3 Results .................................................................................................................. 7
5. Vibrating Wire Piezometers ........................................................................................... 10
5.1 Overview ............................................................................................................. 10
5.2 Methods .............................................................................................................. 11
5.3 Results ................................................................................................................ 11
6. Geotechnical Laboratory Testing .................................................................................. 13
6.1 Overview ............................................................................................................. 13
6.2 Results ................................................................................................................ 13
7. Piezometer Development and Rising Head Testing ...................................................... 16
7.1 Overview ............................................................................................................. 16
7.2 Methods .............................................................................................................. 16
7.3 Results ................................................................................................................ 16
8. Piezometer Level Monitoring ......................................................................................... 19
8.1 Overview ............................................................................................................. 19
8.2 Results ................................................................................................................ 20 8.2.1 Manual Gauging ...................................................................................... 20 8.2.2 Automated Level Logging ........................................................................ 23
9. Automated Salinity Logging ........................................................................................... 23
9.1 Overview ............................................................................................................. 23
9.2 Results ................................................................................................................ 24
10. Water Quality Monitoring ............................................................................................... 25

Report on Hydrogeological Investigation and Monitoring, August 2011 October 2013 Project 49761.03-07Proposed Coal Mine, Bylong, Mid-Western NSW November 2013
10.1 Overview ............................................................................................................. 25
10.2 Groundwater Sampling and Testing .................................................................... 25 10.2.1 Monitoring Locations ............................................................................... 25 10.2.2 Methods ................................................................................................... 26
10.3 Surface Water Sampling and Testing ................................................................. 27 10.3.1 Overview .................................................................................................. 27 10.3.2 Methods ................................................................................................... 28
10.4 Laboratory Testing .............................................................................................. 29
10.5 Analytical Results ................................................................................................ 30
10.6 Discussion ........................................................................................................... 30 10.6.1 Water Quality Plots .................................................................................. 30 10.6.2 Tri-Linear Analysis ................................................................................... 32
11. Surface Water Flow Monitoring ..................................................................................... 35
11.1 Overview ............................................................................................................. 35
11.2 Methods .............................................................................................................. 35
11.3 Results ................................................................................................................ 36
12. Conceptual Hydrogeological Model ............................................................................... 36
13. References .................................................................................................................... 40
14. Limitations ..................................................................................................................... 41
Appendix A: About this Report
Appendix B: Plots of Piezometric Head in Vibrating Wires (BY0011CH, BY0077CH, BY0080CH, BY0091CH, BY0208CH, AGE01, AGE03W)
Hydrograph Plots (Datalogger Water Level Plots)
Electrical Conductivity Plots (Salinity Datalogger Plots)
Surface Flow and Depth Plots (SW4, SW8, SW9) – July 2012 to October 2013
Appendix C: Table C1: Summary of Laboratory Test Results – February 2013 to October 2013
Groundwater Monitoring Quality Plots
Surface Water Monitoring Quality Plots
Appendix D: Drawing 1 – Piezometer Installation Options

1 of 41
Report on Hydrogeological Investigation and Monitoring, August 2011 October 2013 Project 49761.03-07Proposed Coal Mine, Bylong, Mid-Western NSW November 2013
Report on Hydrogeological Investigation and Monitoring - December 2011 to October 2013 Proposed Coal Mine, Bylong, Mid-Western NSW 1. Introduction
This report presents the results to date of ongoing hydrogeological investigation and monitoring for a proposed coal mine at Bylong in Mid-Western New South Wales (NSW). The work was undertaken for Cockatoo Coal Limited (CCL). CCL is planning the development of a coal mine at Bylong, located in Mid-Western NSW. The mine may comprise both open cut and underground workings, however, this is yet to be determined. The scope of investigations and monitoring are based on a Preliminary Hydrogeological Assessment and Water Monitoring Plan (Ref 7) which was prepared in consultation with the NSW Office of Water (NOW). The plan has periodically been reviewed and updated, based on the ongoing results of monitoring and the suggested requirements of Australian Groundwater Engineers (AGE) who are undertaking numerical modelling of groundwater impacts associated with the proposed development. The most recent revision (Revision 3) includes additional monitoring requirements received from the NOW in May 2013. This report presents the results of monitoring from December 2011 to October 2013 for the purposes of the Gateway Application report and comprises the following:
Drilling, logging and installation of standpipe piezometers in dedicated investigation bores;
Installation of standpipe piezometers in selected exploration bores;
Packer testing of rock strata within coal exploration and dedicated investigation bores;
Installation and monitoring of vibrating wire piezometers (VWP) in coal exploration and dedicated investigation bores;
Laboratory hydraulic testing of selected rock cores;
Rising head and falling head hydraulic testing within installed standpipe piezometers;
Automated logging of piezometric head and Electrical Conductivity (EC) at selected locations;
Manual gauging of piezometric head in standpipe piezometers;
Groundwater and surface water sampling and chemical analyses at selected locations;
Automated logging of surface water flow velocity at three locations;
Updated conceptual hydrogeological model. Douglas Partners Pty Ltd (DP) has prepared factual reports presenting the results of monitoring throughout the course of the investigation. These are summarised in Table 1 and Section 13.

2 of 41
Report on Hydrogeological Investigation and Monitoring, August 2011 October 2013 Project 49761.03-07Proposed Coal Mine, Bylong, Mid-Western NSW November 2013
Table 1: Summary of Douglas Partners Data Reports Issued to Date
Report Date Report Title DP Project / Report No.
Report Revision
No.
Reference No
(Section 13)2 April 2012 Results of Cone Penetration Testing 49761.02 - 3
16 April 2012 Summary of Groundwater Assessment to Date 49761.00-03 - 4
31 August 2012 Interim Factual Report on Hydrogeological Investigation and Monitoring
49761.03 - 5
7 January 2013 Interim Factual Report on Hydrogeological Investigation and Monitoring, August to December 2012
49761.03-02 Rev 1 6
20 June 2013 Report on Baseline Groundwater and Surface Water Quality Monitoring, February 2012 to May 2013
49761.03-04 - 8
26 July 2013 Interim Factual Report on Hydrogeological Investigation and Monitoring, January to July 2013
49761.03-05 Rev 1 9
2. Geology
Published Geological Mapping indicates that the geology at the site comprises the following:
Surface Quaternary Alluvium along the valleys, generally associated with the above creeks and river;
Bedrock stratigraphy dips gently to the north-north west at about 2o and comprises the following
units:
o Narrabeen Sandstone (generally outcropping on more elevated peaks in the south of the site and more generally in north western parts of site), overlying;
o Illawarra Coal Measures, including target coal seams (generally outcropping on the valley sides on the northern parts of the site), overlying;
o Shoalhaven Group (outcropping on valley sides in southern and western parts of site).
There are also some areas of Tertiary granite, including an extensive outcrop on the north western parts of the site.
Mapping of the likely extent of Alluvium on the site has been undertaken on the basis of published geological maps as well as examination of LIDAR survey data and stereo pairs of aerial photographs. The inferred extent of alluvium is illustrated on Drawing 1, Appendix D. Additional information from CCL based on exploration to date indicates the following:
There seems to be three sub-parallel fault lines oriented in a northeast to southwest direction on the northern parts of the site. No information on the dip or throw of the faults is available at this time;
The main economic seam at the site is understood to be the Coggan Seam, which is overlain by the Ulan Seam with an inter-burden thickness, typically of about 10 m;

3 of 41
Report on Hydrogeological Investigation and Monitoring, August 2011 October 2013 Project 49761.03-07Proposed Coal Mine, Bylong, Mid-Western NSW November 2013
The depth of cover is expected to range from less than 60 m along the central and southern valleys to depths of up to 300 m below the ridges on the central and northern parts of the site;
The seams are understood to be replaced by igneous intrusions over some parts of the northern portion of the site.
Results of drilling to date indicate that the alluvial soils generally comprise inter-bedded clay and sand, with gravels often encountered near the base of the alluvium, further underlain by basement rock. The depth of the alluvium was found to vary from 5.0 m to 17.9 m. The coal measures rocks typically comprise a relatively thin weathered zone underlain by fresh rock, comprising, siltstone, sandstone, laminite, conglomerate and coal with minor tuff layers and igneous intrusions. 3. Drilling and Piezometer Installation
3.1 Overview
Installation of piezometers was undertaken with reference to the locations identified in the Preliminary Hydrogeological Assessment and Water Monitoring Plan (Ref 7). The purpose of piezometer installation under the plan was to enable the following:
Identification of aquifers, their depths, behaviour, where they contain layers and their connectivity with the surrounding aquifers or surface water systems;
Assessment of the type, quantity and quality of water within the aquifer systems;
Allows for the development of a refined conceptual model for the site as well as future development of a calibrated computer model of regional groundwater behaviour to enable the impacts of the proposed mining operations to be assessed.
Piezometers were installed in selected CCL bores drilled as part of the exploration program as well as bores dedicated for the purpose of piezometer installation and hydrogeological testing. The piezometer locations were distributed to allow coverage of the following:
Locations between the mapped alluvium and the likely areas of mining, which will be critical to assessing potential impacts of the mining on the alluvium;
Locations either side of the inferred faults to allow assessment of the likely impact of the faulting on groundwater flows;
General spread across proposed areas of mining; and
Additional bores requested by NOW to increase the general spread of locations;
Additional bores as requested by AGE for the development of the calibrated computer model of regional groundwater behaviour.
The identification of bores comprised the following:

4 of 41
Report on Hydrogeological Investigation and Monitoring, August 2011 October 2013 Project 49761.03-07Proposed Coal Mine, Bylong, Mid-Western NSW November 2013
Prefix:
“BY”: bores forming part of the CCL exploration program;
“A”: bores drilled in the Alluvium;
“AGE”: additional bores requested by AGE for the purposed of regional hydrogeological modelling. AGE bores were primarily targeted to the Alluvium;
“CPT”: additional bores previously subject to Cone Penetration Testing (CPT). Suffix:
“-S”: alluvial bore screened in the alluvium at shallow depth (i.e. paired piezometer location);
“-D”: alluvial bore screened in the alluvium at deeper depth (i.e. paired piezometer location);
“-W”: bore screened in the weathered rock profile. The piezometers were screened at targeted depths comprising Alluvium (shallow or deeper depth), Coal Measures (Coggan Seam and/or Ulan Seam) or weathered rock underlying Alluvium. The locations of installed piezometers to October 2013 are presented on Drawing 1, Appendix D. 3.2 Methods
Standpipe piezometers were constructed of 50 mm ID Class 18 uPVC casing with threaded connections. Machine slotted screens at the targeted depths were typically 4.5 m to 7.5 m in length and up to 12 m long. Sumps of between of 1.5 m to 6.0 m were installed below the screen in selected piezometers. Filter packs comprising 2 mm to 5 mm graded and washed gravel were installed within the bore annulus to at least 0.10 m above of the screen. A bentonite seal was placed above the filter pack. The piezometers were completed at the surface with metal monuments. 3.3 Piezometer Completion Details
The subsurface conditions encountered at the test bore locations have previously been presented in References 3 to 6 and 9. For conciseness these results are not reported herein. The completion and survey details for piezometers installed to October 2013 are shown in Table 2. The survey of piezometers was undertaken by de Witt Consulting. Where survey was not undertaken, the coordinates and levels have been estimated from the 0.25 m LIDAR supplied by CCL and are approximate only. The locations of the piezometers are shown on Drawing 1 in Appendix D.

5 of 41
Report on Hydrogeological Investigation and Monitoring, August 2011 October 2013 Project 49761.03-07 Proposed Coal Mine, Bylong, Mid-Western NSW November 2013
Table 2: Summary of Piezometer Completion Details Piezometer
IDAlternate
Piezometer IDEasting Northing
Surface Elevation
(AHD)
Depth (m)
PVC Stickup
(m)
Screened Stratum / Target Stratum
Bentonite Depth (m) Screen Depth (m)
Sump Depth, if present (m)
A01-S - 230,108.66 6,412,946.86 247.29 8.5 0.67 Alluvium (shallow ) 1.0-1.8 1.9-7.9 7.9-8.5A01-D - 230,112.43 6,412,947.21 247.25 20.6 0.64 Alluvium (deep) 13.8-14.4 15.6-18.6 18.6-20.6A02-S - 230,425.12 6,404,123.10 299.73 3.8 0.74 Alluvium (shallow ) 0-0.6 0.8-3.8 -A02-D - 230,426.19 6,404,123.04 299.76 8.5 0.73 Alluvium (deep) 3.7-5.1 5.5-8.5 -A03-S - 232,474.91 6,405,318.87 288.08 3.5 0.62 Alluvium (shallow ) 0-0.3 0.5-3.5 -A03-D - 232,474.86 6,405,317.43 288.08 9.4 0.84 Alluvium (deep) 0-0.3, 5.7-6.2 6.4-9.4 -A04 - 233,787.53 6,405,925.52 294.59 5.2 0.73 Alluvium 0-0.2 0.8-5.2 -
A06-S - 231,263.45 6,407,411.12 275.34 4.5 0.60 Alluvium (shallow ) 0-1.2 1.5-4.5 -A06-D - 231,263.58 6,407,412.54 275.32 10.0 0.52 Alluvium (deep) 5.7-6.9 7.0-10.0 -A08-S - 230,227.13 6,408,489.10 267.14 5.0 0.89 Alluvium (shallow ) 0-0.3, 1.5-1.8 2.0-5.0 -A08-D - 230,228.54 6,408,487.47 267.14 8.6 0.78 Alluvium (deep) 5.0-5.4 5.6-8.6 -
A09/SW2 - 228,645.01 6,409,926.89 255.97 6.6 0.74 Alluvium 0.1-0.4 0.6-6.6 -A10 - 230,453.79 6,406,647.50 278.25 9.0 0.79 Alluvium 0-0.2, 2.3-2.8 3.0-9.0 -
A11-S - 230,165.87 6,402,187.47 312.52 3.9 0.55 Alluvium (shallow ) 0-0.8 0.9-3.9 -A11-D - 230,165.93 6,402,188.79 312.50 12.2 0.57 Alluvium (deep) 4.8-6.1 6.2-12.2 -
A12/SW7 - 229,870.65 6,398,592.86 341.80 6.2 0.80 Alluvium 0-0.2 0.2-6.2 -A13 - 229,512.16 6,411,279.12 251.58 7.6 0.66 Clay and Sand and Sand/Gravel 0.9-1.4 1.2-7.2 7.2-7.6
A14/SW5 - 225,357.07 6,406,838.83 280.17 8.3 0.69 Alluvium 0-0.2, 1.8-2.1 2.1-8.3 -A15/SW1 - 234,817.03 6,405,882.93 299.99 6.3 0.74 Alluvium 0-0.1 0.3-6.3 -A16/SW6 - 226,405.21 6,416,909.90 220.01 1.3 0.81 Alluvium 0-0.1 0.2-1.3 -
A17-S - 230,060.51 6,401,190.43 321.09 4.15 0.65 Alluvium 0-0.6 1.2-4.2 -A17-D - 230,059.46 6,401,190.67 321.11 11.3 0.65 Alluvium 4.7-7.1 7.3-11.3 -
A18/SW9 - 229,979.01 6,400,327.55 327.63 6.2 0.65 Alluvium 0-0.2 0.2-6.2 -A19/SW4 - 229,994.66 6,412,727.94 246.29 5.2 0.74 Alluvium 1.7-2.0 2.2-5.2 -A20/SW8 - 231,186.36 6,407,756.08 273.73 7.2 0.68 Alluvium 0-0.9 1.2-7.2 -
A21 - 233,693.28 6,403,938.79 313.68 14.95 0.63 Alluvium 7.0-8.05, 14.3-14.95 8.3-14.3 -A22 - 230,922.13 6,412,502.54 261.69 7.2 0.63 Alluvium 1.7-2.0 2.2-7.2 -A23 - 230,567.69 6,401,122.03 333.42 9.4 0.63 Alluvium 2.9-3.2 3.4-9.4 -
A23-W - 230,567.63 6,401,124.12 333.28 16.4 0.54 Weathered Zone 8.8-10.35 10.4-16.4 -A24-S - 230,810.08 6,400,663.99 342.48 5.4 0.58 Alluvium (shallow ) 1.9-2.2 2.4-5.4 -A24-D - 230,808.88 6,400,665.51 342.42 8.6 0.46 Alluvium (deep) 4.8-5.3 5.6-8.6 -A25 - 231,231.06 6,400,351.88 351.49 5.5 0.61 Alluvium 2.0-2.3 2.5-5.5 -
AGE01-D - 229,452.11 6,414,924.63 237.36 9.4 0.60 Alluvium (deep) 5.9-6.2 6.4-9.4 -AGE01-S - 229,452.90 6,414,924.53 237.35 4.8 0.72 Alluvium (shallow ) 1.3-1.6 1.8-4.8 -AGE01-W - 229,450.88 6,414,924.81 237.38 20.5 0.51 Weathered Zone 11.7-14.3 14.45-20.45 -AGE03-W - 230,107.64 6,412,878.03 246.93 24.15 0.65 Weathered Zone 16.7-18.0 18.0-24.15 -
AGE04 - 228,634.90 6,411,382.00 257.08 66.17 0.68 Coggan Seam 54.0-56.5 57.17-63.17 63.17-66.17AGE04-S - 228,637.65 6,411,382.90 257.05 11.3 0.52 Alluvium 2.5-5.05 5.3-11.3 -AGE04-D - 228,636.91 6,411,382.67 257.07 17.3 0.56 Alluvium 9.0-14.0 14.3-17.3 -AGE04-W - 228,635.88 6,411,382.32 257.06 25.95 0.57 Weathered Zone 17.4-19.7 19.95-25.95 -
AGE05 - 227,890.76 6,410,501.47 259.92 50.9 0.57 Coggan Seam 36.0-41.7 41.9-47.9 47.9-50.9AGE05-A - 227,889.84 6,410,500.11 259.91 8.4 0.57 Alluvium 4.5-5.4 5.4-8.4 -AGE05-W - 227,891.49 6,410,502.59 259.88 15.7 0.62 Weathered Zone 8.4-9.5 9.7-15.7 -
AGE07 - 228,648.82 6,409,111.16 270.68 42.03 0.67 Ulan and Coggan Seams 20.5-23.0, 36.5-42.03 24.1-36.1 36.1-42.03AGE07W - 228,647.04 6,409,111.72 270.68 20.00 0.64 Weathered Zone 6.9-8.9, 17.55-20.0 9.5-17.0 17-20AGE08 - 231,144.41 6,407,146.65 282.09 36.4 0.61 Coggan Seam 25.7-29.25, 34.0-36.4 29.4-33.9 34.0-36.4
AGE08-W - 231,144.14 6,407,147.66 282.03 13.8 0.72 Weathered Zone 5.5-7.5 7.8-13.8 -AGE09 BY0173CH 229,945.09 6,406,679.91 285.69 36.45 0.63 Coggan Seam 21.7-23.9, 28.8-36.3 24.1-28.6 28.6-31.6
AGE09W - 229,944.95 6,406,677.52 285.81 18.06 0.69 Weathered Zone 5.5-6.9, 15.5-18.06 7.56-15.06 15.06-18.06AGE10 BY0206CH 231,810.02 6,405,355.85 298.30 54.24 0.50 Coggan Seam 37.6-40.6, 45.55-48.55 41.0-45.5 45.5-48.5
AGE10W - 231,809.03 6,405,352.84 298.47 20.98 0.54 Weathered Zone 9.6-11.35, 18.5-21 12.0-18.0 18.0-20.98AGE11-W - 230,633.50 6,402,142.12 326.05 14.2 0.63 Weathered Zone 3.6-5.1 5.2-14.2 -AGE12-W - 230,011.41 6,400,310.11 327.69 22.6 0.43 Weathered Zone 11.4-13.2 13.4-22.6 -
AGE13 - 231,057.20 6,401,937.49 354.97 45.1 0.60 Coggan Seam 34.5-37.1 37.6-43.6 43.6-45.1AGE13-W - 231,057.16 6,401,936.48 355.05 14.1 0.56 Weathered Zone 2.5-4.05 4.1-14.1 -
BY0091CH-B - 231,771.61 6,410,453.69 363.78 23.0 0.59 Basalt 11.4-16.0 17.0-23.0 -BY0091CH-S - 231,770.52 6,410,452.08 363.79 36.0 0.64 Sandstone 25.5-29.5 30.0-36.0 -
CP009 BY0015CH 230,110.74 6,412,947.42 247.28 90-96 0.70 Coggan Seam 87.7-88.7 90-96 96-97.6CP014 BY0010CH 231,893.40 6,412,109.72 301.40 161-167 0.74 Coggan Seam 129.5-131 133-139 139-141.5CP027 BY0014CH 229,610.69 6,410,330.43 259.38 50.2-56.2 0.73 Coggan Seam 46-48 50.2-56.2 56.2-57.1CP028 BY0007CH 230,443.10 6,410,217.48 368.85 161-167 0.35 Coggan Seam 157.5-159 161-167 167-169.5CP035 BY0001CH 233,581.28 6,409,309.91 375.92 185-191 0.84 Coggan Seam 180-184 185-191 191-195CP045 BY0016CH 231,315.42 6,408,236.37 292.79 39.8-45.8 0.69 Coggan Seam 36.8-37.8 39.8-45.8 45.8-47.5CP063 BY0204CH 232,615.78 6,405,078.96 296.75 62.50 0.74 Coggan Seam 53.4-54.8, 61.2-63.0 55.0-61.0 61.0-62.5CPT13 BY0174CH 231,033.87* 6,406,771.27* 290.93* 39.40 0.62* Coggan Seam 27.0-28.5, 33.7-39.4 28.9-33.4 33.4-36.4CPT15 - 231,051.06 6,405,928.40 285.63 14.91 0.64 Weathered Zone 5.9-6.85, 13.4-14.91 7.21-13.21 13.21-14.91CPT18 - 230,967.96 6,405,353.76 297.37 23.53 0.47 Weathered Zone 9.0-10.55, 19.0-19.9 11.5-19.0 -CPT36 - 232,343.35 6,404,982.41 301.42 59.15 0.64 Weathered Zone 0.4-7.65, 15.5-44.5, 50.5-54.25 8.0-15.5 -
CPT39W CP129 231,241.22 6,405,086.38 306.47 41.96 0.63 Weathered Zone 11.85-14.6, 22.1-23.1 16.0-22.1 -OP020 BY0188 230,858.02 6,404,063.52 326.48 43.56 0.62 Ulan and Coggan Seams 23.9-26.3, 32.5-36.0 26.5-32.5 32.5-35.5OP032 - 229,258.08 6,400,152.31 382.99 7.9 0.56 Weathered Zone 0.3-4.8 4.8-6.35 -
Notes to Table 2: Survey levels provided by CCL * Levels are approximate and determined from CCL provided LIDAR survey. Detailed survey levels to be advised.

6 of 41
Report on Hydrogeological Investigation and Monitoring, August 2011 October 2013 Project 49761.03-07Proposed Coal Mine, Bylong, Mid-Western NSW November 2013
4. Packer Testing
4.1 Overview
Packer testing was undertaken for selected bores to provide an estimate of the effective permeability of the rock mass at selected depth intervals. The field work was carried out over several periods from August 2011 to October 2013 to coincide with the drilling program. The bores and test periods are summarised in Table 3. Table 3: Summary of Packer Testing
Test Periods Bores
August 2011 BY0014CH, BY0015CH, BY0016CH and BY0011CH (blocked)
June to July 2012 BY0077CH, BY0080CH, BY0091CH and BY0011CH (re-drilled)
September to November 2012 AGE01 (full profile), BY0011CH, BY0077CH, BY0080CH and BY0091CH (base section of bores only)
April 2013 BY0207CH and BY0208CH
21 May 2013 to 5 June 2013 CPT18, CPT36, CPT39 It is noted that additional packer testing for selected bores commenced in September 2013 and is due for completion in November 2013. These test results are not yet available and are therefore not included in this report. 4.2 Methods
The packer system isolated a section of rock by inflating rubber membranes at either end of a chosen test section, typically a 6 m section. Water was then pumped into the test section through the drill rods. The pumping was carried out at successive rising and falling test pressures comprising five stages: three upward pressures followed by two downward pressures. At each stage, or pressure, water loss into the test section was measured and recorded at one minute intervals. Peak pressures (in kPa) were initially set to a maximum of 15 times overburden depth (m). During the second stage of packer testing, which was generally undertaken on deeper bores at higher elevations it was observed that dilation of the rock was occurring at relatively shallow depth and therefore it was necessary to reduce peak pressured to 10 times the overburden, or less with some dilation still noted at times. A number of the tests indicated increasing permeability over the five stages, suggesting that some wash-out of material was occurring due to the testing. In these instances the estimated in-situ hydraulic conductivity as well as the washed-out hydraulic conductivity was recorded.

7 of 41
Report on Hydrogeological Investigation and Monitoring, August 2011 October 2013 Project 49761.03-07Proposed Coal Mine, Bylong, Mid-Western NSW November 2013
4.3 Results
The estimated permeabilities from packer testing are summarised in Table 4 Table 4: Summary of Estimated Hydraulic Conductivity from Packer Testing
Bore ID Depth (m) Estimated K K washed Out
Description From To (m/s) (m/d) (m/s) (m/d)
BY0011CH Water at 33 m 34.06 40.73 5.2x10⁻¹⁰ 4.5x10⁻⁵ Basalt 70.06 76.73 4.6x10⁻⁷ 4.0x10⁻² Sandstone 97.06 103.73 2.2x10⁻¹⁰ 1.9x10⁻⁵ Mudstone, coal 100.03 106.7 9.7x10⁻⁹ 8.4x10⁻⁴ Coal/tuff 106.06 112.73 6.9x10⁻¹⁰ 6.0x10⁻⁵ Tuff, Sandstone 112.06 118.73 5.2x10⁻¹⁰ 4.5x10⁻⁵ Sandstone, coal 127.06 133.73 1.6x10⁻⁹ 1.4x10⁻⁴ Sandstone 133.56 140.23 1.5x10⁻⁹ 1.3x10⁻⁴ Sandstone, coal 139.06 145.73 5.5x10⁻⁹ 4.8x10⁻⁴ Siltstone 145.06 151.73 5.7x10⁻⁹ 4.9x10⁻⁴ Sandstone 154.06 160.73 1.5x10⁻⁹ 1.3x10⁻⁴ Siltstone, coal 169.06 157.73 3.8x10⁻⁹ 3.3x10⁻⁴ Sandstone/siltstone 175.06 181.73 9.6x10⁻⁹ 8.3x10⁻⁴ Siltstone, coal 181.06 187.73 8.4x10⁻⁹ 7.3x10⁻⁴ Sandstone 187.06 193.73 3.6x10⁻⁸ 3.1x10⁻³ 2.6x10⁻⁷ 2.2x10⁻² Sandstone, minor coal 193.06 199.73 1.6x10⁻⁸ 1.4x10⁻³ 7.6x10⁻⁸ 6.6x10⁻³ Ulan 199.06 205.73 6.4x10⁻⁹ 5.5x10⁻⁴ Coggan 205.56 212.23 4.0x10⁻⁹ 3.5x10⁻⁴ Sandstone 214.16 220.83 1.9x10⁻⁹ 1.6x10⁻⁴ Sandstone 220.16 226.83 1.9x10⁻⁹ 1.6x10⁻⁴ Sandstone 226.26 232.83 1.4x10⁻⁹ 1.2x10⁻⁴ Sandstone 232.16 238.16 8.3x10⁻⁹ 7.2x10⁻⁴ Sandstone
BY0014CH
16.58 23.25 7.0x10⁻⁹ 6.0x10⁻⁴ Siltstone, coal, carbonaceous shale
21.58 28.25 4.0x10⁻⁹ 3.5x10⁻⁴ Siltstone, coal, sandstone 27.58 34.25 4.0x10⁻⁶ 3.5x10⁻¹ Sandstone, coal, carb shale
33.58 40.25 2.0x10⁻⁶ 1.7x10⁻¹ Sandstone, coal, carb shale, siltstone
39.58 46.25 3.0x10⁻⁶ 2.6x10⁻¹ Shale, tuff, coal 43.58 50.25 1.0x10⁻⁶ 8.6x10⁻² Siltstone, sandstone
49.58 56.25 5.0x10⁻⁶ 4.3x10⁻¹ Coal, siltstone, sandstone, conglomerate
55.58 62.25 2.0x10⁻⁶ 1.7x10⁻¹

8 of 41
Report on Hydrogeological Investigation and Monitoring, August 2011 October 2013 Project 49761.03-07Proposed Coal Mine, Bylong, Mid-Western NSW November 2013
Table 4: Summary of Estimated Hydraulic Conductivity from Packer Testing (Continued)
Bore ID Depth (m) Estimated K K washed Out
Description From To (m/s) (m/d) (m/s) (m/d)
BY0015CH
28.0 34.7 1.0x10⁻⁵ 8.6x10⁻¹ Sandstone, conglomerate, siltstone
34.0 40.7 1.0x10⁻⁵ 8.6x10⁻¹
Sandstone, coal, carbonaceous shale, siltstone
40.0 46.7 3.0x10⁻⁸ 2.6x10⁻³ Siltstone, shale, siderite, carbonaceous shale, tuff
46.0 52.7 7.0x10⁻⁸ 6.0x10⁻³
Siltstone, tuff carbonaceous shale, coal, sandstone, mudstone
52.0 58.7 2.0x10⁻⁷ 1.7x10⁻²
Siltstone, shale, carbonaceous shale, tuff, coal
58.0 64.7 7.0x10⁻⁸ 6.0x10⁻³ Carbonaceous shale
64.0 70.7 2.0x10⁻⁸ 1.7x10⁻³
Mudstone, coal, carbonaceous shale, siltstone, tuff
70.0 76.7 3.0x10⁻⁷ 2.6x10⁻² Carbonaceous shale, siltstone, sandstone, coal
76.0 82.7 8.0x10⁻⁷ 6.9x10⁻² Mudstone
82.0 88.7 3.0x10⁻⁷ 2.6x10⁻²
Mudstone, coal, carbonaceous shale, sandstone, tuff
85.0 91.7 5.0x10⁻⁷ 4.3x10⁻² Sandstone, coal, tuff
90.5 97.2 2.0x10⁻⁶ 1.7x10⁻¹ Sandstone, coal, carbonaceous shale
BY0077CH Water at 46 m 25.18 31.86 2.0x10⁻⁹ 1.7x10⁻⁴ 5x10⁻⁹ 4.3x10⁻⁴ Conglomerate 45.53 51.19 3.7x10⁻⁹ 3.2x10⁻⁴ Sandstone/siltstone 99.03 105.71 6.8x10⁻⁹ 5.9x10⁻⁴ Sandstone/coal 105.03 110.69 1.4x10⁻⁷ 1.2x10⁻² Sandstone/coal 111.03 113.63 5.8x10⁻⁸ 5.0x10⁻³ Ulan 114.03 116.63 4.8x10⁻⁷ 4.1x10⁻² Sandstone 117.03 120.65 1.5x10⁻⁶ 1.3x10⁻¹ Coggan 123.03 124.61 9.5x10⁻⁹ 8.2x10⁻⁴ Sandstone/siltstone 126.47 132 5.4x10⁻¹⁰ 4.7x10⁻⁵ Mudstone 135.5 141.0 1.0x10⁻⁹ 8.6x10⁻⁵ Sandstone 142.5 147.7 1.0x10⁻⁹ 8.6x10⁻⁵ Sandstone
BY0080CH Water at about 130 m 174.85 179.49 2.4x10⁻⁹ 2.1x10⁻⁴ Siltstone/sandstone 178.68 185.36 2.1x10⁻⁹ 1.8x10⁻⁴ Mudstone/coal 187.18 193.86 4.8x10⁻⁹ 4.1x10⁻⁴ Sandstone 196.68 203.32 1.7x10⁻⁸ 1.5x10⁻³ 9x10⁻⁸ 7.8x10⁻³ Ulan 204.85 207.45 5.0x10⁻⁹ 4.3x10⁻⁴ Siltstone/sandstone 207.85 213.51 2.9x10⁻⁷ 2.5x10⁻² 4.5x10⁻⁷ 3.9x10⁻² Coggan 213.85 215.43 4.5x10⁻⁹ 3.9x10⁻⁴ Sandstone 213.50 239.00 1.2x10⁻⁹ 3.9x10⁻⁴ Sandstone

9 of 41
Report on Hydrogeological Investigation and Monitoring, August 2011 October 2013 Project 49761.03-07Proposed Coal Mine, Bylong, Mid-Western NSW November 2013
Table 4: Summary of Estimated Hydraulic Conductivity from Packer Testing (Continued)
Bore ID Depth (m) Estimated K K washed Out
Description From To (m/s) (m/d) (m/s) (m/d)
BY0091CH Water at about 36 m 16.58 23.26 2.6x10⁻⁶ 2.2x10⁻¹ Basalt 30.95 36.88 4.6x10⁻⁶ 4.0x10⁻¹ 6.3x10⁻⁶ 5.4x10⁻¹ Sandstone 46.18 52.86 1.7x10⁻⁸ 1.5x10⁻³ 3.5x10⁻⁶ 3.0x10⁻¹ Sandstone 100.53 106.19 4.2x10⁻⁹ 3.6x10⁻⁴ Sandstone/siltstone 156.53 163.86 2.9x10⁻⁸ 2.5x10⁻³ 5.7x10⁻⁸ 4.9x10⁻³ Ulan 165.85 168.78 2.8x10⁻⁹ 2.4x10⁻⁴ Siltstone/sandstone 169.18 175.86 1.2x10⁻⁶ 1.0x10⁻¹ 2.2x10⁻⁶ 1.9x10⁻¹ Coggan 174.70 179.37 3.3x10⁻⁹ 2.9x10⁻⁴ Sandstone 178.55 231.31 3.5x10⁻¹⁰ 3.0x10⁻⁶ Sandstone 193.55 231.31 3.3x10⁻¹⁰ 2.9x10⁻⁶ Sandstone
BY0207CH Water at 12.48 m depth 18.95 25.64 1.4x10⁻⁶ 1.2x10⁻¹ 5.4x10⁻⁶ 4.7x10⁻¹ Coal/Sandstone/Siltstone 25.45 32.14 Coal 31.45 38.14 1.9x10⁻⁸ 1.6x10⁻³ Coal/Sandstone/Siltstone 43.45 50.14 3.1x10⁻¹⁰ 2.6x10⁻⁵ 6.5x10⁻⁹ 5.6x10⁻⁴ Coal/Sandstone/Siltstone 52.42 59.14 9.3x10⁻⁹ 8.0x10⁻⁴ 1.1x10⁻⁷ 9.7x10⁻³ Coal/Carb Shale/Tuff
61.45 68.14 5.3x10⁻⁹ 4.6x10⁻⁴ 2.2x10⁻⁸ 1.9x10⁻³ Overburden – Sandstone/Siltstone
70.45 76.12 4.5x10⁻⁹ 3.9x10⁻⁴ 3.2x10⁻⁷ 2.7x10⁻² Ulan Upper 75.95 81.62 2.7x10⁻³ 2.3x10⁻⁸ 1.8x10⁻⁷ 1.5x10⁻² Ulan Seam
82.45 85.06 1.4x10⁻⁷ 1.2x10⁻² Interburden – Sandstone/Siltstone
84.95 91.64 2.4x10⁻⁶ 2.1x10⁻¹ 3.9x10⁻⁶ 3.4x10⁻¹ Coggan Seam 91.45 102.40 2.1x10⁻⁸ 1.8x10⁻³ Floor – Sandstone/Siltstone
BY0208CH Water at 21.89 m depth 19.39 26.07 1.6x10⁻⁷ 1.4x10⁻² 4.4x10⁻⁸ 3.8x10⁻³ Carb. Shale/Siltstone/Tuff
26.38 33.07 4.0x10⁻⁸ 3.5x10⁻³ 2.1x10⁻⁸ 1.9x10⁻³ Igneous Intrusion/Coal /Sandstone/Siltstone
34.34 41.07 1.6x10⁻⁷ 1.4x10⁻² Igneous Intrusion/Carb. Shale/Sandstone/Siltstone
42.88 49.57 7.7x10⁻⁹ 6.7x10⁻⁴ Carb. Siltstone/Igneous Intrusion
49.38 56.07 7.0x10⁻⁹ 6.0x10⁻⁴ Sandstone/Siltstone/Coal 58.38 65.07 7.5x10⁻⁷ 6.4x10⁻² Sandstone/Siltstone
67.88 74.57 3.0x10⁻⁸ 2.6x10⁻³ Overburden – Sandstone/Siltstone/coal
75.88 82.57 8.0x10⁻⁸ 6.9x10⁻³ Ulan Seam
82.38 84.99 4.4x10⁻⁸ 3.8x10⁻³ Interburden – Sandstone/Siltstone
85.38 90.03 3.4x10⁻⁸ 2.9x10⁻³ Coggan Seam 90.88 97.57 3.2x10⁻⁸ 2.7x10⁻³ Floor – Sandstone/Siltstone 97.38 108.34 1.8x10⁻⁸ 1.5x10⁻³ Floor – Sandstone/Siltstone

10 of 41
Report on Hydrogeological Investigation and Monitoring, August 2011 October 2013 Project 49761.03-07Proposed Coal Mine, Bylong, Mid-Western NSW November 2013
Table 4: Summary of Estimated Hydraulic Conductivity from Packer Testing (Continued)
Bore ID Depth (m) Estimated K K washed Out
Description From To (m/s) (m/d) (m/s) (m/d)
AGE01 16.23 22.92 1.3x10⁻⁶ 1.1x10⁻¹ Sandstone
26.53 33.22 8.3x10⁻⁶ 7.2x10⁻¹ Carbonaceous Siltstone with interbedded tuff
32.53 39.22 9.6x10⁻⁶ 8.3x10⁻¹ Carbonaceous Siltstone with interbedded tuff
41.53 48.22 5.7x10⁻⁷ 4.9x10⁻² Carbonaceous Siltstone/Coal
56.53 63.22 8.5x10⁻⁸ 7.3x10⁻³ Sandstone 62.53 69.22 5.1x10⁻⁶ 4.4x10⁻¹ Sandstone 74.53 81.22 3.2x10⁻⁷ 2.8x10⁻² Carbonaceous Siltstone 86.03 92.72 4.1x10⁻⁸ 3.5x10⁻³ Sandstone 94.03 100.72 5.1x10⁻⁸ 4.4x10⁻³ Sandstone / Siltstone 101.53 108.22 2.6x10⁻⁷ 2.3x10⁻² Sandstone / Siltstone / Coal 110.53 117.22 4.1x10⁻⁷ 3.5x10⁻² Coal / Sandstone
116.53 123.22 1.0x10⁻⁶ 8.6x10⁻² Coal / Sandstone / Siltstone / Ulan Seam
122.53 126.16 5.7x10⁻⁸ 4.9x10⁻³ Coal / Interburden 124.03 130.72 5.7x10⁻⁷ 4.9x10⁻² Interburden/Coggan Seam 130.03 136.72 1.0x10⁻⁶ 8.6x10⁻² Sandstone / Siltstone 136.03 142.72 4.1x10⁻⁶ 3.5x10⁻¹ Sandstone / Siltstone 145.03 156.1 2.2x10⁻⁶ 1.9x10⁻¹ Sandstone / Siltstone
CPT18 Water at 10.55 m depth 20.51 23.53 4.4x10⁻⁸ 3.8x10⁻³ 6.8x10⁻⁶ 5.8x10⁻¹ Coal
CPT36 Water at 10.50 m depth 28.32 31.00 7.7x10⁻⁸ 6.7x10⁻³ 1.8x10⁻⁶ 1.6x10⁻¹ Coal 44.47 59.11 7.7x10⁻⁷ 6.6x10⁻² Ulan, Interburden & Coggan 54.47 59.11 1.4x10⁻⁷ 1.2x10⁻² 2.5x10⁻⁶ 2.1x10⁻¹ Coggan
CPT39 Water at 19.66 m depth 23.10 29.42 3.2x10⁻⁶ 2.8x10⁻¹ Ulan Seam 30.00 31.43 1.3x10⁻⁶ 1.1x10⁻¹ Interburden 31.22 34.50 4.9x10⁻⁶ 4.2x10⁻¹ 2.0x10⁻⁵ 1.7x100 Coggan 34.72 41.96 7.5x10⁻⁸ 6.5x10⁻³ 4x10⁻⁷ 3.4x10⁻² Floor
5. Vibrating Wire Piezometers
5.1 Overview
Vibrating wire piezometers (VWPs) were installed in selected bores as per the locations identified in the Preliminary Hydrogeological Assessment and Water Monitoring Plan (Ref 7). The purpose of the VWPs is to assess the vertical hydraulic gradients and aquifer connectivity.

11 of 41
Report on Hydrogeological Investigation and Monitoring, August 2011 October 2013 Project 49761.03-07Proposed Coal Mine, Bylong, Mid-Western NSW November 2013
In general, multiple VWPs were installed in the Ulan Seam, Coggan Seam and floor as well as relatively permeable stratum in the overlying coal measures (i.e. targeted to higher permeability zones). The depths targeted were based on the result of packer testing. The field work was undertaken over several periods from September 2012 to June 2013 to coincide with the drilling program. In total, 31 Geotechnical Systems Australia (GSA) VWPs were installed in ten bores from September 2012 to June 2013. The bores and installation period are summarised in Table 5. Table 5: Summary of Vibrating Wire Piezometer Installation
Installation Period Bores
September to November 2012 BY0011CH, BY0077CH, BY0080CH, BY0091CH, AGE01 and AGE03
April 2013 BY0208
May to June 2013 CPT18, CP36 and CPT39 It is noted that additional vibrating wire piezometers are proposed for installation in October and November 2013 and are therefore yet to be reported. 5.2 Methods
Following packer testing, VWPs were typically installed in Ulan Seam, Coggan Seam and floor as well as various relatively permeable stratum in the overlying coal measures. A specialised winch and tripod setup was used to lower a single wire rope catenary cable down the borehole which supported the piezometers and poly pipe tremmies to the target depths. Verification readings were undertaken to confirm the correct installation prior to grouting of the borehole. The bores were grouted using 1 part cement to 0.3 parts bentonite and 2.5 parts water as per the manufacturer’s instructions. RST Instruments data loggers to record piezometric levels at regular intervals were installed at the surface for BY0011CH, BY0077CH, BY0080CH, BY0091CH, BY0208CH and AGE01 (i.e. locations with greater than two VWPs per bore). VWPs at AGE03, CPT18, CPT36 and CPT39 were monitored using a handheld GSA vibrating wire piezometer readout unit for manual recording of piezometric observations, generally undertaken on a monthly basis. 5.3 Results
The depths of the VWP installations and target stratum are summarised in Table 6. Plots of piezometric head for each location are presented in Appendix B.

12 of 41
Report on Hydrogeological Investigation and Monitoring, August 2011 October 2013 Project 49761.03-07Proposed Coal Mine, Bylong, Mid-Western NSW November 2013
Table 6: Summary of Vibrating Wire Installations
Bore ID Depth (m) Elevation (AHD) Description BY0011CH Surface 356.62
73.40 283.22 Sandstone 148.80 207.82 Sandstone 190.40 166.22 Coal – Ulan Seam 202.40 154.22 Coal – Coggan Seam 220.00 136.62 Sandstone Floor
BY0077CH Surface 297.25 48.30 248.95 Sandstone/siltstone 107.90 189.35 Sandstone/coal – Ulan Seam 118.80 178.45 Coal – Coggan Seam 139.50 157.75 Sandstone Floor
BY0080CH Surface 405.73 177.20 228.53 Siltstone/sandstone 200.00 205.73 Coal – Ulan Seam 210.70 195.03 Coal – Coggan Seam 230.00 175.73 Sandstone Floor
BY0091CH Surface 363.74 57.00 306.74 Sandstone 103.40 260.34 Sandstone/siltstone 172.50 191.24 Coal 185.00 178.74 Sandstone Floor
BY0208CH Surface 327.08 37.30 289.78 Igneous intrusion 60.00 267.08 Sandstone / Siltstone 87.50 239.58 Coal – Coggan Seam
AGE01 Surface 237.26 27.70 209.56 Siltstone 67.10 170.16 Sandstone 120.20 117.06 Coal – Ulan Seam 128.20 109.06 Coal – Coggan Seam 140.70 96.56 Sandstone Floor
AGE03 Surface 246.93 30.50 216.43 Sandstone
CPT18 Surface 297.83 21.75 276.08 Coal
CPT36 Surface 302.05 47.75 254.30 Coal – Ulan Seam 56.75 245.30 Coal – Coggan Seam
CPT39 Surface 307.10 25.00 282.10 Coal – Ulan Seam 33.00 274.10 Coal – Coggan Seam

13 of 41
Report on Hydrogeological Investigation and Monitoring, August 2011 October 2013 Project 49761.03-07Proposed Coal Mine, Bylong, Mid-Western NSW November 2013
6. Geotechnical Laboratory Testing
6.1 Overview
Laboratory testing of selected rock cores was undertaken by Weatherford Laboratories (Australia) Pty Ltd at the request of AGE. Selected rock cores from Bores AGE01, BY0077CH, BY0091CH, BY0208, CPT36 and CPT39 were tested for the following properties:
Porosity;
Grain density; and
Horizontal and vertical permeability to air. Testing methods are reported in Weatherford Laboratories Report AB-66109, dated 8 October 2013. 6.2 Results
The results of geotechnical laboratory testing are summarised in Table 7 with the plotted results shown in Figure 1. Reference should be made to Weatherford Laboratories Report AB-66109 for full details.

14 of 41
Report on Hydrogeological Investigation and Monitoring, August 2011 October 2013 Project 49761.03-07 Proposed Coal Mine, Bylong, Mid-Western NSW November 2013
Table 7: Summary of Geotechnical Laboratory Testing (Weatherford Laboratories Report No. AB-66109, 8/10/2013)
Bore ID Sample
Depth (m) Strata Direction(1)
Porosity Helium (%)
Grain Density (g/cm3)
Horizontal Permeability to
Air (mD)
Vertical Permeability to
Air (mD)
Horizontal Full diameter Permeability to Air
KMAX (mD) K90 (mD)
AGE01
22.75 Siltstone H 8.2 2.83 0.0089 22.84 Siltstone V 8.4 2.79 0.0069 46.19 Siltstone V 9.5 2.64 0.0030 46.27 Siltstone H 9.7 2.62 0.016 63.76 Sandstone V 17.9 2.67 5.4 63.93 Sandstone H 16.8 2.63 15.4
118.08-118.18 Coal WC 5.3 1.71 0.0002 0.023 0.014 126.2 Sandstone H 13.9 2.64 0.10
126.35 Sandstone V 15.1 2.64 0.15 128.83-128.94 Coal WC 11.1 1.48 0.0012 0.35 0.19
140.05 Siltstone V 8.7 2.51 0.0005 140.18 Siltstone H 8.8 2.56
BY0077CH 129.06-129.13 Mudstone WC 11.1 2.54 0.003
BY0091CH
48.22 Sandstone H 14.0 2.65 0.12 48.28 Sandstone V 13.7 2.64 0.055
182.77 Sandstone V 9.8 2.65 0.0032 182.88 Sandstone H 9.6 2.67 0.0065
BY0208CH
52.02 Siltstone V 12.0 2.59 0.0048 52.31 Siltstone H 13.8 2.57 55.37 Siltstone V 9.1 2.57 0.0056 55.48 Siltstone H 8.1 2.57 0.013 63.65 Sandstone H 11.2 2.66 0.16 64.02 Sandstone V 12.0 2.68 0.077
74.15-74.25 Mudstone WC 7.7 2.36 0.0001 0.016 0.014 CPT36 56.56-56.66 Coal WC 8.7 1.45 0.0001 1.15 0.091 CPT39 31.87-31.97 Coal WC 8.4 1.45 0.0002 2.21 1.35
Notes to Table 7: (1) H – Horizontal, V – Vertical

15 of 41
Report on Hydrogeological Investigation and Monitoring, August 2011 October 2013 Project 49761.03-07Proposed Coal Mine, Bylong, Mid-Western NSW November 2013
Figure 1: Plot of Permeability vs Porosity for Rock Core Testing (excerpt from Weatherford Laboratories Report No. AB-66109, 8/10/2013)

16 of 41
Report on Hydrogeological Investigation and Monitoring, August 2011 October 2013 Project 49761.03-07Proposed Coal Mine, Bylong, Mid-Western NSW November 2013
7. Piezometer Development and Rising Head Testing
7.1 Overview
Following installation, piezometers were developed using airlifting techniques to remove the drilling fluids, fines and sediments from within the borehole associated drilling and piezometer installation. The purpose of development is to provide a hydraulic connection between the piezometer and the screened formation. In conjunction with development, rising head tests were undertaken for the majority of piezometers to provide an estimation of the hydraulic conductivity of the screened strata. Rising head tests were undertaken for a total of 61 piezometers. 7.2 Methods
Well development using air lifting techniques comprised the injection of compressed air via a tremie pipe to the base of a piezometer from a trailer-mounted compressor. This was generally undertaken until the expelled water appeared clean and absent of fines and sediment. Following development, a similar process was undertaken for Rising Head Testing. Groundwater in the piezometer was removed by a single burst of compressed air through the tremie pipe. A datalogger installed at the base of the piezometer recorded the rise of the groundwater table to provide an estimate of groundwater recovery and soil or rock mass permeability. The process was repeated two to four times for each piezometer. Falling head tests were undertaken for piezometers A21, CPT18 and OP020 (BY0188CH) as these locations contained minimal free standing water within the screen section. It is noted that falling head tests provide an estimate of the permeability of strata above the water table at the time of testing (i.e. unsaturated soils), whereas rising head tests estimate the permeability for strata below the water table (i.e. saturated soils). Bore A21 was subject to both falling and rising head tests as the water table was near the base of the screen. 7.3 Results
The estimated permeabilities from Rising Head and Falling Head Testing are summarised in Table 8 and Table 9.

17 of 41
Report on Hydrogeological Investigation and Monitoring, August 2011 October 2013 Project 49761.03-07 Proposed Coal Mine, Bylong, Mid-Western NSW November 2013
Table 8: Summary of Estimated Permeability from Rising Head Testing
Piezometer ID
Alternate Piezometer
ID RL
(AHD) Screen Interval
(Depth, m) Screened Stratum Test Date
Average Permeability, k (m/s) (m/d)
A01-S - 247.29 1.9 to 7.9 Clay and Gravel/Sand 15/11/11 1.0x10⁻⁵ 0.86 A01-D - 247.25 15.6 to 18.6 Gravel/Sand and Residual Clay 15/11/11 5.0x10⁻⁷ 0.043 A02-S - 299.73 0.8 to 3.8 Silty Clay/Clayey Silt 9/3/12 1.0x10⁻⁴ 8.6 A02-D - 299.76 5.5 to 8.5 Soil/Sandy Clay 9/3/12 9.1x10⁻⁶ 0.79 A06-S - 275.34 1.5 to 4.5 Silty Clay and Silty Sand and Sand 7/3/12 1.3x10⁻⁴ 11 A06-D - 275.32 7.0 to 10.0 Sandy Clay and Gravelly Clay 7/3/12 1.4x10⁻⁶ 0.12 A11-D - 312.50 6.2 to 12.2 Silty Clay and Sand and Sandy Gravel 7/3/12 6.9x10⁻⁵ 6.0 A11-S - 312.52 0.9 to 3.9 Sand and Sandy Clay/Clayey Sand 7/3/12 1.6x10⁻⁴ 14 A13 - 251.58 1.2 to 7.2 Clay and Sand and Sand/Gravel 9/3/12 1.4x10⁻⁴ 12
A03-D - 288.08 6.4 to 9.4 Clay/Silty Clay/Clayey Silt 2/8/12 8.9x10⁻⁶ 0.77 A03-S - 288.08 0.5 to 3.5 Sandy Clay/Clayey Sand 2/8/12 4.7x10⁻⁶ 0.41 A04 - 294.59 0.2 to 5.2 Sand 4/8/12 4.0x10⁻⁶ 0.35
A08-D - 267.14 5.6 to 8.6 Clay/Sand 2/8/12 6.8x10⁻⁵ 5.9 A08-S - 267.14 2.0 to 5.0 Clay/Sand 1/8/12 4.1x10⁻⁶ 0.35 A09 - 255.97 0.6 to 6.6 Sand/Gravelly Sand/Sandy Gravel 4/8/12 1.5x10⁻⁴ 13 A10 - 278.25 3.0 to 9.0 Sand/Clay/Sandy Clay 1/8/12 9.7x10⁻⁵ 8.4 A12 - 341.80 0.2 to 6.2 Sand/Clay/Sandy Clay/Clayey Sand 3/8/12 5.3x10⁻⁵ 4.6 A13 - 251.58 1.2 to 7.2 Clay and sand and Sand/Gravel 9/3/12 1.4x10⁻⁴ 12 A14 - 280.17 2.3 to 8.3 Clay/Clayey Sand/Gravelly Clay/Gravelly Sand 4/8/12 6.1x10⁻⁶ 0.53 A15 - 229.99 0.3 to 6.3 Sand 1/8/12 1.2x10⁻⁴ 10 A18 - 327.63 0.2 to 6.2 Sandy Silt/Silty Clay/Sand/Sandy Clay/Gravelly Sand 3/8/12 3.0x10⁻⁵ 2.6 A19 - 246.29 2.2 to 5.2 Clay/Clayey Sand/Gravelly Sand 5/8/12 6.8x10⁻⁵ 5.9 A20 - 273.73 1.2 to 7.2 Sandy Clay/Clay/Silty Clay 3/8/12 2.4x10⁻⁵ 2.1 A21 - 313.68 12.8 to 14.3 # Clayey sand 25-27/6/2013 2.9x10⁻⁸ 0.0025 A23 - 333.42 3.4 to 9.4 Sandy Clay/Sand/Gravelly Sand/Sandy Gravel 19/10/12 4.8x10⁻⁵ 4.2
A23-W - 333.28 10.4 to 16.4 Sandstone/Siltstone 13/12/12 5.7x10⁻⁶ 0.50 A24-D - 342.42 5.6 to 8.6 Clayey Sand/Sandstone/Basalt 13/12/12 6.7x10⁻⁶ 0.58 A25 - 351.49 2.5 to 5.5 Sand/Gravelly Sand/Sandy Clay 19/10/12 3.1x10⁻⁶ 0.27
AGE01-S - 237.35 1.8 to 4.8 Sandy Gravel/Gravelly Sand 20/10/12 2.0x10⁻⁶ 0.17 AGE01-D - 237.36 6.4 to 9.4 Sandy Gravel/Clayey Gravelly Sand 20/10/12 1.3x10⁻⁴ 11.6 AGE01-W - 237.38 14.45 to 20.45 Sandstone/Laminite/Siltstone 13/12/12 4.6x10⁻⁷ 0.04 AGE03-W - 246.93 18.0 to 24.15 Tuff/Sandstone/Laminite/Siltstone/Coal 13/12/12 1.6x10⁻⁵ 1.4
AGE04 - 257.08 57.17 to 63.17 Coggan Seam 12/12/12 1.0x10⁻⁵ 0.88 AGE04-W - 257.06 19.95 to 25.95 Siltstone/Coal 12/12/12 1.7x10⁻⁶ 0.14 AGE04-S - 257.05 5.3 to 11.3 Silty Sand/Sand 12/12/12 6.9x10⁻⁵ 6.0 AGE04-D - 257.07 14.3 to 17.3 Sand 12/12/12 8.0x10⁻⁶ 0.69 AGE05 - 259.92 41.9 to 47.9 Coggan Seam 11/12/12 6.5x10⁻⁶ 0.56
AGE05-W - 259.88 9.7 to 15.7 Sandstone/Siltstone/Tuff/Mudstone/Coal 11/12/12 2.3x10⁻⁶ 0.19 AGE05-A - 259.91 5.4 to 8.4 Sand/Gravelly Sand 11/12/12 3.2x10⁻⁵ 2.8 AGE07 - 270.68 24.1 - 36.1 Siltstone, coal, tuff, laminite and sandstone 21/6/2013 6.3x10⁻⁶ 0.55
AGE07W - 270.68 9.5 to 17 Sandstone, claystone, stoney coal and siltstone 25-26/6/2013 7.1x10⁻⁸ 0.0061 AGE08 - 282.09 29.4 to 33.9 Coggan Seam 14/12/12 8.4x10⁻⁶ 0.73
AGE08-W - 282.03 7.8 to 13.8 Sandstone/Coal/Sandstone/Siltstone 14/12/12 7.8x10⁻⁷ 0.07 AGE09 BY0173CH 285.69 24.1 - 28.6 Sandstone, coal, siltstone and carbonaceous shale 19/6/2013 5.9x10⁻⁵ 5.1
AGE09W - 285.81 7.56 to 15.06 Coal, tuff, siltstone, carbonaceous siltstone, laminite and sandstone 25-26/6/2013 3.5x10⁻⁸ 0.0030
AGE10 BY0206CH 298.30 41.0 - 45.5 Conglomerate, coal, sandstone 19/6/2013 1.1x10⁻⁶ 0.093
AGE10W - 298.47 12 to 18 Sandstone, siltstone, coal, tuff and carbonaceous siltstone 19, 24/6/2013 8.9x10⁻⁶ 0.77
AGE11-W - 326.05 5.2 to 14.2 Sandstone 14/12/12 1.7x10⁻⁵ 1.5 AGE12-W - 327.69 13.4 to 22.6 Siltstone 13/12/12 1.0x10⁻⁵ 0.88
AGE13 - 354.97 37.6 to 43.6 Coggan Seam 13/12/13 1.7x10⁻⁵ 1.5 CP035 BY0001 375.92 185 to 191 Coggan Seam 7/12/11 7.0x10⁻⁷ 0.060 CP028 BY0007 368.85 161 to 167 Coggan Seam 9/3/12 3.0x10⁻⁶ 0.26 CP014 BY0010 301.40 133 to 139 Coggan Seam 6/12/11 1.0x10⁻⁶ 0.086 CP027 BY0014 259.38 50.2 to 56.2 Coggan Seam 9/3/12 6.9x10⁻⁶ 0.60 CP009 BY0015 247.28 90 to 96 Coggan Seam 8/3/12 2.4x10⁻⁶ 0.21 CP045 BY0016 292.79 39.8 to 45.8 Coggan Seam 9/3/12 2.4x10⁻⁵ 2.1 CP063 BY0204CH 296.75 55.0 - 61.0 Siltstone, sandstone and coal 20/6/2013 1.7x10⁻⁶ 0.15 CPT13 BY0174CH 290.93* 28.9 - 33.4 Sandstone, conglomerate, coal and tuff 18/6/2013 9.8x10⁻⁶ 0.84
CPT15 - 284.63 7.21 - 13.21 Clayey sand, clayey sandy gravel, silty clay, siltstone and claystone
27/6/2013 & 1/7/2013 1.4x10⁻⁶ 0.12
CPT36 - 301.42 8.0 - 15.5 Claystone, sandstone, siltstone and mudstone 27-28/6/2013 & 1/7/2013 9.7x10⁻⁷ 0.084
CPT39W - 306.47 16 - 22.1 Siltstone, carbonaceous claystone, laminite, sandstone and coal 27-28/6/2013 4.2x10⁻⁶ 0.36
Notes to Table 8: Survey levels provided by CCL * Approximate survey level based on LIDAR survey. Detailed survey levels to be provided. ^ Approximate survey level based detailed survey of adjacent piezometers. # Screen interval depth based on water table level at the time of testing (i.e. only the saturated zone is tested)

18 of 41
Report on Hydrogeological Investigation and Monitoring, August 2011 October 2013 Project 49761.03-07 Proposed Coal Mine, Bylong, Mid-Western NSW November 2013
Table 9: Summary of Estimated Permeability from Falling Head Testing
PiezometerID
Alternate Piezometer
ID RL
(AHD) Screen Interval
(Depth, m) Screened Stratum Test Date
Average Permeability, k (m/s) (m/d)
A21 - 313.68 8.3 - 14.3 Clayey sand, sand, clayey sand 4/7/2013 2.5x10⁻⁶ 0.22 CPT18 - 297.37 11.5 - 19.0 Sand, sandy gravel, silty sand and siltstone 3/07/2013 & 4/7/2013 5.3x10⁻⁷ 0.046 OP020 BY0188CH 326.48 26.5 - 32.5 Tuff and sandstone 3/07/2013 & 4/7/2013 2.0x10⁻⁶ 0.17
Notes to Table 9 Survey levels provided by CCL

19 of 41
Report on Hydrogeological Investigation and Monitoring, August 2011 October 2013 Project 49761.03-07Proposed Coal Mine, Bylong, Mid-Western NSW November 2013
8. Piezometer Level Monitoring
8.1 Overview
Monitoring of groundwater levels in piezometers commenced in December 2011 with the number regularly gauged locations increasing as additional piezometers were installed. The work to date has comprised the following:
Manual gauging of water levels in standpipe piezometers using a Solinst Water Level Meter Tape, generally undertaken monthly in conjunction with groundwater sampling;
Measurement of artesian pressure for piezometer BY0015 using a pressure gauge undertaken monthly in conjunction with groundwater sampling. The piezometer is capped with a ball valve;
Installation of Solinst Leveloggers to automatically record piezometric head (i.e. water levels) at 20 minute intervals; and
Installation of a Solinst Barologger at piezometer A01-D to automatically barometric pressure at 20 minute increments. The barometric pressure is used for correction of Levelogger data.
The purpose of gauging and installation of automated loggers was to monitor water level fluctuations that may occur due to seasonal changes and rainfall influences, in both deep and alluvial screened piezometers. The gauging and installation of loggers was undertaken with reference to “Preliminary Hydrogeological Assessment and Water Monitoring Plan” (Ref 7). Additional automated loggers have now been installed in the majority of piezometers. Loggers are downloaded on a quarterly basis with manual gauging undertaken on a monthly basis only in bores subject to water quality sampling. The piezometers locations with loggers installed to October 2013 and the screened strata are summarised in Table 10.

20 of 41
Report on Hydrogeological Investigation and Monitoring, August 2011 October 2013 Project 49761.03-07Proposed Coal Mine, Bylong, Mid-Western NSW November 2013
Table 10: Summary of Loggers Installed in Piezometers to October 2013
Alluvium Weathered Zone Basalt / Sandstone Coal Measures A01-S* and A01-D* A02-S* and A02-D* A03-S* and A03-D* A04-D A06-S* and A06-D* A08-S A08-D A09* A10 A11-S and A11-D A12* A13 A14* A15* A17-S and A17-D A18*/SW9 A19*/SW4 A20*/SW8 A21 A23 A24-D A25 AGE01-S and
AGE01-D
AGE07-W AGE08W AGE09-W AGE10-W AGE11-W CPT13 CPT15 CPT18 CPT36 CPT39-W
BY0091CH-B (Basalt)
BY0091CH-S (Sandstone)
AGE07 (Ulan and Coggan)
AGE08 (Coggan) AGE09 (Coggan) AGE10 (Coggan) AGE13 (Coggan) CP035 / BY0001
(Coggan) CP028 / BY0007
(Coggan) CP014 / BY0010
(Coggan) CP027 / BY0014
(Coggan) CP045 / BY0016
(Coggan) OP028 (Ulan and
Coggan)
Notes to Table 10: * Dual piezometric head and Electrical Conductivity logger (refer Section 9). 8.2 Results
8.2.1 Manual Gauging
The results of manual gauging indicated piezometric head for piezometers ranged from 234.4 AHD to 347.6 AHD over the monitoring period of August 2011 to October 2013. The results of gauging are summarised in Table 11.

21 of 41
Report on Hydrogeological Investigation and Monitoring, August 2011 October 2013 Project 49761.03-07Proposed Coal Mine, Bylong, Mid-Western NSW November 2013
Table 11: Summary of Piezometric Head from Manual Gauging (AHD) – August 2011 to October 2013 Piezometer ID A01-D
(BY0015-D)A01-S
(BY0015-S) A02-D A02-S A03-S A03-D A04 A06-D A06-S A08-D A08-S A09 / SW2 A10 A11-D A11-S A12 /
SW7 A13 A14 / SW5
A15 / SW1 A17-D A17-S A18 /
SW9 A19 A20 A21 A23 A23-W A24-D A24-S A25 AGE01-D AGE01-S
Surveyed Surface RL (AHD) 247.25 247.29 299.76 299.73 288.08 288.08 294.59 275.32 275.34 267.14 267.14 255.97 278.25 312.5 312.52 341.8 251.58 280.17 299.99 321.09 321.11 327.63 246.29 273.73 313.68 333.42 333.28 342.42 342.48 351.49 237.36 237.35
PVC Stickup (m) 0.64 0.67 0.73 0.74 0.62 0.84 0.73 0.52 0.60 0.78 0.89 0.74 0.79 0.57 0.55 0.80 0.66 0.69 0.74 0.65 0.65 0.65 0.74 0.68 0.63 0.63 0.54 0.46 0.58 0.61 0.60 0.72Date
26/08/2011 246.038/12/2011 241.97 242.0723/02/2012 241.91 248.8524/02/2012 241.96 242.0228/02/2012 242.04 242.10 295.18 295.17 273.44 273.54 311.37 311.36 320.24 320.277/03/2012 273.95 274.06 312.32 312.349/03/2012 296.15 296.13 273.87 273.97 249.1630/05/2012 297.47 297.44 273.08 273.18 311.97 312.01 249.11 320.57 320.5931/05/2012 242.49 242.5325/06/2012 311.79 311.83 249.1826/06/201227/06/2012 242.54 242.59 297.67 297.63 273.16 273.2628/06/201222/07/2012 311.85 311.9023/07/2012 297.95 297.9124/07/2012 242.63 242.68 273.35 273.45 249.27 321.01 321.0419/08/2012 340.6920/08/2012 264.28 264.28 253.30 298.8321/08/2012 287.79 287.82 273.6522/08/2012 242.53 242.58 298.19 298.15 273.17 273.27 249.2523/08/2012 311.65 311.70 320.73 320.7517/09/2012 242.48 242.5118/09/2012 298.11 298.10 273.15 273.17 249.1819/09/2012 254.19 340.67 273.65 298.80 326.99 243.29 272.1120/09/201219/10/2012 327.23 336.91 347.59 234.4620/10/2012 234.4821/10/2012 242.42 242.46 272.99 273.01 248.8322/10/2012 297.96 297.92 273.6323/10/2012 253.94 340.44 298.64 326.5319/11/2012 234.45 234.4320/11/2012 297.76 297.72 287.15 287.18 310.93 310.99 340.21 320.08 320.09 326.27 326.31 335.39 346.1821/11/2012 293.09 272.65 272.66 253.55 272.93 248.68 273.60 298.33 271.8522/11/2012 242.29 242.32 263.63 263.63 243.143/12/2012 272.50 248.54 273.60 271.684/12/2012 340.10 298.19 326.155/12/2012 242.22 297.63 253.44 243.0511/12/201212/12/201213/12/2012 325.8414/12/201216/01/2013 297.36 297.3315/01/2013 271.97 271.99 271.0514/01/2013 241.88 241.91 248.49 242.7816/01/2013 252.93 339.76 273.61 297.74 325.7718/02/2013 241.9419/02/2013 272.23 272.24 248.83 242.91 271.4520/02/2013 297.23 297.20 253.24 339.74 273.55 298.75 325.6821/02/2013 241.90 287.38 287.40 293.34 263.46 263.47 272.53 310.20 310.30 319.53 319.63 324.87 334.44 234.42 234.426/03/20137/03/2013 334.4218/03/201319/03/2013 242.41 242.45 248.9620/03/2013 297.35 297.31 272.70 272.72 253.883/04/20135/04/2013 287.68 287.7215/04/2013 242.47 242.51 253.49 249.02 273.5217/04/2013 272.87 272.89 298.79 271.9817/04/2013 297.31 297.26 340.44 326.5618/04/2013 324.71 324.67 334.4812/05/2013 242.46 249.00 243.2613/05/2013 272.89 272.90 271.9814/05/2013 297.26 297.22 253.38 340.18 273.48 298.46 326.3215/05/2013 287.52 287.55 293.33 263.67 263.87 272.36 311.28 311.42 320.14 320.15 324.69 324.66 334.72 346.71 234.50 234.4916/05/2013 242.4118/06/2013 242.51 242.55 249.09 243.3619/06/2013 297.22 297.18 253.26 339.96 273.40 298.18 326.2020/06/2013 273.05 273.06 272.05 324.85 324.81 335.1624/06/20134/07/20135/07/2013 300.9014/07/2013 339.7822/07/2013 242.52 242.50 253.37 249.1223/07/2013 273.19 273.21 273.38 298.0124/07/2013 297.18 297.14 326.1025/07/2013 325.17 325.13 334.7526/07/201319/08/2013 242.55 249.08 243.3520/08/2013 273.13 273.19 252.75 273.35 272.0621/08/2013 339.64 326.0222/08/2013 297.18 297.15 297.857/09/2013 263.84 263.83 272.198/09/2013 287.42 287.44 311.24 311.31 325.08 325.039/09/2013 320.11 320.14 334.40 234.51 235.5117/09/2013 273.0718/09/2013 297.13 297.10 293.16 339.52 273.31 297.72 325.9419/09/2013 242.48 253.28 250.0020/09/2013 242.4430/09/201314/10/201315/10/2013 272.78 272.80 253.05 248.74 273.2216/10/2013 242.41 242.44 297.01 296.97 339.37 297.55 325.78 271.8817/10/2013 324.55
Piezometric Head RL (AHD)

22 of 41
Report on Hydrogeological Investigation and Monitoring, August 2011 October 2013 Project 49761.03-07Proposed Coal Mine, Bylong, Mid-Western NSW November 2013
Table 11: Summary of Piezometric Head from Manual Gauging (AHD) – August 2011 to October 2013 (Continued) Piezometer ID AGE01-W AGE03-W AGE04 AGE04-D AGE04-S AGE04-W AGE05 AGE05-A AGE05-W AGE07 AGE07W AGE08 AGE08-W AGE09 AGE09W AGE10 AGE10W AGE11-W AGE12-W AGE13 AGE13-W BY0001
(CP035) BY0007 BY0010 (CP014)
BY0014 (CP027)
BY0015 (CP009) - artesian
BY0016 (CP045) BY0091-B BY0091-S OP028 CPT13 CPT15 CPT18 CPT36
Surveyed Surface RL (AHD) 237.38 246.93 257.08 257.07 257.05 257.06 259.92 259.91 259.88 270.68 270.68 282.09 282.03 285.69 285.81 298.3 298.47 326.05 327.69 354.97 355.05 375.92 368.85 301.4 259.38 247.28 292.79 363.78 363.79 332.37 285.63 297.37 301.42
PVC Stickup (m) 0.51 0.65 0.68 0.56 0.52 0.57 0.57 0.57 0.62 0.67 0.64 0.61 0.72 0.63 0.69 0.50 0.54 0.63 0.43 0.60 0.60 0.84 0.35 0.74 0.73 0.70 0.69 0.59 0.64 0.64 0.64 0.47 0.64Date
26/08/20118/12/2011 251.24 253.81 272.8923/02/2012 250.92 253.81 272.9324/02/201228/02/2012 273.06 253.98 253.89 273.057/03/20129/03/2012 250.94 253.95 322.3930/05/2012 273.72 254.38 251.15 273.59 323.0331/05/2012 254.18 249.9725/06/2012 273.76 254.44 251.27 323.1926/06/2012 254.2727/06/2012 250.1728/06/2012 275.9622/07/2012 273.73 254.49 251.27 254.34 323.2723/07/2012 273.2724/07/2012 250.1719/08/2012 272.7220/08/2012 254.4121/08/201222/08/2012 254.57 249.9723/08/2012 273.66 251.5317/09/2012 251.40 250.77 272.7118/09/201219/09/201220/09/2012 323.2919/10/201220/10/201221/10/2012 254.28 250.77 272.5822/10/201223/10/201219/11/201220/11/2012 322.7521/11/2012 273.39 254.31 251.34 254.18 272.6422/11/20123/12/2012 254.08 272.094/12/20125/12/2012 250.1711/12/2012 234.41 254.75 253.66 253.6512/12/2012 250.56 250.72 250.65 250.75 341.83 330.5913/12/2012 242.13 325.80 320.22 341.71 322.7414/12/2012 273.79 274.31 318.2216/01/201315/01/201314/01/2013 253.85 249.97 271.4416/01/201318/02/2013 273.14 253.95 253.84 250.4719/02/2013 271.5520/02/2013 322.7521/02/2013 234.41 273.91 275.20 251.156/03/2013 340.81 330.577/03/2013 242.22 250.73 250.91 250.87 250.85 254.59 253.45 253.36 273.82 275.07 318.70 326.79 320.1618/03/2013 271.8319/03/2013 242.40 253.9120/03/2013 250.72 250.75 250.71 250.74 254.59 253.54 254.44 273.87 275.17 318.45 320.223/04/2013 330.565/04/2013 318.2315/04/2013 242.47 254.01 272.0117/04/201317/04/201318/04/2013 250.82 250.79 250.74 250.77 254.65 253.54 253.47 320.1412/05/2013 253.94 271.9313/05/2013 273.91 275.2514/05/2013 326.1215/05/2013 234.48 250.84 250.78 250.72 250.75 254.60 253.47 253.41 318.08 320.03 251.30 330.57 322.8116/05/2013 243.41 273.13 254.0318/06/2013 242.50 273.96 253.97 272.0619/06/2013 273.96 283.93 326.02 319.8620/06/2013 250.87 250.76 250.72 250.76 254.52 253.41 253.36 273.9324/06/2013 285.404/07/2013 274.865/07/2013 256.71 258.3214/07/201322/07/2013 242.50 296.02 253.99 272.2123/07/2013 274.00 275.2924/07/2013 325.93 319.7625/07/2013 250.85 250.77 250.72 250.75 254.50 253.39 253.34 283.9426/07/2013 244.22 322.78 275.10 276.42 278.93 289.6419/08/2013 254.04 250.37 272.1920/08/2013 273.98 275.2721/08/2013 283.96 285.35 325.84 319.75 289.7322/08/20137/09/2013 273.86 274.63 275.022 278.778/09/2013 256.76 258.35 322.82 289.709/09/2013 234.49 273.95 330.5517/09/2013 319.80 272.2018/09/2013 283.86 325.78 275.07 276.3519/09/2013 250.89 250.78 250.74 250.77 254.56 253.38 253.32 254.01 250.6720/09/2013 273.36 254.09 251.3930/09/2013 274.91214/10/2013 253.8315/10/2013 273.56 274.90 271.9116/10/2013 282.46 285.11 325.59 238.9717/10/2013 319.62
Piezometric Head RL (AHD)

23 of 41
Report on Hydrogeological Investigation and Monitoring, August 2011 October 2013 Project 49761.03-07Proposed Coal Mine, Bylong, Mid-Western NSW November 2013
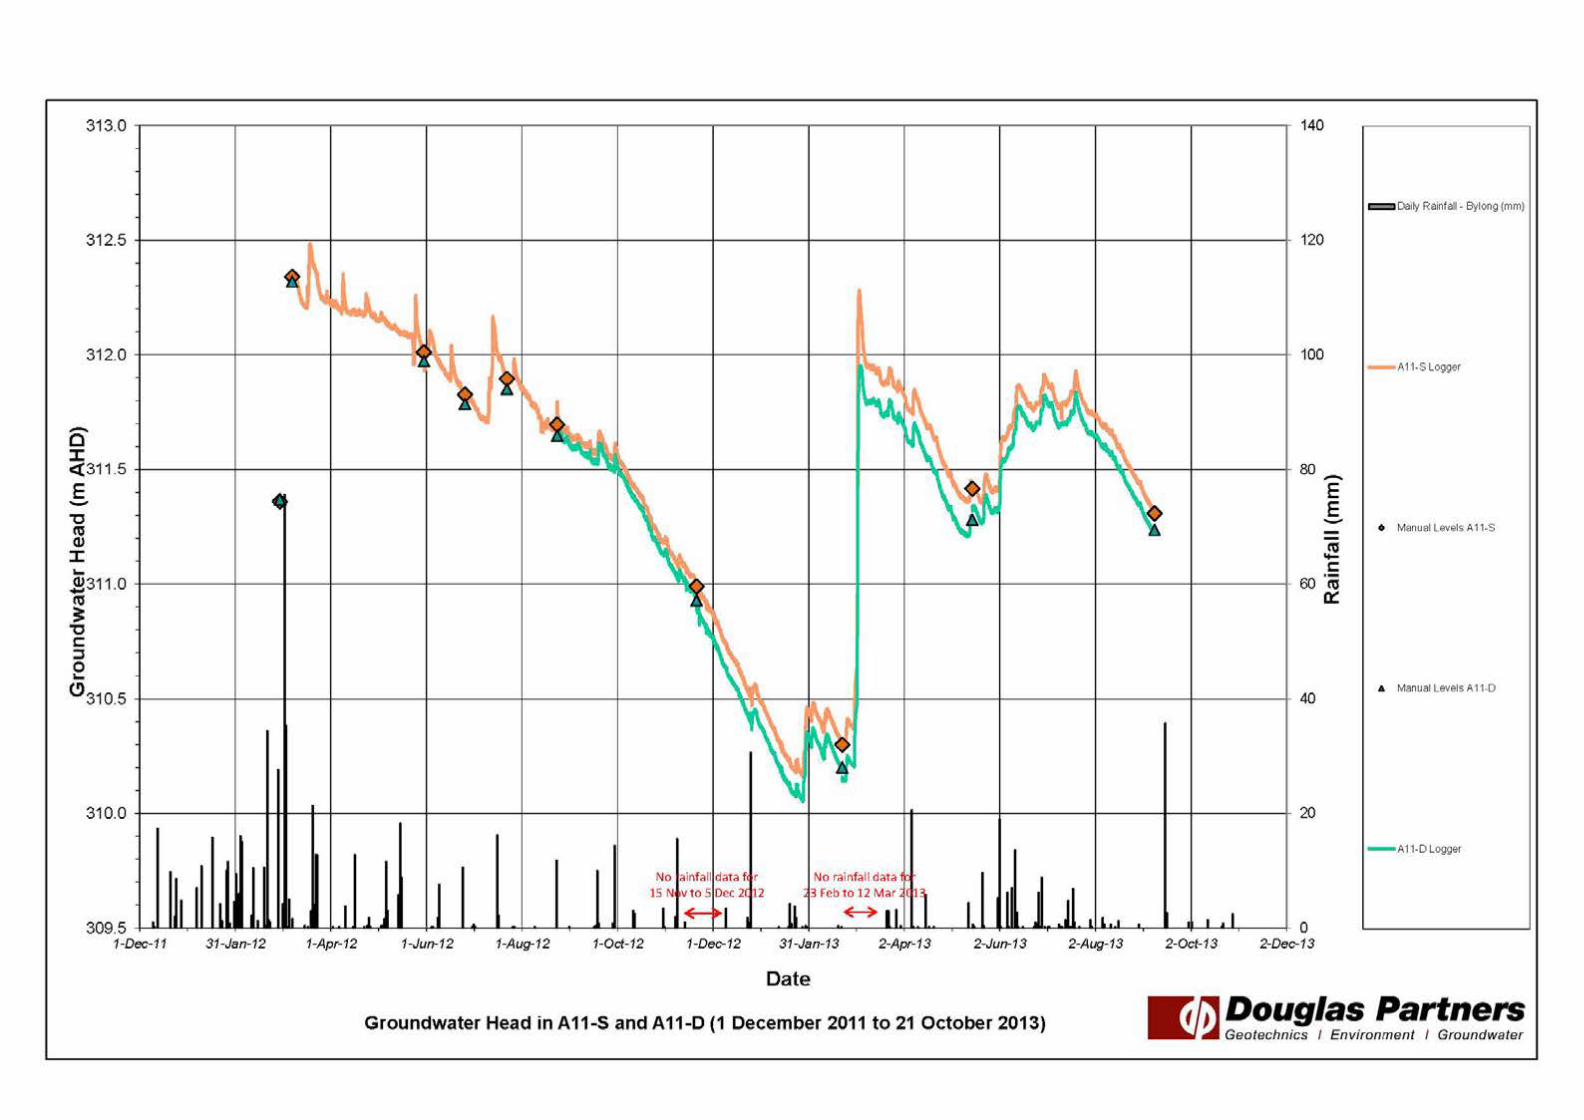
8.2.2 Automated Level Logging
Plots of water level versus time for installed loggers and manual gauging levels are shown in Appendix B together with daily rainfall data collected at the CCL weather station at Bylong. The results indicate varied response to rainfall, with greater response in the Alluvial Aquifer. The results of EC logging are discussed in Section 9. 9. Automated Salinity Logging
9.1 Overview
Dual automated Electrical Conductivity (EC) and piezometric head (i.e. water level) loggers were installed in shallow and deeper alluvium screened piezometers to monitor changes in EC that may occur due to seasonal changes, rainfall influences and the depth within the alluvium for the assessment of baseline conditions. The loggers were installed in piezometers using stainless steel wire to monitor EC at a fixed depth at 20 minute intervals. The loggers were generally positioned within the central to lower part of the piezometer screen to account for fluctuating water levels (i.e. minimise potential for the water table falling below the depth of the logger). The piezometers locations with salinity loggers installed to October 2013 are summarised in Table 12. Table 12: Summary of Loggers Installed in Piezometers to October 2013
Alluvium Shallow Alluvium Adjacent to Surface Water Feature
A01-S and A01-D
A02-S and A02-D
A03-S and A03-D
A06-S and A06-D
A09
A12
A14
A15
A18/SW9
A19/SW4
A20/SW8
Notes to Table 12: “-D” suffix indicates deeper alluvium piezometer (installed to the base of the Alluvium) “-S” suffix indicates shallow alluvium piezometer Loggers installed at locations A18, A19 and A20 were connected to the surface flow gauge telemetry systems as discussed in Section 11.

24 of 41
Report on Hydrogeological Investigation and Monitoring, August 2011 October 2013 Project 49761.03-07Proposed Coal Mine, Bylong, Mid-Western NSW November 2013
The results of water level logging are discussed in Section 8. 9.2 Results
The results of ongoing logged EC are plotted against rainfall and are included in Appendix B. The range of measured EC is summarised in Table 13. Table 13: Range of Measured Electrical Conductivity in Loggers
Location ID Range of EC by Logger (µS/cm)
A01-S 1670 to 3340
A01-D 910 to 1060
A02-S 1080 to 1290
A02-D 830 to 990
A03-S 1300 to 3190
A03-D 1045 to 1065
A06-S 900 to 1680
A06-D 580 to 680
A09 305 to 1740
A12 160 to 310
A14 1380 to 1650
A15 110 to 335
A18/SW9 140 to 580
A19/SW4 960 to 1830
A20/SW8 565 to 1720
The results indicate that for paired piezometers locations the EC for shallower screened locations (i.e. A01-S, A02-S, A03-S and A06-S) fluctuates in apparent response to rainfall, with increases in salinity following rainfall. For deeper screened locations, the salinity is relatively consistent and generally less than for the shallow locations. There is at times a slight difference between the logger readings and the manual readings and this is likely to be due to differences in the measurement method. Groundwater sampling using the low-flow pump also allows for some mixing of the water within the piezometer, whereas the logger measures EC at a specific and constant depth within the screen.

25 of 41
Report on Hydrogeological Investigation and Monitoring, August 2011 October 2013 Project 49761.03-07Proposed Coal Mine, Bylong, Mid-Western NSW November 2013
It is noted that apparent spikes/dips following sampling often occur due to disturbance of the water column. 10. Water Quality Monitoring
10.1 Overview
Groundwater and surface water quality monitoring was undertaken with reference to the Preliminary Hydrogeological Assessment and Water Monitoring Plan (Ref 7). The purpose of the water monitoring was to assess the quality of water within the aquifer systems, namely: groundwater present within alluvial and coal measure aquifers; and surface waters present within the alluvial aquifers. Groundwater and surface water monitoring commenced in February 2012 and has generally been undertaken monthly and is proposed to continue on this basis. Monitoring locations were selection on the basis of the conceptual model and the results of hydraulic testing and have developed throughout the investigation as access became available. Broadly, monitoring locations were selected as follows:
Groundwater: piezometers installed in the alluvial aquifer and the Coggan Seam to allow for collection of representative groundwater samples;
Surface Water: at upstream, downstream, and central creek and river locations within the tenement based on the local and regional topography. Upstream locations are generally located in the northern areas of the tenement, downstream locations in southern areas, as well as central and eastern locations targeting mid-site surface water quality. Shallow piezometers installed at surface water locations allow collection of shallow groundwater at times when there is no surface water flow.
Groundwater and surface water monitoring conducted at the site is outlined below. 10.2 Groundwater Sampling and Testing
10.2.1 Monitoring Locations
A total of 17 piezometers, comprising eleven screened in the alluvium and six screened in the coal measures were sampled for the assessment of baseline groundwater quality. The locations were sampled as access became available. The monitoring locations and number of sampling events are summarised in Table 11.

26 of 41
Report on Hydrogeological Investigation and Monitoring, August 2011 October 2013 Project 49761.03-07Proposed Coal Mine, Bylong, Mid-Western NSW November 2013
Table 11: Summary of Sampled Groundwater Piezometers – February 2012 to October 2013
Piezometer ID Screened Stratum Number of Sampling Events
A01-S Alluvium 18
A02-S Alluvium 17
A06-S Alluvium 17
A09 Alluvium 12
A12 Alluvium 11
A13 Alluvium 17
A14 Alluvium 13
A15 Alluvium 11
A18 Alluvium 11
A19 Alluvium 3
A20 Alluvium 9
AGE08 Coggan Seam 5
AGE10 Coggan Seam 4
AGE13 Coggan Seam 4
BY0014CH Coggan Seam 18
BY0015CH Coggan Seam 17
BY0016CH Coggan Seam 18
10.2.2 Methods
Prior to purging, the water level in each piezometer was measured within each well using a Solinst dip meter for the assessment of trends in groundwater level / piezometric head (refer Section 8). The piezometers were purged using a MP10 MicroPurge low-flow water sampler until steady pH, EC, turbidity and temperature readings were achieved. The low volume sampling method provides greater confidence in the quality of the obtained sample versus traditional bailing methods and avoids the requirement to purge high volumes from each piezometer. The pump utilises disposable small diameter gas and water tubing to prevent sample cross contamination. The purged water was collected within a flow cell and field pH, electrical conductivity (EC), oxidation-reduction potential (ORP), dissolved oxygen, turbidity and temperature were measured using a hand-held calibrated multi-parameter meter until steady readings were achieved.

27 of 41
Report on Hydrogeological Investigation and Monitoring, August 2011 October 2013 Project 49761.03-07Proposed Coal Mine, Bylong, Mid-Western NSW November 2013
Groundwater sampling was undertaken by an Environmental Engineer from DP under strict QA/QC protocols. All sampling data was recorded on DP chain of custody sheets, and the general sampling procedure comprised:
The use of new disposable gloves for each sampling location;
Transfer of samples into laboratory-prepared bottles, and capping immediately;
Collection of replicate samples for QA/QC purposes;
Labelling of sample bottles with individual and unique identification, including project number, sample location and sampling date;
Placement of the sample bottles into a cooled, insulated and sealed container for transport to the laboratory within recommended holdings times for analysis;
Use of chain of custody (C-O-C) documentation ensuring that sample tracking and custody could be cross-checked at any point in the transfer of samples from the field to the laboratory.
Samples for metals analysis were filtered on-site using 45 µm disposable filters to allow reporting of dissolved metal concentrations in groundwater. 10.3 Surface Water Sampling and Testing
10.3.1 Overview
Nine surface water monitoring locations (SW1 to SW9) were selected for the assessment of baseline surface water quality. Surface water sampling commenced in February 2012 and has generally been undertaken on a monthly basis. To allow for periods of no or limited surface water flow, alternative shallow groundwater piezometers were installed in 2012 adjacent to all surface water sampling locations, with the exception of SW3 due to the presence of shallow rock. The shallow piezometers enable sampling of shallow groundwater in the absence of surface water for the collection of baseline water quality information. In the instance that surface water was not present at the time of sampling, the piezometers were sampled as per the standard piezometer sampling methods (refer Section 10.2.2). The monitoring locations, alternate piezometers and number of sampling events are summarised in Table 13.

28 of 41
Report on Hydrogeological Investigation and Monitoring, August 2011 October 2013 Project 49761.03-07Proposed Coal Mine, Bylong, Mid-Western NSW November 2013
Table 13: Summary of Surface Water Sampling
Surface Water Location
Number of Monthly Sampling Events
Alternative Shallow Piezometer Sampling Events
SW1 9 A15 11
SW2 8 A13 17
SW3 7 - -
SW4 19 A19 3
SW5 0 A14 13
SW6 12 A16 0
SW7 4 A12 11
SW8 11 A20 7
SW9 3 A18 11
It is noted that several locations were dry on a regular basis. Additionally, two event-based monitoring events were undertaken on 8 March 2012 and 11 March 2013 following significant rainfall at the site. The sample locations are shown on Drawing 1 in Appendix D.
10.3.2 Methods
Surface water samples were collected using a long-handled ‘swing sampler’, which allowed the use of a new laboratory prepared sampling bottle for each sampling event. Sampling was undertaken to minimise the disturbance of surface water sediments. In-situ measurements of pH, electrical conductivity (EC), oxidation-reduction potential (ORP), dissolved oxygen, turbidity and temperature were taken using a hand-held calibrated multi-parameter meter following collection of each surface water sample. Surface water sampling was undertaken by an Environmental Engineer from DP under strict QA/QC protocols. All sampling data was recorded on DP chain of custody sheets, and the general sampling procedure comprised:
The use of new disposable gloves for each sampling location;
Transfer of samples into laboratory-prepared bottles, and capping immediately;
Collection of replicate samples for QA/QC purposes;
Labelling of sample bottles with individual and unique identification, including project number, sample location and sampling date;

29 of 41
Report on Hydrogeological Investigation and Monitoring, August 2011 October 2013 Project 49761.03-07Proposed Coal Mine, Bylong, Mid-Western NSW November 2013
Placement of the sample bottles into a cooled, insulated and sealed container for transport to the laboratory within recommended holdings times for analysis;
Use of chain of custody (C-O-C) documentation ensuring that sample tracking and custody could be cross-checked at any point in the transfer of samples from the field to the laboratory.
10.4 Laboratory Testing
Laboratory testing was undertaken by Envirolab Services Pty Ltd (Envirolab), a laboratory registered with the National Association of Testing Authorities, Australia (NATA). Analytical methods used are shown on the laboratory sheets in Appendix C. Groundwater and surface water samples analysed for the following:
pH;
Electrical Conductivity (EC);
Turbidity;
Alkalinity: Hydroxide (OH-) as CaCO3, Carbonate (CO32-) as CaCO3, Bicarbonate (HCO3
-) as CaCO3 and Total Alkalinity as CaCO3;
Anions: Chloride (Cl-), Ammonia (NH3) as Nitrogen (N), Nitrogen Oxides (NO2- and NO3
-) and Sulphate (SO4
2-);
Cations: Sodium (Na+), Potassium (K+), Calcium (Ca2+) and Magnesium (Mg2+);
Total Phosphorous (P); and
Dissolved metals (16): Aluminium (Al), Arsenic (As), Barium (Ba), Beryllium (Be), Cadmium (Cd), Chromium (Cr), Cobalt (Co), Copper (Cu), Iron (Fe), Lead (Pb), Manganese (Mn), Mercury (Hg), Nickel (Ni), Selenium (Se), Vanadium (V), Zinc (Zn).
For the purposes of Quality Assurance / Quality Control (QA / QC), one duplicate groundwater and surface water sample were collected for each monthly sampling event analysed for the above suite, however, for conciseness the results are not detailed in this report. Laboratory testing of pH was undertaken in addition to the field measurements. The measurement of pH in the field is considered more reliable / representative as pH is highly sensitive and can change during sample transport. Therefore field pH readings are generally presented, with the exception of a number of occasions where malfunction of the field meter occurred, in which case the laboratory results are presented. It is noted that it is general industry practice to collect unfiltered surface water samples metal analyses, therefore providing total analyte concentrations. At the request of NOW, surface water samples were tested for dissolved metals (i.e. field filtered) to allow direct comparison of results with dissolved metal concentrations in groundwater as outlined in the Preliminary Hydrogeological Assessment and Water Monitoring Plan (Ref 7).
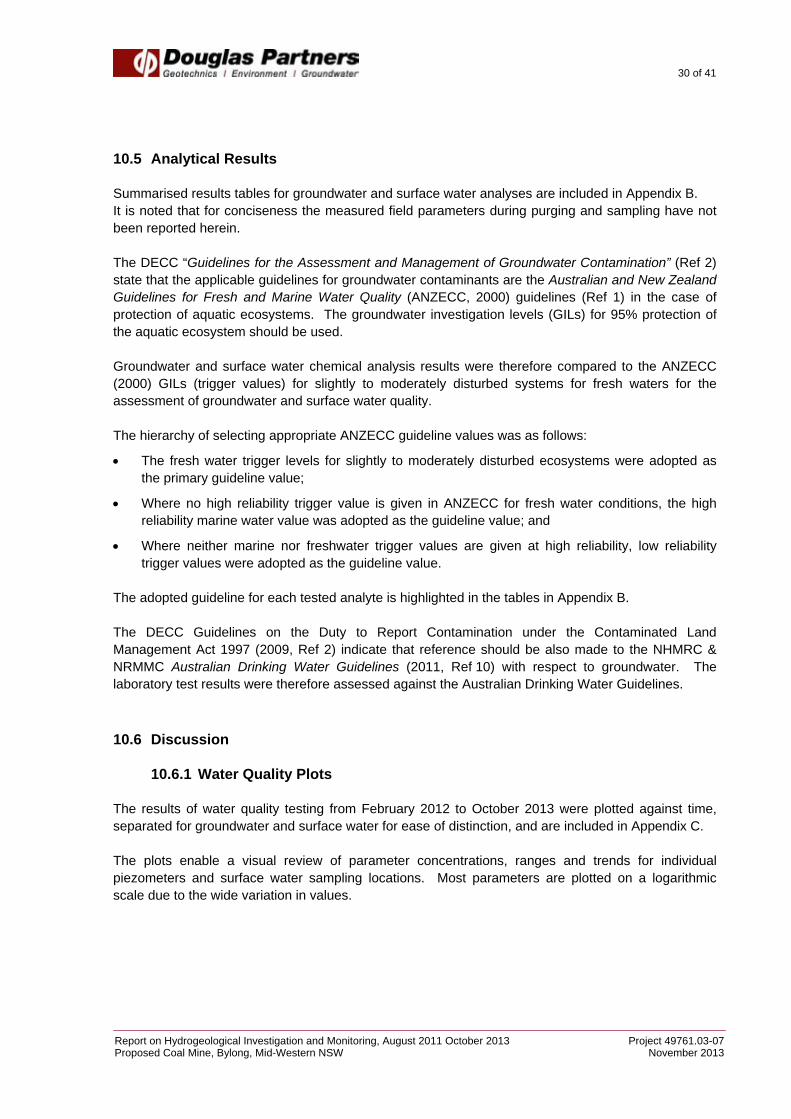
30 of 41
Report on Hydrogeological Investigation and Monitoring, August 2011 October 2013 Project 49761.03-07Proposed Coal Mine, Bylong, Mid-Western NSW November 2013
10.5 Analytical Results
Summarised results tables for groundwater and surface water analyses are included in Appendix B. It is noted that for conciseness the measured field parameters during purging and sampling have not been reported herein. The DECC “Guidelines for the Assessment and Management of Groundwater Contamination” (Ref 2) state that the applicable guidelines for groundwater contaminants are the Australian and New Zealand Guidelines for Fresh and Marine Water Quality (ANZECC, 2000) guidelines (Ref 1) in the case of protection of aquatic ecosystems. The groundwater investigation levels (GILs) for 95% protection of the aquatic ecosystem should be used. Groundwater and surface water chemical analysis results were therefore compared to the ANZECC (2000) GILs (trigger values) for slightly to moderately disturbed systems for fresh waters for the assessment of groundwater and surface water quality. The hierarchy of selecting appropriate ANZECC guideline values was as follows:
The fresh water trigger levels for slightly to moderately disturbed ecosystems were adopted as the primary guideline value;
Where no high reliability trigger value is given in ANZECC for fresh water conditions, the high reliability marine water value was adopted as the guideline value; and
Where neither marine nor freshwater trigger values are given at high reliability, low reliability trigger values were adopted as the guideline value.
The adopted guideline for each tested analyte is highlighted in the tables in Appendix B. The DECC Guidelines on the Duty to Report Contamination under the Contaminated Land Management Act 1997 (2009, Ref 2) indicate that reference should be also made to the NHMRC & NRMMC Australian Drinking Water Guidelines (2011, Ref 10) with respect to groundwater. The laboratory test results were therefore assessed against the Australian Drinking Water Guidelines. 10.6 Discussion
10.6.1 Water Quality Plots
The results of water quality testing from February 2012 to October 2013 were plotted against time, separated for groundwater and surface water for ease of distinction, and are included in Appendix C. The plots enable a visual review of parameter concentrations, ranges and trends for individual piezometers and surface water sampling locations. Most parameters are plotted on a logarithmic scale due to the wide variation in values.

31 of 41
Report on Hydrogeological Investigation and Monitoring, August 2011 October 2013 Project 49761.03-07Proposed Coal Mine, Bylong, Mid-Western NSW November 2013
The plots also show the relevant ANZECC (2000) criteria (Ref 1), based on the hierarchy selection outlined above in Section 10.5. Some parameters have no ANZECC criteria at all, and no line is plotted. For comparison, the most common laboratory practical quantitation limit (PQL) is shown on the graphs as a blue horizontal line. In general, the PQL should be lower than the ANZECC criteria. This was achieved for the majority of analytes. The observations regarding groundwater and surface water trends for February 2012 to October 2013 monitoring are summarised as follows: Surface Water
The pH of surface waters was generally higher than the pH of groundwater. pH values were reasonably consistent between pH 7.5 and 8.5, and were regularly above the ANZECC criteria upper range of pH 8.0 for many locations;
EC provides an indirect measure of water salinity. Surface waters were generally fresher than groundwater based on EC, with values ranging from 180 µS/cm to 2,200 µS/cm. ECs were lowest for the March 2012 event-based sampling following several consecutive days of rainfall including 76 mm recorded at the Bylong weather station on 1 March 2012. Similarly lower ECs were observed for the March 2013 sampling event which also followed significant rainfall. Increasing salinity trends were apparent as sampling locations progress downstream, with upstream locations SW1, SW7 and SW9, all located on the upstream reaches with consistently lower EC than SW3 and SW4 which are located on the downstream reaches of the site;
A similar trend in increasing concentration with distance downstream was also observed for the major anions and cations, in particular Sodium, Magnesium, Potassium, Chloride, Sulphate and Bicarbonate, which indicate increasing salinity;
Turbidity varied between sampling events, however, was generally within the ANZECC criteria range of 1 to 50 NTU for most wells;
Metals Copper and Zinc and to a lesser extent Cobalt were found to be variable both spatially and temporally and regularly exceeded ANZECC criteria at many locations. Cobalt was less variable from April 2013, however, it is noted that the majority of sampling locations were dry;
Of the remaining metals only occasional minor exceedances of ANZECC criteria were found for Aluminium, Cadmium and Chromium;
In terms of nutrients, Total Phosphorus and NOx, were highly variable both spatially and temporally and regularly exceeded ANZECC criteria at many locations. Ammonia was present at concentrations within ANZECC criteria.
Groundwater
Groundwater sampling was undertaken for both the Alluvial Aquifer and the Coal Measures (Coggan Seam). Results for piezometers screened in the coal measures are shown as plotted in black to distinguish them from the Alluvial samples. From the plots in Appendix C, the following comments on the difference in groundwater quality between the two aquifers can be made:
pH values were reasonably consistent between the ANZECC criteria range of pH 6.5 and 8.0. The pH for wells screened in the coal measures were generally slightly higher than those screened in the Alluvium;

32 of 41
Report on Hydrogeological Investigation and Monitoring, August 2011 October 2013 Project 49761.03-07Proposed Coal Mine, Bylong, Mid-Western NSW November 2013
ECs generally ranged between 1,000 µS/cm to 3,000 µS/cm for the majority of piezometers. ECs for Coal Measure piezometers were generally evenly spread over this range. The most saline piezometers were BY0016CH which is screened in the coal measures and A01-S screened in the Alluvium.
In terms of major cations, the results indicated a preference towards sodium and potassium over calcium and magnesium in the coal measures compared to the alluvium. In terms of major anions, the coal measures were generally relatively high in carbonate/bicarbonate with BY0016CH and AGE10 relatively high in Chloride and BY0014CH and AGE08 relatively low in Sulphate;
Piezometers A12, A15 and A18, respectively installed adjacent to surface water locations SW7, SW1 and SW9, were notably fresher than the remainder of alluvial piezometers. EC values ranged between 250 µS/cm to 400 µS/cm which is considered more representative of surface water quality at these locations (i.e. shallow screened wells). These locations are also located on the upstream reaches of the site;
Turbidity varied between sampling events and regularly exceeded the ANZECC criteria range of 1 to 50 NTU, however, turbidity is considered to be of limited importance with respect to groundwater as it can be affected by the disturbed conditions near the well;
Metals Copper and Zinc and to a lesser extent Cobalt were found to highly variable both spatially and temporally and were observed to regularly exceed ANZECC criteria at most of the alluvial locations. Occasional minor exceedances of ANZECC criteria were found for Dissolved Chromium, Beryllium, Nickel, Manganese and Arsenic. Concentrations were generally only slightly in excess of criteria and laboratory detection limits;
The concentrations of metals in the coal measures was generally less than the criteria, with the exception of BY0016CH, which regularly exceeded for Dissolved Arsenic, Copper, Cobalt and Nickel. Piezometers AGE08, AGE10 and AGE13 which were monitored from June/July 2013 also indicated occasional exceedances for these parameters. There majority of piezometers in the Coal measures regularly exceeded ANZECC criteria for Dissolved Zinc.
A02-S exceeded ANZECC criteria for Dissolved Selenium for on all sampling occasions;
In terms of nutrients, Total Phosphorus and NOx, regularly exceeded the criteria in the Alluvial locations, in particular at A02-S, with Ammonia concentrations below the criteria in all Alluvial wells. The concentrations of Total Phosphorus and NOx were consistently lower in the coal measures wells, with only occasional and exceedances of the criteria. Ammonia concentrations, however, consistently exceeded or were equal to the criteria for the coal measures (with the exception of BY0014CH on two occasions).
10.6.2 Tri-Linear Analysis
Tri-linear diagrams of major ionic composition were plotted for groundwater and surface to assess spatial variation in water chemistry and aquifer systems. Separate plots for groundwater and surface water, as well as a combined plot of groundwater and surface water are shown on Figure 2 to Figure 4.

33 of 41
Report on Hydrogeological Investigation and Monitoring, August 2011 October 2013 Project 49761.03-07Proposed Coal Mine, Bylong, Mid-Western NSW November 2013
Figure 2: Tri-Linear Analysis (Piper Plot) for Groundwater – February 2012 to October 2013
Figure 3: Tri-Linear Analysis (Piper Plot) for Surface Water – February 2012 to October 2013

34 of 41
Report on Hydrogeological Investigation and Monitoring, August 2011 October 2013 Project 49761.03-07Proposed Coal Mine, Bylong, Mid-Western NSW November 2013
Figure 4: Tri-Linear Analysis (Piper Plot) – Combined Groundwater and Surface Water The plots indicate the following:
Groundwater in the coal measures is spatially separate (i.e. clustered) from groundwater in the Alluvium. Ionic composition is dominated by Sodium/Potassium and Carbonates, indicative of rock weathering in the coal measures. Groundwater in general is low in Sulphates;
Groundwater in the Alluvium generally shows no cation dominance, with the results centrally plotted for Cations. In terms of Anions, groundwater is lower in Sulphates and high in Carbonates and Chloride;
Similar ionic composition is apparent for surface water and groundwater in the Alluvium, indicating linkage of water quality;
Groundwater quality at A02-S is noticeably separate from the other wells screened in the Alluvium. Groundwater at A02-S is dominated by Calcium and Magnesium and is lower in Sodium and Potassium.

35 of 41
Report on Hydrogeological Investigation and Monitoring, August 2011 October 2013 Project 49761.03-07Proposed Coal Mine, Bylong, Mid-Western NSW November 2013
11. Surface Water Flow Monitoring
11.1 Overview
Three Sontek IQ velocity meters were installed in creek beds within the tenement to allow for continuous monitoring of water levels and flow velocity with telemetry transfer of data. From survey of the creek cross-section, flow estimates can also be determined. The locations were selected to provide upstream and downstream flow data as follows:
Location SW4 – Bylong Creek, on the downstream reaches of where the creek passes through the site;
Location SW9 – Lee Creek, on the mid reaches of where the creek passes through the site, upstream of the intersection with Bylong Creek;
Location SW8 – Bylong Creek, on the mid reaches of where the creek passes through the site, upstream of the intersection with Lee Creek.
The locations of the flow meters were selected with regard to the following specific requirements:
Relatively straight reach;
Control point, preferably a narrow section of creek with relatively stable banks;
Accessible, however out of sight of public roads;
Receiving 3G mobile reception. It is noted that the selection of final locations was a compromise between the above requirements, and due to the irregular nature of the creek geometry, the creek beds at each location were inevitably somewhat variable in both in straightness and consistency of the cross section. The monitoring locations are shown on Drawing 1, Appendix D. 11.2 Methods
The installation of velocity meters at SW4, SW8 and SW9 comprised the following procedure:
Installation of a concrete plinth with the top level flush with the base of the creek;
Attachment of the Sontek velocity meter to the plinth;
Installation of a galvanised steel frames around the perimeter of the plinth (SW4 and SW9 only);
Measurement of the creek cross-section at the point of the installed meter using an automatic level and hand tape;
Installation of a telemetry system and automated camera on an adjacent creek bank, connected to the meters via trenched cables, to enable collection of regular images of the creek section and confirmation of surface water flow;
Installation of a graduated staff in view of the camera to enable estimation of surface water depth for verification of water depth.

36 of 41
Report on Hydrogeological Investigation and Monitoring, August 2011 October 2013 Project 49761.03-07Proposed Coal Mine, Bylong, Mid-Western NSW November 2013
The velocity meter measures the height of water within the creek in range 0.08 m to 1.5 m. 11.3 Results
Figures of surface flow gauging at SW4, SW8 and SW9 the period 25 July 2012 to 27 October 2013 are shown in Appendix B. The velocity meters are accurate for flow depths between 0.08 m and 1.5 m. Increased scatter in the results was observed for period when the water depth is below 0.08 m and these results should be considered approximate only. A line of best fit has been provided to assist with interpretation. It is noted that a periods of low rainfall have occurred, in particular from October 2012 to February 2013 and therefore surface water flows have significantly reduced. Locations SW4 and SW9 were dry for the majority of this period. It is noted that the SW4 telemetry system was faulty for 25 July 2012 to 23 August 2012. Flow meter malfunction also occurred at SW4 from 1 March 2013 to 2 April 2013 following a high water flow event which partially buried the flow unit with sands from the creek bed. Damage to the telemetry cable also occurred for the period 13 September 2013 to current (27 October 2013). Observations of surface water flows have been supplemented with weekly photographs from each telemetry unit, with comments provided on the plots in Appendix B. 12. Conceptual Hydrogeological Model
The conceptual model of groundwater flow has been updated based on the results of site monitoring to date, and is summarised as follows. Valleys and Creeks The Bylong River enters the south eastern side of the site and leaves the site at the northern tip of the site, shortly before joining the Goulbourn River. Several other creeks and rivers feed into the Bylong River across the site and from upstream to downstream comprise the following:
Crows Nest Creek;
Cousins Creek;
Lee Creek;
Growee River;
Dry Creek. These creeks sit in the base of valley features, which generally comprise a relatively flat valley base and steeply sloping valley sides which contain gully features which fall steeply towards the valley floors. The gullies and valleys have been formed from erosion of the sandstone, with eroded material deposited in both the gullies (Gully Colluvium) as well as the valley floors (Valley Alluvium).

37 of 41
Report on Hydrogeological Investigation and Monitoring, August 2011 October 2013 Project 49761.03-07Proposed Coal Mine, Bylong, Mid-Western NSW November 2013
Alluvial Aquifers The sands and gravels in the valley floors are permeable, containing sand and gravel sediments and form Alluvial Aquifers. This Alluvial Aquifer is the source of water for the vast majority of registered groundwater bores and wells in the valleys. The alluvium is recharged by direct rainfall, runoff from valley sides and creek flow. The creeks are expected to be dry at times, however creek flows have been observed to occur following rainfall and have been sustained by ongoing rainfall. At times of higher flows the creeks are losing creeks and recharge the aquifer, and other times, as the surface flows recede become gaining creeks with groundwater draining back into the creeks. The central sections of Bylong Creek, near the Bylong Valley Way Bridge have been observed to be dry while the upper reaches of the creek are still losing water to groundwater and the lower reaches are presumably gaining flow from groundwater. Groundwater quality in the alluvium is expected to be relatively fresh, however is impacted to some degree by salinity and possibly nutrients from the adjacent agricultural land uses. The depth of the alluvium is variable and there is evidence of bars of shallower rock in places. These are expected to occur in places where there is localised necking in the valley sides. These bars are expected to in effect dam the groundwater, leading to ‘terracing’ of the water table. No surface water has been observed in the western valley and this suggests the sediments are highly permeable allowing rainfall to recharge directly. It seems that there may be a buried alluvial paeleochannel present on the northerly trending spur between Bylong Creek and Lee Creek at Upper Bylong. The results of investigation to date indicate that this is generally dry, sitting above the level of the adjacent Valley Alluvium. Gully Colluvium Limited investigation of the Gully Colluvium has been undertaken to date, however their presence has been inferred from mapping of aerial photos and topographic data. The colluvium is likely to be relatively fine grained and shallow compared to the Valley Alluvium and although groundwater seepage can be expected to occur in the base of the Gully Colluvium towards the Valley Alluvium, these are not expected to represent significant aquifers. This is evidenced by the lack of registered groundwater bores in these locations. Coal Measures The Alluvial Aquifers are underlain by Illawarra Coal Measure rocks which comprise layers of relatively impermeable sandstone and siltstone over and between seams of coal. On the higher ground to either side of the valleys the coal measures are overlain by Narrabeen Sandstone, which has been eroded along the valleys.

38 of 41
Report on Hydrogeological Investigation and Monitoring, August 2011 October 2013 Project 49761.03-07Proposed Coal Mine, Bylong, Mid-Western NSW November 2013
This erosion process is likely to have led to stress relief, which has likely lead to horizontal cracking of the rocks in the valley floor and vertical cracking of the rocks on the higher ground above the valley sides. This would be expected to lead to relatively high horizontal hydraulic conductivity and low vertical hydraulic conductivity below the floor or the valley and potentially higher vertical hydraulic conductivity on the higher ground. The coal is more permeable than the sandstone and siltstone inter-burden but less permeable than the Alluvial Aquifer. The primary coal seams below the site comprise the Ulan and Coggan Seams. These seams dip (fall in level) towards the north and are generally located at depth below the Alluvium, however, are expected to intersect the Alluvium below Lee Creek and Bylong River at the central and southern parts of the site. Recharge (infiltration of rainwater from the surface) would be expected to occur into the coal seams through the higher ground to the sides of the valley, potentially facilitated by vertical cracking from stress relief. Sub-horizontal flow would be expected to occur in the coal seams, generally in an overall northerly direction, skewed towards the valleys. The rate of groundwater flow in the coal seams would be much less than that occurring in the Alluvial Aquifer. There would be expected to be leakage of water from the Alluvial Aquifer into the coal seams, most of which would be expected to occur where the coal seams intersect the alluvium, as outlined above, however limited vertical leakage would occur below the remaining valley floor. The presence of significantly higher (artesian) heads in the coal seam than the alluvium on the northern parts of the site is evidence of the limited vertical connection in the valley floors and on these northern parts of the site the leakage would be upwards from the coal seams to the Alluvium. The presence of faulting on the northern parts of the site would also provide a potential vertical pathway. Groundwater in the coal seams would typically be expected to be of poorer quality than groundwater in the Alluvial Aquifer, however, the results of water quality testing suggest a similar range of salinity but with differing ionic composition. Triassic Sediments The Triassic rocks, primarily sandstone, overly the coal measures on the valley sides, in particular on the southern parts of the site, adjacent to Cousins Creek and Lee Creek. Recharge occurs directly to this formation and is expected both leak vertically towards underlying coal seams as well as horizontally, potentially forming seams near the base of the steep slopes along Cousins Creek and Lee Creek. Idealised groundwater flow sections for Bylong Valley based on the conceptual hydrogeological flow model are shown in Figure 5 to Figure 7.

39 of 41
Report on Hydrogeological Investigation and Monitoring, August 2011 October 2013 Project 49761.03-07Proposed Coal Mine, Bylong, Mid-Western NSW November 2013
Figure 5: Idealised Groundwater Flow for Long Section at Bylong Valley
Figure 6: Idealised Cross Valley Flow – Bylong Valley North (Section A-A)

40 of 41
Report on Hydrogeological Investigation and Monitoring, August 2011 October 2013 Project 49761.03-07Proposed Coal Mine, Bylong, Mid-Western NSW November 2013
Figure 7: Idealised Cross Valley Flow – Bylong Valley South (Section B-B) Salinity Potential sources of salinity at the site are likely to include:
Groundwater within the coal measures / bedrock;
Leaching from the coal measures / bedrock;
Evaporative concentration in locations with shallow groundwater;
Leaching of unsaturated soils.
The existing hydrological regime provides limited pathways for transport of saline groundwater between the Coal Measures and the Alluvium, due to the presence of low permeability interburden between the more permeable coal seams and the Alluvium. Furthermore, the water in the coal measures is of a similar salinity to Alluvium. Sources of existing salinity are more likely to be due to agricultural land uses and are sourced from surface leaching. 13. References
1. ANZECC (2000), “Australian and New Zealand Guidelines for Fresh and Marine Water Quality”, Australian and New Zealand Environment and Conservation Council, October 2000.
2. DEC (2007), Guidelines for the Assessment and Management of Groundwater Contamination, Department of Environment and Conservation, March 2007.
3. Douglas Partners (2012), “Results of Cone Penetration Testing, Upper Bylong”, Project 49761.02, April 2012.
4. Douglas Partners (2012), “Summary of Groundwater Assessment to Date, Proposed Coal Mine, Bylong”, Project 49761.00-03, April 2012.

41 of 41
Report on Hydrogeological Investigation and Monitoring, August 2011 October 2013 Project 49761.03-07Proposed Coal Mine, Bylong, Mid-Western NSW November 2013
5. Douglas Partners (2012), “Interim Factual Report of Hydrogeological Investigation and Monitoring, Proposed Coal Mine, Bylong, Mid-Western NSW”, Project 49761.03, August 2012.
6. Douglas Partners (2013), “Interim Factual Report on Hydrogeological Investigation and Monitoring, August to December 2012”, Project 49761.03-02, Rev 1, January 2013.
7. Douglas Partners (2013), “Preliminary Hydrogeological Assessment and Water Monitoring Plan, Proposed Coal Mine at Bylong, Mid-Western NSW”, Project 49761.00-Rev3, May 2013.
8. Douglas Partners (2013), “Report on Baseline Groundwater and Surface Water Quality Monitoring, February 2012 to May 2013”, Project 49761.03-04, May 2013.
9. Douglas Partners (2013), “Interim Factual Report on Hydrogeological Investigation and Monitoring, January to July 2013”, Project 49761.03-05, Rev 1, 26 July 2013.
10. NHMRC, NRMMC (2011), “Australian Drinking Water Guidelines Paper 6 National Water Quality Management Strategy”, National Health and Medical Research Council, National Resource Management Ministerial Council, Commonwealth of Australia, Canberra, October 2011.
14. Limitations
Douglas Partners Pty Ltd (DP) has prepared this report for this project at Bylong in accordance with DP’s proposal dated 27 April 2011 and acceptance Purchase Order NWECBYLONG/00011, dated 10 May 2011. The work was carried out under DP’s Conditions of Engagement. This report is provided for the exclusive use of Cockatoo Coal Limited for this project only and for the purposes as described in the report. It should not be used by or relied upon for other projects or purposes on the same or other site or by a third party. In preparing this report DP has necessarily relied upon information provided by the client and/or their agents. The results provided in the report are indicative of the sub-surface conditions on the site only at the specific sampling or testing locations, and then only to the depths investigated and at the time the work was carried out. Sub-surface conditions can change abruptly due to variable geological processes and also as a result of human influences. Such changes may occur after DP’s field testing has been completed. DP’s advice is based upon the conditions encountered during this investigation. The accuracy of the advice provided by DP in this report may be affected by undetected variations in ground conditions across the site between and beyond the sampling or testing locations. The advice may also be limited by budget constraints imposed by others or by site accessibility. This report must be read in conjunction with all of the attached and should be kept in its entirety without separation of individual pages or sections. DP cannot be held responsible for interpretations or conclusions made by others unless they are supported by an expressed statement, interpretation, outcome or conclusion stated in this report. This report, or sections from this report, should not be used as part of a specification for a project, without review and agreement by DP. This is because this report has been written as advice and opinion rather than instructions for construction.
Douglas Partners Pty Ltd

Appendix A
About this Report

July 2010
Introduction These notes have been provided to amplify DP's report in regard to classification methods, field procedures and the comments section. Not all are necessarily relevant to all reports. DP's reports are based on information gained from limited subsurface excavations and sampling, supplemented by knowledge of local geology and experience. For this reason, they must be regarded as interpretive rather than factual documents, limited to some extent by the scope of information on which they rely. Copyright This report is the property of Douglas Partners Pty Ltd. The report may only be used for the purpose for which it was commissioned and in accordance with the Conditions of Engagement for the commission supplied at the time of proposal. Unauthorised use of this report in any form whatsoever is prohibited. Borehole and Test Pit Logs The borehole and test pit logs presented in this report are an engineering and/or geological interpretation of the subsurface conditions, and their reliability will depend to some extent on frequency of sampling and the method of drilling or excavation. Ideally, continuous undisturbed sampling or core drilling will provide the most reliable assessment, but this is not always practicable or possible to justify on economic grounds. In any case the boreholes and test pits represent only a very small sample of the total subsurface profile. Interpretation of the information and its application to design and construction should therefore take into account the spacing of boreholes or pits, the frequency of sampling, and the possibility of other than 'straight line' variations between the test locations. Groundwater Where groundwater levels are measured in boreholes there are several potential problems, namely: • In low permeability soils groundwater may
enter the hole very slowly or perhaps not at all during the time the hole is left open;
• A localised, perched water table may lead to an erroneous indication of the true water table;
• Water table levels will vary from time to time with seasons or recent weather changes. They may not be the same at the time of construction as are indicated in the report; and
• The use of water or mud as a drilling fluid will mask any groundwater inflow. Water has to be blown out of the hole and drilling mud must first be washed out of the hole if water measurements are to be made.
More reliable measurements can be made by installing standpipes which are read at intervals over several days, or perhaps weeks for low permeability soils. Piezometers, sealed in a particular stratum, may be advisable in low permeability soils or where there may be interference from a perched water table. Reports The report has been prepared by qualified personnel, is based on the information obtained from field and laboratory testing, and has been undertaken to current engineering standards of interpretation and analysis. Where the report has been prepared for a specific design proposal, the information and interpretation may not be relevant if the design proposal is changed. If this happens, DP will be pleased to review the report and the sufficiency of the investigation work. Every care is taken with the report as it relates to interpretation of subsurface conditions, discussion of geotechnical and environmental aspects, and recommendations or suggestions for design and construction. However, DP cannot always anticipate or assume responsibility for: • Unexpected variations in ground conditions.
The potential for this will depend partly on borehole or pit spacing and sampling frequency;
• Changes in policy or interpretations of policy by statutory authorities; or
• The actions of contractors responding to commercial pressures.
If these occur, DP will be pleased to assist with investigations or advice to resolve the matter.

July 2010
Site Anomalies In the event that conditions encountered on site during construction appear to vary from those which were expected from the information contained in the report, DP requests that it be immediately notified. Most problems are much more readily resolved when conditions are exposed rather than at some later stage, well after the event. Information for Contractual Purposes Where information obtained from this report is provided for tendering purposes, it is recommended that all information, including the written report and discussion, be made available. In circumstances where the discussion or comments section is not relevant to the contractual situation, it may be appropriate to prepare a specially edited document. DP would be pleased to assist in this regard and/or to make additional report copies available for contract purposes at a nominal charge. Site Inspection The company will always be pleased to provide engineering inspection services for geotechnical and environmental aspects of work to which this report is related. This could range from a site visit to confirm that conditions exposed are as expected, to full time engineering presence on site.

Appendix B
Plots of Piezometric Head in Vibrating Wires (BY0011CH, BY0077CH, BY0080CH, BY0091CH, BY0208CH, AGE01, AGE03W)
Hydrograph Plots (Datalogger Water Level Plots) Electrical Conductivity Plots (Salinity Datalogger Plots)
Surface Flow and Depth Plots (SW4, SW8, SW9) – July 2012 to October 2013