Embed Size (px)
Citation preview

ESIA of the Gulpur Hydropower Project
Hagler Bailly Pakistan Appendix A R4V07GHP: 09/23/14 A-1
Appendix A: Physical Baseline
A.1 Seismicity
See following pages.

1
Seismic Hazard Study
General
The proposed Project site is located on the foothill of Himalayan range. It lies close to the Riasi thrust
which is a branch of Main Boundary Thrust (MBT). Numerous large earthquakes with magnitude
greater than VIII are believed to be associated with MBT in Himalayan range East of the Project site.
As the Project site is located in active seismic region, evaluation of realistic seismic design
parameters is therefore necessary to design the Project structures so that these can withstand the
expected ground motions due to earthquakes.
Methodology
The methodology adopted for the seismic hazard evaluation of Gulpur Hydropower Project is as
follows:
Collection and review of the regional geology and tectonic setting in an area of 150 km
radius from the site. For this, the data available with WAPDA, Geological Survey of Pakistan,
Oil and Gas Development Corporation and various universities were collected and analyzed.
Study of all available historical and instrumental earthquake data including data from
regional network as well as Mangla local network and development of comprehensive
earthquake catalogue.
Study of existing faults of the area through satellite images and available geologic literature
and maps.
On the basis of synthesis of tectonic and siesmological data obtained from the above
mentioned studies, development of a siesmotectonic map and evaluation of the active faults
for their capability to generate earthquakes.
Carry on seismic hazard analysis by using probabilistic and deterministic approaches. EZ-
FRISK software was used for the probabilistic hazard analysis. For the deterministic analysis,
several faults and attenuation relationship were used to calculate the maximum horizontal
ground acceleration.
Evaluation of OBE and MCE accelerations and selection of appropriate seismic design
parameters for the design of the Project structures.
Tectonic Setting
Regional Tectonic Setting
The geodynamic of Pakistan is characterized by the collision and coalescence of Eurasian and Indian
Continental Plates (Figure 1), which were once separated by oceanic domains. This process started
in the late Eocene to early Oligocene with formation of the Himalayan ranges1. It is however, also
1 Farah, A., De Jong, K.A; Geodynamics of Pakistan: An introduction; Geodynamics of Pakistan, Geological
Survey of Pakistan (1979).

2
understood that the recent collision of Indo-Pakistan subcontinent has succeeded a similar collision
immediately north of Pakistan2 or throughout southern Asia3 that took place in Paleozoic era.
The Himalayas are believed to form a sharp frontal thrust belt as the southern edge of a wide
collision zone extending north to include Hindukush, Pamir, Tien Shan, Tibetan Plateau, and other
collisional features of Central Asia.
Figure 1: Regional Plate Tectonic Setting
Relative to Eurasia, the Indian Plate is still moving northwards at a rate of about 3.7 cm/yr near 73
degree longitude east4. Indus suture line that coincides with upper Tsengpo river valley represents
the original site of the continental collision along which linear and well-developed ophiolite suites
are found. These ophiolites are interpreted as the remnants of the oceanic crust of the Tethys ocean
trapped during the collision between Indian and Eurasian continental blocks. The major portion of
this convergence was taken up by deformation along the northern collision boundary involving
folding and thrusting of the upper crustal layers5 in the shape of MKT (Main Karakorum Thrust),
MMT (Main Mantle Thrust), MBT (Main Boundary Thrust) and SRT (Salt Range Thrust), as shown in
Figure 2.
2 Kravchenko, K.N.; Tectonic evolution of the Tien Shan, Pamia and Karakorum; Geodynamics of Pakistan,
Geological Survey of Pakistan (1979) 3 Talent, J.A.; Mawson, R.; Paleozoic – Mesozoic biostratigraphy of Pakistan in relation to biogeography and the
coalescence of Asia; Geodynamics of Pakistan, Geological Survey of Pakistan (1979) 4 Minster, J.B., et el..; Numerical modeling of instantaneous plate tectonics, Royal Astron. Soc. Geophys. Jour.
Vol.36 (1974). 5 Seeber, L., Jacob K.H.; Micro earthquake survey of northern Pakistan, Preliminary results and tectonic
implications; Proc. Symp. on Himalayan Geology, CNRS, Paris (1976).

3
Figure 2: Generalized Tectonic Map Northern Pakistan
The MKT separates rocks of Asian landmass from Kohistan island arc complex. The Kohistan island
arc is separated from the Indian plate by MMT. The MBT separates pre-collisional Paleozoic and
Mesozoic sedimentary rocks of the Indian plate from the younger post-collisional Himalayan molasse
sediments. A single detachment surface is believed to exist beneath the entire rocks south of MMT.
This surface extends southwards till it emerges out in the shape of Salt Range Thrust6.
Local Tectonic Setting
Project site is located close to Riasi thrust, which runs more than 200 km along the Himalayan range
and is considered as a main branch of the MBT. Towards East it joins MBT and towards West it
merges again into MBT at the axis of Hazara-Kashmir Syntaxial Bend, which is quite sharp near
Muzaffarabad towards North and becomes less sharp towards South. On the East of the Hazara-
Kashmir Syntaxial Axis, the geological features show predominantly northwest trend while their
trend change to northeast towards the West of the axis. The main tectonic features West of
Syntaxial Axis are Salt Range Thrust, Dil Jabba Thrust, Kahuta Fault and Riwat Fault (Fig-4.8). The
Syntaxial Axis itself is believed to run along a north-south running strike-slip fault called Jhelum
Fault. As many active tectonic features are present close to the Project site, therefore it is located
within highly active geotectonic environment.
6 Seeber L. et al; Seismicity and continental subduction in the Himalayan arc, in Zagros – Hindukush Himalayas;
Geodynamics Evolution, A.G.U. Geodynamics Services, Vol.3 (1981).

4
Figure 3: Regional Geological Map
Quittmeyer et al.7 have classified whole of the area of Pakistan into fifteen seismotectonic provinces
(Figure 4). Gulpur Hydropower project is located near the following four distinct provinces being
discussed below:
a. Himalayas Province
b. Hazara Region Province
c. Salt Range Province and
d. Indus Basin Province
a) Himalayas Province
The Himalayas represent one of the primary compressional features that have resulted from the
collision of the Indo-Pakistan Continental Plate with Eurasian Plate. This zone of deformation is the
result of folding and thrusting associated with the development of large nappe structures and deep
crustal shortening8. The Himalayas trends in a southeasterly direction just east of the Hazara-
Kashmir syntaxis (Fig-4.7) where the project site is located.
Seismicity within this seismotectonic province is characterized as moderate to high level. Most
events are associated with the frontal zone of deformation. They are located parallel to and
northeast of the surface trace of the Main Frontal Thrust. One great earthquake, the 1905 Kangra
event with Ms=8.0 occurred within this zone, probably rupturing a 300 km portion along the Main
7 Quittmeyer, R.C., et al; Seismicity of Pakistan and its relation to surface faults; Geodynamics of Pakistan
(1979). 8 Ganser, A.; Geology of the Himalayas: New York, Inter Science Publications (1964).

5
Frontal Thrust9. Riasi thrust is a branch of MBT and runs almost parallel to MBT upto the syntaxial
bend.
In the vicinity of the Hazara-Kashmir syntaxis, the mapped surface trace of the frontal thrust bends
around from a southeast trend to a southwest orientation. The seismically defined fault zone,
however, does not follow the mapped surface faults; it continues for an additional 100 km to the
northwest of the Hazara-Kashmir syntaxis10.
Figure 4: Seismotectonic Provinces of P[Pakistan
b) Hazara Region Province
The Hazara seismotectonic province encompasses mostly eastward trending folds and faults of the
Hazara region in Northern Pakistan. The deformation within this zone is primarily the result of
thrusting and a deep crustal decollement process associated with the collision between the Indian
and Eurasian plates11.
9 Quittmeyer, R.C., et al; Seismicity of Pakistan and its relation to surface faults; Geodynamics of Pakistan
(1979). 10
Armbruster, J., et al.; Tectonics of the lower Himalayas in north Pakistan based on micro earthquake observations, Jour. Geophys. Res., Vol.83 (1978).
11 Ganser, A.; Geology of the Himalayas: New York, Inter Science Publications (1964).

6
Seismic activity within this province has occurred at a low level12. Historical data however do indicate
moderate events causing significant damage in this region.
Shallow seismicity within the Hazara region occurs on perpendicular, steeply dipping faults
characterized by reverse and strike-slip faulting. The microseismicity data suggest that the Hazara
Thrust Fault may be related to a decollement surface identified at depth13. However, as the mapped
faults are dominantly of thrust nature, a narrow alignment of epicenters along these faults is not to
be expected. Furthermore, some activity is also associated with faults that are located below the
decollement surface, which do not have any surface expression. The broad band of activity following
the dominant structural trend, however, suggests that at least some of these earthquakes may be
related to the major mapped structures14.
c) Salt Range Province
The Salt Range is situated south of the Hazara seismotectonic province and extends from the
Sulaiman Range on the West to the Himalayas in the East (Fig-4.9). General orientation of this range
is east northeast, but prominent southeast trending transverse features offset parts of it (Fig-4.7). It
is composed of folded and faulted thrust sheets and represents thin-skinned internal deformation
within the Indian Plate resulting from its collision with Eurasia.
Although it is the frontal zone of deformation in this region, the Salt Range is characterized by a low
level seismic activity, in contrast to other parts of the frontal zone in Pakistan. It has limited known
history of moderate or large magnitude earthquake. Micro-earthquake studies, however, indicate
that at low magnitude levels (m<4), the entire Salt Range is active, especially along transverse faults
at points where it is offset. Cambrian salt deposits may provide an explanation for this aseismic
character of the Salt range. Deformation may result from aseismic slip along a decollement surface
mechanically detached by the salt15. The micro seismic activity may represent small readjustments
within the decollement sheets.
d) Indus Basin Province
The Indus Basin is located within the Indo-Pakistan Plate South and Southwest of the Himalayas and
Salt Range, and East of the predominantly northward trending mountain ranges of Pakistan (Fig-4.8).
This feature is a foredeep basin. The seismicity occurring within this zone is generally of low level.
Although infrequent, some events have caused considerable damage. Southwest of the Himalayas,
the events occur along a discontinuous, but nevertheless, linear trend about 200 km from the Main
Frontal Thrust16. This same trend parallels the Salt Range, but not at as great a distance. This activity
12
Seeber, L., Jacob K.H.; Micro earthquake survey of northern Pakistan, Preliminary results and tectonic implications; Proc. Symp. on Himalayan Geology, CNRS, Paris (1976).
13 Seeber L. et al; Seismicity and continental subduction in the Himalayan arc, in Zagros – Hindukush
Himalayas; Geodynamics Evolution, A.G.U. Geodynamics Services, Vol.3 (1981). 14
Quittmeyer, R.C., et al; Seismicity of Pakistan and its relation to surface faults; Geodynamics of Pakistan (1979).
15 Seeber, L., et al; Seismicity of the Hazara arc in northern Pakistan; Decollement vs. basement faulting;
Geodynamics of Pakistan (1979). 16
Menke, W., and Jacob, K.H.; Seismicity Patterns in Pakistan and north western India associated with continental Collision: Seismol. Soc. America Bull; Vol.66 (1976).

7
within the Indus Basin may be related to bending of the lithosphere17, active basement faults
transverse to the fold and thrust belts18, and/or development of a new frontal thrust19. A focal
mechanism for one event near New Delhi showed normal faulting on one of two nodal planes
parallel to the Himalayas20.
Surface faults have not been mapped in the Indus Basin; the extensive alluvial cover has buried any
structural evidence of faulting on the surface. Inferences based on gravity data, however, indicate
basement faults may exist in some portions of the Indus Basin21.
Seismicity
General
Earthquakes pose a multitude of hazard to dams, either by direct loading of the structures or by
initiating a sequence of events that may lead to dam failure. For example, strong ground shaking or
fault offset at the dam foundation is a direct load on the structure while an upstream failure, seiche
or landslide into the reservoir are earthquake generated events that can lead to overtopping and
failure. Effects of ground shaking by earthquakes are also documented in terms of loss of free board
due to differential tectonic ground movements, slope failure, piping failure through cracks induced
by ground shaking, failure of spillway and outlet works22.
Earthquakes are generated by tectonic process in the upper part of the earth called lithosphere that
is divided into several rigid parts called as “Plates”. Due to movements along these plates, stress
build up takes place and results in the deformation of the crystal mass. This energy accumulation
gives birth to seismic events. The contact zones between adjacent plates are, therefore, considered
as most vulnerable parts from the seismic hazard point of view.
The project site is located near one of these contacts between Indian plate and Eurasian plate. This
contact represented by the Himalayas has always been generating moderate to large earthquakes
including Kangra (1905), Bihar-Nepal (1934) and Assam (1897) earthquakes that caused widespread
destruction and huge loss of life.
17
Molnar, P., et al; Fault plane solutions of shallow earthquakes and contemporary tectonics in Asia, Earth and Planetary Science Letters, Vol.19 (1973).
18 Valdiya, K.S.; Himalayan Transverse faults and folds and their parallelism with subsurface structures of
north Indian plains, Tectonophysics, Vol.32 (1976). 19
Le Fort, P., Himalayas: The collided range. Present knowledge of the continental Arc: A.M. Jour Sci., Vol.275-A (1975).
20 Molnar, P., et al; Fault plane solutions of shallow earthquakes and contemporary tectonics in Asia, Earth
and Planetary Science Letters, Vol.19 (1973). 21
Farah, A., et .el; Gravity field of the buried shield in the Punjab plain, Pakistan: Geol. Soc. America Bull., Vol.88 (1977).
22 Seed, H.B. “Earthquake resistant design of earth dams:, International Conference on Recent Advances in
Geotechnical Earthquake, Engineering and Soil Dynamics, Missouri, (1981).

8
Historical Seismicity
The earthquakes originated before the advent of seismic recording instruments that have been
mentioned in the literature and were located within the Project region give mainly information
about the level of damage that this region has undergone historically. Though this information does
not give a conclusive account of their epicentral location, these do give an understanding about the
extent of structural damages and probable life loss in return. This non-instrumental data is solely
dependent upon human observation. In order to perform a quantitative analysis of the effects of an
earthquake, it is convenient to reduce the raw data to a more manageable form. For this purpose
intensity scales have been established which categorize the effects experienced by human being into
well defined level ranging from minimum sensations to catastrophic extremes. The historical / pre-
instrumental earthquake data was collected from Oldham23, Heuckroth et al.24, Ambraseys et al.25
and Quittmeyer et al.26 catalogues as the same source of information has been used in the
seismotectonic studies of other large projects in Pakistan (Tarbela dam, Mangla dam, etc.).
A brief description of the main historic events in the region under study is given below:
a) 4th Century B.C
The first known historical account of seismicity in this region was described in 4th Century B.C by
Aristobulus of Cassanderia. He accompanied Alexander on his expedition to India and pointed out
that the country above river Jhelum was subjected to earthquakes which caused the ground to open
up so much that even the river bed was changed.
b) Year 25 A.D
Another historical record of a destructive earthquake is available of Taxila event. This event was
located in the Hazara area and occurred in 25 A.D. Seismic intensity at Taxila was about X and felt
throughout the country. The damage effects are still witnessed in the remains of Jandial, Sirkap and
Dharmarajika around Taxila. After the earthquake, building methods had to be changed and height
of the buildings was reduced. It was also started to ensure that foundations of the new buildings are
more secure.
c) June 23, 1669
An earthquake with as much intensity as IX was felt at the city of Attock.
d) September 24, 1827
A destructive earthquake was felt in Lahore Region. The Fort Kolitaran near the city was destroyed.
About 1000 lives were lost. A hill was shaken down which fell into the River Ravi. Its maximum
intensity was estimated as VIII-IX.
23
Oldham, T.; A catalogue of Indian earthquakes, Mem. Geol. Survey India, Vol. 19 (1893) 24
Heuckroth, L. and Karim, R.: Earthquake history, seismicity and tectonics of the regions of Afghanistan, Seism. Centre, Kabul University (1970).
25 Ambraseys A. Lensen G., and Monifer A.; The Pattan earthquake of 28 December 1974, UNESCO Publication
(1975) 26
Quittmeyer R.C and Jacob K.H; Historical and modern seismicity of Pakistan, Afghanistan, northwestern India and southeastern Iran ; Bull. Siesm. Soc. Am. Vol. 69, No.3 (1979)

9
e) May 30, 1885
A destructive earthquake in Kashmir, which inflicted heavy destruction in Sopor, Gulmarg and
Srinagar area, 3,000 people were killed. Radius of perceptibility was about 650 km. Many aftershocks
were recorded. The maximum intensity in the epicentral region was VIII.
The intensities of the felt earthquakes recorded in this region are shown in Figure 5.
Figure 5: Felt Earthquake Intensities
A chronological list of available intensity data of the earthquakes occurred in the Project region
before the present instrumental recordings started in 1904 is given in Table 1.
Table 1: Historical Earthquakes in the Project Region
Sr. No.
Year Date Description Estimated
Intensity MM Source
1 4
th
Century BC
Aristobulus of Cassandreia, who accompanied Alexander on his expedition to India, points out that the country above the river Hydaspes (Jhelum) is subjected to earthquakes which cause the ground to open up so that even the beds of river are changed.
IX-X Ambraseys
2 25 AD
A destructive earthquake in north-western Pakistan laid Taxila in ruins and caused wide spread havoc throughout the country side. The effects of this earthquake can still be seen among the excavated remains at Jandial, Sirkap and Dharmarajika. As result of the earthquake new methods of buildings were introduced and the height of buildings was reduced from four to two storeys with special precautions to make the foundation secure.
IX-X Q&J
3 1669 4-
Jun Strongly felt in Mandra VI-X Q&J

10
Sr. No.
Year Date Description Estimated
Intensity MM Source
4 1669 23-Jun
An earthquake at Attock, a fissure 50 yards long was formed in the ground.
VIII-IX Q&J
5 1827 24-Sep
Destructive in Lahore region. Fort Kolitaran near city destroyed, about 1000 perished in ruins. A hill shaken down, which fell into river Rowee (Ravi) produced an inundation of 100 coss of land.
VIII-IX Q&J
6 1831
Peshawar & valley of Indus – Severe, extended from Peshawar to Dera Ghazi Khan, felt most at Dera bank (Darban); men and camels unable to stand, rocks fell in many places, water forced from crevices in the plains.
Daraban VIII-IX Peshawar & D.G.
Khan IV-VI Q&J
7 1832 22-Jan
Near Lahore-violent, people all rushed out of houses.
V-VI
8 1832 21-Feb
Lahore, valley of Badakhshan, N.W. India huge masses of rock was thrown from the cliffs at many places chocking up valleys. Great part of population destroyed.
Lahore V-VI Mangla V
9 1842 19-Feb
Kabul, Peshawar. At Kabul said to have lasted for 3 minutes, several shocks, rocked the fouth in a frightful manner. At Peshawar very destructive, “earth-trembled like aspen leaf” several killed. At Ferozpur severe. At Ludhiyana north south, the hot springs of South (temp. 140 deg-110 deg) become as cold as the ordinary wells, water diminished greatly and at times the springs were completely dry. These appearances continued for 25 days.
Kabul Q&J
VI-VII Peshawar VI
Ferozpur VI
10 1851 4-
Feb Lahore, appears to have extended all over Punjab. Lahore V-VI
11 1851 6-
Feb Lahore, appears to have extended all over Punjab. Lahore V-VI
12 1851 17-Feb
Strongly felt in Lahore, Multan Lahore V-VI
13 1853 Nov. Strongly felt in Attock VI Q&J
14 1858 29-
Aug Lahore-sharp shocks Lahore IV-V
15 1865 22-Jan
Slight damage and great panic in Peshawar, long duration.
V-VII
16 1865 4-
Dec Lahore – tow smart shocks III-V
17 1867 10-
Nov Damaging in Bannu VII-VIII Q&J
18 1868 11-
Aug Damaging in Peshawar, a portion of the fort was shaken down (official record).
VII-VIII Q&J
19 1868 12-
Nov
Violent shock felt in Lahore, Dera Ismail Khan and Attock, followed by many aftershocks which were felt throughout the Punjab.
Attock IV-VI & D.I. Khan IV-VI
Q&J
20 1869 24-
Mar Severe shock in the upper reaches of Jhelum V-VII Q&J
21 1869 25-
Mar
A large earthquake in the Hindukush, strongly felt at Kohat, Lahore, Peshawar and at Khojend and Tashkent; shocking lasting 20 seconds.
Kohat, Lahore & Peshawar V
NESPAK

11
Sr. No.
Year Date Description Estimated
Intensity MM Source
22 1869 April Peshawar – Part of fort shaken down (official record).
VII-VIII Q&J
23 1869 20-Dec
Rawalpindi – Shock said to have lasted for 1/2 a minute; cracked walls and caused all people to run out of houses. Attock – A series of shocks at intervals of about 20 sec. Lawrencepur – Ist shocks 15 sec others at 5 sec. interval. Campbellpur – For half an hour; building much damaged. Talagang – Not felt
VII-VIII Q&J
24 1871 April Severe at Rawalpindi and Murree; originating from Kashmir
Rawalpindi & Murree VI
Q&J
25 1875 12-Dec
Damaging in villages between Lahore and Peshawar where a number of people were killed.
VII-VIII Q&J
26 1878 2-
Mar
Damaging earthquake in the Punjab. At Kohat several houses, public buildings and portion of the wall of the fort fell. At Peshawar, it caused damage to houses and city walls. Damaging at Attock, Abbottabad, Rawalpindi, Jhelum, Murree. Strongly felt at Bannu, Nowshera, Mardan, Lahore and Simla. Many aftershocks.
Peshawar & Kohat VII-VIII, Attock VI-
VII, Lahore VI
27 1883 April Damaging shock at Peshawar. VI-VIII Q&J
28 1885 30-
May
Destructive shock in Kashmir, Sopor, Gulmarg and Srinagar about totally ruined and 3,000 people killed. Heavy damage at Gurias and Punch: Muzaffarabad heavily damaged. Felt in Peshawar, Lahore, Simla, Leh, Kanpalu, and Gilgit. Radius of perceptibility about 650 km. Many aftershocks.
Kashmir VIII, Muzaffarabad VI-VII, Peshawar IV
Q&J
29 1893 3-
Nov Slight damage at Peshawar, Nowshera, felt throughout the Punjab
VI-VII Q&J
30 1905 4-
Apr Kangra earthquake, in Rawalpindi few lofty buildings cracked, some damage in Lahore.
Kangra VIII Rawalpindi V-VI
Q&J
31 1929 1-
Feb
Destructive earthquake, perhaps shallower than calculated, ruin Skorzor and Drosh. Damage was equally heavy in the USSR at Kulyab. It caused substantial damage in Abbottabad, Peshawar, Cherat, Gurez, Chitral and Dushambe. It was felt within a radius area of 1,000 km.
Abbottabad & Peshawar VI-VII
NESPAK
32 1939 21-
Nov
Destructive in the Badakhshan area, the damage extending to Srinagar, Rawalpindi and Kargil. Drosh was seriously damaged. Felt within a radius of 600 km.
Rawalpindi V-VI NESPAK
33 1945 27-Jun
Felt in Peshawar IV NESPAK
34 1945 22-Jun
Destructive at Chamba and parts of Kahsmir. Strongly felt at Rawalpindi, Peshawar, Lahore and Simla.
Rawalpindi V NESPAK
35 1953 1-
Mar Slight damage in Cambellpur VI-VII Q&J
36 1956 16-Sep
Destructive in the Ghazi district in Afghanistan where many villages were destroyed and animals lost. The damage was equally serious at Said Karem. Cause panic at Kohat. Strongly felt at Parachinar, Parwan, Loger, Ghaiz, Nazerajat, Beshud, Makur, Rawalpindi and Rawalpindi
Rawalpindi V NESPAK

12
Sr. No.
Year Date Description Estimated
Intensity MM Source
Srinagar. Radius of perceptibility about 450 km.
37 1962 2-
Aug Felt at Rawalpindi IV-VI Q&J
38 1966 11-Jan
Felt at Risalpur IV NESPAK
39 1966 2-
Feb
Strongly felt around Abbottabad where it caused minor damage at Havelian. Felt at Rawalpindi, Islamabad, Abbottabad, Taxila. The shock was felt at Muzaffarabad and Gujar Khan.
Abbottabad VI Islamabad V Taxila
VI Q&J
40 1977 14-Feb
About 7 km northeast of Rawalpindi caused damage in 20 villages. In villages Kuri, Malot and Pindi Begwal around Nilour most of the “Katcha” houses either collapsed or damaged. A few houses built with dressed blocks of sandstone and sand-cement mortar also developed extensive cracks.
VII NESPAK
41 1978 7-
May Felt widely at Punjab and NWFP Provinces. Some damage at Peshawar and Chitral.
Mangla IV Tarbela VI
WAPDA
42 1980 12-Feb
Felt widely in the areas of Punjab and NWFP. Mangla IV Tarbela
V WAPDA
43 1983 31-Dec
Felt widely in the areas of Punjab and NWFP. Damages at Peshawar, Chitral and many northern areas. Some damage near Tarbela also. Felt in parts of Afghanistan also.
Chitral VII Peshawar VI Rawalpindi V
Tarbela V Mangla III
WAPDA
44 1996 4-
Apr
Felt widely in the areas of Punjab and NWFP. Some damages at Peshawar, Chitral and Northern Areas. Some damage near Tarbela also. Felt also in parts of Afghanistan.
Chitral VI Peshawar V
Rawalpindi IV Mangla III Lahore
& Jhelum III
WAPDA
45 1999 17-Feb
Epicenter near Mangla. Felt also in the adjoining areas.
Mangla IV WAPDA
Instrumental Seismicity
The instrumental recording of earthquakes started in 1904 but the number of seismic stations
remained small in South Asian Region until 1960 when the installation of high quality seismographs
under World Wide Standard Seismograph Network (WWSSN) increased the quality of earthquake
recording. In addition, local microseismic networks were also established at important dams and
other projects in Pakistan. In the present seismic studies, two classes of instrumental earthquake
data have been used. The first one is based upon earthquakes recorded by local seismic networks
and the other is compiled from regional data catalogues.
Seismicity Recorded by Local Networks
Near the Project site, an independent telemetry microseismic network belonging to Mangla Dam
Project is functioning. Initially, it comprised of three stand-alone stations since 1966. However, in
1993, it was replaced with a more modern microseismic network having thirteen field seismic
stations out of which seven have been put to operation. The Central Recording Station (CRS) is

13
installed near the left abutment of the main embankment of Mangla dam. The microseismicity
recorded by Mangla Dam network is shown in Figure 6.
Figure 6: Microseismicity of the Project Region
Seismicity Recorded by Regional Networks
The regional seismic data catalogue being used in the study is compiled on the basis of seismic
events listed since 1904 by various agencies like British Association for the Advancement of Science
(BAAS), International Seismological Centre (ISC), International seismological summary (ISS), United
States Geological Survey (USGS) and others. It consists of a list of 594 earthquakes among which 331
earthquakes have magnitude more than or equal to 4 within a radius of about 200 km from project
site.
Composite Earthquake Catalogue
A composite list of earthquakes recorded within about 200 km of the Project site was prepared from
the data collected from regional as well as microseismic networks mentioned above. This list
contains all the earthquakes recorded in area between latitude 32.0o-35.0oN and longitude 72.0o-
76.0oE. This list is presented in Table 2. The epicenters of these earthquakes are plotted in Figure 7.

14
Figure 7: Seismotectonic Map of the Project Region
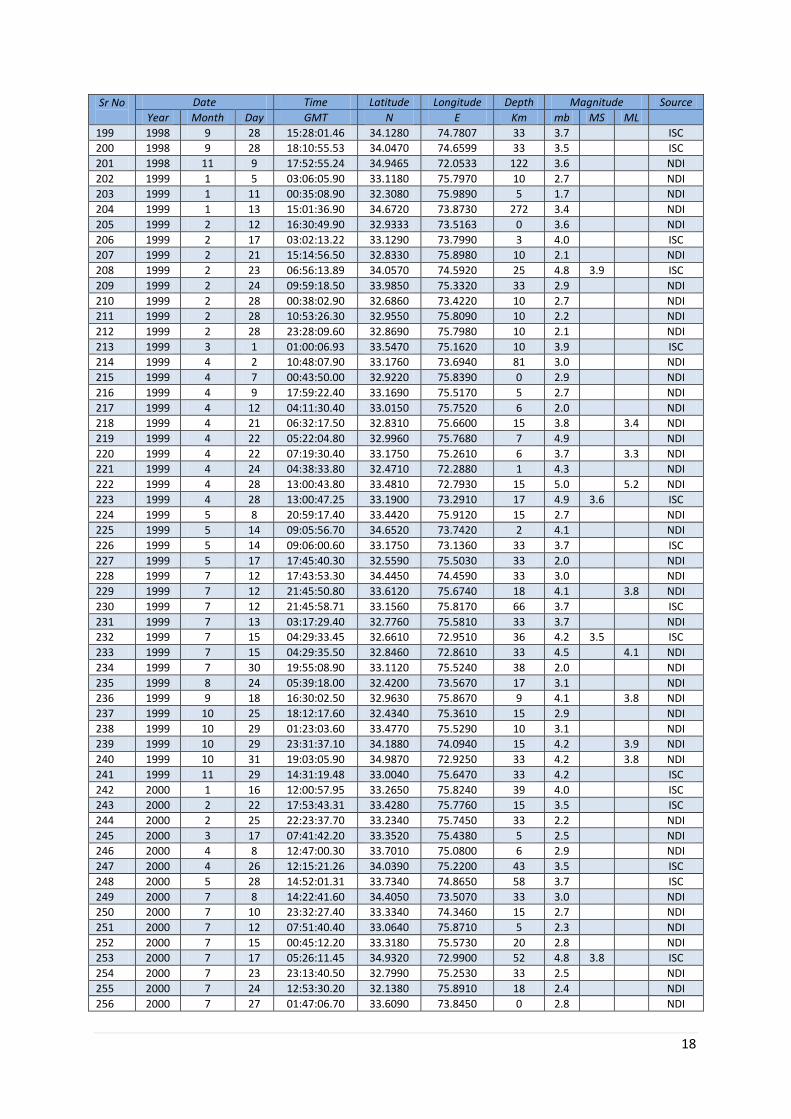
Table 2: Composite List of Recorded Earthquake Data
Sr No
Date Time Latitude Longitude Depth Magnitude Source
Year Month Day GMT N E Km mb MS ML
1 1905 4 4 00:50:00.00 33.0000 76.0000 35 6.8 8.0
PAS
2 1928 11 14 04:33:09.00 35.0000 72.5000 110 5.6 6.0
PAS
3 1937 11 7 19:07:40.00 35.0000 73.0000 100 5.5 5.8
PAS
4 1945 6 22 18:00:57.00 32.5000 76.0000 60 5.9 6.5
PAS
5 1964 2 13 05:10:47.20 34.9900 72.7000 68 4.5
ISC
6 1964 7 3 14:10:27.80 34.1500 74.9100 33 4.9
ISC
7 1964 12 31 08:21:11.00 34.9000 73.0000 131 4.4
ISC
8 1965 10 9 04:34:22.00 32.3000 74.0000 79 4.5
USCGS
9 1965 11 8 21:23:09.40 34.6000 73.3000 65 4.6
USCGS
10 1966 2 2 09:20:09.30 33.8900 73.2000 37 5.1
ISC
11 1966 3 16 00:08:17.30 33.2300 75.9100 33 4.7
ISC
12 1966 4 6 01:51:53.20 34.9100 73.0600 54 5.1
ISC
13 1967 2 10 05:46:29.00 33.2800 75.2900 21 4.8
ISC
14 1967 2 20 14:23:48.70 33.6900 75.4200 38 4.8
ISC
15 1967 2 20 15:18:39.00 33.6300 75.3300 20 5.5
ISC
16 1967 2 20 15:39:54.40 33.4800 74.8300 96 4.0
ISC
17 1967 2 21 12:37:43.00 33.6500 75.4400 20 4.9
ISC
18 1967 2 24 00:17:38.80 33.5700 75.3900 32 4.6
ISC
19 1967 7 2 08:32:39.70 33.2100 75.7100 42 4.8
ISC
20 1968 3 3 09:31:21.60 34.7100 72.3600 43 5.0
ISC
21 1968 7 3 19:46:55.00 34.8000 74.6000 88 4.6
ISC
22 1969 1 23 20:01:21.00 32.1900 76.0000 64 3.9
ISC
23 1970 1 2 20:01:02.00 32.5000 76.0000 96 4.1
ISC
24 1970 4 28 14:12:32.00 32.8000 74.9000 116 4.5
ISC

15
Sr No
Date Time Latitude Longitude Depth Magnitude Source
Year Month Day GMT N E Km mb MS ML
25 1970 4 28 15:11:47.70 32.9000 74.7000 126 3.5
ISC
26 1970 4 30 03:24:54.30 33.2600 73.4300 33 4.8
ISC
27 1970 6 11 10:30:39.90 33.1100 75.0000 72 4.5
ISC
28 1970 9 7 21:19:09.00 33.0000 75.2000 54 4.6
ISC
29 1970 12 5 17:51:54.00 33.9000 74.5000 75 4.3
ISC
30 1971 4 28 15:12:42.62 34.4449 73.5973 43 4.8
ISC
31 1971 12 27 20:59:39.26 34.9776 73.0234 55 5.2
ISC
32 1972 1 8 01:30:35.00 34.7000 74.1000 96 4.0
ISC
33 1972 3 10 14:36:16.95 33.9073 72.7158 40 4.9
ISC
34 1972 4 17 02:24:50.14 33.9487 72.8622 52 4.8
ISC
35 1972 9 27 02:03:39.00 33.9910 72.6996 41 5.1
ISC
36 1973 1 16 21:31:25.86 33.2922 75.8320 39 5.1
ISC
37 1973 4 10 00:10:02.88 33.1703 75.7460 61 4.4
ISC
38 1973 7 13 22:03:38.06 33.1732 75.6747 48 4.8
ISC
39 1973 7 13 22:54:27.85 33.1819 75.7057 55 4.4
ISC
40 1973 10 24 05:23:51.34 33.1479 75.9166 37 5.3
ISC
41 1973 10 24 19:57:17.09 33.1167 75.9269 48 4.9
ISC
42 1973 12 16 19:09:46.94 34.2686 74.0466 40 5.1
ISC
43 1974 3 25 13:44:05.79 33.7003 72.6774 39 4.4
ISC
44 1974 3 26 04:45:54.73 33.8805 72.8457 72 4.1
ISC
45 1974 4 12 10:32:48.23 33.5311 73.8677 50 4.4
ISC
46 1974 5 20 17:39:19.59 34.5632 74.2327 49 4.8
ISC
47 1974 8 1 19:54:11.76 33.4410 74.5294 0 4.5
ISC
48 1974 8 11 17:21:00.02 34.8828 73.2713 33 4.1
ISC
49 1974 12 28 22:38:53.24 34.9946 73.1013 68 4.8
ISC
50 1975 1 20 09:28:00.68 34.9363 73.1054 63 4.6
ISC
51 1975 4 7 06:41:02.95 34.9085 72.9663 53 5.0
ISC
52 1975 10 17 10:46:09.30 34.2535 74.0640 77 4.1
ISC
53 1975 10 30 14:20:54.36 32.8923 75.7092 75 4.7
ISC
54 1975 10 30 14:36:44.40 32.9700 75.9583 45 4.8
ISC
55 1975 12 10 05:03:47.30 32.7871 75.9180 76 4.7
ISC
56 1976 1 9 23:50:16.49 32.7799 75.9813 96 4.5
ISC
57 1976 2 25 07:45:23.79 33.3444 74.8921 51 4.5
ISC
58 1976 5 22 18:32:53.58 33.0491 75.8290 71 4.4
ISC
59 1977 1 21 14:57:46.38 32.7601 75.9826 51 4.5
ISC
60 1977 2 14 00:22:37.80 33.5967 73.2669 27 5.2
ISC
61 1978 4 12 02:10:16.20 33.7184 75.4263 33 3.8
ISC
62 1978 4 27 18:12:24.79 35.0022 73.0280 58 4.9
ISC
63 1978 5 7 10:32:25.57 33.3964 73.6306 25 5.0 4.4
ISC
64 1978 5 16 06:31:57.14 33.1817 75.3309 96 4.1
ISC
65 1978 5 17 08:39:15.29 32.8934 75.7301 96 4.0
ISC
66 1978 11 18 01:35:00.00 32.8740 72.7513 39 4.6
ISC
67 1979 3 4 02:51:47.95 33.9436 73.1959 42 4.7
ISC
68 1979 7 2 16:27:04.29 34.7364 74.9361 74 4.4
ISC
69 1979 7 2 16:30:47.22 34.5062 74.3684 89 4.6
ISC
70 1979 12 4 04:05:42.07 34.1725 74.0963 33 4.7
ISC
71 1979 12 22 22:28:44.99 33.1078 75.8963 18 4.8 4.1
ISC
72 1980 2 5 20:17:56.85 33.2496 75.8083 33 4.2
ISC
73 1980 2 9 18:23:01.17 32.7900 72.5576 27 4.1
ISC
74 1980 3 29 02:02:53.68 32.7961 73.9736 18 4.7
ISC
75 1980 3 29 07:12:56.39 33.1427 73.2231 30 4.5
ISC
76 1980 5 1 05:43:10.65 33.0264 75.9745 18 4.9 3.8
ISC
77 1980 7 27 11:24:00.24 34.6240 72.0444 53 4.0
ISC
78 1980 8 23 21:36:49.04 32.9637 75.7509 3 5.2 4.9
ISC
79 1980 8 23 21:50:01.20 32.9023 75.7974 13 5.2 4.9
ISC
80 1980 10 5 10:47:18.67 34.6882 74.2892 33 4.1
ISC
81 1981 2 6 09:54:01.40 34.3459 72.0258 263 3.8
ISC
82 1981 6 23 19:54:02.10 34.2608 74.8815 33 4.8
ISC

16
Sr No
Date Time Latitude Longitude Depth Magnitude Source
Year Month Day GMT N E Km mb MS ML
83 1981 7 4 03:49:25.77 34.3555 75.2542 209 3.7
ISC
84 1981 8 17 09:11:15.75 33.4165 75.6202 6 4.9 3.8
ISC
85 1981 9 27 11:10:42.48 33.2954 75.6352 33 4.5
ISC
86 1981 11 9 19:31:02.47 33.3267 75.8524 33 4.5
ISC
87 1981 12 14 18:25:39.23 33.1881 75.7226 21 4.5
ISC
88 1982 1 17 12:17:37.86 34.5236 73.9030 33 3.9
ISC
89 1982 4 3 22:39:21.98 33.3664 73.4204 3 4.1
ISC
90 1982 9 8 17:53:18.54 32.9277 75.4959 33 4.8
ISC
91 1982 10 25 08:16:27.39 34.0589 73.5200 83 4.3
ISC
92 1983 1 18 13:45:30.03 34.3461 74.2660 33 4.8
ISC
93 1983 5 30 08:39:49.37 32.7136 75.4850 41 4.6
ISC
94 1983 10 12 02:44:42.23 33.7596 75.7209 33 4.5
ISC
95 1984 2 18 07:08:56.67 34.3491 72.0208 33 4.1
ISC
96 1984 4 21 20:34:20.58 34.9902 73.6360 10 3.8
ISC
97 1984 5 23 03:14:17.66 33.1703 75.9302 14 4.8
ISC
98 1984 6 4 05:03:50.16 34.8752 73.0254 52 4.6
ISC
99 1984 8 15 05:31:04.62 34.9020 74.4680 53 4.5
ISC
100 1984 12 20 07:32:07.23 32.9495 72.6961 37 4.6
ISC
101 1984 12 27 20:22:05.91 32.9062 72.6691 22 4.6
ISC
102 1984 12 28 16:28:01.63 34.6108 73.6090 47 4.5
ISC
103 1985 2 25 18:56:07.72 34.2191 74.4430 44 4.6
ISC
104 1985 4 23 12:23:56.07 32.8225 73.2092 64 4.6
ISC
105 1985 8 10 12:56:13.90 33.8905 74.8008 41 4.6
ISC
106 1986 4 25 06:30:50.46 34.8207 73.5379 33 3.9
ISC
107 1986 5 16 05:16:13.70 34.0000 72.5800 15 4.3
4.0 ISC
108 1986 7 10 07:56:12.00 34.1500 72.6900 2 4.7
4.5 ISC
109 1986 7 30 04:03:27.18 33.0499 75.8544 61 4.6
ISC
110 1986 9 19 11:15:38.56 34.2749 73.0635 64 4.4
ISC
111 1987 3 16 06:09:36.61 34.8302 72.3380 212 3.7
ISC
112 1987 7 12 12:19:18.59 33.4897 73.5054 22 4.4 3.3
ISC
113 1988 1 9 01:16:12.48 34.4401 73.3257 95 4.4
ISC
114 1988 1 20 11:48:33.40 34.6956 74.6575 33 4.3
ISC
115 1988 1 21 10:26:48.69 34.7349 73.1783 33 3.4
ISC
116 1988 11 25 00:07:07.45 32.8931 75.8088 80 4.8
ISC
117 1988 12 7 21:13:54.99 33.9486 72.9770 50 4.4
ISC
118 1989 4 7 05:43:24.49 33.7463 73.2029 43 4.3
ISC
119 1989 5 7 10:19:33.68 32.2303 72.3548 33 3.9
ISC
120 1989 5 10 20:05:28.01 33.3402 75.6956 33 3.9
ISC
121 1989 5 10 20:19:21.56 33.3270 75.6545 37 4.7 4.0
ISC
122 1989 9 7 07:42:36.94 34.7668 74.2484 147 4.4
ISC
123 1989 12 5 02:46:11.18 34.8303 73.7770 33 4.2
ISC
124 1990 3 3 05:53:37.96 32.8660 74.1490 10 4.3
ISC
125 1990 3 6 14:43:08.50 33.2381 75.3939 10 3.8
ISC
126 1990 3 15 17:33:27.92 34.5038 74.0883 33 4.5
ISC
127 1990 4 26 15:39:18.31 34.5983 73.5383 33 4.2
ISC
128 1990 9 7 01:57:55.58 34.1017 73.1395 33 4.0
ISC
129 1990 10 9 21:56:38.54 34.0921 73.1564 33 4.4
ISC
130 1990 11 12 15:45:19.76 33.2544 75.8220 67 4.8
ISC
131 1990 12 20 05:46:48.57 34.4392 74.6409 33 4.3
ISC
132 1990 12 25 03:56:46.06 33.3059 75.7558 51 5.3 4.5
ISC
133 1991 1 10 01:33:22.37 34.0152 74.8202 33 3.9
ISC
134 1991 3 16 03:57:42.41 34.5221 72.6623 33 4.5
ISC
135 1991 5 17 17:04:30.87 34.9251 73.8863 33 3.9
ISC
136 1991 5 24 15:38:03.11 34.9778 72.2006 210 3.4
ISC
137 1991 12 18 14:17:21.95 32.8030 73.6496 42 4.2
ISC
138 1992 1 6 19:07:13.99 34.0237 74.0587 34 4.3
ISC
139 1992 2 6 18:47:03.05 34.7764 72.7539 33 4.0
ISC
140 1992 3 24 21:01:47.77 33.8365 72.9023 14 4.9 4.4
ISC

17
Sr No
Date Time Latitude Longitude Depth Magnitude Source
Year Month Day GMT N E Km mb MS ML
141 1992 4 17 12:42:58.71 34.1295 72.7016 13 4.2
ISC
142 1992 6 19 23:02:35.62 32.2247 72.0831 33 3.8
ISC
143 1993 2 17 16:06:07.62 33.5623 72.5114 26 4.9 4.3
ISC
144 1993 5 15 07:27:12.14 34.8269 72.0362 33 3.8
ISC
145 1993 5 15 08:14:04.96 34.9046 72.0295 33 3.8
ISC
146 1993 6 8 14:30:37.83 33.6669 72.7367 32 4.8
ISC
147 1993 7 2 21:03:59.63 34.1576 73.4272 19 4.3
ISC
148 1993 7 12 01:27:51.90 33.3303 75.9049 33 4.0
ISC
149 1993 9 15 15:08:14.79 33.3314 75.7436 44 5.0 4.3
ISC
150 1993 11 13 00:01:40.54 34.3166 73.5060 33 3.9
ISC
151 1994 4 15 09:44:21.37 34.5578 74.1278 58 4.5
ISC
152 1994 5 13 09:19:52.17 32.5496 75.9544 33 4.3
ISC
153 1994 8 4 22:43:10.32 33.8449 72.1197 28 3.8
ISC
154 1994 12 19 03:22:18.05 34.0508 72.0483 33 3.9
ISC
155 1995 9 26 20:31:54.64 32.2679 74.8940 0 4.2
ISC
156 1995 12 8 21:00:25.17 33.4263 72.6422 10 4.1
ISC
157 1995 12 30 23:40:16.95 34.8482 72.0314 33 3.8
ISC
158 1996 2 14 01:52:22.94 34.9863 73.0220 30 3.9
ISC
159 1996 2 20 02:55:52.66 34.0396 72.6740 46 4.7 4.2
ISC
160 1996 3 25 06:31:20.76 33.1437 73.5821 16 4.6 3.5
ISC
161 1996 4 21 01:09:48.70 34.7841 73.5142 34 4.0
ISC
162 1996 5 5 10:21:23.30 33.5900 72.7600 0 3.7
EIDC
163 1996 5 15 15:02:06.43 33.1462 75.8056 58 3.5
ISC
164 1996 5 24 16:23:44.70 34.4198 72.4188 55 4.1
ISC
165 1996 8 8 14:58:19.85 34.0425 72.9533 21 4.8 4.2
ISC
166 1996 8 17 15:48:02.76 33.4550 75.4542 78 3.2
ISC
167 1996 8 25 05:13:25.20 34.1200 75.6900 0 3.8
EIDC
168 1996 9 8 10:47:15.70 33.8220 72.3103 33 3.6
ISC
169 1996 9 23 11:13:11.52 33.3954 75.6388 33 3.5
ISC
170 1996 11 28 22:56:33.30 32.2700 72.9400 85 3.6
EIDC
171 1996 12 14 09:48:39.36 34.2335 74.7044 33 4.0
ISC
172 1996 12 16 17:59:35.16 33.1416 75.9892 46 3.4
ISC
173 1997 1 19 13:59:24.10 33.6811 75.0662 33 3.6
ISC
174 1997 4 12 05:35:24.18 33.4529 75.7405 33 3.4
ISC
175 1997 5 19 22:21:49.17 34.6110 72.4376 16 3.8
ISC
176 1997 5 31 19:20:21.03 34.8346 73.6131 57 4.4 3.9
ISC
177 1997 7 2 12:01:58.75 34.4141 73.7255 33 3.8
ISC
178 1997 7 21 17:24:49.30 32.9030 72.3950 0 3.8
EIDC
179 1997 7 29 09:43:35.67 32.8482 73.7897 7 4.0 3.1
ISC
180 1997 8 28 01:15:41.20 33.7600 73.2600 15 4.5
4.3 BJI
181 1997 9 5 15:41:52.39 33.9647 73.0764 24 4.0
ISC
182 1997 10 25 12:20:34.30 34.2825 73.3834 0 3.6
EIDC
183 1997 12 7 18:59:50.80 32.9700 75.0200 33 3.2
2.7 NDI
184 1997 12 23 04:15:04.96 33.8045 75.2336 33 4.0
ISC
185 1997 12 27 12:38:20.70 33.9600 75.8800 26 4.1
3.8 BJI
186 1998 3 18 13:35:22.56 35.0082 74.3500 102 3.7
ISC
187 1998 3 24 04:25:43.89 32.3976 74.0587 54 4.0 3.6
ISC
188 1998 5 10 09:42:23.20 34.3737 72.5867 0 3.8
EIDC
189 1998 5 18 12:29:31.78 33.1574 75.8387 65 3.5
ISC
190 1998 5 24 13:22:28.84 34.5864 74.3820 33 3.6
ISC
191 1998 5 29 19:11:05.14 34.1016 73.1230 33 3.9
ISC
192 1998 6 7 08:20:35.68 34.0109 73.0408 33 3.5
ISC
193 1998 6 8 12:22:07.70 34.5535 74.1551 0 3.6 3.3
EIDC
194 1998 7 6 22:50:49.32 33.0806 75.9018 23 3.7
ISC
195 1998 7 6 10:24:06.24 32.9384 75.7640 59 3.8
ISC
196 1998 7 12 05:45:02.41 34.0217 72.7723 66 4.5
ISC
197 1998 8 17 17:55:01.86 33.1524 75.7102 33 3.5
ISC
198 1998 8 21 01:58:36.26 34.3694 73.7272 64 4.0
ISC
18
Sr No
Date Time Latitude Longitude Depth Magnitude Source
Year Month Day GMT N E Km mb MS ML
199 1998 9 28 15:28:01.46 34.1280 74.7807 33 3.7
ISC
200 1998 9 28 18:10:55.53 34.0470 74.6599 33 3.5
ISC
201 1998 11 9 17:52:55.24 34.9465 72.0533 122 3.6
NDI
202 1999 1 5 03:06:05.90 33.1180 75.7970 10 2.7
NDI
203 1999 1 11 00:35:08.90 32.3080 75.9890 5 1.7
NDI
204 1999 1 13 15:01:36.90 34.6720 73.8730 272 3.4
NDI
205 1999 2 12 16:30:49.90 32.9333 73.5163 0 3.6
NDI
206 1999 2 17 03:02:13.22 33.1290 73.7990 3 4.0
ISC
207 1999 2 21 15:14:56.50 32.8330 75.8980 10 2.1
NDI
208 1999 2 23 06:56:13.89 34.0570 74.5920 25 4.8 3.9
ISC
209 1999 2 24 09:59:18.50 33.9850 75.3320 33 2.9
NDI
210 1999 2 28 00:38:02.90 32.6860 73.4220 10 2.7
NDI
211 1999 2 28 10:53:26.30 32.9550 75.8090 10 2.2
NDI
212 1999 2 28 23:28:09.60 32.8690 75.7980 10 2.1
NDI
213 1999 3 1 01:00:06.93 33.5470 75.1620 10 3.9
ISC
214 1999 4 2 10:48:07.90 33.1760 73.6940 81 3.0
NDI
215 1999 4 7 00:43:50.00 32.9220 75.8390 0 2.9
NDI
216 1999 4 9 17:59:22.40 33.1690 75.5170 5 2.7
NDI
217 1999 4 12 04:11:30.40 33.0150 75.7520 6 2.0
NDI
218 1999 4 21 06:32:17.50 32.8310 75.6600 15 3.8
3.4 NDI
219 1999 4 22 05:22:04.80 32.9960 75.7680 7 4.9
NDI
220 1999 4 22 07:19:30.40 33.1750 75.2610 6 3.7
3.3 NDI
221 1999 4 24 04:38:33.80 32.4710 72.2880 1 4.3
NDI
222 1999 4 28 13:00:43.80 33.4810 72.7930 15 5.0
5.2 NDI
223 1999 4 28 13:00:47.25 33.1900 73.2910 17 4.9 3.6
ISC
224 1999 5 8 20:59:17.40 33.4420 75.9120 15 2.7
NDI
225 1999 5 14 09:05:56.70 34.6520 73.7420 2 4.1
NDI
226 1999 5 14 09:06:00.60 33.1750 73.1360 33 3.7
ISC
227 1999 5 17 17:45:40.30 32.5590 75.5030 33 2.0
NDI
228 1999 7 12 17:43:53.30 34.4450 74.4590 33 3.0
NDI
229 1999 7 12 21:45:50.80 33.6120 75.6740 18 4.1
3.8 NDI
230 1999 7 12 21:45:58.71 33.1560 75.8170 66 3.7
ISC
231 1999 7 13 03:17:29.40 32.7760 75.5810 33 3.7
NDI
232 1999 7 15 04:29:33.45 32.6610 72.9510 36 4.2 3.5
ISC
233 1999 7 15 04:29:35.50 32.8460 72.8610 33 4.5
4.1 NDI
234 1999 7 30 19:55:08.90 33.1120 75.5240 38 2.0
NDI
235 1999 8 24 05:39:18.00 32.4200 73.5670 17 3.1
NDI
236 1999 9 18 16:30:02.50 32.9630 75.8670 9 4.1
3.8 NDI
237 1999 10 25 18:12:17.60 32.4340 75.3610 15 2.9
NDI
238 1999 10 29 01:23:03.60 33.4770 75.5290 10 3.1
NDI
239 1999 10 29 23:31:37.10 34.1880 74.0940 15 4.2
3.9 NDI
240 1999 10 31 19:03:05.90 34.9870 72.9250 33 4.2
3.8 NDI
241 1999 11 29 14:31:19.48 33.0040 75.6470 33 4.2
ISC
242 2000 1 16 12:00:57.95 33.2650 75.8240 39 4.0
ISC
243 2000 2 22 17:53:43.31 33.4280 75.7760 15 3.5
ISC
244 2000 2 25 22:23:37.70 33.2340 75.7450 33 2.2
NDI
245 2000 3 17 07:41:42.20 33.3520 75.4380 5 2.5
NDI
246 2000 4 8 12:47:00.30 33.7010 75.0800 6 2.9
NDI
247 2000 4 26 12:15:21.26 34.0390 75.2200 43 3.5
ISC
248 2000 5 28 14:52:01.31 33.7340 74.8650 58 3.7
ISC
249 2000 7 8 14:22:41.60 34.4050 73.5070 33 3.0
NDI
250 2000 7 10 23:32:27.40 33.3340 74.3460 15 2.7
NDI
251 2000 7 12 07:51:40.40 33.0640 75.8710 5 2.3
NDI
252 2000 7 15 00:45:12.20 33.3180 75.5730 20 2.8
NDI
253 2000 7 17 05:26:11.45 34.9320 72.9900 52 4.8 3.8
ISC
254 2000 7 23 23:13:40.50 32.7990 75.2530 33 2.5
NDI
255 2000 7 24 12:53:30.20 32.1380 75.8910 18 2.4
NDI
256 2000 7 27 01:47:06.70 33.6090 73.8450 0 2.8
NDI

19
Sr No
Date Time Latitude Longitude Depth Magnitude Source
Year Month Day GMT N E Km mb MS ML
257 2000 8 11 03:46:44.40 32.6050 75.5110 48 2.9
2.3 NDI
258 2000 8 14 14:46:11.80 33.0770 75.4000 14 2.7
NDI
259 2000 8 23 14:32:44.70 34.0750 74.3830 33 4.7
NDI
260 2000 8 24 01:29:08.60 33.3190 75.4200 33 3.0
NDI
261 2000 8 28 00:32:11.20 33.4440 75.2430 7 2.7
NDI
262 2000 8 31 22:46:36.70 34.1240 73.4810 33 3.2
NDI
263 2000 9 5 14:04:28.90 33.9730 75.0360 33 2.9
NDI
264 2000 9 6 02:53:03.49 34.3400 75.0920 33 3.7
ISC
265 2000 9 7 21:58:41.80 33.3240 74.8350 26 3.4
NDI
266 2000 9 26 19:39:24.95 33.4090 75.6960 9 4.4
ISC
267 2000 10 2 05:41:54.00 35.0000 76.0000 0 5.1
NDI
268 2000 10 28 16:47:01.90 32.6010 74.9060 35 2.4
NAO
269 2000 10 28 23:53:13.10 32.9040 75.1710 33 2.6
NAO
270 2000 12 22 16:55:58.20 33.3190 75.9430 5 2.9
NAO
271 2000 12 27 00:40:16.40 33.2670 75.9950 0 2.7
NAO
272 2001 1 2 04:49:27.00 32.0000 75.0000
3.7
NAO
273 2001 1 3 21:35:23.00 32.0000 75.0000
4.1
NAO
274 2001 1 5 21:35:23.00 34.0000 76.0000
4.0
NAO
275 2001 1 8 09:01:51.60 33.6910 75.6250 33 3.9
3.5 NAO
276 2001 1 8 09:01:53.85 33.4260 75.9610 38 4.0
ISC
277 2001 1 8 09:06:19.40 33.2470 75.5730 15 2.9
NDI
278 2001 1 9 03:12:27.80 33.7670 75.9670 33 2.8
NDI
279 2001 1 9 07:19:37.00 32.0000 75.0000
3.8
NAO
280 2001 1 14 04:19:20.00 33.0000 76.0000
4.3
NAO
281 2001 1 16 10:36:58.00 33.0000 75.0000
4.3
NAO
282 2001 1 20 01:15:36.00 34.0000 72.0000
3.7
NAO
283 2001 1 21 01:24:50.00 33.0000 75.0000
4.0
NAO
284 2001 1 21 08:13:25.14 34.9500 73.4590 33 3.7
ISC
285 2001 1 23 12:01:07.00 33.0000 73.0000
4.2
NAO
286 2001 1 24 12:23:53.30 32.6310 75.6330 5 2.7
NDI
287 2001 1 24 19:49:44.50 32.7720 75.8240 33 2.7
NDI
288 2001 1 25 19:23:58.00 33.0000 74.0000
3.5
NAO
289 2001 1 31 04:18:05.00 34.0000 74.0000
2.7
NAO
290 2001 2 2 21:22:59.00 32.0000 72.0000
4.0
NAO
291 2001 2 4 10:14:08.44 33.2860 75.8310 19 4.3 3.6
NAO
292 2001 2 9 03:00:56.80 34.5520 73.9600 45 3.8
ISC
293 2001 2 9 18:17:51.00 33.0000 72.0000
3.9
NAO
294 2001 2 10 01:27:06.00 34.0000 76.0000
3.9
NAO
295 2001 2 10 03:46:16.00 32.0000 75.0000
4.5
NAO
296 2001 2 10 18:57:34.00 32.0000 75.0000
3.7
NAO
297 2001 2 12 10:20:37.00 32.0000 72.0000
4.5
NAO
298 2001 2 15 21:17:09.00 33.0000 72.0000
3.7
NAO
299 2001 2 18 07:42:25.00 32.0000 72.0000
3.8
NAO
300 2001 2 18 19:35:56.00 33.0000 74.0000
4.1
NAO
301 2001 2 20 17:33:33.50 33.1240 75.9510 40 4.5 3.8
ISC
302 2001 3 1 20:56:55.00 32.0000 72.0000
3.8
NAO
303 2001 3 1 21:29:52.10 32.4150 74.9170 33 2.6
NDI
304 2001 3 6 04:24:12.00 34.0000 72.0000
4.7
NAO
305 2001 3 6 17:59:39.60 32.9070 74.7640 28 2.8
NDI
306 2001 3 11 03:19:32.00 33.0000 75.0000
3.6
NAO
307 2001 3 11 19:09:52.00 32.0000 73.0000
3.5
NAO
308 2001 3 11 20:19:06.00 32.0000 74.0000
4.4
NAO
309 2001 3 12 09:35:22.00 32.0000 75.0000
3.8
NAO
310 2001 3 17 18:34:54.00 34.0000 75.0000
3.9
NAO
311 2001 3 17 19:37:03.00 35.0000 75.0000
3.6
NAO
312 2001 3 19 00:35:10.00 33.0000 73.0000
4.5
NAO
313 2001 3 22 04:03:28.00 33.0000 76.0000
3.8
NAO
314 2001 3 24 14:39:10.48 33.3790 75.6720 33 3.8
ISC

20
Sr No
Date Time Latitude Longitude Depth Magnitude Source
Year Month Day GMT N E Km mb MS ML
315 2001 3 28 12:33:32.00 35.0000 74.0000
4.6
NAO
316 2001 4 2 19:08:50.00 32.0000 76.0000
3.5
NAO
317 2001 4 8 18:33:54.00 34.0000 73.0000
3.9
NAO
318 2001 4 9 15:00:37.74 32.6205 73.0157 0 3.8
IDC
319 2001 4 9 15:19:07.00 35.0000 74.0000
4.3
NAO
320 2001 4 13 03:25:27.10 32.7360 75.0530 76 2.5
NDI
321 2001 4 18 23:32:26.50 32.6200 74.8150 33 2.6
NDI
322 2001 4 19 22:06:50.00 32.0000 72.0000
3.8
NAO
323 2001 4 22 20:29:28.00 32.0000 75.0000
3.7
NAO
324 2001 4 22 22:47:10.00 32.0000 75.0000
3.6
NAO
325 2001 4 29 13:52:46.00 34.0000 76.0000
3.6
NAO
326 2001 4 30 00:32:15.00 33.0000 75.0000
3.8
NAO
327 2001 4 30 15:37:12.20 33.1510 75.7770 8 2.6
NDI
328 2001 5 4 06:26:42.50 34.6210 74.2410 33 3.9
ISC
329 2001 5 7 22:08:00.00 35.0000 73.0000
3.6
NAO
330 2001 5 9 03:47:52.00 33.0000 75.0000
4.3
NAO
331 2001 5 11 14:59:21.00 32.0000 73.0000
4.3
NAO
332 2001 5 18 03:06:16.00 34.0000 72.0000
3.7
NAO
333 2001 5 21 22:16:00.00 34.0000 76.0000
4.5
NAO
334 2001 5 23 18:06:39.30 32.7290 74.9190 38 2.5
NDI
335 2001 6 2 04:39:00.70 34.1203 74.2258 200 4.3
DMN
336 2001 6 3 19:47:28.00 35.0000 72.0000
3.5
NAO
337 2001 6 5 22:50:34.00 32.0000 75.0000
3.8
NAO
338 2001 6 7 04:48:12.00 32.0000 72.0000
4.0
NAO
339 2001 6 8 22:10:31.90 34.9961 73.3194 10 4.8
DMN
340 2001 6 11 14:36:12.20 34.6762 73.5251 10 4.9
DMN
341 2001 6 13 07:33:45.00 32.0000 75.0000
4.1
NAO
342 2001 6 13 19:43:28.20 33.3090 75.4900 5 3.1
NDI
343 2001 6 13 19:49:18.80 32.6960 74.8840 11 2.5
NAO
344 2001 6 15 03:56:30.00 33.0000 75.0000
3.6
NDI
345 2001 6 15 11:13:13.60 32.8870 72.1500 33 3.6
NAO
346 2001 6 16 07:43:38.00 34.0000 73.0000
4.6
NAO
347 2001 6 17 17:18:43.00 34.0000 76.0000
3.8
NAO
348 2001 6 18 14:04:50.00 35.0000 73.0000
4.0
NAO
349 2001 6 20 04:36:56.00 34.0000 73.0000
3.8
LDG
350 2001 6 23 07:49:16.00 32.0000 73.0000
3.7
NDI
351 2001 6 27 03:50:32.00 35.0000 76.0000
3.5
NDI
352 2001 6 28 23:25:09.00 32.7520 74.7670 10 3.1
NAO
353 2001 7 1 00:12:51.00 33.0000 75.0000
3.5
IDC
354 2001 7 2 20:33:05.75 34.7376 73.3292 0 3.8
NAO
355 2001 7 4 05:35:45.00 35.0000 76.0000
4.3
NAO
356 2001 7 6 15:52:38.00 33.0000 75.0000
5.1
NAO
357 2001 7 7 21:24:36.00 33.0000 76.0000
4.6
NAO
358 2001 7 11 23:52:04.00 34.0000 72.0000
4.3
NAO
359 2001 7 14 01:54:56.00 32.0000 76.0000
3.8
NAO
360 2001 7 15 05:01:38.00 32.0000 73.0000
4.0
NAO
361 2001 7 16 16:07:16.20 32.9420 73.1480 33 5.2
MOS
362 2001 7 17 02:55:32.00 33.0000 75.0000
4.0
NAO
363 2001 7 17 14:10:33.00 32.0000 72.0000
3.9
NAO
364 2001 7 18 12:22:11.60 33.4074 75.1596 345 4.5
NAO
365 2001 7 20 05:21:24.00 33.0000 73.0000
4.3
NAO
366 2001 7 20 13:27:28.00 33.0000 75.0000
4.0
NAO
367 2001 7 21 00:17:17.00 33.0000 75.0000
4.7
NAO
368 2001 7 25 21:47:09.00 35.0000 73.0000
3.5
NAO
369 2001 8 7 08:31:39.00 34.0000 75.0000
3.9
NAO
370 2001 8 9 01:30:01.00 32.0000 74.0000
3.8
NAO
371 2001 8 9 19:32:32.80 33.4444 75.5545 336 4.2
DMN
372 2001 8 15 00:45:06.00 33.0000 72.0000
3.7
NAO

21
Sr No
Date Time Latitude Longitude Depth Magnitude Source
Year Month Day GMT N E Km mb MS ML
373 2001 8 24 18:57:02.00 33.0000 73.0000
4.0
NAO
374 2001 8 25 19:54:09.00 33.0000 75.0000
4.6
NAO
375 2001 8 26 17:05:28.00 33.0000 75.0000
4.2
NAO
376 2001 8 26 17:52:17.00 32.0000 75.0000
3.7
NAO
377 2001 8 27 01:57:26.20 33.6622 74.9070 200 4.1
DMN
378 2001 8 27 03:42:48.00 33.0000 75.0000
4.8
NAO
379 2001 8 28 11:33:44.00 33.0000 74.0000
4.7
NAO
380 2001 8 30 09:02:14.00 35.0000 76.0000
4.7
NAO
381 2001 8 31 15:36:21.00 35.0000 73.0000
2.8
NAO
382 2001 9 1 05:59:51.00 33.0000 72.0000
4.3
NAO
383 2001 9 6 00:40:49.00 33.0000 75.0000
4.8
NAO
384 2001 9 8 15:48:53.00 33.0000 75.0000
4.5
NAO
385 2001 9 9 01:04:37.00 33.0000 72.0000
3.7
NAO
386 2001 9 9 01:06:26.00 32.5326 75.9245 324 4.5
DMN
387 2001 9 9 23:39:35.50 34.5198 73.1259 133 4.4
DMN
388 2001 9 14 15:18:19.00 35.0000 73.0000
4.7
NAO
389 2001 9 14 15:39:10.80 34.5967 74.6998 300 4.7
DMN
390 2001 9 14 16:28:24.00 33.0000 73.0000
3.9
NAO
391 2001 9 14 18:29:53.00 33.0000 75.0000
3.7
NAO
392 2001 9 20 20:22:53.00 34.0000 76.0000
3.8
NAO
393 2001 9 24 05:30:53.00 34.0000 73.0000
3.6
NAO
394 2001 9 24 20:15:35.00 32.0000 76.0000
3.7
NAO
395 2001 9 26 15:29:57.00 33.0000 75.0000
3.8
NAO
396 2001 9 28 04:37:57.50 33.4010 75.8300 33 5.1
MOS
397 2001 9 30 00:54:15.90 34.6835 74.0036 133 4.7
DMN
398 2001 9 30 11:29:15.00 32.0000 74.0000
4.5
NAO
399 2001 9 30 11:31:02.80 34.5649 74.8615 320 4.8
DMN
400 2001 10 5 02:36:56.00 33.0000 75.0000
4.8
NAO
401 2001 10 6 19:21:07.30 34.1863 73.4330 10 4.9
IDC
402 2001 10 7 13:57:05.00 34.0000 74.0000
3.6
NAO
403 2001 10 11 06:01:41.72 34.6092 72.4553 0 4.0
IDC
404 2001 10 14 10:35:51.00 33.0000 73.0000
3.7
NAO
405 2001 10 15 20:18:09.00 33.0000 72.0000
3.8
NAO
406 2001 10 18 17:54:26.00 35.0000 76.0000
4.3
NAO
407 2001 10 18 17:55:59.00 34.3970 75.0860 268 5.0
DMN
408 2001 10 21 13:23:29.00 34.0000 76.0000
4.2
NAO
409 2001 10 21 14:29:12.00 34.0000 72.0000
3.7
NAO
410 2001 10 21 20:17:15.10 34.9918 72.0489 10 4.7
DMN
411 2001 10 27 03:53:51.00 32.0000 75.0000
3.9
NAO
412 2001 10 28 23:16:24.00 32.0000 72.0000
3.8
NAO
413 2001 11 3 04:50:45.71 33.1522 72.6066 0 4.2
IDC
414 2001 11 6 02:19:36.00 32.0000 72.0000
3.8
NAO
415 2001 11 6 10:50:06.00 32.0000 73.0000
4.1
NAO
416 2001 11 7 05:13:08.00 33.0000 76.0000
3.9
NAO
417 2001 11 12 22:21:40.00 32.0000 73.0000
4.2
NAO
418 2001 11 13 16:35:04.00 32.0000 72.0000
4.9
NAO
419 2001 11 13 19:29:13.00 33.0000 75.0000
3.9
NAO
420 2001 11 16 12:34:21.00 32.0000 75.0000
4.1
NAO
421 2001 11 19 17:58:08.00 32.0000 72.0000
3.8
NAO
422 2001 11 23 20:42:29.00 34.0000 74.0000
6.7
NAO
423 2001 11 24 14:43:57.00 33.0000 74.0000
3.7
NAO
424 2001 12 9 12:08:57.00 33.0000 75.0000
4.0
NAO
425 2001 12 9 16:01:32.00 35.0000 73.0000
4.0
NAO
426 2001 12 16 05:32:32.00 33.0000 75.0000
3.5
NAO
427 2001 12 16 05:34:02.50 34.1263 73.7819 147 4.3
DMN
428 2001 12 21 20:06:41.00 33.0000 75.0000
4.2
NAO
429 2001 12 21 21:56:41.50 32.8733 74.4470 33 5.0
DMN
430 2001 12 22 03:39:13.00 34.0000 75.0000
5.0
NAO

22
Sr No
Date Time Latitude Longitude Depth Magnitude Source
Year Month Day GMT N E Km mb MS ML
431 2001 12 22 11:26:25.90 34.8174 72.3052 10 4.8
DMN
432 2001 12 22 12:06:59.10 34.6710 73.1330 33 4.3
MOS
433 2001 12 24 09:42:50.40 32.6147 75.2520 305 4.0
NAO
434 2001 12 28 20:58:48.75 34.6099 73.5547 0 3.8
3.1 IDC
435 2001 12 30 18:39:14.00 33.0000 75.0000
4.2
NAO
436 2001 12 31 22:20:24.00 33.0000 75.0000
5.1
NAO
437 2002 1 6 14:34:22.00 33.0000 74.0000
3.8
NAO
438 2002 1 7 13:04:18.24 33.6575 74.6155 61 3.6
IDC
439 2002 1 7 20:32:47.00 33.0000 74.0000
4.4
NAO
440 2002 1 11 01:24:49.00 34.0000 76.0000
4.4
NAO
441 2002 1 13 12:08:10.60 32.4450 75.9370 33 5.1
NAO
442 2002 1 13 12:08:35.19 34.9422 74.0524 33 4.6
MDD
443 2002 1 13 13:39:30.82 33.9197 75.5453 33 4.6
MDD
444 2002 1 19 04:38:04.00 33.0000 75.0000
3.8
NAO
445 2002 1 24 15:34:32.00 35.0000 72.0000
4.3
NAO
446 2002 2 5 05:35:56.00 32.0000 73.0000
5.1
NAO
447 2002 2 7 03:29:20.00 34.0000 72.0000
4.2
NAO
448 2002 2 8 04:02:14.00 32.0000 76.0000
3.8
NAO
449 2002 2 9 18:10:03.00 33.0000 76.0000
3.8
NAO
450 2002 2 12 23:13:56.00 33.0819 75.9476 0 3.4
2.9 IDC
451 2002 2 12 23:14:22.36 33.6144 75.8236 0 3.9
3.7 IDC
452 2002 2 14 23:44:02.00 32.0000 72.0000
4.6
NAO
453 2002 2 17 05:22:59.70 33.0400 75.8800 31 4.3
4.1 BJI
454 2002 2 18 22:33:31.00 32.0000 74.0000
4.4
NAO
455 2002 2 19 07:22:47.00 33.0000 72.0000
4.1
NAO
456 2002 2 20 01:37:50.00 35.0000 74.0000
4.0
NAO
457 2002 2 22 10:01:31.00 33.0000 75.0000
4.5
NAO
458 2002 2 22 17:27:02.00 33.0000 73.0000
4.0
NAO
459 2002 2 26 14:04:26.00 34.0000 76.0000
4.6
NAO
460 2002 3 3 12:07:11.00 32.0000 74.0000
4.7
NAO
461 2002 3 3 13:04:48.00 33.0000 75.0000
5.0
NAO
462 2002 3 3 16:31:37.00 32.0000 73.0000
3.9
NAO
463 2002 3 3 21:03:38.00 32.0000 75.0000
4.3
NAO
464 2002 3 5 14:15:03.00 33.0000 74.0000
4.0
NAO
465 2002 3 6 19:56:13.00 33.0000 75.0000
4.7
NAO
466 2002 3 7 16:59:46.00 33.0000 73.0000
3.9
NAO
467 2002 3 9 20:58:43.00 32.0000 75.0000
3.9
NAO
468 2002 3 14 10:45:36.00 33.0000 75.0000
3.8
NAO
469 2002 3 14 18:44:03.80 34.1600 75.9800 48 3.9
3.8 BJI
470 2002 3 18 04:29:14.40 32.9700 75.8900 57 4.1
4.5 NAO
471 2002 3 21 21:57:31.00 33.0000 72.0000
4.9
NAO
472 2002 3 24 10:18:09.70 32.2564 75.8423 0 3.7
3.8 IDC
473 2002 3 29 01:58:18.00 33.0000 73.0000
4.2
NAO
474 2002 3 30 21:13:21.00 32.0000 74.0000
3.8
NAO
475 2002 3 31 17:09:17.00 33.0000 75.0000
3.5
NAO
476 2002 4 3 02:23:09.00 34.0000 72.0000
4.6
NAO
477 2002 4 5 20:30:42.00 33.0000 74.0000
4.7
NAO
478 2002 4 11 16:05:58.00 33.0000 75.0000
3.9
NAO
479 2002 4 13 23:13:57.00 32.0000 75.0000
3.8
NAO
480 2002 4 14 14:48:20.00 33.0000 75.0000
3.5
NAO
481 2002 4 16 08:14:07.00 32.0000 75.0000
3.5
NAO
482 2002 4 16 23:45:39.00 33.0000 73.0000
4.3
NAO
483 2002 4 17 06:32:53.00 32.0000 75.0000
3.5
NAO
484 2002 4 18 22:12:41.90 32.9470 74.7260 33 4.8
BER
485 2002 4 21 10:41:16.00 35.0000 76.0000
4.0
MDD
486 2002 4 30 23:01:19.00 33.0000 73.0000
4.0
NAO
487 2002 5 6 09:32:10.10 34.2600 73.7000 70 3.9
BJI
488 2002 5 6 16:27:25.00 33.0000 74.0000 0 3.6
NAO

23
Sr No
Date Time Latitude Longitude Depth Magnitude Source
Year Month Day GMT N E Km mb MS ML
489 2002 5 8 06:30:40.00 35.0000 73.0000
4.1
NAO
490 2002 5 9 08:11:38.00 32.0000 73.0000
3.6
NAO
491 2002 5 10 06:00:49.27 33.0359 75.9810 0 3.8
3.7 IDC
492 2002 5 13 18:41:11.00 32.0000 73.0000
4.0
NAO
493 2002 5 15 15:32:54.00 35.0000 74.0000
3.8
NAO
494 2002 5 18 22:47:22.30 32.1414 73.1310 0 3.8 4.2 3.2 IDC
495 2002 5 18 22:47:44.00 35.0000 74.0000
3.5
NAO
496 2002 5 19 03:56:51.81 34.1667 74.9971 0 4.0
3.1 IDC
497 2002 5 19 08:39:52.00 35.0000 76.0000
4.1
NAO
498 2002 5 21 05:48:26.00 34.0000 74.0000
3.8
NAO
499 2002 5 23 09:19:48.00 34.0000 72.0000
3.1
NAO
500 2002 5 27 00:05:01.00 32.0000 72.0000
3.8
NAO
501 2002 6 2 05:15:16.00 33.0000 75.0000
3.6
NAO
502 2002 6 4 00:12:04.00 33.0000 72.0000
4.0
NAO
503 2002 6 6 00:32:15.00 35.0000 73.0000
3.5
NAO
504 2002 6 9 02:51:14.00 33.0000 72.0000
3.5
NAO
505 2002 6 10 23:19:47.00 33.0000 72.0000
2.8
NAO
506 2002 6 10 23:26:00.00 32.0000 75.0000
4.1
NAO
507 2002 6 16 19:47:09.48 33.5874 72.9457 0 3.8
3.2 IDC
508 2002 6 24 20:41:39.00 34.0000 72.0000
3.8
NAO
509 2002 6 25 03:21:42.00 33.0000 75.0000
3.7
NAO
510 2002 7 1 07:35:09.00 33.0000 75.0000
3.9
NAO
511 2002 7 2 05:36:33.99 33.0653 75.8859 0 3.8
3.6 IDC
512 2002 7 2 07:01:11.00 32.0000 74.0000
3.8
NAO
513 2002 7 9 02:56:47.32 32.9866 73.4734 0 3.8
2.9 IDC
514 2002 7 11 03:32:11.00 33.0000 76.0000
4.5
NAO
515 2002 7 14 21:03:28.00 34.0000 73.0000
3.6
NAO
516 2002 7 18 20:29:19.00 34.0000 72.0000
4.1
NAO
517 2002 7 22 07:55:59.00 32.0000 73.0000
3.0
NAO
518 2002 7 22 09:57:23.00 32.0000 72.0000
3.8
NAO
519 2002 8 3 15:26:12.80 33.8840 72.8450 33 4.4
MOS
520 2002 8 4 05:02:28.00 35.0000 74.0000
3.5
NAO
521 2002 8 8 20:50:27.00 33.0000 75.0000
4.2
NAO
522 2002 8 8 22:45:11.00 33.0000 72.0000
4.0
NAO
523 2002 8 14 12:06:34.00 35.0000 73.0000
3.9
NAO
524 2002 8 14 16:15:17.00 33.0000 75.0000
3.8
NAO
525 2002 8 16 01:33:08.00 35.0000 74.0000
4.0
NAO
526 2002 8 17 23:23:28.00 33.0000 72.0000
3.6
NAO
527 2002 8 18 00:32:06.60 34.0550 72.8600 33 4.5
MOS
528 2002 8 20 14:53:38.00 34.0000 73.0000
4.1
NAO
529 2002 8 20 22:51:26.00 34.0000 76.0000
3.4
NAO
530 2002 9 3 17:26:14.00 33.0000 72.0000
5.5
NAO
531 2002 9 3 21:01:06.00 33.0000 76.0000
3.9
NAO
532 2002 9 4 11:37:46.00 33.0000 76.0000
4.4
NAO
533 2002 9 9 23:46:49.00 35.0000 74.0000
3.9
NAO
534 2002 9 11 06:39:20.00 33.0000 75.0000
3.8
NAO
535 2002 9 13 04:27:22.00 32.0000 74.0000
3.7
NAO
536 2002 9 13 18:20:12.00 33.0000 72.0000
4.0
NAO
537 2002 9 16 06:09:40.00 32.0000 73.0000
4.0
NAO
538 2002 9 18 04:46:38.00 32.0000 72.0000
3.9
NAO
539 2002 9 22 19:57:07.00 33.0000 74.0000
4.3
NAO
540 2002 10 1 02:50:51.00 33.0000 72.0000
5.3
NAO
541 2002 10 2 23:28:30.00 35.0000 75.0000
4.3
NAO
542 2002 10 4 14:59:54.00 33.0000 73.0000
3.9
NAO
543 2002 10 5 11:47:16.00 35.0000 73.0000
4.2
NAO
544 2002 10 10 15:27:00.00 32.0000 76.0000
4.6
NAO
545 2002 10 10 17:25:05.00 33.0000 73.0000
3.8
NAO
546 2002 10 17 04:29:45.00 32.0000 73.0000
4.4
NAO

24
Sr No
Date Time Latitude Longitude Depth Magnitude Source
Year Month Day GMT N E Km mb MS ML
547 2002 10 17 14:24:03.00 34.0000 72.0000
4.6
NAO
548 2002 10 21 13:49:10.00 33.0000 72.0000
3.7
NAO
549 2002 10 29 11:00:58.00 34.0000 76.0000
5.1
NAO
550 2002 10 30 03:12:30.00 35.0000 76.0000
3.6
NAO
551 2002 11 1 22:55:05.00 33.0000 76.0000
3.9
NAO
552 2002 11 1 22:55:18.56 34.7529 73.6430 0 3.8
2.9 IDC
553 2002 11 1 22:57:44.73 34.9448 73.6945 0 4.1
2.9 IDC
554 2002 11 2 04:55:07.00 35.0000 76.0000
4.0
NAO
555 2002 11 2 15:23:17.00 33.0000 76.0000
4.6
NAO
556 2002 11 3 04:47:17.00 33.0000 76.0000
4.0
NAO
557 2002 11 3 06:11:11.00 34.0000 76.0000
4.1
NAO
558 2002 11 3 14:48:07.00 33.0000 75.0000
3.8
NAO
559 2002 11 3 18:53:05.00 32.0000 72.0000
3.8
NAO
560 2002 11 4 05:18:47.00 35.0000 76.0000
4.1
NAO
561 2002 11 4 22:03:36.00 34.0000 76.0000
3.9
NAO
562 2002 11 5 11:59:20.00 33.0000 76.0000
4.2
NAO
563 2002 11 8 02:22:05.00 33.0000 76.0000
4.2
NAO
564 2002 11 8 02:51:22.00 33.0000 76.0000
3.7
NAO
565 2002 11 11 09:17:04.06 34.1842 75.3474 0 4.0
IDC
566 2002 11 13 18:40:45.00 35.0000 72.0000
3.4
NAO
567 2002 11 13 21:17:12.00 33.0000 72.0000
3.7
NAO
568 2002 11 16 14:18:36.00 35.0000 72.0000
3.9
NAO
569 2002 11 19 04:30:09.00 34.0000 76.0000
3.8
NAO
570 2002 11 20 19:22:26.00 32.0000 75.0000
3.9
NAO
571 2002 11 20 22:28:31.80 34.8068 74.3212 0 3.9
2.9 IDC
572 2002 11 20 22:50:17.00 34.0000 74.0000
4.0
NAO
573 2002 11 21 00:02:01.00 34.0000 76.0000
4.1
NAO
574 2002 11 21 03:10:22.00 34.0000 75.0000
3.8
NAO
575 2002 11 22 07:10:30.00 34.0000 76.0000
4.3
NAO
576 2002 11 22 09:12:12.60 33.4080 73.5240 33 4.5
MOS
577 2002 11 24 09:35:25.34 32.4224 73.1631 0 4.0
2.9 IDC
578 2002 11 24 12:56:47.00 34.0000 76.0000
4.5
NAO
579 2002 11 24 14:57:52.20 34.9015 73.7414 0 3.8
3.0 IDC
580 2002 11 25 11:06:18.00 33.0000 76.0000
4.2
NAO
581 2002 11 28 14:07:19.00 33.0000 72.0000
4.7
NAO
582 2002 11 30 19:19:49.00 35.0000 75.0000
3.9
NAO
583 2002 12 2 00:56:51.00 33.0000 72.0000
4.2
NAO
584 2002 12 4 10:29:35.00 33.0000 75.0000
4.3
NAO
585 2002 12 11 04:54:33.00 35.0000 75.0000
4.1
NAO
586 2002 12 17 10:28:08.00 33.3288 75.8066 46 3.6 3.0 3.2 IDC
587 2002 12 19 15:22:50.00 32.0000 75.0000
4.0
NAO
588 2002 12 19 16:13:32.21 33.4550 73.2430 0 3.9
3.5 IDC
589 2002 12 20 18:57:33.00 33.0000 75.0000
4.0
NAO
590 2002 12 23 00:12:41.00 33.0000 72.0000
5.2
NAO
591 2002 12 23 02:19:32.00 32.0000 73.0000
4.2
NAO
592 2002 12 29 07:29:17.00 33.0000 76.0000
3.7
NAO
593 2002 12 29 20:15:48.57 34.8821 73.8705 0 4.0
2.6 IDC
594 2002 12 31 01:07:45.00 33.0000 75.0000
3.7
NAO
Seismicity Pattern
The microseismic data of the region indicate that the region is very active on a microseismic level
with frequent earthquakes of magnitude greater than 4.

25
The largest earthquake recorded by regional network is the Kangra earthquake of magnitude Ms=8.0
occurred on 4th April 1905 about 200 km southeast of the project. Two earthquakes of magnitude
greater than 6 have also been recorded in this area.
Figure 8 shows distribution of seismicity with depth in the region as recorded by Mangla
microseismic network. Major concentration of earthquakes is within upper 20 km. It is important to
note that all the events having magnitude 5 or greater are originated within shallow depth (< 20 km).
This aspect of seismicity depicts that seismic forces are active at shallow depth, which increases
earthquake hazard within this region. Majority of the events falls within focal depths less than 30
km. Though, events with magnitude greater than 5 do not seem to occur beyond 30 km depth,
nevertheless, events with magnitude 4 to 5 do occur at depths upto as much as 60 km. There is only
one earthquake that was located at focal depth of 79.3 km.
From the spatial point of view, number of earthquakes is quite less south of latitude 32.5o. This low
level of seismicity may be true as no prominent causative seismotectonic feature is recognized in the
plain areas of Punjab due to thick alluvial cover. However, another factor for this reduced level could
be the fact that no local seismic network properly covers this area. Generally the spread of
earthquake epicentres seems to be random for magnitudes less than 4. However, for the events
having magnitudes more than 4, most of these show association with local tectonic features except
in Potwar and Punjab plain (Figure 8). The concentration of events in zone near latitude 34.0o and
longitude 72.75o may be associated with Tarbela reservoir induced effect. The concentration of
events west of Abbotabad appears to be partially associated with HLSZ (Hazara Lower Seismic Zone)
as suggested by Seeber et al.27 extending northwest-southeast from Hazara thrust system of faults
except the event of February 25, 1996 of magnitude 5.2 with focal depth of five kilometers located
only four kilometers downstream of Tarbela dam, which was an induced event. Lot of seismicity is
associated with MBT and other faults of the Hazara thrust system, which indicates that these faults
are active. In Salt Range, a lot of seismicity appears to be associated with Kahuta fault and Dil Jabba
thrust, therefore indicating these faults as seismically active. A concentration of seismic activity is
seen along river Jhelum north of Mangla. This could probably be associated with the mapped portion
of the Jhelum fault, which is also considered as a possible extension of Dil Jabba thrust along the axis
of the syntaxial bend, as suggested by the study of fault plane solutions of a few earthquakes in this
area. This association of seismicity suggests that this portion of Jhelum fault upto Kahuta may be
considered as active tectonic feature. Another concentration of epicenters is seen northeast of
Mangla, which could be associated with Riasi fault and a possible associated fault closer to Mangla.
Further towards northeast, lot of seismicity is associated with Riasi thrust, MBT and other tectonic
features of the Himalayan range.
27
Seeber, L., et al; Seismicity of the Hazara arc in northern Pakistan; Decollement vs. basement faulting; Geodynamics of Pakistan (1979).

26
Figure 8: Microseismicity of the Project Region Depth plot
Seismotectonic Setting
Seismotectonic Model
Based on the synthesis of geological and seismicity data described above, a seismotectonic model of
the project region is presented below which provides the basis for seismic hazard analysis for the
Project.
The Project site is located near the base of Himalayan range where major tectonic features of this
gigantic range are present. The other prominent tectonic feature is the presence of Hazara-Kashmir
syntaxial bend which is very sharp near Muzaffarabad and gradually dies out southwards. All
geological features show NW-SE trend towards east of the syntaxial bend while these have NE-SW
trend on the western side of the syntaxial bend.
The seismotectonic features that have been considered critical for the seismic hazard to the Project
include:
i. Himalayan Frontal Thrusts i.e. Main Boundary Thrust (MBT) and Riasi Thrust and associated
parallel faults, having NW-SE trend and located east of the syntaxial axis;
ii. Jhelum Fault, trending N-S, and running along the axis of the syntaxial bend; and
iii. Dil Jabba thrust, Kahuta Fault and Salt Range Frontal Thrust, all have NE-SW trend and
located west of the axis of the syntaxis.

27
The entire region is dominated mainly by thrust type of faults that do have some strike- slip
component at places also. These faults are considered active because of association of observed
seismicity with these faults (Figure 7). The faults critical to the project are discussed below:
Project Area Faults
The main tectonic features controlling the seismic hazard for the Project are as follows:
a) Main Boundary Thrust
Main Boundary thrust is the main frontal thrust of the Himalayan range which runs along the
Himalayan arc for about 2500 km from Assam in the east to Kashmir in the west. Near the Project
site, it takes a northwest trend due to the syntaxial bend. Near it surface trace, it dips towards
northeast at steep angle but becomes sub-horizontal in the subsurface away from the surface trace.
Seeber et al.28 have shown that the series of large earthquakes which occurred along the Himalayan
range are probably related to slip along this sub-horizontal surface, termed as detachment. The MBT
is seismically active and have seismic potential to generate large earthquakes. The closest distance
of MBT from project site is 40 km towards northeast.
b) Riasi Thrust
Another important fault of the Himalayan front is the Riasi Thrust which is a branch of the MBT and
runs almost parallel to MBT for a distance of about 220 km. Lot of observed seismicity can be
associated with this fault. This fault passes at a distance of only 8 km northeast of the Project site.
Near the site, it has a trend of NW-SE, dipping towards northeast away from the site. Because of its
close association with the MBT and recorded seismicity, this fault is considered as an active tectonic
feature.
c) Jhelum Fault
This is a north-south trending left lateral strike-slip fault with steep dip towards east. Kazmi29 has
shown that this fault may extend from north of Muzaffarabad to near Jhelum towards south along
the axis of the syntaxial bend. The mapped length of this fault is, however, limited to about 20 km
only between Mangla and Kahuta (Figure 4). The alignment of observed seismicity along this fault
suggests that this fault may extend towards south up to the northeastern termination of Dil Jabba
thrust. A 50 km length of this fault is taken as active with nearest trace at 30 km west of the project
site.
d) Dil Jabba Thrust:
Dil Jabba Thrust is a north east trending fault present near the eastern side of Salt Range with a
surface trace 86 km long. This thrust dips towards northwest and terminates on the western side of
River Jhelum. Some disturbance of Quaternary deposits has been reported near the surface trace of
this fault and epicenters of many earthquakes can be associated with this fault, therefore indicating
28
Seeber L. et al; Seismicity and continental subduction in the Himalayan arc, in Zagros – Hindukush Himalayas; Geodynamics Evolution, A.G.U. Geodynamics Services, Vol.3 (1981).
29 Farah, A., De Jong, K.A; Geodynamics of Pakistan: An introduction; Geodynamics of Pakistan, Geological
Survey of Pakistan (1979).

28
that this fault is seismically active. Its eastern termination is at a distance of about 35 km from the
Project site.
e) Kahuta Fault:
This fault is present north of Dil Jabba Thrust and runs parallel to it. This fault starts northwest of GT
Road and terminates near the axis of the syntaxis. It length is about 50 km. Because of its similarity
with Dil Jabba Thrust and observed seismicity of the area, this fault is also taken as active.
Seismic Hazard Evaluation
Both probabilistic as well as deterministic hazard evaluation procedures were employed for seismic
hazard analysis of the project in accordance with the ICOLD guidelines30.
Probabilistic Approach
Methodology
In probabilistic hazard evaluation method, the seismic activity of seismic source (line or area) is
specified by a recurrence relationship, defing the cumulative number of events per year versus the
magnitude. Distribution of earthquake is assumed to be uniform within the source zone and
independent of time31.
The principle of the analysis is to evaluate at the site of interest the probability of exceedence of a
ground motion parameter (e.g. acceleration) due to the occurrence of a strong event, at a certain
distance from the site. This approach combines the probability of exceedence of the earthquake size
(recurrence relationship), and probability on the distance from the epicenter to the site.
Each source zone is split into elementary zones at a constant distance from the site. Integration is
carried out within each zone by summing the effects of the various elementary zones taking into
account the attenuation effect with distance. Total hazard is obtained by adding the influence of
various sources. The results are expressed in terms of a ground motion parameter associated to the
total number of expected events per year (i.e. the inverse of the return period), or in terms of annual
hazard.
A seismic hazard model is developed based on findings of the seismotectonic synthesis. The seismic
hazard model relies upon the concept of seismotectonic zones. Each zone is defined as a zone with
homogenous seismic and tectonic features, inferred from geological, tectonic and seismic data.
These zones are first defined, then a maximum earthquake and an earthquake recurrence equation
is elaborated for each of these source zones.
The seismic parameters attached to the various seismic zones are a recurrence relationship relating
the number of events for a specific period of time to the magnitude, the maximum earthquake
giving an upper bound of potential magnitude in the zone, and an attenuation relationship
representing the decrease of acceleration with distance.
30
International Commission on Large Dams (ICOLD); Guidelines for selecting seismic parameters for large dams, Paris (1989).
31 Cornell, C.A.; Engineering seismic risk analysis, Bull. Seism. Soc .Am., Vol.58, No.5 (1968).

29
Seismic Source Modeling
For the definition of seismic sources, either line (i.e. fault) or area sources can be used for modeling.
Because of uncertainty in the epicentral locations, it is difficult to relate the recorded earthquakes to
the faults present in the area and to develop recurrence relationship for each fault. The area around
the site was therefore divided into six seismic zones (area sources) based on their homogeneous
tectonic and seismic characteristics. These zones are MBT, Riasi, Hazara, Potwar, Salt Range and
Punjab seismic zones (Figure 9).
Figure 9: Seismic Source Zones
Each of these areas was assigned a maximum magnitude potential. As the shallow earthquakes are
of more concern to seismic hazard, the minimum depth of the earthquakes is taken as 5 km for all
sources except Punjab seismic zone where the minimum depth of earthquakes is taken as 30 km.
The source parameters used in probabilistic hazard analysis are given in Table 3.
Table 3: Source Parameters for Probabilistic Analysis
Source Zone Minimum
Magnitude M0 No. of Earthquakes
of Mb >= M0 Activity Rate
No. /Year
b-valu
e
Maximum Potential Magnitude Mb
Main Boundary Thrust (MBT)
4.0 146 1.5052 0.81 8.3

30
Source Zone Minimum
Magnitude M0 No. of Earthquakes
of Mb >= M0 Activity Rate
No. /Year
b-valu
e
Maximum Potential Magnitude Mb
Riasi 4.0 40 0.4124 1.03 7.5
Hazara 4.2 55 0.5670 1.28 7.0
Potwar 4.0 33 0.3402 0.93 7.0
Salt Range 4.2 7 0.0722 0.82 7.0
Punjab 4.0 35 0.3608 0.85 6.0
Magnitude–Frequency Relationship
A general equation that described earthquake recurrence may be expressed as follows:
N (m) = f (m, t) (1)
Where N (m) is the number of earthquakes with magnitude equal to or greater than m, and t is time
period
The simplest form of equation (1) that has been used in most engineering applications is the well
known Richter’s law which states that the cumulated number of earthquakes occurred in a given
period of time can be approximated by the relationship
log N(m) = a – b m (2)
Equation (2) assumes spatial and temporal independence of all earthquakes, i.e. it has the properties
of a Poisson model. Coefficient a is related to the total number of events occurred in the source zone
and depends on its area, while coefficient b represents the coefficient of proportionality between
log N(m) and the magnitude. Coefficients a and b can be derived from seismic data relative to the
source of interest.
The composite list of earthquakes given in Table 2 for the window 32.0oN to 35.0oN and 72.0oE to
76.0oE covering an area within about 200 km radius of the project provided the necessary data base
for the computation of b-value for each seismic source zone.
The seismic data from 1904-2002 contain magnitude values in the form of surface wave, body wave
or local magnitude scales. Since attenuation relationships are based on magnitudes of given type, a
single scale must be selected. All the magnitudes above 4 were therefore converted to body wave
(mb) by using the following equations as suggested by Ambraseys and Bommer32:
0.87 (mb) – 0.50 (Ms) = 1.91 0.82 (Ml) – 0.58 (Ms) = 1.20
Where mb is body–wave magnitude, Ms is surface-wave magnitude and Ml is local magnitude.
The converted body wave magnitudes values are given is Table 2. Separate list of earthquakes
occurring within each seismic zone was extracted from the composite list through GIS software.
Magnitude-frequency plot was then drawn and b-values were calculated for each zone through
32
Ambraseys N.N. & Bommer J.J.; Uniform magnitude re-evaluation for the strong motion database of Europe and adjacent areas, European Earthquake Engineering, Vol.4 No.2 (1990).

31
regression analysis of data. The b–values and activity rate for the six seismic zones used in the
probabilistic analysis are shown in Table 3.
Attenuation Relationships
Because of lack of sufficient strong–motion data covering a larger range of magnitudes and
distances, attenuation relationships for the South Asian region could not be developed. For
probabilistic hazard analysis, the attenuation equations of Boore et al.33, Idriss34, Sadigh35 and
Abrahamson-Silva36 have been used. As the Project is founded on rock, the average shear wave
velocity up to 30 meters depth was taken as 800 m/sec, which was observed at proposed Kalabagh
damsite for similar rock formations.
Results of Peak Ground Acceleration (PGA)
The probabilistic hazard analysis was carried out by using EZ-FRISK software developed by Risk
Engineering Inc. of Colorado, USA. The parameters for all the six seismic zones (area sources) given
in Table 3 were fed to the software. The results of the hazard analysis are presented in Figure 10 in
the form of total hazard at the Project site in terms of annual frequency of exceedence of peak
horizontal ground acceleration.
Figure 10: Total Hazard Plot
Deterministic Approach
33
Boore et al.; Equations for estimating horizontal response spectra and peak acceleration from western north American earthquakes: A summary of recent work, Seism. Res. Letters, Vol. 68 (1997).
34 Idriss, I. M.; Procedure for selecting earthquakes ground motions at rock sites, National Institute of
Standards and Technology, NIST GCR 93-625 (1993). 35
Sadigh K. et al.; Attenuation relationships for shallow crustal earthquakes based on California strong motion data, Seism. Res. Letters, Vol. 68 (1997).
36 Abrahamson, N.A. and Silva W.J.; Empirical response spectral attenuation relations for shallow crustal
earthquakes, Seism. Res. Letters, Vol. 68 (1997).

32
Methodology
In the deterministic procedure, critical seismogenic sources, like capable fault, representing a threat
to the Project are identified and a maximum magnitude assigned to each of these faults. The
capability of the faults is ascertained through observation of historical and instrumental seismic data
and geological criteria such as the rupture length – magnitude relationship or fault movement -
magnitude relationship. The maximum seismic design parameter is obtained by considering the most
severe combination of maximum magnitude and minimum distance to the Project site,
independently of the return period.
Maximum Earthquake Potential
Table 4 gives the various active faults present around the Project site and their lengths. The
maximum rupture length of the faults has generally been taken as 50% of the total length. The Main
Boundary Thrust (MBT) is a long active feature extending all along the Himalayan front from Assam
to Kashmir, its maximum rupture length has been taken same as that observed in Kangra earthquake
of 1905.
The maximum potential magnitude of each of these faults (Table 4) was calculated on the basis of
fault rupture length and rupture area using various available relationships37 and a maximum
magnitude was selected accordingly for each of these active tectonic features as shown in Table 4.
Table 4: Maximum Potential Magnitudes of Critical Faults
Tectonic Feature
Fault Length (Km)
Fault Ruptur
e Length (Km)
Rupture Length Basis Rupture Area Basis
Selected Max. Mag.
Slemmons 1982
Patwardhan et al. 1975
Tocher, Seed & Housner
Wells Coppersmith 1994
Rupture Area Wells & Coppersmith 1994
Wyss 1979
Lgt. (Km)
Wdt. (Km)
Main Boundary Thrust (MBT)
1200 300 8.0 8.0 8.1 8.2 300 150 8.6 8.8 8.3
Riasi Thrust
220 110 7.4 7.4 7.3 7.5 100 40 7.6 7.7 7.5
Jhelum Fault
50 25 6.6 6.6 6.7 6.6 25 15 6.6 6.7 6.6
Dil Jabba Thrust
86 43 7.0 7.0 7.0 7.0 43 15 6.8 7.0 7.0
Kahuta Fault
50 25 6.6 6.6 6.7 6.6 25 15 6.6 6.7 6.6
Results of PGA
Horizontal Peak Ground Acceleration (PGA) at the project site induced by each seismic source was
computed considering that maximum earthquake can occur at the closest distance from the site. The
computed accelerations using several attenuation relationships of common use in engineering
37
Slemmons, D.B., Bodin, P., and Zhang Xiaoyi ; Determination of earthquake size from surface faulting events, Proc . Seminar on Seismic Zonation, Guangzhou, China, State Seismological Bureau (Beijing) (1987).

33
practice are summarized in Table 5. This table shows that the maximum accelerations at the site are
caused by Riasi thrust being at a closest distance of 8 km from the site.
Table 5: Peak Horizontal Accelerations
Tectonic Feature
Max. Magnitu
de
Closest Distance to Fault
(Km.)
Computed Accelerations (g) Median (50-percentile)
Boore, Joyner &
Fumel 1997
Ambraseys et al. 1996
Idriss 1993
Sadigh et al. 1997
Ambraseys &
Bommer 1991
Campbell &
Bozorgnia 1993
Main Boundary Thrust (MBT)
8.3 40 0.21 0.24 0.27 0.26 0.18 0.24
Riasi Thrust 7.5 8 0.41 0.59 0.53 0.57 0.49 0.43
Jhelum Fault 6.6 30 0.09 0.11 0.12 0.11 0.10 0.13
Dil Jabba Thrust 7.0 35 0.12 0.12 0.16 0.12 0.10 0.14
Kahuta Fault 6.6 40 0.08 0.08 0.11 0.09 0.07 0.09
Seismic Design Parameters
Design seismic parameters are selected herein on the basis of the results provided by probabilistic
and deterministic approaches, and in compliance with the recommendations of ICOLD38.
OBE Acceleration
According to ICOLD guidelines, “Operating Basis Earthquake (OBE) represents the level of ground
motion at the dam site at which only minor damage is acceptable. The dam, appurtenant structures
and equipment should remain functional and damage easily repairable from the occurrence of
earthquake shaking not exceeding the OBE”. Because of its definition, the OBE is best determined by
using probabilistic procedures, for instance, such as specifying a 50% probability of not being
exceeded in 100 years, the corresponding return period is equal to 144 years. In any case the OBE
accelerations are significantly lower than those for MCE.
Figure 10 shows the results of probabilistic analysis for Gulpur Hydropower project obtained through
EZ-FRISK software as total hazard in terms of annual frequency of proximity exceedence of peak
ground accelerations. The source contribution analysis shows that maximum contribution to total
hazard is from Riasi source zone. Keeping in view the proximity of the most critical tectonic feature,
the recommended OBE acceleration for the project structures is 0.24g with a return period of 1000
years.
MCE Acceleration
According to ICOLD guidelines, “the MCE is the largest reasonable conceivable earthquake that
appears possible along a recognized fault or within a geographically defined tectonic province, under
the presently known or presumed tectonic framework”. This definition is inspired by that of Seed39:
“the largest rationally conceivable event that could occur in the tectonics environment in which the
project is located”. The MCE can be evaluated through a deterministic or a probabilistic procedure. If
the probabilistic seismic hazard evaluation is used, the MCE is linked to a very long return period for
this event.
38
International Commission on Large Dams (ICOLD); Guidelines for selecting seismic parameters for large dams, Paris (1989).
39 Seed, H. B.; The selection of design earthquake for critical structures. Bull. Seis. Soc. Am., Vol.72 (1982)

34
For Gulpur Hydropower Project, the most critical tectonic feature controlling the MCE is the Riasi
thrust which is causing maximum accelerations at the project site (Table 5). Various attenuation
relationships give peak horizontal accelerations ranging from 0.41g to 0.59g. For the peak horizontal
acceleration associated with MCE, an average value of 0.50g is selected. This value is conservative
but selected in view of the proximity of the most critical tectonic structure from the project.
Conclusions and Recommendations
The seismic hazard evaluation for Gulpur Hydropower Project was carried out on the basis of
understanding of local tectonic environment, desk studies of faults in the vicinity of the Project and
synthesis of available seismological and tectonic data to evaluate the capability of active tectonic
features and assigning ground motion associated with them. The main conclusions based on the
present study are as follows:
The project site is located close to the Riasi Thrust which is a branch of MBT, the main source
of destructive earthquakes in the Himalayan region.
The critical surface tectonic features around the Project site are MBT and Riasi thrusts
towards east and Dil Jabba Thrust, Kahuta Fault and Jhelum Fault towards west of the
Project.
Historical record shows that earthquakes in this region have caused maximum intensity of
VIII-IX several times in the past. The instrumentally recorded seismicity shows that faults in
this area are seismically active. Several epicenters of recorded earthquakes can be
associated with the known faults of the area.
Seismic hazard evaluation was carried out in accordance with the ICOLD guidelines for
selecting seismic design parameters using both probabilistic as well as deterministic
approaches.
The probabilistic approach was used to select the Operating Basis Earthquake (OBE) using
the instrumentally recorded earthquake data for the last century. For the project life of 100
years, recommended OBE acceleration is 0.24g.
Based upon the deterministic evaluation, peak horizontal ground acceleration of 0.50g
associated with Maximum Credible Earthquake (MCE) is recommended for the Project.

ESIA of the Gulpur Hydropower Project
Hagler Bailly Pakistan Appendix A R4V07GHP: 09/23/14 A-2
A.2 Ambient Air Quality
Client Sustainable Solutions Pvt. Ltd.
Sampling Point Proposed Power House Site
Date of Intervention August 26–27, 2013
Parameter Unit Duration LDL Average Obtained Concentration
Carbon Monoxide (CO) mg/m3 24 Hours 0.01 0.85
Nitrogen Dioxide(NO2) ug/m3 24 Hours 5.0 <5.0
Sulfur Dioxide (SO2) ug/m3 24 Hours 5.0 <5.0
Particulate Matter (PM10) ug/m3 24 Hours 2.00 97.14
ug/m3: micrograms per cubic meter
mg/m3: milligram per cubic meter
LDL: Lowest Detection Limit
A.3 Ambient Air Quality
Client Sustainable Solutions Pvt. Ltd.
Sampling Point Proposed Camp Area
Date of Intervention August 27–28, 2013
Parameter Unit Duration LDL Average Obtained Concentration
Carbon Monoxide (CO) mg/m3 24 Hours 0.01 0.82
Nitrogen Dioxide(NO2) ug/m3 24 Hours 5.0 <5.0
Sulfur Dioxide (SO2) ug/m3 24 Hours 5.0 <5.0
Particulate Matter (PM10) ug/m3 24 Hours 2.00 87.90
ug/m3: micrograms per cubic meter
mg/m3: milligram per cubic meter
LDL: Lowest Detection Limit
A.4 Ambient Air Quality
Client Sustainable Solutions Pvt. Ltd.
Sampling Point Proposed Batching Plant
Date of Intervention August 29–30, 2013

ESIA of the Gulpur Hydropower Project
Hagler Bailly Pakistan Appendix A R4V07GHP: 09/23/14 A-3
Parameter Unit Duration LDL Average Obtained Concentration
Carbon Monoxide (CO) mg/m3 24 Hours 0.01 0.93
Nitrogen Dioxide(NO2) ug/m3 24 Hours 5.0 <5.0
Sulfur Dioxide (SO2) ug/m3 24 Hours 5.0 <5.0
Particulate Matter (PM10) ug/m3 24 Hours 2.00 66.77
ug/m3: micrograms per cubic meter
mg/m3: milligram per cubic meter
LDL: Lowest Detection Limit
A.5 Standards
A.5.1 National Environmental Quality Standards (NEQS) for Ambient Air
Concentration in Ambient Air
Pollutants Time– Weighted Average
Effective from 1st
July 2010 Effective from 1
st
January 2013 Method of
measurement
SO2 Annual Average* 80 ug/m3 80 ug/m
3 –Ultraviolet
Fluorescence Method 24 hrs** 120 ug/m
3 120 ug/m
3
NO Annual Average* 40 ug/m3 40 ug/m
3 Gas Phase
Chemiluminescence 24 hrs** 40 ug/m
3 40 ug/m
3
NO2 Annual Average* 40 ug/m3 40 ug/m
3 Gas Phase
Chemiluminescence 24 hrs** 80 ug/m
3 80 ug/m
3
O3 1 hr 180 ug/m3 130 ug/m
3 Non Dispersive UV
Absorption Method
Suspended Particulate Matter (SPM)
Annual Average* 400 ug/m3 360 ug/m
3 High Volume
Sampling (average flow rate not less than 1.1 m3/minute)
24 hrs** 550 ug/m3 500 ug/m
3
Respirable Particulate Matter (PM10)
Annual Average* 200 ug/m3 120 ug/m
3 – Ray Absorption
Method 24 hrs** 250 ug/m3 150 ug/m
3
Respirable Particulate Matter (PM2.5)
Annual Average* 25 ug/m3 15 ug/m
3 – Ray Absorption
Method 24 hrs** 40 ug/m3 35 ug/m
3
1 hr 25 ug/m3 15 ug/m
3
Lead (Pb) Annual Average* 1.5 ug/m3 1 ug/m
3 ASS Method after
sampling using EPM 2060 or equivalent Filter paper
24 hrs** 2 ug/m3 1.5 ug/m
3
Carbon Monoxide (CO)
8hrs** 5 ug/m3 5 ug/m
3 Non Dispersive Infra
Red (NDIR) Method 1 hr 10 ug/m
3 10 ug/m
3
* Annual arithmetic mean of minimum 104 measurements in a year, taken twice a week 24 hourly at uniform interval.
** 24 hourly/ 8 hourly values should be met 98% of the in a year 2% of the time. It may exceed but not on two consecutive days.

ESIA of the Gulpur Hydropower Project
Hagler Bailly Pakistan Appendix A R4V07GHP: 09/23/14 A-4
A.6 Water Analysis Report
See following pages
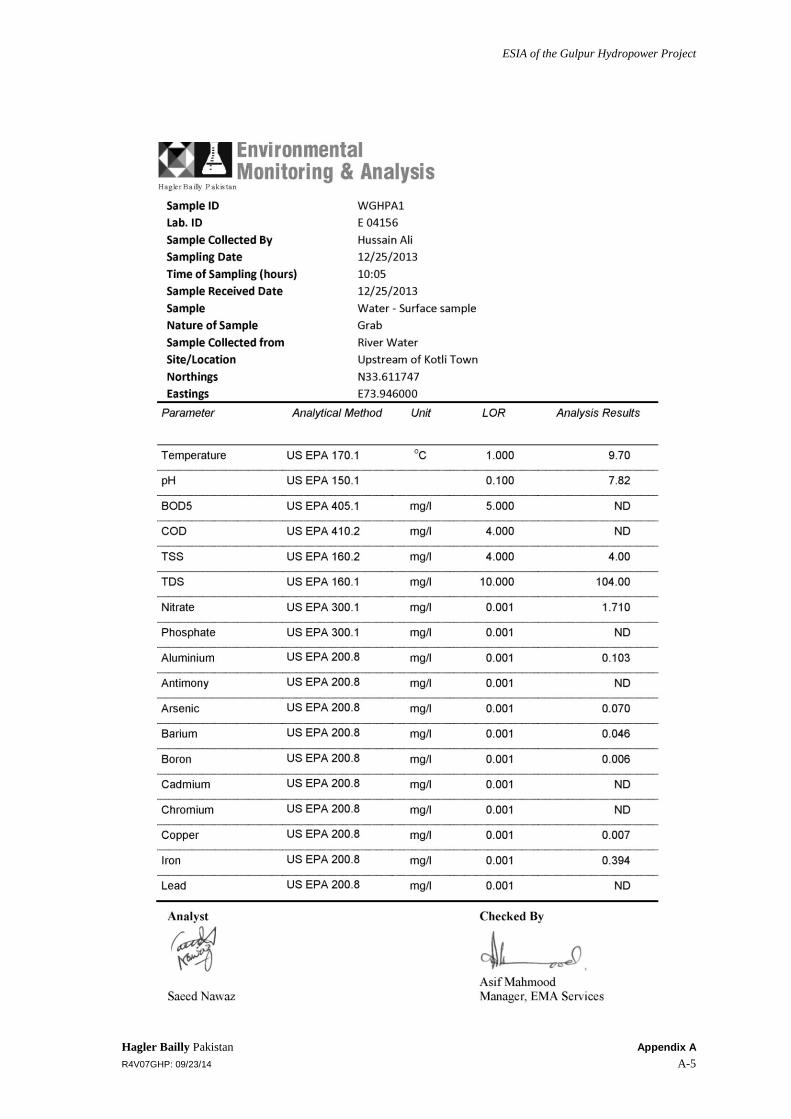
ESIA of the Gulpur Hydropower Project
Hagler Bailly Pakistan Appendix A R4V07GHP: 09/23/14 A-5
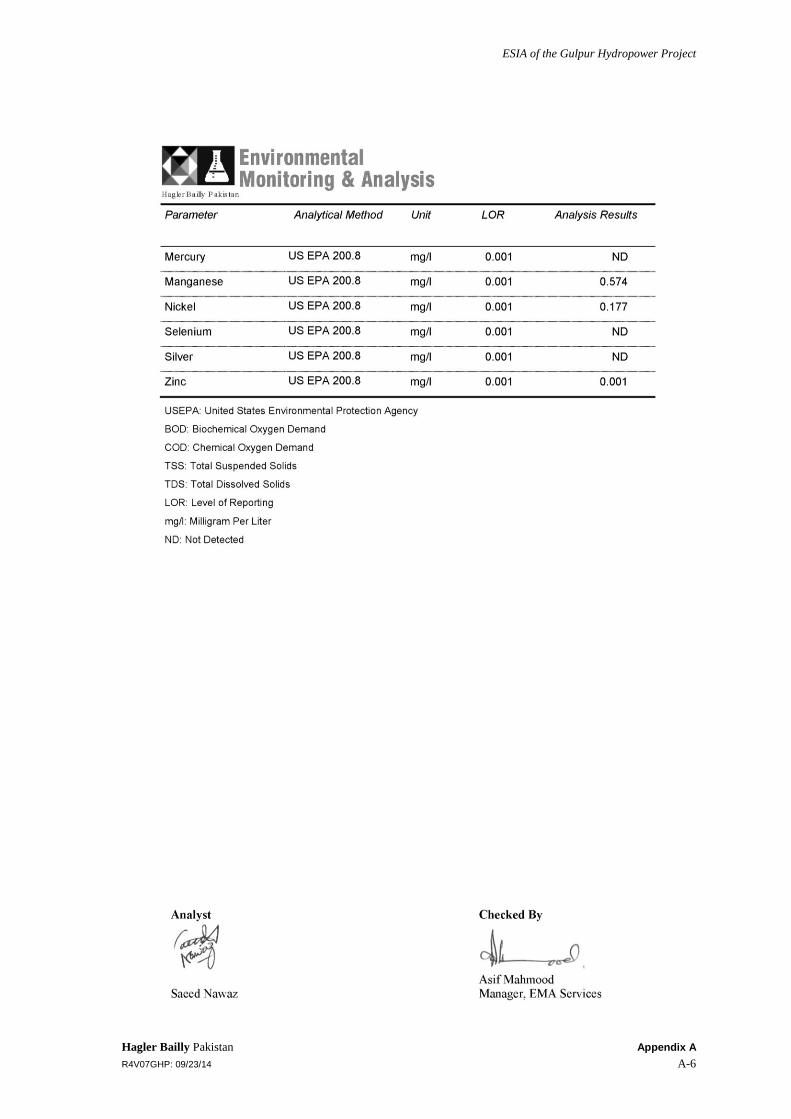
ESIA of the Gulpur Hydropower Project
Hagler Bailly Pakistan Appendix A R4V07GHP: 09/23/14 A-6

ESIA of the Gulpur Hydropower Project
Hagler Bailly Pakistan Appendix A R4V07GHP: 09/23/14 A-7

ESIA of the Gulpur Hydropower Project
Hagler Bailly Pakistan Appendix A R4V07GHP: 09/23/14 A-8