Embed Size (px)
Citation preview

Appendix A:
Turbine Specifications

p =
1.22
5 kg
/m3
Main carrier
Yaw drive
Annular generator
Blade adapter
Rotor hub
Rotor blade
1
2
3
4
5
6
1
2
3
4
5
6
PAGE 20 ENERCON product overview E-92 E-92 PAGE 21
Rated power: 2,350 kWRotor diameter: 92 mHub height in meter: 84 / 85 / 98 / 104 / 108 / 138 Wind zone (DIBt): WZ IIIWind class (IEC): IEC/EN IIA
WEC concept: Gearless, variable speed, single blade adjustment
RotorType: Upwind rotor with active pitch controlRotational direction: Clockwise No. of blades: 3Swept area: 6,648 m2 Blade material: GRP (epoxy resin); Built-in lightning protectionRotational speed: Variable, 5 - 16 rpmPitch control: ENERCON single blade
pitch system; one inde-pendent pitch system per rotor blade with allocated emergency supply
Drive train with generatorMain bearing: Double row tapered/cylin-
drical roller bearingsGenerator: ENERCON direct-drive
annular generatorGrid feed: ENERCON inverter Brake systems: – 3 independent pitch con-
trol systems with emer-gency power supply
– Rotor brake – Rotor lockYaw system: Active via yaw gear, load-dependent dampingCut-out wind speed: 28 - 34 m/s (with ENERCON storm
control*)Remote monitoring: ENERCON SCADA
* For more information on the ENERCON storm control feature, please see the last page.
E-92 2,350 kW
0 5 10 15 20 25
2,5002,2502,0001,7501,5001,2501,000
750500250
0
0.500.450.400.350.300.250.200.150.100.050.00
Wind speed v at hub height (m/s)
Power P (kW) Power coefficient Cp (-)
1 0.0 0.00
2 3.6 0.11
3 29.9 0.27
4 98.2 0.38
5 208.3 0.41
6 384.3 0.44
7 637.0 0.46
8 975.8 0.47
9 1,403.6 0.47
10 1,817.8 0.45
11 2,088.7 0.39
12 2,237.0 0.32
13 2,300.0 0.26
14 2,350.0 0.21
15 2,350.0 0.17
16 2,350.0 0.14
17 2,350.0 0.12
18 2,350.0 0.10
19 2,350.0 0.08
20 2,350.0 0.07
21 2,350.0 0.06
22 2,350.0 0.05
23 2,350.0 0.05
24 2,350.0 0.04
25 2,350.0 0.04
Calculated power curve
Wind Power P (m/s) (kW)

Appendix B:
Avian Baseline Surveys
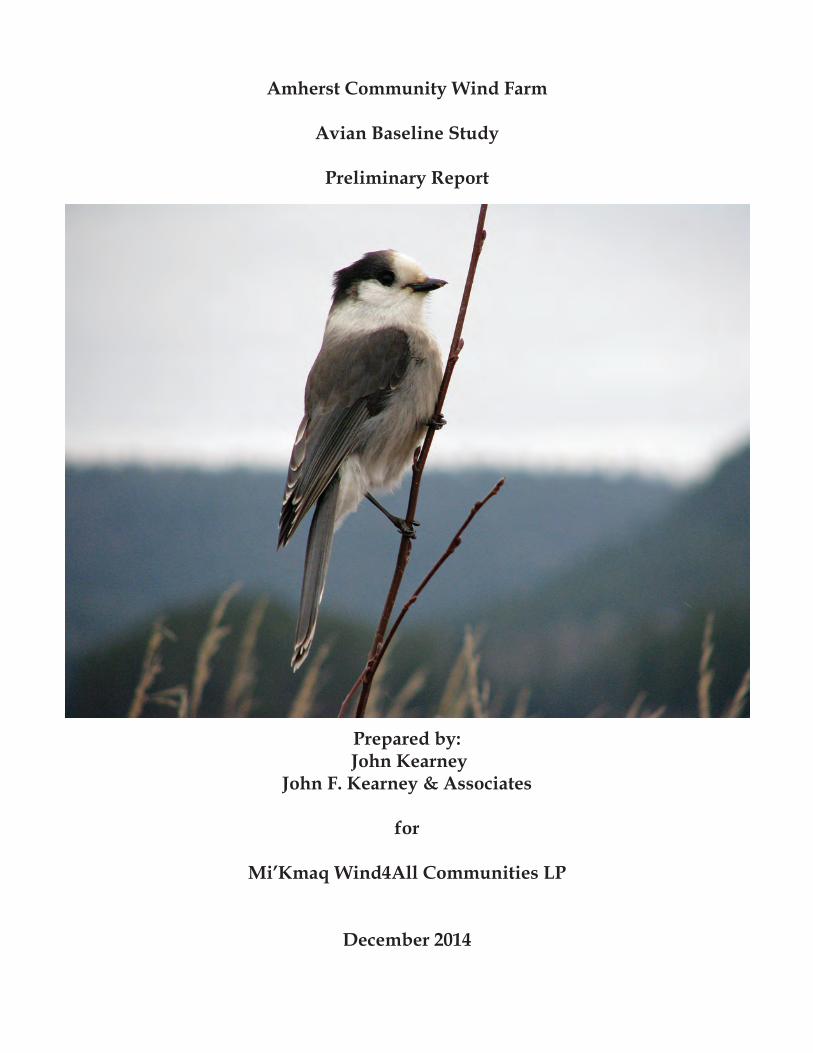
Amherst Community Wind Farm
Avian Baseline Study
Preliminary Report
Prepared by: John Kearney
John F. Kearney & Associates
for
Mi’Kmaq Wind4All Communities LP
December 2014
1
Introduction
The Mi’Kmaq Wind4All Communities are proposing the construction of a 6 megawatt, 3 turbine wind energy facility near the Town of Amherst, in Cumberland County, Nova Scotia. This document presents the preliminary results of an avian baseline study conducted by John F. Kearney & Associates from April through November 2014 as part of the environmental assessment of the project.
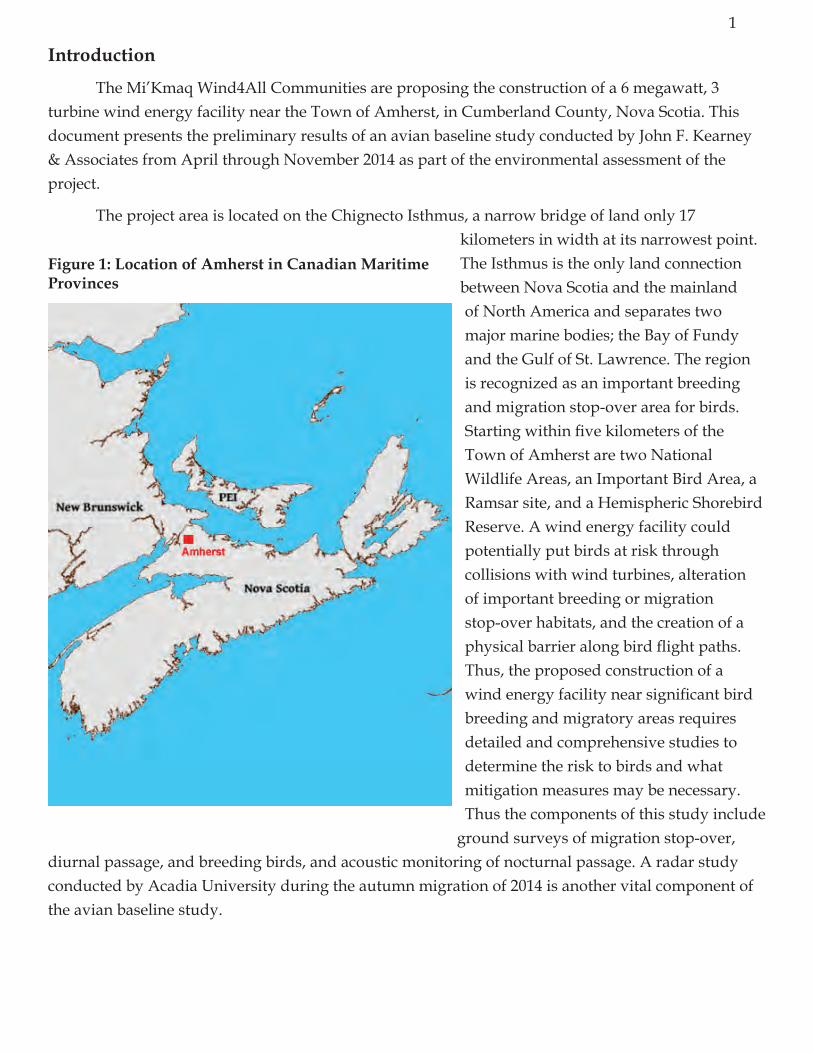
The project area is located on the Chignecto Isthmus, a narrow bridge of land only 17 kilometers in width at its narrowest point. The Isthmus is the only land connection between Nova Scotia and the mainland of North America and separates two major marine bodies; the Bay of Fundy and the Gulf of St. Lawrence. The region is recognized as an important breeding and migration stop-over area for birds. Starting within five kilometers of the Town of Amherst are two National Wildlife Areas, an Important Bird Area, a Ramsar site, and a Hemispheric Shorebird Reserve. A wind energy facility could potentially put birds at risk through collisions with wind turbines, alteration of important breeding or migration stop-over habitats, and the creation of a physical barrier along bird flight paths. Thus, the proposed construction of a wind energy facility near significant bird breeding and migratory areas requires detailed and comprehensive studies to determine the risk to birds and what mitigation measures may be necessary. Thus the components of this study include
ground surveys of migration stop-over, diurnal passage, and breeding birds, and acoustic monitoring of nocturnal passage. A radar study conducted by Acadia University during the autumn migration of 2014 is another vital component of the avian baseline study.
Figure 1: Location of Amherst in Canadian Maritime Provinces
2
Definition of Study Area
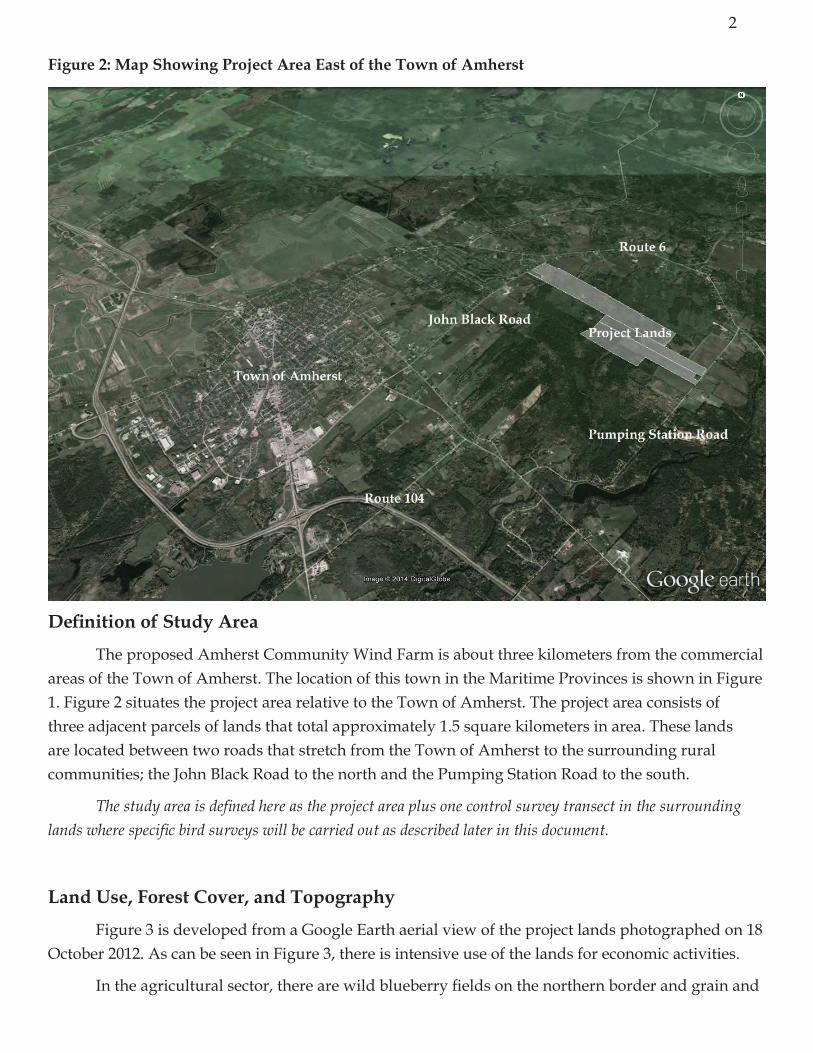
The proposed Amherst Community Wind Farm is about three kilometers from the commercial areas of the Town of Amherst. The location of this town in the Maritime Provinces is shown in Figure 1. Figure 2 situates the project area relative to the Town of Amherst. The project area consists of three adjacent parcels of lands that total approximately 1.5 square kilometers in area. These lands are located between two roads that stretch from the Town of Amherst to the surrounding rural communities; the John Black Road to the north and the Pumping Station Road to the south.
The study area is defined here as the project area plus one control survey transect in the surrounding lands where specific bird surveys will be carried out as described later in this document.
Land Use, Forest Cover, and Topography
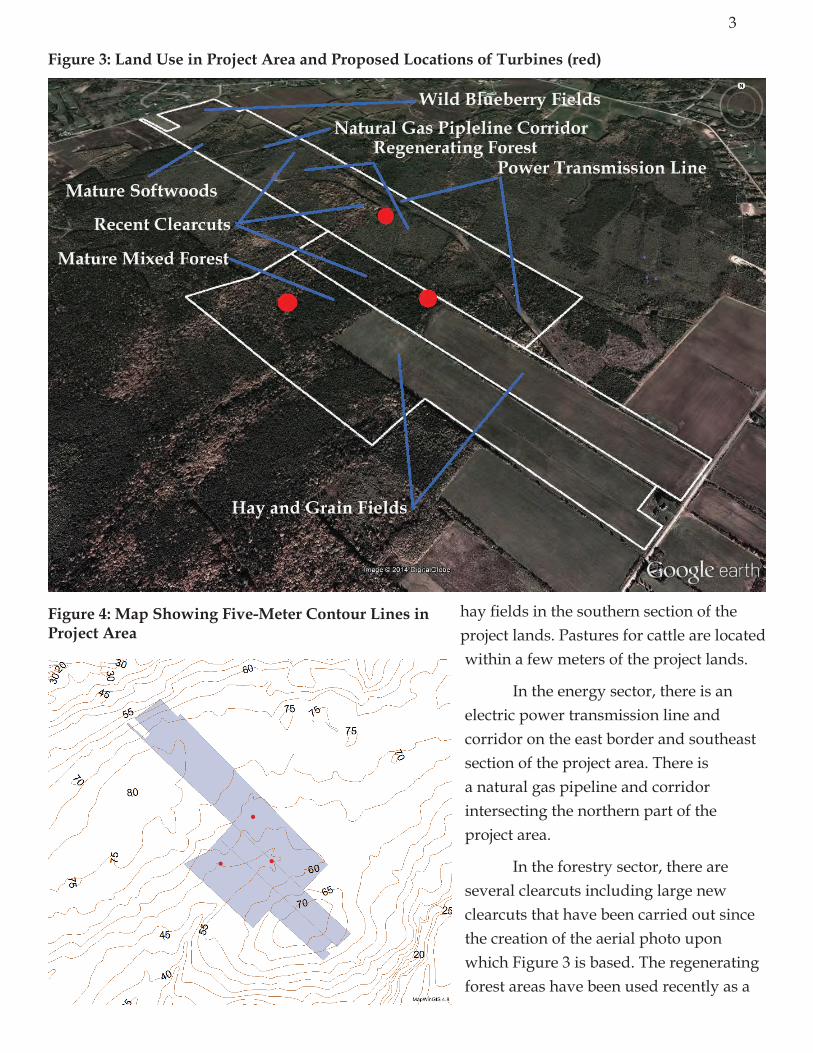
Figure 3 is developed from a Google Earth aerial view of the project lands photographed on 18 October 2012. As can be seen in Figure 3, there is intensive use of the lands for economic activities.
In the agricultural sector, there are wild blueberry fields on the northern border and grain and
Figure 2: Map Showing Project Area East of the Town of Amherst
3
hay fields in the southern section of the project lands. Pastures for cattle are located within a few meters of the project lands.
In the energy sector, there is an electric power transmission line and corridor on the east border and southeast section of the project area. There is a natural gas pipeline and corridor intersecting the northern part of the project area.
In the forestry sector, there are several clearcuts including large new clearcuts that have been carried out since the creation of the aerial photo upon which Figure 3 is based. The regenerating forest areas have been used recently as a
Figure 3: Land Use in Project Area and Proposed Locations of Turbines (red)
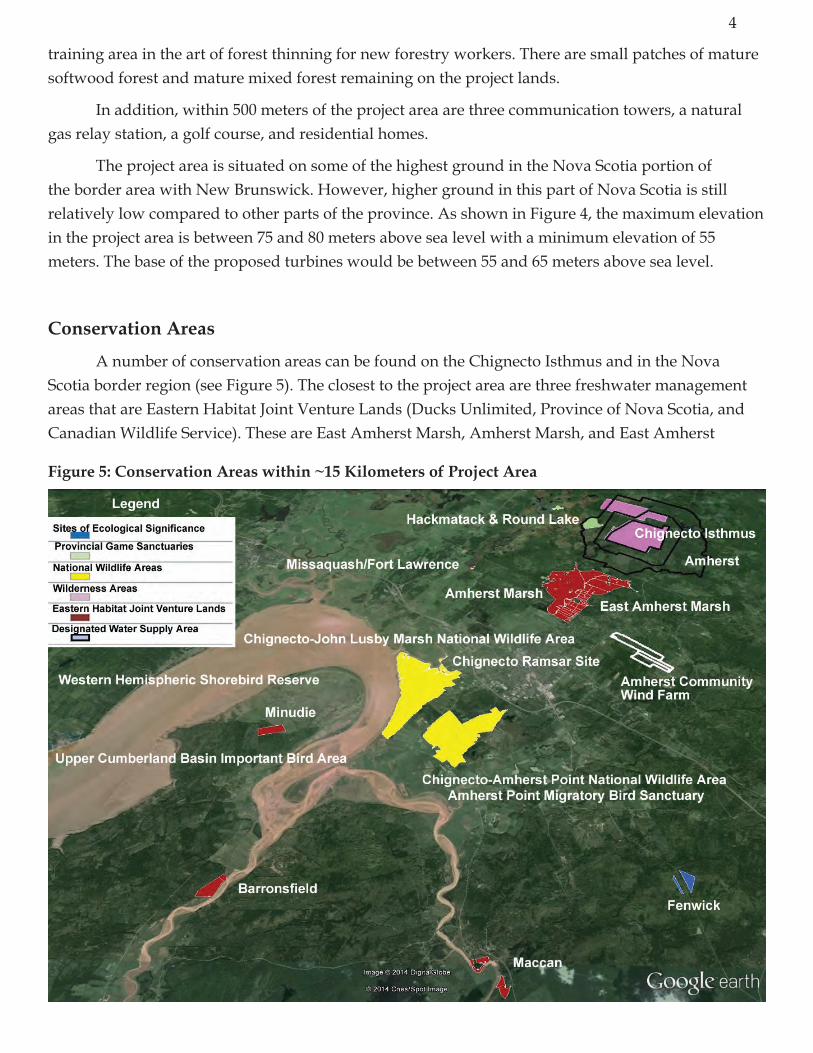
Figure 4: Map Showing Five-Meter Contour Lines in Project Area
4
training area in the art of forest thinning for new forestry workers. There are small patches of mature softwood forest and mature mixed forest remaining on the project lands.
In addition, within 500 meters of the project area are three communication towers, a natural gas relay station, a golf course, and residential homes.
The project area is situated on some of the highest ground in the Nova Scotia portion of the border area with New Brunswick. However, higher ground in this part of Nova Scotia is still relatively low compared to other parts of the province. As shown in Figure 4, the maximum elevation in the project area is between 75 and 80 meters above sea level with a minimum elevation of 55 meters. The base of the proposed turbines would be between 55 and 65 meters above sea level.
Conservation Areas
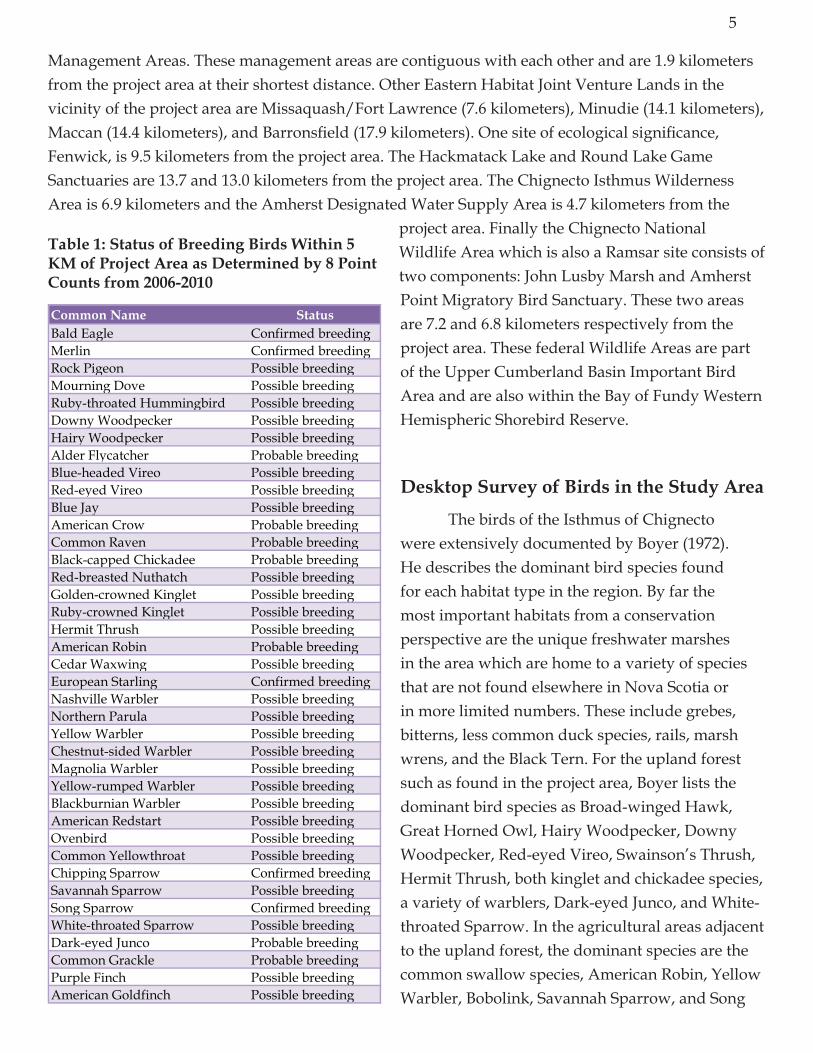
A number of conservation areas can be found on the Chignecto Isthmus and in the Nova Scotia border region (see Figure 5). The closest to the project area are three freshwater management areas that are Eastern Habitat Joint Venture Lands (Ducks Unlimited, Province of Nova Scotia, and Canadian Wildlife Service). These are East Amherst Marsh, Amherst Marsh, and East Amherst
Figure 5: Conservation Areas within ~15 Kilometers of Project Area
5
Management Areas. These management areas are contiguous with each other and are 1.9 kilometers from the project area at their shortest distance. Other Eastern Habitat Joint Venture Lands in the vicinity of the project area are Missaquash/Fort Lawrence (7.6 kilometers), Minudie (14.1 kilometers), Maccan (14.4 kilometers), and Barronsfield (17.9 kilometers). One site of ecological significance, Fenwick, is 9.5 kilometers from the project area. The Hackmatack Lake and Round Lake Game Sanctuaries are 13.7 and 13.0 kilometers from the project area. The Chignecto Isthmus Wilderness Area is 6.9 kilometers and the Amherst Designated Water Supply Area is 4.7 kilometers from the
project area. Finally the Chignecto National Wildlife Area which is also a Ramsar site consists of two components: John Lusby Marsh and Amherst Point Migratory Bird Sanctuary. These two areas are 7.2 and 6.8 kilometers respectively from the project area. These federal Wildlife Areas are part of the Upper Cumberland Basin Important Bird Area and are also within the Bay of Fundy Western Hemispheric Shorebird Reserve.
Desktop Survey of Birds in the Study Area
The birds of the Isthmus of Chignecto were extensively documented by Boyer (1972). He describes the dominant bird species found for each habitat type in the region. By far the most important habitats from a conservation perspective are the unique freshwater marshes in the area which are home to a variety of species that are not found elsewhere in Nova Scotia or in more limited numbers. These include grebes, bitterns, less common duck species, rails, marsh wrens, and the Black Tern. For the upland forest such as found in the project area, Boyer lists the dominant bird species as Broad-winged Hawk, Great Horned Owl, Hairy Woodpecker, Downy Woodpecker, Red-eyed Vireo, Swainson’s Thrush, Hermit Thrush, both kinglet and chickadee species, a variety of warblers, Dark-eyed Junco, and White-throated Sparrow. In the agricultural areas adjacent to the upland forest, the dominant species are the common swallow species, American Robin, Yellow Warbler, Bobolink, Savannah Sparrow, and Song
Common name StatusBald Eagle Confirmed breedingMerlin Confirmed breedingRock Pigeon Possible breedingMourning Dove Possible breedingRuby-throated Hummingbird Possible breedingDowny Woodpecker Possible breedingHairy Woodpecker Possible breedingAlder Flycatcher Probable breedingBlue-headed Vireo Possible breedingRed-eyed Vireo Possible breedingBlue Jay Possible breedingAmerican Crow Probable breedingCommon Raven Probable breedingBlack-capped Chickadee Probable breedingRed-breasted Nuthatch Possible breedingGolden-crowned Kinglet Possible breedingRuby-crowned Kinglet Possible breedingHermit Thrush Possible breedingAmerican Robin Probable breedingCedar Waxwing Possible breedingEuropean Starling Confirmed breedingNashville Warbler Possible breedingNorthern Parula Possible breedingYellow Warbler Possible breedingChestnut-sided Warbler Possible breedingMagnolia Warbler Possible breedingYellow-rumped Warbler Possible breedingBlackburnian Warbler Possible breedingAmerican Redstart Possible breedingOvenbird Possible breedingCommon Yellowthroat Possible breedingChipping Sparrow Confirmed breedingSavannah Sparrow Possible breedingSong Sparrow Confirmed breedingWhite-throated Sparrow Possible breedingDark-eyed Junco Probable breedingCommon Grackle Probable breedingPurple Finch Possible breedingAmerican Goldfinch Possible breeding
Table 1: Status of Breeding Birds Within 5 KM of Project Area as Determined by 8 Point Counts from 2006-2010

6
Sparrow.
More recent data from the Maritimes Breeding Bird Atlas (Atlantic Canada Conservation Data Centre 2014, Bird Studies Canada et al. 2012) indicate a species composition of breeding birds near the project area that is similar to that described by Boyer. Table 1 shows the breeding status of 39 species of birds found on 8 roadside point counts conducted within 5 kilometers of the project area from June 24 to July 1 between 2006 and 2010. These point counts appear not to have been taken near any wetlands, given the absence of water birds.
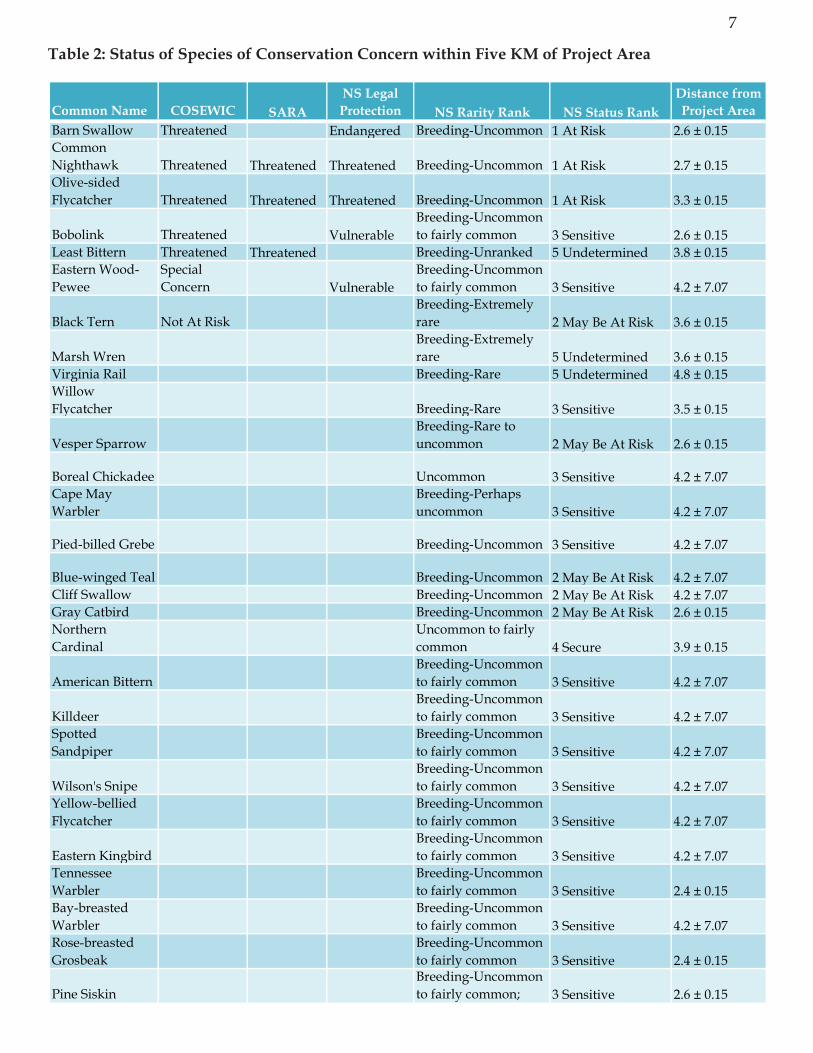
Table 2 presents the status of species of conservation concern observed within 5 kilometers of the project area based on data provided by the Atlantic Canada Conservation Data Centre (2014).The table also shows the distance of the observed birds from the project area. None of the birds listed were seen or heard within it. Nonetheless, the data show that there are 28 species of conservation concern within 5 kilometers of the project area of which 3 are listed as threatened under the Species at Risk Act (SARA), an additional 2 ranked as threatened and 1 as special concern by the Committee on the Status of Endangered Wildlife in Canada (COSEWIC), and 4 out of the 5 threatened species also have legal protection from the Province of Nova Scotia. These species are Barn Swallow, Common Nighthawk, Olive-sided Flycatcher, Bobolink, Least Bittern, and Eastern Wood-Pewee. The Barn Swallow, Common Nighthawk, and Bobolink were less than 3 kilometers from the project area.
Objectives of the Baseline Study
The avian baseline study has three major objectives:
1. To provide information on birds such that the proposed project complies with the federal Migratory Birds Convention Act, the Species at Risk Act, and associated laws and policies of the Province of Nova Scotia,
2. To provide diurnal and nocturnal information to inform the siting, operation, and monitoring of the proposed project in regard to the direct (mortality from collision and construction activities) and indirect (displacement from habitat, fragmentation of habitat, avoidance of habitat, and flight path barrier) effects on birds, and
3. To provide a quantitative baseline for measuring the impacts of the project in the short and long term and to contribute to a global understanding of wind energy projects on birds.
These objectives will be met through the studies to:
A. Determine the relative abundance of breeding birds in the study area,
B. Determine the abundance of birds in migration stop-over in the study area,
C. Determine the numbers of birds wintering in the study area,
D. Determine the abundance, species composition, and movement patterns of birds in diurnal and nocturnal passage and the risk of collision with wind turbines,
7
Table 2: Status of Species of Conservation Concern within Five KM of Project Area
Common name COSEWIC SARAnS Legal Protection nS Rarity Rank nS Status Rank
Distance from Project Area
Barn Swallow Threatened Endangered Breeding-Uncommon 1 At Risk 2.6 ± 0.15Common Nighthawk Threatened Threatened Threatened Breeding-Uncommon 1 At Risk 2.7 ± 0.15Olive-sided Flycatcher Threatened Threatened Threatened Breeding-Uncommon 1 At Risk 3.3 ± 0.15
Bobolink Threatened VulnerableBreeding-Uncommon to fairly common 3 Sensitive 2.6 ± 0.15
Least Bittern Threatened Threatened Breeding-Unranked 5 Undetermined 3.8 ± 0.15Eastern Wood-Pewee
Special Concern Vulnerable
Breeding-Uncommon to fairly common 3 Sensitive 4.2 ± 7.07
Black Tern Not At RiskBreeding-Extremely rare 2 May Be At Risk 3.6 ± 0.15
Marsh WrenBreeding-Extremely rare 5 Undetermined 3.6 ± 0.15
Virginia Rail Breeding-Rare 5 Undetermined 4.8 ± 0.15Willow Flycatcher Breeding-Rare 3 Sensitive 3.5 ± 0.15
Vesper SparrowBreeding-Rare to uncommon 2 May Be At Risk 2.6 ± 0.15
Boreal Chickadee Uncommon 3 Sensitive 4.2 ± 7.07Cape May Warbler
Breeding-Perhaps uncommon 3 Sensitive 4.2 ± 7.07
Pied-billed Grebe Breeding-Uncommon 3 Sensitive 4.2 ± 7.07
Blue-winged Teal Breeding-Uncommon 2 May Be At Risk 4.2 ± 7.07Cliff Swallow Breeding-Uncommon 2 May Be At Risk 4.2 ± 7.07Gray Catbird Breeding-Uncommon 2 May Be At Risk 2.6 ± 0.15Northern Cardinal
Uncommon to fairly common 4 Secure 3.9 ± 0.15
American BitternBreeding-Uncommon to fairly common 3 Sensitive 4.2 ± 7.07
KilldeerBreeding-Uncommon to fairly common 3 Sensitive 4.2 ± 7.07
Spotted Sandpiper
Breeding-Uncommon to fairly common 3 Sensitive 4.2 ± 7.07
Wilson's SnipeBreeding-Uncommon to fairly common 3 Sensitive 4.2 ± 7.07
Yellow-bellied Flycatcher
Breeding-Uncommon to fairly common 3 Sensitive 4.2 ± 7.07
Eastern KingbirdBreeding-Uncommon to fairly common 3 Sensitive 4.2 ± 7.07
Tennessee Warbler
Breeding-Uncommon to fairly common 3 Sensitive 2.4 ± 0.15
Bay-breasted Warbler
Breeding-Uncommon to fairly common 3 Sensitive 4.2 ± 7.07
Rose-breasted Grosbeak
Breeding-Uncommon to fairly common 3 Sensitive 2.4 ± 0.15
Pine SiskinBreeding-Uncommon to fairly common; 3 Sensitive 2.6 ± 0.15
8
E. Determine the possible effects, besides collisions, of wind turbines and human activities on the breeding, wintering, and migrating birds in the study area including
a) the use of habitats by breeding and wintering birds and migrating birds in stop-over,
b) displacement from habitats,
c) avoidance of habitats,
d) the possible effects of habitat fragmentation on bird populations, and
e) the possible barrier effects on flight pathways.
F. Determine the presence and abundance of species of conservation concern in the study area, the kinds and amount of habitat they require, and the measures required by the project proponents for avoidance or mitigation,
G. Make recommendations for adaptive management of bird habitats and risk abatement at the wind energy facility,
H. Make recommendations for post-construction studies, and
I. Contribute to the national database on avian wind facility studies.
Survey Methods
Eight types of survey methodologies were used to meet the objectives of the study. All the surveys include quantitative survey methodologies consisting of counts within the project area and in the control area (the acoustic surveys are only in the project area).
1. MIgRATIOn STOP-OvER TRAnSECTS
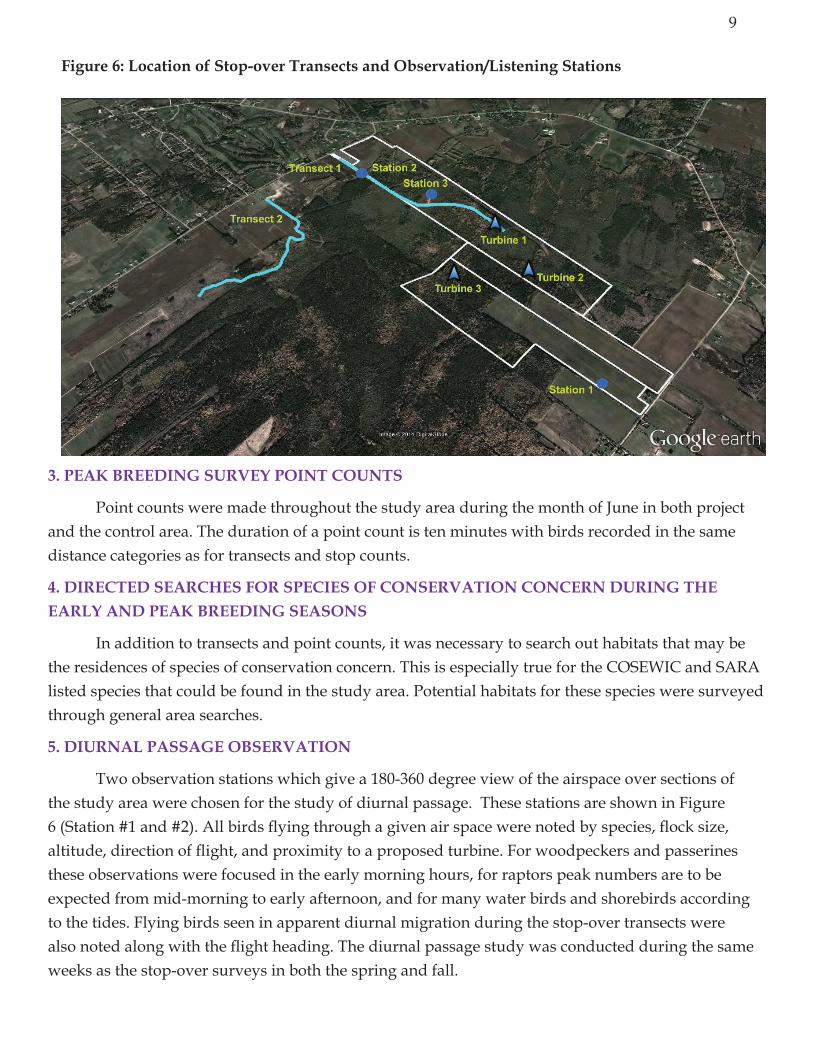
Two transects were used for the study of stop-over migration. These transects are shown in Figure 6. The transects were chosen so as to sample representative habitats in the study area, one in the project area (Transect 1) and one in a control area (Transect 2).
Each transect was surveyed once every week during the migration period, April 15-June 7, 2014 and August 15-October 31, 2014. The transects were 1,500 metres in length with all birds recorded in the following distance categories from the observer: <50 meters, 50-100 meters, >100 meters, and flying overhead. The transects are divided into three equal 500-meter segments which represent, when possible, distinct habitat types. Along each transect are six stop counts.
The duration of each stop count is ten minutes with birds recorded in the same distance categories as the rest of the transect. The stop counts provide a finer resolution of habitat utilization by birds in stop-over and increase survey time in a systematic fashion.
2. EARLy BREEDIng SURvEy
The spring stop-over transects also provide data on early breeding birds using the study area.
9
3. PEAK BREEDIng SURvEy POInT COUnTS
Point counts were made throughout the study area during the month of June in both project and the control area. The duration of a point count is ten minutes with birds recorded in the same distance categories as for transects and stop counts.
4. DIRECTED SEARChES FOR SPECIES OF COnSERvATIOn COnCERn DURIng ThE EARLy AnD PEAK BREEDIng SEASOnS
In addition to transects and point counts, it was necessary to search out habitats that may be the residences of species of conservation concern. This is especially true for the COSEWIC and SARA listed species that could be found in the study area. Potential habitats for these species were surveyed through general area searches.
5. DIURnAL PASSAgE OBSERvATIOn
Two observation stations which give a 180-360 degree view of the airspace over sections of the study area were chosen for the study of diurnal passage. These stations are shown in Figure 6 (Station #1 and #2). All birds flying through a given air space were noted by species, flock size, altitude, direction of flight, and proximity to a proposed turbine. For woodpeckers and passerines these observations were focused in the early morning hours, for raptors peak numbers are to be expected from mid-morning to early afternoon, and for many water birds and shorebirds according to the tides. Flying birds seen in apparent diurnal migration during the stop-over transects were also noted along with the flight heading. The diurnal passage study was conducted during the same weeks as the stop-over surveys in both the spring and fall.
Figure 6: Location of Stop-over Transects and Observation/Listening Stations
10
6. ACOUSTIC MOnITORIng OF nOCTURnAL PASSAgE
Acoustic monitoring of nocturnal passage provides data on the species of birds migrating through an area, their relative abundance, and migration timing. Two recording stations were set up and were located at stations #1 and #3 as shown in Figure 6. Recording took place every night from civil sunset to civil sunrise from mid-April to early June and early August to mid November 2014.
At both sites, a Song Meter SM2, made by Wildlife Acoustics, was used as a recording device. The Song Meter is powered by 2 AA and 4 D alkaline batteries. Settings were as follows:
Sampling format: 16 bit
Sampling rate: 24,000 Hz
High pass filter: 1,000 Hz
Pre-amp: 60 dB gain
Storage: 2-32GB SD cards
Wildlife Acoustics also produces a night flight call microphone, the SMX-NFC, to be used with the Song Meter. This weather-resistant microphone rests on a flat horizontal plate creating a pressure zone resulting in a 3-6 dB gain within a beam angle of 125 degrees. Based on experience in Nova
Scotia, the range is estimated at 100-150 meters in altitude.
The Song Meter and SMX-NFC microphone were chosen for use in this study since they were also employed by the author at seven other existing or proposed wind energy facilities from 2011 to 2013 in Nova Scotia.
The detection of night flight calls recorded in the .wav format, and their organization and identification to bird species was conducted using the Raven Pro sound
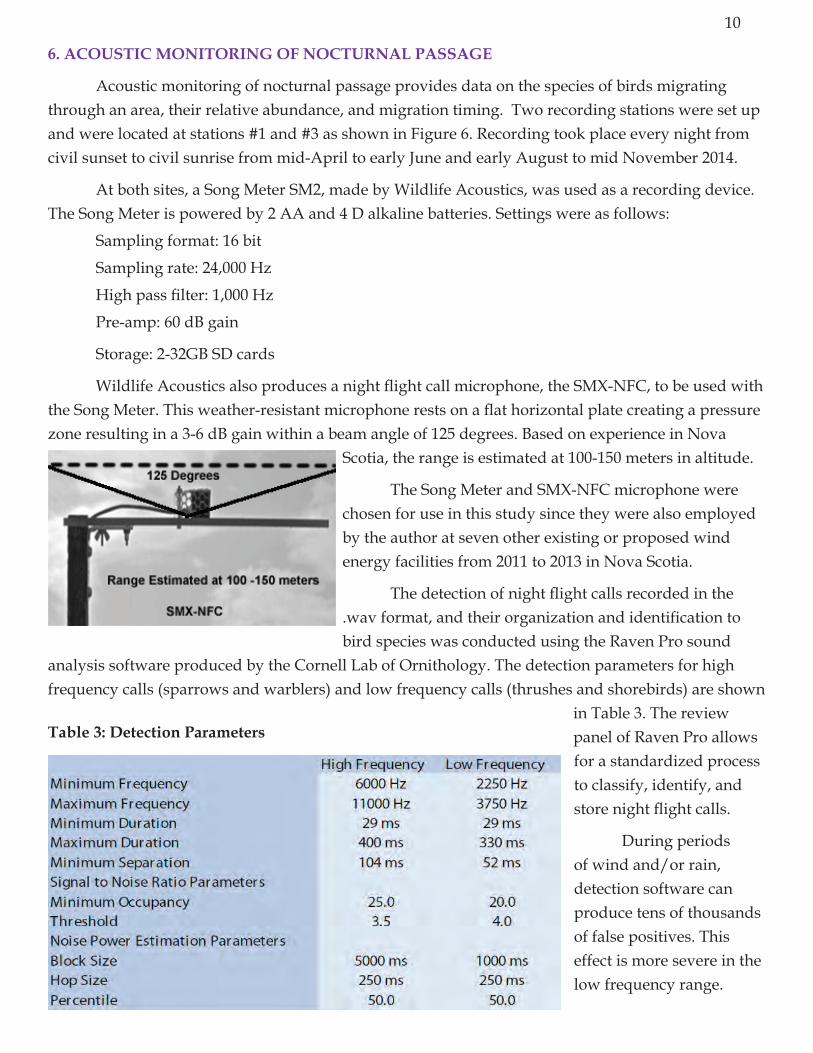
analysis software produced by the Cornell Lab of Ornithology. The detection parameters for high frequency calls (sparrows and warblers) and low frequency calls (thrushes and shorebirds) are shown
in Table 3. The review panel of Raven Pro allows for a standardized process to classify, identify, and store night flight calls.
During periods of wind and/or rain, detection software can produce tens of thousands of false positives. This effect is more severe in the low frequency range.
Table 3: Detection Parameters
11
To overcome this problem, a number of bandwidth filters were employed when normal detector runs produced more than 5,000 detections. For the high frequency detector, a bandwidth filter with a minimum of 100 Hz , a maximum of 1000 Hz, and an energy percentile of 40% (the fraction of total energy in the specified bandwidth) proved to be the most effective. For the low frequency detector, a filter with a minimum bandwidth of 100 Hz, a maximum of 500 Hz, and an energy percentile of 40% or more was used. Past studies showed that the high frequency filter captured about 98% of the true positives detected without the filter. For the low frequency detector, the bandwidth filter is less efficient but still captures the majority of night flight calls during the night.
Results
The results of the baseline study will be presented on a seasonal basis from April to November. The analysis for each season consists of three study components.
SPRIng MIgRATIOn
The study of birds migrating in the spring consists of surveys of migration stop-over, diurnal passage, and nocturnal passage.
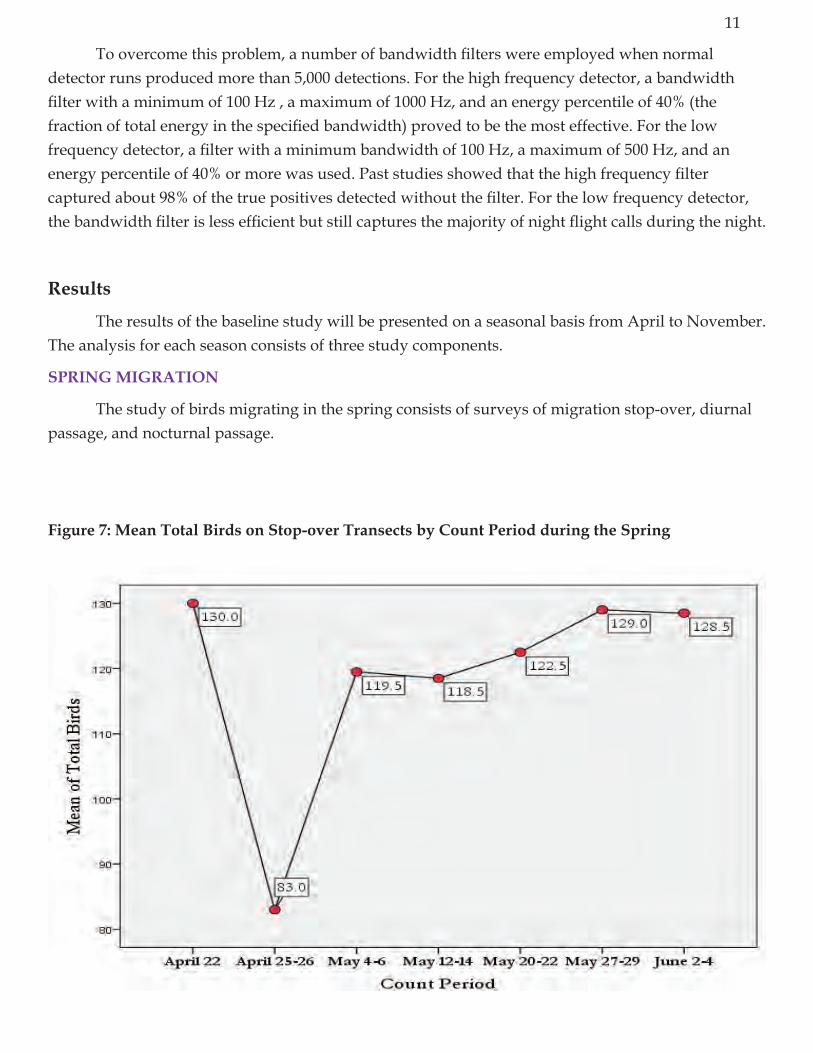
Figure 7: Mean Total Birds on Stop-over Transects by Count Period during the Spring

12
MigRATion STop-oveR
Figure 7 shows the mean number of birds on the stop-over transects by count period during the spring migration. Despite, the dip in the number of birds in late April, there is no statistically significant difference or clear seasonal trend in the number of birds present.
Figure 8 graphs the total birds seen on each transect in the project and control areas. The project transect has a greater number of birds but a statistical T-test indicates that there is not a significant difference in the number of birds on the transects at a 95% confidence level.
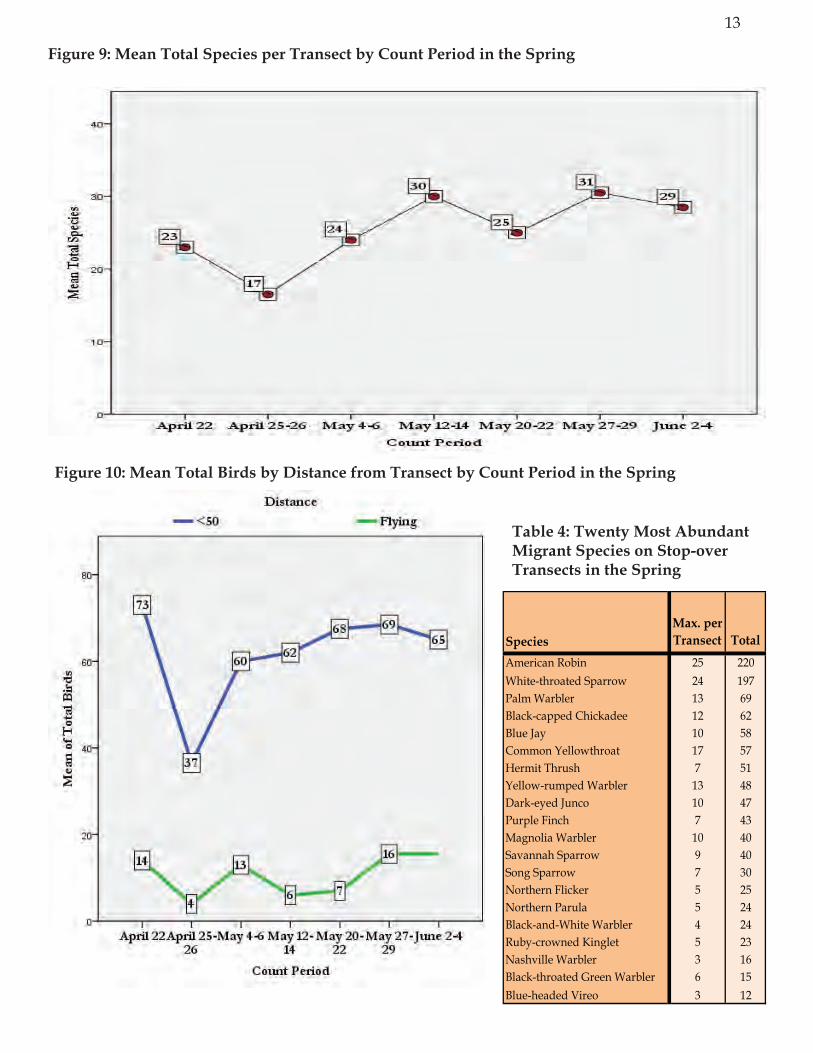
Figure 9 plots the mean total species recorded on the transects by count period. As with total birds, a statistical analysis reveals no significant differences between the periods.
The number of birds flying over a transect in the morning is an indication
of the strength of diurnal migration that may be taking place. At the same time, the number of birds seen within 50 meters of the transect is the strongest indication of the density of birds in stop-over. Figure 10 compares the mean number of birds within 50 meters of the transect and the mean number of birds flying over the transect by count period. For the spring period, there was a mean number of 60.92 birds within 50 meters of the transect and a mean of 10.46 birds flying over the transect. A statistical T-test confirms that there is a significantly smaller number of birds flying over the transect than seen on the ground or in trees within 50 meters of the transect at the 95% confidence level.
Table 4 shows the most abundant migratory species present on the stop-over transects in the spring; with American Robin, White-throated Sparrow, and Palm Warbler being the top three species
Figure 8: Birds per Stop-over Transect by Count Period in the Spring
13
Figure 9: Mean Total Species per Transect by Count Period in the Spring
Figure 10: Mean Total Birds by Distance from Transect by Count Period in the Spring
Table 4: Twenty Most Abundant Migrant Species on Stop-over Transects in the Spring
Max. per Transect Total
American Robin 25 220White-throated Sparrow 24 197Palm Warbler 13 69Black-capped Chickadee 12 62Blue Jay 10 58Common Yellowthroat 17 57Hermit Thrush 7 51Yellow-rumped Warbler 13 48Dark-eyed Junco 10 47Purple Finch 7 43Magnolia Warbler 10 40Savannah Sparrow 9 40Song Sparrow 7 30Northern Flicker 5 25Northern Parula 5 24Black-and-White Warbler 4 24Ruby-crowned Kinglet 5 23Nashville Warbler 3 16Black-throated Green Warbler 6 15Blue-headed Vireo 3 12
Species
14
detected.
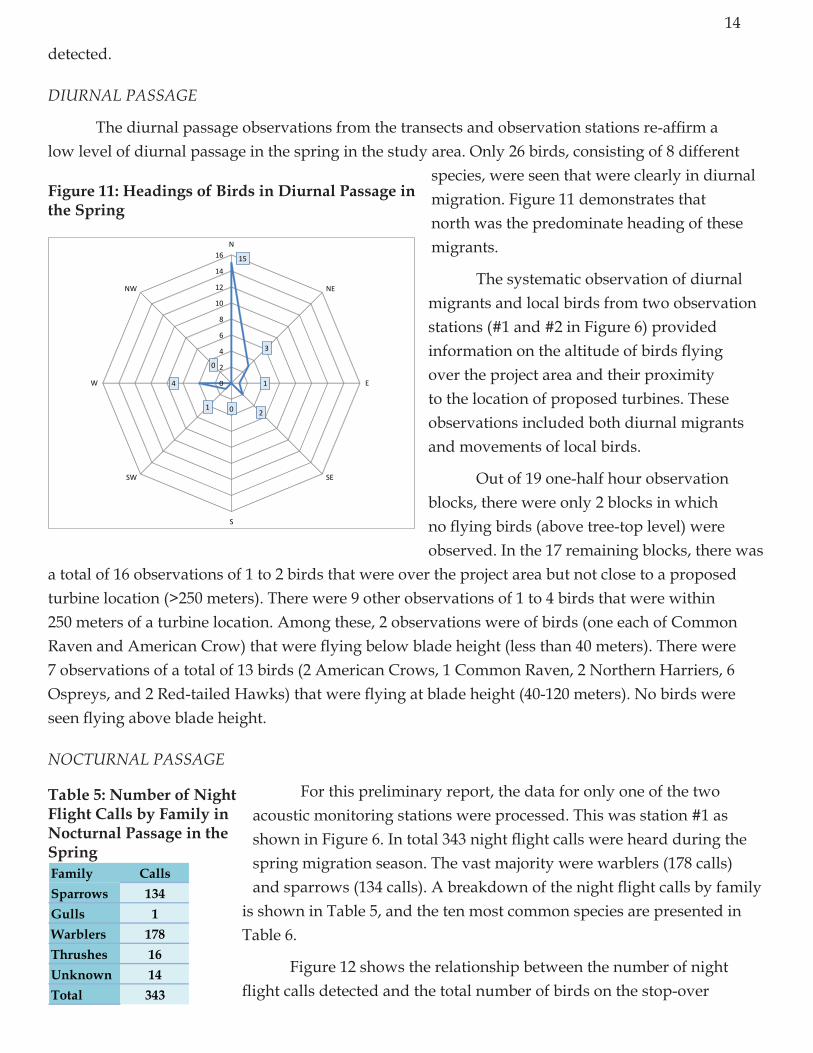
DiuRnAl pASSAge
The diurnal passage observations from the transects and observation stations re-affirm a low level of diurnal passage in the spring in the study area. Only 26 birds, consisting of 8 different
species, were seen that were clearly in diurnal migration. Figure 11 demonstrates that north was the predominate heading of these migrants.
The systematic observation of diurnal migrants and local birds from two observation stations (#1 and #2 in Figure 6) provided information on the altitude of birds flying over the project area and their proximity to the location of proposed turbines. These observations included both diurnal migrants and movements of local birds.
Out of 19 one-half hour observation blocks, there were only 2 blocks in which no flying birds (above tree-top level) were observed. In the 17 remaining blocks, there was
a total of 16 observations of 1 to 2 birds that were over the project area but not close to a proposed turbine location (>250 meters). There were 9 other observations of 1 to 4 birds that were within 250 meters of a turbine location. Among these, 2 observations were of birds (one each of Common Raven and American Crow) that were flying below blade height (less than 40 meters). There were 7 observations of a total of 13 birds (2 American Crows, 1 Common Raven, 2 Northern Harriers, 6 Ospreys, and 2 Red-tailed Hawks) that were flying at blade height (40-120 meters). No birds were seen flying above blade height.
noCTuRnAl pASSAge
For this preliminary report, the data for only one of the two acoustic monitoring stations were processed. This was station #1 as shown in Figure 6. In total 343 night flight calls were heard during the spring migration season. The vast majority were warblers (178 calls) and sparrows (134 calls). A breakdown of the night flight calls by family
is shown in Table 5, and the ten most common species are presented in Table 6.
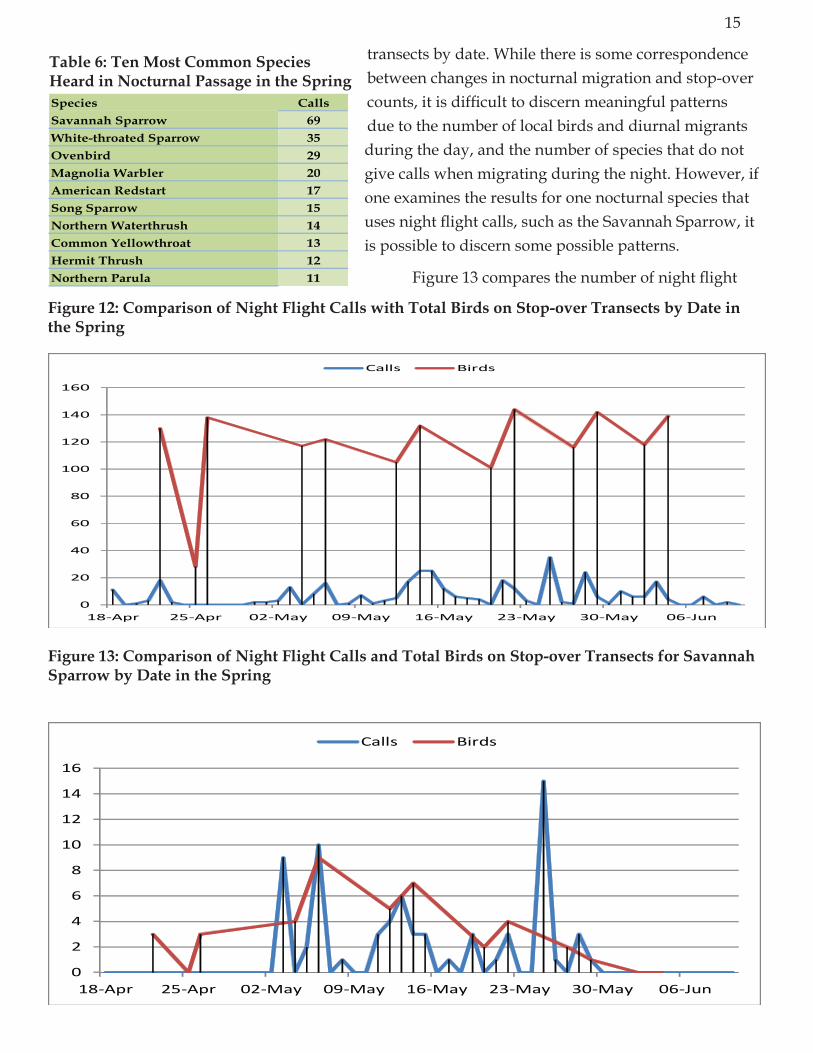
Figure 12 shows the relationship between the number of night flight calls detected and the total number of birds on the stop-over
15
3
1
201
4
0
0
2
4
6
8
10
12
14
16N
NE
E
SE
S
SW
W
NW
Figure 11: headings of Birds in Diurnal Passage in the Spring
Table 5: number of night Flight Calls by Family in nocturnal Passage in the SpringFamily CallsSparrows 134gulls 1Warblers 178Thrushes 16Unknown 14Total 343
15
transects by date. While there is some correspondence between changes in nocturnal migration and stop-over counts, it is difficult to discern meaningful patterns due to the number of local birds and diurnal migrants during the day, and the number of species that do not give calls when migrating during the night. However, if one examines the results for one nocturnal species that uses night flight calls, such as the Savannah Sparrow, it is possible to discern some possible patterns.
Figure 13 compares the number of night flight
Table 6: Ten Most Common Species heard in nocturnal Passage in the SpringSpecies CallsSavannah Sparrow 69White-throated Sparrow 35Ovenbird 29Magnolia Warbler 20American Redstart 17Song Sparrow 15northern Waterthrush 14Common yellowthroat 13hermit Thrush 12northern Parula 11
0
20
40
60
80
100
120
140
160
18-Apr 25-Apr 02-May 09-May 16-May 23-May 30-May 06-Jun
Calls Birds
Figure 12: Comparison of night Flight Calls with Total Birds on Stop-over Transects by Date in the Spring
0
2
4
6
8
10
12
14
16
18-Apr 25-Apr 02-May 09-May 16-May 23-May 30-May 06-Jun
Calls Birds
Figure 13: Comparison of night Flight Calls and Total Birds on Stop-over Transects for Savannah Sparrow by Date in the Spring
16
calls recorded for Savannah Sparrow to the number detected on the stop-over transects.It appears that there are arrivals of Savannah Sparrows in the period May 3-13 and then a departure of migrating birds on May 25.
BReeDing SeASon
The breeding season is divided into three parts: nocturnal breeding birds, early breeding birds, and peak breeding birds. Breeding surveys focused on the peak breeding birds.
noCTuRnAl/CRepuSCulAR BReeDing BiRDS
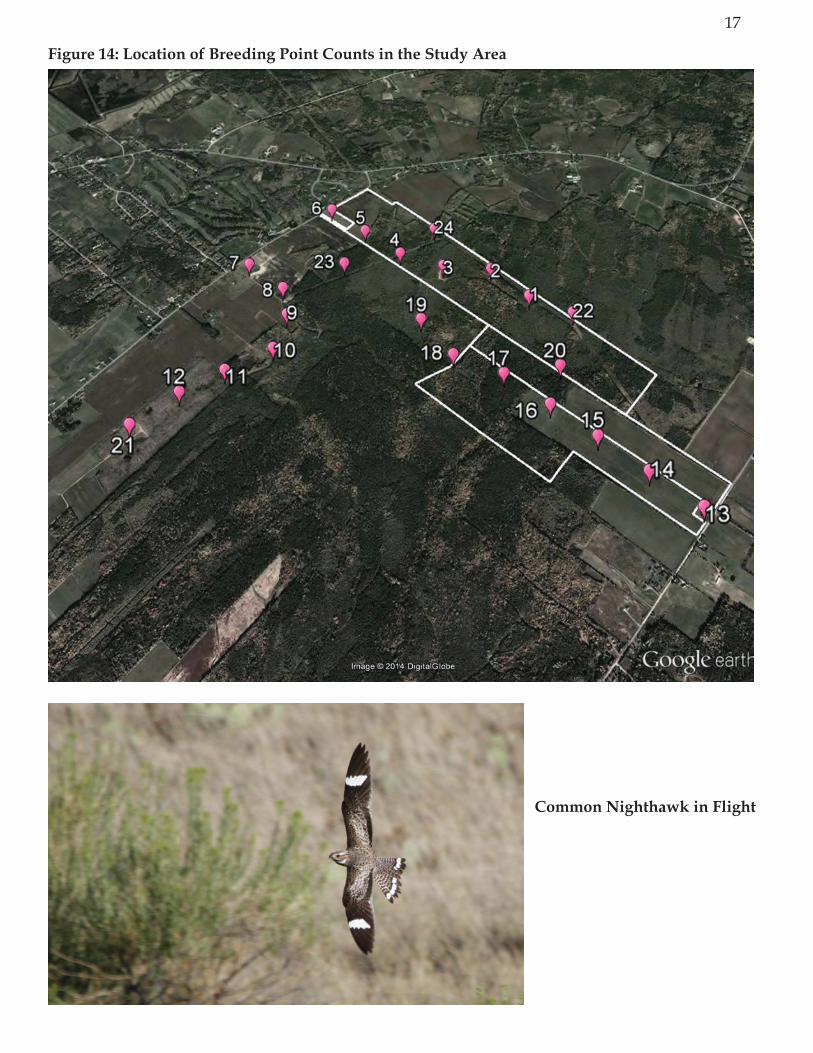
Nocturnal breeding birds were surveyed by acoustic monitoring. Data processing for Station #1 (see Figure 6) showed that American Woodcocks were already engaged in courtship displays by April 18, the first night of recording. A Common Nighthawk was heard on the last night of recording on June 10. Common Nighthawks were frequently recorded both at evening and morning twilight hours when recording started again August 11 and on a number of nights thereafter. These data suggest that Common Nighthawks bred in the southeastern section of the project area near Pumping Station Road.
No owls were recorded at Station #1. However, a Great Horned Owl was observed on the control transect on September 30; most likely a locally breeding bird.
eARly BReeDing
A number of species breed early in the spring and are thus not as actively engaged in courtship and breeding activities by the time the peak season arrives in June. Table 7 list a number of these species detected during the stop-over transects.
peAk BReeDing BiRDS
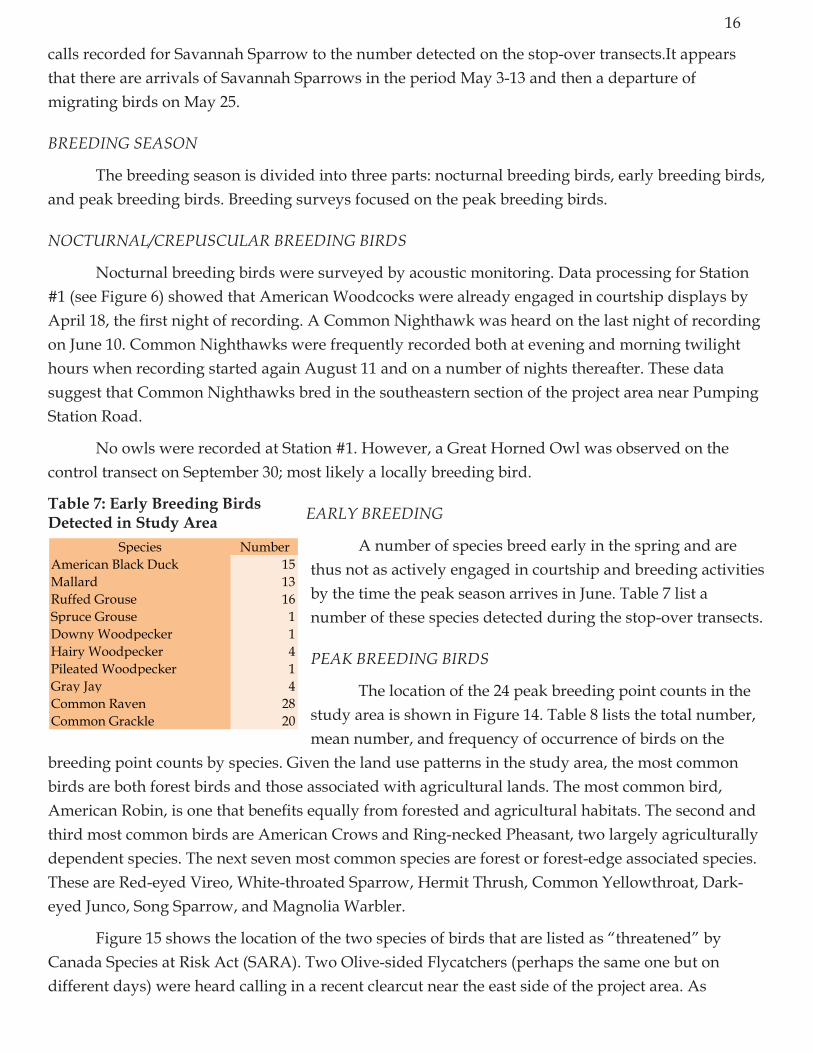
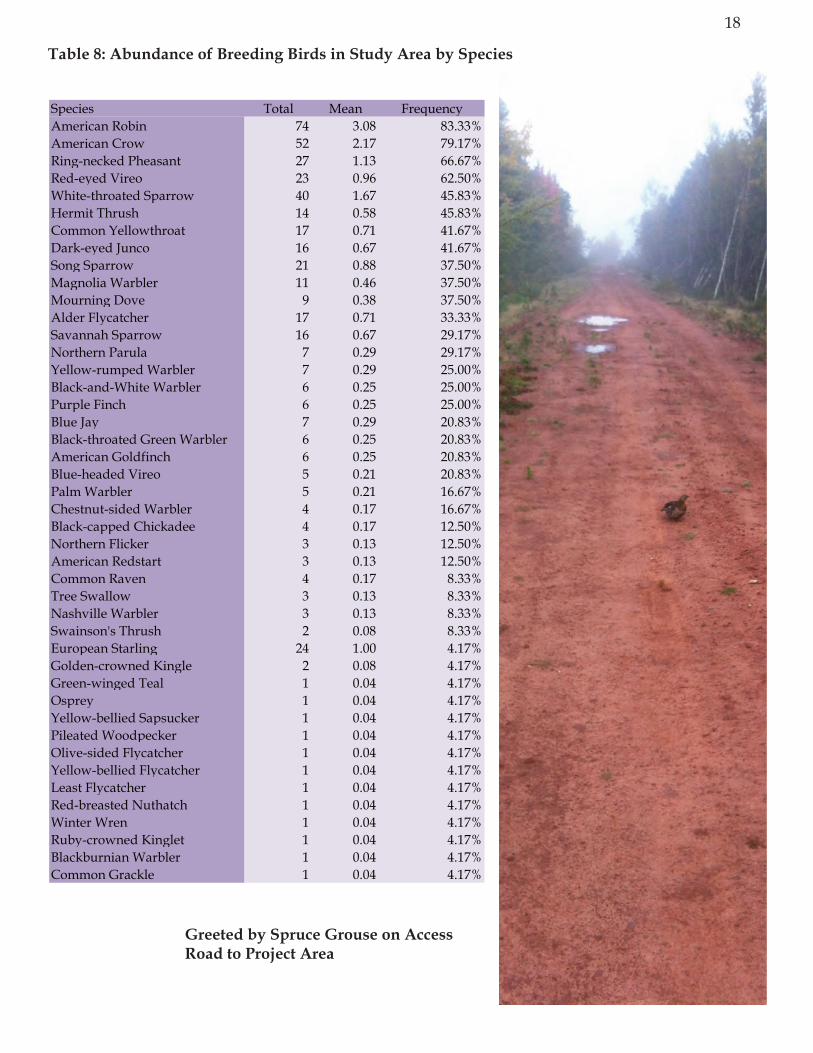
The location of the 24 peak breeding point counts in the study area is shown in Figure 14. Table 8 lists the total number, mean number, and frequency of occurrence of birds on the
breeding point counts by species. Given the land use patterns in the study area, the most common birds are both forest birds and those associated with agricultural lands. The most common bird, American Robin, is one that benefits equally from forested and agricultural habitats. The second and third most common birds are American Crows and Ring-necked Pheasant, two largely agriculturally dependent species. The next seven most common species are forest or forest-edge associated species. These are Red-eyed Vireo, White-throated Sparrow, Hermit Thrush, Common Yellowthroat, Dark-eyed Junco, Song Sparrow, and Magnolia Warbler.
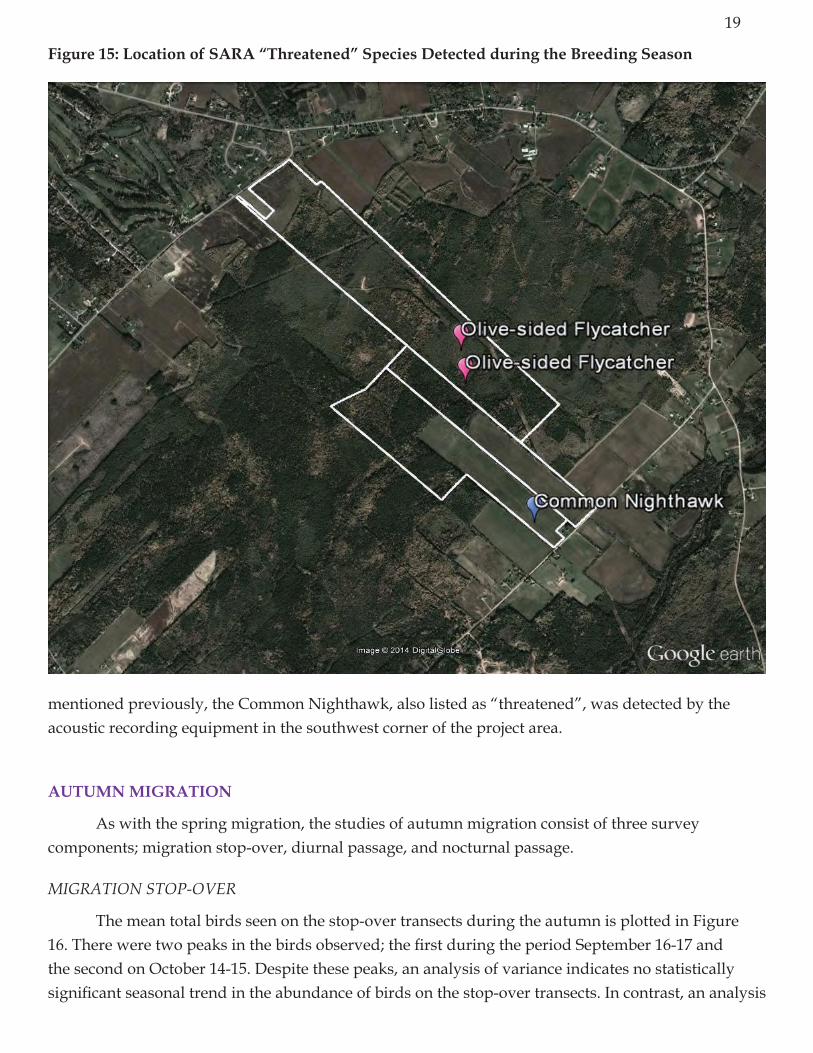
Figure 15 shows the location of the two species of birds that are listed as “threatened” by Canada Species at Risk Act (SARA). Two Olive-sided Flycatchers (perhaps the same one but on different days) were heard calling in a recent clearcut near the east side of the project area. As
Species NumberAmerican Black Duck 15Mallard 13Ruffed Grouse 16Spruce Grouse 1Downy Woodpecker 1Hairy Woodpecker 4Pileated Woodpecker 1Gray Jay 4Common Raven 28Common Grackle 20
Table 7: Early Breeding Birds Detected in Study Area
17
Figure 14: Location of Breeding Point Counts in the Study Area
Common nighthawk in Flight
18
Species Total Mean FrequencyAmerican Robin 74 3.08 83.33%American Crow 52 2.17 79.17%Ring-necked Pheasant 27 1.13 66.67%Red-eyed Vireo 23 0.96 62.50%White-throated Sparrow 40 1.67 45.83%Hermit Thrush 14 0.58 45.83%Common Yellowthroat 17 0.71 41.67%Dark-eyed Junco 16 0.67 41.67%Song Sparrow 21 0.88 37.50%Magnolia Warbler 11 0.46 37.50%Mourning Dove 9 0.38 37.50%Alder Flycatcher 17 0.71 33.33%Savannah Sparrow 16 0.67 29.17%Northern Parula 7 0.29 29.17%Yellow-rumped Warbler 7 0.29 25.00%Black-and-White Warbler 6 0.25 25.00%Purple Finch 6 0.25 25.00%Blue Jay 7 0.29 20.83%Black-throated Green Warbler 6 0.25 20.83%American Goldfinch 6 0.25 20.83%Blue-headed Vireo 5 0.21 20.83%Palm Warbler 5 0.21 16.67%Chestnut-sided Warbler 4 0.17 16.67%Black-capped Chickadee 4 0.17 12.50%Northern Flicker 3 0.13 12.50%American Redstart 3 0.13 12.50%Common Raven 4 0.17 8.33%Tree Swallow 3 0.13 8.33%Nashville Warbler 3 0.13 8.33%Swainson's Thrush 2 0.08 8.33%European Starling 24 1.00 4.17%Golden-crowned Kingle 2 0.08 4.17%Green-winged Teal 1 0.04 4.17%Osprey 1 0.04 4.17%Yellow-bellied Sapsucker 1 0.04 4.17%Pileated Woodpecker 1 0.04 4.17%Olive-sided Flycatcher 1 0.04 4.17%Yellow-bellied Flycatcher 1 0.04 4.17%Least Flycatcher 1 0.04 4.17%Red-breasted Nuthatch 1 0.04 4.17%Winter Wren 1 0.04 4.17%Ruby-crowned Kinglet 1 0.04 4.17%Blackburnian Warbler 1 0.04 4.17%Common Grackle 1 0.04 4.17%
Table 8: Abundance of Breeding Birds in Study Area by Species
greeted by Spruce grouse on Access Road to Project Area
19
mentioned previously, the Common Nighthawk, also listed as “threatened”, was detected by the acoustic recording equipment in the southwest corner of the project area.
AUTUMn MIgRATIOn
As with the spring migration, the studies of autumn migration consist of three survey components; migration stop-over, diurnal passage, and nocturnal passage.
MigRATion STop-oveR
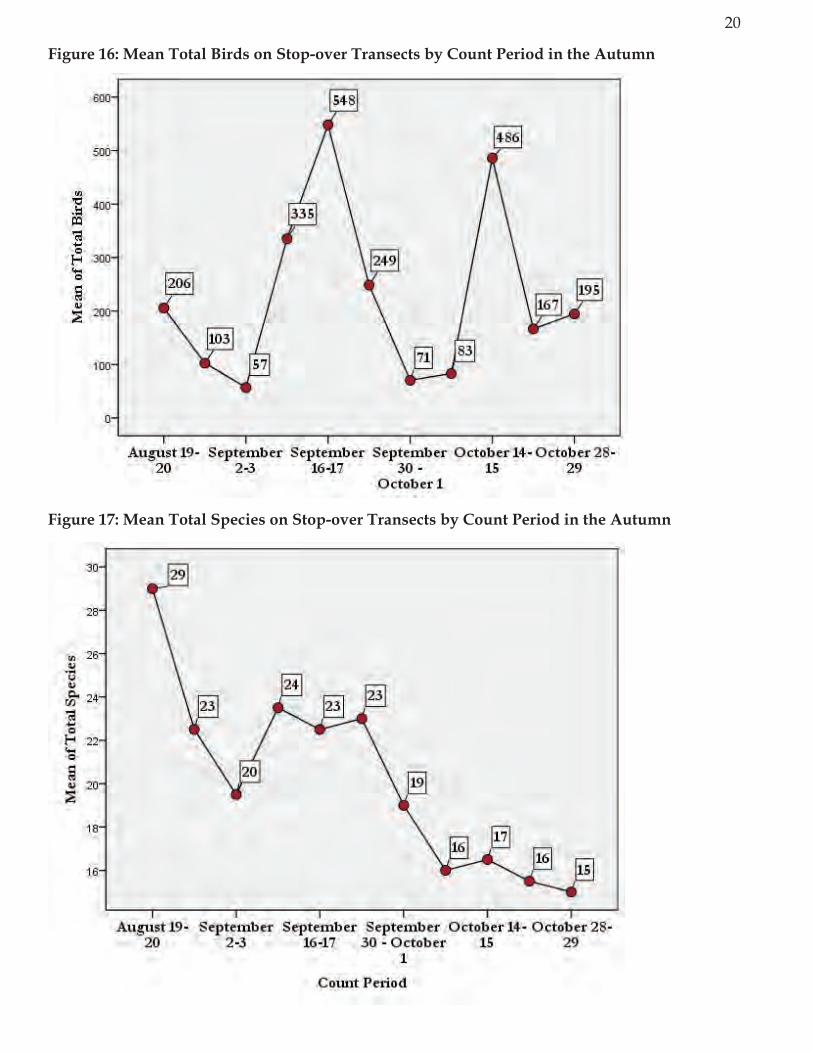
The mean total birds seen on the stop-over transects during the autumn is plotted in Figure 16. There were two peaks in the birds observed; the first during the period September 16-17 and the second on October 14-15. Despite these peaks, an analysis of variance indicates no statistically significant seasonal trend in the abundance of birds on the stop-over transects. In contrast, an analysis
Figure 15: Location of SARA “Threatened” Species Detected during the Breeding Season
20
Figure 16: Mean Total Birds on Stop-over Transects by Count Period in the Autumn
Figure 17: Mean Total Species on Stop-over Transects by Count Period in the Autumn
21
of variance indicates seasonal difference in the mean number of species on the transects in the autumn. As seen in Figure 17, there is a sharp downward trend in the number of species in the month of October.
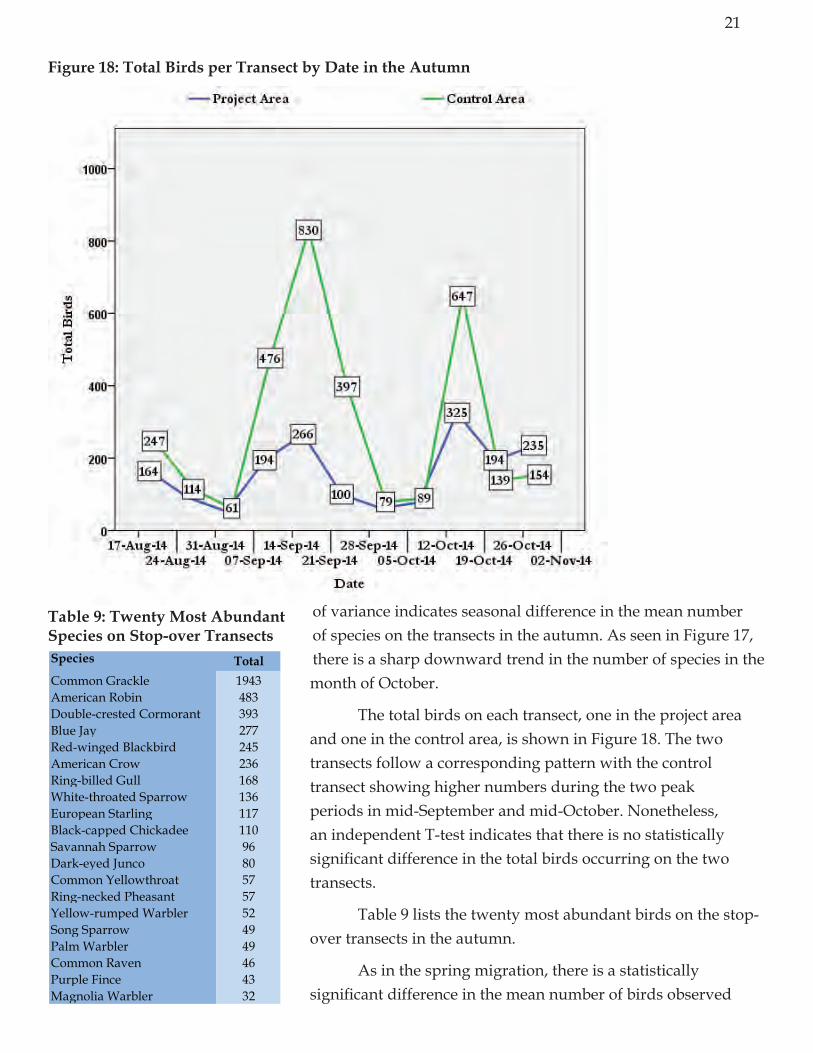
The total birds on each transect, one in the project area and one in the control area, is shown in Figure 18. The two transects follow a corresponding pattern with the control transect showing higher numbers during the two peak periods in mid-September and mid-October. Nonetheless, an independent T-test indicates that there is no statistically significant difference in the total birds occurring on the two transects.
Table 9 lists the twenty most abundant birds on the stop-over transects in the autumn.
As in the spring migration, there is a statistically significant difference in the mean number of birds observed
Figure 18: Total Birds per Transect by Date in the Autumn
Species TotalCommon Grackle 1943American Robin 483Double-crested Cormorant 393Blue Jay 277Red-winged Blackbird 245American Crow 236Ring-billed Gull 168White-throated Sparrow 136European Starling 117Black-capped Chickadee 110Savannah Sparrow 96Dark-eyed Junco 80Common Yellowthroat 57Ring-necked Pheasant 57Yellow-rumped Warbler 52Song Sparrow 49Palm Warbler 49Common Raven 46Purple Fince 43Magnolia Warbler 32
Table 9: Twenty Most Abundant Species on Stop-over Transects

22
from the transect at a distance of less than 50 meters compared to those birds seen flying over the transect. However, unlike the spring, and as seen in Figure 19, the number of birds flying over the transects is much greater than those on the ground or in the trees within 50 meters. The mean number of birds within 50 meters is 46.45 and for flying birds it is 147.09. This could indicate a high degree of diurnal passage at the time the transect lines are walked as discussed in the next section.
DiuRnAl pASSAge
Diurnal migration was much more apparent in the autumn than in the spring. Compared to a total of 26 diurnal migrants seen in the spring, there were 3,918 birds counted flying during day in the autumn. Figure 20 displays the heading of these birds. The dominant heading is northeast with 1,930 birds flying in that direction. The secondary heading is southwest with 844 birds. However a large number of these diurnal observations included Common Grackles and Red-
Figure 19: Mean Total Birds by Distance from Transect in the Autumn

23
Figure 20: heading of All Birds Flying during the Day in the Fall; n=3918
74
1930
46
155
534844
131
204
0200400600800
100012001400160018002000
N
NE
E
SE
S
SW
W
NW
3238
3
61
70
412
39
20
0
50
100
150
200
250
300
350
400
450N
NE
E
SE
S
SW
W
NW
Figure 21: heading of Diurnal Migrants in the Fall; n=675
24
9
70
43
629
20
145
0
50
100
150N
NE
E
SE
S
SW
W
NW
0-1 Hours after Sunrise; N=286
134
863
4472
21
0
50
100
150N
NE
E
SE
S
SW
W
NW
1-2 Hours after Sunrise; N=171
1 14
21
55
13
0
15
0
50
100
150N
NE
E
SE
S
SW
W
NW
2-8 Hours after Sunrise; N=101
Figure 22: heading of nocturnal Migrants by Time of Day in the Autumn
25
winged Blackbirds. Although these two species are diurnal migrants, their movements largely to the northeast in the early morning suggests that they were moving from a night time roost in the Amherst marshes to feed in agricultural lands in the surrounding areas. A further factor to consider is the number of birds that are nocturnal migrants that are terminating or re-orienting their flights in the early morning hours.
Figure 21 shows the flight heading of those species of birds that are primarily diurnal migrants and excludes blackbirds and nocturnal migrants from the analysis. Here the pre-dominant direction is southwest; a heading appropriate for diurnal migration in the autumn.
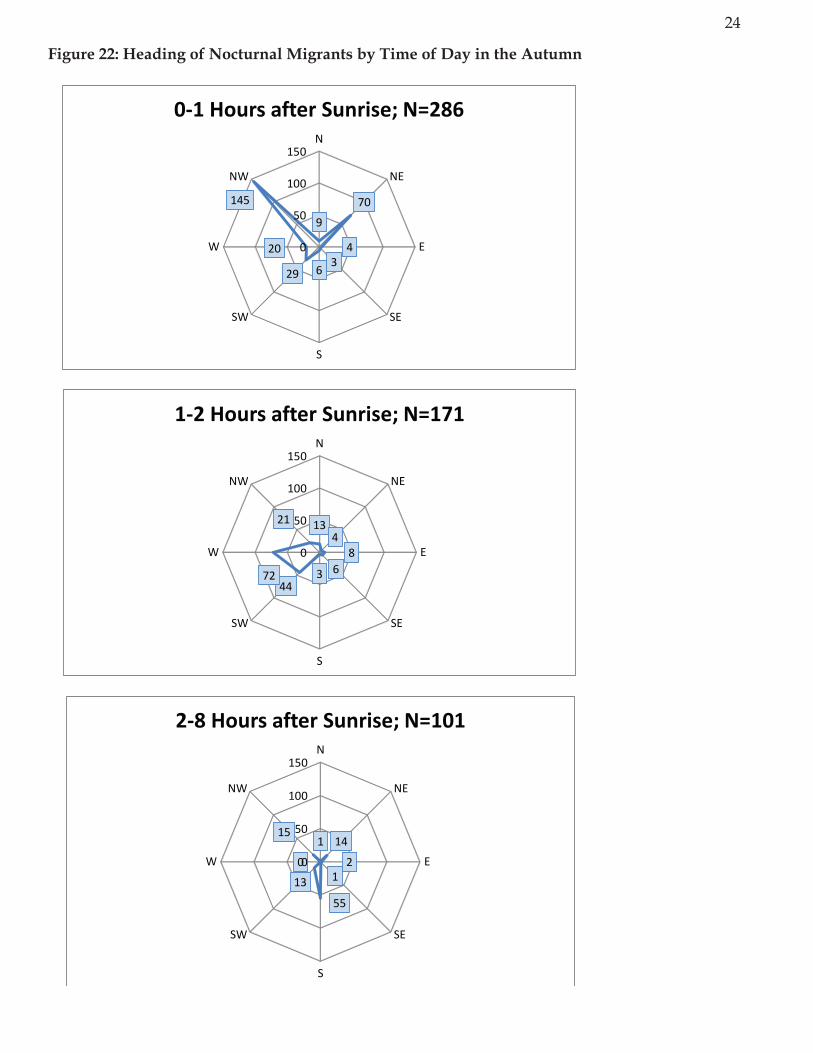
Figure 22 displays the heading of nocturnal migrants by time of day. In the first hour after sunrise, the primary heading is northwest, in the second hour it is west, and for the next 7 hours it is south. There is a corresponding decrease in the number of nocturnal migrants seen during those time categories from 286 to 171 to 101. This pattern indicates an early morning re-orientation of nocturnal migrants to the northwest, backing in the next hour to west and southwest.
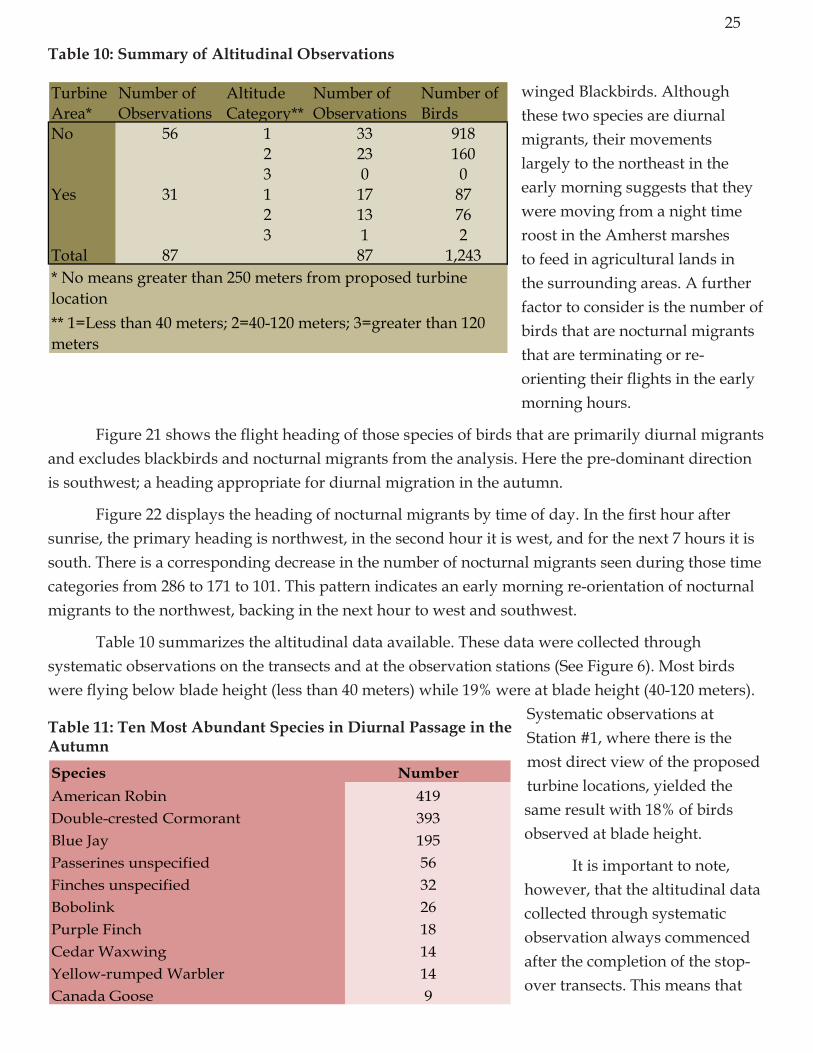
Table 10 summarizes the altitudinal data available. These data were collected through systematic observations on the transects and at the observation stations (See Figure 6). Most birds were flying below blade height (less than 40 meters) while 19% were at blade height (40-120 meters).
Systematic observations at Station #1, where there is the most direct view of the proposed turbine locations, yielded the same result with 18% of birds observed at blade height.
It is important to note, however, that the altitudinal data collected through systematic observation always commenced after the completion of the stop-over transects. This means that
Turbine Number of Altitude Number of Number ofArea* Observations Category** Observations BirdsNo 56 1 33 918
2 23 1603 0 0
Yes 31 1 17 872 13 763 1 2
Total 87 87 1,243* No means greater than 250 meters from proposed turbine location** 1=Less than 40 meters; 2=40-120 meters; 3=greater than 120 meters
Table 10: Summary of Altitudinal Observations
Table 11: Ten Most Abundant Species in Diurnal Passage in the AutumnSpecies numberAmerican Robin 419Double-crested Cormorant 393Blue Jay 195Passerines unspecified 56Finches unspecified 32Bobolink 26Purple Finch 18Cedar Waxwing 14Yellow-rumped Warbler 14Canada Goose 9
26
the observations do not include data for the first 1.5 to 2 hours after sunrise when diurnal migration was the most intense. Random notes on flight altitudes during the first 1.5 hours
after sunrise show two flocks of grackes, one of 180 birds and another of 670 birds, flying at 40-120 meters on September 16 and 17 respectively. Another common diurnal migrant in the early morning, the Double-crested Cormorant would also fly at the 40-120 meter altitude category.
Table 11 lists the ten most abundant species in diurnal passage (excludes local non-migrating birds)
noCTuRnAl pASSAge
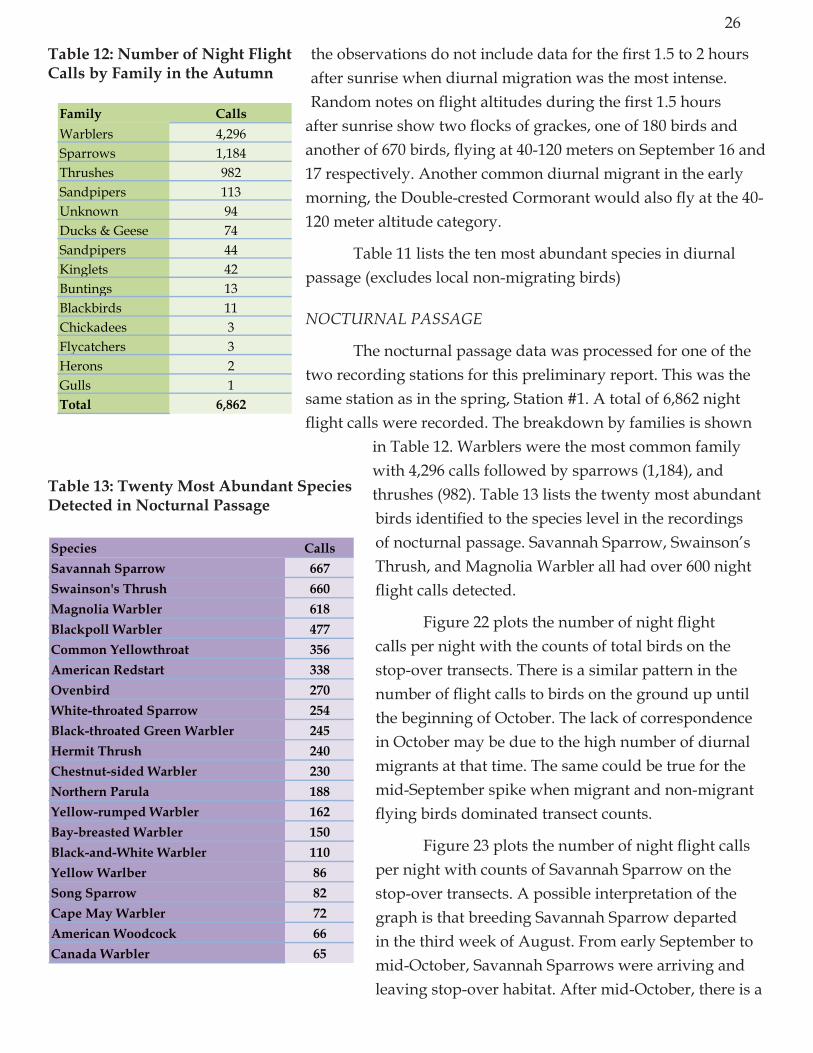
The nocturnal passage data was processed for one of the two recording stations for this preliminary report. This was the same station as in the spring, Station #1. A total of 6,862 night flight calls were recorded. The breakdown by families is shown
in Table 12. Warblers were the most common family with 4,296 calls followed by sparrows (1,184), and thrushes (982). Table 13 lists the twenty most abundant birds identified to the species level in the recordings of nocturnal passage. Savannah Sparrow, Swainson’s Thrush, and Magnolia Warbler all had over 600 night flight calls detected.
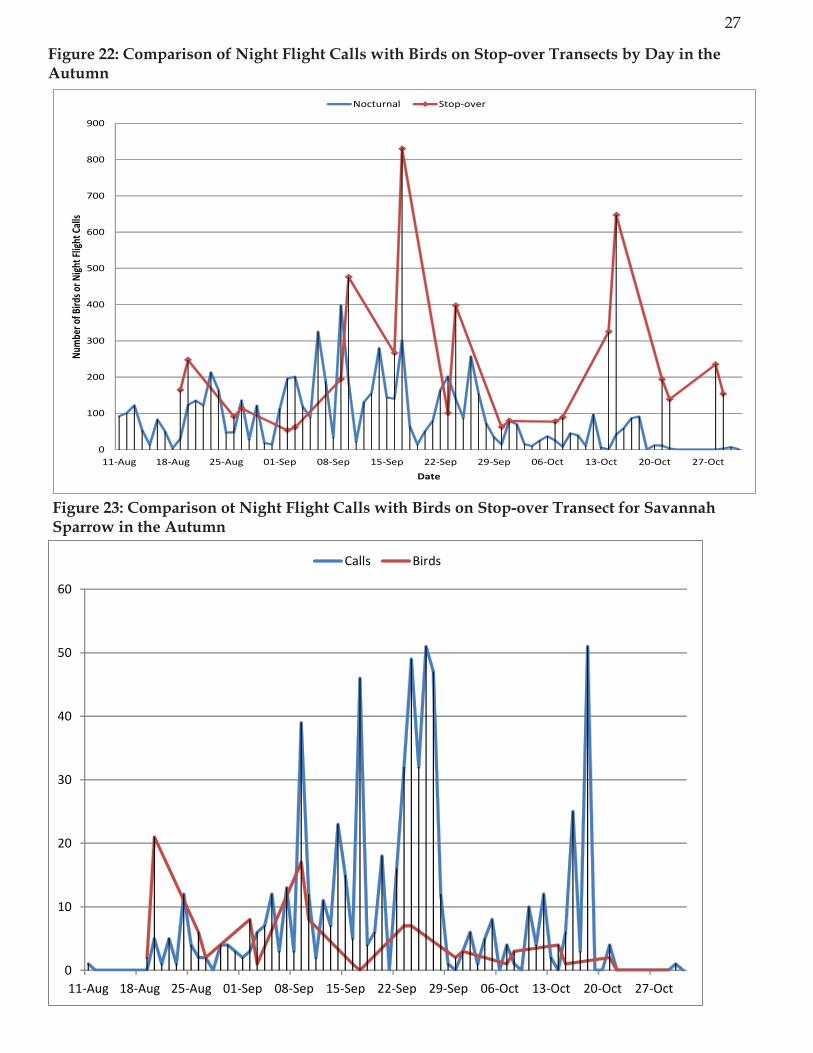
Figure 22 plots the number of night flight calls per night with the counts of total birds on the stop-over transects. There is a similar pattern in the number of flight calls to birds on the ground up until the beginning of October. The lack of correspondence in October may be due to the high number of diurnal migrants at that time. The same could be true for the mid-September spike when migrant and non-migrant flying birds dominated transect counts.
Figure 23 plots the number of night flight calls per night with counts of Savannah Sparrow on the stop-over transects. A possible interpretation of the graph is that breeding Savannah Sparrow departed in the third week of August. From early September to mid-October, Savannah Sparrows were arriving and leaving stop-over habitat. After mid-October, there is a
Family CallsWarblers 4,296Sparrows 1,184Thrushes 982Sandpipers 113Unknown 94Ducks & Geese 74Sandpipers 44Kinglets 42Buntings 13Blackbirds 11Chickadees 3Flycatchers 3Herons 2Gulls 1Total 6,862
Table 12: number of night Flight Calls by Family in the Autumn
Species CallsSavannah Sparrow 667Swainson's Thrush 660Magnolia Warbler 618Blackpoll Warbler 477Common yellowthroat 356American Redstart 338Ovenbird 270White-throated Sparrow 254Black-throated green Warbler 245hermit Thrush 240Chestnut-sided Warbler 230northern Parula 188yellow-rumped Warbler 162Bay-breasted Warbler 150Black-and-White Warbler 110yellow Warlber 86Song Sparrow 82Cape May Warbler 72American Woodcock 66Canada Warbler 65
Table 13: Twenty Most Abundant Species Detected in nocturnal Passage
27
Figure 23: Comparison ot night Flight Calls with Birds on Stop-over Transect for Savannah Sparrow in the Autumn
0
10
20
30
40
50
60
11-Aug 18-Aug 25-Aug 01-Sep 08-Sep 15-Sep 22-Sep 29-Sep 06-Oct 13-Oct 20-Oct 27-Oct
Calls Birds
0
100
200
300
400
500
600
700
800
900
11-Aug 18-Aug 25-Aug 01-Sep 08-Sep 15-Sep 22-Sep 29-Sep 06-Oct 13-Oct 20-Oct 27-Oct
Num
ber o
f Bird
s or N
ight F
light
Calls
Date
Nocturnal Stop-over
Figure 22: Comparison of night Flight Calls with Birds on Stop-over Transects by Day in the Autumn
28
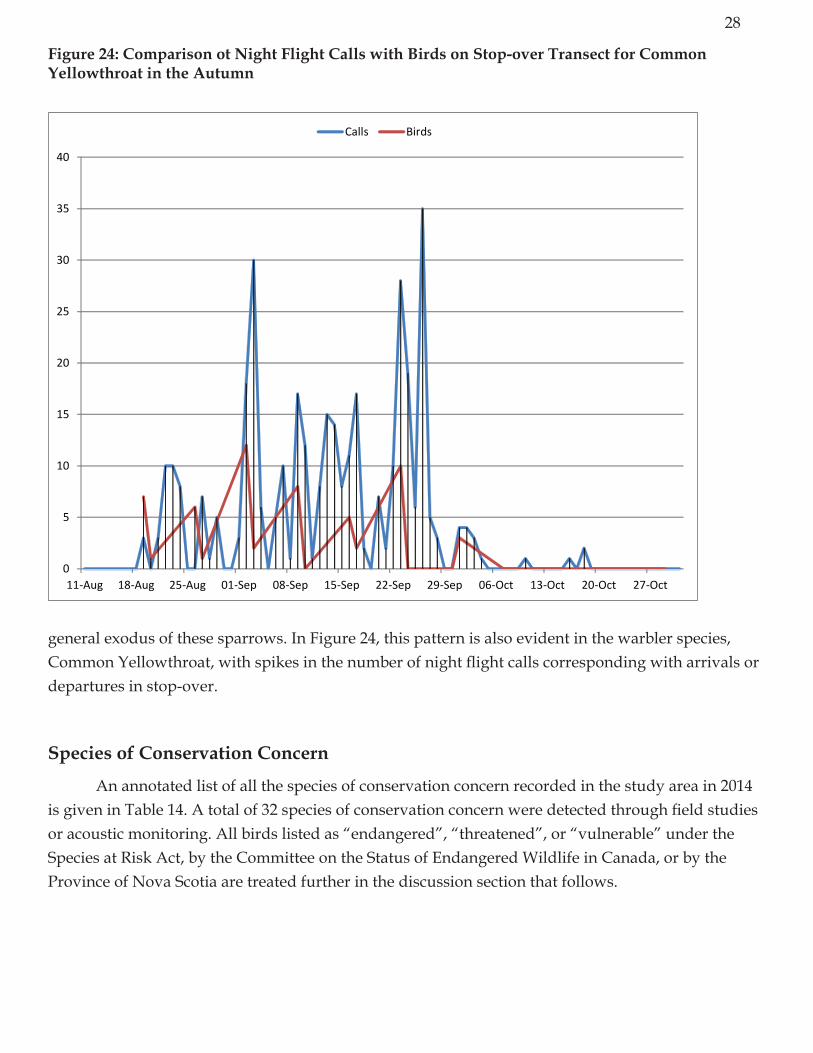
general exodus of these sparrows. In Figure 24, this pattern is also evident in the warbler species, Common Yellowthroat, with spikes in the number of night flight calls corresponding with arrivals or departures in stop-over.
Species of Conservation Concern
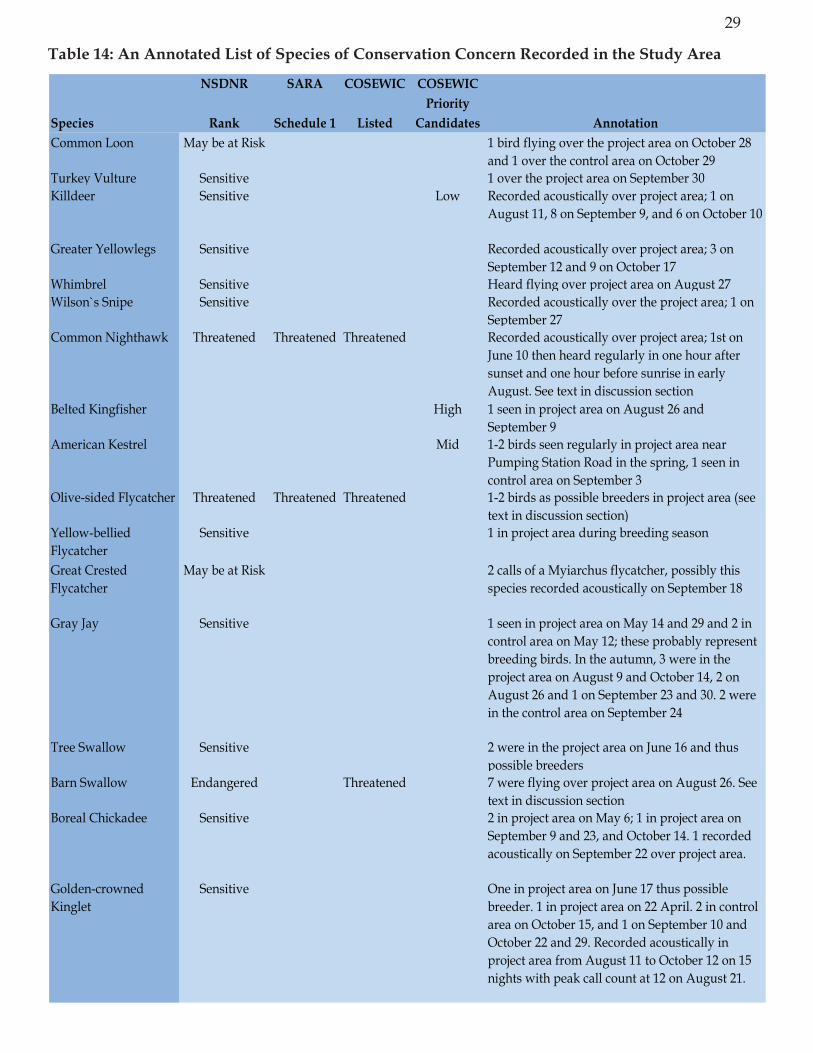
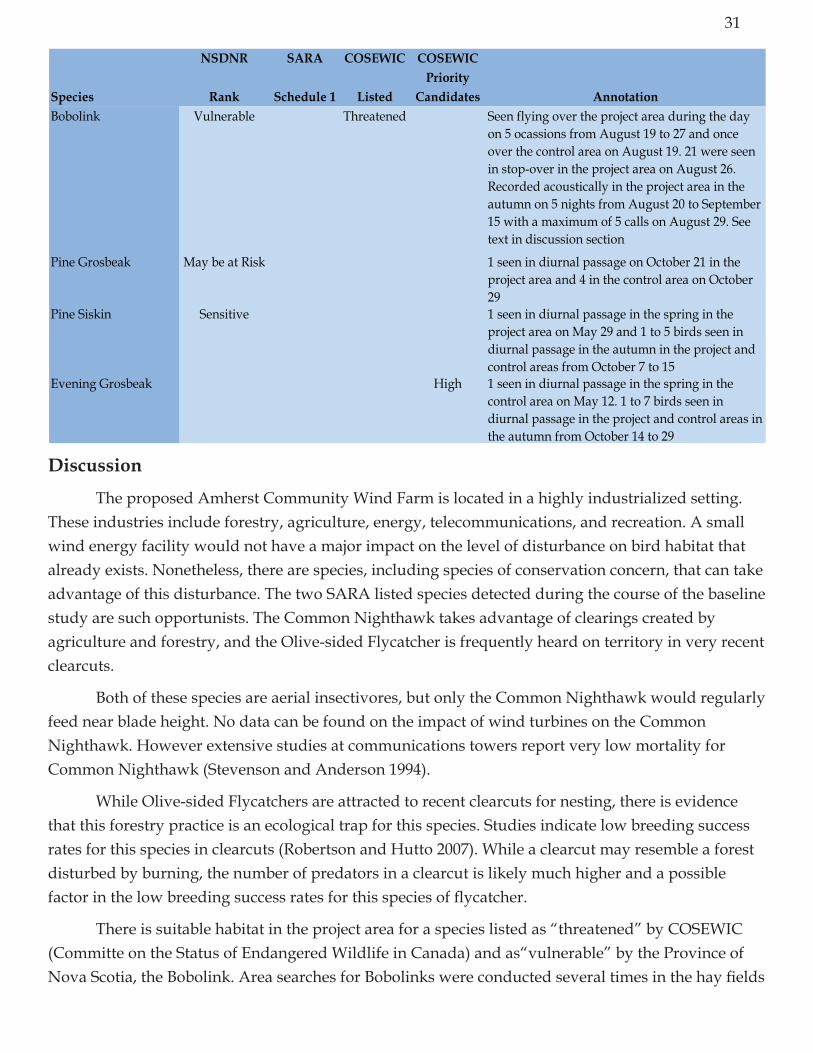
An annotated list of all the species of conservation concern recorded in the study area in 2014 is given in Table 14. A total of 32 species of conservation concern were detected through field studies or acoustic monitoring. All birds listed as “endangered”, “threatened”, or “vulnerable” under the Species at Risk Act, by the Committee on the Status of Endangered Wildlife in Canada, or by the Province of Nova Scotia are treated further in the discussion section that follows.
0
5
10
15
20
25
30
35
40
11-Aug 18-Aug 25-Aug 01-Sep 08-Sep 15-Sep 22-Sep 29-Sep 06-Oct 13-Oct 20-Oct 27-Oct
Calls Birds
Figure 24: Comparison ot night Flight Calls with Birds on Stop-over Transect for Common yellowthroat in the Autumn
29
Table 14: An Annotated List of Species of Conservation Concern Recorded in the Study Area
nSDnR SARA COSEWIC COSEWICPriority
Species Rank Schedule 1 Listed Candidates AnnotationCommon Loon May be at Risk 1 bird flying over the project area on October 28
and 1 over the control area on October 29Turkey Vulture Sensitive 1 over the project area on September 30Killdeer Sensitive Low Recorded acoustically over project area; 1 on
August 11, 8 on September 9, and 6 on October 10
Greater Yellowlegs Sensitive Recorded acoustically over project area; 3 on September 12 and 9 on October 17
Whimbrel Sensitive Heard flying over project area on August 27Wilson`s Snipe Sensitive Recorded acoustically over the project area; 1 on
September 27Common Nighthawk Threatened Threatened Threatened Recorded acoustically over project area; 1st on
June 10 then heard regularly in one hour after sunset and one hour before sunrise in early August. See text in discussion section
Belted Kingfisher High 1 seen in project area on August 26 and September 9
American Kestrel Mid 1-2 birds seen regularly in project area near Pumping Station Road in the spring, 1 seen in control area on September 3
Olive-sided Flycatcher Threatened Threatened Threatened 1-2 birds as possible breeders in project area (see text in discussion section)
Yellow-bellied Flycatcher
Sensitive 1 in project area during breeding season
Great Crested Flycatcher
May be at Risk 2 calls of a Myiarchus flycatcher, possibly this species recorded acoustically on September 18
Gray Jay Sensitive 1 seen in project area on May 14 and 29 and 2 in control area on May 12; these probably represent breeding birds. In the autumn, 3 were in the project area on August 9 and October 14, 2 on August 26 and 1 on September 23 and 30. 2 were in the control area on September 24
Tree Swallow Sensitive 2 were in the project area on June 16 and thus possible breeders
Barn Swallow Endangered Threatened 7 were flying over project area on August 26. See text in discussion section
Boreal Chickadee Sensitive 2 in project area on May 6; 1 in project area on September 9 and 23, and October 14. 1 recorded acoustically on September 22 over project area.
Golden-crowned Kinglet
Sensitive One in project area on June 17 thus possible breeder. 1 in project area on 22 April. 2 in control area on October 15, and 1 on September 10 and October 22 and 29. Recorded acoustically in project area from August 11 to October 12 on 15 nights with peak call count at 12 on August 21.

30
nSDnR SARA COSEWIC COSEWICPriority
Species Rank Schedule 1 Listed Candidates AnnotationRuby-crowned Kinglet Sensitive 1 in project area during breeding season on June
19Wood Thrush Undetermined Threatened 1 recorded acoustically in project area on
September 2. See text in discussion sectionTennessee Warbler Sensitive Recorded acoustically in project area on 7 nights
from September 2-17 with a maximum of 2 calls per night on September 4
Cape May Warbler Sensitive 1 seen in control area on May 27. Recorded acoustically in project area on 23 nights from August 11 to September 25. A total of 72 calls with a maximum of 11 in a night on September 12
Bay-breasted Warbler Sensitive 1 seen in control area on May 12. Recorded acoustically in project area in the spring on June 2. Recorded acoustically in the project area in the autumn on 41 nights from August 11 to September 28. Maximum call count of 12 on September 14.
Blackpoll Warbler Sensitive 3 seen in project area on September 16 and 2 on September 23. 1 seen in control area on May 27, September 9, and October 1. Recorded acoustically in project area in spring on 4 nights from May 25 to June 3 with a maximum of 2 calls on June 3. Recorded acoustically in the project area in autumn from August 16 to October 10 with a total of 477 flight calls with the maximun of 56 calls on September 14
Canada Warbler Endangered Threatened Threatened Recorded acoustically in the project area in the autumn on 22 nights from August 11 to September 17 with a total of 65 calls and a peak of 11 calls on August 23. See text in discussion section
Wilson's Warbler Sensitive 1 seen in the control area on September 3. Recorded acoustically in the project area in the spring with on 1 call on June 3 and on 14 nights in the autumn from August 16 to September 27 with a peak call count of 5 on August 23
Vesper Sparrow May be at Risk Recorded acoustically in the project area on September 10 and 17 with 1 call each night
Rose-breasted Grosbeak
Sensitive 1 seen in the control area on May 27. Recorded acoustically in the project area in the autumn with one call on six nights from September 1 to 23.
Indigo Bunting Undetermined Recorded acoustically in the project area with one call on the nights of August 21 and October 22
31
Discussion
The proposed Amherst Community Wind Farm is located in a highly industrialized setting. These industries include forestry, agriculture, energy, telecommunications, and recreation. A small wind energy facility would not have a major impact on the level of disturbance on bird habitat that already exists. Nonetheless, there are species, including species of conservation concern, that can take advantage of this disturbance. The two SARA listed species detected during the course of the baseline study are such opportunists. The Common Nighthawk takes advantage of clearings created by agriculture and forestry, and the Olive-sided Flycatcher is frequently heard on territory in very recent clearcuts.
Both of these species are aerial insectivores, but only the Common Nighthawk would regularly feed near blade height. No data can be found on the impact of wind turbines on the Common Nighthawk. However extensive studies at communications towers report very low mortality for Common Nighthawk (Stevenson and Anderson 1994).
While Olive-sided Flycatchers are attracted to recent clearcuts for nesting, there is evidence that this forestry practice is an ecological trap for this species. Studies indicate low breeding success rates for this species in clearcuts (Robertson and Hutto 2007). While a clearcut may resemble a forest disturbed by burning, the number of predators in a clearcut is likely much higher and a possible factor in the low breeding success rates for this species of flycatcher.
There is suitable habitat in the project area for a species listed as “threatened” by COSEWIC (Committe on the Status of Endangered Wildlife in Canada) and as“vulnerable” by the Province of Nova Scotia, the Bobolink. Area searches for Bobolinks were conducted several times in the hay fields
nSDnR SARA COSEWIC COSEWICPriority
Species Rank Schedule 1 Listed Candidates AnnotationBobolink Vulnerable Threatened Seen flying over the project area during the day
on 5 ocassions from August 19 to 27 and once over the control area on August 19. 21 were seen in stop-over in the project area on August 26. Recorded acoustically in the project area in the autumn on 5 nights from August 20 to September 15 with a maximum of 5 calls on August 29. See text in discussion section
Pine Grosbeak May be at Risk 1 seen in diurnal passage on October 21 in the project area and 4 in the control area on October 29
Pine Siskin Sensitive 1 seen in diurnal passage in the spring in the project area on May 29 and 1 to 5 birds seen in diurnal passage in the autumn in the project and control areas from October 7 to 15
Evening Grosbeak High 1 seen in diurnal passage in the spring in the control area on May 12. 1 to 7 birds seen in diurnal passage in the project and control areas in the autumn from October 14 to 29
32
of the project area but none were found. These fields did provide stop-over habitat in the autumn migration, with a flock of 21 of these birds seen on August 26. Small numbers of Bobolinks were also detected in diurnal and nocturnal passage in late August to mid-September.
There is suitable habitat for another species listed as “endangered” by the Province of Nova Scotia and “threatened” by COSEWIC, the Barn Swallow. Area searches turned up no Barn Swallows during the breeding season for this species in the project or control area. A flock of seven Barn Swallows was seen flying over the study area in the autumn on August 26.
The acoustic monitoring of nocturnal passage recorded one Wood Thrush flying over the project area on September 2. This species is listed as “threatened” by COSEWIC.
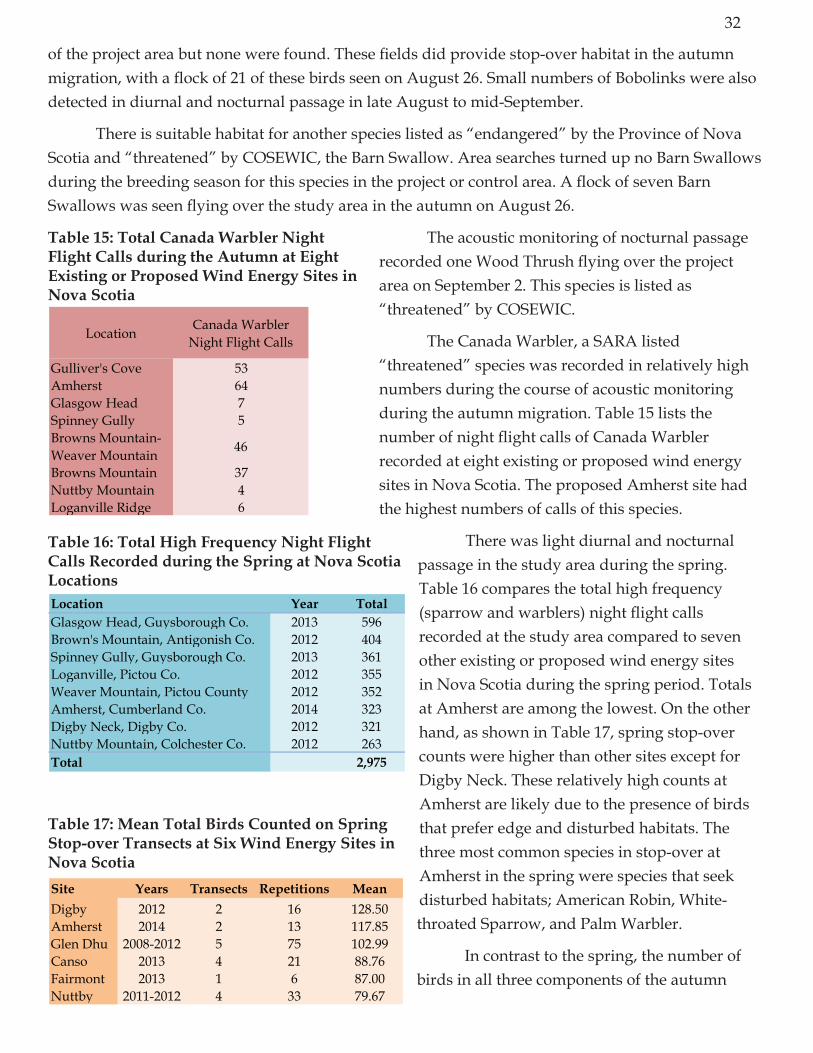
The Canada Warbler, a SARA listed “threatened” species was recorded in relatively high numbers during the course of acoustic monitoring during the autumn migration. Table 15 lists the number of night flight calls of Canada Warbler recorded at eight existing or proposed wind energy sites in Nova Scotia. The proposed Amherst site had the highest numbers of calls of this species.
There was light diurnal and nocturnal passage in the study area during the spring. Table 16 compares the total high frequency (sparrow and warblers) night flight calls recorded at the study area compared to seven other existing or proposed wind energy sites in Nova Scotia during the spring period. Totals at Amherst are among the lowest. On the other hand, as shown in Table 17, spring stop-over counts were higher than other sites except for Digby Neck. These relatively high counts at Amherst are likely due to the presence of birds that prefer edge and disturbed habitats. The three most common species in stop-over at Amherst in the spring were species that seek disturbed habitats; American Robin, White-throated Sparrow, and Palm Warbler.
In contrast to the spring, the number of birds in all three components of the autumn
Table 15: Total Canada Warbler night Flight Calls during the Autumn at Eight Existing or Proposed Wind Energy Sites in nova Scotia
Location Canada Warbler Night Flight Calls
Gulliver's Cove 53Amherst 64Glasgow Head 7Spinney Gully 5Browns Mountain-Weaver Mountain 46
Browns Mountain 37Nuttby Mountain 4Loganville Ridge 6
Table 16: Total high Frequency night Flight Calls Recorded during the Spring at nova Scotia LocationsLocation year TotalGlasgow Head, Guysborough Co. 2013 596Brown's Mountain, Antigonish Co. 2012 404Spinney Gully, Guysborough Co. 2013 361Loganville, Pictou Co. 2012 355Weaver Mountain, Pictou County 2012 352Amherst, Cumberland Co. 2014 323Digby Neck, Digby Co. 2012 321Nuttby Mountain, Colchester Co. 2012 263Total 2,975
Table 17: Mean Total Birds Counted on Spring Stop-over Transects at Six Wind Energy Sites in nova ScotiaSite years Transects Repetitions MeanDigby 2012 2 16 128.50Amherst 2014 2 13 117.85Glen Dhu 2008-2012 5 75 102.99Canso 2013 4 21 88.76Fairmont 2013 1 6 87.00Nuttby 2011-2012 4 33 79.67

33
migration surveys was high; stop-over, nocturnal passage, and diurnal passage. Table 18 compares stop-over counts and nocturnal passage recordings at eight existing or proposed wind energy sites in Nova Scotia. The stop-over counts in Amherst approached the high counts at Digby Neck in mean total birds and were on a par with that location for the percentage of birds that were in flight in the morning. For nocturnal migration, Amherst was in the middle range of total and mean number of high frequency night flight calls.
The large number of birds in the air over the Amherst site in first two hours of the day consisted of three components; true diurnal migrants, re-orienting nocturnal migrants, and non-migratory movements to local feeding areas. The inappropriate direction of the nocturnal migrants in the early morning is consistent with the reports of Van Doren et al. (2014) and support the view of re-orientation over the study area. The American Robin was dominant in this group. The non-migratory movements were primarily large flocks of Common Grackles and Red-winged Blackbirds. Some of these flocks could also have been engaged in diurnal passage. Most diurnal migration was represented by Double-crested Cormorants, Blue Jays, and winter finches.
Towards a Final Report
The final report will include an analysis of the use of habitats within the study area by birds during the breeding season and during migration stop-over. In addition the effects of weather on stop-over, diurnal passage, and nocturnal passage will be examined using weather data collected at the wind energy site by the proponents, Mi’Kmaq Wind4All, and data available through Environment Canada.
It will be useful in the final report to include a further analysis of bird flights in the first two hours of the autumn mornings, incorporating radar and weather data. In addition, a combined radar and acoustic study in the spring of 2015 would fill an existing gap in the baseline study.
Table 18: Comparison of Stop-over Counts and high Frequency night Fligh Call Counts at Eight Sites in nova Scotia
Location County Distance from Coast
Mean Birds/Day
% Flying Year Calls/ Season Mean/
night* Year
Gulliver's Cove Digby <1 km 286 65 2012 10,002 213 2011Amherst Cumberland 7 km 227 65 2014 5,504 85 2014Glasgow Head Guysborough <1 km 2,016 94 2013Spinney Gully Guysborough <1 km 1,383 21 2013Browns Mountain-Weaver Mountain
Antigonish- Pictou 12-16 km 79 21 2008 7,899 152 2011
Browns Mountain Antigonish 12 km 54 11 2011-2012 4,529 - 2011Nuttby Mountain Colchester 20 km 48 14 2011-2012 1,271 - 2011Loganville Ridge Pictou 14 km - - 2011 2,095 - 2011* September 2 to October 15
107 34 2013
Stop-over Transects Acoustic Recordings
34
References
Atlantic Canada Conservation Data Centre. 2014. Data Report 5212: Amherst, NS. edited by Data
Manager Prepared by J. Churchill.
Bird Studies Canada, Environment Canada-Canadian Wildlife Service, New Brunswick Department
of Natural Resources, Nova Scotia Department of Natural Resources, and Prince Edward
Island Department of Agriculture and Forestry. 2012. “Maritimes Breeding Bird Atlas
Database.” http://www.mba-aom.ca/.
Boyer, George F. 1972. Birds of the Border Region, Canadian Wildlife Service Ocassional Paper No. 8.
Ottawa: Canadian Wildlife Service.
Robertson, Bruce A., and Richard L. Hutto. 2007. “Is Selectively Harvested Forest an Ecological Trap
for Olive-sided Flycatchers.” The Condor 109:109-121.
Stevenson, H. M., and B.H. Anderson. 1994. The birdlife of Florida. Gainesville: University Presses of
Florida.
Van Doren, Benjamin M., Daniel Sheldon, Jeffrey Geevarghese, Wesley M. Hochachka, and Andrew
Farnsworth. 2014. “Autumn morning flights of migrant songbirds in the northeastern United
States are linked to nocturnal migration and winds aloft.” The Auk 132 (1):105-118.
Acknowlegements
Cover photo of Gray Jay by Jeff Skevington, Creative Commons Licence, Attribution, 2.0 Generic
Photo on page 17 of Common Nighthawk by Paul Hurtado, Creative Commons Licence, Attribution-
ShareAlike, 2.0 Generic
Other photos and figures by John Kearney.
This document conforms to Google Earth policies for commercial use:
http://www.google.com/permissions/geoguidelines.html.

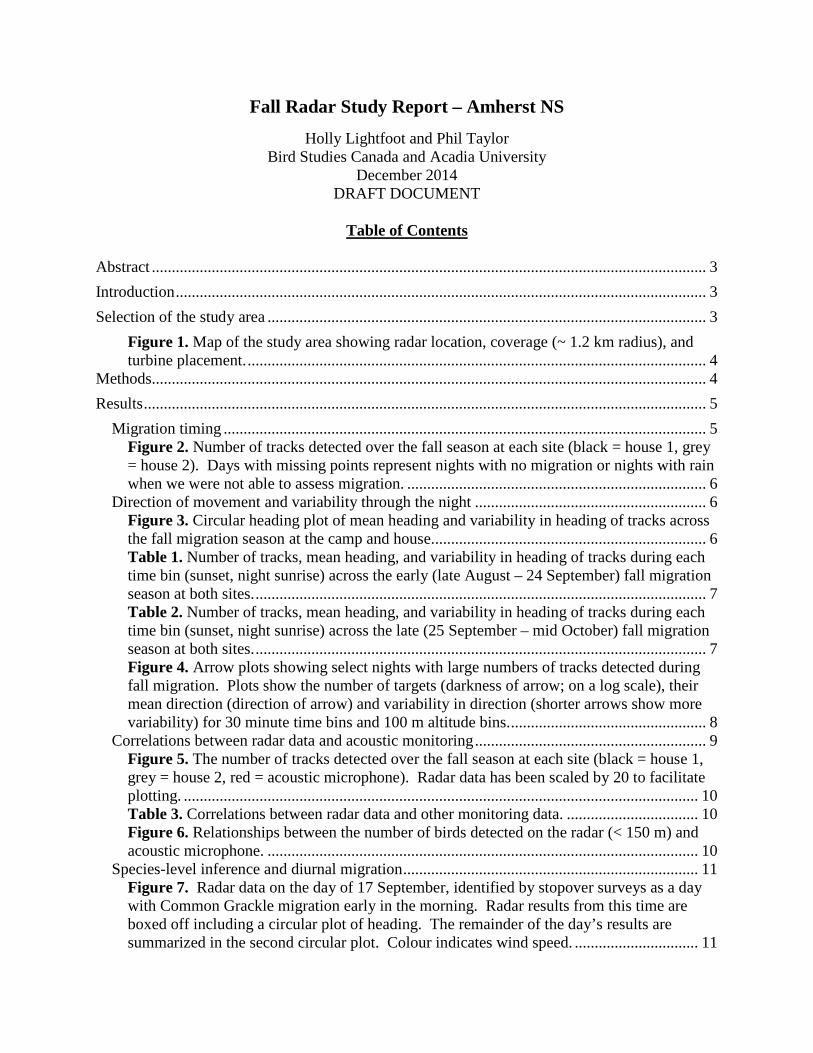
Fall Radar Study Report – Amherst NS
Holly Lightfoot and Phil Taylor Bird Studies Canada and Acadia University
December 2014 DRAFT DOCUMENT
Table of Contents
Abstract ........................................................................................................................................... 3
Introduction ..................................................................................................................................... 3
Selection of the study area .............................................................................................................. 3
Figure 1. Map of the study area showing radar location, coverage (~ 1.2 km radius), and turbine placement. ................................................................................................................... 4
Methods........................................................................................................................................... 4
Results ............................................................................................................................................. 5
Migration timing ......................................................................................................................... 5 Figure 2. Number of tracks detected over the fall season at each site (black = house 1, grey = house 2). Days with missing points represent nights with no migration or nights with rain when we were not able to assess migration. ........................................................................... 6
Direction of movement and variability through the night .......................................................... 6 Figure 3. Circular heading plot of mean heading and variability in heading of tracks across the fall migration season at the camp and house..................................................................... 6 Table 1. Number of tracks, mean heading, and variability in heading of tracks during each time bin (sunset, night sunrise) across the early (late August – 24 September) fall migration season at both sites. ................................................................................................................. 7 Table 2. Number of tracks, mean heading, and variability in heading of tracks during each time bin (sunset, night sunrise) across the late (25 September – mid October) fall migration season at both sites. ................................................................................................................. 7 Figure 4. Arrow plots showing select nights with large numbers of tracks detected during fall migration. Plots show the number of targets (darkness of arrow; on a log scale), their mean direction (direction of arrow) and variability in direction (shorter arrows show more variability) for 30 minute time bins and 100 m altitude bins. ................................................. 8
Correlations between radar data and acoustic monitoring .......................................................... 9 Figure 5. The number of tracks detected over the fall season at each site (black = house 1, grey = house 2, red = acoustic microphone). Radar data has been scaled by 20 to facilitate plotting. ................................................................................................................................. 10 Table 3. Correlations between radar data and other monitoring data. ................................. 10 Figure 6. Relationships between the number of birds detected on the radar (< 150 m) and acoustic microphone. ............................................................................................................ 10
Species-level inference and diurnal migration .......................................................................... 11 Figure 7. Radar data on the day of 17 September, identified by stopover surveys as a day with Common Grackle migration early in the morning. Radar results from this time are boxed off including a circular plot of heading. The remainder of the day’s results are summarized in the second circular plot. Colour indicates wind speed. ............................... 11
Figure 8. Radar data on the day of 14 October, identified by stopover surveys as a day with American Robin migration early in the morning. ................................................................. 12
Effects of weather on number of targets detected, heading and variability in heading ............ 12 Figure 9. Full model-averaged coefficients from candidate models assessing the association of weather variables with number of targets detected (log), and variance in heading through at sunset, night, and sunrise. Size of the points is scaled on the importance value calculated from model averaging (on a scale of 0-1). ................................................. 13 Table 4. Mean wind direction at each time period for each night binned by direction........ 14
Discussion ..................................................................................................................................... 14
Migration timing ....................................................................................................................... 14 Direction of movement and variability in heading through the night ....................................... 15 Correlations between radar data and acoustic monitoring ........................................................ 16 Species-level inference and diurnal migration .......................................................................... 16 Effects of weather on number of targets detected and variability in heading ........................... 16 Assessment of risk .................................................................................................................... 17
Future Work .................................................................................................................................. 17
Literature Cited ............................................................................................................................. 18
Appendix 1: Blip filtering settings used to remove clutter. ......................................................... 19
Appendix 2: Number of tracks detected over the 2010 fall season at each site ........................... 19
Appendix 3: Circular plots at each site surveyed during the 2010 fall season. ........................... 20
Abstract Here we present nocturnal results from a fall migration study conducted in Amherst NS. Two 12.5 kW Furuno radars modified to record bird migration were operated from late August to present at two locations adjacent to the proposed Amherst Community Wind Farm. This report presents data collected from late August to mid-October for both sites. A full report including the rest of late fall migration and a more detailed analysis of diurnal migration will follow at a later date; however, data presented here likely represents the bulk of migration in this area.
Introduction We recorded the movement of biological targets (likely primarily birds) in the airspace in and around a proposed wind farm in the Amherst area of Nova Scotia. We collected data continuously from two modified marine radars over the fall of 2014, and have analysed these data to describe the volume, direction, and altitude of migration of presumed bird targets, and the relationship between those variables and weather. Our focus is on nocturnal migrants, and as such, we have primarily analyzed data collected between the hours of sunset and sunrise. However, we do provide some assessment of diurnal movement during times identified through stopover surveys. Further, to provide additional information about species specific passage rates, we also correlate radar data with data collected from acoustic sensors (collected and processed by John Kearney). Finally, we interpret these data in light of possible movements through the site of the proposed wind farm project area, and provide our view of the relative risk of the proposed development to bird migration in the area.
Selection of the study area Due to logistical constraints (lack of electricity and site security) it was impossible to operate the radars immediately at the project site. However, two private homes close to the proposed wind farm site were chosen due to proximity to the site and support of homeowners. House 1, situated on NS Highway 6 (45.846173°, -64.154015°), is approximately 1.4 km from the closest proposed turbine location and House 2, located on Pumping Station Road (45.824016°, -64.135886°), is approximately 1 km from the closest proposed turbine location. The proximity of these two sites to the proposed wind farm location provides excellent information on the general pattern of migration in the area and can be used to infer the pattern of passage at the project site itself (Figure 1). Furthermore, the sweep of the radar at House 1 covers a portion of the airspace above the project area.

Figure 1. Map of the study area showing radar location, coverage (~ 1.2 km radius), and turbine placement.
Methods
Two Furuno 1954C-BB (Camas, Washington, USA) X-band (3-cm wavelength) marine radars were set-up in late summer 2014. The radar antennas made a complete 360° revolution (a scan) every 2.4 sec. At both sites, for most of the season, the radars were set at a fixed angle of 25°. All output from the radar was processed using a digitizing card (Sigma Sd, Rutter Technologies Inc., NL ) and recorded using radR, an open source, R-based platform (
Equipment
www.radr-project.org, Taylor et al. 2010). All data (date, time, and location in space) on targets (“blips”) detected by the radar were stored in blip movie files for later processing (see Taylor et al. 2010 for details).
All recorded movies were filtered to remove clutter (e.g. spurious information from incoming radar signals, reflections due to rain, and backscatter from surrounding vegetation) using program radR (see
Data filtering and processing:
http://radr-project.org; Appendix 1). We also employed radR’s declutter filter to develop site specific declutter files and applied them using a threshold occupancy value of 0.03, to remove the persisting ground clutter. Following clutter removal a multi-frame correspondence tracking algorithm (MFC tracker; Shafique and Shah 2005) implemented in radR (Taylor et al. 2010) was used to link successive
detections of the same target to create ‘tracks’. Tracks provide information on the direction of travel and speed of targets. Typically, small marine radars with a 3 cm wavelength detect insects as well as birds. However, examination of radar cross section and flight speed (commonly used for filtering out insects) did not show any obvious clustering that would allow for easy separation of the two types of biological targets. As such, we did not employ additional filtering to remove insect tracks and so it should be recognized that some of the targets recorded by the radar are likely from insects. Weather data (wind speed and direction, pressure, temperature, and humidity) were acquired from the tower at the proposed project site (Natural Forces).
Data were first summarized by grouping by one or more of four variables: location, time of night, season, and altitude, depending on the focus of the analyses. To examine the general direction of movement and variability in movement at the two sites, data were grouped based migratory direction and split based on time of year. We split the season into early (start of recording – 24 September) and late (25 September – end of recording) because it provides a logical break between groups of species that tend to migrate ‘early’ or ‘late’ (Calvert et al 2009). To examine fine scale decisions data were grouped based on altitude (100 m bins) and time (30 min bins) and plotted using arrow plots. For each of these groups we calculated the circular mean and variance in direction of movement. Finally, we correlated nightly counts of targets from radar with counts from the acoustic study.
Data Analysis
The effect of weather (tailwind assistance, pressure, change in pressure and humidity) on log of the number of targets detected, and variance in heading was modelled using generalized linear models. Temperature was not included in these models as it was correlated with date (-0.740; temperature decreased across the season). Model support was assessed using Akaike's Information Criterion (package MuMIn; Barton 2012) and relative variable importance (on a scale of 0 to 1) and full model-averaged coefficients were calculated using functions in AICcmodavg (Mazerolle 2012). This type of approach is useful when dealing with potentially large number of multi-way interactions in a model (Crawley 2007). Model-averaged coefficients show the relative strength of the relationship between the weather variable and the response, and the variable importance provides information on the amount of evidence that a particular variable has some effect on the response. All analyses were conducted using program R (R Statistical Core team; V 3.02).
Results
Migration timing The bulk of fall migration activity occurred between 27 September and the 3 October at both sites. There also was a smaller peak in early September and mid-October. There was a strong, positive correlation between migratory activity at both sites (Spearman’s rho; 0.94, p < 0.001).
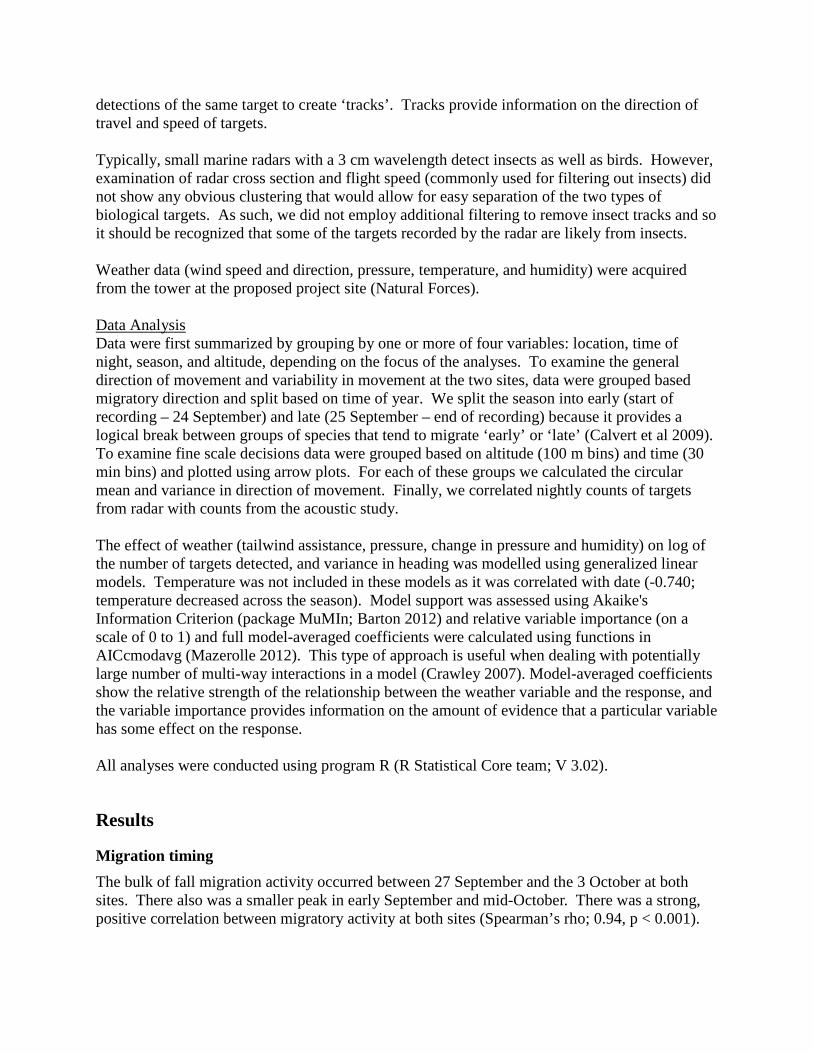
Furthermore, approximately 50% of the total number of targets detected occurred on only 8 nights (or 17% of the nights at house 1 and 16% of the nights at house 2).
Figure 2. Number of tracks detected over the fall season at each site (black = house 1, grey = house 2). Days with missing points represent nights with no migration or nights with rain when we were not able to assess migration.
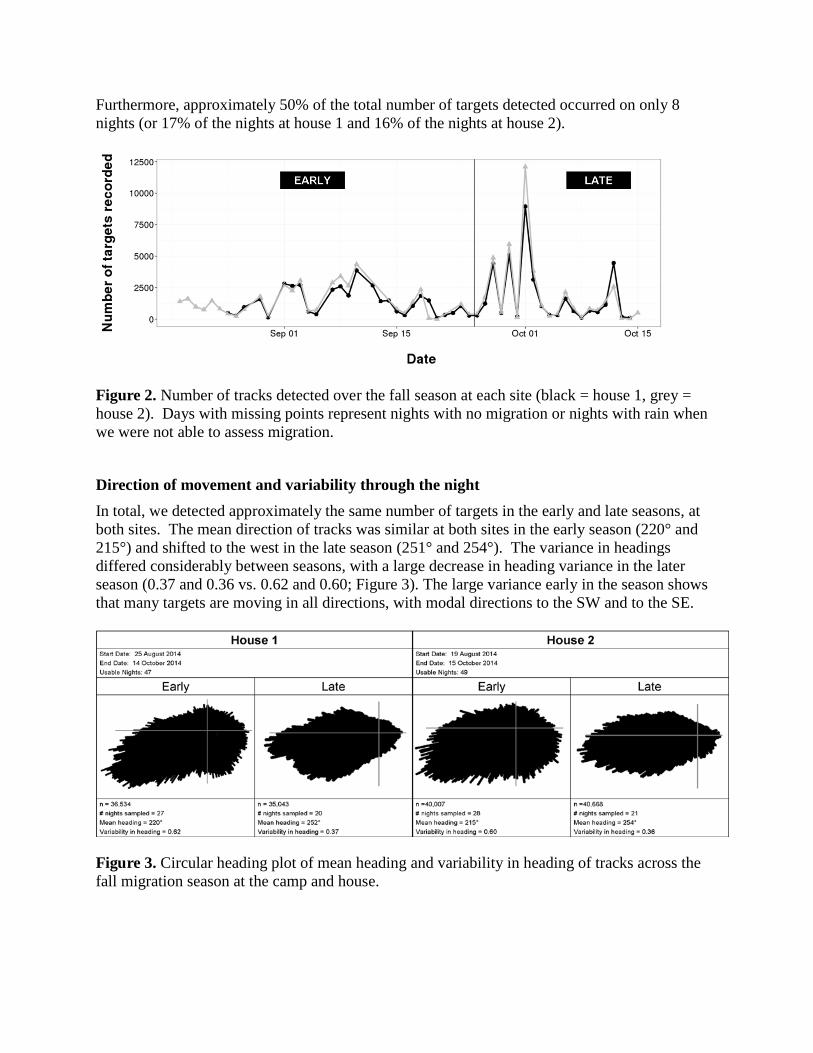
Direction of movement and variability through the night In total, we detected approximately the same number of targets in the early and late seasons, at both sites. The mean direction of tracks was similar at both sites in the early season (220° and 215°) and shifted to the west in the late season (251° and 254°). The variance in headings differed considerably between seasons, with a large decrease in heading variance in the later season (0.37 and 0.36 vs. 0.62 and 0.60; Figure 3). The large variance early in the season shows that many targets are moving in all directions, with modal directions to the SW and to the SE.
Figure 3. Circular heading plot of mean heading and variability in heading of tracks across the fall migration season at the camp and house.
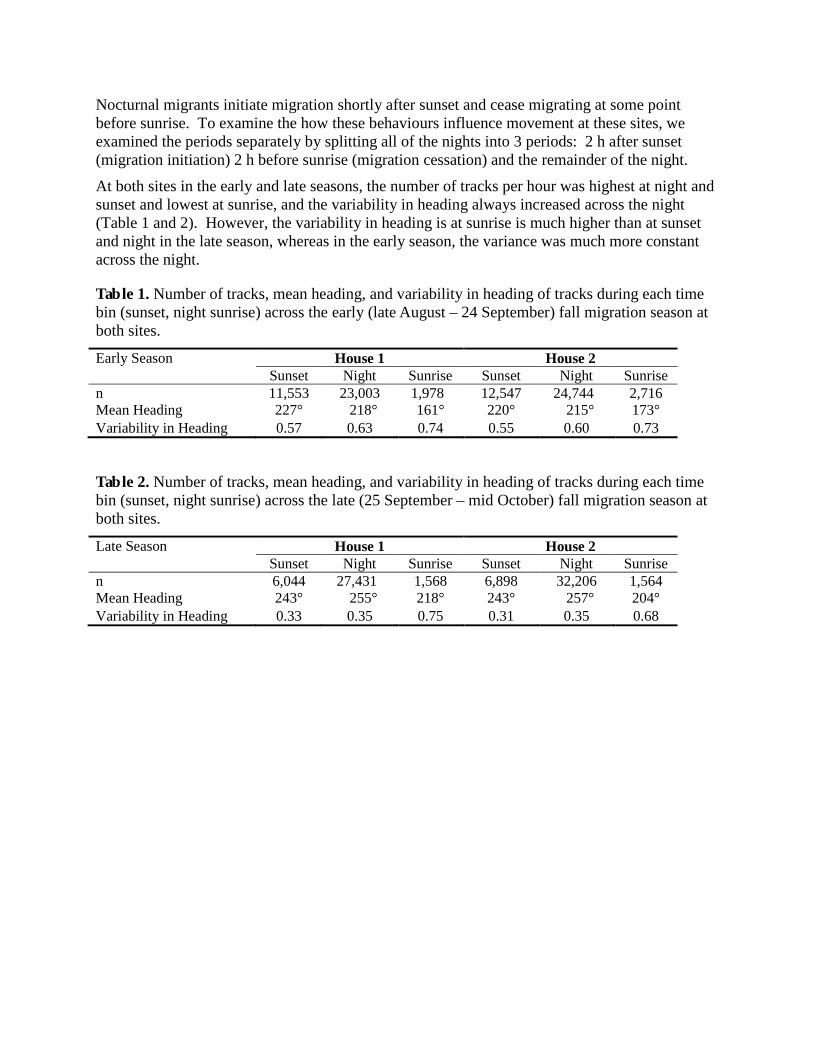
Nocturnal migrants initiate migration shortly after sunset and cease migrating at some point before sunrise. To examine the how these behaviours influence movement at these sites, we examined the periods separately by splitting all of the nights into 3 periods: 2 h after sunset (migration initiation) 2 h before sunrise (migration cessation) and the remainder of the night. At both sites in the early and late seasons, the number of tracks per hour was highest at night and sunset and lowest at sunrise, and the variability in heading always increased across the night (Table 1 and 2). However, the variability in heading is at sunrise is much higher than at sunset and night in the late season, whereas in the early season, the variance was much more constant across the night.
Table 1. Number of tracks, mean heading, and variability in heading of tracks during each time bin (sunset, night sunrise) across the early (late August – 24 September) fall migration season at both sites.
Early Season House 1 House 2 Sunset Night Sunrise Sunset Night Sunrise
n 11,553 23,003 1,978° 12,547 24,744° 2,716 Mean Heading 227° 0218° 161° 220° 0215° 173° Variability in Heading 0.57 0.63 0.74 0.55 0.60 0.73
Table 2. Number of tracks, mean heading, and variability in heading of tracks during each time bin (sunset, night sunrise) across the late (25 September – mid October) fall migration season at both sites.
Late Season House 1 House 2 Sunset Night Sunrise Sunset Night Sunrise
n 6,044 27,431° 1,568 6,898 32,206 1,564 Mean Heading 243° 0255° 218° 243° 0257° 204° Variability in Heading 0.33 0.35 0.75 0.31 0.35 0.68

Within night variability Further insight into the patterns of movement can be obtained by examining particular nights with relatively high amounts of migratory activity. In Figure 4 we present a selection of these that show how that pattern can vary considerably across nights.
Figure 4. Arrow plots showing select nights with large numbers of tracks detected during fall migration. Plots show the number of targets (darkness of arrow; on a log scale), their mean direction (direction of arrow) and variability in direction (shorter arrows show more variability) for 30 minute time bins and 100 m altitude bins.
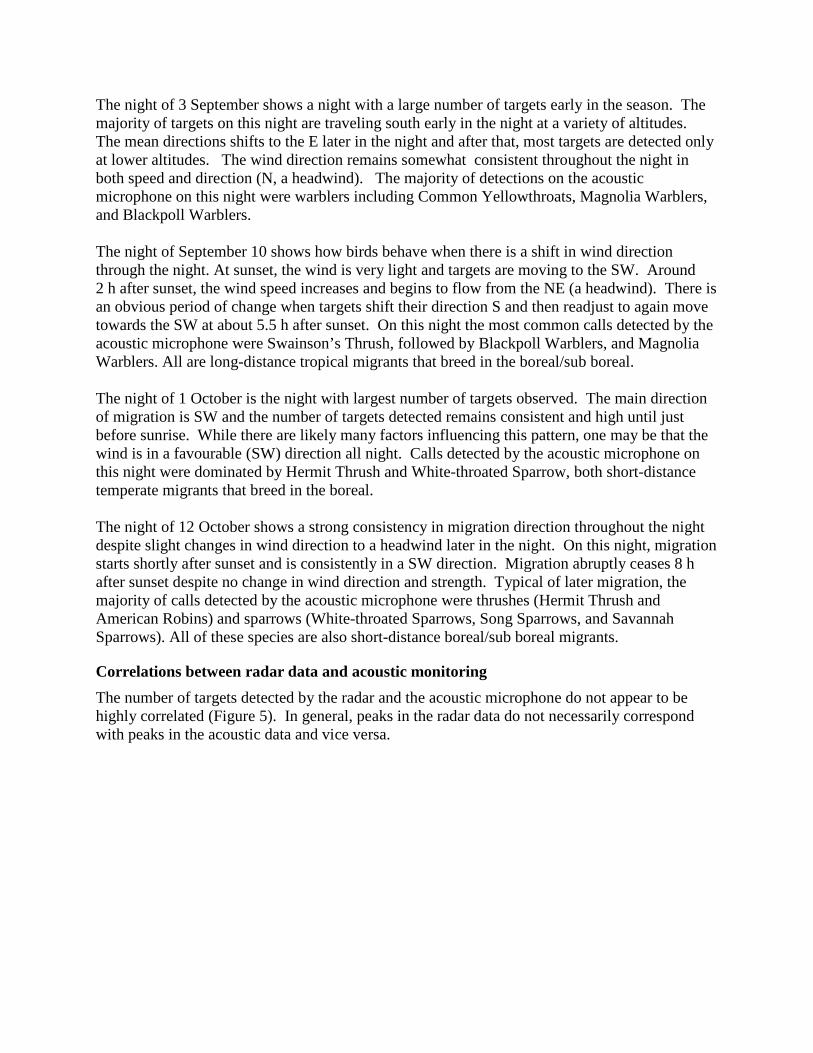
The night of 3 September shows a night with a large number of targets early in the season. The majority of targets on this night are traveling south early in the night at a variety of altitudes. The mean directions shifts to the E later in the night and after that, most targets are detected only at lower altitudes. The wind direction remains somewhat consistent throughout the night in both speed and direction (N, a headwind). The majority of detections on the acoustic microphone on this night were warblers including Common Yellowthroats, Magnolia Warblers, and Blackpoll Warblers. The night of September 10 shows how birds behave when there is a shift in wind direction through the night. At sunset, the wind is very light and targets are moving to the SW. Around 2 h after sunset, the wind speed increases and begins to flow from the NE (a headwind). There is an obvious period of change when targets shift their direction S and then readjust to again move towards the SW at about 5.5 h after sunset. On this night the most common calls detected by the acoustic microphone were Swainson’s Thrush, followed by Blackpoll Warblers, and Magnolia Warblers. All are long-distance tropical migrants that breed in the boreal/sub boreal. The night of 1 October is the night with largest number of targets observed. The main direction of migration is SW and the number of targets detected remains consistent and high until just before sunrise. While there are likely many factors influencing this pattern, one may be that the wind is in a favourable (SW) direction all night. Calls detected by the acoustic microphone on this night were dominated by Hermit Thrush and White-throated Sparrow, both short-distance temperate migrants that breed in the boreal. The night of 12 October shows a strong consistency in migration direction throughout the night despite slight changes in wind direction to a headwind later in the night. On this night, migration starts shortly after sunset and is consistently in a SW direction. Migration abruptly ceases 8 h after sunset despite no change in wind direction and strength. Typical of later migration, the majority of calls detected by the acoustic microphone were thrushes (Hermit Thrush and American Robins) and sparrows (White-throated Sparrows, Song Sparrows, and Savannah Sparrows). All of these species are also short-distance boreal/sub boreal migrants.
Correlations between radar data and acoustic monitoring The number of targets detected by the radar and the acoustic microphone do not appear to be highly correlated (Figure 5). In general, peaks in the radar data do not necessarily correspond with peaks in the acoustic data and vice versa.
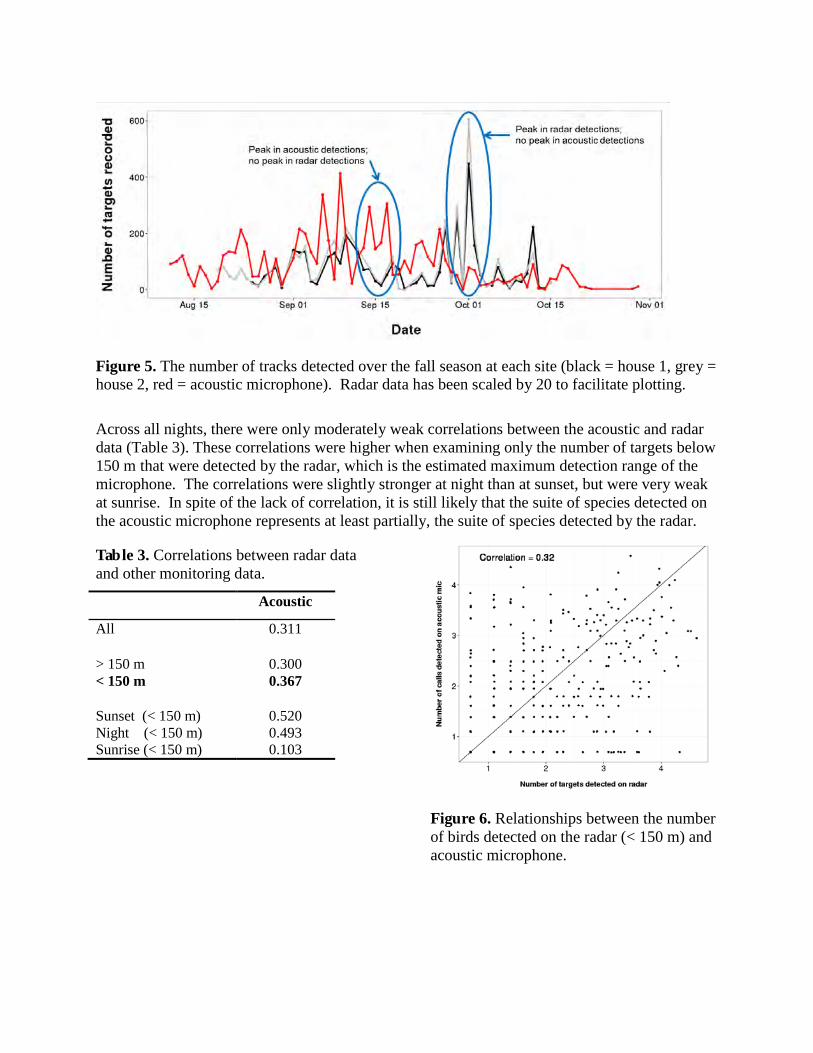
Figure 5. The number of tracks detected over the fall season at each site (black = house 1, grey = house 2, red = acoustic microphone). Radar data has been scaled by 20 to facilitate plotting. Across all nights, there were only moderately weak correlations between the acoustic and radar data (Table 3). These correlations were higher when examining only the number of targets below 150 m that were detected by the radar, which is the estimated maximum detection range of the microphone. The correlations were slightly stronger at night than at sunset, but were very weak at sunrise. In spite of the lack of correlation, it is still likely that the suite of species detected on the acoustic microphone represents at least partially, the suite of species detected by the radar.
Table 3. Correlations between radar data and other monitoring data.
Acoustic
All 0.311 > 150 m 0.300 < 150 m 0.367
Sunset (< 150 m) 0.520 Night (< 150 m) 0.493 Sunrise (< 150 m) 0.103
Figure 6. Relationships between the number of birds detected on the radar (< 150 m) and acoustic microphone.

Species-level inference and diurnal migration
On 17 September Kearney (pers. com) recorded large numbers of Common Grackles between 10:00 GMT and 11:00 GMT on stopover counts. The majority of these individuals were flying to the NE. A different pattern of movement was observed in the radar data. Few targets (n = 14) were detected on the radar at this time, and those that were, were traveling to the SE or NW. Later that same day the radar detected many more targets (n = 1558), many of which were moving to the NE. Further, the airspeed of these targets was low (<7 m/s) consisted with passerine migration.
A sample of some specific Radar-Ground Survey Comparisons:
Figure 7. Radar data on the day of 17 September, identified by stopover surveys as a day with Common Grackle migration early in the morning. Radar results from this time are boxed off including a circular plot of heading. The remainder of the day’s results are summarized in the second circular plot. Colour indicates wind speed. On 14 October, Kearney (pers. com) recorded 164 American Robins on stopover counts between 10:36 GMT and 12:39 GMT. Most of these individuals (n = 156) had a westerly component to their heading (either SW, W or W). Again, we do not see the same pattern in the radar data. Few targets were detected between these times (or in fact during the entire day, n = 42), and over half (60%) of those detected had an easterly component to their heading. Both of these results point to the importance of combining the two observational methods. Ground-based surveys are picking up movements at lower altitudes, and with the particular configuration of the radars that we had at this site, we are not well able to detect low-altitude movements.
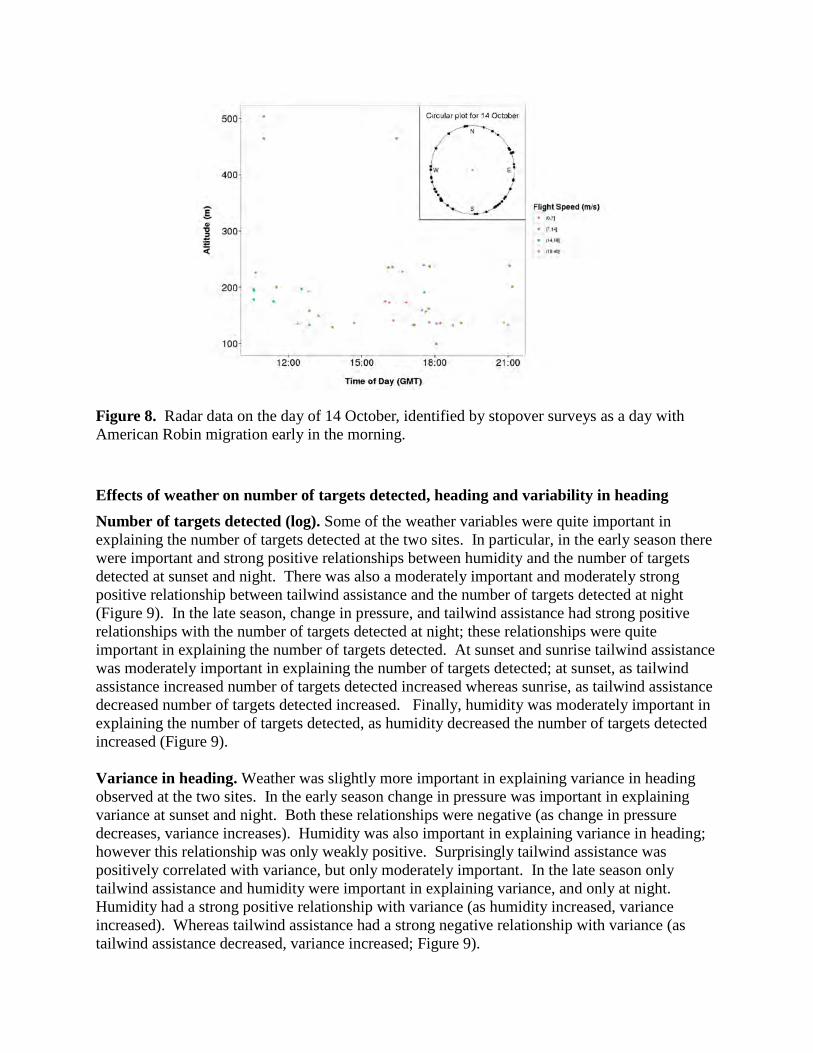
Figure 8. Radar data on the day of 14 October, identified by stopover surveys as a day with American Robin migration early in the morning.
Effects of weather on number of targets detected, heading and variability in heading Number of targets detected (log). Some of the weather variables were quite important in explaining the number of targets detected at the two sites. In particular, in the early season there were important and strong positive relationships between humidity and the number of targets detected at sunset and night. There was also a moderately important and moderately strong positive relationship between tailwind assistance and the number of targets detected at night (Figure 9). In the late season, change in pressure, and tailwind assistance had strong positive relationships with the number of targets detected at night; these relationships were quite important in explaining the number of targets detected. At sunset and sunrise tailwind assistance was moderately important in explaining the number of targets detected; at sunset, as tailwind assistance increased number of targets detected increased whereas sunrise, as tailwind assistance decreased number of targets detected increased. Finally, humidity was moderately important in explaining the number of targets detected, as humidity decreased the number of targets detected increased (Figure 9). Variance in heading. Weather was slightly more important in explaining variance in heading observed at the two sites. In the early season change in pressure was important in explaining variance at sunset and night. Both these relationships were negative (as change in pressure decreases, variance increases). Humidity was also important in explaining variance in heading; however this relationship was only weakly positive. Surprisingly tailwind assistance was positively correlated with variance, but only moderately important. In the late season only tailwind assistance and humidity were important in explaining variance, and only at night. Humidity had a strong positive relationship with variance (as humidity increased, variance increased). Whereas tailwind assistance had a strong negative relationship with variance (as tailwind assistance decreased, variance increased; Figure 9).
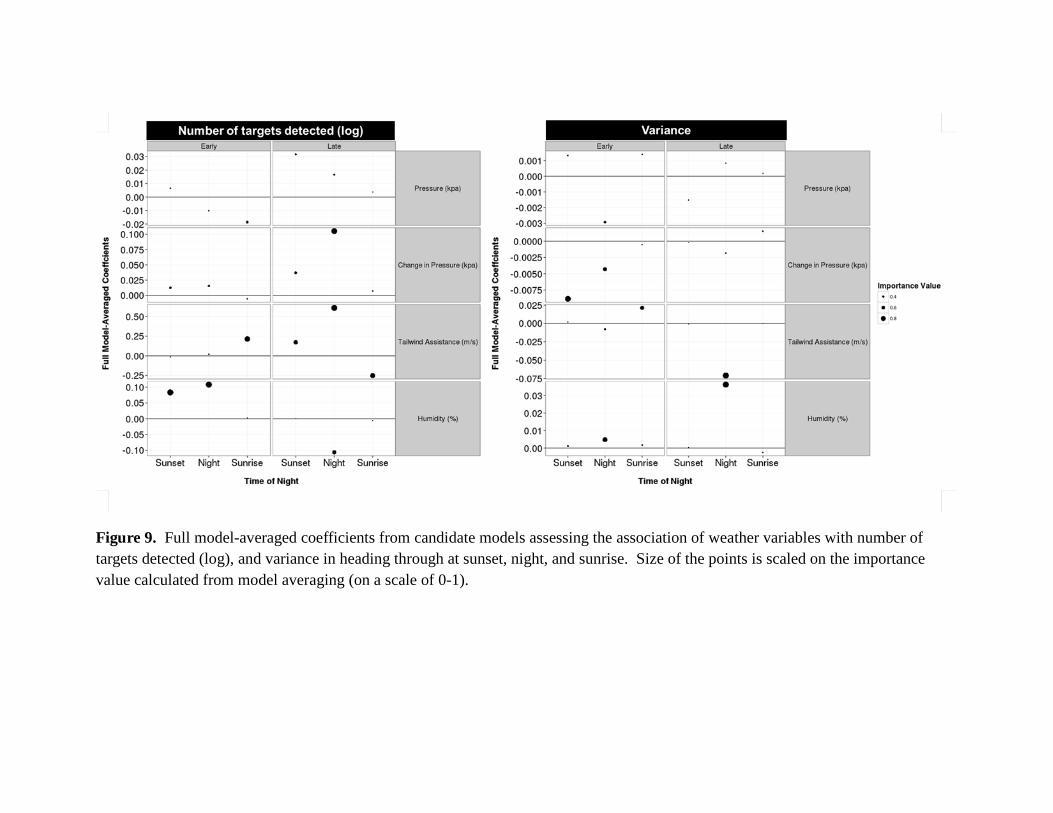
Figure 9. Full model-averaged coefficients from candidate models assessing the association of weather variables with number of targets detected (log), and variance in heading through at sunset, night, and sunrise. Size of the points is scaled on the importance value calculated from model averaging (on a scale of 0-1).
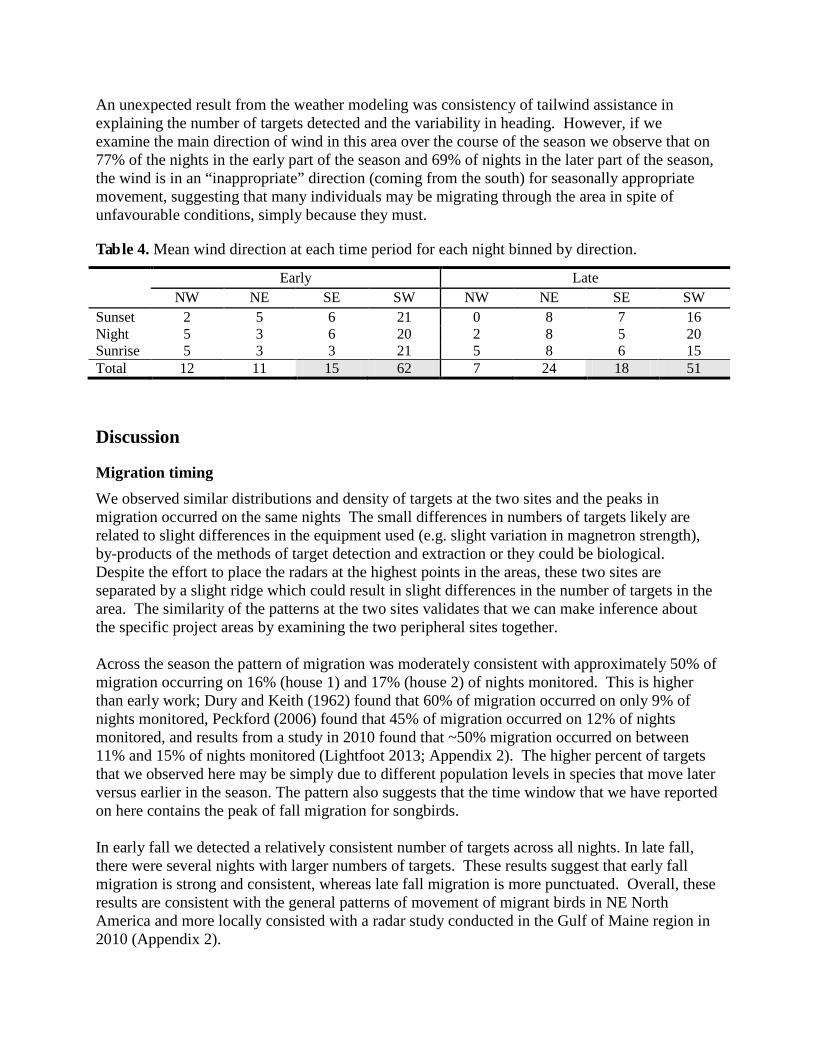
An unexpected result from the weather modeling was consistency of tailwind assistance in explaining the number of targets detected and the variability in heading. However, if we examine the main direction of wind in this area over the course of the season we observe that on 77% of the nights in the early part of the season and 69% of nights in the later part of the season, the wind is in an “inappropriate” direction (coming from the south) for seasonally appropriate movement, suggesting that many individuals may be migrating through the area in spite of unfavourable conditions, simply because they must.
Table 4. Mean wind direction at each time period for each night binned by direction.
Early Late NW NE SE SW NW NE SE SW Sunset 2 5 6 21 0 8 7 16 Night 5 3 6 20 2 8 5 20 Sunrise 5 3 3 21 5 8 6 15 Total 12 11 15 62 7 24 18 51
Discussion
Migration timing We observed similar distributions and density of targets at the two sites and the peaks in migration occurred on the same nights The small differences in numbers of targets likely are related to slight differences in the equipment used (e.g. slight variation in magnetron strength), by-products of the methods of target detection and extraction or they could be biological. Despite the effort to place the radars at the highest points in the areas, these two sites are separated by a slight ridge which could result in slight differences in the number of targets in the area. The similarity of the patterns at the two sites validates that we can make inference about the specific project areas by examining the two peripheral sites together. Across the season the pattern of migration was moderately consistent with approximately 50% of migration occurring on 16% (house 1) and 17% (house 2) of nights monitored. This is higher than early work; Dury and Keith (1962) found that 60% of migration occurred on only 9% of nights monitored, Peckford (2006) found that 45% of migration occurred on 12% of nights monitored, and results from a study in 2010 found that ~50% migration occurred on between 11% and 15% of nights monitored (Lightfoot 2013; Appendix 2). The higher percent of targets that we observed here may be simply due to different population levels in species that move later versus earlier in the season. The pattern also suggests that the time window that we have reported on here contains the peak of fall migration for songbirds. In early fall we detected a relatively consistent number of targets across all nights. In late fall, there were several nights with larger numbers of targets. These results suggest that early fall migration is strong and consistent, whereas late fall migration is more punctuated. Overall, these results are consistent with the general patterns of movement of migrant birds in NE North America and more locally consisted with a radar study conducted in the Gulf of Maine region in 2010 (Appendix 2).
Our ability to directly compare or rank the number of targets (Appendix 2) detected to what has been observed at other sites (in Nova Scotia or elsewhere) is limited. The angle of the radars for this project were deliberately set low to enhance the ability to detect targets closer to the ground. This compromises our ability to obtain data on targets at higher altitudes, making comparisons difficult. In addition, different track forming and filtering parameters were used in this project compared to the work in 2010, which influences the number of targets detected in unknown ways. Furthermore, direct comparisons of data from any radar is dependent upon calibrating radars in a way that observers can calculated how probability of detection varies with distance from the beam. As such, even comparisons between the two sites in this study are not completed without caution. As part of ongoing research, we are investigating ways to undertake these calibrations, but we have not yet determined a method that can be readily put in to practice.
Direction of movement and variability in heading through the night Circular plots of direction of movement for the early season show high variability in movement at both sites. Although there is a strong movement SW, there are also a high number of targets move SE and a moderate amount moving in “seasonally inappropriate” directions, NE and NW. Late in the season there is far less variability in heading with the majority of targets moving SW. Migration to the SW is consistent with movement from areas further north including Cape Breton and Newfoundland, following the general North America coastline. Migration to the SE direction is consistent with a more direct route to overwintering grounds in South America. Earlier radar studies in the region show some migration to the SE, and it is generally thought that this comprises shorebirds and Blackpoll Warblers (both which are known to take overwater routes to South America), and strong migration to the SW, thought to be passerines (Nisbet et al. 1995, Richardson 1972, 1978). These results are similar to some of the data from the radar study in 2010 (e.g. Lorneville and Petit Manan Point); however, greatly vary from data collected at Kent Island and Sandy Cove, where it was hypothesised that movement at these coastal sites was strongly influenced by local topography and encountering large expanses of open water (Lightfoot 2013; Appendix 3). The variability in direction that we observed in the early part of the fall was exceptionally high compared to that observed in the late fall, and compared to other locations (e.g. Lightfoot 2013). High variability in the early season is consistent with the hypothesis that birds are less urgent to migrate and is also is influenced by a high proportion of targets moving in the SE direction. In addition, the low percent of nights with favorable wind conditions likely contribute to high variability. Individuals may not be moving in ‘appropriate’ migratory directions simply because they are undertaking post-fledging exploration of the landscape, or seeking suitable habitat for moulting. The lack of variability in the late fall is consistent with the hypothesis that birds are moving quickly through the site later in the season, a behavior we have observed at other locations in the region (Appendix 3). Furthermore, many of the individuals on fall migration on the east coast are hatch year birds move south for the first time (Leppold 2009, 2010, Ralph 1981,); this lack of experience may explain the lack of urgency in the early part of the season.
Closer examination of variability in heading shows an increase throughout the course of the night (Tables 1 and 2) in both the early and late season. This pattern is consistent with bird behaviour. Shortly after sunset individuals are initiating migration, at “night” the radar detects a combination of individuals in the middle of migration and ceasing migration (contributing to a slight increase in variability) and then at sunrise the radar detects individuals ceasing migration. Compared to other sites, arrow plots from these two sites shows consistency across altitudes suggesting similar migratory strategies are being employed at the altitudes sampled.
Correlations between radar data and acoustic monitoring Correlation between radar data and acoustic data were lower than we have observed at the single other site where we have done this (Lightfoot and Taylor 2013). In the present study, the radar was set to scan at a higher angle (to avoid nearby clutter) which means that we are detecting fewer targets at lower altitudes. Other reasons for the lack of correlation are more likely, but difficult to ascertain. These include mostly biological effects – e.g. species composition varies (will discuss with Kearney for final report), individual birds have very different calling patterns at the two sites.
Species-level inference and diurnal migration Neither of the two mornings identified by Kearney as having strong diurnal movement were well sampled by the radar. It is likely that these observed movements were occurring at an altitude below that which we were detecting targets by the radar. However, interestingly on the 17th, there seems to be a period of high activity later in the afternoon after Kearney’s surveys in a direction consistent with his early morning observations. It is possible that this is an extension of the diurnal migration he observed; however, there is a gap in time between his migrations and this period of high activity. In the final report we will more fully examine daytime radar data to more explicitly assess patterns of diurnal movement at the site.
Effects of weather on number of targets detected and variability in heading The results from weather modelling in this study support previous work suggesting that weather affects migration in variable and complex ways (Richardson 1978, 1990). Overall relationships between weather variables and the number of targets detected were more important in the late season and for some variables (change in pressure and tailwind assistance) stronger. In the early season humidity is most important in explaining the number of targets detected; whereas in the late season tailwind assistance is more important. Weather relationships with variance were slightly stronger and more important in the early season compared to the early season. These results are similar from previous work (e.g. Peckford 2006, Thurber 2010, Matcovitch 2011, Lightfoot 2013, Lightfoot and Taylor 2013). In these studies, weather (tailwind assistance in particular) was shown to have an important relationship with the number of targets detected by the radar. Although the relationship between tailwind assistance and the number of targets is not consistent, many of the relationships are biological correct. Because tailwind assistance was important in explaining the number of targets detected (positive relationship at night in the late season), this suggests that birds are taking advantage of the few nights with favourable winds. Furthermore,

tailwind assistance is important in explaining variance in the late season at night (negative relationship). This suggests that birds are still moving on nights with headwinds, likely because so few nights have favourable winds, but the directions they are traveling on these nights are highly variable.
Assessment of risk Assessments of risk of collisions using radar data are difficult, and have not been proven to be that effective. In general, mortality associated with windfarms is thought to be low, relative to the effects of other human infrastructure (Zimmerling et al. 2013). Risk may be correlated with volume of migration, but without multiple, standardized radar studies from a broader region, it is difficult to make firm statements about whether the volume of migrants at the site is more or less than what might be expected elsewhere. In the present case, we have no data from other nearby sites that has been collected in a comparable way, and so are unable to compare the volume of migrants observed here to other places. Risk may also be correlated with unusual patterns of movement, which can occur during periods of take-off and landing or during periods when individuals are re-orienting, and thus perhaps at higher risk because they are more likely to be stressed, tired or perhaps subject to some external force (e.g. fog) that leads to unusual patterns of movement. To our knowledge, such correlations have never been established, and so must be considered only as plausible hypotheses. The patterns of variability in orientation observed at this site, particularly in the early fall suggest that there may be more risk during that period than during late fall, although basing this conclusion on a single year’s data is tenuous. However, it is our view that much of this variability may be due to biological variation that is not due to ‘disorientation’ but rather, likely due to landscape-scale stopover movements, post-fledging movements, or simply from different species groups (e.g. shorebirds vs. songbirds). A fuller analysis of these data is necessary to properly test this hypothesis. The risk of mortality associated with wind farms may be associated with periods of extreme weather. In particular, patterns of fall movement in coastal Nova Scotia are highly dependent on weather (Mclaren et al 2000) and, in particular, with hurricanes or their remnants. The fall of 2014 had only six hurricanes, two tropical storms, and one tropical depression, more storms than 2013 but fewer than the previous three years (http://en.wikipedia.org/wiki/2013_Atlantic_hurricane_season) which should be taken in to account when considering these results and our interpretation. Assessments of risk of wind turbine developments to migratory birds would benefit from broader, regional-scale studies that attempted to put into context patterns of migration as they relate to both local and regional-scale patterns of geography and weather. Further, such assessments would also benefit from rigorous, controlled, before-after studies that correlated post-construction mortality with pre-construction assessments of risk.
Future Work In the coming weeks we will be processing and including the rest of fall migration (mid-October though late November) in analyses. In addition, we will be taking a closer look at diurnal

movement at these sites. Finally we also hope to include an assessment of bat detections relative to radar detections.
Literature Cited Barton, K. 2012. MuMIn: Multi-model inference. R package version 1.7.11. http://CRAN.R-
project.org/package=MuMIn Calvert, A.M., Taylor, P.D., and Walde, S. 2009. Cross-scale environmental influences on migratory
stopover behaviour. Global Change Biology 15: 744-759. Crawley, M. J. 2007. The R book. John Wiley and Sons, Ltd., Great Britain. Drury, W. H., and J. A. Keith. 1962. Radar studies of songbird migration in coastal New England.
Ibis 104:449-489. Leppold, A.J. 2010. Metinic Island 2010 migration monitoring report. Leppold, A.J. 2011. Metinic Island spring 2011 migration monitoring report. Lightfoot, H.L. 2013. Factors influencing decisions of birds during fall migration in the Gulf of
Maine Region. MSc thesis, Biology. Acadia University, Wolfville NS. Lightfoot, H.L. and Taylor, P.D. 2013. Final Sable Wind Radar Report. Matkovich C. 2011. Radar aeroecology: mesoscale nocturnal avian migration and using radar cross
section to distinguish among target types. MSc thesis, Biology. Acadia University, Wolfville, NS.
Mazerolle, M.J. 2012. AICcmodavg: Model selection and multimodel inference based on (Q)AIC(c). R package version 1.25. http://CRAN.R-project.org/package=AICcmodavg.
Mclaren, I., Maybank, B., Keddy, K., Taylor, P.D., and Fitzgerald, T. 2000. A notable autum arrival of reverse-migrants in southern NS. North American Birds 4:10.
Nisbet, I.C.T., McNair, D.B., Post, W., and Williams, T.C. 1995. Transoceanic migration of the blackpoll warbler: summary of scientific evidence and response to criticisms by Murray. Journal of Field Ornithology 66: 612-622.
Peckford, M.L. 2006. Wind drift and the use of radar, acoustics, and Canadian Migration Monitoring Network methods for monitoring nocturnal passerine migration. MSc thesis, Biology. Acadia University, Wolfville NS
R Core Team (2013). R: A language and environment for statistical computing. R Foundation for Statistical Computing, Vienna, Austria. ISBN 3-900051-07-0, URL http://www.R-project.org/.
Ralph, C.J. 1981. Age ratios and their possible use in determining autumn routes of passerine migrants. Wilson Bulletin 93: 164-188.
Richardson, W.J. 1972. Autumn migration in eastern Canada: a radar study. American Birds 26: 10-16.
Richardson, W.J. 1978. Timing and amount of bird migration in relation to weather: a review. Oikos 20: 224-227.
Richardson, W. J. 1990. Timing and amount of bird migration in relation to weather: updated review. In E. Gwinner [ed.], Bird migration: physiology and ecophysiology. Springer, Berlin.
Shafique, K., and M. Shah. 2005. A Noniterative Greedy Algorithm for Multiframe Point Correspondence. IEEE Transactions on Pattern Analysis and Machine Intelligence 27:51-65.
Taylor, P.D., J. Brzustowski, C. Matkovich, M. Peckford, Wilson, D. 2010. radR: an open-source platform for acquiring and analysing data on biological targets observed by radar. BMC-Ecology 10:22; doi:10.1186/1472-6785-10-22.
Thurber, B.G. 2010. Daily flight timing and movement strategies of migrating landbirds: importance of local wind patterns. MSc thesis, Biology. University of Western Ontario, London, ON.
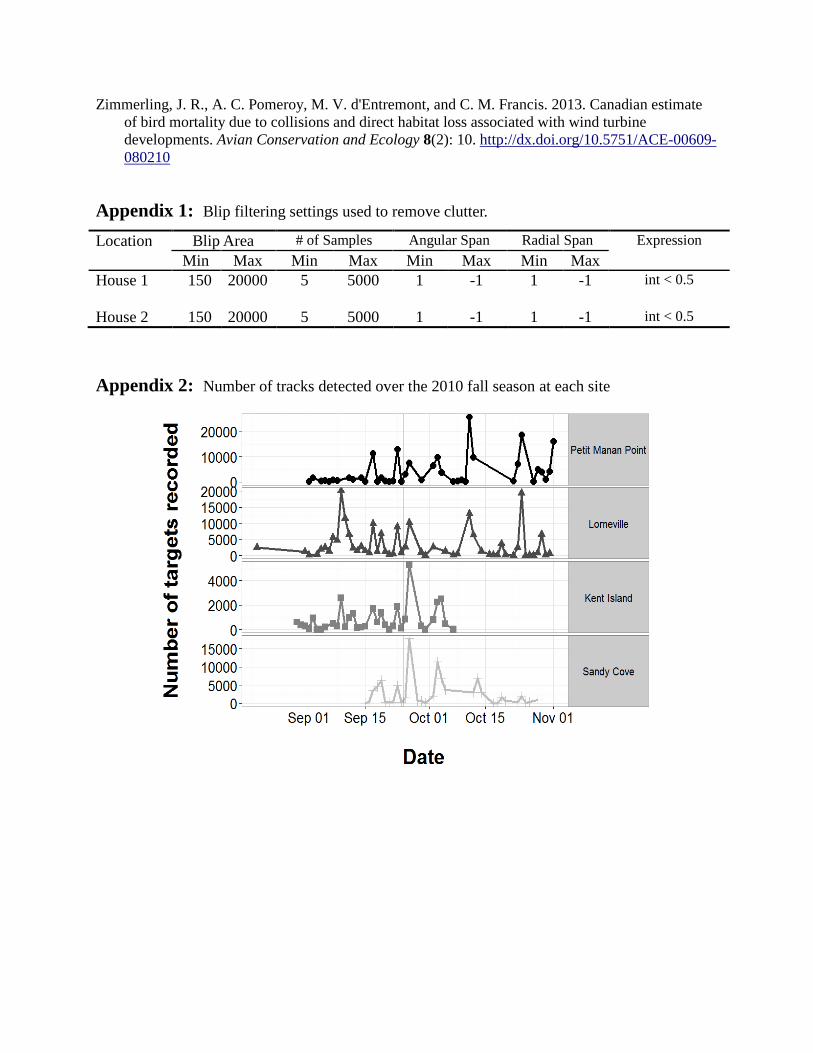
Zimmerling, J. R., A. C. Pomeroy, M. V. d'Entremont, and C. M. Francis. 2013. Canadian estimate of bird mortality due to collisions and direct habitat loss associated with wind turbine developments. Avian Conservation and Ecology 8(2): 10. http://dx.doi.org/10.5751/ACE-00609-080210
Appendix 1: Blip filtering settings used to remove clutter.
Appendix 2: Number of tracks detected over the 2010 fall season at each site
Location Blip Area # of Samples Angular Span Radial Span Expression Min Max Min Max Min Max Min Max House 1
150 20000 5 5000 1 -1 1 -1 int < 0.5
House 2 0150 20000 5 5000 1 -1 1 -1 int < 0.5

Appendix 3: Circular plots at each site surveyed during the 2010 fall season.

Table 1: Warren Wind Project, Winter Bird Survey Detailed Results
Wind Speed and Direction Temperature °C Sky Precipitation
February 27/2014 1 411779 5075082 Agricultural field 411561 5075281 Agricultural field with spruce hedge <5 km/h S -10 Overcast None 7:09 AM American Crow 2 100+ …… … … … … … … … … … … … … American Crow 3 50-100 …… … … … … … … … … … … … … American Goldfinch 2 50-100 …… … … … … … … … … … … … … Common Raven 1 100+ …… … … … … … … … … … … … … Snow Bunting 1 0-50 …
… 2 411561 5075281 Agricultural field with spruce hedge 411347 5075486 Agricultural field with spruce hedge <5 km/h S -10 Overcast None 7:18 AM American Crow 2 100+ …
… … … … … … … … … … … … … Common Raven 1 100+ …… … … … … … … … … … … … … Common Raven 1 50-100 …
… 3 411347 5075486 Agricultural field with spruce hedge 411071 5075611 Mature softwood along agricultural
field <5 km/h S -10 Overcast None 7:25 AM American Crow 2 100+ …
… … … … … … … … … … … … … Blue Jay 1 50-100 …… … … … … … … … … … … … … Blue Jay 1 100+ …… … … … … … … … … … … … … Red Crossbill 2 FO W
… 4 411071 5075611 Mature softwood along agricultural field 410852 5075700 Mature mixedwood along small
stream <5 km/h S -10 Overcast None 7:35 AM Black-capped Chickadee 4 0-50 …
… … … … … … … … … … … … … Blue Jay 1 50-100 …… … … … … … … … … … … … … Gray Jay 2 0-50 …… … … … … … … … … … … … … Pileated Woodpecker 1 100+ …… … … … … … … … … … … … … Purple Finch 2 FO N… … … … … … … … … … … … … Red-breasted Nuthatch 1 0-50 …
… 5 410852 5075700 Mature mixedwood along small stream 410810 5075970 Mature softwood <5 km/h S -10 Overcast None 7:50 AM American Crow 2 100+ …
… … … … … … … … … … … … … Black-capped Chickadee 6 0-50 …… … … … … … … … … … … … … Purple Finch 1 0-50 …… … … … … … … … … … … … … Red-breasted Nuthatch 1 0-50 …… 6 410810 5075970 Mature softwood 411082 505983 Recent cutover <5 km/h S -10 Overcast None 8:06 AM American Crow 1 100+ …… … … … … … … … … … … … … Black-capped Chickadee 1 50-100 …… … … … … … … … … … … … … Common Raven 1 0-50 …… … … … … … … … … … … … … Purple Finch 2 0-50 …… 7 411082 505983 Recent cutover 411029 5076267 Mixed shrub growth <5 km/h S -10 Overcast None 8:24 AM None Observed N/A N/A …
… 8 411029 5076267 Mixed shrub growth 410862 5076510 Young hardwoods adjacent to recent cutover <5 km/h S -8 Overcast None 8:34 AM None Observed N/A N/A …
… 9 410862 5076510 Young hardwoods adjacent to recent cutover 410650 5076645 Young spruce adjacent to recent
cutover <5 km/h S -8 Overcast None 8:44 AM American Crow 1 100+ …
… … … … … … … … … … … … … Common Raven 1 100+ …
… 10 410650 5076645 Young spruce adjacent to recent cutover 410394 5076790 Young spruce <5 km/h S -8 Overcast None 8:57 AM American Crow 1 50-100 …
… … … … … … … … … … … … … American Crow 1 100+ …… … … … … … … … … … … … … American Crow 5 FO NW… … … … … … … … … … … … … Red-winged Crossbill 2 FO N
… 11 410394 5076790 Young spruce 410195 5076973 Mixed shrub growth along access road <5 km/h S -8 Overcast None 9:08 AM American Crow 1 100+ …
… … … … … … … … … … … … … Brown Creeper 1 0-50 …… … … … … … … … … … … … … Purple Finch 1 FO E
… 12 410311 5076866 Young mixedwoods along access road 410587 5076983 Young to mid-aged softwood along
access road; close to shrub swamp <5 km/h S -8 Overcast None 9:20 AM American Crow 2 100+ …
… … … … … … … … … … … … … Black-capped Chickadee 4 0-50 …
… 13 410587 5076983
Young to mid-aged softwood along access
road; close to shrub swamp
410836 576847 Mid-aged softwood along powerline corridor <5 km/h S -8 Overcast None 9:39 AM None Observed N/A N/A …
… 14 410836 576847 Mid-aged softwood along powerline corridor 411030 5076657 Mid-aged softwood along powerline
corridor <5 km/h S -8 Overcast None 9:48 AM Black-capped Chickadee 4 0-50 …
… … … … … … … … … … … … … Red-breasted Nuthatch 1 0-50 …
… 15 411030 5076657 Mid-aged softwood along powerline corridor 411211 5076453 Mid-aged softwood along powerline
corridor <5 km/h S -8 Overcast None 9:57 AM Common Raven 1 100+ …
… 16 411211 5076453 Mid-aged softwood along powerline corridor 411315 5076224 Regenerating softwoods <5 km/h S -8 Overcast None 10:07 AM American Crow 2 100+ …
… 17 411315 5076224 Regenerating softwoods 411374 5075971 Shrub hardwoods along recent cutover and mid-aged mixedwood <5 km/h S -5 Overcast None 10:17 AM American Crow 1 100+ …
… … … … … … … … … … … … … Black-capped Chickadee 9 0-50 …
… 18 411374 5075971Shrub hardwoods along recent cutover and mid-
aged mixedwood411491 5075725 Edge of agricultural field and recent
cutover <5 km/h S -5 Overcast None 10:31 AM American Crow 2 100+ …
… … … … … … … … … … … … … Black-capped Chickadee 2 50-100 …… … … … … … … … … … … … … Ring-necked Pheasant 2 0-50 …
… 19 411491 5075725 Edge of agricultural field and recent cutover 411684 5075555 Edge of agricultural field and recent
cutover <5 km/h S -5 Overcast None 10:41 AM None Observed N/A N/A …
Date Transect Number
Transect Start (Easting)
Transect Start (Northing)
ConditionsTime
Job # 14-4969
Start Point Habitat NotesCommon Name Number Observed
Distance to Observer (m)
Transect End (Easting)
Transect End (Northing) End Point Habitat
Table 1 - Page 1
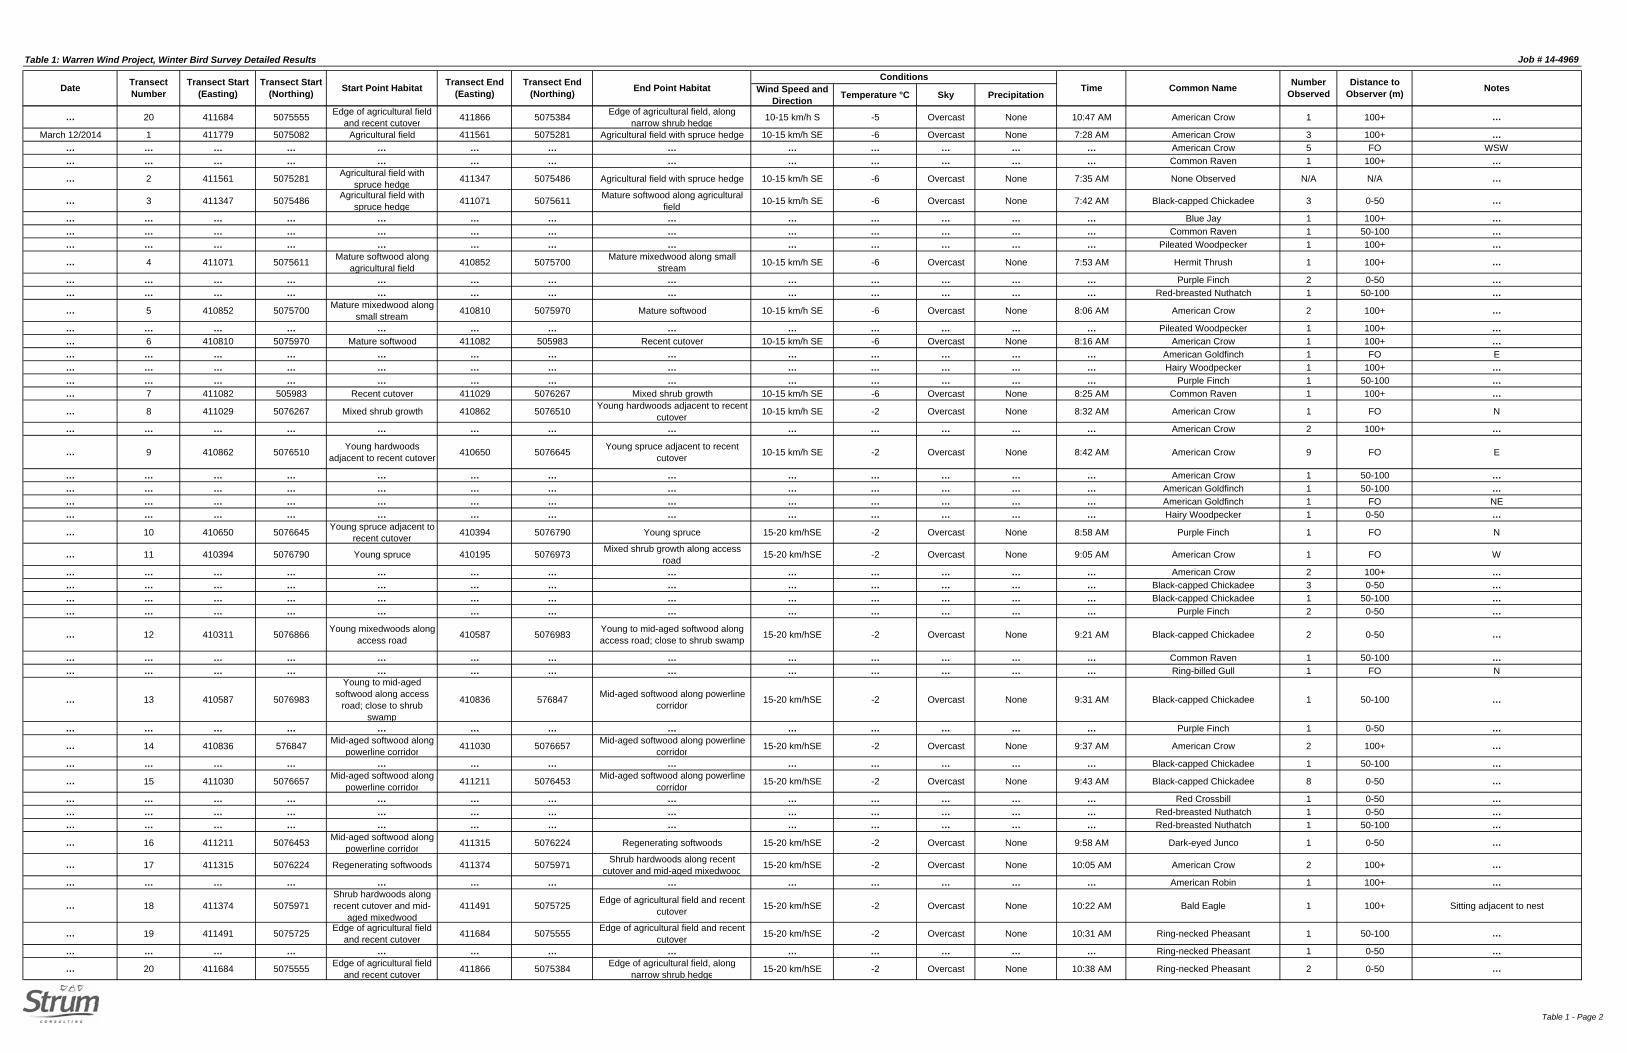
Table 1: Warren Wind Project, Winter Bird Survey Detailed Results
Wind Speed and Direction Temperature °C Sky Precipitation
Date Transect Number
Transect Start (Easting)
Transect Start (Northing)
ConditionsTime
Job # 14-4969
Start Point Habitat NotesCommon Name Number Observed
Distance to Observer (m)
Transect End (Easting)
Transect End (Northing) End Point Habitat
… 20 411684 5075555 Edge of agricultural field and recent cutover 411866 5075384 Edge of agricultural field, along
narrow shrub hedge 10-15 km/h S -5 Overcast None 10:47 AM American Crow 1 100+ …
March 12/2014 1 411779 5075082 Agricultural field 411561 5075281 Agricultural field with spruce hedge 10-15 km/h SE -6 Overcast None 7:28 AM American Crow 3 100+ …… … … … … … … … … … … … … American Crow 5 FO WSW… … … … … … … … … … … … … Common Raven 1 100+ …
… 2 411561 5075281 Agricultural field with spruce hedge 411347 5075486 Agricultural field with spruce hedge 10-15 km/h SE -6 Overcast None 7:35 AM None Observed N/A N/A …
… 3 411347 5075486 Agricultural field with spruce hedge 411071 5075611 Mature softwood along agricultural
field 10-15 km/h SE -6 Overcast None 7:42 AM Black-capped Chickadee 3 0-50 …
… … … … … … … … … … … … … Blue Jay 1 100+ …… … … … … … … … … … … … … Common Raven 1 50-100 …… … … … … … … … … … … … … Pileated Woodpecker 1 100+ …
… 4 411071 5075611 Mature softwood along agricultural field 410852 5075700 Mature mixedwood along small
stream 10-15 km/h SE -6 Overcast None 7:53 AM Hermit Thrush 1 100+ …
… … … … … … … … … … … … … Purple Finch 2 0-50 …… … … … … … … … … … … … … Red-breasted Nuthatch 1 50-100 …
… 5 410852 5075700 Mature mixedwood along small stream 410810 5075970 Mature softwood 10-15 km/h SE -6 Overcast None 8:06 AM American Crow 2 100+ …
… … … … … … … … … … … … … Pileated Woodpecker 1 100+ …… 6 410810 5075970 Mature softwood 411082 505983 Recent cutover 10-15 km/h SE -6 Overcast None 8:16 AM American Crow 1 100+ …… … … … … … … … … … … … … American Goldfinch 1 FO E… … … … … … … … … … … … … Hairy Woodpecker 1 100+ …… … … … … … … … … … … … … Purple Finch 1 50-100 …… 7 411082 505983 Recent cutover 411029 5076267 Mixed shrub growth 10-15 km/h SE -6 Overcast None 8:25 AM Common Raven 1 100+ …
… 8 411029 5076267 Mixed shrub growth 410862 5076510 Young hardwoods adjacent to recent cutover 10-15 km/h SE -2 Overcast None 8:32 AM American Crow 1 FO N
… … … … … … … … … … … … … American Crow 2 100+ …
… 9 410862 5076510 Young hardwoods adjacent to recent cutover 410650 5076645 Young spruce adjacent to recent
cutover 10-15 km/h SE -2 Overcast None 8:42 AM American Crow 9 FO E
… … … … … … … … … … … … … American Crow 1 50-100 …… … … … … … … … … … … … … American Goldfinch 1 50-100 …… … … … … … … … … … … … … American Goldfinch 1 FO NE… … … … … … … … … … … … … Hairy Woodpecker 1 0-50 …
… 10 410650 5076645 Young spruce adjacent to recent cutover 410394 5076790 Young spruce 15-20 km/hSE -2 Overcast None 8:58 AM Purple Finch 1 FO N
… 11 410394 5076790 Young spruce 410195 5076973 Mixed shrub growth along access road 15-20 km/hSE -2 Overcast None 9:05 AM American Crow 1 FO W
… … … … … … … … … … … … … American Crow 2 100+ …… … … … … … … … … … … … … Black-capped Chickadee 3 0-50 …… … … … … … … … … … … … … Black-capped Chickadee 1 50-100 …… … … … … … … … … … … … … Purple Finch 2 0-50 …
… 12 410311 5076866 Young mixedwoods along access road 410587 5076983 Young to mid-aged softwood along
access road; close to shrub swamp 15-20 km/hSE -2 Overcast None 9:21 AM Black-capped Chickadee 2 0-50 …
… … … … … … … … … … … … … Common Raven 1 50-100 …… … … … … … … … … … … … … Ring-billed Gull 1 FO N
… 13 410587 5076983
Young to mid-aged softwood along access
road; close to shrub swamp
410836 576847 Mid-aged softwood along powerline corridor 15-20 km/hSE -2 Overcast None 9:31 AM Black-capped Chickadee 1 50-100 …
… … … … … … … … … … … … … Purple Finch 1 0-50 …
… 14 410836 576847 Mid-aged softwood along powerline corridor 411030 5076657 Mid-aged softwood along powerline
corridor 15-20 km/hSE -2 Overcast None 9:37 AM American Crow 2 100+ …
… … … … … … … … … … … … … Black-capped Chickadee 1 50-100 …
… 15 411030 5076657 Mid-aged softwood along powerline corridor 411211 5076453 Mid-aged softwood along powerline
corridor 15-20 km/hSE -2 Overcast None 9:43 AM Black-capped Chickadee 8 0-50 …
… … … … … … … … … … … … … Red Crossbill 1 0-50 …… … … … … … … … … … … … … Red-breasted Nuthatch 1 0-50 …… … … … … … … … … … … … … Red-breasted Nuthatch 1 50-100 …
… 16 411211 5076453 Mid-aged softwood along powerline corridor 411315 5076224 Regenerating softwoods 15-20 km/hSE -2 Overcast None 9:58 AM Dark-eyed Junco 1 0-50 …
… 17 411315 5076224 Regenerating softwoods 411374 5075971 Shrub hardwoods along recent cutover and mid-aged mixedwood 15-20 km/hSE -2 Overcast None 10:05 AM American Crow 2 100+ …
… … … … … … … … … … … … … American Robin 1 100+ …
… 18 411374 5075971Shrub hardwoods along recent cutover and mid-
aged mixedwood411491 5075725 Edge of agricultural field and recent
cutover 15-20 km/hSE -2 Overcast None 10:22 AM Bald Eagle 1 100+ Sitting adjacent to nest
… 19 411491 5075725 Edge of agricultural field and recent cutover 411684 5075555 Edge of agricultural field and recent
cutover 15-20 km/hSE -2 Overcast None 10:31 AM Ring-necked Pheasant 1 50-100 …
… … … … … … … … … … … … … Ring-necked Pheasant 1 0-50 …
… 20 411684 5075555 Edge of agricultural field and recent cutover 411866 5075384 Edge of agricultural field, along
narrow shrub hedge 15-20 km/hSE -2 Overcast None 10:38 AM Ring-necked Pheasant 2 0-50 …
Table 1 - Page 2
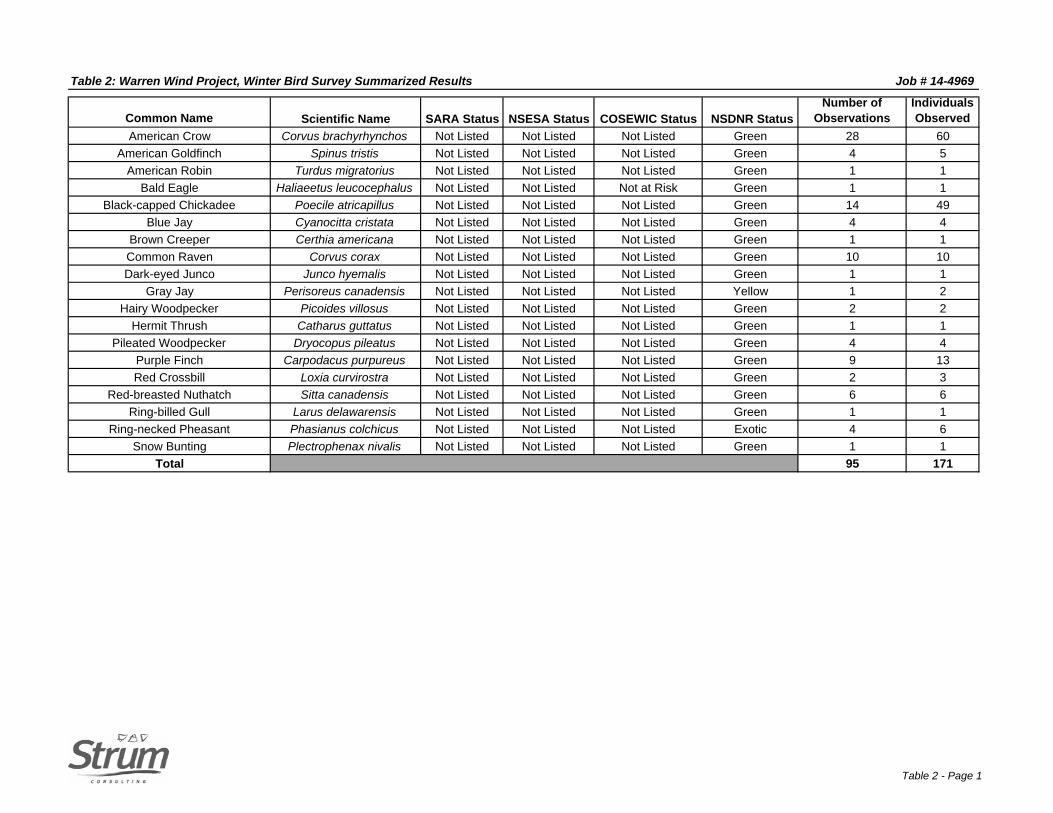
Table 2: Warren Wind Project, Winter Bird Survey Summarized Results
Common Name Scientific Name SARA Status NSESA Status COSEWIC Status NSDNR StatusNumber of
ObservationsIndividuals Observed
American Crow Corvus brachyrhynchos Not Listed Not Listed Not Listed Green 28 60American Goldfinch Spinus tristis Not Listed Not Listed Not Listed Green 4 5
American Robin Turdus migratorius Not Listed Not Listed Not Listed Green 1 1Bald Eagle Haliaeetus leucocephalus Not Listed Not Listed Not at Risk Green 1 1
Black-capped Chickadee Poecile atricapillus Not Listed Not Listed Not Listed Green 14 49Blue Jay Cyanocitta cristata Not Listed Not Listed Not Listed Green 4 4
Brown Creeper Certhia americana Not Listed Not Listed Not Listed Green 1 1Common Raven Corvus corax Not Listed Not Listed Not Listed Green 10 10Dark-eyed Junco Junco hyemalis Not Listed Not Listed Not Listed Green 1 1
Gray Jay Perisoreus canadensis Not Listed Not Listed Not Listed Yellow 1 2Hairy Woodpecker Picoides villosus Not Listed Not Listed Not Listed Green 2 2
Hermit Thrush Catharus guttatus Not Listed Not Listed Not Listed Green 1 1Pileated Woodpecker Dryocopus pileatus Not Listed Not Listed Not Listed Green 4 4
Purple Finch Carpodacus purpureus Not Listed Not Listed Not Listed Green 9 13Red Crossbill Loxia curvirostra Not Listed Not Listed Not Listed Green 2 3
Red-breasted Nuthatch Sitta canadensis Not Listed Not Listed Not Listed Green 6 6Ring-billed Gull Larus delawarensis Not Listed Not Listed Not Listed Green 1 1
Ring-necked Pheasant Phasianus colchicus Not Listed Not Listed Not Listed Exotic 4 6Snow Bunting Plectrophenax nivalis Not Listed Not Listed Not Listed Green 1 1
Total 95 171
Job # 14-4969
Table 2 - Page 1