Embed Size (px)
Citation preview
2004 Everglades Consolidated Report Appendix 8B-1
App. 8B-1-1
Appendix 8B-1: Annual Permit Compliance Monitoring Report
for Non-Everglades Construction Project Discharge Structures
Shi Kui Xue, Steven Hill and Richard Pfeuffer
INTRODUCTION
The non-Everglades Construction Project (non-ECP) permit (Florida Department of Environmental Protection No. 06,502590709) authorizes the South Florida Water Management District to operate and maintain structures (currently 38 structures), in compliance with the reporting requirements stated in Specific Conditions 5 and 12 of the non-ECP permit.
METHODS
WATER QUALITY AND HYDROLOGIC DATA
The water quality and hydrologic data evaluated in this appendix were retrieved from the South Florida Water Management District’s (SFWMD’s or District’s) DBHYDRO database. Before water quality data are entered into the database, the District follows strict quality assurance/quality control (QA/QC) procedures outlined in the Florida Department of Environmental Protection (FDEP)-approved Comprehensive Quality Assurance Plan (CompQAP, No. 870166G) (SFWMD, 1999a). The CompQAP provides assurances that the water quality monitoring program is providing accurate data and that sufficient progress is being made toward achieving water quality standards.
Methods for hydrologic data collection are documented in the Guidelines for the Collection of Hydrologic and Meteorologic Data (SJRWMD et al., 1994). The QA/QC procedures for hydrological data are found in the Guidelines for Quality Control and Quality Assurance of Hydrologic and Meteorological Data (SJRWMD et al., 1999).
PERMIT SAMPLING SITES
In addition to authorizing the operation and maintenance of non-Everglades Construction Project (non-ECP) structures, the non-ECP permit requires a routine water quality monitoring program to characterize the quality of water discharged through District structures. Currently, the non-ECP permit requires monitoring at four additional C-111 basin structures (upstream) that are

Appendix 8B-1 2004 Everglades Consolidated Report
App. 8B-1-2
controlled by the District, two structures that are controlled by the Village of Wellington (VOW), and one structure that is controlled by the North Springs Improvement District (NSID).
The District typically collects water quality samples on the upstream side of a structure or at a nearby location representative of the quality of water flowing through a structure. Structure locations are shown in Figure 1. In accordance with Specific Condition 16, the District previously submitted a Monitoring Locations Report to the FDEP on July 15, 1998 that included detailed information on the specific locations for sample collection for 44 structures. On August 9, 2001, the District submitted a minor modification to the non-ECP permit to include phase I of the Western C-11 Basin Critical Restoration Project (including operation and maintenance of the S-9A pump station). The current monitoring program encompasses 38 locations that provide the representative information to characterize the quality of water discharged through the 45 structures. The structure names, representative water quality monitoring location names, and sampling frequencies of the various categories of chemical constituents and physical properties required by the monitoring schedule denoted in the permit are shown in Appendix 8B-1a, Table 1.
PERMIT DATA ANALYSIS PERIODS
Specific Condition 12 requires the District to submit annual monitoring reports providing updates on water quality data and associated comparisons with state water quality standards. The water quality characterization includes an evaluation of compliance with Class III criteria for each monitoring location representative of a non-ECP structure.
Appendix 8B-1 provides the annual update of the non-ECP permit monitoring program (Specific Condition 12) and a comparison of water quality data at non-ECP structures to state water quality standards from Water Year 2003 (WY2003) (May 1, 2002 to April 30, 2003), the sixth year of non-ECP data. These comparisons fulfill the non-ECP permit requirements to measure progress toward achieving and maintaining compliance with state water quality standards.

2004 Everglades Consolidated Report Appendix 8B-1
App. 8B-1-3
Figure 1. Non-ECP discharge structures and additional upstream structures.

Appendix 8B-1 2004 Everglades Consolidated Report
App. 8B-1-4
Method Detection Limits
Each water quality constituent has a method detection limit (MDL) that essentially defines the minimum concentration, or level, at which the constituent can be quantified. The MDL is usually twice the background noise level associated with a test and represents that level at which the presence of the analyte can be reliably determined. The MDL does not represent a level at which an exact measurement can be determined. The practical quantitation limit (PQL) represents the lowest level achievable among laboratories within specified limits during routine laboratory operations and for which a measurement can be considered quantifiably reliable for a constituent. Generally, the PQL is four times the MDL, although different laboratories may establish PQLs at two to five times the MDL. In Appendix 8B-1, trace metal data that were reported to be less than the MDL were assigned a value equal to the MDL. Total phosphorus (TP) data that were less than the MDL of 4.0 micrograms per liter (µg/L) (or parts per billion [ppb]) were assigned a value of 4.0 ppb to provide a conservative basis for statistical analysis. For pesticide detections, concentrations greater than the PQL were considered reliable.
EXCURSION ANALYSIS FOR CLASS III CONSTITUENTS AND PESTICIDES
To evaluate compliance with water quality criteria in WY2003, constituent concentrations were compared to their respective Class III numeric criteria. If a constituent concentration exceeded its numeric criteria, then an excursion was recorded and the total number of excursions and the percent of excursions for the non-ECP structures were tabulated.
Trace Metals and Un-ionized Ammonia
The un-ionized portion of dissolved ammonia measured in a water sample was calculated and compared to the 0.02-milligram per liter (mg/L) criterion only if temperature and pH values had been recorded for that sample. For trace metals, the most recent trace metal criteria were used for evaluating the data even if the criteria had changed over time. When comparing the calculated criteria with trace metal concentrations, only water samples were used if hardness values were determined from that same sample, i.e., no extrapolations were made to samples without hardness data. The equations used in this appendix for calculated criteria for trace metals and un-ionized ammonia were derived from the equations listed in Rule 62-302.503, Florida Administrative Code (F.A.C.).
Total Phosphorus
The data for total phosphorus are presented in this appendix in time series plots and statistical box plots. For TP, any site with data > 50 ppb would be viewed as a “concern”, any site with data > 10 ppb would be viewed as a “potential concern”, and any site with data < 10 ppb would be viewed as “no concern”. This approach is consistent with the federal Settlement Agreement (i.e., Settlement Agreement dated July 26, 1991, entered in Case No. 88-1886-Civ-Hoeveler, U.S. District Court for the Southern District of Florida, as modified by the Omnibus Order entered in the case on April 27, 2001), which indicates that the District’s Stormwater Treatment Areas (STAs) are located and sized to deliver a uniform, long-term, annual flow-weighted mean TP concentration of 50 ppb or less at each inflow point to the Everglades Protection Area (EPA). Additionally, the Everglades Forever Act (EFA) mandates that the default TP criterion shall be 10 ppb in the EPA in the event that the FDEP does not adopt by rule such a criterion by December 31, 2003. There are additional TP concentration compliance limits for inflows to the

2004 Everglades Consolidated Report Appendix 8B-1
App. 8B-1-5
Everglades National Park (ENP or Park) by way of Shark River Slough (S-12S and S-333), Taylor Slough (S-332 and S-175), and the coastal basin (S-18C) outlined in Appendix A of the Settlement Agreement. However, Appendix 8B-1 does not track compliance with the interim or long-term TP concentration limits set forth in the Settlement Agreement.
The District’s categories of concern, potential concern, and no concern are based on a common-sense understanding of water resources protection. These terms, however, are not intended to be interpretations of state water quality standards or state water quality law. The FDEP, not the District, is responsible for interpreting whether a given constituent violates the numeric criterion, the narrative criterion, a water body’s designated uses, or the antidegradation policy.
Pesticides
The Everglades Protection Area pesticide monitoring program includes non-ECP permitted structures. For purposes of Appendix 8B-1, the WY2003 surface water pesticide analyses are presented in tables for the non-ECP structures only. The sediment pesticide analyses for WY2003 are presented in a separate table. Five upstream structures in the C-111 basin are included in the pesticide monitoring program and represent potential warning sites for pesticides that might be discharged into the Park.
DESCRIPTION OF NOTCHED BOX AND WHISKER PLOTS
Notched box and whisker plots were created to summarize data for each constituent that exceeded its numeric criteria. These plots also summarize the TP data collected at all monitoring locations. A notched box and whisker plot summarize selected statistical properties of the data sets. Notched box and whisker plots can be used to test for statistical significance between data sets at roughly a 95 percent confidence interval, to detect changes in constituent concentration variability over time, and to determine if trends exist. The notched box and whisker plots used for these summaries are based on McGill et al. (1978) (Table 1).
It is recognized that using notched box and whisker plots to determine differences between data sets with large differences in sample size may cause significant findings that are artifacts of the number of samples and the amount of variation in the data sets. The objective of providing the plots was to compare data from the current water year (WY2003) to those in previous individual permit water years (WY1998, WY1999, WY2000, WY2001, and WY2002) and previously established baseline data sets for the non-ECP discharge structures.

Appendix 8B-1 2004 Everglades Consolidated Report
App. 8B-1-6
Table 1. Description of notched box and whisker plots used in Appendix 8B.
Square represents data greater than 4 standard deviations above the median.
Diamond represents data greater than 2 standard deviations above the median.
Upper whisker is maximum data value or highest value not outside +2 standarddeviations.
Top of box is the 75th percentile (Q75).
Asterisk is mean concentration.Open circle in the notched box plot represents flow-weighted meanconcentration of TP at flow structures.Notch represents the 95% confidence interval for the median.
Bottom of box is the 25th percentile (Q25).
Lower whisker is minimum data value or lowest value not outside -2 standarddeviations.
1. Notches surrounding the medians provide a measure of the significance of differences between notched box plots. If the notches about two medians do not overlap, then the medians are significantly different at about a 95-percent confidence level.
2. At times, the variability in a data set may be quite high. When highly variable data are presented in a notched box and whisker plot, the width of the notch may be greater than the 25th or 75th percentile. When this occurs, the box plot appears as if it is folded from the end of the notch back towards the median. This is done automatically by the statistics program to save space within the figure being presented.
3. Notches are calculated using the following equation:
nQQMedianNotch )2575(58.1 −±=
Where: n = number of data points

2004 Everglades Consolidated Report Appendix 8B-1
App. 8B-1-7
RESULTS: WATER QUALITY EVALUATION AND EXCURSION ANALYSIS
In accordance with Specific Conditions 5 and 12(h) of the non-ECP permit, this section presents an update of constituent concentrations and physical properties measured during WY2003 (May 1, 2002 through April 30, 2003), the sixth year of non-ECP permit monitoring. For standards with numeric criteria, the data from the structures were assessed for compliance with those standards using the procedures in Rule 62-4.246, F.A.C. For parameters that have narrative water quality criteria, the concentrations obtained at each structure were reported using plots and summary statistics.
MONITORING OF PHYSICAL PARAMETERS, NUTRIENTS, MAJOR IONS, AND TRACE METALS
Descriptive Statistics
A summary of the data begins with a presentation of descriptive statistics for all water quality constituent concentrations and physical properties (excluding pesticides and priority pollutants) measured for non-ECP monitoring locations during WY2003 (Appendix 8B-1b, Table 2). The descriptive statistics (summary tables) are presented by monitoring location for each water quality parameter collected for the site. A reference is also provided in Appendix 8B-1b, Table 1, reflecting current state Class III criteria.
The statistical summary tables report the range of constituent concentrations, median values, the number of sample observations, selected data percentiles (25th and 75th), and flag parameters exhibiting excursions from Class III numeric criteria. Concentrations observed to be less than the lower limit of the analytical method (MDL) were set equal to the MDL for statistical analysis.
For parameters, such as nutrients, that have only narrative criteria, the tables provide basic information to assist with identifying water quality constituents that might be of concern. TP is the nutrient deemed to be of particular concern for the non-ECP structures. Additional discussion on this topic is provided in this section.
Excursions from Class III Criteria (Numeric)
Further analysis of excursions from Class III criteria was accomplished by summarizing the excursions, plotting the data for parameters exhibiting the excursions, discussing the parameters, and noting which ones are a concern. The excursion analysis is based on 11 water quality parameters (with a numeric criteria), shown in Table 2, that were collected for the non-ECP monitoring program and can be compared with applicable Class III water quality criteria listed in Rule 62-302.530, F.A.C.

Appendix 8B-1 2004 Everglades Consolidated Report
App. 8B-1-8
Parameter
WY2003 WY2002 WY2001 WY2000 WY1999 WY1998 Non-ECP
Baseline EFA
Baseline
Total Alkalinity 1:471 0:475 0:490 0:559 0:502 0:525 0:2845 1:2677
Dissolved Oxygen 436:649 456:597 455:637 558:697 485:581 459:551 2177:3018 1694:2615
Specific Conductance 1:664 0:600 2:637 5:698 0:589 3:551 12:3058 59:2615
pH 2:666 1:611 1:637 1:698 10:589 12:551 37:3008 6:2586 Turbidity 1:470 2:479 1:489 3:645 4:504 0:527 12:2842 10:2637
Un-Ionized Ammonia 0:477 0:478 3:485 1:622 20:501 7:448 10:2661 12:2548
Total Iron 0:72 0:74 1:186 0:270 1:244 0:261 5:1655 5:836 Total Cadmium 0:31 0:30 0:101 0:133 0:126 1:127 4:785 9:362
Total Lead ND ND 0:77 0:119 0:112 0:120 2:785 1:364 Total Copper 0:35 0:29 0:101 0:132 0:126 0:127 0:779 1:373
Total Zinc 0:31 0:25 0:100 0:129 0:125 0:127 2:786 3:363
Notes: 1st number indicates number of excursions; 2nd number indicates total number of samples collected.
ND = no data
WY2003 (May 1, 2002 through April 30, 2003); WY2002 (May 1, 2001 through April 30, 2002); WY2001 (May 1, 2000 through April 30, 2001); WY2000 (May 1, 1999 through April 30, 2000); WY1999 (May 1, 1998 through April 30, 1999); WY1998 (May 1, 1997 through April 30, 1998); non-ECP Baseline (October 1, 1988 through April 30, 1997); and EFA Baseline (October 1, 1978 through September 30, 1988).
Of the 11 parameters listed in Table 2, dissolved oxygen (DO), pH, alkalinity, specific conductance, and turbidity exhibited excursions at one or more locations during WY2003. Previous non-ECP annual monitoring reports provided summary tables showing the total number of excursions by individual monitoring location (SFWMD 2003, 2002, 2001, 2000, 1999b, and 1999c). Table 2 summarizes the previously reported information and compares the results with the current water year. A summary of observed excursions from Class III criteria for individual non-ECP monitoring locations during WY2003 is presented in Table 3. The monitoring locations are categorized in the table as either “into,” “within,” “from,” or “C-111 basin” locations as defined by the non-ECP permit.
Calculated criteria for the parameters were derived from the equations listed in Rule 62-302.530, F.A.C. When comparing the calculated criteria with trace metal or major ion concentrations, the only samples used were those in which hardness values were determined in the same sample as that of the trace metal or major ion.
Table 2. Summary of total number of excursions from state Class III criteria for all non-ECP monitoring sites during WY2003 (May 1, 2002 through April 30, 2003) and previous periods.

2004 Everglades Consolidated Report Appendix 8B-1
App. 8B-1-9
For parameters that exceeded Class III criteria during WY2003, time series plots and box whisker plots are provided in Appendix 8B-1c. These plots report the range of the data and the magnitude of the excursions and assist with detecting whether there are any increasing or decreasing trends observed in the data. To assess how far a physical parameter, major ion, or trace metal deviated above or below a Class III numeric criterion, a percent-departure line was added to the time series plots and box and whisker plots. These departure lines indicate whether a parameter value ranges more than 1, 10, or 100 percent beyond the numeric criteria. The physical parameters appear as horizontal lines across the plots. For the major ions and trace metals, the criteria change from sample to sample because the criteria for each parameter for a particular sample were calculated based on the hardness data calculated from the same sample. For data values that show an excursion, the percentage departure is annotated on the plot above the data value.
Dissolved Oxygen
Dissolved oxygen (DO) concentrations exhibited consistent excursions from Class III criteria during WY2003 (Table 3). About 67 percent (436 out of 649 samples) of DO concentrations measured at the non-ECP monitoring locations were less than the minimum criterion of 5 mg/L. The DO concentrations measured for WY2003 are consistent with the concentration levels and the frequency of excursions observed in previous water years, and there is a slight improvement (67 percent versus 76 percent) for DO excursions for WY2003 compared with WY2002. The DO excursions occurred at all locations. The DO time series and box and whisker plots are shown in Appendix 8B-1c.
Specific Conductance
Specific conductance was measured in 664 samples collected from the monitoring sites. Of these samples, one detected value exhibited an excursion exceeding the Class III criteria for specific conductance. The criteria for Class III waters requires that specific conductance not exceed a level greater than 50 percent above background, or 1,275 microhms per centimeter (µmhos/cm), whichever is greater. Specific conductance is not a parameter of concern for the non-ECP monitoring locations.
pH
The pH of a solution is defined as the negative base-10 logarithm of the hydrogen ion activity and can range from 0 (very acidic) to 14 (very alkaline). For freshwater systems, the Class III criteria for pH ranges from 6.0 to 8.5 units. For WY2003, excursions from the pH criterion occurred in less than 1 percent (2 out of 666) of the samples collected. As shown in Table 3, only one excursion with a pH greater than 8.5 units was observed at the S-143 site and one excursion with a pH less than 6.0 units was observed at NSID1 site. The pH data for S-143 and NSID1 are plotted in Appendix 8B-1c. This parameter is not a concern for structures going into the EPA.

Appendix 8B-1 2004 Everglades Consolidated Report
App. 8B-1-10
Table 3. Summary of excursions from state Class III surface water criteria for individual non-ECP monitoring sites during WY2003.
Alk
alin
ity
DO
Spec
ific
Con
duct
ance
pH
Tur
bidi
ty
Un-
Ioni
zed
Am
mon
ia
Iron
Cad
miu
m
Lea
d
Cop
per
Zinc
ACME1DS ACME1DS (0 : 12) (3 : 12) (0 : 12) (0 : 12) (0 : 12) (0 : 12) (0 : 4) (0 : 2) (0 : 2) (0 : 2)
ACME1 (Upstream of ACME1DS) VOW1 -ND- (4 :4) (0 : 4) (0 : 4) -ND- (0:2) -ND- -ND- (0:2) -ND-
G-94D G94D (0 : 13) (5 : 13) (0 : 13) (0 : 13) (0 : 13) (0 : 13) (0 : 4) (0 : 2) (0 : 2) (0 : 2)ACME2
(Upstream of G94D) VOW2 -ND- (2 : 3) (0 : 3) (0 : 3) -ND- (0 : 2) -ND- -ND- (0 : 2) -ND-
G-123 G123 (0 : 12) (9 : 30) (0 : 31) (0 : 31) (0 : 12) (0 : 12) (0 : 4) (0 : 2) (0 : 2) (0 : 2)S-9 S9 (0 : 18) (41 : 49) (0 : 50) (0 : 51) (0 : 16) (0 : 17) (0 : 4) (0 : 2) (0 : 2) (0 : 2)
S-9A S9A (0 : 2) (23 : 26) (0 : 26) (0 : 26) (0 : 8) (0 : 9) S-14 S14 (0 : 0) (0 : 1) (0 : 2) (0 : 2) (0 : 2)
S-18C S18C (0 : 17) (15 : 35) (0 : 35) (0 : 35) (0 : 17) (0 : 17) (0 : 4) (0 : 2) (0 : 2) (0 : 2)S-140 S140 (1 : 19) (11 : 33) (0 : 35) (0 : 35) (0 : 17) (0 : 18) (0 : 5) (0 : 2) (0 : 2) (0 : 2)S-175 S175 (0 : 13) (22 : 26) (0 : 26) (0 : 26) (0 : 13) (0 : 13) (0 : 4) (0 : 2) (0 : 2) (0 : 2)S-190 S190 (0 : 16) (6 : 17) (0 : 17) (0 : 17) (0 : 16) (0 : 16) (0 : 5) (0 : 2) (0 : 2) (0 : 2)S-332 S332 (0 : 12) (25 : 25) (0 : 25) (0 : 25) (0 : 12) (0 : 12) (0 : 3) (0 : 2) (0 : 2) (0 : 2)
S38B (0 : 4) (1 : 3) (0 : 4) (0 : 4) (0 : 4) (0 : 4) (0 : 4) (0 : 1) (0 : 1) (0 : 1)NSIDSP01 (0 : 4) (0 : 4) (1 : 4) (0 : 0)
G-64 G64 (0 : 4) (2 : 4) (0 : 4) (0 : 4) (0 : 4) (0 : 4) G-69 G69
G-71, S-346, S-347 S12D (0 : 26) (25 : 26) (0 : 26) (0 : 26) (0 : 26) (0 : 24) S-10E S10E (0 : 12) (5 : 12) (0 : 12) (0 : 12) (0 : 12) (0 : 12) S-141 S34S-142 S142 (0 : 15) (8 : 14) (0 : 15) (0 : 15) (0 : 15) (0 : 15) S-143 S11A (0 : 16) (3 : 14) (1 : 16) (1 : 16) (0 : 16) (0 : 16) S-144 S144 -ND- -ND- -ND- -ND- -ND- -ND- S-145 S145 (0 : 18) (11 : 16) (0 : 18) (0 : 18) (0 : 18) (0 : 18) S-146 S146 -ND- -ND- -ND- -ND- -ND- -ND- S-151 S151 (0 : 16) (10 : 16) (0 : 16) (0 : 16) (0 : 15) (0 : 16) S-333 S333 (0 : 26) (27 : 31) (0 : 31) (0 : 31) (0 : 26) (0 : 26) (0 : 5) (0 : 2) (0 : 2) (0 : 2)
S-339, S-340 C123SR84 (0 : 15) (7 : 13) (0 : 14) (0 : 15) (1 : 14) (0 : 15) G-94A, G-94B, G-94C G94B (0 : 12) (10 : 12) (0 : 12) (0 : 12) (0 : 11) (0 : 12) (0 : 4)
S-31, S-337 S31 (0 : 4) (4 : 4) (0 : 4) (0 : 4) (0 : 4) (0 : 4) S-34 S34 (0 : 17) (3 : 16) (0 : 17) (0 : 17) (0 : 17) (0 : 17) S-38 S38 (0 : 9) (5 : 7) (0 : 9) (0 : 9) (0 : 9) (0 : 9) S-39 S39 (0 : 19) (6 : 20) (0 : 20) (0 : 20) (0 : 19) (0 : 19) (0 : 1)
S-197 S197 -ND- -ND- -ND- -ND- -ND- -ND- S-334 S334 (0 : 16) (10 : 15) (0 : 16) (0 : 16) (0 : 16) (0 : 16)
S-343A, S-343B US41-25 (0 : 20) (24 : 25) (0 : 25) (0 : 25) (0 : 20) (0 : 19) S-344 S344 (0 : 4) (3 : 4) (0 : 4) (0 : 4) (0 : 4) (0 : 4) (0 : 4) S-174 S176 (0 : 14) (13 : 14) (0 : 14) (0 : 14) (0 : 14) (0 : 14) (0 : 4) (0 : 2) (0 : 2) (0 : 2)S-177 S177 (0 : 17) (15 : 18) (0 : 18) (0 : 18) (0 : 17) (0 : 17) (0 : 4) (0 : 2) (0 : 2) (0 : 2)S-178 S178 (0 : 15) (13 : 16) (0 : 16) (0 : 16) (0 : 15) (0 : 15) (0 : 4) (0 : 2) (0 : 2) (0 : 2)
S-331, S-173 S331-173 (0 : 21) (21 : 22) (0 : 22) (0 : 22) (0 : 21) (0 : 21) S-332D S332D (0 : 17) (44 : 50) (0 : 50) (0 : 50) (0 : 17) (0 : 17) (0 : 4) (0 : 2) (0 : 2) (0 : 2)
(1 : 471) (436 : 649) (1 : 664) (2 : 666) (1 : 470) (0 : 477) (0 : 72) (0 : 31) (0 : 35) (0 : 31)Notes:
INTO
1st number in parenthesis indicates number of excursions. 2nd number in parenthesis indicates total number of samples collected. Bold numbers indicate excursions from state class III criteria. -ND- indicates that no data was collected.
Totals
WIT
HIN
FRO
MC
-111
B
ASI
N
NSID1
Same as Data for S34 Shown Below
No Data (Structure Closed)
PARAMETERS
AREA STRUCTURESAMPLING
SITE

2004 Everglades Consolidated Report Appendix 8B-1
App. 8B-1-11
Alkalinity
The criterion for Class III waters requires that alkalinity not measure below 20 mg/L. Alkalinity was measured in 471 samples taken during WY2003. Of these samples, S-140 had one sample value (<1 mg/L) flagged as a potential excursion. The median alkalinity value for this site was 186.8 mg/L (Appendix 8B-1b, Table 3). Alkalinity does not appear to be a parameter of concern, since excursions have only occurred on one occasion during the past several water years.
Turbidity
The criterion for Class III waters requires that turbidity not exceed 29 nephelometric turbidity units (NTU) above natural background conditions. In general, the median value can be used to determine the average background levels on a site-to-site basis for the non-ECP monitoring locations to compare the measured turbidity at a site with Class III criteria. For instance, if background levels at a particular location indicate a median turbidity level of approximately 3 NTU and a turbidity measurement of 30 NTU was measured, then this would indicate that the measurement is 27 NTU above background levels. This measurement would not be considered an excursion, although the 30-NTU measurement might be construed as an excursion of the criterion in the absence of sufficient background data to calculate a median value for comparison.
Turbidity was measured in 470 samples collected during WY2003. The majority of the data are characterized by low turbidity values. Out of 470 samples, one sample collected at S-339 with a turbidity reading of 29.1 NTU was flagged as a potential excursion. The median turbidity value for this site was 1.675 NTU (Appendix 8B-1b, Table 3). Turbidity does not appear to be a parameter of concern, since excursions have only occurred on a few occasions during the past several water years.
Un-Ionized Ammonia
The Class III surface water quality criterion for ammonia was established for the un-ionized portion of dissolved ammonia. The un-ionized portion of dissolved ammonia measured in a water sample can be calculated and compared to the Class III criterion only if temperature and pH have been recorded for that sample. None of the 477 samples analyzed for un-ionized ammonia at all locations during WY2003 had concentrations that exceeded its criterion of 0.02 mg/L. During WY2001, the results for un-ionized ammonia in 3 out of 30 samples collected at S-142 exceeded this criterion. The situation improved in WY2002 and WY2003, and no excursions for un-ionized ammonia were observed in the surface waters discharging to the Park through non-ECP structures. In previous non-ECP monitoring reports, this parameter was identified as a potential concern for structures discharging “into” the Park and the upstream structures in the C-111 basin. Because no excursions were evident in the data for WY2003, un-ionized ammonia is not a concern in the upstream C-111 basin structures and the “into” structures discharging to the Park from the basin, indicating a significant improvement when compared with WY2001 results.
Trace Metals and Total Iron
Quarterly monitoring for total iron and the trace metals cadmium, copper, and zinc is conducted in accordance with the monitoring requirements of the non-ECP permit. There were no observed iron or trace metal concentrations in WY2003 that exceeded their respective Class III criteria. These metals are not parameters of concern for the non-ECP monitoring locations.

Appendix 8B-1 2004 Everglades Consolidated Report
App. 8B-1-12
Evaluation of Total Phosphorus
The non-ECP permit established the monitoring schedule shown in Appendix 8B-1a for the collection of TP at non-ECP structures. Sample collection is accomplished mainly through a grab-sample collection program. Grab samples are collected biweekly for a majority of the structures when flow is occurring at the structure; otherwise, collection is conducted at least once a month. A few exceptions exist for some non-ECP structures, where sampling is conducted biweekly only during flow events. Nutrients are the most frequently sampled parameters in the non-ECP monitoring program.
During WY2003, auto-samplers collected TP samples weekly at the ACME1, ACME2, S-9, S-9A, S-18C, S-190, S-140, NSID1 (S-38B), and G-123 pump structures. Deployment of the auto-samplers at these locations was previously identified as an improvement in the monitoring program for collecting TP data at “into” structures. Auto-samplers also collected samples at the S-332D structures located in the C-111 basin that discharge water into the S-332D detention area east of the Park.
The TP concentration data collected for all monitoring locations during WY2003 (the sixth year of non-ECP permit monitoring) are plotted in time series and notched box and whisker plots in Appendix 8B-1d. The plots are designed to provide a comparison of TP concentration data between WY2003 and previous periods (WY2002, WY2001, WY2000, WY1999, WY1998, EFA baseline, and non-ECP baseline) to detect changes and trends in TP concentrations at non-ECP monitoring locations. To assist with evaluation of the TP concentration data for a particular location discharging “into,” “within,” or “from” the EPA, horizontal lines representing the 10 ppb and 50 ppb concentration levels were added to the TP time series and notched box and whisker plots. TP concentrations are reported in ppb (or µg/L) unless otherwise noted.
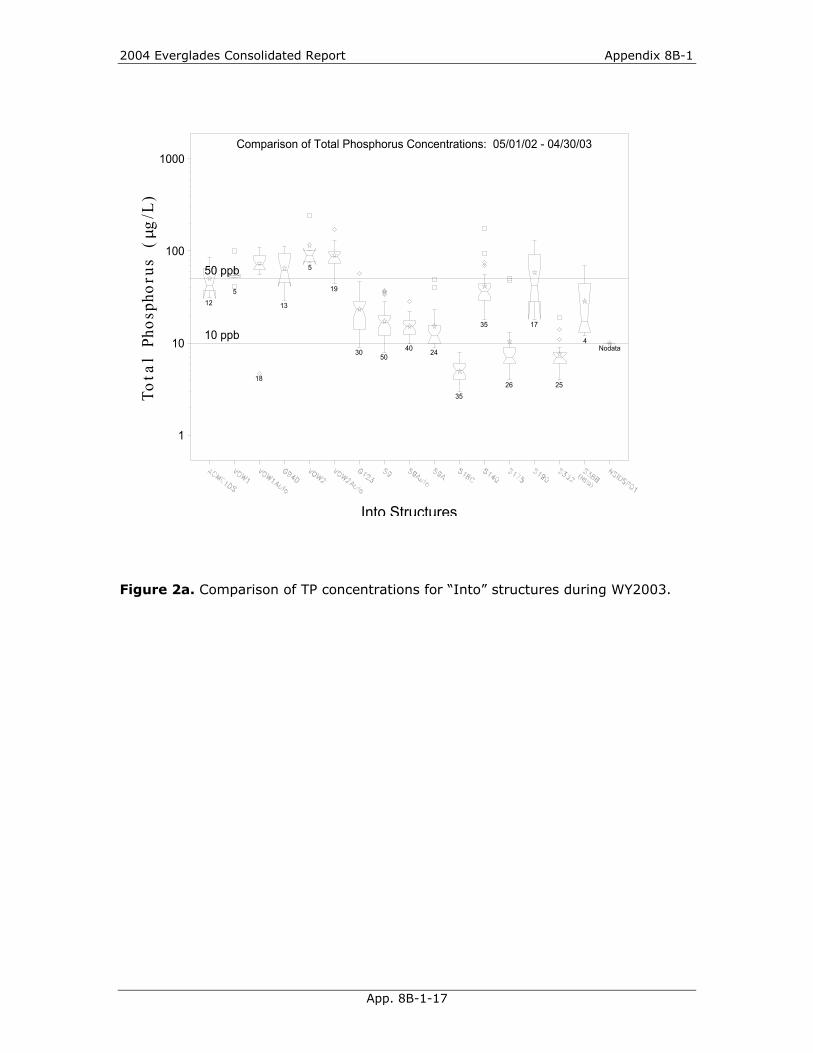
For WY2003, a statistical comparison of TP concentration data for all monitoring locations is presented as notched box and whisker plots in Figures 2a through 2d. The figures represent “into” (Figure 2a), “within” (Figure 2b), and “from” (Figure 2c) monitoring locations. Additionally, notched box and whisker plots were constructed for TP concentration data for the upstream C-111 basin monitoring locations (Figure 2d). Summary statistics of TP data collected for all monitoring locations are presented as a separate table in Appendix 8B-1b, Table 3 (grab and auto-sampler data are reported separately). A discussion of the TP concentration data observed during WY2003 is provided below.
“Into” Structures
Some of the highest TP concentrations for non-ECP structures discharging directly to the EPA during WY2003 were observed for the monitoring locations at the VOW2, VOW2Auto, ACME1DS, and G-94D culverts and the upstream pump stations (Figure 2a). Weekly auto-sampler collection and biweekly grab samples at the respective upstream monitoring locations VOW1 (ACME pump station 1) and VOW2 (ACME pump station 2) were initiated in July 2000 based on a monitoring agreement between the District and the Village of Wellington (VOW).

2004 Everglades Consolidated Report Appendix 8B-1
App. 8B-1-13
The ACME1DS and G-94D culverts, operated by the VOW, remain open at all times and discharge to the Arthur R. Marshall Loxahatchee National Wildlife Refuge (Refuge) when upstream pump stations ACME1 or ACME2 are operating. Sixteen District data collection trips to the culvert monitoring locations resulted in only 9 sampled flow events. The monitoring agreement with the VOW resulted in a sufficient number of samples (37) collected by both grab and auto-samplers upstream of the pump stations to cover a broad range of flows observed during pumping events and to adequately characterize the TP concentrations.
More than 75 percent of the data collected at the upstream VOW1 monitoring sites were below 88 ppb, with median TP values ranging between 43 and 72 ppb. More than 75 percent of the data collected at the upstream VOW2 monitoring sites were below 100 ppb, with median TP values ranging between 62 ppb and 89 ppb. Discharge data were not available for the ACEM1DS and G-94D culverts, although discharge data from the upstream pump stations during WY2003 (8,813 acre-feet [ac-ft] for ACME1 and 9,469 ac-ft for ACME2, respectively) can be used as an indication of the magnitude and occurrence of flow through the downstream culverts.
Additionally, high TP concentrations were observed for structures S-190 (feeder canal basin) and S-140 (L-28 basin), with median TP concentrations of 42 ppb and 36 ppb, respectively. During WY2003, structure S-190 discharged 88,026 ac-ft, and S-140 discharged 136,367 ac-ft into the western portion of WCA-3A.
The lowest TP concentrations were observed at structures in the C-111 basin at S-18C, S-174, S-177, S-331, S-173, and S-332D. These structures discharge to the southeastern portion of the Park by way of the C-111 canal and Taylor Slough. The TP data for these monitoring locations had median concentrations of 5 ppb for S-18C, 7 ppb for S-175, and 7 ppb for S-332, with 75 percent of the samples having concentrations below 6 ppb for S-18C, 9 ppb for S-175, and 8 ppb for S-332. During WY2003, the S-175 and S-332 structures were operated infrequently, discharging only 2,396 ac-ft for S-175 and 547 ac-ft for S-332 to the Park. The S-18C structure discharged approximately 134,932 ac-ft to the lower C-111 canal. S-178 had an average concentration of 29 ppb, the highest TP concentration in the C-111 basin, with a negative discharge of 598 ac-ft.
Structures S-9 (C-11 West basin) and G-123 (North New River basin) discharge directly to the eastern side of Water Conservation Area 3A (WCA-3A). The notched box and whisker plot for S-9, which is based on grab-sample data, indicates a TP concentration of less than 20 ppb for 75 percent of the data, a median concentration of 17 ppb, and a maximum concentration of 37 ppb (Figure 2a). In contrast, 75 percent of the data collected by the auto-sampler at S-9 is below 18 ppb, with a median concentration of 15 ppb and a maximum concentration of 28 ppb. G-123 exhibits a maximum concentration of 57 ppb. The monitoring schedule for structure G-123 requires biweekly grab sampling during flow events; otherwise, the samples are collected monthly. An auto-sampler collected samples every 7 days, resulting in 48 auto-samples and 30 grab samples collected during this period. During WY2003, procedures were also instituted to allow the determination of the volume of water discharged from the North New River Canal into the EPA. Previously, only an annual volume could be estimated. The structure did not discharge water over the entire period. The auto-sampler and grab sample TP values at G-123 were similar and had a median concentration of 16 ppb for auto-samples and 23 ppb for grab samples. Seventy-five percent of the data ranged from 25 ppb to 28 ppb, with a maximum concentration of 57 ppb for grab samples and 42 ppb for auto-samples.

Appendix 8B-1 2004 Everglades Consolidated Report
App. 8B-1-14
The North Springs Improvement District (NSID) operates several pump stations to remove excess runoff from the basin. The flow-proportional auto-sampler, headwater pressure sensor, and calibrated flow monitoring equipment with telemetry that monitor the NSID’s pump station discharges into Water Conservation Area 2A (WCA-2A) are functioning for the NSID basin. The surface water quality monitoring program has continued at the NSID pump station S-38B. No upstream water quality monitoring samples have been collected at NSIDSP01 during times of flow. Results from S-38B, and upstream data from NSIDSP01, are reported in Chapter 8B, Table 8B-1. A more complete presentation of the results from these stations can be found in Appendix 8B-1b, Table 3, and Appendix 8B-1e. Operation of the auto-sampler and telemetry equipment used to collect the data was delayed due to unforeseen pump repairs. The repairs have since been completed, and pump testing was performed. Pump curves were developed and programmed into the equipment. All systems are now operational and have not provided flow-weighted, proportional sampling data results for the WY2003 compliance report because no valid TP data was recorded from the auto-sampler at the NSID during WY2003.
Pump station 1 (NSID1) has the capability to discharge directly to WCA-2A, though discharges occur relatively infrequently. The NSID1 pump discharged approximately 688 ac-ft to WCA-2A during WY2003. The sampling location, designated as S-38B, is on the WCA-2A side of the structure. During WY2003, no samples were collected at S-38B during a flow event. The TP concentrations for the four samples collected at NSID1 ranged from 12 ppb to 69 ppb. Auto-sampling equipment for flow-proportional TP sampling has been installed at the NSID in WY2002 but no valid TP data has yet been recorded. There was no valid TP data for grab samples at the NSIDSP01 site during WY2003 because the failure of QA/QC requirements.
The remaining structure, S-14, is in the northwest corner of Shark River Slough in the Park. The structure is situated a short distance to the west of the S-12A structure. According to operational records, the S-14 structure remained closed during WY2003. Operational records also indicate that the structure has been closed since 1986. Therefore, routine sampling for TP was not conducted at this location in accordance with the “biweekly if flowing” sampling schedule required by the permit. In the event that this structure was operated, it would convey some of the discharge from WCA-3A outflow structures S-343A and S-343B, and some overland runoff from the southeastern portion of Big Cypress National Preserve to the Park.
During WY2003, the water quality monitoring program has been ongoing in the Boynton Farm basin. Although access limitations and other boundary issues still exist, surface water quality samples for most of the identified “into” structures have been obtained during times of flow. Recently, the Williams Nursery pump on the north side of the Refuge was voluntarily removed. As part of the expansion work for State Road 7 to the east of the remaining farm properties, the Lake Worth Drainage District is continuing its efforts to provide sufficient capacity to allow all discharges from the remaining farms to flow east. This would eliminate the need for these farms to pump west into the Refuge.
The headquarters property is owned and operated by the U.S. Fish and Wildlife Service (USFWS) and is bordered by several farms immediately east of the property boundary that discharge onto the property. The headquarters property is identified in the EFA as being within the EPA boundary, but the property is east of the protective levee, has no connection to discharge westward to WCA-1, and stands alone as an isolated parcel. During WY2003, data collected for the Amestory Farm include sites BFBAFCP, BFBAFNP, and BFBAFSP; data collected for the Dubois Farm include sites BFBDFCP, BFBDFNP, BFBDFSP, and BFBDFWP; data collected for the Mecca Farm include sites BFBMFCP, BFBMFSP, and BFBMFNP; and data collected for the Williams Nursery include site BFBWNCP. These are event-driven grab samples that have no

2004 Everglades Consolidated Report Appendix 8B-1
App. 8B-1-15
associated flow measurements. The data are provided in Table 4, which shows extremely high TP concentrations (mean concentrations ranging from 310 ppb to 1,656 ppb).
“Within” Structures
For structures discharging “within” the EPA during WY2003, low TP concentrations were observed for structures S-12D and S-333, which convey discharges from WCA-3A to the Park (Figure 2b). The monitoring location for S-12D serves as a surrogate monitoring location for the non-ECP permit structures G-71, S-346, and S-347. The median TP concentrations at these monitoring locations were 11 ppb and 12 ppb at S-12D and S-333, respectively, with 75 percent of the data below 15 ppb for S-12D and S-333. The maximum concentration observed was 23 ppb for S-12D and S-333, respectively. The discharge volumes for the period were 226,449 ac-ft for S-12D, and 207,064 ac-ft for S-333.
Higher concentrations were observed at structures S-145 which convey discharges from WCA-2A to WCA-2B. The structures usually operate simultaneously. Maximum concentration was 77 ppb, median value was 12 ppb, and 75 percent of the data (17 samples) was below 22 ppb at S-145. Discharge volumes ranged from 22,790 ac-ft at S-146, to 39,656 ac-ft at S-145.
In addition to monitoring the water quality at structure S-34, the data from the location are representative of the water quality conditions for structure S-141, which conveys discharges from WCA-2B to the North New River Canal just upstream of S-34. The TP concentrations from the S-34 location ranged from 9 ppb to 58 ppb, with a median value of 20 ppb.
The highest TP concentrations were observed at structures S-10E and S-151 and at the monitoring site C123SR84, the surrogate location for structures S-339 and S-340. The S-10E structure conveys discharges from the Refuge to the northern portion of WCA-2A downstream of pump station S-6. Sampling at the S-10E location occurs upstream of the structure and is near the western rim canal in the Refuge. During WY2003, the S-10E structure remained closed (Appendix 8B-1a, Table 2). The TP concentrations (non-flow event) for S-10E ranged from 29 ppb to 128 ppb, with a median concentration of 52 ppb. Structure S-151 discharged approximately 125,116 ac-ft during WY2003. TP concentrations ranged from 13 ppb to 37 ppb, with a median value of 18 ppb. Structures S-339 and S-340, located upstream of S-151 in the Miami Canal, discharged about 269,546 ac-ft for S-339 and 109,209 ac-ft for S-340. TP concentrations at C123SR84 ranged from 10 ppb to 109 ppb, with a median value of 33 ppb.
“From” Structures
The TP concentrations collected during WY2003 for the structures classified as “from” are summarized in the box and whisker plot shown in Figure 2c. Structure G-94B exhibited the highest TP concentrations, which ranged from 26 ppb to 143 ppb. The median TP concentration at this structure was 47 ppb, with 75 percent of the data below 51 ppb. G-94B is also the surrogate sampling site for structures G-94A and G-94C. All three structures are located in the L-40 levee on the eastern side of the Refuge and provide water supply releases from the Refuge to the Lake Worth Drainage District (LWDD). Additionally, the District owns and maintains the structures, but the LWDD operates them.
The G-94A and G-94B structures, when open, allow interior LWDD canals to fill. The direction of flow always has been toward the LWDD canal system. The G-94C structure is operated similarly.

Appendix 8B-1 2004 Everglades Consolidated Report
App. 8B-1-16
The G-94C structure was used intermittently for water supply purposes. The total discharge from the Refuge to the LWDD system was approximately 23,397 ac-ft (Appendix 8B-1a, Table 2). Operational records were unavailable to determine the frequency and magnitude of water supply releases to LWDD canals during WY2003 by way of the G-94A and G-94B structures.
The next highest TP concentrations were observed at S-39, with TP concentrations ranging from 12 ppb to 74 ppb, with a median value of 29 ppb. The structure discharged approximately 206,697 ac-ft during WY2003. During that period, four samples were collected at S-344. The TP concentrations ranged from 9 ppb to 63 ppb and the median concentration for the four samples was 14 ppb.
For the remainder of the “from” structure monitoring locations (S-31, S-34, S-38, S-334, S-337, S-343A, and S-343B), 75 percent of the observed TP concentrations were below 33 ppb, with median values ranging from 12 ppb to 20 ppb.
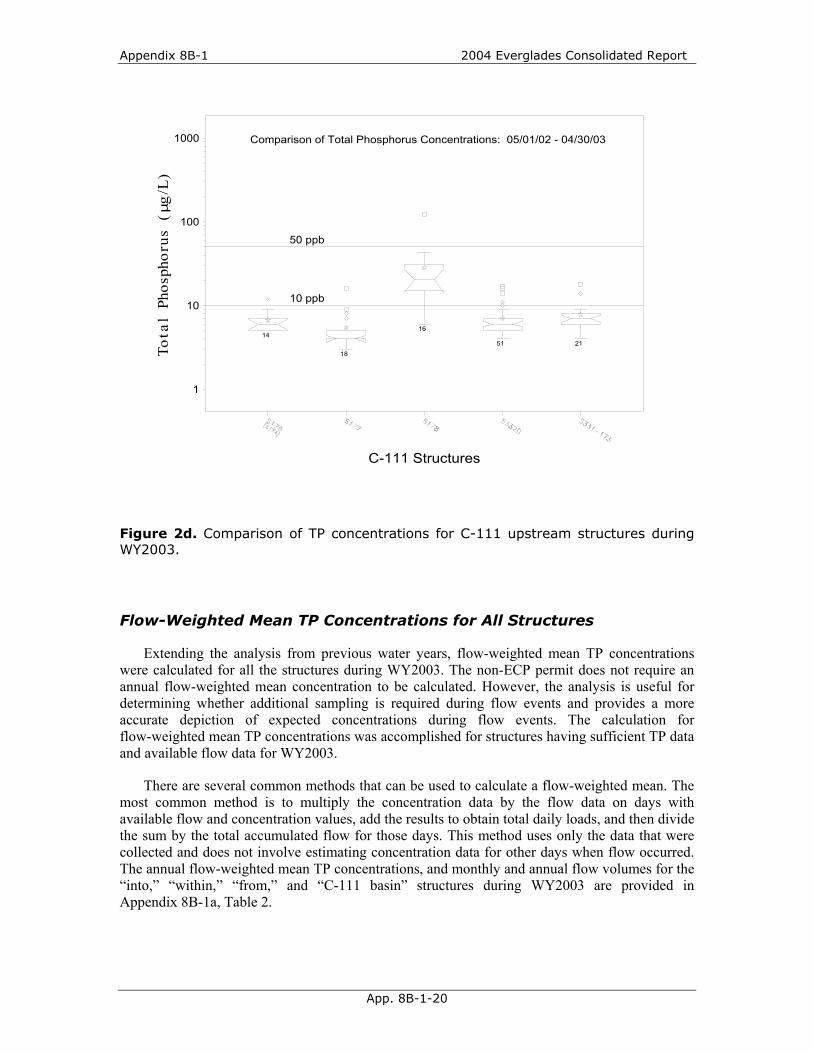
C-111 Basin Upstream Structures
Structures S-176, S-177, S-178, S-331, and S-173, shown in Figure 2d, are C-111 basin structures located upstream of “into” structures S-18C, S-332, and S-175. Seventy-five percent of the TP concentration data collected for these structures was below 31 ppb, with the median values ranging between 4 ppb and 21 ppb. The maximum TP at S-178 is 122 ppb, with a median TP concentration of 21 ppb, which was significantly higher than the rest of the C-111 basin upstream structures.
2004 Everglades Consolidated Report Appendix 8B-1
App. 8B-1-17
12 5
18
13
5
19
30 50 40 24
35
35
26
17
25
4
50 ppb
10 ppbNodata
Comparison of Total Phosphorus Concentrations: 05/01/02 - 04/30/03To
tal
Phos
phor
us (
µg/L
)
1
10
100
1000
Into Structures
Figure 2a. Comparison of TP concentrations for “Into” structures during WY2003.

Appendix 8B-1 2004 Everglades Consolidated Report
App. 8B-1-18
Figure 2b. Comparison of TP concentrations for “Within” structures during WY2003.
4
26
12
17 15
15
17
16
32
15
50 ppb
10 ppbNodata
Comparison of Total Phosphorus Concentrations: 05/01/02 - 04/30/03To
tal
Phos
phor
us (
µg/
L)
1
10
100
1000
Within Structures

2004 Everglades Consolidated Report Appendix 8B-1
App. 8B-1-19
Figure 2c. Comparison of TP concentrations for “From” structures during WY2003.
12
4 17 8
18 16
26 4
50 ppb
10 ppb
Comparison of Total Phosphorus Concentrations: 05/01/02 - 04/30/03
Tota
l Ph
osph
orus
(µ
g/L
)
1
10
100
1000
From Structures
Appendix 8B-1 2004 Everglades Consolidated Report
App. 8B-1-20
Figure 2d. Comparison of TP concentrations for C-111 upstream structures during WY2003.
Flow-Weighted Mean TP Concentrations for All Structures
Extending the analysis from previous water years, flow-weighted mean TP concentrations were calculated for all the structures during WY2003. The non-ECP permit does not require an annual flow-weighted mean concentration to be calculated. However, the analysis is useful for determining whether additional sampling is required during flow events and provides a more accurate depiction of expected concentrations during flow events. The calculation for flow-weighted mean TP concentrations was accomplished for structures having sufficient TP data and available flow data for WY2003.
There are several common methods that can be used to calculate a flow-weighted mean. The most common method is to multiply the concentration data by the flow data on days with available flow and concentration values, add the results to obtain total daily loads, and then divide the sum by the total accumulated flow for those days. This method uses only the data that were collected and does not involve estimating concentration data for other days when flow occurred. The annual flow-weighted mean TP concentrations, and monthly and annual flow volumes for the “into,” “within,” “from,” and “C-111 basin” structures during WY2003 are provided in Appendix 8B-1a, Table 2.
14
18
16
51 21
50 ppb
10 ppb
Comparison of Total Phosphorus Concentrations: 05/01/02 - 04/30/03
Tota
l Ph
osph
orus
(µ
g/L
)
1
10
100
1000
C-111 Structures

2004 Everglades Consolidated Report Appendix 8B-1
App. 8B-1-21
A more detailed analysis of the WY2003 annual flow-weighted mean TP concentration data for each “into” structure is shown in Table 4. The calculations were based on two methods for determining flow-weighted mean concentrations. The first method calculates the flow-weighted mean TP concentration using only days of flow and associated TP data. The second method uses an estimation algorithm to determine TP concentrations on all days with positive flow for which no observed values are available.
The two methods resulted in similar calculations for the flow-weighted mean concentration at most of the “into” structures. The calculation methods yielded slightly different results for the G-94D site (117 ppb versus 92 ppb) and the S-140 site (65 ppb versus 62 ppb). Table 4 presents the results for the flow-weighted mean TP concentrations at “into” sites during WY2003. The highest flow-weighted mean TP concentration for the “into” structures during WY2003 was observed at the ACME2 pump station, followed by G-94D, S-190, ACME1, ACME1DS, and the S-140 pump stations. These sites are designated as a concern for TP.
The lowest flow-weighted mean TP concentrations were observed at the S-18C, S-175, and S-332 monitoring locations. These locations are the subject of interim and long-term compliance limits stipulated in the federal Settlement Agreement; therefore, these are viewed as a potential concern for TP.

Appendix 8B-1 2004 Everglades Consolidated Report
App. 8B-1-22
Table 4. Annual flow-weighted mean TP concentrations for WY2003.
Stru
ctur
e
Wat
er Q
ualit
y
S
tatio
n Id
Tota
l Flo
w V
olum
e (a
cre-
feet
)
Sam
ple
Siz
e
(Gra
b)
Num
ber o
f Day
s w
ith
Pos
itive
Flo
w
Arit
hmet
ic A
vera
ge
(Gra
b)(µ
g/L)
Sam
ple
Siz
e
(Com
p)
Sam
ple
Type
Tota
l Sam
ples
C
olle
cted
Dur
ing
Flow
Flow
-Wei
ghte
d 2
Mea
n C
once
ntra
tion
(µg/
L)
Flow
-Wei
ghte
d 3
Mea
n C
once
ntra
tion
(µg/
L)
TP L
oad
(kg)
ACME1DS ACME1DS 8,813 6 11 48 6 51 0 Grab 4 3 80 7 76 827
ACME1 VOW1 8,813 5 48 69 17 8 Auto 5 & Grab 4
37 83 80 867
G94D G94D 9,469 6 16 75 6 92 0 Grab 4 9 117 7 92 1,076
ACME2 VOW2 9,469 5 75 143 19 8 Auto 5 & Grab 4
67 108 119 1,387
NSIDSP01 688 ND ND ND 0 9 Grab 4 ND ND ND ND
S-38B (WCA-2A
near NSID1)688 4 4 29 0 Auto 5 &
Grab 40 ND ND ND
G-123 G123 0 30 0 23 48 8 Auto 5 & Grab 4
0 ND ND1 0
S-9 S9 264,301 50 214 17 36 Auto 5 & Grab 4
219 17 17 5,580
S-9A S9A ND 24 ND 15 23 Auto 5 & Grab 4
ND ND ND ND
S-175 S175 2,396 26 2 10 0 Grab 4 2 10 9 27
S-332 S332 547 26 9 8 0 Grab 4 1 ND 1 6 4
S-18C S18C 134,932 35 270 5 0 Auto 5 & Grab 4
6 6 7 1,200
S-140 S140 136,367 35 200 42 39 8Auto 5 & Grab 4
189 65 62 10,191
S-190 S190 88,026 17 233 58 40 8 Auto 5 & Grab 4
215 84 86 9,358
Various10 Various10 ND1 55 ND1 310-1656 ND1 Grab 4 ND1 ND1 ND1 ND1
1)
2)
3)4)5)6)
7)
8)
9)
10)
Auto-sampler installed upstream of structure during WY2002, but no data are available.
Sites include BFBAFCP, BFBAFNP, BFBAFSP, BFBDFCP, BFBDFNP, BFBDFSP, BFBDFWP, BFBMFCP, BFBMFSP, BFBMFNP, and BFBWNCP.
Flow-weighted mean concentration based on days of flow and monitored TP data only.
Flow-weighted mean concentration based on estimation algorithm to determine TP concentration on non monitored days
Auto-sampler installed upstream of structure during WY2001.
Flow data from upstream pump structures, ACME1 and ACME2, is representative of the flow through the ACMD1DS and G94D culverts, respectively.Flow-weighted mean concentrations for ACME1DS and G94D were calculated using the flow data at upstream structures ACME1 and ACME2, respectively.
Grab indicates samples collected by grab sampling methodology.Auto indicates that samples were collected by automatic composite samples.
Notes:
ND - no data are available.
L-28
Feeder Canal
Hyd
rolo
gic
B
asin
ACME (Basin B)
Boynton Farms
North New River
C-111
North Springs Improv. District NSID1
C-11 West

2004 Everglades Consolidated Report Appendix 8B-1
App. 8B-1-23
PESTICIDE MONITORING
Pesticides in Surface Waters and Sediments
The quarterly surface water and semiannual sediment pesticide sampling at the 15 non-ECP sites (Figure 3) for WY2003 was conducted during June 2002, September 2002, November 2002, and March 2003. Representative MDLs and PQLs for the pesticide analytes are listed in Table 5. The Department of Environmental Protection Central Laboratory in Tallahassee, Florida performed all the pesticide analyses. Refer to the Quality Assurance Evaluation section of the individual pesticide event reports for a summary of any limitations on data validity that might influence the utility of these data. The individual reports can be found online at the District’s Website at http://www.sfwmd.gov/curre/pest/pestindex.htm.
To evaluate potential impacts on aquatic life resulting from intermittent pesticide exposure, the maximum observed concentration is compared to the criterion maximum concentration published by the U.S. Environmental Protection Agency (USEPA) under Section 304 (a) of the Clean Water Act (CWA), and as promulgated in Chapter 62-302, F.A.C. For compounds not specifically listed, Rule 62-302.200, F.A.C., allows for acute and chronic toxicity standards. These standards are calculated as one-third and one-twentieth, respectively, of the amount lethal to 50 percent of the test organisms in 96 hours, where the 96-hour EC50 or LC50 is the lowest value determined for a species significant to the indigenous aquatic community. Table 6 lists representative toxicity levels for selected freshwater aquatic invertebrates and fishes.
Table 7 lists the pesticides detected in surface water samples collected during WY2003. Four surface water samples were collected at each site and were analyzed for all parameters. Pesticides with concentrations greater than their respective Class III criterion or toxicity limit were assigned to the “concern” excursion category, whereas those higher than the PQL were assigned to the “potential concern” excursion category. None of the surface water detections were identified as a concern.
Table 8 lists the pesticides detected in the sediment samples collected during WY2003. Two sediment samples were collected at each site and were analyzed for all parameters. Pesticides with concentrations greater than the PQL were assigned to the “potential concern” excursion category. Dichlorodiphenyldichloroethane (DDD), a dichlorodiphenyltrichloroethane (DDT) metabolite and insecticide, was detected at several locations at levels of “potential concern”. Additionally, one detected concentration of endosulfan sulfate, which is a metabolite of the insecticide endosulfan, was identified at a level of “potential concern”.

Appendix 8B-1 2004 Everglades Consolidated Report
App. 8B-1-24
Figure 3. Pesticide monitoring network for non-ECP structures.

2004 Everglades Consolidated Report Appendix 8B-1
App. 8B-1-25
Table 5. Minimum detection limits (MDLs) and practical quantitation limits (PQLs) for pesticides determined in June 2002.
NA = not analyzed
Pesticide or metaboliteWater: range of MDL-PQL (µg/L)
Sediment: range of MDL-PQL (µg/Kg)
Pesticide or metaboliteWater: range of MDL-PQL (µg/L)
Sediment: range of MDL-PQL (µg/Kg)
2,4-D 0.8 - 3.2 17 - 520 endosulfan sulfate 0.0019 - 0.0192 0.88 - 24.82,4,5-T 0.8 - 3.2 17 - 520 endrin 0.019 - 0.088 1.6 - 482,4,5-TP (silvex) 0.8 - 3.2 17 - 520 endrin aldehyde 0.0042 - 0.0192 0.82 - 24.8alachlor 0.047 - 0.216 25 - 760 ethion 0.019 - 0.088 2.1 - 60aldrin 0.0021 - 0.0096 0.41 - 12.4 ethoprop 0.019 - 0.088 4.1 - 124ametryn 0.0094 - 0.044 2.1 - 60 fenamiphos (nemacur) 0.028 - 0.132 16 - 480atrazine 0.0094 - 0.192 2.1 - 60 fonofos (dyfonate) 0.019 - 0.088 4.1 - 124atrazine desethyl 0.0094 - 0.044 N/A heptachlor 0.0023 - 0.0104 0.41 - 12.4atrazine desisopropyl 0.0094 - 0.044 N/A heptachlor epoxide 0.0019 - 0.0088 0.41 - 12.4azinphos methyl (guthion) 0.019 - 0.088 2.1 - 60 hexazinone 0.019 - 0.088 8.2 - 248α-BHC (alpha) 0.0021 - 0.0096 0.41 - 12.4 imidacloprid 0.2 - 0.4 N/Aβ-BHC (beta) 0.0032 - 0.0148 0.41 - 12.4 linuron 0.2 - 0.4 8.2 - 120δ-BHC (delta) 0.0021 - 0.0096 0.82 - 24.8 malathion 0.028 - 0.132 6.2 - 184γ-BHC (gamma) (lindane) 0.0019 - 0.0088 0.41 - 12.4 metalaxyl 0.047 - 0.216 N/Abromacil 0.038 - 0.172 16 - 480 methamidophos N/A 21 - 600butylate 0.019 - 0.088 N/A methoxychlor 0.0098 - 0.044 2 - 60carbophenothion (trithion) 0.015 - 0.068 2 - 60 metolachlor 0.057 - 0.26 21 - 600chlordane 0.0094 - 0.044 6.2 - 184 metribuzin 0.019 - 0.088 4.1 - 124chlorothalonil 0.015 - 0.068 2 - 60 mevinphos 0.057 - 0.308 8.2 - 248chlorpyrifos ethyl 0.019 - 0.088 2.1 - 60 mirex 0.011 - 0.052 1.6 - 48chlorpyrifos methyl 0.0094 - 0.044 4.1 - 124 monocrotophos (azodrin) N/A 41 - 1240cypermethrin 0.019 - 0.088 2 - 60 naled 0.075 - 0.348 33 - 1000DDD-P,P’ 0.0045 - 0.0208 0.82 - 24.8 norflurazon 0.019 - 0.088 4.1 - 124DDE-P,P’ 0.0038 - 0.0172 0.82 - 31.6 parathion ethyl 0.019 - 0.088 6.2 - 184DDT-P,P’ 0.0038 - 0.0172 1.2 - 36.8 parathion methyl 0.019 - 0.088 6.2 - 184demeton 0.11 - 0.52 41 - 1240 PCB 0.019 - 0.088 8.6 - 560diazinon 0.019 - 0.088 4.1 - 124 permethrin 0.015 - 0.068 2.5 - 180dicofol (kelthane) 0.042 - 0.192 6.2 - 184 phorate 0.028 - 0.132 2.1 - 60dieldrin 0.0019 - 0.0088 0.41 - 12.4 prometryn 0.019 - 0.088 6.2 - 184disulfoton 0.019 - 0.088 4.1 - 124 prometon 0.019 - 0.088 N/Adiuron 0.2 - 0.4 8.2 - 120 simazine 0.0094 - 0.044 2.1 - 60α-endosulfan (alpha) 0.0038 - 0.0172 0.41 - 12.4 toxaphene 0.071 - 0.328 31 - 920β-endosulfan (beta) 0.0038 - 0.0172 0.41 - 12.4 trif luralin 0.0075 - 0.0348 1.6 - 48

Appendix 8B-1 2004 Everglades Consolidated Report
App. 8B-1-26
Table 6. Toxicity of pesticides ( g/L) to selected freshwater aquatic invertebrates and fishes.
48 hr EC50 96 hr LC50 96 hr LC50
Common name Water flea
Fathead Minnow (#) Bluegill
Daphnia acute chronic Pimephales acute chronic Lepomis acute chronic
magna toxicity (*) toxicity (*) Promelas toxicity toxicity macrochirus toxicity toxicity
2,4-D 25,000 (7) 8333 1250 133,000 (7) 44333 6650 180,000 (8) 60000 9000
- - - - - - 900 (48 hr) (6) - -
Ametryn 28,000 (7) 9333 1400 - - - 4,100 (4) 1367 205
Atrazine 6900 (7) 2300 345 15,000 (7) 5000 750 16,000 (4) 5333 800
Bromacil - - - - - - 127,000 (7) 42333 6350
DDD, p,p' 3,200 (6) 1067 160 4,400 (1) 1467 220 42 (1) 14 2.1
DDE, p,p' - - - - - - 240 (1) 80 12
Diuron 1,400 (7) 467 70 14,200 (7) 4733 710 5,900 (4) 1967 295
Endosulfan 166 (7) 55 8 1 (1) 0.3 0.05 1 (1) 0.33 0.05
- - - - - - 2 (3) 0.67 0.10
- - - - - - - - -
- - - - - - - - -
Hexazinone 151,600 (7) 50533 7580 274,000 (4) 91333 13700 100,000 (7) 33333 5000
Norflurazon 15,000 (7) 5000 750 - - - 16,300 (7) 5433 815
Prometon - - - - - - 40,000 (5) 13333 2000
Simazine 1,100 (7) 367 55 100,000 (7) 33333 5000 90,000 (4) 30000 4500
Trifluralin 625 (7) 208 31 105 (7) 35 5 60 (4) 20 3
(*) Florida Administrative Code (FAC) 62-302.200, for compounds not specifically listed, acute and chronic toxicity standards are calculated as
one-third and one-twentieth, respectively, of the amount lethal to 50% of the test organisms in 96 hours, where the 96 hour LC50 is the lowest value
which has been determined for a species significant to the indigenous aquatic community.
(#) Species is not indigenous. Information is given for comparison purposes only.
(1) Johnson, W. W. and M.T. Finley (1980). Handbook of Acute Toxicity of Chemicals to Fish and Aquatic Invertebrates. U.S. Department of the Interior,
Fish and Wildlife Service Resource Publication 137. Washington, DC.
(2) U.S. Environmental Protection Agency (1977). Silvacultural Chemicals and Protection of Water Quality. Seattle, WA. EPA-910/9-77-036.
(3) Schneider, B.A. (Ed.) (1979). Toxicology Handbook, Mammalian and Aquatic Data, Book 1: Toxicology Data. U.S. Environmental Protection Agency.
U.S. Government Printing Office. Washington, DC. EPA-5400/9-79-003.
(4) Hartley, D. and H. Kidd. (Eds.) (1987). The Agrochemicals Handbook. Second Edition, The Royal Society of Chemistry. Nottingham, England.
(5) Montgomery, J.H. (1993). Agrochemicals Desk Reference: Environmental Data. Lewis Publishers. Chelsea, MI.
(6) Verschueren, K. (1983). Handbook of Environmental Data on Organic Chemicals. Second Edition, Van Nostrand Reinhold Co. Inc. New York, NY.
(7) U.S. Environmental Protection Agency (1991) Pesticide Ecological Effects Database, Ecological Effects Branch, Office of Pesticide Programs,
Washington, D.C.
(8) Mayer, F.L. , and M.R. Ellersieck. (1986). Manual of Acute Toxicity: Interpretation and Database for 410 Chemicals and 66 Species of
Freshwater Animals. United States Fish and Wildlife Service Publication No. 160.

2004 Everglades Consolidated Report Appendix 8B-1
App. 8B-1-27
Table 6. Continued.
96 hr LC50 96 hr LC50 96 hr LC50
common name Largemouth Bass Rainbow Trout (#) Channel Catfish
Micropterus acute chronic Oncorhynchus acute chronic Ictalurus acute chronic
salmoides toxicity toxicity Mykiss toxicity toxicity punctatus toxicity toxicity
2,4-D - - - 100,000 (4) 33333 5000 - - -
- - - 110,000 (7) 36667 5500 - - -
ametryn - - - 8,800 (4) 2933 440 - - -
atrazine - - - 8,800 (4) 2933 440 7,600 (4) 2533 380
bromacil - - - 36,000 (7) 12000 1800 - - -
DDD, p,p' 42 (1) 14 2.1 70 (1) 23.3 3.5 1,500 (1) 500 75
DDE, p,p' - - - 32 (1) 10.7 1.6 - - -
diuron - - - 5,600 (4) 1867 280 - - -
endosulfan - - - 1 (1) 0.33 0.050 1 (1) 0.3 0.05
- - - 3 (2) 1 0.15 1.5 (7) 0.5 0.08
- - - 1 (3) 0.33 0.050 - - -
- - - 0.3 (5) 0.10 0.015 - - -
hexazinone - - - 180,000 (7) 60000 9000 - - -
norflurazon - - - 8,100 (7) 2700 405 >200,000 (4) >67,000 >10,000
prometon - - - 12,000 (5) 4000 600 - - -
simazine - - - 100,000 (7) 33333 5000 - - -
trifluralin 75 (7) 25 4 30 (4) 10 1.5 210 (7) 70 11
(*) Florida Administrative Code (FAC) 62-302.200, for compounds not specifically listed, acute and chronic toxicity standards are calculated as
one-third and one-twentieth, respectively, of the amount lethal to 50% of the test organisms in 96 hours, where the 96 hour LC50 is the lowest value
which has been determined for a species significant to the indigenous aquatic community.
(#) Species is not indigenous. Information is given for comparison purposes only.
(1) Johnson, W. W. and M.T. Finley (1980). Handbook of Acute Toxicity of Chemicals to Fish and Aquatic Invertebrates. U.S. Department of the Interior,
Fish and Wildlife Service Resource Publication 137. Washington, DC.
(2) U.S. Environmental Protection Agency (1977). Silvacultural Chemicals and Protection of Water Quality. Seattle, WA. EPA-910/9-77-036.
(3) Schneider, B.A. (Ed.) (1979). Toxicology Handbook, Mammalian and Aquatic Data, Book 1: Toxicology Data. U.S. Environmental Protection Agency.
U.S. Government Printing Office. Washington, DC. EPA-5400/9-79-003.
(4) Hartley, D. and H. Kidd. (Eds.) (1987). The Agrochemicals Handbook. Second Edition, The Royal Society of Chemistry. Nottingham, England.
(5) Montgomery, J.H. (1993). Agrochemicals Desk Reference: Environmental Data. Lewis Publishers. Chelsea, MI.
(6) Verschueren, K. (1983). Handbook of Environmental Data on Organic Chemicals. Second Edition, Van Nostrand Reinhold Co. Inc. New York, NY.
(7) U.S. Environmental Protection Agency (1991) Pesticide Ecological Effects Database, Ecological Effects Branch, Office of Pesticide Programs,
Washington, D.C.
(8) Mayer, F.L. , and M.R. Ellersieck. (1986). Manual of Acute Toxicity: Interpretation and Database for 410 Chemicals and 66 Species of
Freshwater Animals. United States Fish and Wildlife Service Publication No. 160.

Appendix 8B-1 2004 Everglades Consolidated Report
App. 8B-1-28
Table 7. Pesticide detections and excursions for surface water samples collected from May 2002 to April 2003.1
simazine
0:1:
0
1:1:
0
norflurazon
1:1:
0
4:0:
0
prometon
3:0:
0
hexazinone 1:
0:0
1:0:
0
2:0:
0
endosulfan sulfate
1:0:
0
1:0:
0
0:2:
0
beta endosulfan
1:0:
0
alpha endosulfan
1:0:
0
0:1:
0
diuron
1:0:
0
bromacil
0:2:
0
atrazine desisopropyl
1:0:
0
1:0:
0
1:0:
0
atrazine desethyl 2:
0:0
2:0:
0
1:0:
0
1:0:
0
1:0:
0
0:3:
0
2:0:
0
1:0:
0
atrazine
0:4:
0
0:4:
0
1:1:
0
1:2:
0
2:0:
0
0:2:
0
2:0:
0
0:1:
0
0:4:
0
1:2:
0
0:3:
0
0:4:
0
2:0:
0
1:0:
0
2:2:
0
ametryn
3:1:
0*
3:1:
0
1:0:
0
4:0:
0
4:0:
0
Com
poun
d
2,4-D
0:1:
0
Stru
ctur
e
AC
ME
1DS
G-9
4D
G-1
23
S-9
S-18
C
S-14
0
S-19
0
S-33
2
S-3
8B
S-14
2
S-31
S-17
6
S-17
7
S-17
8
S-3
31/S
-173
Notes: 1 Four samples were collected for each site and analyzed for all parameters. Table cells only represent concentrations above the detection limit.
* Number of samples < = PQL (no concern); number of samples > PQL (potential concern); and number of samples exceeding criterion or toxicity limit (concern).

2004 Everglades Consolidated Report Appendix 8B-1
App. 8B-1-29
Table 8. Pesticide detections and excursions for sediment samples collected in June 2002 and November 2002.1
Compound
Stru
ctur
e
brom
acil
DD
D-p
,p’
DD
E-p
,p’
alph
a en
dosu
lfan
beta
end
osul
fan
endo
sulfa
n su
lfate
BHC
gam
ma
(lind
ane)
triflu
ralin
ACME1DS 1:0* 0:2 1:0 G-94D 2:0 G-123 S-9 S-18C S-140 S-190 S-332 S-38B 1:0 0:1 S-142 S-31 S-176 1:0 1:0 S-177 1:0 S-178 0:1 1:0 1:0 0:1 S-331/S-173
Notes: 1 Two sediment samples were collected for each site and analyzed for all parameters. Table cells only represent concentrations above the detection limit.
* Number of samples < PQL (no concern); and number of samples > PQL (potential concern).

Appendix 8B-1 2004 Everglades Consolidated Report
App. 8B-1-30
LITERATURE CITED
McGill, R., J.W. Tukey and W.A. Larsen. 1978. Variations of Box Plots. Am. Statistician, 32(1): 12-16.
SFWMD. 1999a. Comprehensive Quality Assurance Plan No. 870166G, South Florida Water Management District, West Palm Beach, FL.
SFWMD. 1999b. 1999 Everglades Interim Report. South Florida Water Management District, West Palm Beach, FL.
SFWMD. 1999c. Non-ECP Structures Annual Monitoring Report. Submitted to the Florida Department of Environmental Protection in accordance with the FDEP Permit No. 06,502590709 (Non-ECP Permit). South Florida Water Management District, West Palm Beach, FL.
SFWMD. 2000. 2000 Everglades Consolidated Report. South Florida Water Management District, West Palm Beach, FL.
SFWMD. 2001. 2001 Everglades Consolidated Report. South Florida Water Management District, West Palm Beach, FL.
SFWMD. 2002. 2002 Everglades Consolidated Report. South Florida Water Management District, West Palm Beach, FL.
SFWMD. 2003. 2003 Everglades Consolidated Report. South Florida Water Management District, West Palm Beach, FL.
SJRWMD, SFWMD and SWFWMD. 1994. Guidelines for the Collection of Hydrologic and Meteorologic Data, Volume 1: Field Applications. Kinsman, G., J. Kite and D. Mtundu, eds. St. Johns River Water Management District, South Florida Water Management District, and Southwest Florida Water Management District, FL.
SJRWMD, SFWMD and SWFWMD. 1999. Guidelines for Quality Control and Quality Assurance of Hydrologic and Meteorologic Data, Volume 2: Data Management. M.L. Crowell and N.D. Mtundu, eds. St. Johns River Water Management District, South Florida Water Management District, Southwest Florida Water Management District, and Suwannee River Water Management District, FL.