Embed Size (px)
Citation preview

1
Appendix 7.1 Hydrology
A.1 Objectives and Work Flow
Taking account of the goals of the recommended project, the objectives of the hydrological
and hydraulic studies are set as follows:
(i) To clarify the current conditions of river channel and riparian areas, where are
subject to proposed road network
(ii) To estimate the flood discharges of the rivers in various return periods through
statistical approach at crossings along proposed road alignment
(iii) To recommend betterment of drainage system along the proposed alignment,
where deterioration of present drainage conditions due to implementation of the
project is predicted, if any
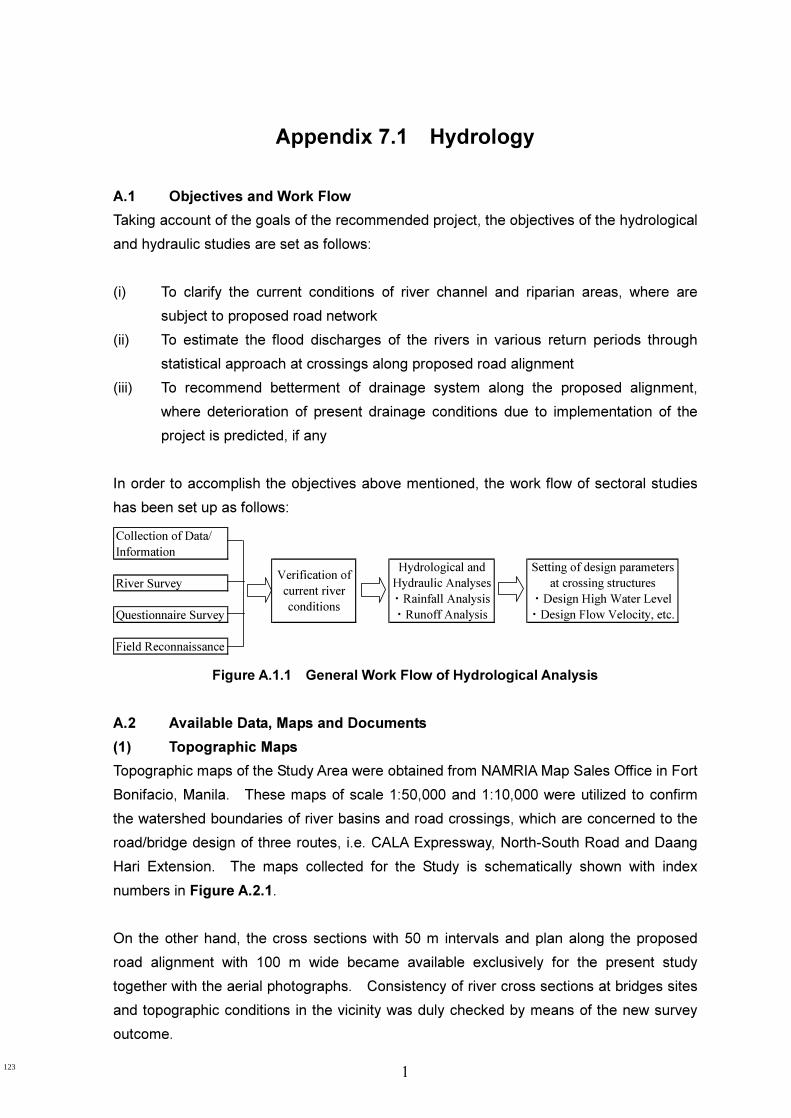
In order to accomplish the objectives above mentioned, the work flow of sectoral studies
has been set up as follows:
Collection of Data/
Information
River Survey
Questionnaire Survey
Field Reconnaissance
Hydrological and
Hydraulic Analyses
・ Rainfall Analysis
・ Runoff Analysis
Verification of
current river
conditions
Setting of design parameters
at crossing structures
・ Design High Water Level
・ Design Flow Velocity, etc.
Figure A.1.1 General Work Flow of Hydrological Analysis
A.2 Available Data, Maps and Documents
(1) Topographic Maps
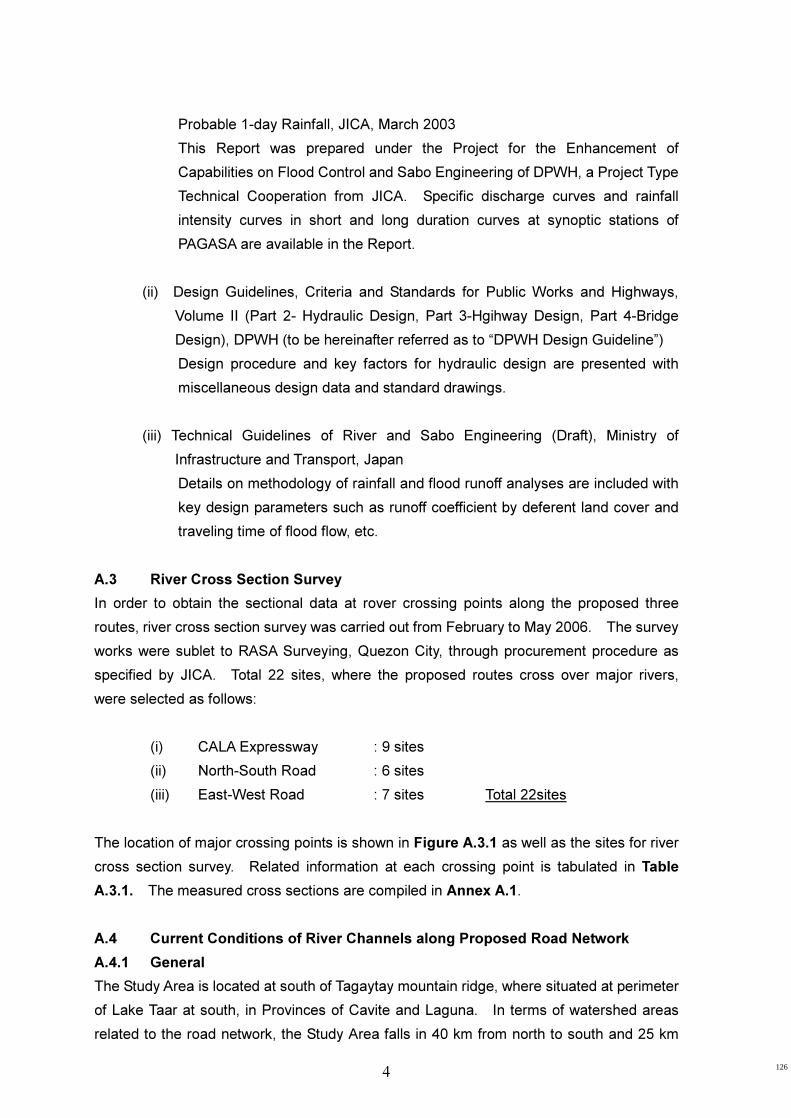
Topographic maps of the Study Area were obtained from NAMRIA Map Sales Office in Fort
Bonifacio, Manila. These maps of scale 1:50,000 and 1:10,000 were utilized to confirm
the watershed boundaries of river basins and road crossings, which are concerned to the
road/bridge design of three routes, i.e. CALA Expressway, North-South Road and Daang
Hari Extension. The maps collected for the Study is schematically shown with index
numbers in Figure A.2.1.
On the other hand, the cross sections with 50 m intervals and plan along the proposed
road alignment with 100 m wide became available exclusively for the present study
together with the aerial photographs. Consistency of river cross sections at bridges sites
and topographic conditions in the vicinity was duly checked by means of the new survey
outcome.
123

2
Scale 1:50,000
Scale 1:10,000
Figure A.2.1 Available Topographic Maps in the Study Area
(2) Rainfall Record
Daily rainfall records at total six gauging stations (Sangley Point, Ambulong, Amadeo,
Bacoor, San Pedro and Tagaytay) in and around the Study Area were collected at the
Climate Data Center of PAGASA, Quezon City. The longest duration of daily record is
available from 1951 to date at Ambulong, Laguna. The name of gauging station, location
3129 I
Cavite
City
3229 IV
Muntinlu
pa City
3219 II
Mendez
3229 III
Calamba
3129 I-3
Caridad
3129 I-4
Cavite City
3129 I-5
Las Piñas
3129 I-8
Noveleta
3129 I-9
Imus
3129 I-10
San Nicolas
3229 IV-6
Alabang
3129 I-13
General Trias
3129 I-14
Malagasan
Segundo
3129 I-15
Pag-Asa
3229 IV-11
Muntinlupa
3229 IV-12
San Pedro
3129 I-18
Tanza
3129 I-19
Dasmariñas
3129 I-20
Dasmarinas
Bagong Bayan
3229 IV-16
Manila
Southwoods
3229 IV-17
Biñan
3129 I-23
Trece Martinez
City
3129 I-24
First Cavite
Industrial Estate
3129 I-25
Bulihan
3229 IV-21
Gen. Mariano
Alvarez
3229 IV-22
Laguna Bel-Air
3129 II-3
Calumpang Cerca
3129 II-4
Banaybanay
3129 II-5
Silang
3229 III-1
Putting Kahoy
3229 III-2
Canlubang
Industrial Park
3129 II-10
Lalaan II
3229 III-6
Lumil
NS Road
Daang Hari Extension
CALA
Expressway
124

3
(longitude and latitude) and duration are presented in Table A.2.1 and location of these
stations is shown in Figure A.2.2.
(3) Discharge Record
Mean daily discharge records at total ten gauging stations in and around the Study Area
were collected from Hydrological Division, Bureau of Research and Standards, DPWH.
The records are divided into two categories, i.e. old and new coding system. The
available data of the old and new systems cover the period from 40’s to 1979 and from
1983 to date, respectively, since there was a suspension of discharge measurement by
DPWH between 1979 and 1983. Two gauging stations have been operated in the Study
Area namely at Alapan in Ylang-Ylang River and at Palubluban in Panaysayan River
(Pasong Cama Chile River, a tributary of Ylang-Ylang River). However, those were all
closed and stopped measurement in 1979 and 1984 respectively. Available duration and
other related information is shown in Table A.2.2 and location of water level gauging
stations is marked on Figure A.2.2.
(4) Land Use Maps
The future land use pattern is required to estimate flood peak discharge at arbitrary points
of crossing structures such as bridge, viaduct and culvert. As for the flood runoff analysis,
which is scheduled to be carried out in the subsequent feasibility study period, the land use
map created on GIS format prepared though the present study is available.
(5) Satellite Imagery
Geographical information of the Study Area can be extracted at free-access web site of
Google Earth. A satellite imagery taken in 2005 can provide the latest information of
ground cover in the Study Area. The imagery was utilized to examine relationship
between proposed road alignment and river channels concerned.
(6) Related Study Reports and Guidelines
Among the related reports, documents and guidelines related to the hydrology, hydraulics
and river engineering issues, in particular, following are to be referred for the Study:
(i) The Feasibility Study of the Proposed Cavite Busway System, JICA,
November 2002
Among the volumes of the Final Report of the Feasibility Study, Appendix A –
Natural Conditions involves useful information for hydrological analysis.
Since the study of Busway System covers same target area of the present
Study, the methodology shall be referred.
(ii) Specific Discharge Curve Rainfall Intensity Duration Curve Isohyet of
125
4
Probable 1-day Rainfall, JICA, March 2003
This Report was prepared under the Project for the Enhancement of
Capabilities on Flood Control and Sabo Engineering of DPWH, a Project Type
Technical Cooperation from JICA. Specific discharge curves and rainfall
intensity curves in short and long duration curves at synoptic stations of
PAGASA are available in the Report.
(ii) Design Guidelines, Criteria and Standards for Public Works and Highways,
Volume II (Part 2- Hydraulic Design, Part 3-Hgihway Design, Part 4-Bridge
Design), DPWH (to be hereinafter referred as to “DPWH Design Guideline”)
Design procedure and key factors for hydraulic design are presented with
miscellaneous design data and standard drawings.
(iii) Technical Guidelines of River and Sabo Engineering (Draft), Ministry of
Infrastructure and Transport, Japan
Details on methodology of rainfall and flood runoff analyses are included with
key design parameters such as runoff coefficient by deferent land cover and
traveling time of flood flow, etc.
A.3 River Cross Section Survey
In order to obtain the sectional data at rover crossing points along the proposed three
routes, river cross section survey was carried out from February to May 2006. The survey
works were sublet to RASA Surveying, Quezon City, through procurement procedure as
specified by JICA. Total 22 sites, where the proposed routes cross over major rivers,
were selected as follows:
(i) CALA Expressway : 9 sites
(ii) North-South Road : 6 sites
(iii) East-West Road : 7 sites Total 22sites
The location of major crossing points is shown in Figure A.3.1 as well as the sites for river
cross section survey. Related information at each crossing point is tabulated in Table
A.3.1. The measured cross sections are compiled in Annex A.1.
A.4 Current Conditions of River Channels along Proposed Road Network
A.4.1 General
The Study Area is located at south of Tagaytay mountain ridge, where situated at perimeter
of Lake Taar at south, in Provinces of Cavite and Laguna. In terms of watershed areas
related to the road network, the Study Area falls in 40 km from north to south and 25 km
126

5
from east to west, namely, in around 1,000 km2. The altitude of the watershed varies from
EL 680 m at Tagaytay City to the sea level at the coastal area facing to Manila Bay.
The watershed area is characterized by a number of rivers originating at Tagaytay Ridge
and running in parallel, which flows into Manila Bay and Laguna de Bay with feeding
valuable water resources in the area. Relatively narrow strips of watershed from south to
north (Manila Bay) and to northeast (Laguna de Bay) forms such unique topography. The
major river basins emptying toward Manila Bay are Zapote, Imus, San Juan and Canas
(from east to west), and those toward Laguna de Bay are Tunasan, San Pedro, Binan and
Santa Rosa (from north to south) as shown in Figure A.2.1. The size of catchment areas
approximately varies between 20 and 120 km2. The length of river course is around 50
km for the longest. The longitudinal profiles of major nine rivers such as Santa Rosa,
Binan, San Pedro, Imus, Dasmariñas, Ylang-Ylang, Baluctot, Rio Grande and Canas
Rivers, in which the proposed road alignment traverses.
It is noted that in the Study Area, more than 70 small scale ponds/reservoirs with under
10 m high dams are located. Most of them were constructed by National Irrigation
Administration (NIA) or Local Government Units (LGUs) for irrigation purposes. In
accordance with the interview to the local people, most of them were constructed 20 to
40 years ago and its function has been deteriorated due to lack of proper maintenance and
appropriate repair of gate facilities. As urbanization progressed in Cavite, the necessity of
the pond has been declined due to drastic decrease of irrigation water demand. In fact,
agricultural land is rapidly changing to residential areas in the Study Area. The
approximate location of the pond can be confirmed on the General Layout that was
obtained at the “Cavite Friar Lands Irrigation System Office” (Branch of NIA regional office),
Naic.
Further detailed conditions on the rivers running through the Study Area are presented
dividing into three routes in the subsequent sub-sections. Principal feature of the
crossings along the proposed routes is summarized in Table A.3.1.
A.4.2 CALA Expressway
The proposed CALA Expressway starts at South Luzon Expressway at Santa Rosa,
Laguna, and is connected with Dasmariñas - Naic Road at west of First Cavite Industrial
Estate (FCIS), Dasmariñas. Total length is 22.9 km. From the starting point (Sta.0+000),
it runs to eastward in parallel with the Cabuyao River for about 6 km. After crossing the
existing Santa Rosa-Tagaytay Road, it will cross a tributary of the Banava River, and then
will enter into Municipality of Silang, Cavite. As going toward west, the alignment will
cross the several rivers and rise altitude up to EL.300m at around Sta.12+000. These
127

6
rivers flow down to Laguna de Bay. The channel section is mostly covered by thick
vegetation and formed moderately deep valley. The river bed is outcropped at many
places and seems relatively stable against turbulence of flow. At Sta.13+700, the
alignment runs in the watershed of the Baluctot River, which is one of major tributaries of
the Imus River system flowing to Manila Bay.
Based on the field reconnaissance, shifting of the original alignment of about 100 m to 150
m toward north (crossing at more downstream section) is recommended due to possible
reduction of bridge span at around Sta.13+400. It is advantageous from topographical
point view. After crossing Aguinaldo Highway at Sta.14+700 most likely by flyover, the
CALA Expressway will cross over three rivers. After passing Sta.19+400, the alignment
will run in the narrow strip area between the Rio Grade and the Ylang-Ylang Rivers.
The typical river conditions at crossings are shown as follows:
River channel at Sta.8+400 Land undulation between
Sta.9+000 and Sta.10+000
River channel at Sta.14+200
A.4.3 North-South Road
The North-South Road (NS Road) will be linked with the existing Coastal Road at the
right-angle curve, where the Coastal Road is separating from the costal line at Talaba,
Municipality of Bacoor and after running to south it will be connected with the proposed
CALA Expressway in Municipality of Silang. Total length is 26.7 km, which is the longest
among the proposed three routes. It should be crossed over the fishpond area developed
in Barangay Talaba II within first 1.0 km stretch from start point. In next 8.0 km length, the
NS Road will run in the most urbanized residential area among the proposed road section
in the Study. The proposed alignment is located to pass by the Citta Iatlia Estate at
Sta.8+500. Up to the point several, the NS Road will cross over several creeks.
In terms of risk of inundation in the Study Area, as far as along the proposed road network,
this section will be most susceptible considering rapid land reclamation and insufficient
drainage system in the lowly lying area. Further, according to the interview to the villagers
residing nearby the newly development area connected with Citta Italia Estate, his house
located at Sta.8+900 is threatening by flood flow overtopping parapet wall almost every
128

7
rainy season. In the channel area beside his residence, an old irrigation weir with spillway
gate exists. Since the gate seems closed permanently due to lack of maintenance, the
water stagnated at upstream will rise by inflow and overtop occasionally.
The inundation problem along the coastal area of particularly Municipalities of Bacoor,
Imus, Kawit, Noveleta and Rasario, where the population and industries has been
concentrated, is aware by DPWH and such LGUs as well. The improvement of drainage
system cannot catch up the rapid land use changes that will cause acute rising of flood
peak discharge and serious inundation. Comprehensive master plan for flood control of
three principal rivers of Imus, San Juan and Canas is indispensable. In fact, most of all
municipalities located at the lowland areas were inundated for 8 hours when the typhoon
Reming has hit the area on October 28, 2000. The situation in the area becomes worse
after then as such urbanization is remarkably progressive.
At Sta.12+700, the NS road crosses the East-West Road (EW Road) and crosses the
Aguinaldo Highway at Sta.19+200 where the elevation is approximately EL.100 m. Then,
the NS Road runs almost in parallel with the Dasmariñas River, a tributary of the San Juan
River system. It will cross near Bucal Bridge at Dasmariñas town proper, Sta.21+500.
The shape of river is formed by deep valley and steep slope with 30 to 50 m height from
riverbed and risk of flood damage will be limited as far as the present land use last.
Following pictures show the typical conditions as described above:
Upstream of irrigation weir (water is contaminated by domestic waste water) , Sta.17+250
Upstream view from the suspension bridge, Sta.14+000
Disposed solid waste in the river channel and heavily contaminated water, Sta.8+750
A.4.4 Daang Hari Extension
The East-West Road (EW Road) will start from the border between Muntinlupa City
(National Capital Region) and Municipality of Imus, Cavite, where it will be connected with
the Daang Hari Road under construction presently. The EW Road will end the Coastal
Road in Municipality of Tanza. Total length is 21.0 km.
Since the proposed alignment is located at lowland between EL.10m to EL.30m and
129
8
crosses over many rivers flowing down from south to north into Manila Bay, due
consideration will be required to decide the design flood levels appropriately. The EW
Road is can be divided mainly into two parts, namely east and west sections by Aguinaldo
Highway. Within the eastern part, the Road will cross seven rivers, which are moderately
small creeks with 15 m to 25 m of width. It will cross with the proposed NS Road at
Sta.8+500. At Sta.8+650, a new bridge is under construction along the proposed
alignment.
At western part stretching from Aguinaldo Highway to the end point at the Coastal Road,
total five rivers cross the alignment. Paddy and pasture land is predominant land use in
this area to the contrary those in the eastern part. It is noted that future urbanization and
land use change shall be taken into account to estimate flood discharge at crossings where
the catchments varies between 50 to 100 km2 approximately.
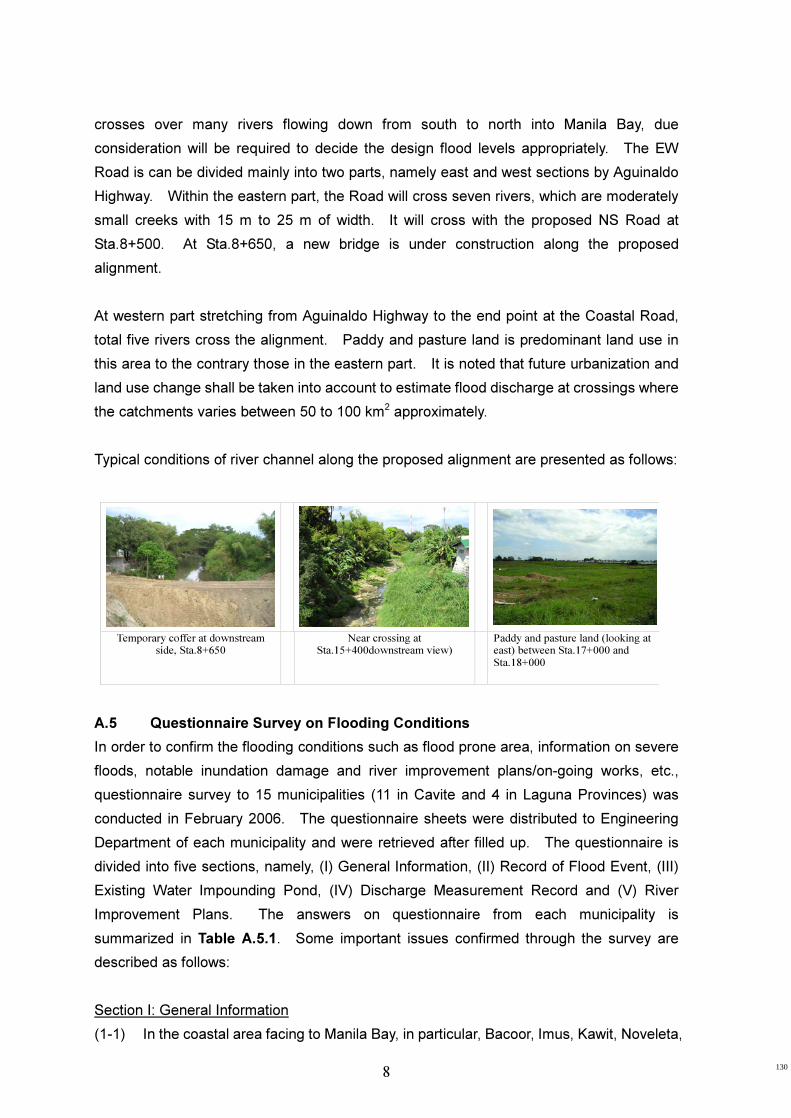
Typical conditions of river channel along the proposed alignment are presented as follows:
Temporary coffer at downstream side, Sta.8+650
Near crossing at Sta.15+400downstream view)
Paddy and pasture land (looking at east) between Sta.17+000 and Sta.18+000
A.5 Questionnaire Survey on Flooding Conditions
In order to confirm the flooding conditions such as flood prone area, information on severe
floods, notable inundation damage and river improvement plans/on-going works, etc.,
questionnaire survey to 15 municipalities (11 in Cavite and 4 in Laguna Provinces) was
conducted in February 2006. The questionnaire sheets were distributed to Engineering
Department of each municipality and were retrieved after filled up. The questionnaire is
divided into five sections, namely, (I) General Information, (II) Record of Flood Event, (III)
Existing Water Impounding Pond, (IV) Discharge Measurement Record and (V) River
Improvement Plans. The answers on questionnaire from each municipality is
summarized in Table A.5.1. Some important issues confirmed through the survey are
described as follows:
Section I: General Information
(1-1) In the coastal area facing to Manila Bay, in particular, Bacoor, Imus, Kawit, Noveleta,
130
9
and in lakeshore municipalities of Carmona, San Pedro and Biñan, flood prone
area is identified in the low lying Barangays. Extraordinary high tide in addition to
the insufficient inland drainage system is major reason of flood occurrence.
(1-2) A total of 974 ha (approximately 10 km2) flood prone area in Bacoor, Minus, Kawit
and Noveleta was identified with some particular barangays suffering from frequent
inundation, where are the most susceptible zone to heavy storm in monsoon
seasons. Among those, the largest area of 801 ha (82 %) falls in Kawit.
Nonexistence of major river outlet in Kawit might be one of the main reasons.
Section II: Record of Flood Event
(2-1) Severest flood in each municipality is summarized as below:
Nov. 1995 : Carmona
Nov.1998 : Bacoor
Jun.1999 : Silang
Sep.1999 : Gen. Mariano Alvalez
Oct.-Nov.2000 : Imus, Kawit, Noveleta, General Trias
Nov.2001 : Naic, Biñan
Oct.-Nov.2002 : San Pedro
(Rosalio, Tanza, Dasmariñas and Trece martinez answered “None” or blank)
(2-2) According to the answers, due to the flood in Nov. 2000, relatively wide area was
inundated at Imus, Kawit and Neveleta, in particular, Manila Bay coastal area. The
inundation depth reached about 1.0 m above the ground surface and inundation
lasted 4 hours (Noveleta) to 3days (Imus), which caused serious damage to houses,
other properties and livestock. No description regarding inundation is found in the
questionnaire sheets from Bacoor. Since the origin of the North-South Road will be
located in Bacoor, careful treatment of flood water in Bacoor is required.
Section III: Existing Water Impounding Pond
(3-1) Three municipalities of Dasmariñas, Trece Martinez and Carmona reported
information on impounding ponds. Dasmariñas described information on five
dams with 6m to 10m high. Agriculture is predominant function of small scale
reservoirs in the Study Area. Most of them were constructed in 40 to 20 years ago.
Section IV: Discharge Measurement Records
(4-1) Among 15 municipalities, only Gen. Mariano Alvalez answered “Yes”, but no
technical document is available fort the records.
Section V: River Improvement Plan
131

10
(5-1) Only four municipalities of Bacoor, General Trias, Carmona and Biñan responded
that they have river improvement plans. For instance, Bacoor has a plan to dredge
the NIA’s Creek (L=3.4 km) near Molino Highway for enhancement of cultivation.
In other municipalities there is no river improvement plan/activities.
A.6 Methodology of Hydrological Analysis
In order to set appropriate methodology of hydrological analysis to determine the probable
flood discharge and other design parameters at arbitrary crossings where structures are to
be designed, following factors were examined:
(i) Basin parameters : size of catchments, channel length, riverbed gradient
(traveling time of discharge)
Relatively small catchments (> 200 km2), short river length (> 50 km) and
1/80 to 1/100 of average riverbed gradient
(ii) Existing structures for flood control
No major control structures, which can retard and store flood discharge
and no inter-basin connection or floodways
(iii) Availability of rainfall and discharge record
Fairly reliable daily rainfall records (sufficient duration and coverage of
area) but no flood discharge measurement record in the subject river basin
(no measured hydrograph)
(iv) Requirement for design parameters of structure (bridge, culvert, revetment
and embankment, etc.)
Flood peak discharge can be converted to the flood water level based on
the channel geometry by means of appropriate runoff model.
(v) Future flood control/drainage improvement plan
No major flood control/drainage improvement plan to be taken account to
estimate flood discharges is not identified in DPWH except minor channel
improvement managed by LGUs
As the result of examination, flood runoff analysis by rational formula and uniform flow
theory will be applied to estimate probable peak discharges and associated water levels at
arbitrary locations in the Study Area.
A7. Hydrological Analysis
A.7.1 Characteristics of Rainfall Pattern
Monthly rainfall amount at six stations is tabulated in Table A.7.1 and illustrated in
Figure A.7.1. It is distinct that August and July are predominant rainy period and January
to April is very dry in the Study Area. Although the monthly pattern is similar among six
stations, the rainfall amount at Amadeo is rather high compared with others. According to
132

11
the record from PAGASA, in fact, annual rainfall in most of years are extraordinary high,
which shows equal or more than 2.5 to 2.8 times of the amount at Sangley Point and
Bacoor.
Because the reliability of the daily rainfall record at Amadeo seemed low, the Study Team
wrote a letter to confirm the issue to the Chief of Climate Data Division, PAGASA, before
starting hydrological analysis. As the results of the consultation, PAGASA informed to the
Study Team by their letter dated on February 28, 2006 that the records at Amadeo should
not be included in any analysis. PAGASA recognized that it was entirely their mistake on
data processing. Therefore, the records at Amadeo were omitted in the subsequent
analysis in the present Study. A chronological annual rainfall fluctuation is shown in
Figure A.7.2.
Table A.7.1 Monthly Rainfall Amount at Six Stations
Year Sangley Ambulong Bacoor San
Pedro Tagaytay Year Sangley Ambulong Bacoor
San Pedro
Tagaytay
1951 - 1,885 - - - 1979 1,345 2,107 1,803 2,001 -
1952 - 2,123 - - - 1980 1,265 2,135 1,743 1,786 -
1953 - 1,669 - - - 1981 1,518 1,870 1,683 1,206 -
1954 - 1,322 - - - 1982 1,009 1,651 1,508 573 -
1955 - 1,190 - - - 1983 1,367 1,280 702 523 -
1956 - 2,022 - - - 1984 2,179 1,799 2,103 648 -
1957 - 1,166 - - - 1985 1,956 2,034 2,351 1,291 -
1958 - 1,348 - - - 1986 2,955 2,458 2,623 2,597 -
1959 - 1,678 - - - 1987 1,705 1,370 1,409 1,603 -
1960 - 2,252 - - - 1988 1,986 1,971 1,826 1,406 -
1961 - 2,184 - - - 1989 2,117 2,085 1,654 2,605 -
1962 - 2,514 - - - 1990 2,599 2,284 2,220 - -
1963 - 1,379 - - - 1991 2,441 1,946 1,858 - -
1964 - 1,740 - - - 1992 2,242 1,587 1,692 - -
1965 - 1,179 - - - 1993 1,852 2,121 1,488 1,359 -
1966 - 2,038 - - - 1994 1,924 1,578 1,649 775 1,689
1967 - 1,943 - - - 1995 2,299 2,001 1,721 1,118 2,048
1968 - 1,380 - - - 1996 1,657 1,608 1,446 1,548 1,802
1969 - 1,264 - - - 1997 2,048 1,269 1,325 783 1,492
1970 - 1,854 - - - 1998 2,019 1,679 1,812 1,043 2,111
1971 - 2,299 - 1,620 - 1999 2,430 2,364 1,937 - 2,268
1972 - 2,427 - 2,441 - 2000 3,116 2,457 2,286 - 1,546
1973 - 1,745 - 1,717 - 2001 1,930 1,643 1,462 - 2,022
1974 1,296 2,328 - 2,090 - 2002 2,682 1,486 1,952 - 1,808
1975 1,137 1,549 1,522 1,704 - 2003 1,915 1,334 1,310 - 1,748
1976 1,877 2,601 1,964 1,966 - 2004 1,591 1,520 1,254 - 1,553
1977 1,944 1,675 1,963 1,594 - 2005 1,673 1,544 1,424 - 2,175
1978 2,086 2,009 2,399 2,005 - Ave. 1,942 1,817 1,745 1,520 1,855
133

12
0
50
100
150
200
250
300
350
400
450
500
Jan Feb Mar Apr May Jun Jul Aug Sep Oct Nov Dec
Mo
nth
ly R
ainfa
ll (
mm
)
Sangley
Ambulong
Bacoor
San Pedro
Tagaytay
Figure A.7.1 Monthly Variation of Rainfall
0
500
1,000
1,500
2,000
2,500
3,000
3,500
19
51
19
55
19
59
19
63
19
67
19
71
19
75
19
79
19
83
19
87
19
91
19
95
19
99
20
03
An
nu
al R
ain
fall
(m
m) Sangley
Ambulong
Bacoor
San Pedro
Tagaytay
Figure A.7.2 Chronological Annual Rainfall Pattern
A.7.2 Probable Rainfall
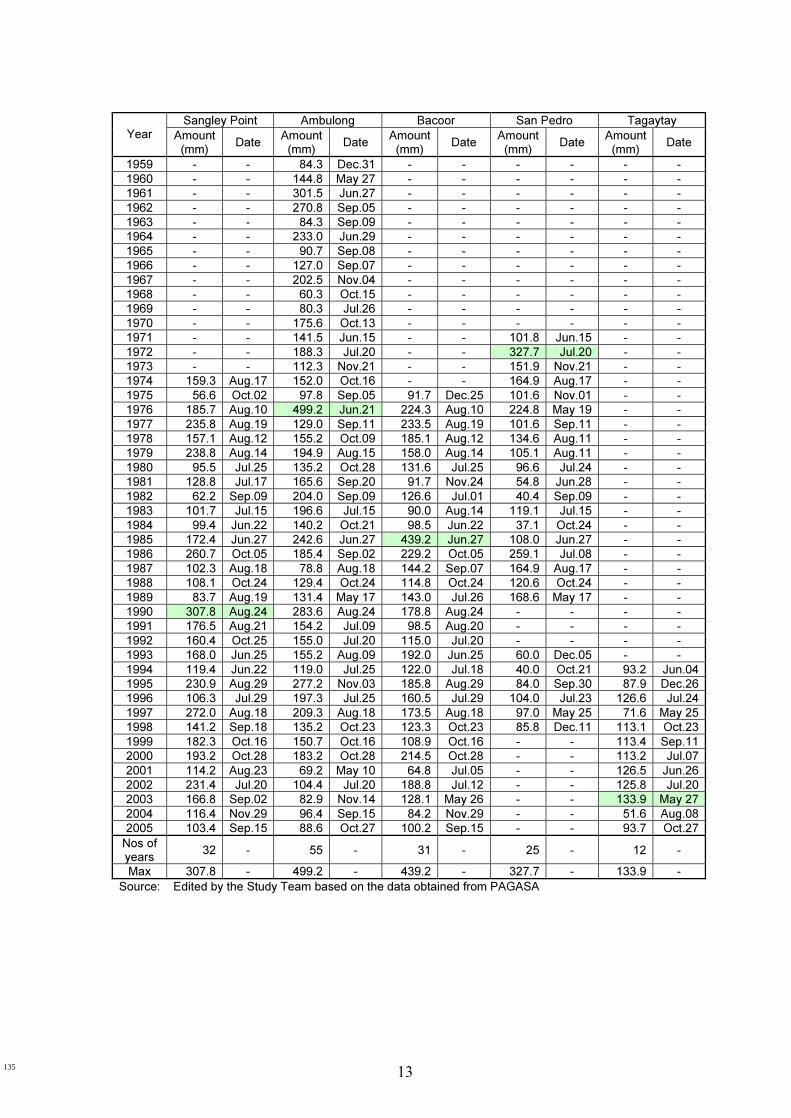
Annual maximum 1-day rainfall at four stations (point rainfall) are tabulated in Table A.7.2.
Based on the series of records, probable 1-day rainfall was estimated by Gumbel Method
and as summarized in Table A.7.3.
Table A.7.2 Annual Maximum 1-day Rainfall
Sangley Point Ambulong Bacoor San Pedro Tagaytay Year Amount
(mm) Date
Amount (mm)
Date Amount (mm)
Date Amount (mm)
Date Amount (mm)
Date
1951 - - 117.1 Nov.21 - - - - - -
1952 - - 134.6 Dec.21 - - - - - -
1953 - - 84.3 Jun.03 - - - - - -
1954 - - 59.7 Aug.09 - - - - - -
1955 - - 59.9 Sep.23 - - - - - -
1956 - - 120.1 Sep.07 - - - - - -
1957 - - 85.3 Oct.11 - - - - - -
1958 - - 261.1 Jun.02 - - - - - -
134
13
Sangley Point Ambulong Bacoor San Pedro Tagaytay Year Amount
(mm) Date
Amount (mm)
Date Amount (mm)
Date Amount (mm)
Date Amount (mm)
Date
1959 - - 84.3 Dec.31 - - - - - -
1960 - - 144.8 May 27 - - - - - -
1961 - - 301.5 Jun.27 - - - - - -
1962 - - 270.8 Sep.05 - - - - - -
1963 - - 84.3 Sep.09 - - - - - -
1964 - - 233.0 Jun.29 - - - - - -
1965 - - 90.7 Sep.08 - - - - - -
1966 - - 127.0 Sep.07 - - - - - -
1967 - - 202.5 Nov.04 - - - - - -
1968 - - 60.3 Oct.15 - - - - - -
1969 - - 80.3 Jul.26 - - - - - -
1970 - - 175.6 Oct.13 - - - - - -
1971 - - 141.5 Jun.15 - - 101.8 Jun.15 - -
1972 - - 188.3 Jul.20 - - 327.7 Jul.20 - -
1973 - - 112.3 Nov.21 - - 151.9 Nov.21 - -
1974 159.3 Aug.17 152.0 Oct.16 - - 164.9 Aug.17 - -
1975 56.6 Oct.02 97.8 Sep.05 91.7 Dec.25 101.6 Nov.01 - -
1976 185.7 Aug.10 499.2 Jun.21 224.3 Aug.10 224.8 May 19 - -
1977 235.8 Aug.19 129.0 Sep.11 233.5 Aug.19 101.6 Sep.11 - -
1978 157.1 Aug.12 155.2 Oct.09 185.1 Aug.12 134.6 Aug.11 - -
1979 238.8 Aug.14 194.9 Aug.15 158.0 Aug.14 105.1 Aug.11 - -
1980 95.5 Jul.25 135.2 Oct.28 131.6 Jul.25 96.6 Jul.24 - -
1981 128.8 Jul.17 165.6 Sep.20 91.7 Nov.24 54.8 Jun.28 - -
1982 62.2 Sep.09 204.0 Sep.09 126.6 Jul.01 40.4 Sep.09 - -
1983 101.7 Jul.15 196.6 Jul.15 90.0 Aug.14 119.1 Jul.15 - -
1984 99.4 Jun.22 140.2 Oct.21 98.5 Jun.22 37.1 Oct.24 - -
1985 172.4 Jun.27 242.6 Jun.27 439.2 Jun.27 108.0 Jun.27 - -
1986 260.7 Oct.05 185.4 Sep.02 229.2 Oct.05 259.1 Jul.08 - -
1987 102.3 Aug.18 78.8 Aug.18 144.2 Sep.07 164.9 Aug.17 - -
1988 108.1 Oct.24 129.4 Oct.24 114.8 Oct.24 120.6 Oct.24 - -
1989 83.7 Aug.19 131.4 May 17 143.0 Jul.26 168.6 May 17 - -
1990 307.8 Aug.24 283.6 Aug.24 178.8 Aug.24 - - - -
1991 176.5 Aug.21 154.2 Jul.09 98.5 Aug.20 - - - -
1992 160.4 Oct.25 155.0 Jul.20 115.0 Jul.20 - - - -
1993 168.0 Jun.25 155.2 Aug.09 192.0 Jun.25 60.0 Dec.05 - -
1994 119.4 Jun.22 119.0 Jul.25 122.0 Jul.18 40.0 Oct.21 93.2 Jun.04
1995 230.9 Aug.29 277.2 Nov.03 185.8 Aug.29 84.0 Sep.30 87.9 Dec.26
1996 106.3 Jul.29 197.3 Jul.25 160.5 Jul.29 104.0 Jul.23 126.6 Jul.24
1997 272.0 Aug.18 209.3 Aug.18 173.5 Aug.18 97.0 May 25 71.6 May 25
1998 141.2 Sep.18 135.2 Oct.23 123.3 Oct.23 85.8 Dec.11 113.1 Oct.23
1999 182.3 Oct.16 150.7 Oct.16 108.9 Oct.16 - - 113.4 Sep.11
2000 193.2 Oct.28 183.2 Oct.28 214.5 Oct.28 - - 113.2 Jul.07
2001 114.2 Aug.23 69.2 May 10 64.8 Jul.05 - - 126.5 Jun.26
2002 231.4 Jul.20 104.4 Jul.20 188.8 Jul.12 - - 125.8 Jul.20
2003 166.8 Sep.02 82.9 Nov.14 128.1 May 26 - - 133.9 May 27
2004 116.4 Nov.29 96.4 Sep.15 84.2 Nov.29 - - 51.6 Aug.08
2005 103.4 Sep.15 88.6 Oct.27 100.2 Sep.15 - - 93.7 Oct.27
Nos of years
32 - 55 - 31 - 25 - 12 -
Max 307.8 - 499.2 - 439.2 - 327.7 - 133.9 -
Source: Edited by the Study Team based on the data obtained from PAGASA
135

14
Table A.7.3 Probable 1-day Rainfall (point rainfall)
(Unit: mm)
Source: Analyzed based on the rainfall record from PAGASA
As seen in Table A.7.2, the significant rainfall (193.2mm at Sangley Point and 214.5 mm at
Bacoor) was recorded on October 28, 2000, which caused serious inundation along the
coastal area. The municipalities at coastal area answered to the questionnaire that most
serous flooding has occurred in November 2000. Although no available direct
measurement record of flood discharges is available, the magnitude of the flood of
November 2000 might be approximately 10-year recurrence 1-day rainfall probability
based on the probable rainfall tabulated above.
A.7.3 Runoff Analysis
(1) Runoff Record
Based on the available daily discharge records, annual peak discharges at eight gauging
stations are summarized in Table A.7.4. The table shows the specific discharges per one
km2 of catchment as well. In the Study Area at Alapan (CA=60 km2: Ylang-Ylang River)
and Palubluban (CA=29 km2: Panaysayan River), maximum value of annual peak
discharge is 346.5 m3/s and 227.7 m3/s respectively. In terms of specific discharge, both
are 5.8 m3/s/km2 and 7.9 m3/s/km2. Since the reliability of the records could not be
justified based on the actual discharge measurement and/or rating curves, etc. at gauging
stations concerned, statistical analysis to estimate probable discharges was not conducted
based on the discharge data. Therefore, those were handled as a guide of magnitude of
flood peak discharges.
Return Period (Year)
Sangley Point
Ambulong Bacoor San
Pedro
1.01 41.6 38.8 24.4 11.5
2 147.8 138.8 144.4 105.5
5 211.3 198.6 215.4 161.7
10 253.3 238.2 262.8 198.9
25 305.3 287.1 321.3 244.9
50 345.8 325.3 366.9 280.8
100 385.0 362.1 411.0 315.4
200 423.9 398.8 454.8 349.8
Years of data
available 32 55 31 25
136

15
Table A.7.4 Annual Peak Discharge Records 1 2 3 4 5 6 7 8
Station Name Alapan Mabacao Bukal Palubluban Palangue Calamias San Cristobal Porac
Name of River YIang-Ylang Maragondon Maragondon Panaysayan Balsahan Arangilan San Cristobal San Juan
Catchment Area (km
2)
60 260 260 29 22 87 106 185
m3/s m
3/s/km
2 m
3/s m
3/s/km
2 m
3/s m
3/s/km
2m
3/s m
3/s/km
2m
3/s m
3/s/km
2m
3/s m
3/s/km
2 m
3/s m
3/s/km
2 m
3/s m
3/s/km
2
1946 - - 1,667.0 6.41 - - - - - - - - - - - -
1947 - - 3,387.0 13.03 - - - - - - - - - - - -
1948 - - 1,093.0 4.20 - - - - - - - - - - - -
1949 - - 367.2 1.41 - - - - - - - - - - - -
1950 - - 1,204.9 4.63 - - - - - - - - - - - -
1951 - - 631.5 2.43 - - - - - - - - - - - -
1952 - - 1,387.5 5.34 - - - - - - - - - - - -
1953 - - 1,044.0 4.02 - - - - - - - - - - - -
1954 - - 399.9 1.54 - - - - 17.2 0.78 - - - - - -
1955 - - 193.8 0.75 - - - - 4.3 0.20 - - - - - -
1956 - - 1,234.5 4.75 - - - - 315.0 14.32 181.0 2.08 - - - -
1957 - - 1,364.1 5.25 - - 149.0 5.14 76.9 3.50 12.3 0.14 - - - -
1958 - - 1,911.0 7.35 - - 92.5 3.19 17.8 0.81 68.5 0.79 - - - -
1959 - - 334.0 1.28 - - 32.8 1.13 24.8 1.13 16.8 0.19 - - - -
1960 - - 1,507.0 5.80 - - 171.6 5.92 56.5 2.57 60.6 0.70 - - - -
1961 - - 1,161.0 4.47 - - 206.3 7.11 80.9 3.68 215.3 2.47 - - - -
1962 - - 2,667.0 10.26 - - 227.7 7.85 187.1 8.50 215.0 2.47 - - - -
1963 - - 922.5 3.55 - - 92.5 3.19 36.0 1.64 4.6 0.05 - - - -
1964 - - 3,495.0 13.44 - - 146.3 5.04 46.9 2.13 17.4 0.20 - - - -
1965 - - 149.2 0.57 - - 6.5 0.22 49.7 2.26 5.4 0.06 - - - -
1966 - - 1,234.5 4.75 - - 72.1 2.48 104.5 4.75 34.7 0.40 - - - -
1967 - - 3,987.0 15.33 - - 85.4 2.94 95.4 4.34 53.5 0.61 - - - -
1968 - - 502.5 1.93 - - 75.2 2.59 118.9 5.40 10.6 0.12 - - - -
1969 - - 320.5 1.23 - - 16.0 0.55 90.1 4.10 8.4 0.10 - - - -
1970 - - - - - - - - - - 180.8 2.08 - - - -
1971 52.9 0.88 938.0 3.61 - - 148.5 5.12 30.4 1.38 - - - - - -
1972 52.9 0.88 726.0 2.79 - - 85.4 2.94 11.4 0.52 - - - - - -
1973 171.0 2.85 806.5 3.10 - - 85.4 2.94 6.0 0.27 - - - - - -
1974 346.5 5.78 3,167.0 12.18 - - - - 10.9 0.50 - - - - - -
1975 301.5 5.03 1,072.0 4.12 - - 166.3 5.73 0.6 0.03 - - - - - -
1976 157.5 2.63 3,607.0 13.87 - - 65.9 2.27 11.0 0.50 - - - - - -
1977 - - - - - - 0.7 0.02 - - - - - - - -
1978 - - 122.4 0.47 - - 4.0 0.14 6.5 0.29 - - - - - -
1979 310.5 5.18 809.2 3.11 - - 85.4 2.94 14.5 0.66 - - - - - -
1980 - - - - - - - - - - - - - - - -
1981 - - - - - - - - - - - - - - - -
1982 - - - - - - - - - - - - - - - -
1983 18.7 0.31 - - 127.2 0.49 - - - - - - - - - -
1984 0.5 0.01 - - 319.6 1.23 - - - - - - 29.3 0.28 - -
1985 - - - - 375.5 1.44 - - - - - - 91.9 0.87 - -
1986 - - - - 823.4 3.17 - - - - - - 1,068.8 10.08 85.0 0.46
1987 - - - - 412.0 1.58 - - - - - - 34.5 0.33 63.5 0.34
1988 - - - - 184.3 0.71 - - - - - - 606.1 5.72 124.1 0.67
1989 - - - - 293.4 1.13 - - - - - - 192.5 1.82 - -
1990 - - - - 62.8 0.24 - - - - - - 538.1 5.08 - -
1991 - - - - 46.8 0.18 - - - - - - - - 34.2 0.18
1992 - - - - 50.7 0.19 - - - - - - - - 4.8 0.03
1993 - - - - 107.0 0.41 - - - - - - - - 26.7 0.14
1994 - - - - 39.9 0.15 - - - - - - - - 14.5 0.08
1995 - - - - 67.3 0.26 - - - - - - - - 74.4 0.40
1996 - - - - 108.6 0.42 - - - - - - - - 10.3 0.06
1997 - - - - 67.3 0.26 - - - - - - - - 4.3 0.02
1998 - - - - 81.1 0.31 - - - - - - - - 24.5 0.13
1999 - - - - 9.9 0.04 - - - - - - - - 4.1 0.02
2000 - - - - 124.4 0.48 - - - - - - - - - -
Average 156.9 2.61 1356.7 5.22 183.4 0.71 95.9 3.31 58.9 2.68 72.3 0.83 365.9 3.45 39.2 0.21
Max 346.5 5.78 3987.0 15.33 823.4 3.17 227.7 7.85 315.0 14.32 215.3 2.47 1068.8 10.08 124.1 0.67
Min 0.5 0.01 122.4 0.47 9.9 0.04 0.7 0.02 0.6 0.03 4.6 0.05 29.3 0.28 4.1 0.02
Source: Hydrological Division, Bureau of Research and Standards, DPWH
137

16
(2) Probable Flood Peak Discharge
As mentioned in Section A.6, the flood peak discharge was calculated by means of
Rational Formula. The formula of the theory is represented as follows:
Q = 6.3
1* C * I * A
where, Q: Peak discharge (m3/s)
I: Intensity of rainfall for a duration equal to the time of concentration (mm/hr)
A: Drainage area or catchment contributing to storm flow (km2)
C: Runoff coefficient depending on catchment characteristics
(a) Runoff coefficient
Runoff coefficient (C) shall be decided taking account of land cover, vegetation,
shape of catchment and land development, etc. Different figures recommended
in guidelines commonly applied in sewerage design and land development are
introduced in the Technical Guidelines of River and Sabo Engineering, Ministry of
Infrastructure and Transport, Japan.
On the other hand, future land use plan targeted in year 2020 was prepared in the
current Study. Based on the presumed built-up conditions in the Study Area
versus the criteria as above, 0.6 was applied to estimate the peak discharges at
crossing points.
(b) Time of concentration
Time of Concentration in the Rational Formula is usually defined as required time
for reaching of the flow in the channel from the most remote point to the outlet of
the catchment concerned. Three methodologies by Kraven’s formula, Rziha’s
formula and Ven Ti Chows formula were tested. The one developed by Ven Ti
Chow is recommended to apply in the Design Guidelines, Criteria and Standards
for Public Works and Highways Volume II, DPWH (Page 696). Those formulas
cited above are described as follows:
① Kraven’s formula
T = L/W
I I > 1/100 1/100 < I <1/200 I< 1/200
W 3.5 m/s 3.0 m/s 2.1 m/s
where, I: Slope of channel, W: Flow velocity (m/s)
L: Length of channel, T: Time of concentration
138

17
② Rziha’s formula
T= L/W
W= 20 (h/L)0.6
where, W: Flow velocity (m/s), h: Elevation gap (m)
L: Channel length (m) T: Time of concentration (s)
③ Ven Ti Chow (DPWH’s Guideline)
Tc = 385.0
15.1
51H
L
where, Tc: Time of concentration (min)
L: Length of watershed along the mainstream (m)
H: Difference in elevation between the most distant ridge in the watershed and point under review (m)
The results of calculation by three methods are compared as tabulated in
Table A.7.5. As the results of examination, Ven Ti Chow’s formula was applied to
estimate the time of concentration, because that tends to give moderate figures
between other two methods. Especially as for the small catchments with short
channel length, Kraven and Rziha formula return comparatively short time
concentration, which would cause too large rainfall intensity and overestimate of
flood discharge.
Longitudinal profiles of major ricers subject to design of proposed road network are
illustrated Figure A.7.3.
139

18
Table A.7.5 Calculation of Time of Concentration
Flow Velocity
(m/s) Time of Concentration (min)
Section No. River
Length (km)
Bed slope
Elevation Gap (m)
Kraven Rziha Kraven Rziha Ven Ti Chow
CE-R1 16.53 0.01724 505 3.5 2.5 79 112 127
CE-R2 5.67 0.02564 195 3.5 2.6 27 36 53
CE-R3 5.56 0.02857 155 3.5 2.3 26 40 57
CE-R4 1.38 0.03846 65 3.5 3.2 7 7 16
CE-R5 12.12 0.01020 315 3.5 2.2 58 90 106
CE-R6 16.43 0.00746 355 3.0 2.0 91 137 144
CE-R7 15.16 0.01714 375 3.5 2.2 72 116 129
CE-R8 4.60 0.01724 125 3.5 2.3 22 33 50 CA
LA
Expre
ssw
ay
CE-R9 13.25 0.01429 325 3.5 2.2 63 102 116
NS-R1 11.07 0.00562 195 3.0 1.8 62 104 115
NS-R2 1.21 0.00926 12 3.0 1.3 7 16 26
NS-R3 19.83 0.00524 235 3.0 1.4 110 237 210
NS-R4 30.50 0.00714 585 3.0 1.9 169 273 242
NS-R5 1.53 0.01538 25 3.5 1.7 7 15 26
Nort
h-S
outh
Road
NS-R6 12.04 0.00833 255 3.0 2.0 67 101 114
DH-R1 5.64 0.00444 115 2.1 1.9 45 49 65
DH-R2 8.19 0.00588 155 3.0 1.9 46 74 89
DH-R3 32.54 0.00532 605 3.0 1.8 181 296 257
DH-R4 6.55 0.00436 55 2.1 1.1 52 96 103
DH-R5 27.70 0.00735 465 3.0 1.7 154 268 237
DH-R6 35.33 0.00311 635 3.0 1.8 196 328 278 Daang H
ari
Exte
nsio
n
DH-R7 38.08 0.00130 645 3.0 1.7 212 367 301
Source: JICA Study Team
In order to decide the rainfall intensity applying to the rational Formula, analyzed
data of rainfall (intensity-duration-frequency) in short duration at Sangley Point in
Cavite was collected from Hydrometeorological Investigations and Special Studies
Section, Flood Forecasting Branch, PAGASA. The computed extreme values of
rainfall and equivalent average intensity of computed extreme values are available
as shown in Tables A.7.6. The table was prepared by hourly rainfall records for
11 years from 1978 to 1988.
On the other hand, probable annual maximum 1-day rainfall at Sangley Point was
estimated based on 32-year records till 2005 as presented in Sub-section A.7.3.
However, since the probable values were estimated in the basis of 1-day rainfall not
24-hour data, an adjustment to 24-hour by adding 5% was conducted. The
adjusted intensity-duration-frequency values are tabulated in Table A.7.7 with
graphs corresponded.
140

19
Santa Rosa River
0
100
200
300
400
500
0 5 10 15 20 25 30
Distance (km)
Ele
vati
on
(m
)Binan River (Pulo River)
0
100
200
300
400
500
600
700
0 5 10 15 20 25 30 35 40
Distance (km)
Ele
vat
ion
(E
L.m
)
San Pedro (Piela River)
0
100
200
300
400
500
600
700
0 5 10 15 20 25 30 35 40
Distance (km)
Ele
vati
on
(E
L.m
)
Imus River
0
100
200
300
400
500
600
700
0 5 10 15 20 25 30 35 40 45 50
Distance (km)
Ele
vati
on
(E
L.m
)
Dasmarinas River
0
50
100
150
200
250
300
350
400
0 5 10 15 20
Distance (km)
Ele
vati
on
(E
L.m
)
Ilang-Ilang River
0
100
200
300
400
500
600
0 5 10 15 20 25 30 35 40
Distance (km)
Ele
vat
ion
(E
L.m
)
Baluctot River
0
50
100
150
200
250
300
0 4 8 12 16 20 24
Distance (km)
Ele
vati
on
(E
L.m
)
Rio Grande River
0
100
200
300
400
500
600
700
0 10 20 30 40 50
Distance (km)
Ele
vati
on
(E
L.m
)
Canas River
0
100
200
300
400
500
600
700
0 10 20 30 40 50
Distance (km)
Ele
vati
on
(E
L.m
)
Figure A.7.3 Longitudinal Profiles of Major Rivers
141

20
(c)
Rain
fall
inte
nsity
Ta
ble
A.7
.6 R
ain
fall In
ten
sit
y -
Du
rati
on
- F
req
ue
nc
y D
ata
at
Sa
ng
ley P
oin
t, C
avit
e
Co
mp
ute
d e
xtr
em
e v
alu
e (
in m
m)
Dura
tion
Retu
rn p
eriod (
year)
5 m
in
10 m
in15 m
in20 m
in30 m
in45 m
in60 m
in80 m
in
100 m
in120 m
in150 m
in3 h
rs6 h
rs12 h
rs24 h
rs
2
11.0
17.7
22.9
26.3
31.8
37.4
41.3
48.1
53.7
58.6
65.0
71.4
93.1
117.1
135.8
5
16.8
26.9
34.6
39.7
48.8
58.4
65.0
76.4
86.5
94.6
105.1
114.3
151.2
185.9
217.5
10
20.6
33.0
42.4
48.6
60.1
72.3
80.8
95.1
108.2
118.4
131.7
142.7
189.6
231.5
271.7
15
22.8
36.4
46.8
53.6
66.4
80.2
89.7
105.7
120.5
131.8
146.7
158.8
211.3
257.3
302.2
20
24.3
38.8
49.9
57.1
70.9
85.7
95.9
113.1
129.0
141.2
157.1
170.0
226.5
275.3
323.6
25
25.5
40.7
52.2
59.8
74.3
89.9
100.7
118.8
135.7
148.4
165.2
178.7
238.1
289.1
340.0
50
29.1
46.4
59.5
68.2
84.9
102.9
115.4
136.4
156.0
170.7
190.1
205.3
274.2
331.9
390.8
100
32.6
52.1
66.8
76.5
95.3
115.9
130.1
153.8
176.2
192.9
214.8
231.8
309.9
374.3
441.1
Eq
uiv
ale
nt
avera
ge in
ten
sit
y o
f co
mp
ute
d e
xtr
em
e v
alu
es (
in m
m/h
r)
Dura
tion
Retu
rn p
eriod (
year)
5 m
in
10 m
in15 m
in20 m
in30 m
in45 m
in60 m
in80 m
in
100 m
in120 m
in150 m
in3 h
rs6 h
rs12 h
rs24 h
rs
2
132.0
106.2
91.6
78.9
63.6
49.9
41.3
36.1
32.2
29.3
26.0
23.8
15.5
9.8
5.7
5
201.6
161.4
138.4
119.1
97.6
77.9
65.0
57.3
51.9
47.3
42.0
38.1
25.2
15.5
9.1
10
247.2
198.0
169.6
145.8
120.2
96.4
80.8
71.3
64.9
59.2
52.7
47.6
31.6
19.3
11.3
15
273.6
218.4
187.2
160.8
132.8
106.9
89.7
79.3
72.3
65.9
58.7
52.9
35.2
21.4
12.6
20
291.6
232.8
199.6
171.3
141.8
114.3
95.9
84.8
77.4
70.6
62.8
56.7
37.8
22.9
13.5
25
306.0
244.2
208.8
179.4
148.6
119.9
100.7
89.1
81.4
74.2
66.1
59.6
39.7
24.1
14.2
50
349.2
278.4
238.0
204.6
169.8
137.2
115.4
102.3
93.6
85.3
76.0
68.4
45.7
27.7
16.3
100
391.2
312.6
267.2
229.5
190.6
154.5
130.1
115.3
105.7
96.5
85.9
77.3
51.6
31.2
18.4
Sourc
e:
Hydro
lom
ete
oro
logic
al In
ve
stig
atio
ns a
nd
Spe
cia
l S
tud
ies S
ection
, F
loo
d F
ore
castin
g B
ranch,
PA
GA
SA
(T
he r
esults a
bove w
ere
estim
ate
d b
ased o
n 1
1 y
ears
record
fro
m 1
978 t
o 1
988.)
Ta
ble
A.7
.7 A
dju
ste
d R
ain
fall In
ten
sit
y -
Du
rati
on
- F
req
uen
cy C
urv
e f
or
San
gle
y P
oin
t, C
avit
e
Co
mp
ute
d e
xtr
em
e v
alu
e (
in m
m)
Retu
rn P
eriod (
Year)
5
10
15
20
30
45
60
80
100
120
150
180
360
720
1440
2
12.6
17.7
22.9
26.3
31.8
37.4
41.3
48.1
53.7
58.6
65.0
71.4
93.1
117.1
135.8
5
17.1
27.4
35.3
40.5
49.8
59.6
66.3
77.9
88.2
96.5
107.2
116.6
154.3
189.7
221.9
10
20.2
32.3
41.5
47.6
58.8
70.8
79.1
93.1
105.9
115.9
128.9
139.7
185.6
226.6
266.0
25
24.0
38.4
49.2
56.4
70.1
84.8
95.0
112.0
128.0
139.9
155.8
168.5
224.5
272.6
320.6
50
27.0
43.1
55.3
63.4
78.9
95.6
107.2
126.7
144.9
158.6
176.6
190.7
254.8
308.4
363.1
100
29.9
47.8
61.2
70.1
87.3
106.2
119.2
141.0
161.5
176.8
196.9
212.5
284.0
343.1
404.3
Eq
uiv
ale
nt
avera
ge in
ten
sit
y o
f co
mp
ute
d e
xtr
em
e v
alu
es (
in m
m/h
r)
Retu
rn P
eriod (
Year)
5
10
15
20
30
45
60
80
100
120
150
180
360
720
1440
2
150.9
121.4
104.7
90.2
72.7
57.0
47.2
41.2
36.8
33.5
29.7
27.2
17.7
11.2
6.5
5
205.7
164.7
141.2
121.5
99.6
79.4
66.3
58.5
52.9
48.3
42.9
38.9
25.7
15.8
9.2
10
242.0
193.8
166.0
142.7
117.7
94.4
79.1
69.8
63.6
58.0
51.6
46.6
30.9
18.9
11.1
25
288.5
230.3
196.9
169.2
140.1
113.0
95.0
84.0
76.8
70.0
62.3
56.2
37.4
22.7
13.4
50
324.4
258.7
221.1
190.1
157.8
127.5
107.2
95.0
87.0
79.3
70.7
63.6
42.5
25.7
15.1
100
358.6
286.5
244.9
210.4
174.7
141.6
119.2
105.7
96.9
88.4
78.8
70.8
47.3
28.6
16.8
Sourc
e:
Pre
pare
d b
y J
ICA
Stu
dy T
ea
m b
ased
on t
he
pro
ce
sse
d d
ata
obta
ine
d fro
m P
AG
AS
A
142
21
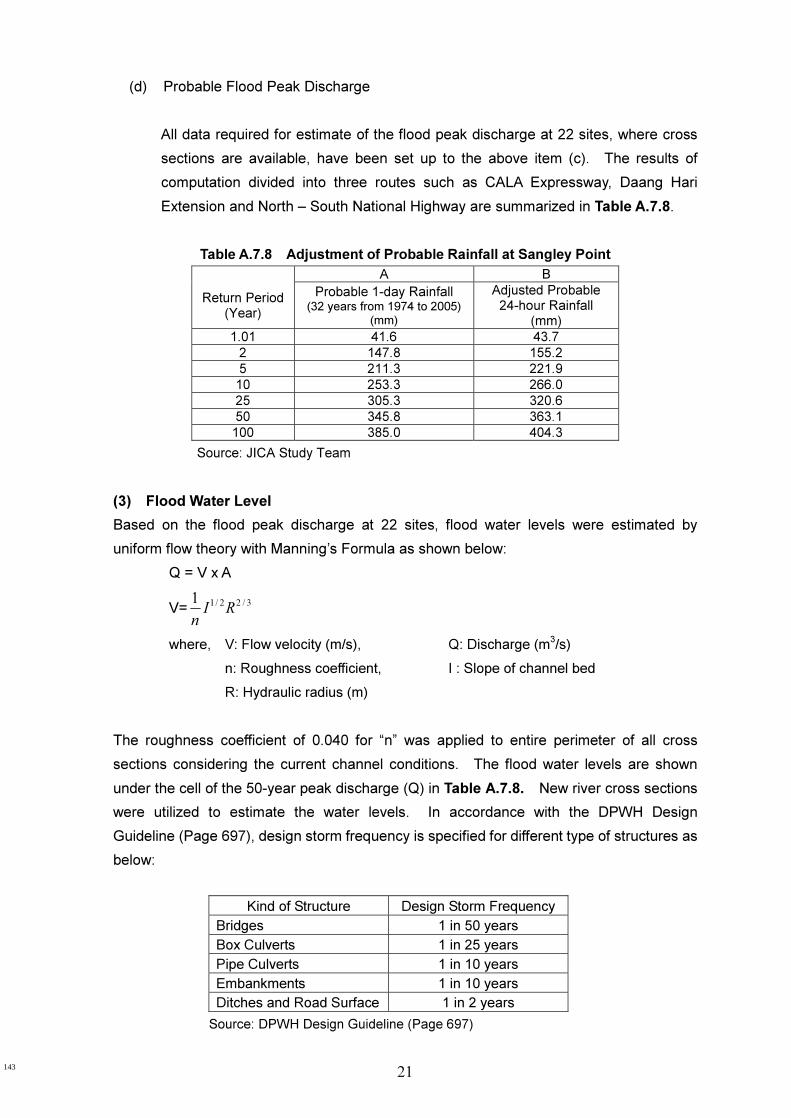
(d) Probable Flood Peak Discharge
All data required for estimate of the flood peak discharge at 22 sites, where cross
sections are available, have been set up to the above item (c). The results of
computation divided into three routes such as CALA Expressway, Daang Hari
Extension and North – South National Highway are summarized in Table A.7.8.
Table A.7.8 Adjustment of Probable Rainfall at Sangley Point
A B
Return Period (Year)
Probable 1-day Rainfall (32 years from 1974 to 2005)
(mm)
Adjusted Probable 24-hour Rainfall
(mm)
1.01 41.6 43.7
2 147.8 155.2
5 211.3 221.9
10 253.3 266.0
25 305.3 320.6
50 345.8 363.1
100 385.0 404.3
Source: JICA Study Team
(3) Flood Water Level
Based on the flood peak discharge at 22 sites, flood water levels were estimated by
uniform flow theory with Manning’s Formula as shown below:
Q = V x A
V=3/22/11
RIn
where, V: Flow velocity (m/s), Q: Discharge (m3/s)
n: Roughness coefficient, I : Slope of channel bed
R: Hydraulic radius (m)
The roughness coefficient of 0.040 for “n” was applied to entire perimeter of all cross
sections considering the current channel conditions. The flood water levels are shown
under the cell of the 50-year peak discharge (Q) in Table A.7.8. New river cross sections
were utilized to estimate the water levels. In accordance with the DPWH Design
Guideline (Page 697), design storm frequency is specified for different type of structures as
below:
Kind of Structure Design Storm Frequency
Bridges 1 in 50 years
Box Culverts 1 in 25 years
Pipe Culverts 1 in 10 years
Embankments 1 in 10 years
Ditches and Road Surface 1 in 2 years
Source: DPWH Design Guideline (Page 697)
143

22
(4) Evaluation of Results
In the Feasibility Study of the Cavite Busway System carried out by JICA in 2002, runoff
analysis to estimate flood peak discharges at 12 crossing point along the proposed busway.
The proposed route is corresponded with the North-South road in the present Study.
Estimated peak discharge and specific discharge at the subject points is tabulated in
Table A.7.9. The specific discharge for 50-year return period varies between 2.7 and
14.9 m3/s/km2. On the other hand, those estimated by the current study fall into between
9 and 36 m3/s/km2 based on the figures in Table A.7.8. Therefore, it is noted that the
current study resulted larger values in terms of specific discharges compared with those
estimated by Busway System Study.
On the other hand, Specific Discharge Curves in different return periods are available in
the Report of “Specific Discharge Curve, Rainfall Intensity Duration Curve, Isohyet of
Probable 1-day Rainfall”, which was prepared in the Project for the Enhancement of
Capabilities in Flood Control and Sabo Engineering of the DPWH under JICA in March
2003. As Figure A.7.4 illustrates, three curves in each region, such as Luzon, Visayas
and Mindanao were developed based on the peak flood discharges estimated in 14 major
river basins in the country. The distributed range of the specific discharges becomes
closer to the envelope curve of Luzon.
Therefore, it is proved that the results of runoff analysis were preliminarily justified in the
feasibility study level. However, further verification and updating of the design discharges
and flood water levels should be conducted during the detailed design stage. Discharge
rating curves at 22 cross sections are attached in Annex B.
Table A.7.9 Flood Peak Discharges Estimated by Busway Study
Station River Area Peak Discharge (m3/s) Specific Discharge (m
3/s)
No. Name (km2) 25 yr 50yr 100 yr 25 yr 50yr 100 yr
1 Imus-Tributary 10.73 25.4 29.2 33.0 2.4 2.7 3.1
1a Zapote 56.14 184.9 207.9 230.6 3.3 3.7 4.1
1b Zapote 53.22 177.8 199.7 221.4 3.3 3.8 4.2
2 Zapote-Tributary 2.32 13.0 14.9 16.9 5.6 6.4 7.3
3 Imus-Tributary 1.15 11.0 12.7 14.3 9.6 11.0 12.4
4 Imus-Tributary 3.07 19.6 22.6 25.5 6.4 7.4 8.3
5 Imus-Tributary 0.69 6.6 7.6 8.6 9.6 11.0 12.5
6 Imus 8.53 35.0 40.7 45.3 4.1 4.8 5.3
7 Imus-Tributary 0.72 8.8 10.1 11.5 12.2 14.0 16.0
8 Imus-Tributary 0.74 9.6 11.0 12.5 13.0 14.9 16.9
9 Imus-Tributary 1.44 17.4 20.0 22.7 12.1 13.9 15.8
10 Imus-Tributary (Baluctot River)
5.92 61.1 67.3 73.4 10.3 11.4 12.4
11 Imus 39.75 135.5 155.7 175.5 3.4 3.9 4.4
12 Imus-Tributary 3.30 34.0 39.0 44.1 10.3 11.8 13.4
Source: Final Report, Feasibility Study of the Cavite Busway System, JICA
144

23
Figure A.7.4 Specific Discharge Curve (1:50-Year Return Period)
A.8 Particular Issues on River Engineering related to the Proposed Alignment
A.8.1 CALA Expressway from Sta.1+000 to Sta.1+500
The alignment of CALA Expressway near connection with the SLEX near Santa Rosa will
cross the small creek of the Santa Rosa River. Since the proposed alignment will run
along the creek, appropriate alignment not to deteriorate of the local drainage conditions
considering the drainage system in the new residential estates, where are under
developing in the vicinity will be required.
Although flood discharge will not make influence to the vertical design of the proposed
expressway, it is recommended to confirm existing outlet connected with the creek should
be further investigated in the feasibility design stage.
A.8.2 Daang Hari Extension from Sta.14 +000 to Sta. 15+000
Near the starting point in Bacoor of the North-South Road, interchange (and/or service
area) is planned on the ground level. In order to decide appropriate elevation of land
reclamation and required related structures in the coastal area considering high tide (storm
serge) of Manila Bay, probable maximum tide levels were studied.
In Manila Bay, tide levels are observed at Pier No.7 of Manila South Harbor (14°37′N,
120°58′) by the Coast and Geodetic Survey Department, National Mapping and Resource
Information Authority (NAMRIA), DENR. The maximum tide levels were collected from
NAMRIA Binondo Office as tabulated in Table A.8.1. Based on the historical records,
probable maximum high tide of 50-year return period was estimated at EL.2.42m by
145

24
Gumbel Method. In order to protect the structure extraordinary high tide, it is
recommended that this tide level should considered in structural design of road facilities.
A.8.3 North-South Road from Sta.0+000 to Sta.3+000
Along the proposed alignment of Daang Hari Extension in Citta Italia estates in Municipality
of Imus, NIA’s irrigation canal is running in parallel. Considering the availability of the
limited space of right-of-way, encasing is one of the possible solution to keep the required
width of the road design.
The Study Team wrote an official letter to confirm the opinion to NIA. Discussion with the
Chief Engineer of the NIA’s Operation Office in Municipality of Naic as well as joint filed
inspection was made on May 30, 2006.
As the result of the discussion with NIA, they basically accepted to encase (or to cover) the
irrigation canal, since it has been already abandoned due to decrease of irrigation water
demand in their command area. In fact, it seems no maintenance of the canal is currently
provided and confirmed spotted water stagnation in the canal. However, the NIA staff
requested to remain the flow space, because presently the canal has a function of
drainage in the neighboring area of the sub-division.
Based on the findings and recognition by NIA, in order to fit the road alignment within the
right-of-way, it is recommended to encase the canal to keep present flow area tentatively.
In the detailed design stage, appropriate drainage network should be studied.
A.8.4 North-South Road from Sta.21+000 to Sta.21+500
Proposed alignment of NS-Road will cross the Dasmariñas River at around 100 m to 200 m
upstream of Bucal Bridge, where construction of widening span is progressed. A river
cross section (NS-R6) is available at this section. Based on the runoff analysis, the
50-year probable flood water level will reached a little higher the right bank. It is
recommended that the proper protection for the side slope of embankment at bridge pier
will be required. In particular, as for the vertical formation of the proposed alignment
crossing this point, due care shall be paid.
A.9 Bank Erosion
No serious erosion or local scour of river bed and/or river bank may become realize under
the current conditions as far as at the crossing site along the proposed alignment of three
routes. However, appropriate treatment to stabilize the slope of river bank in association
with construction of bridge and other crossing structures will be required.
Sediment deposition along the channel is rather small considering steep river bed gradient
146

25
and relatively thick vegetation cover of the watershed. Further, the river bed and foot of
bank slopes are formed with hard rock and thus these are less susceptible to erosion by
strong current under the current conditions.
However, specific consideration of countermeasures at crossing points shall be made if
present channel geometry is remarkably changed due to construction works of new road
and related structures.
147

26
North East 1951 52 53 54 55 56 57 58 59 60 61 62 63 64 65 66 67 68 69 70 71 72 73 74 75 76 77 78 79 80 81 82 83 84 85 86 87 88 89 90 91 92 93 94 95 96 97 98 99 00 01 02 03 04 05
428 Cavite City 14°30' 120°55' 31
432 Tanaunan 14°05' 121°03' 54
Climatic Station
74 - 0406 Amadeo 14°10'18" 120°57'00" 18
75 - 0407 Bacoor 14°27'00" 120°56'00" 30
79 - 0408 San Pedro 14°22'00" 121°02'18" 25
Agromat Station
424 Tagaytay City 14°07'18'' 120°58'00'' 11
Source: Prepared by the Study Team based on daily rainfall records from PAGASA 138
45 46 …. 54 55 56 …. 65 66 67 68 69 70 71 72 73 74 75 76 77 78 79 80 81 82 83 84 85 86 87 88 89 90 91 92 93 94 95 96 97 98 99 00 01 02 03 04 05
Ilang-Ilang 60 5.558 12
Maragondon 260 17.730 30
Maragondon 260 2.288 18
Panaysayan 29 28.970 20
Balsahan 22 34.662 24
Alemang 42Not
established15
Arangilan Calamias,Cabuyao, Laguna 87 19.950 15
Pagsanjan 247 4.980 16
San Cristobal 106Not
established7
San Juan 185Not
established14°12'38" 14
Note: 171
Source: Hydrological Division, Bureau of Research and Standards, DPWH
Year Available
Years
14°16'59"
14°22'22"
14°16'20"
14°16'20"
14°24'30"
120°52'55"
120°48'30"
121°07'30"
121°27'25"
121°09'19"
121°09'10"
120°46'28"
East
120°54'20"
120°44'20"
120°44'20"
Porac, Calamba, Laguna
Code No.
Palubluban, General Trias
Palangue, Naic, Cavite
Makina, Naic, Cavite
Name of River
04SW141210BRS074
04SW141210BRS075
04SW141204BRS068
04SW141204BRS062*
14°14'10"
Bukal, Maragondon, Cavite
14°16'41"
14°13'06"
San Isidro, Pagsanjan,
Laguna
San Cristobal, Calamba,
Laguna
14°19'06"
04SW141212BRS071*
04SW142205PW023
04SW141204PW024
04SW141210PW013
Total
Table A.2.2 Available Mean Daily Discharge Record in and around the Study Area
04SW142205PW022
04SW141204PW025
Location
Alapan, 2nd
Imus, Cavite
Mabacao, Maragondon,
Cavite
Catchment
Area
(km2) North
LocationAltitude of
zero gauge
(EL.m)
Only annual discharge characteristics and mean monthly discharge are available instead of daily discharge record.
Daily discharge or mean daily gauge height are available.
Mabolo Elem. School, Bacoor
San Pedro, Laguna
Tagaytay
Cavite
Laguna
Cavite
*, Only mean daily gauge height is available.
Ambulong
Barrio Maintim, Amadeo
Province
Cavite
Batangas
Cavite
Year
Table A.2.1 Available Daily Rainfall Record in and around the Study Area
Available
Years
Total
Code No.Location
Synoptic Station
MunisipalityName of Station
Sangley Point
148

27
Figure A.2.2 Watershed Boundaries with Rainfall and Water Level Gauging Stations
Canas River
San Juan River Imus River
Zapote River
Tunasan River
San Pedro River
Binan River
Sta. Rosa
Legend Rainfall Gauge Water Level Gauge Watershed Boundary Proposed Road Alignment
Sanley Point
Amadeo
Arangilan
San Pedro
Balsahan
Alemang
Panaysayan
Ylang-Ylang
Mabolo
Tagaytay
Ambulong
149

28
Figure A.2.3 Location Map of Crossing with River along Proposed Roads
12
10
6 54 3
2
11 9 8
71
9
8
7
6
5
4
3
2
1
10
98 7 6 5 4 3 2
1
Legend
Major crossing points with rivers
Crossing points subject to river cross section survey
(February to March, 2006)
CALA Expressway - 9 sites
North-South - 6 sites
East-West - 7 sites
150

29
Table A.3.1 River Crossings along Proposed Three Routes
I. CALA Expressway (CE)
Start Sta.0+000 Santa Rosa SLEX
CALA1 Sta.5+820 Banava - Silang 12.3 Bridge CE-R1
CALA2 Sta.7+200 Banava - Silang 1.6 Bridge moderately deep CE-R2
CALA3 Sta.7+720 Banava - Silang 4.5 Bridge moderately deep -
CALA4 Sta.8+500 Banava - Silang 2.2 Bridge CE-R3
CALA5 Sta.9+200 Biñan - Silang 1.4 Bridge CE-R4
CALA6 Sta.10+840 Biñan - Silang 8.8 Bridge CE-R5
CALA7 Sta.13+250 San Pedro - Silang 12.7 Bridge
Downstream of
confluence, deep valley
with thick vegetation
CE-R6
CALA8 Sta.15+320 Imus - Silang 13.2 Bridge deep valley CE-R7
CALA9 Sta.16+800 Dasmariñas - Silang 4.9 Bridge CE-R8
CALA10 Sta.19+300 San Juan Ylang Ylang Silang 8.8 Bridge CE-R9
End Sta.22+881 Silang Dasmarinas - Naic Road
9 sites
II. Daang Hari Extension (DH)
Start Sta.0+000 Muntinlupa City - -
Boundary of Muntinlupa
City and Municipality of
Imus
EW1 Sta.3+200 - - Muntinlupa City - Bridge moderately deep valley -
EW2 Sta.3+420 - - Imus 3.4 Bridge -
EW3 Sta.6+100 Zapote Don Cella Imus 10.9 Bridge -
EW4 Sta.7+100 Zapote - Imus 4.6 Bridge DH-R1
EW5 Sta.8+100 - - Imus 1.3 Bridge -
EW6 Sta.9+300 Imus - Imus 7.7 Bridge DH-R2
EW7 Sta.12+050 Imus - Imus 54.6 Bridgenear new bridge under
constructionDH-R3
EW8 Sta.13+640 Imus - Imus 8.7 Bridge DH-R4
EW9 Sta.15+220 San Juan - Imus 52.0 Bridge DH-R5
EW10 Sta.17+300 San Juan Pasong Cama Chili General Trias 11.4 Bridge -
EW11 Sta.17+400 San Juan Rio Grande General Trias 51.1 Bridgenear existing suspension
bridgeDH-R6
EW12 Sta.18+960 Cañas Cañas General Trias 95.8 Bridge DH-R7
End Sta.24+268 Tanza Coastal Road
7 sites
III. North-South Road (NS)
Start Sta.0+000 Imus Coastal Road
NS1 Sta.4+150 - - Imus - - small creek -
NS2 Sta.7+950 - - Imus 4.9 Bridge -
NS3 Sta.8+750 Imus - Imus 9.9 Bridge
near new bridge already
constructed, land
reclamation is on-going for
expansion of Citta Italia
estate
NS-R1
NS4 Sta.11+300 Imus - Imus 1.8 Bridge NS-R2
NS5 Sta.12+900 Imus Baluctot Imus 20.9 Bridge moderately deep NS-R3
NS6 Sta.14+000 Imus - Imus 34.7 Bridge near suspention bridge NS-R4
NS7 Sta.17+250 Imus - Dasmariñas 3.0 Bridge near existing irrigation weir NS-R5
NS8 Sta.21+500 San Juan Dasmariñas Dasmariñas 11.8 Bridgenear Bucal Bridge under
construction of wideningNS-R6
NS9 Sta.25+500 San Juan Ylang Ylang Silang 2.9 Bridge -
End Sta.26+700 SilangProposed CALA
Expressway
6 sites
Note:
Source: JICA Study Team
(1, Tentative figures to be further veirfied through finalization of alingment in the feasibility study
Proposed
Structure
(Tentative)
Name of RiverCrossing
Points (1
Drainage
Area
(km2
)
Municipality
Cross
section
survey
Notable Existing
ConditionsName of TributaryRef. No.
151

30
Table A.8.1 Recorded Maximum Tide Levels at Manila South Harbour
Station: Pier No.7, Manila South Harbour
Location: 14°35'N, 120°58'E
Year Date Elevation (m) Year Date Elevation (m)
1946 Sep.06,11,24 1.27 1976 Jun.29,30 1.85
1947 Jun.20 1.63 1977 Jul.18 1.76
1948 Sep.01 1.63 1978 Oct.12 1.79
1949 Jun12,15 27,28,29 1.33 1979 Aug.09 1.75
1950 Jul.27 1.57 1980 Aug.26,28 1.67
1951 Aug.16,17 1.63 1981 Jul.04, Aug.01 1.82
1952 Jun.11 1.57 1982 Jun.24 1.91
1953 Jun.28,29 1.60 1983 Aug.11 1.71
1954 Jul.01, Dec.10 1.45 1984 Aug.27,29 2.09
1955 Jul.19 1.45 1985 Jun.22 2.12
1956 Jun.10 1.45 1986 Jul.09 2.01
1957 Jun.29 1.36 1987 Jul.12,13 1.95
1958 Jul.17 1.33 1988 Jul.30 1.98
1959 Aug.05,18 1.33 1989 Jun.05 1.95
1960 Aug.07 1.60 1990 Jun.24,25 1.94
1961 Jul.29 1.48 1991 Oct.25 1.95
1962 Aug.01 1.57 1992 Aug.29 1.95
1963 Jul.21 1.48 1993 Oct.06 1.99
1964 Aug.07 1.82 1994 Jun.23, Jul.10 2.00
1965 Jul.14,28 1.57 1995 Oct.01 2.03
1966 Aug.15 1.60 1996 Jul.31 2.19
1967 Jul.19, Aug.19 1.60 1997 Aug.18 2.04
1968 Jul.25, 26 1.69 1998 Aug.09 1.91
1969 Jun.30 1.60 1999 Apr.22 2.15
1970 Aug.17 1.72 2000 Jul.04 2.25
1971 Oct.11 1.72 2001 Aug.19 1.49
1972 Jul.12 1.91 2002 Jul.11 1.63
1973 Oct.15 1.79 2003 - -
1974 Jul.20 1.91 2004 Dec.14 1.52
1975 Aug.07 1.47 2005 Jun.24 1.62
Max 2.25
Average 1.73
Note:
Source: NAMRIA Binondo Office
The records above are in meters and referred to Mean Lower Low Water (MLLW)
152

31
AN
NE
X A
11
04
.15
19.5
7
253
.93
19.4
8
35
.83
19.8
3
45
.64
18.8
6
53
.97
18.2
8
60
.00
17.9
9
7-7
.93
17.5
8
8-7
.95
19.8
2
9-9
.97
18.2
4
10
-45
.86
19.0
8
11
-77
.08
19.7
6
12
-95
.99
19.6
0
NS
-R1
17
.0
17
.5
18
.0
18
.5
19
.0
19
.5
20
.0
-60
-40
-20
02
04
060
Dis
tance
(m
)
Elevation (EL.m)
Only
this
sec
tio
n
is e
nou
gh
18
1.7
02
6.6
3
25
1.0
82
6.9
6
33
1.7
82
7.3
9
41
5.8
92
7.6
3
54
.99
25
.60
62
.38
23
.80
70
.00
23
.79
8-2
.90
24
.20
9-5
.38
24
.90
10
-18
.35
25
.72
11
-33
.20
25
.72
12
-57
.37
26
.61
13
-68
.20
27
.09
NS
-R2
20
22
24
26
28
30
-80
-60
-40
-20
02
04
06
08
01
00
Dis
tance
(m
)
Elevation (EL.m)
16
9.4
73
7.0
3
23
5.9
23
6.1
7
31
2.7
93
4.1
0
49
.98
30
.94
50
.00
26
.66
6-6
.85
27
.32
7-1
8.3
33
3.9
7
8-3
8.3
03
6.1
6
9-7
2.1
23
6.5
2
NS
-R3
22
24
26
28
30
32
34
36
38
40
-80
-60
-40
-20
02
04
06
08
0
Dis
tan
ce (
m)
Elevation (EL.m)
11
17
.48
51
.73
28
1.6
75
1.4
5
32
5.5
05
0.9
1
41
3.6
65
0.6
5
51
2.1
64
8.8
9
60
.00
47
.37
7-1
0.8
44
8.7
1
8-1
2.6
45
0.2
9-1
7.5
75
1.0
6
10
-33
.54
51
.07
11
-51
.58
50
.77
12
-73
.69
50
.51
13
-88
.50
49
.98
47
47
.548
48
.549
49
.550
50
.551
51
.552
-10
0.0
0-5
0.0
00
.00
50
.00
10
0.0
01
50
.00
系列
1
NS
-R4
47
47
.548
48
.549
49
.550
50
.551
51
.5
-40
-30
-20
-10
01
02
03
0
Dis
tan
ce (
m)
Elevation (EL.m)
153

32
19
6.7
173
.67
28
1.7
873
.46
36
6.8
473
.26
45
1.9
173
.05
53
6.9
772
.84
62
3.5
170
.69
71
4.6
969
.71
84.4
066
.28
93.6
165
.45
10
0.0
064
.96
11
-3.2
664
.95
12
-4.8
065
.63
13
-11.4
566
.05
14
-20.6
168
.79
15
-31.1
668
.69
16
-41.7
168
.58
17
-52.2
668
.48
18
-62.8
068
.38
NS
-R5
64
65
66
67
68
69
70
71
72
73
74
75 -8
0-6
0-4
0-2
00
20
40
60
80
100
120
Dis
tan
ce (
m)
Elevation (El.m)
19
1.7
01
16
.30
3
26
5.6
21
14
.83
3
34
1.9
41
13
.35
3
41
0.8
71
13
.95
3
57
.87
11
2.1
43
60
.00
11
1.2
23
7-6
.62
11
1.9
03
8-8
.84
11
3.3
73
9-2
2.1
71
13
.69
3
10
-32
.18
11
6.7
63
11
-52
.25
12
7.9
53
Dis
tan
ce 8
to
9
13
.33
27
9
Dis
tan
ce 4
to
5
3.5
03
78
6
NS
-R6
11
0
11
2
11
4
11
6
11
8
12
0
12
2
12
4
12
6
12
8
13
0 -80
-60
-40
-20
02
04
06
08
01
00
12
0
Dis
tan
ce (
m)
Elevation (m)
156
.99
39
.82
235
.39
36
.22
323
.65
35
.38
415
.39
33
.92
57
.55
33
.23
63
.33
32
.00
70
.00
31
.72
8-4
.14
32
.01
9-7
.49
33
.44
10
-33
.10
36
.86
11
-48
.76
37
.59
12
-58
.17
39
.52
DH
-R1
20
25
30
35
40
45
-80
-60
-40
-20
02
040
60
80
Dis
tance
(m
)
Elevation (EL.m)
19
1.1
93
6.5
8
27
1.9
33
6.5
3
35
1.2
43
5.7
2
42
9.1
93
2.5
0
59
.44
29
.99
63
.98
27
.48
70
.00
26
.30
8-4
.51
27
.69
9-6
.92
30
.06
10
-9.1
83
1.0
0
11
-27
.37
33
.45
12
-46
.04
34
.31
13
-59
.91
34
.43
14
-77
.56
36
.57
DH
-R2
20
22
24
26
28
30
32
34
36
38
-10
0-8
0-6
0-4
0-2
00
20
40
60
80
10
0
Dis
tance
(m
)
Elavation (EL.m)
154
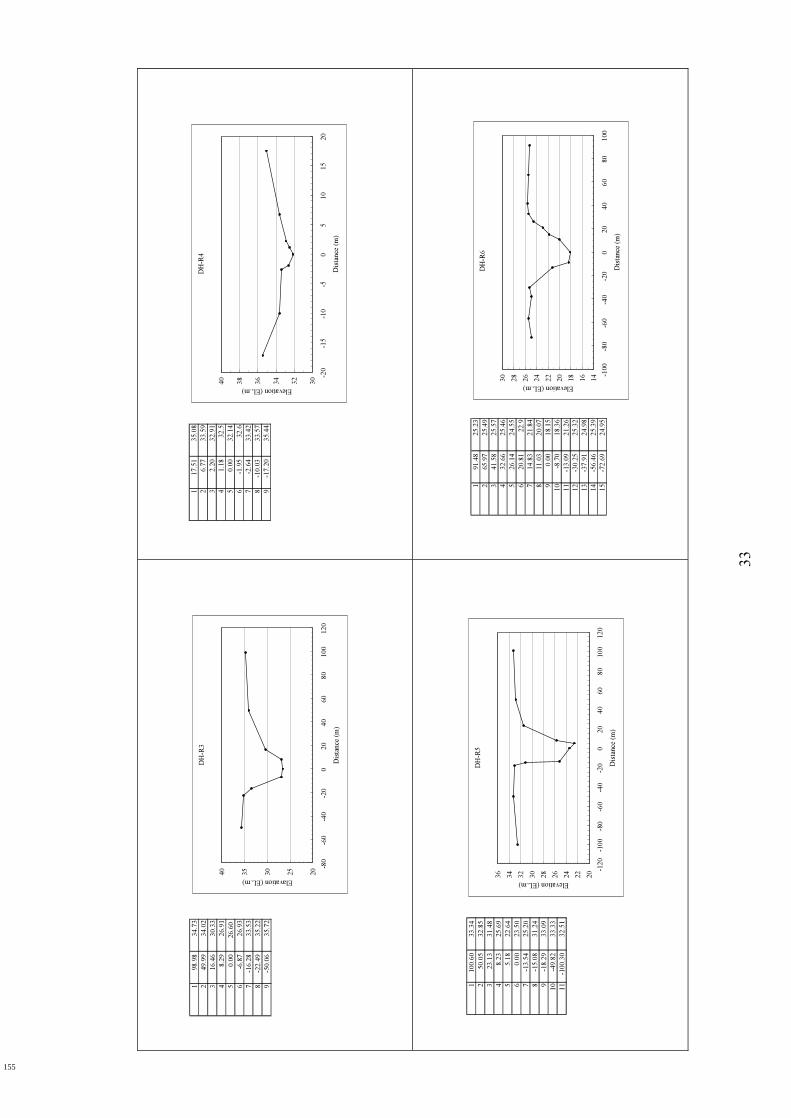
33
19
8.9
83
4.7
3
24
9.9
93
4.0
2
31
6.4
63
0.3
3
48
.29
26
.91
50
.00
26
.60
6-6
.87
26
.93
7-1
6.2
83
3.5
3
8-2
2.4
93
5.2
2
9-5
0.0
63
5.7
2
DH
-R3
20
25
30
35
40
-80
-60
-40
-20
02
04
06
08
01
00
12
0
Dis
tan
ce (
m)
Elavation (EL.m)
11
7.5
13
5.0
8
26
.77
33
.59
32
.20
32
.91
41
.18
32
.5
50
.00
32
.14
6-1
.95
32
.6
7-2
.64
33
.42
8-1
0.0
33
3.5
7
9-1
7.2
03
5.4
4
DH
-R4
30
32
34
36
38
40 -2
0-1
5-1
0-5
05
10
15
20
Dis
tan
ce (
m)
Elevation (EL.m)
1100
.60
33
.34
250
.05
32
.85
323
.13
31
.48
48
.23
25
.69
55
.18
22
.64
60
.00
23
.50
7-1
3.5
425
.20
8-1
5.0
831
.24
9-1
8.2
933
.09
10
-49
.82
33
.33
11
-100
.30
32
.51
DH
-R5
20
22
24
26
28
30
32
34
36
-12
0-1
00
-80
-60
-40
-20
020
40
60
80
10
012
0
Dis
tance
(m
)
Elevation (EL.m)
19
1.4
82
5.2
3
26
5.9
72
5.4
9
34
1.5
82
5.5
7
43
2.6
62
5.4
6
52
6.1
42
4.5
5
62
0.8
12
2.9
71
4.8
32
1.8
4
81
1.0
32
0.0
7
90
.00
18
.15
10
-8.7
01
8.3
6
11
-13
.09
21
.26
12
-30
.25
25
.32
13
-37
.91
24
.98
14
-56
.46
25
.39
15
-72
.69
24
.95
DH
-R6
14
16
18
20
22
24
26
28
30 -1
00
-80
-60
-40
-20
02
04
06
08
01
00
Dis
tan
ce (
m)
Elevation (EL.m)
155

34
11
78
.83
23
.68
21
42
.33
23
.21
31
12
.09
23
.62
49
7.5
82
3.6
2
59
6.2
81
5.1
0
69
0.7
21
5.2
5
78
7.3
32
3.8
1
88
3.0
12
3.9
2
95
3.4
31
7.7
2
10
42
.40
14
.72
11
27
.12
11
.71
12
14
.21
8.6
8
13
4.7
35
.93
14
0.0
05
.65
15
-3.4
85
.81
16
-11
.42
8.2
9
17
-30
.55
13
.11
18
-65
.78
12
.95
19
-76
.34
14
.50
20
-97
.74
12
.83
21
-12
9.2
21
5.5
3
22
-13
9.6
21
3.7
6
23
-14
9.7
61
7.9
8
24
-18
5.1
02
0.9
8
25
-24
7.3
32
5.5
9
26
-26
9.6
72
4.6
8
27
-27
7.2
62
4.7
6
28
-29
4.1
42
3.7
2
DH
-R7
05
10
15
20
25
30 -3
50
-30
0-2
50
-20
0-1
50
-10
0-5
00
50
10
01
50
20
02
50
Dis
tan
ce (
m)
Elevation (EL.m)
15
9.5
51
05.6
8
23
7.4
31
05.4
5
32
1.0
21
05
.4
41
6.7
81
04.4
5
51
3.6
01
02.9
5
62
.48
91.5
6
70
.00
90.6
2
8-1
.47
91.6
9
9-7
.83
98.2
7
10
-17
.53
10
5.5
5
11
-30
.76
10
5.7
5
12
-49
.49
10
6.2
5
13
-67
.55
10
7.2
3
CE
-R1
88
90
92
94
96
98
10
0
10
2
10
4
10
6
10
8
11
0
-80
-60
-40
-20
02
04
06
08
0
Dis
tan
ce (
m)
Elevation (EL.m)
1211
.58
196
.85
2150
.59
205
.28
389
.60
213
.71
455
.12
204
.37
531
.03
195
.70
68
.72
178
.34
73
.42
169
.66
80
.00
169
.76
9-3
.27
169
.83
10
-8.8
9179
.91
11
-15
.83
183
.27
12
-21
.75
186
.63
13
-69
.46
200
.36
14
-107
.23
207
.72
15
-116
.14
208
.17
16
-152
.95
209
.49
CE
-R2
15
0
16
0
17
0
18
0
19
0
20
0
21
0
22
0 -200
-150
-100
-50
050
100
15
020
025
0
Dis
tan
ce (
m)
Elevation (EL.m)
208
.87
25
7.4
2
126
.77
25
9.4
2
90
.16
25
7.9
2
77
.81
256
.4
55
.30
25
1.2
5
21
.30
24
0.5
2
9.4
922
7.7
6
4.0
92
24
.1
0.0
022
1.5
8
-13
.03
21
8.3
6
-26
.22
22
0.2
5
-37
.69
23
2.6
9
-61
.32
23
2.9
2
-96
.04
23
8.7
1
-126
.69
250
.3
-138
.90
25
6.2
5
-160
.26
25
6.7
8
-200
.03
25
7.9
9
-234
.90
25
7.2
1
CE
-R3
21
5
22
0
22
5
23
0
23
5
24
0
24
5
25
0
25
5
26
0
26
5 -28
0-1
80
-80
20
12
022
032
0
Dis
tan
ce (
m)
Elevation (m)
156

35
87.37
273.36
57.50
272.17
30.18
271.32
17.70
264.57
9.02
260.34
1.30
255.60
0.00
255.10
-1.58
255.44
-7.32
258.30
-12.74
262.70
-17.71
265.37
-27.52
267.85
-52.88
267.08
-63.04
266.31
-76.55
273.92
-91.69
275.73
-103.71
276.18
-112.69
274.00
-140.63
266.48
CE-R4
25
42
56
25
8
26
02
62
26
42
66
26
82
70
27
22
74
27
62
78
-18
0-1
40
-10
0-6
0-2
02
06
01
00
Dis
tan
ce (
m)
Elevation (m)
61.9
9290
.30
28.0
5289
.03
15.7
7283
.18
9.7
8281
.29
3.9
7273
.72
0.0
0272
.62
-3.7
5273
.51
-9.3
1290
.01
-32.1
5289
.30
-81.9
1287
.57
-102.0
4286
.35
CE
-R5
270
272
274
276
278
280
282
284
286
288
290
292
-15
0-1
00
-50
05
01
00
Dis
tance
(m
)
Elevation (EL.m)
19
7.9
32
79
.91
27
8.8
02
80
.12
34
8.1
52
75
.39
42
3.9
02
62
.21
51
6.9
92
61
.58
61
2.0
72
60
.35
75
.60
25
9.3
5
83
.34
25
3.0
0
90
.00
25
1.4
9
10
-3.7
92
52
.50
11
-8.9
02
58
.63
12
-14
.46
26
6.3
5
13
-21
.94
26
7.8
6
14
-34
.97
27
4.7
4
15
-43
.40
27
3.2
4
16
-52
.25
27
4.6
1
17
-59
.47
27
9.1
7
18
-10
1.9
02
80
.32
19
-15
1.9
72
79
.98
CE
-R6
25
0.0
0
25
5.0
0
26
0.0
0
26
5.0
0
27
0.0
0
27
5.0
0
28
0.0
0
28
5.0
0 -20
0.0
0-1
50
.00
-10
0.0
0-5
0.0
00
.00
50
.00
10
0.0
01
50
.00
Dis
tan
ce (
m)
Elevation (EL.m)
19
9.5
22
75
.49
25
8.6
62
74
.00
34
9.3
22
74
.80
42
8.1
92
75
.39
52
1.1
52
71
.86
68
.69
25
7.1
5
72
.84
25
5.9
0
80
.00
25
5.9
2
9-7
.52
25
8.2
4
10
-17
.03
27
3.4
0
11
-24
.46
27
6.8
1
12
-26
.68
27
6.7
7
13
-33
.56
27
6.8
4
14
-50
.83
27
6.5
6
15
-82
.99
27
5.5
5
16
-10
0.7
72
76
.76
CE
-R7
25
0
25
5
26
0
26
5
27
0
27
5
28
0
-15
0-1
00
-50
05
01
00
15
0
Dis
tan
ce (
m)
Elevation (EL.m)
157

36
57.5
223
8.7
36.8
7240
.72
10.1
5240
.36
6.7
5237
.48
1.6
223
3.9
0.0
0233
.78
-4.3
9234
.12
-9.5
1241
.34
-35.9
5242
.75
-42.5
724
2.8
-63.7
2243
.73
-78.5
4247
.16
-92.0
4252
.17
CE
-R8
23
2
23
4
23
6
23
8
24
0
24
2
24
4
24
6
24
8
25
0
25
2
25
4 -10
0-8
0-6
0-4
0-2
00
20
40
60
80
(Dis
tan
ce m
)
Elevation (m)
14
5.3
62
03
.36
97
.20
19
8.9
1
68
.66
19
9.8
8
49
.82
19
8.0
6
34
.73
18
4.8
13
.13
17
6.8
1
0.0
01
72
.51
-12
.28
17
7.0
5
-24
.48
18
0.8
9
-40
.05
19
1.4
6
-47
.59
19
4.7
4
-62
.42
19
6.9
8
-88
.29
19
8.6
9
CE
-R9
17
0
17
5
18
0
18
5
19
0
19
5
20
0
20
5 -10
0-5
00
50
10
01
50
20
0
Dis
tance
(m
)
Elevation (EL.m)
158

37
ANNEX B
Elevation Peri-Left Peri-Right ∑S R Area ∑A ∆d d n I I^1/2 R^2/3 V A Q
X Y (EL.m) (m) (m) (m) (m) (m2) (m
2) (m) (m) (m/s) (m
2) (m
3/s)
1 5.83 19.83 19.82 0.82 0.84 16.90 1.481 11.23 25.02 0.82 2.24 0.040 0.0056 0.0750 1.299 2.4 25.0 60.9
2 5.64 18.86 19.00 0.14 0.14 15.24 0.905 1.90 13.79 0.14 1.42 0.040 0.0056 0.0750 0.935 1.8 13.8 24.2
3 3.97 18.28 18.86 0.58 1.77 14.96 0.795 7.39 11.89 0.58 1.28 0.040 0.0056 0.0750 0.858 1.6 11.9 19.1
4 0.00 17.99 18.28 0.28 3.85 12.61 0.357 2.79 4.50 0.28 0.70 0.040 0.0056 0.0750 0.503 0.9 4.5 4.2
5 -7.93 17.58 18.00 0.01 0.14 8.48 0.201 0.08 1.70 0.01 0.42 0.040 0.0056 0.0750 0.343 0.6 1.7 1.1
6 -7.95 19.82 17.99 0.41 7.92 8.33 0.195 1.62 1.62 0.41 0.41 0.040 0.0056 0.0750 0.336 0.6 1.6 1.0
17.58 0.00 0
HYDRAULIC PROPERTIES AT NS-R1
Discharge Rating Curve at NS-R1
17
18
19
20
0 10 20 30 40 50 60 70
Discharge (m3/s)E
levat
ion (
EL
.m)
X Y Elevation Peri-Left Peri-Right ∑S R Area ∑A ∆d d n I I^1/2 R^2/3 V A Q
(EL.m) (m) (m) (m) (m) (m2) (m
2) (m) (m) (m/s) (m
2) (m
3/s)
1 81.70 26.63 27.09 2.03 0.49 79.62 1.302 7.19 103.68 0.09 3.29 0.040 0.0093 0.0962 1.192 2.9 103.7 297.4
2 51.08 26.96 27.00 8.80 2.13 77.09 1.251 28.56 96.48 0.39 3.20 0.040 0.0093 0.0962 1.161 2.8 96.5 269.6
3 31.78 27.39 26.61 16.60 3.33 66.16 1.027 35.29 67.92 0.61 2.81 0.040 0.0093 0.0962 1.018 2.4 67.9 166.3
4 15.89 27.63 26.00 22.44 1.53 46.23 0.706 12.13 32.63 0.28 2.20 0.040 0.0093 0.0962 0.793 1.9 32.6 62.2
5 4.99 25.60 25.72 1.90 0.66 22.26 0.921 2.73 20.49 0.12 1.92 0.040 0.0093 0.0962 0.947 2.3 20.5 46.7
6 2.38 23.80 25.60 9.51 1.06 19.70 0.902 9.76 17.77 0.60 1.80 0.040 0.0093 0.0962 0.934 2.2 17.8 39.9
7 0.00 23.79 25.00 1.58 0.18 9.14 0.877 1.02 8.01 0.10 1.20 0.040 0.0093 0.0962 0.916 2.2 8.0 17.7
8 -2.90 24.20 24.90 2.57 1.23 7.38 0.948 5.33 6.99 0.70 1.10 0.040 0.0093 0.0962 0.965 2.3 7.0 16.2
9 -5.38 24.90 24.20 1.43 0.35 3.57 0.466 1.00 1.66 0.20 0.40 0.040 0.0093 0.0962 0.601 1.4 1.7 2.4
10 -18.35 25.72 24.00 1.43 0.35 1.78 0.370 0.66 0.66 0.20 0.20 0.040 0.0093 0.0962 0.516 1.2 0.7 0.8
11 -33.20 25.72 23.80 - 0.00 0.00 0.00 0.00
12 -57.3744 26.61
13 -68.1989 27.09
HYDRAULIC PROPERTIES AT NS-R2
Discharge Rating Curve at NS-2
23.5
24.0
24.5
25.0
25.5
26.0
26.5
27.0
27.5
0 50 100 150 200 250 300 350
Discharge (m3/s)
Ele
vat
ion (
EL
.m)
X Y Elevation Peri-Left Peri-Right ∑S R Area ∑A ∆d d n I I^1/2 R^2/3 V A Q
(EL.m) (m) (m) (m) (m) (m2) (m
2) (m) (m) (m/s) (m
2) (m
3/s)
1 69.47 37.03 36.17 0.94 0.11 79.49 3.222 0.75 256.14 0.01 9.51 0.040 0.0052 0.0724 2.182 3.9 256.1 1,011.3
2 35.92 36.17 36.16 1.47 1.80 78.44 3.256 11.60 255.40 0.16 9.50 0.040 0.0052 0.0724 2.197 4.0 255.4 1,015.4
3 12.79 34.10 36.00 9.17 11.22 75.17 3.243 60.71 243.80 1.00 9.34 0.040 0.0052 0.0724 2.191 4.0 243.8 966.7
4 9.98 30.94 35.00 8.26 10.10 54.78 3.342 37.29 183.09 0.90 8.34 0.040 0.0052 0.0724 2.235 4.0 183.1 740.6
5 0.00 26.66 34.10 0.92 0.13 36.43 4.002 3.18 145.79 0.10 7.44 0.040 0.0052 0.0724 2.521 4.6 145.8 665.1
6 -6.85 27.32 34.00 0.28 0.04 35.38 4.031 0.93 142.61 0.03 7.34 0.040 0.0052 0.0724 2.533 4.6 142.6 653.7
7 -18.33 33.97 33.97 1.93 1.30 35.06 4.041 28.84 141.68 0.97 7.31 0.040 0.0052 0.0724 2.537 4.6 141.7 650.5
8 -38.30 36.16 33.00 1.99 1.34 31.83 3.545 27.16 112.84 1.00 6.34 0.040 0.0052 0.0724 2.325 4.2 112.8 474.8
9 -72.12 36.52 32.00 1.99 1.34 28.50 3.006 24.55 85.68 1.00 5.34 0.040 0.0052 0.0724 2.083 3.8 85.7 323.0
31.00 0.12 0.08 25.17 2.429 1.39 61.13 0.06 4.34 0.040 0.0052 0.0724 1.807 3.3 61.1 199.9
30.94 1.87 2.39 24.97 2.393 19.90 59.74 0.94 4.28 0.040 0.0052 0.0724 1.789 3.2 59.7 193.4
30.00 1.99 2.54 20.71 1.924 17.24 39.84 1.00 3.34 0.040 0.0052 0.0724 1.547 2.8 39.8 111.5
29.00 1.99 2.54 16.17 1.397 13.18 22.60 1.00 2.34 0.040 0.0052 0.0724 1.250 2.3 22.6 51.1
28.00 1.36 1.73 11.64 0.809 6.65 9.42 0.68 1.34 0.040 0.0052 0.0724 0.868 1.6 9.4 14.8
27.32 3.34 0.81 8.56 0.324 2.03 2.77 0.32 0.66 0.040 0.0052 0.0724 0.471 0.9 2.8 2.4
27.00 3.55 0.86 4.41 0.167 0.74 0.74 0.34 0.34 0.040 0.0052 0.0724 0.303 0.5 0.7 0.4
26.66 0.00 0.00 0.00 0.00 0.00 26.66 - 0.040 0.0052 0.0724 0.000 0.0 0.0 0.0
HYDRAULIC PROPERTIES AT NS-R3
Discharge Rating Curve at NS-R3
26
27
28
29
30
31
32
33
34
0 100 200 300 400 500
Discharge (m3/s)
Ele
vat
ion (
EL
.m)
159
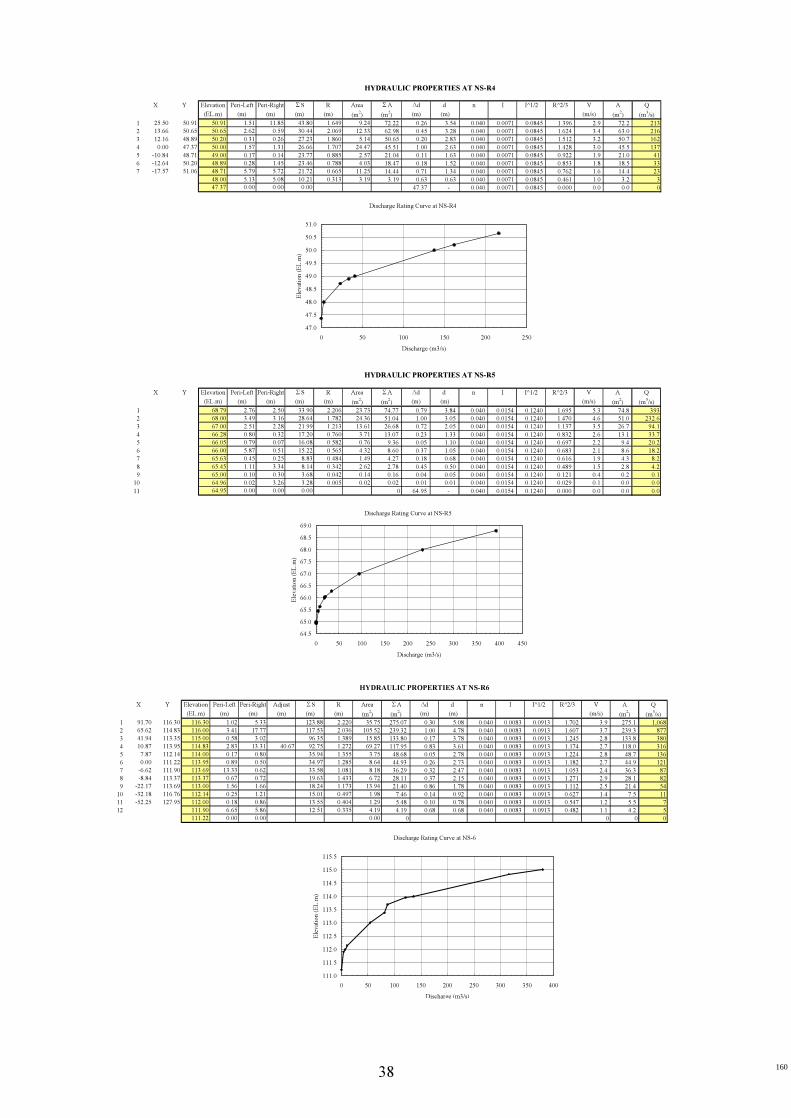
38
HYDRAULIC PROPERTIES AT NS-R4
X Y Elevation Peri-Left Peri-Right ∑S R Area ∑A ∆d d n I I^1/2 R^2/3 V A Q
(EL.m) (m) (m) (m) (m) (m2) (m
2) (m) (m) (m/s) (m
2) (m
3/s)
1 25.50 50.91 50.91 1.51 11.85 43.80 1.649 9.24 72.22 0.26 3.54 0.040 0.0071 0.0845 1.396 2.9 72.2 213
2 13.66 50.65 50.65 2.62 0.59 30.44 2.069 12.33 62.98 0.45 3.28 0.040 0.0071 0.0845 1.624 3.4 63.0 216
3 12.16 48.89 50.20 0.31 0.26 27.23 1.860 5.14 50.65 0.20 2.83 0.040 0.0071 0.0845 1.512 3.2 50.7 162
4 0.00 47.37 50.00 1.57 1.31 26.66 1.707 24.47 45.51 1.00 2.63 0.040 0.0071 0.0845 1.428 3.0 45.5 137
5 -10.84 48.71 49.00 0.17 0.14 23.77 0.885 2.57 21.04 0.11 1.63 0.040 0.0071 0.0845 0.922 1.9 21.0 41
6 -12.64 50.20 48.89 0.28 1.45 23.46 0.788 4.03 18.47 0.18 1.52 0.040 0.0071 0.0845 0.853 1.8 18.5 33
7 -17.57 51.06 48.71 5.79 5.72 21.72 0.665 11.25 14.44 0.71 1.34 0.040 0.0071 0.0845 0.762 1.6 14.4 23
48.00 5.13 5.08 10.21 0.313 3.19 3.19 0.63 0.63 0.040 0.0071 0.0845 0.461 1.0 3.2 3
47.37 0.00 0.00 0.00 47.37 - 0.040 0.0071 0.0845 0.000 0.0 0.0 0
Discharge Rating Curve at NS-R4
47.0
47.5
48.0
48.5
49.0
49.5
50.0
50.5
51.0
0 50 100 150 200 250
Discharge (m3/s)
Ele
vat
ion (
EL
.m)
X Y Elevation Peri-Left Peri-Right ∑S R Area ∑A ∆d d n I I^1/2 R^2/3 V A Q
(EL.m) (m) (m) (m) (m) (m2) (m
2) (m) (m) (m/s) (m
2) (m
3/s)
1 68.79 2.76 2.50 33.90 2.206 23.73 74.77 0.79 3.84 0.040 0.0154 0.1240 1.695 5.3 74.8 393
2 68.00 3.49 3.16 28.64 1.782 24.36 51.04 1.00 3.05 0.040 0.0154 0.1240 1.470 4.6 51.0 232.6
3 67.00 2.51 2.28 21.99 1.213 13.61 26.68 0.72 2.05 0.040 0.0154 0.1240 1.137 3.5 26.7 94.1
4 66.28 0.80 0.32 17.20 0.760 3.71 13.07 0.23 1.33 0.040 0.0154 0.1240 0.832 2.6 13.1 33.7
5 66.05 0.79 0.07 16.08 0.582 0.76 9.36 0.05 1.10 0.040 0.0154 0.1240 0.697 2.2 9.4 20.2
6 66.00 5.87 0.51 15.22 0.565 4.32 8.60 0.37 1.05 0.040 0.0154 0.1240 0.683 2.1 8.6 18.2
7 65.63 0.45 0.25 8.83 0.484 1.49 4.27 0.18 0.68 0.040 0.0154 0.1240 0.616 1.9 4.3 8.2
8 65.45 1.11 3.34 8.14 0.342 2.62 2.78 0.45 0.50 0.040 0.0154 0.1240 0.489 1.5 2.8 4.2
9 65.00 0.10 0.30 3.68 0.042 0.14 0.16 0.04 0.05 0.040 0.0154 0.1240 0.121 0.4 0.2 0.1
10 64.96 0.02 3.26 3.28 0.005 0.02 0.02 0.01 0.01 0.040 0.0154 0.1240 0.029 0.1 0.0 0.0
11 64.95 0.00 0.00 0.00 0 64.95 - 0.040 0.0154 0.1240 0.000 0.0 0.0 0.0
HYDRAULIC PROPERTIES AT NS-R5
Discharge Rating Curve at NS-R5
64.5
65.0
65.5
66.0
66.5
67.0
67.5
68.0
68.5
69.0
0 50 100 150 200 250 300 350 400 450
Discharge (m3/s)
Ele
vat
ion (
EL
.m)
HYDRAULIC PROPERTIES AT NS-R6
X Y Elevation Peri-Left Peri-Right Adjust ∑S R Area ∑A ∆d d n I I^1/2 R^2/3 V A Q
(EL.m) (m) (m) (m) (m) (m) (m2) (m
2) (m) (m) (m/s) (m
2) (m
3/s)
1 91.70 116.30 116.30 1.02 5.33 123.88 2.220 35.75 275.07 0.30 5.08 0.040 0.0083 0.0913 1.702 3.9 275.1 1,068
2 65.62 114.83 116.00 3.41 17.77 117.53 2.036 105.52 239.32 1.00 4.78 0.040 0.0083 0.0913 1.607 3.7 239.3 877
3 41.94 113.35 115.00 0.58 3.02 96.35 1.389 15.85 133.80 0.17 3.78 0.040 0.0083 0.0913 1.245 2.8 133.8 380
4 10.87 113.95 114.83 2.83 13.31 40.67 92.75 1.272 69.27 117.95 0.83 3.61 0.040 0.0083 0.0913 1.174 2.7 118.0 316
5 7.87 112.14 114.00 0.17 0.80 35.94 1.355 3.75 48.68 0.05 2.78 0.040 0.0083 0.0913 1.224 2.8 48.7 136
6 0.00 111.22 113.95 0.89 0.50 34.97 1.285 8.64 44.93 0.26 2.73 0.040 0.0083 0.0913 1.182 2.7 44.9 121
7 -6.62 111.90 113.69 13.33 0.62 33.58 1.081 8.18 36.29 0.32 2.47 0.040 0.0083 0.0913 1.053 2.4 36.3 87
8 -8.84 113.37 113.37 0.67 0.72 19.63 1.433 6.72 28.11 0.37 2.15 0.040 0.0083 0.0913 1.271 2.9 28.1 82
9 -22.17 113.69 113.00 1.56 1.66 18.24 1.173 13.94 21.40 0.86 1.78 0.040 0.0083 0.0913 1.112 2.5 21.4 54
10 -32.18 116.76 112.14 0.25 1.21 15.01 0.497 1.98 7.46 0.14 0.92 0.040 0.0083 0.0913 0.627 1.4 7.5 11
11 -52.25 127.95 112.00 0.18 0.86 13.55 0.404 1.29 5.48 0.10 0.78 0.040 0.0083 0.0913 0.547 1.2 5.5 7
12 111.90 6.65 5.86 12.51 0.335 4.19 4.19 0.68 0.68 0.040 0.0083 0.0913 0.482 1.1 4.2 5
111.22 0.00 0.00 0.00 0 0 0 0
Discharge Rating Curve at NS-6
111.0
111.5
112.0
112.5
113.0
113.5
114.0
114.5
115.0
115.5
0 50 100 150 200 250 300 350 400
Discharge (m3/s)
Ele
vat
ion
(E
L.m
)
160
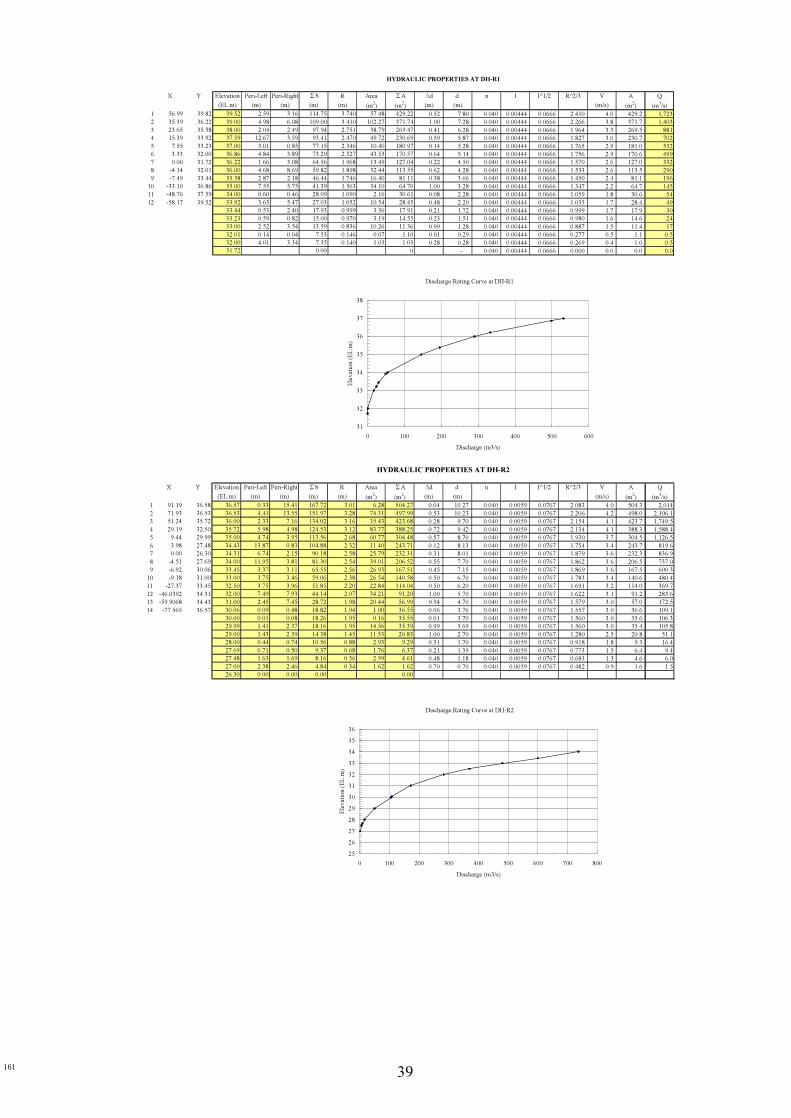
39
X Y Elevation Peri-Left Peri-Right ∑S R Area ∑A ∆d d n I I^1/2 R^2/3 V A Q
(EL.m) (m) (m) (m) (m) (m2) (m
2) (m) (m) (m/s) (m
2) (m
3/s)
1 56.99 39.82 39.52 2.59 3.16 114.75 3.740 57.48 429.22 0.52 7.80 0.040 0.00444 0.0666 2.410 4.0 429.2 1,723
2 35.39 36.22 39.00 4.98 6.08 109.00 3.410 102.27 371.74 1.00 7.28 0.040 0.00444 0.0666 2.266 3.8 371.7 1,403
3 23.65 35.38 38.00 2.04 2.49 97.94 2.751 38.79 269.47 0.41 6.28 0.040 0.00444 0.0666 1.964 3.3 269.5 881
4 15.39 33.92 37.59 12.67 3.59 93.41 2.470 49.72 230.69 0.59 5.87 0.040 0.00444 0.0666 1.827 3.0 230.7 702
5 7.55 33.23 37.00 3.01 0.85 77.15 2.346 10.40 180.97 0.14 5.28 0.040 0.00444 0.0666 1.765 2.9 181.0 532
6 3.33 32.00 36.86 4.84 3.89 73.29 2.327 43.53 170.57 0.64 5.14 0.040 0.00444 0.0666 1.756 2.9 170.6 499
7 0.00 31.72 36.22 1.66 3.08 64.56 1.968 13.49 127.04 0.22 4.50 0.040 0.00444 0.0666 1.570 2.6 127.0 332
8 -4.14 32.01 36.00 4.68 8.69 59.82 1.898 32.44 113.55 0.62 4.28 0.040 0.00444 0.0666 1.533 2.6 113.5 290
9 -7.49 33.44 35.38 2.87 2.18 46.44 1.746 16.40 81.11 0.38 3.66 0.040 0.00444 0.0666 1.450 2.4 81.1 196
10 -33.10 36.86 35.00 7.55 5.75 41.39 1.563 34.10 64.70 1.00 3.28 0.040 0.00444 0.0666 1.347 2.2 64.7 145
11 -48.76 37.59 34.00 0.60 0.46 28.09 1.090 2.16 30.61 0.08 2.28 0.040 0.00444 0.0666 1.059 1.8 30.6 54
12 -58.17 39.52 33.92 3.63 5.47 27.03 1.052 10.54 28.45 0.48 2.20 0.040 0.00444 0.0666 1.035 1.7 28.4 49
33.44 0.53 2.40 17.93 0.999 3.36 17.91 0.21 1.72 0.040 0.00444 0.0666 0.999 1.7 17.9 30
33.23 0.59 0.82 15.00 0.970 3.19 14.55 0.23 1.51 0.040 0.00444 0.0666 0.980 1.6 14.6 24
33.00 2.52 3.54 13.59 0.836 10.26 11.36 0.99 1.28 0.040 0.00444 0.0666 0.887 1.5 11.4 17
32.01 0.14 0.04 7.53 0.146 0.07 1.10 0.01 0.29 0.040 0.00444 0.0666 0.277 0.5 1.1 0.5
32.00 4.01 3.34 7.35 0.140 1.03 1.03 0.28 0.28 0.040 0.00444 0.0666 0.269 0.4 1.0 0.5
31.72 0.00 0 - 0.040 0.00444 0.0666 0.000 0.0 0.0 0.0
HYDRAULIC PROPERTIES AT DH-R1
Discharge Rating Curve at DH-R1
31
32
33
34
35
36
37
38
0 100 200 300 400 500 600
Discharge (m3/s)
Ele
vati
on (
EL
.m)
X Y Elevation Peri-Left Peri-Right ∑S R Area ∑A ∆d d n I I^1/2 R^2/3 V A Q
(EL.m) (m) (m) (m) (m) (m2) (m
2) (m) (m) (m/s) (m
2) (m
3/s)
1 91.19 36.58 36.57 0.33 15.41 167.72 3.01 6.28 504.27 0.04 10.27 0.040 0.0059 0.0767 2.083 4.0 504.3 2,014
2 71.93 36.53 36.53 4.41 13.55 151.97 3.28 74.31 497.99 0.53 10.23 0.040 0.0059 0.0767 2.206 4.2 498.0 2,106.1
3 51.24 35.72 36.00 2.33 7.16 134.02 3.16 35.43 423.68 0.28 9.70 0.040 0.0059 0.0767 2.154 4.1 423.7 1,749.5
4 29.19 32.50 35.72 5.98 4.98 124.53 3.12 83.77 388.25 0.72 9.42 0.040 0.0059 0.0767 2.134 4.1 388.3 1,588.4
5 9.44 29.99 35.00 4.74 3.95 113.56 2.68 60.77 304.48 0.57 8.70 0.040 0.0059 0.0767 1.930 3.7 304.5 1,126.5
6 3.98 27.48 34.43 13.87 0.83 104.88 2.32 11.40 243.71 0.12 8.13 0.040 0.0059 0.0767 1.754 3.4 243.7 819.6
7 0.00 26.30 34.31 6.74 2.15 90.18 2.58 25.79 232.31 0.31 8.01 0.040 0.0059 0.0767 1.879 3.6 232.3 836.9
8 -4.51 27.69 34.00 11.95 3.81 81.30 2.54 39.01 206.52 0.55 7.70 0.040 0.0059 0.0767 1.862 3.6 206.5 737.0
9 -6.92 30.06 33.45 3.37 3.11 65.55 2.56 26.93 167.51 0.45 7.15 0.040 0.0059 0.0767 1.869 3.6 167.5 600.3
10 -9.18 31.00 33.00 3.75 3.46 59.06 2.38 26.54 140.58 0.50 6.70 0.040 0.0059 0.0767 1.783 3.4 140.6 480.4
11 -27.37 33.45 32.50 3.75 3.96 51.85 2.20 22.84 114.04 0.50 6.20 0.040 0.0059 0.0767 1.691 3.2 114.0 369.7
12 -46.0392 34.31 32.00 7.49 7.93 44.14 2.07 34.21 91.20 1.00 5.70 0.040 0.0059 0.0767 1.622 3.1 91.2 283.6
13 -59.9068 34.43 31.00 2.45 7.45 28.72 1.98 20.44 56.99 0.94 4.70 0.040 0.0059 0.0767 1.579 3.0 57.0 172.5
14 -77.565 36.57 30.06 0.09 0.48 18.82 1.94 1.00 36.55 0.06 3.76 0.040 0.0059 0.0767 1.557 3.0 36.6 109.1
30.00 0.01 0.08 18.26 1.95 0.16 35.55 0.01 3.70 0.040 0.0059 0.0767 1.560 3.0 35.6 106.3
29.99 1.41 2.37 18.16 1.95 14.56 35.39 0.99 3.69 0.040 0.0059 0.0767 1.560 3.0 35.4 105.8
29.00 1.43 2.39 14.38 1.45 11.53 20.83 1.00 2.70 0.040 0.0059 0.0767 1.280 2.5 20.8 51.1
28.00 0.44 0.74 10.56 0.88 2.93 9.29 0.31 1.70 0.040 0.0059 0.0767 0.918 1.8 9.3 16.4
27.69 0.71 0.50 9.37 0.68 1.76 6.37 0.21 1.39 0.040 0.0059 0.0767 0.773 1.5 6.4 9.4
27.48 1.63 1.69 8.16 0.56 2.99 4.61 0.48 1.18 0.040 0.0059 0.0767 0.683 1.3 4.6 6.0
27.00 2.38 2.46 4.84 0.34 1.62 1.62 0.70 0.70 0.040 0.0059 0.0767 0.482 0.9 1.6 1.5
26.30 0.00 0.00 0.00 0.00
HYDRAULIC PROPERTIES AT DH-R2
Discharge Rating Curve at DH-R2
25
26
27
28
29
30
31
32
33
34
35
36
0 100 200 300 400 500 600 700 800
Discharge (m3/s)
Ele
vati
on (
EL
.m)
161

40
X Y Elevation Peri-Left Peri-Right ∑S R Area ∑A ∆d d n I I^1/2 R^2/3 V A Q
(EL.m) (m) (m) (m) (m) (m2) (m
2) (m) (m) (m/s) (m
2) (m
3/s)
1 98.98 34.73 34.73 2.71 48.99 122.82 2.596 66.64 318.80 0.71 8.13 0.040 0.0053 0.0729 1.889 3.4 318.8 1,097.9
2 49.99 34.02 34.02 0.08 0.18 71.12 3.546 1.36 252.15 0.02 7.42 0.040 0.0053 0.0729 2.325 4.2 252.2 1,069.1
3 16.46 30.33 34.00 1.79 4.30 70.86 3.539 30.46 250.80 0.47 7.40 0.040 0.0053 0.0729 2.322 4.2 250.8 1,062.1
4 8.29 26.91 33.53 0.92 4.84 64.77 3.402 31.28 220.33 0.53 6.93 0.040 0.0053 0.0729 2.262 4.1 220.3 908.7
5 0.00 26.60 33.00 1.74 9.14 59.01 3.204 50.99 189.05 1.00 6.40 0.040 0.0053 0.0729 2.173 4.0 189.0 749.2
6 -6.87 26.93 32.00 1.74 9.14 48.13 2.869 40.48 138.06 1.00 5.40 0.040 0.0053 0.0729 2.019 3.7 138.1 508.3
7 -16.28 33.53 31.00 1.17 6.12 37.24 2.620 21.24 97.59 0.67 4.40 0.040 0.0053 0.0729 1.901 3.5 97.6 338.2
8 -22.49 35.22 30.33 0.57 0.85 29.95 2.549 9.09 76.35 0.33 3.73 0.040 0.0053 0.0729 1.866 3.4 76.3 259.8
9 -50.06 35.72 30.00 1.74 2.59 28.52 2.358 25.01 67.25 1.00 3.40 0.040 0.0053 0.0729 1.771 3.2 67.3 217.2
29.00 1.74 2.59 24.19 1.746 21.20 42.24 1.00 2.40 0.040 0.0053 0.0729 1.450 2.6 42.2 111.7
28.00 1.74 2.59 19.86 1.059 17.38 21.04 1.00 1.40 0.040 0.0053 0.0729 1.039 1.9 21.0 39.9
27.00 0.12 0.18 15.53 0.236 1.07 3.66 0.07 0.40 0.040 0.0053 0.0729 0.381 0.7 3.7 2.5
26.93 0.42 0.05 15.23 0.170 0.30 2.59 0.02 0.33 0.040 0.0053 0.0729 0.307 0.6 2.6 1.4
26.91 6.46 8.30 14.76 0.155 2.29 2.29 0.31 0.31 0.040 0.0053 0.0729 0.288 0.5 2.3 1.2
26.60 0.00 0.00 0.00 0.00 0.00 #REF! - 0.040 0.0053 0.0729 0.000 0.0 0.0 0.0
HYDRAULIC PROPERTIES AT DH-R3
Discharge Rating Curve at DH-R3
25
26
27
28
29
30
31
32
33
0 100 200 300 400 500 600
Discharge (m3/s)
Ele
vat
ion
(E
L.m
)
X Y Elevation Peri-Left Peri-Right ∑S R Area ∑A ∆d d n I I^1/2 R^2/3 V A Q
(EL.m) (m) (m) (m) (m) (m2) (m
2) (m) (m) (m/s) (m
2) (m
3/s)
1 17.51 35.08 35.08 0.32 0.58 34.24 1.31 2.63 44.84 0.08 2.94 0.040 0.0044 0.0660 1.197 2.0 44.8 88.6
2 6.77 33.59 35.00 3.96 7.28 33.35 1.27 26.92 42.21 1.00 2.86 0.040 0.0044 0.0660 1.170 1.9 42.2 81.5
3 2.20 32.91 34.00 1.63 2.98 22.10 0.69 7.85 15.28 0.41 1.86 0.040 0.0044 0.0660 0.782 1.3 15.3 19.7
4 1.18 32.50 33.59 0.08 0.14 17.49 0.43 0.34 7.44 0.02 1.45 0.040 0.0044 0.0660 0.565 0.9 7.4 6.9
5 0.00 32.14 33.57 7.38 1.02 17.28 0.41 1.87 7.10 0.15 1.43 0.040 0.0044 0.0660 0.553 0.9 7.1 6.5
6 -1.95 32.60 33.42 0.55 2.85 8.87 0.59 2.81 5.23 0.42 1.28 0.040 0.0044 0.0660 0.703 1.2 5.2 6.1
7 -2.64 33.42 33.00 0.12 0.61 5.47 0.44 0.43 2.43 0.09 0.86 0.040 0.0044 0.0660 0.582 1.0 2.4 2.3
8 -10.03 33.57 32.91 0.41 0.83 4.74 0.42 1.21 2.00 0.31 0.77 0.040 0.0044 0.0660 0.562 0.9 2.0 1.9
9 -17.20 35.44 32.60 0.44 0.27 3.50 0.23 0.30 0.79 0.10 0.46 0.040 0.0044 0.0660 0.371 0.6 0.8 0.5
32.50 1.57 1.23 2.80 0.17 0.49 0.49 0.36 0.36 0.040 0.0044 0.0660 0.312 0.5 0.5 0.3
32.14 0.00 0.00 0.00 0 0.0
HYDRAULIC PROPERTIES AT DH-R4
Discharge Rating Curve at DH-R4
30
31
32
33
34
35
36
0 20 40 60 80 100
Discharge (m3/s)
Ele
vati
on
(E
L.m
)
X Y Elevation Peri-Left Peri-Right ∑S R Area ∑A ∆d d n I I^1/2 R^2/3 V A Q
(EL.m) (m) (m) (m) (m) (m2
) (m2
) (m) (m) (m/s) (m2
) (m3
/s)
1 100.60 33.34 33.09 0.18 9.29 100.85 3.004 7.95 302.94 0.09 10.45 0.040 0.0074 0.0857 2.082 4.5 302.9 1,351.7
2 50.05 32.85 33.00 0.30 15.48 91.39 3.228 11.37 294.99 0.15 10.36 0.040 0.0074 0.0857 2.184 4.7 295.0 1,380.9
3 23.13 31.48 32.85 1.70 16.72 75.61 3.751 50.01 283.62 0.85 10.21 0.040 0.0074 0.0857 2.414 5.2 283.6 1,467.6
4 8.23 25.69 32.00 1.04 10.23 57.18 4.085 22.98 233.62 0.52 9.36 0.040 0.0074 0.0857 2.556 5.5 233.6 1,279.6
5 5.18 22.64 31.48 0.48 0.66 45.91 4.588 9.15 210.64 0.24 8.84 0.040 0.0074 0.0857 2.761 5.9 210.6 1,246.5
6 0.00 23.50 31.24 0.25 0.66 44.77 4.501 8.94 201.49 0.24 8.60 0.040 0.0074 0.0857 2.726 5.8 201.5 1,177.2
7 -13.54 25.20 31.00 1.03 2.76 43.86 4.390 35.50 192.55 1.00 8.36 0.040 0.0074 0.0857 2.681 5.7 192.6 1,106.5
8 -15.08 31.24 30.00 1.03 2.76 40.07 3.920 32.67 157.05 1.00 7.36 0.040 0.0074 0.0857 2.486 5.3 157.1 836.8
9 -18.29 33.09 29.00 1.03 2.76 36.27 3.429 29.84 124.38 1.00 6.36 0.040 0.0074 0.0857 2.274 4.9 124.4 606.2
10 -49.82 33.33 28.00 1.03 2.76 32.48 2.910 27.02 94.54 1.00 5.36 0.040 0.0074 0.0857 2.038 4.4 94.5 413.1
11 -100.30 32.51 27.00 1.03 2.76 28.69 2.354 24.19 67.52 1.00 4.36 0.040 0.0074 0.0857 1.769 3.8 67.5 256.1
12 26.00 0.32 0.86 24.90 1.740 6.92 43.33 0.31 3.36 0.040 0.0074 0.0857 1.447 3.1 43.3 134.4
25.69 0.51 0.69 23.72 1.535 10.58 36.41 0.49 3.05 0.040 0.0074 0.0857 1.331 2.9 36.4 103.8
25.20 1.61 0.28 22.52 1.147 4.08 25.83 0.20 2.56 0.040 0.0074 0.0857 1.096 2.3 25.8 60.6
25.00 8.03 1.41 20.63 1.054 15.01 21.75 1.00 2.36 0.040 0.0074 0.0857 1.036 2.2 21.7 48.3
24.00 4.01 0.71 11.19 0.602 4.14 6.74 0.50 1.36 0.040 0.0074 0.0857 0.713 1.5 6.7 10.3
23.50 3.05 0.71 6.47 0.402 2.14 2.60 0.50 0.86 0.040 0.0074 0.0857 0.544 1.2 2.6 3.0
23.00 2.20 0.51 2.71 0.168 0.46 0.46 0.36 0.36 0.040 0.0074 0.0857 0.305 0.7 0.5 0.3
22.64 0.00 0.00 0.00 0.00 0.00 0.040 0.0074 0.0857 0.000 0.0 0.0 0.0
HYDRAULIC PROPERTIES AT DH-R5
Discharge Rating Curve at DH-R5
22
23
24
25
26
27
28
29
30
31
0 100 200 300 400 500 600 700 800 900
Discharge (m3/s)
Ele
vat
ion (
El.
m)
162
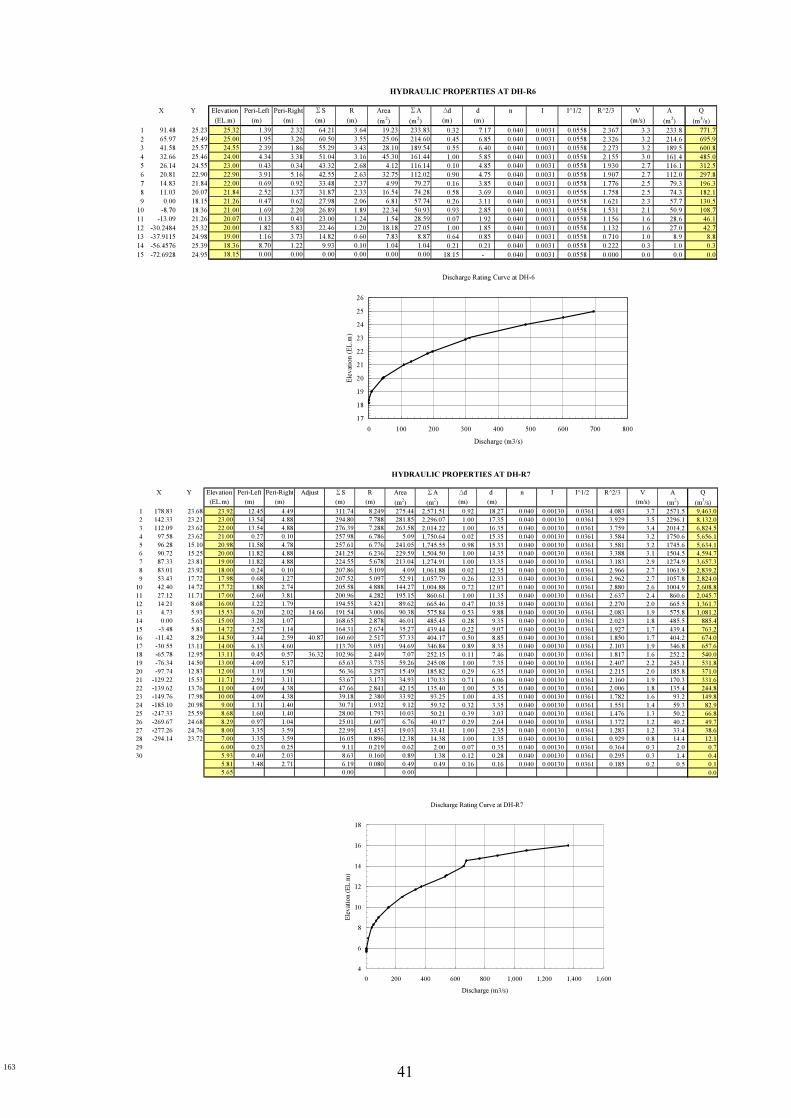
41
X Y Elevation Peri-Left Peri-Right ∑S R Area ∑A ∆d d n I I^1/2 R^2/3 V A Q
(EL.m) (m) (m) (m) (m) (m2) (m
2) (m) (m) (m/s) (m
2) (m
3/s)
1 91.48 25.23 25.32 1.39 2.32 64.21 3.64 19.23 233.83 0.32 7.17 0.040 0.0031 0.0558 2.367 3.3 233.8 771.7
2 65.97 25.49 25.00 1.95 3.26 60.50 3.55 25.06 214.60 0.45 6.85 0.040 0.0031 0.0558 2.326 3.2 214.6 695.9
3 41.58 25.57 24.55 2.39 1.86 55.29 3.43 28.10 189.54 0.55 6.40 0.040 0.0031 0.0558 2.273 3.2 189.5 600.8
4 32.66 25.46 24.00 4.34 3.38 51.04 3.16 45.30 161.44 1.00 5.85 0.040 0.0031 0.0558 2.155 3.0 161.4 485.0
5 26.14 24.55 23.00 0.43 0.34 43.32 2.68 4.12 116.14 0.10 4.85 0.040 0.0031 0.0558 1.930 2.7 116.1 312.5
6 20.81 22.90 22.90 3.91 5.16 42.55 2.63 32.75 112.02 0.90 4.75 0.040 0.0031 0.0558 1.907 2.7 112.0 297.8
7 14.83 21.84 22.00 0.69 0.92 33.48 2.37 4.99 79.27 0.16 3.85 0.040 0.0031 0.0558 1.776 2.5 79.3 196.3
8 11.03 20.07 21.84 2.52 1.37 31.87 2.33 16.54 74.28 0.58 3.69 0.040 0.0031 0.0558 1.758 2.5 74.3 182.1
9 0.00 18.15 21.26 0.47 0.62 27.98 2.06 6.81 57.74 0.26 3.11 0.040 0.0031 0.0558 1.621 2.3 57.7 130.5
10 -8.70 18.36 21.00 1.69 2.20 26.89 1.89 22.34 50.93 0.93 2.85 0.040 0.0031 0.0558 1.531 2.1 50.9 108.7
11 -13.09 21.26 20.07 0.13 0.41 23.00 1.24 1.54 28.59 0.07 1.92 0.040 0.0031 0.0558 1.156 1.6 28.6 46.1
12 -30.2484 25.32 20.00 1.82 5.83 22.46 1.20 18.18 27.05 1.00 1.85 0.040 0.0031 0.0558 1.132 1.6 27.0 42.7
13 -37.9115 24.98 19.00 1.16 3.73 14.82 0.60 7.83 8.87 0.64 0.85 0.040 0.0031 0.0558 0.710 1.0 8.9 8.8
14 -56.4576 25.39 18.36 8.70 1.22 9.93 0.10 1.04 1.04 0.21 0.21 0.040 0.0031 0.0558 0.222 0.3 1.0 0.3
15 -72.6928 24.95 18.15 0.00 0.00 0.00 0.00 0.00 0.00 18.15 - 0.040 0.0031 0.0558 0.000 0.0 0.0 0.0
HYDRAULIC PROPERTIES AT DH-R6
Discharge Rating Curve at DH-6
17
18
19
20
21
22
23
24
25
26
0 100 200 300 400 500 600 700 800
Discharge (m3/s)
Ele
vat
ion (
EL
.m)
X Y Elevation Peri-Left Peri-Right Adjust ∑S R Area ∑A ∆d d n I I^1/2 R^2/3 V A Q
(EL.m) (m) (m) (m) (m) (m2) (m
2) (m) (m) (m/s) (m
2) (m
3/s)
1 178.83 23.68 23.92 12.45 4.49 311.74 8.249 275.44 2,571.51 0.92 18.27 0.040 0.00130 0.0361 4.083 3.7 2571.5 9,463.0
2 142.33 23.21 23.00 13.54 4.88 294.80 7.788 281.85 2,296.07 1.00 17.35 0.040 0.00130 0.0361 3.929 3.5 2296.1 8,132.0
3 112.09 23.62 22.00 13.54 4.88 276.39 7.288 263.58 2,014.22 1.00 16.35 0.040 0.00130 0.0361 3.759 3.4 2014.2 6,824.5
4 97.58 23.62 21.00 0.27 0.10 257.98 6.786 5.09 1,750.64 0.02 15.35 0.040 0.00130 0.0361 3.584 3.2 1750.6 5,656.1
5 96.28 15.10 20.98 11.58 4.78 257.61 6.776 241.05 1,745.55 0.98 15.33 0.040 0.00130 0.0361 3.581 3.2 1745.6 5,634.1
6 90.72 15.25 20.00 11.82 4.88 241.25 6.236 229.59 1,504.50 1.00 14.35 0.040 0.00130 0.0361 3.388 3.1 1504.5 4,594.7
7 87.33 23.81 19.00 11.82 4.88 224.55 5.678 213.04 1,274.91 1.00 13.35 0.040 0.00130 0.0361 3.183 2.9 1274.9 3,657.3
8 83.01 23.92 18.00 0.24 0.10 207.86 5.109 4.09 1,061.88 0.02 12.35 0.040 0.00130 0.0361 2.966 2.7 1061.9 2,839.2
9 53.43 17.72 17.98 0.68 1.27 207.52 5.097 52.91 1,057.79 0.26 12.33 0.040 0.00130 0.0361 2.962 2.7 1057.8 2,824.0
10 42.40 14.72 17.72 1.88 2.74 205.58 4.888 144.27 1,004.88 0.72 12.07 0.040 0.00130 0.0361 2.880 2.6 1004.9 2,608.8
11 27.12 11.71 17.00 2.60 3.81 200.96 4.282 195.15 860.61 1.00 11.35 0.040 0.00130 0.0361 2.637 2.4 860.6 2,045.7
12 14.21 8.68 16.00 1.22 1.79 194.55 3.421 89.62 665.46 0.47 10.35 0.040 0.00130 0.0361 2.270 2.0 665.5 1,361.7
13 4.73 5.93 15.53 6.20 2.02 14.66 191.54 3.006 90.38 575.84 0.53 9.88 0.040 0.00130 0.0361 2.083 1.9 575.8 1,081.2
14 0.00 5.65 15.00 3.28 1.07 168.65 2.878 46.01 485.45 0.28 9.35 0.040 0.00130 0.0361 2.023 1.8 485.5 885.4
15 -3.48 5.81 14.72 2.57 1.14 164.31 2.674 35.27 439.44 0.22 9.07 0.040 0.00130 0.0361 1.927 1.7 439.4 763.2
16 -11.42 8.29 14.50 3.44 2.59 40.87 160.60 2.517 57.33 404.17 0.50 8.85 0.040 0.00130 0.0361 1.850 1.7 404.2 674.0
17 -30.55 13.11 14.00 6.13 4.60 113.70 3.051 94.69 346.84 0.89 8.35 0.040 0.00130 0.0361 2.103 1.9 346.8 657.6
18 -65.78 12.95 13.11 0.45 0.57 36.32 102.96 2.449 7.07 252.15 0.11 7.46 0.040 0.00130 0.0361 1.817 1.6 252.2 540.0
19 -76.34 14.50 13.00 4.09 5.17 65.63 3.735 59.26 245.08 1.00 7.35 0.040 0.00130 0.0361 2.407 2.2 245.1 531.8
20 -97.74 12.83 12.00 1.19 1.50 56.36 3.297 15.49 185.82 0.29 6.35 0.040 0.00130 0.0361 2.215 2.0 185.8 371.0
21 -129.22 15.53 11.71 2.91 3.11 53.67 3.173 34.93 170.33 0.71 6.06 0.040 0.00130 0.0361 2.160 1.9 170.3 331.6
22 -139.62 13.76 11.00 4.09 4.38 47.66 2.841 42.15 135.40 1.00 5.35 0.040 0.00130 0.0361 2.006 1.8 135.4 244.8
23 -149.76 17.98 10.00 4.09 4.38 39.18 2.380 33.92 93.25 1.00 4.35 0.040 0.00130 0.0361 1.782 1.6 93.2 149.8
24 -185.10 20.98 9.00 1.31 1.40 30.71 1.932 9.12 59.32 0.32 3.35 0.040 0.00130 0.0361 1.551 1.4 59.3 82.9
25 -247.33 25.59 8.68 1.60 1.40 28.00 1.793 10.03 50.21 0.39 3.03 0.040 0.00130 0.0361 1.476 1.3 50.2 66.8
26 -269.67 24.68 8.29 0.97 1.04 25.01 1.607 6.76 40.17 0.29 2.64 0.040 0.00130 0.0361 1.372 1.2 40.2 49.7
27 -277.26 24.76 8.00 3.35 3.59 22.99 1.453 19.03 33.41 1.00 2.35 0.040 0.00130 0.0361 1.283 1.2 33.4 38.6
28 -294.14 23.72 7.00 3.35 3.59 16.05 0.896 12.38 14.38 1.00 1.35 0.040 0.00130 0.0361 0.929 0.8 14.4 12.1
29 6.00 0.23 0.25 9.11 0.219 0.62 2.00 0.07 0.35 0.040 0.00130 0.0361 0.364 0.3 2.0 0.7
30 5.93 0.40 2.03 8.63 0.160 0.89 1.38 0.12 0.28 0.040 0.00130 0.0361 0.295 0.3 1.4 0.4
5.81 3.48 2.71 6.19 0.080 0.49 0.49 0.16 0.16 0.040 0.00130 0.0361 0.185 0.2 0.5 0.1
5.65 0.00 0.00 0.0
HYDRAULIC PROPERTIES AT DH-R7
Discharge Rating Curve at DH-R7
4
6
8
10
12
14
16
18
0 200 400 600 800 1,000 1,200 1,400 1,600
Discharge (m3/s)
Ele
vat
ion (
EL
.m)
163

42
X Y Elevation Peri-Left Peri-Right ∑S R Area ∑A ∆d d n I I^1/2 R^2/3 V A Q
(EL.m) (m) (m) (m) (m) (m2) (m
2) (m) (m) (m/s) (m
2) (m
3/s)
1 59.55 105.68 105.40 0.67 1.83 49.28 5.165 14.88 254.54 0.40 14.78 0.040 0.0172 0.1313 2.988 9.8 254.5 2,497
2 37.43 105.45 105.00 0.92 2.52 46.78 5.123 18.94 239.67 0.55 14.38 0.040 0.0172 0.1313 2.972 9.8 239.7 2,338
3 21.02 105.40 104.45 0.75 1.06 43.35 5.091 14.43 220.72 0.45 13.83 0.040 0.0172 0.1313 2.960 9.7 220.7 2,144
4 16.78 104.45 104.00 1.67 2.35 41.55 4.965 29.56 206.29 1.00 13.38 0.040 0.0172 0.1313 2.910 9.6 206.3 1,971
5 13.60 102.95 103.00 0.08 0.12 37.54 4.708 1.39 176.73 0.05 12.38 0.040 0.0172 0.1313 2.809 9.2 176.7 1,630
6 2.48 91.56 102.95 1.58 1.33 37.34 4.696 25.24 175.34 0.95 12.33 0.040 0.0172 0.1313 2.804 9.2 175.3 1,614
7 0.00 90.62 102.00 1.67 1.40 34.43 4.360 24.32 150.10 1.00 11.38 0.040 0.0172 0.1313 2.669 8.8 150.1 1,315
8 -1.47 91.69 101.00 1.67 1.40 31.36 4.011 22.01 125.79 1.00 10.38 0.040 0.0172 0.1313 2.524 8.3 125.8 1,042
9 -7.83 98.27 100.00 1.67 1.40 28.30 3.667 19.70 103.78 1.00 9.38 0.040 0.0172 0.1313 2.378 7.8 103.8 810
10 -17.53 105.55 99.00 1.22 1.02 25.23 3.332 12.92 84.08 0.73 8.38 0.040 0.0172 0.1313 2.231 7.3 84.1 616
11 -30.76 105.75 98.27 0.38 0.38 23.00 3.094 4.48 71.16 0.27 7.65 0.040 0.0172 0.1313 2.123 7.0 71.2 496
12 -49.49 106.25 98.00 1.39 1.40 22.25 2.997 15.36 66.68 1.00 7.38 0.040 0.0172 0.1313 2.079 6.8 66.7 455
13 -67.55 107.23 97.00 1.39 1.40 19.46 2.637 13.42 51.31 1.00 6.38 0.040 0.0172 0.1313 1.909 6.3 51.3 322
96.00 1.39 1.40 16.67 2.273 11.48 37.89 1.00 5.38 0.040 0.0172 0.1313 1.729 5.7 37.9 215
95.00 1.39 1.40 13.88 1.903 9.53 26.41 1.00 4.38 0.040 0.0172 0.1313 1.536 5.0 26.4 133
94.00 1.39 1.40 11.09 1.522 7.59 16.88 1.00 3.38 0.040 0.0172 0.1313 1.323 4.3 16.9 73
93.00 1.39 1.40 8.30 1.119 5.65 9.29 1.00 2.38 0.040 0.0172 0.1313 1.078 3.5 9.3 33
92.00 0.43 0.43 5.52 0.660 1.36 3.64 0.31 1.38 0.040 0.0172 0.1313 0.758 2.5 3.6 9
91.69 0.22 0.18 4.65 0.491 0.51 2.28 0.13 1.07 0.040 0.0172 0.1313 0.622 2.0 2.3 5
91.56 0.95 1.58 4.25 0.417 1.48 1.77 0.56 0.94 0.040 0.0172 0.1313 0.558 1.8 1.8 3
91.00 0.64 1.07 1.72 0.169 0.29 0.29 0.38 0.38 0.040 0.0172 0.1313 0.305 1.0 0.3 0.3
90.62 0.00 0.00 0.00 0 0 0
HYDRAULIC PROPERTIES AT CE-R1
Discharge Rating Curve at CE-R1
90
92
94
96
98
100
102
0 200 400 600 800 1,000 1,200
Discharge (m3/s)
Ele
vat
ion
(E
L.m
)
HYDRAULIC PROPERTIES AT CE-R2
X Y Elevation Peri-Left Peri-Right ∑S R Area ∑A ∆d d n I I^1/2 R^2/3 V A Q
(EL.m) (m) (m) (m) (m) (m2) (m2) (m) (m) (m/s) (m2) (m3/s)
1 211.58 196.85 209.49 13.67 1.87 250.26 11.0766 107.43 2,772.0 0.49 39.83 0.040 0.02564 0.1601 4.969 19.9 2,772.0 55,140
2 150.59 205.28 209.00 23.16 3.17 234.71 11.3526 164.67 2664.58 0.83 39.34 0.040 0.02564 0.1601 5.051 20.2 2,664.6 53,880
3 89.60 213.71 208.17 3.37 0.65 208.38 11.9972 31.16 2499.92 0.17 38.51 0.040 0.02564 0.1601 5.241 21.0 2,499.9 52,446
4 55.12 204.37 208.00 5.55 1.07 204.35 12.0808 49.84 2468.76 0.28 38.34 0.040 0.02564 0.1601 5.265 21.1 2,468.8 52,032
5 31.03 195.70 207.72 3.76 2.75 197.73 12.2334 123.51 2418.91 0.72 38.06 0.040 0.02564 0.1601 5.309 21.3 2,418.9 51,411
6 8.72 178.34 207.00 5.23 3.82 191.21 12.0045 163.95 2295.40 1.00 37.34 0.040 0.02564 0.1601 5.243 21.0 2,295.4 48,175
7 3.42 169.66 206.00 5.23 3.82 182.16 11.7009 155.13 2131.45 1.00 36.34 0.040 0.02564 0.1601 5.154 20.6 2,131.5 43,977
8 0.00 169.76 205.00 3.29 2.41 173.11 11.4166 93.20 1976.32 0.63 35.34 0.040 0.02564 0.1601 5.070 20.3 1,976.3 40,113
9 -3.27 169.83 204.37 7.16 4.05 167.41 11.2488 191.45 1883.12 1.37 34.71 0.040 0.02564 0.1601 5.020 20.1 1,883.1 37,845
10 -8.89 179.91 203.00 5.23 2.95 156.20 10.8302 130.37 1691.67 1.00 33.34 0.040 0.02564 0.1601 4.895 19.6 1,691.7 33,149
11 -15.83 183.27 202.00 5.23 2.95 148.02 10.5481 122.46 1561.30 1.00 32.34 0.040 0.02564 0.1601 4.810 19.3 1,561.3 30,061
12 -21.75 186.63 201.00 3.35 1.89 139.84 10.2895 74.22 1438.83 0.64 31.34 0.040 0.02564 0.1601 4.731 18.9 1,438.8 27,248
13 -69.46 200.36 200.36 1.30 1.06 134.60 10.1383 40.43 1364.61 0.36 30.70 0.040 0.02564 0.1601 4.684 18.8 1,364.6 25,589
14 -107.23 207.72 200.00 3.62 2.95 132.23 10.0138 108.06 1324.18 1.00 30.34 0.040 0.02564 0.1601 4.646 18.6 1,324.2 24,627
15 -116.14 208.17 199.00 3.62 2.95 125.66 9.6774 101.81 1216.11 1.00 29.34 0.040 0.02564 0.1601 4.541 18.2 1,216.1 22,108
16 -152.95 209.49 198.00 3.62 2.95 119.10 9.3564 95.56 1114.30 1.00 28.34 0.040 0.02564 0.1601 4.440 17.8 1,114.3 19,807
197.00 3.62 2.95 112.53 9.0535 89.30 1018.75 1.00 27.34 0.040 0.02564 0.1601 4.344 17.4 1,018.7 17,715
196.00 1.08 0.89 105.96 8.7720 25.57 929.45 0.30 26.34 0.040 0.02564 0.1601 4.253 17.0 929.4 15,826
195.70 2.53 1.14 103.98 8.6924 57.84 903.88 0.70 26.04 0.040 0.02564 0.1601 4.228 16.9 903.9 15,297
195.00 3.62 1.63 100.31 8.4339 78.59 846.03 1.00 25.34 0.040 0.02564 0.1601 4.143 16.6 846.0 14,033
194.00 3.62 1.63 95.07 8.0725 73.83 767.45 1.00 24.34 0.040 0.02564 0.1601 4.024 16.1 767.4 12,363
193.00 3.62 1.63 89.82 7.7220 69.07 693.62 1.00 23.34 0.040 0.02564 0.1601 3.907 15.6 693.6 10,848
192.00 3.62 1.63 84.58 7.3842 64.30 624.56 1.00 22.34 0.040 0.02564 0.1601 3.792 15.2 624.6 9,481
191.00 3.62 1.63 79.34 7.0618 59.54 560.25 1.00 21.34 0.040 0.02564 0.1601 3.681 14.7 560.3 8,255
190.00 3.62 1.63 74.09 6.7580 54.78 500.71 1.00 20.34 0.040 0.02564 0.1601 3.574 14.3 500.7 7,165
189.00 3.62 1.63 68.85 6.4770 50.02 445.92 1.00 19.34 0.040 0.02564 0.1601 3.475 13.9 445.9 6,203
188.00 3.62 1.63 63.60 6.2246 45.26 395.90 1.00 18.34 0.040 0.02564 0.1601 3.384 13.5 395.9 5,363
187.00 1.34 0.60 58.36 6.0084 15.54 350.64 0.37 17.34 0.040 0.02564 0.1601 3.305 13.2 350.6 4,639
186.63 3.30 2.65 56.42 5.9395 62.98 335.09 1.63 16.97 0.040 0.02564 0.1601 3.280 13.1 335.1 4,399
185.00 2.03 1.63 50.46 5.3924 34.63 272.11 1.00 15.34 0.040 0.02564 0.1601 3.075 12.3 272.1 3,350
184.00 1.48 1.19 46.81 5.0734 23.36 237.48 0.73 14.34 0.040 0.02564 0.1601 2.953 11.8 237.5 2,807
183.27 0.62 0.44 44.14 4.8508 8.22 214.12 0.27 13.61 0.040 0.02564 0.1601 2.866 11.5 214.1 2,456
183.00 2.29 1.63 43.08 4.7792 28.31 205.90 1.00 13.34 0.040 0.02564 0.1601 2.837 11.4 205.9 2,339
182.00 2.29 1.63 39.16 4.5350 24.96 177.59 1.00 12.34 0.040 0.02564 0.1601 2.740 11.0 177.6 1,948
181.00 2.29 1.63 35.24 4.3314 21.61 152.63 1.00 11.34 0.040 0.02564 0.1601 2.657 10.6 152.6 1,624
180.00 0.21 0.15 31.32 4.1837 1.78 131.02 0.09 10.34 0.040 0.02564 0.1601 2.596 10.4 131.0 1,362
179.91 1.04 1.48 30.96 4.1739 17.10 129.24 0.91 10.25 0.040 0.02564 0.1601 2.592 10.4 129.2 1,341
179.00 0.76 1.07 28.44 3.9428 11.45 112.14 0.66 9.34 0.040 0.02564 0.1601 2.496 10.0 112.1 1,120
178.34 0.39 0.40 26.61 3.7837 5.62 100.69 0.34 8.68 0.040 0.02564 0.1601 2.428 9.7 100.7 979
178.00 1.15 1.17 25.82 3.6813 15.76 95.06 1.00 8.34 0.040 0.02564 0.1601 2.384 9.5 95.1 907
177.00 1.15 1.17 23.51 3.3737 14.59 79.30 1.00 7.34 0.040 0.02564 0.1601 2.249 9.0 79.3 714
176.00 1.15 1.17 21.19 3.0540 13.42 64.71 1.00 6.34 0.040 0.02564 0.1601 2.105 8.4 64.7 545
175.00 1.15 1.17 18.87 2.7177 12.25 51.29 1.00 5.34 0.040 0.02564 0.1601 1.947 7.8 51.3 400
174.00 1.15 1.17 16.55 2.3579 11.08 39.03 1.00 4.34 0.040 0.02564 0.1601 1.772 7.1 39.0 277
173.00 1.15 1.17 14.24 1.9630 9.92 27.95 1.00 3.34 0.040 0.02564 0.1601 1.568 6.3 27.9 175
172.00 1.15 1.17 11.92 1.5127 8.75 18.03 1.00 2.34 0.040 0.02564 0.1601 1.318 5.3 18.0 95
171.00 1.15 1.17 9.60 0.9668 7.58 9.29 1.00 1.34 0.040 0.02564 0.1601 0.978 3.9 9.3 36
170.00 0.19 0.20 7.29 0.2341 1.17 1.71 0.17 0.34 0.040 0.02564 0.1601 0.380 1.5 1.7 3
169.83 3.27 0.08 6.89 0.0775 0.36 0.53 0.07 0.17 0.040 0.02564 0.1601 0.182 0.7 0.5 0
169.76 3.43 0.12 3.54 0.0492 0.17 0.17 0.10 0.10 0.040 0.02564 0.1601 0.134 0.5 0.2 0
169.66 0 0 169.66
Discharge Rating Curve at CE-R2
168
170
172
174
176
178
180
0 200 400 600 800 1,000 1,200
Discharge (m3/s)
Ele
vati
on
(E
L.m
)
164
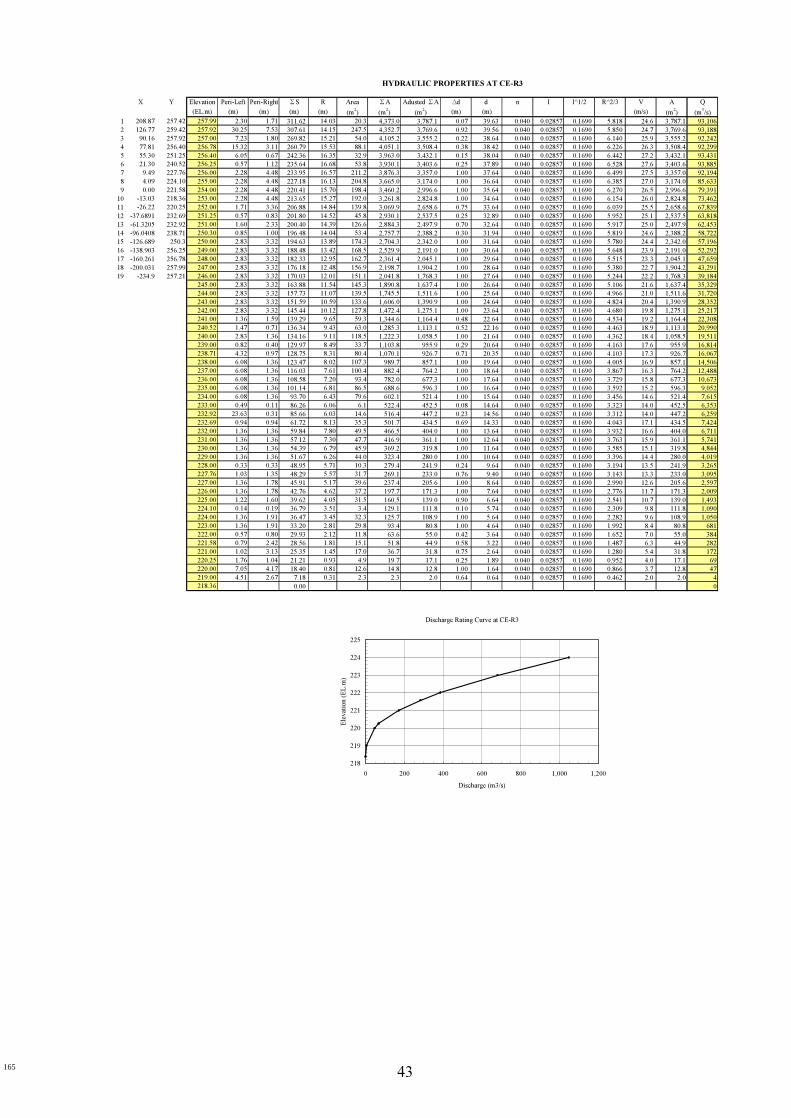
43
X Y Elevation Peri-Left Peri-Right ∑S R Area ∑A Adusted ∑A ∆d d n I I^1/2 R^2/3 V A Q
(EL.m) (m) (m) (m) (m) (m2) (m
2) (m
2) (m) (m) (m/s) (m
2) (m
3/s)
1 208.87 257.42 257.99 2.30 1.71 311.62 14.03 20.3 4,373.0 3,787.1 0.07 39.63 0.040 0.02857 0.1690 5.818 24.6 3,787.1 93,106
2 126.77 259.42 257.92 30.25 7.53 307.61 14.15 247.5 4,352.7 3,769.6 0.92 39.56 0.040 0.02857 0.1690 5.850 24.7 3,769.6 93,188
3 90.16 257.92 257.00 7.23 1.80 269.82 15.21 54.0 4,105.2 3,555.2 0.22 38.64 0.040 0.02857 0.1690 6.140 25.9 3,555.2 92,242
4 77.81 256.40 256.78 15.32 3.11 260.79 15.53 88.1 4,051.1 3,508.4 0.38 38.42 0.040 0.02857 0.1690 6.226 26.3 3,508.4 92,299
5 55.30 251.25 256.40 6.05 0.67 242.36 16.35 32.9 3,963.0 3,432.1 0.15 38.04 0.040 0.02857 0.1690 6.442 27.2 3,432.1 93,431
6 21.30 240.52 256.25 0.57 1.12 235.64 16.68 53.8 3,930.1 3,403.6 0.25 37.89 0.040 0.02857 0.1690 6.528 27.6 3,403.6 93,885
7 9.49 227.76 256.00 2.28 4.48 233.95 16.57 211.2 3,876.3 3,357.0 1.00 37.64 0.040 0.02857 0.1690 6.499 27.5 3,357.0 92,194
8 4.09 224.10 255.00 2.28 4.48 227.18 16.13 204.8 3,665.0 3,174.0 1.00 36.64 0.040 0.02857 0.1690 6.385 27.0 3,174.0 85,633
9 0.00 221.58 254.00 2.28 4.48 220.41 15.70 198.4 3,460.2 2,996.6 1.00 35.64 0.040 0.02857 0.1690 6.270 26.5 2,996.6 79,391
10 -13.03 218.36 253.00 2.28 4.48 213.65 15.27 192.0 3,261.8 2,824.8 1.00 34.64 0.040 0.02857 0.1690 6.154 26.0 2,824.8 73,462
11 -26.22 220.25 252.00 1.71 3.36 206.88 14.84 139.8 3,069.9 2,658.6 0.75 33.64 0.040 0.02857 0.1690 6.039 25.5 2,658.6 67,839
12 -37.6891 232.69 251.25 0.57 0.83 201.80 14.52 45.8 2,930.1 2,537.5 0.25 32.89 0.040 0.02857 0.1690 5.952 25.1 2,537.5 63,818
13 -61.3205 232.92 251.00 1.60 2.33 200.40 14.39 126.6 2,884.3 2,497.9 0.70 32.64 0.040 0.02857 0.1690 5.917 25.0 2,497.9 62,453
14 -96.0408 238.71 250.30 0.85 1.00 196.48 14.04 53.4 2,757.7 2,388.2 0.30 31.94 0.040 0.02857 0.1690 5.819 24.6 2,388.2 58,722
15 -126.689 250.3 250.00 2.83 3.32 194.63 13.89 174.3 2,704.3 2,342.0 1.00 31.64 0.040 0.02857 0.1690 5.780 24.4 2,342.0 57,196
16 -138.903 256.25 249.00 2.83 3.32 188.48 13.42 168.5 2,529.9 2,191.0 1.00 30.64 0.040 0.02857 0.1690 5.648 23.9 2,191.0 52,292
17 -160.261 256.78 248.00 2.83 3.32 182.33 12.95 162.7 2,361.4 2,045.1 1.00 29.64 0.040 0.02857 0.1690 5.515 23.3 2,045.1 47,659
18 -200.031 257.99 247.00 2.83 3.32 176.18 12.48 156.9 2,198.7 1,904.2 1.00 28.64 0.040 0.02857 0.1690 5.380 22.7 1,904.2 43,291
19 -234.9 257.21 246.00 2.83 3.32 170.03 12.01 151.1 2,041.8 1,768.3 1.00 27.64 0.040 0.02857 0.1690 5.244 22.2 1,768.3 39,184
245.00 2.83 3.32 163.88 11.54 145.3 1,890.8 1,637.4 1.00 26.64 0.040 0.02857 0.1690 5.106 21.6 1,637.4 35,329
244.00 2.83 3.32 157.73 11.07 139.5 1,745.5 1,511.6 1.00 25.64 0.040 0.02857 0.1690 4.966 21.0 1,511.6 31,720
243.00 2.83 3.32 151.59 10.59 133.6 1,606.0 1,390.9 1.00 24.64 0.040 0.02857 0.1690 4.824 20.4 1,390.9 28,352
242.00 2.83 3.32 145.44 10.12 127.8 1,472.4 1,275.1 1.00 23.64 0.040 0.02857 0.1690 4.680 19.8 1,275.1 25,217
241.00 1.36 1.59 139.29 9.65 59.3 1,344.6 1,164.4 0.48 22.64 0.040 0.02857 0.1690 4.534 19.2 1,164.4 22,308
240.52 1.47 0.71 136.34 9.43 63.0 1,285.3 1,113.1 0.52 22.16 0.040 0.02857 0.1690 4.463 18.9 1,113.1 20,990
240.00 2.83 1.36 134.16 9.11 118.5 1,222.3 1,058.5 1.00 21.64 0.040 0.02857 0.1690 4.362 18.4 1,058.5 19,511
239.00 0.82 0.40 129.97 8.49 33.7 1,103.8 955.9 0.29 20.64 0.040 0.02857 0.1690 4.163 17.6 955.9 16,814
238.71 4.32 0.97 128.75 8.31 80.4 1,070.1 926.7 0.71 20.35 0.040 0.02857 0.1690 4.103 17.3 926.7 16,067
238.00 6.08 1.36 123.47 8.02 107.3 989.7 857.1 1.00 19.64 0.040 0.02857 0.1690 4.005 16.9 857.1 14,506
237.00 6.08 1.36 116.03 7.61 100.4 882.4 764.2 1.00 18.64 0.040 0.02857 0.1690 3.867 16.3 764.2 12,488
236.00 6.08 1.36 108.58 7.20 93.4 782.0 677.3 1.00 17.64 0.040 0.02857 0.1690 3.729 15.8 677.3 10,673
235.00 6.08 1.36 101.14 6.81 86.5 688.6 596.3 1.00 16.64 0.040 0.02857 0.1690 3.592 15.2 596.3 9,052
234.00 6.08 1.36 93.70 6.43 79.6 602.1 521.4 1.00 15.64 0.040 0.02857 0.1690 3.456 14.6 521.4 7,615
233.00 0.49 0.11 86.26 6.06 6.1 522.4 452.5 0.08 14.64 0.040 0.02857 0.1690 3.323 14.0 452.5 6,353
232.92 23.63 0.31 85.66 6.03 14.6 516.4 447.2 0.23 14.56 0.040 0.02857 0.1690 3.312 14.0 447.2 6,259
232.69 0.94 0.94 61.72 8.13 35.3 501.7 434.5 0.69 14.33 0.040 0.02857 0.1690 4.043 17.1 434.5 7,424
232.00 1.36 1.36 59.84 7.80 49.5 466.5 404.0 1.00 13.64 0.040 0.02857 0.1690 3.932 16.6 404.0 6,711
231.00 1.36 1.36 57.12 7.30 47.7 416.9 361.1 1.00 12.64 0.040 0.02857 0.1690 3.763 15.9 361.1 5,741
230.00 1.36 1.36 54.39 6.79 45.9 369.2 319.8 1.00 11.64 0.040 0.02857 0.1690 3.585 15.1 319.8 4,844
229.00 1.36 1.36 51.67 6.26 44.0 323.4 280.0 1.00 10.64 0.040 0.02857 0.1690 3.396 14.4 280.0 4,019
228.00 0.33 0.33 48.95 5.71 10.3 279.4 241.9 0.24 9.64 0.040 0.02857 0.1690 3.194 13.5 241.9 3,265
227.76 1.03 1.35 48.29 5.57 31.7 269.1 233.0 0.76 9.40 0.040 0.02857 0.1690 3.143 13.3 233.0 3,095
227.00 1.36 1.78 45.91 5.17 39.6 237.4 205.6 1.00 8.64 0.040 0.02857 0.1690 2.990 12.6 205.6 2,597
226.00 1.36 1.78 42.76 4.62 37.2 197.7 171.3 1.00 7.64 0.040 0.02857 0.1690 2.776 11.7 171.3 2,009
225.00 1.22 1.60 39.62 4.05 31.5 160.5 139.0 0.90 6.64 0.040 0.02857 0.1690 2.541 10.7 139.0 1,493
224.10 0.14 0.19 36.79 3.51 3.4 129.1 111.8 0.10 5.74 0.040 0.02857 0.1690 2.309 9.8 111.8 1,090
224.00 1.36 1.91 36.47 3.45 32.3 125.7 108.9 1.00 5.64 0.040 0.02857 0.1690 2.282 9.6 108.9 1,050
223.00 1.36 1.91 33.20 2.81 29.8 93.4 80.8 1.00 4.64 0.040 0.02857 0.1690 1.992 8.4 80.8 681
222.00 0.57 0.80 29.93 2.12 11.8 63.6 55.0 0.42 3.64 0.040 0.02857 0.1690 1.652 7.0 55.0 384
221.58 0.79 2.42 28.56 1.81 15.1 51.8 44.9 0.58 3.22 0.040 0.02857 0.1690 1.487 6.3 44.9 282
221.00 1.02 3.13 25.35 1.45 17.0 36.7 31.8 0.75 2.64 0.040 0.02857 0.1690 1.280 5.4 31.8 172
220.25 1.76 1.04 21.21 0.93 4.9 19.7 17.1 0.25 1.89 0.040 0.02857 0.1690 0.952 4.0 17.1 69
220.00 7.05 4.17 18.40 0.81 12.6 14.8 12.8 1.00 1.64 0.040 0.02857 0.1690 0.866 3.7 12.8 47
219.00 4.51 2.67 7.18 0.31 2.3 2.3 2.0 0.64 0.64 0.040 0.02857 0.1690 0.462 2.0 2.0 4
218.36 0.00 0
HYDRAULIC PROPERTIES AT CE-R3
Discharge Rating Curve at CE-R3
218
219
220
221
222
223
224
225
0 200 400 600 800 1,000 1,200
Discharge (m3/s)
Ele
vat
ion
(E
L.m
)
165

44
Elevation Peri-Left Adjust Peri-Right ∑S R Area ∑A ∆d d n I I^1/2 R^2/3 V A Q
X Y (EL.m) (m) (m) (m) (m) (m) (m2) (m
2) (m) (m) (m/s) (m
2) (m
3/s)
1 87.37 273.36 273.36 0.73 9.04 171.77 5.296 56.91 909.63 0.36 18.26 0.040 0.0385 0.1961 3.038 14.9 909.6 13,549
2 57.50 272.17 273.00 1.69 20.85 162.00 5.264 117.95 852.72 0.83 17.90 0.040 0.0385 0.1961 3.026 14.8 852.7 12,651
3 30.18 271.32 272.17 0.35 5.47 139.45 5.269 21.77 734.77 0.17 17.07 0.040 0.0385 0.1961 3.028 14.8 734.8 10,908
4 17.70 264.57 272.00 1.39 21.87 133.64 5.335 77.28 713.00 0.68 16.90 0.040 0.0385 0.1961 3.053 15.0 713.0 10,673
5 9.02 260.34 271.32 0.65 0.67 110.39 5.759 32.49 635.72 0.32 16.22 0.040 0.0385 0.1961 3.213 15.8 635.7 10,014
6 1.30 255.60 271.00 2.04 2.10 109.06 5.531 99.15 603.22 1.00 15.90 0.040 0.0385 0.1961 3.127 15.3 603.2 9,250
7 0.00 255.10 270.00 2.04 2.10 104.92 4.804 95.52 504.07 1.00 14.90 0.040 0.0385 0.1961 2.847 14.0 504.1 7,036
8 -1.58 255.44 269.00 2.04 2.10 100.78 4.054 91.90 408.55 1.00 13.90 0.040 0.0385 0.1961 2.542 12.5 408.6 5,092
9 -7.32 258.30 268.00 0.31 38.25 0.32 96.64 3.277 13.47 316.65 0.15 12.90 0.040 0.0385 0.1961 2.206 10.8 316.7 3,425
10 -12.74 262.70 267.85 3.47 1.79 57.77 5.248 41.49 303.18 0.85 12.75 0.040 0.0385 0.1961 3.020 14.8 303.2 4,489
11 -17.71 265.37 267.00 4.08 2.10 52.52 4.983 43.45 261.69 1.00 11.90 0.040 0.0385 0.1961 2.917 14.3 261.7 3,743
12 -27.5167 267.85 266.00 2.57 1.32 46.34 4.710 24.39 218.24 0.63 10.90 0.040 0.0385 0.1961 2.810 13.8 218.2 3,006
13 -52.8783 267.08 265.37 0.78 0.78 42.44 4.567 13.40 193.84 0.37 10.27 0.040 0.0385 0.1961 2.753 13.5 193.8 2,616
14 -63.0418 266.31 265.00 0.91 0.90 40.88 4.414 14.93 180.45 0.43 9.90 0.040 0.0385 0.1961 2.691 13.2 180.4 2,380
15 -76.5526 273.92 264.57 1.21 1.30 39.07 4.236 18.70 165.52 0.57 9.47 0.040 0.0385 0.1961 2.618 12.8 165.5 2,125
16 -91.6942 275.73 264.00 2.11 2.28 36.56 4.015 29.73 146.82 1.00 8.90 0.040 0.0385 0.1961 2.526 12.4 146.8 1,818
17 -103.706 276.18 263.00 0.63 0.68 32.17 3.640 8.16 117.09 0.30 7.90 0.040 0.0385 0.1961 2.366 11.6 117.1 1,358
18 -112.685 274 262.70 1.11 1.60 30.85 3.531 17.82 108.93 0.70 7.60 0.040 0.0385 0.1961 2.319 11.4 108.9 1,238
19 -140.627 266.48 262.00 1.59 2.28 28.14 3.238 22.66 91.12 1.00 6.90 0.040 0.0385 0.1961 2.189 10.7 91.1 978
261.00 1.05 1.51 24.27 2.820 13.16 68.45 0.66 5.90 0.040 0.0385 0.1961 1.996 9.8 68.5 670
260.34 0.54 0.65 21.72 2.546 6.25 55.30 0.34 5.24 0.040 0.0385 0.1961 1.864 9.1 55.3 505
260.00 1.59 1.91 20.53 2.389 16.45 49.05 1.00 4.90 0.040 0.0385 0.1961 1.787 8.8 49.1 430
259.00 1.11 1.34 17.03 1.914 9.82 32.60 0.70 3.90 0.040 0.0385 0.1961 1.541 7.6 32.6 246
258.30 0.67 0.57 14.59 1.562 3.74 22.78 0.30 3.20 0.040 0.0385 0.1961 1.346 6.6 22.8 150
258.00 2.24 1.91 13.34 1.427 10.11 19.04 1.00 2.90 0.040 0.0385 0.1961 1.268 6.2 19.0 118
257.00 2.24 1.91 9.19 0.971 6.48 8.92 1.00 1.90 0.040 0.0385 0.1961 0.981 4.8 8.9 43
256.00 0.90 0.76 5.03 0.486 1.57 2.45 0.40 0.90 0.040 0.0385 0.1961 0.618 3.0 2.4 7
255.60 0.36 0.45 3.37 0.259 0.45 0.87 0.16 0.50 0.040 0.0385 0.1961 0.406 2.0 0.9 2
255.44 1.62 0.95 2.57 0.163 0.42 0.42 0.34 0.34 0.040 0.0385 0.1961 0.299 1.5 0.4 1
255.10 0.00 0.00 0
HYDRAULIC PROPERTIES AT CE-R4
Discharge Rating Curve at CE-R4
254
255
256
257
258
259
260
261
262
263
264
0 200 400 600 800 1,000 1,200 1,400 1,600
Discharge (m3/s)
Ele
vat
ion (
EL
.m)
Elevation
(m)Depth (m) R Area ∑A d n I I^1/2 R^2/3 V A Q
Left Right Total ∑S (m) (m2) (m2) (m/s) (m2) (m3/s)
289.03 16.41 1.09 2.40 3.49 53.87 5.69 36.85 306.36 16.41 0.04 0.0102 0.101 3.186 8.0 306.4 2,465
288.00 15.38 1.06 2.33 3.39 50.38 5.35 33.30 269.51 15.38 0.04 0.0102 0.101 3.059 7.7 269.5 2,081
287.00 14.38 1.06 2.33 3.39 46.99 5.03 30.87 236.21 14.38 0.04 0.0102 0.101 2.934 7.4 236.2 1,750
286.00 13.38 1.06 2.33 3.39 43.60 4.71 28.43 205.34 13.38 0.04 0.0102 0.101 2.810 7.1 205.3 1,457
285.00 12.38 1.06 2.33 3.39 40.21 4.40 25.99 176.91 12.38 0.04 0.0102 0.101 2.685 6.8 176.9 1,199
284.00 11.38 0.87 1.91 2.78 36.82 4.10 19.50 150.92 11.38 0.04 0.0102 0.101 2.561 6.5 150.9 976
283.18 10.56 0.19 0.60 0.79 34.04 3.86 4.04 131.42 10.56 0.04 0.0102 0.101 2.461 6.2 131.4 817
283.00 10.38 1.06 3.32 4.38 33.25 3.83 20.39 127.38 10.38 0.04 0.0102 0.101 2.448 6.2 127.4 787
282.00 9.38 0.75 2.36 3.11 28.87 3.71 12.35 106.99 9.38 0.04 0.0102 0.101 2.395 6.0 107.0 647
281.29 8.67 0.31 0.37 0.68 25.76 3.67 4.04 94.64 8.67 0.04 0.0102 0.101 2.381 6.0 94.6 569
281.00 8.38 1.06 1.26 2.32 25.08 3.61 15.28 90.60 8.38 0.04 0.0102 0.101 2.354 5.9 90.6 539
280.00 7.38 1.06 1.26 2.32 22.76 3.31 14.17 75.32 7.38 0.04 0.0102 0.101 2.221 5.6 75.3 422
279.00 6.38 1.06 1.26 2.32 20.44 2.99 13.07 61.15 6.38 0.04 0.0102 0.101 2.076 5.2 61.2 321
278.00 5.38 1.06 1.26 2.32 18.12 2.65 11.96 48.08 5.38 0.04 0.0102 0.101 1.917 4.8 48.1 233
277.00 4.38 1.06 1.26 2.32 15.80 2.29 10.86 36.12 4.38 0.04 0.0102 0.101 1.735 4.4 36.1 158
276.00 3.38 1.06 1.26 2.32 13.48 1.87 9.75 25.26 3.38 0.04 0.0102 0.101 1.520 3.8 25.3 97
275.00 2.38 1.06 1.26 2.32 11.16 1.39 8.65 15.51 2.38 0.04 0.0102 0.101 1.245 3.1 15.5 49
274.00 1.38 0.30 0.35 0.65 8.84 0.78 2.22 6.86 1.38 0.04 0.0102 0.101 0.844 2.1 6.9 15
273.72 1.10 0.22 0.79 1.01 8.19 0.57 1.55 4.64 1.10 0.04 0.0102 0.101 0.685 1.7 4.6 8
273.51 0.89 2.21 1.91 4.12 7.18 0.43 2.53 3.09 0.89 0.04 0.0102 0.101 0.570 1.4 3.1 4
273.00 0.38 1.64 1.42 3.06 3.06 0.18 0.56 0.56 0.38 0.04 0.0102 0.101 0.322 0.8 0.6 0
272.62 0.00 0.00 0.00 0.00 0.00 0.00 0 0 0.00 0.04 0.0102 0.101 0.000 0.0 0.0 0
0.00 0.04 0.0102 0.101 0.000 0.0 0.0 0
Hydrailic Radius (m)
HYDRAULIC PROPERTIES AT CE-R5
Discharge Rating Curve at CE-R5
270
272
274
276
278
280
282
284
286
288
290
0 500 1,000 1,500 2,000 2,500 3,000
Discharge (m3/s)
Ele
vat
ion (
EL
.m)
166
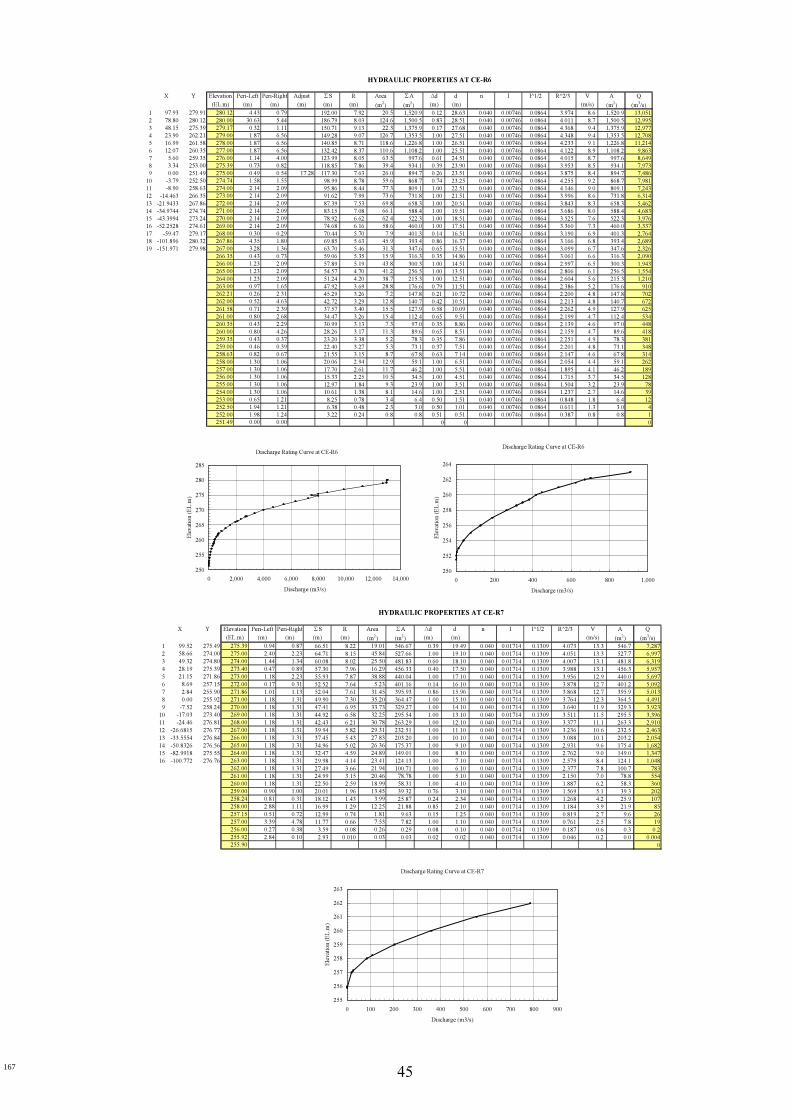
45
X Y Elevation Peri-Left Peri-Right Adjust ∑S R Area ∑A ∆d d n I I^1/2 R^2/3 V A Q
(EL.m) (m) (m) (m) (m) (m) (m2) (m
2) (m) (m) (m/s) (m
2) (m
3/s)
1 97.93 279.91 280.12 4.43 0.79 192.00 7.92 20.5 1,520.9 0.12 28.63 0.040 0.00746 0.0864 3.974 8.6 1,520.9 13,051
2 78.80 280.12 280.00 30.63 5.44 186.79 8.03 124.6 1,500.5 0.83 28.51 0.040 0.00746 0.0864 4.011 8.7 1,500.5 12,995
3 48.15 275.39 279.17 0.32 1.11 150.71 9.13 22.3 1,375.9 0.17 27.68 0.040 0.00746 0.0864 4.368 9.4 1,375.9 12,977
4 23.90 262.21 279.00 1.87 6.56 149.28 9.07 126.7 1,353.5 1.00 27.51 0.040 0.00746 0.0864 4.348 9.4 1,353.5 12,708
5 16.99 261.58 278.00 1.87 6.56 140.85 8.71 118.6 1,226.8 1.00 26.51 0.040 0.00746 0.0864 4.233 9.1 1,226.8 11,214
6 12.07 260.35 277.00 1.87 6.56 132.42 8.37 110.6 1,108.2 1.00 25.51 0.040 0.00746 0.0864 4.122 8.9 1,108.2 9,863
7 5.60 259.35 276.00 1.14 4.00 123.99 8.05 63.5 997.6 0.61 24.51 0.040 0.00746 0.0864 4.015 8.7 997.6 8,649
8 3.34 253.00 275.39 0.73 0.82 118.85 7.86 39.4 934.1 0.39 23.90 0.040 0.00746 0.0864 3.953 8.5 934.1 7,973
9 0.00 251.49 275.00 0.49 0.54 17.28 117.30 7.63 26.0 894.7 0.26 23.51 0.040 0.00746 0.0864 3.875 8.4 894.7 7,486
10 -3.79 252.50 274.74 1.58 1.55 98.99 8.78 59.6 868.7 0.74 23.25 0.040 0.00746 0.0864 4.255 9.2 868.7 7,981
11 -8.90 258.63 274.00 2.14 2.09 95.86 8.44 77.3 809.1 1.00 22.51 0.040 0.00746 0.0864 4.146 9.0 809.1 7,243
12 -14.463 266.35 273.00 2.14 2.09 91.62 7.99 73.6 731.8 1.00 21.51 0.040 0.00746 0.0864 3.996 8.6 731.8 6,314
13 -21.9433 267.86 272.00 2.14 2.09 87.39 7.53 69.8 658.3 1.00 20.51 0.040 0.00746 0.0864 3.843 8.3 658.3 5,462
14 -34.9744 274.74 271.00 2.14 2.09 83.15 7.08 66.1 588.4 1.00 19.51 0.040 0.00746 0.0864 3.686 8.0 588.4 4,683
15 -43.3994 273.24 270.00 2.14 2.09 78.92 6.62 62.4 522.3 1.00 18.51 0.040 0.00746 0.0864 3.525 7.6 522.3 3,976
16 -52.2528 274.61 269.00 2.14 2.09 74.68 6.16 58.6 460.0 1.00 17.51 0.040 0.00746 0.0864 3.360 7.3 460.0 3,337
17 -59.47 279.17 268.00 0.30 0.29 70.44 5.70 7.9 401.3 0.14 16.51 0.040 0.00746 0.0864 3.190 6.9 401.3 2,764
18 -101.896 280.32 267.86 4.35 1.80 69.85 5.63 45.9 393.4 0.86 16.37 0.040 0.00746 0.0864 3.166 6.8 393.4 2,689
19 -151.971 279.98 267.00 3.28 1.36 63.70 5.46 31.3 347.6 0.65 15.51 0.040 0.00746 0.0864 3.099 6.7 347.6 2,326
266.35 0.43 0.73 59.06 5.35 15.9 316.3 0.35 14.86 0.040 0.00746 0.0864 3.061 6.6 316.3 2,090
266.00 1.23 2.09 57.89 5.19 43.8 300.3 1.00 14.51 0.040 0.00746 0.0864 2.997 6.5 300.3 1,943
265.00 1.23 2.09 54.57 4.70 41.2 256.5 1.00 13.51 0.040 0.00746 0.0864 2.806 6.1 256.5 1,554
264.00 1.23 2.09 51.24 4.20 38.7 215.3 1.00 12.51 0.040 0.00746 0.0864 2.604 5.6 215.3 1,210
263.00 0.97 1.65 47.92 3.69 28.8 176.6 0.79 11.51 0.040 0.00746 0.0864 2.386 5.2 176.6 910
262.21 0.26 2.31 45.29 3.26 7.2 147.8 0.21 10.72 0.040 0.00746 0.0864 2.200 4.8 147.8 702
262.00 0.52 4.63 42.72 3.29 12.8 140.7 0.42 10.51 0.040 0.00746 0.0864 2.213 4.8 140.7 672
261.58 0.71 2.39 37.57 3.40 15.5 127.9 0.58 10.09 0.040 0.00746 0.0864 2.262 4.9 127.9 625
261.00 0.80 2.68 34.47 3.26 15.4 112.4 0.65 9.51 0.040 0.00746 0.0864 2.199 4.7 112.4 534
260.35 0.43 2.29 30.99 3.13 7.3 97.0 0.35 8.86 0.040 0.00746 0.0864 2.139 4.6 97.0 448
260.00 0.80 4.26 28.26 3.17 11.3 89.6 0.65 8.51 0.040 0.00746 0.0864 2.159 4.7 89.6 418
259.35 0.43 0.37 23.20 3.38 5.2 78.3 0.35 7.86 0.040 0.00746 0.0864 2.251 4.9 78.3 381
259.00 0.46 0.39 22.40 3.27 5.3 73.1 0.37 7.51 0.040 0.00746 0.0864 2.201 4.8 73.1 348
258.63 0.82 0.67 21.55 3.15 8.7 67.8 0.63 7.14 0.040 0.00746 0.0864 2.147 4.6 67.8 314
258.00 1.30 1.06 20.06 2.94 12.9 59.1 1.00 6.51 0.040 0.00746 0.0864 2.054 4.4 59.1 262
257.00 1.30 1.06 17.70 2.61 11.7 46.2 1.00 5.51 0.040 0.00746 0.0864 1.895 4.1 46.2 189
256.00 1.30 1.06 15.33 2.25 10.5 34.5 1.00 4.51 0.040 0.00746 0.0864 1.715 3.7 34.5 128
255.00 1.30 1.06 12.97 1.84 9.3 23.9 1.00 3.51 0.040 0.00746 0.0864 1.504 3.2 23.9 78
254.00 1.30 1.06 10.61 1.38 8.1 14.6 1.00 2.51 0.040 0.00746 0.0864 1.237 2.7 14.6 39
253.00 0.65 1.21 8.25 0.78 3.4 6.4 0.50 1.51 0.040 0.00746 0.0864 0.848 1.8 6.4 12
252.50 1.94 1.21 6.38 0.48 2.3 3.0 0.50 1.01 0.040 0.00746 0.0864 0.611 1.3 3.0 4
252.00 1.98 1.24 3.22 0.24 0.8 0.8 0.51 0.51 0.040 0.00746 0.0864 0.387 0.8 0.8 1
251.49 0.00 0.00 0 0 0
HYDRAULIC PROPERTIES AT CE-R6
Discharge Rating Curve at CE-R6
250
255
260
265
270
275
280
285
0 2,000 4,000 6,000 8,000 10,000 12,000 14,000
Discharge (m3/s)
Ele
vat
ion
(E
L.m
)
Discharge Rating Curve at CE-R6
250
252
254
256
258
260
262
264
0 200 400 600 800 1,000
Discharge (m3/s)
Ele
vat
ion
(E
L.m
)
X Y Elevation Peri-Left Peri-Right ∑S R Area ∑A ∆d d n I I^1/2 R^2/3 V A Q
(EL.m) (m) (m) (m) (m) (m2) (m
2) (m) (m) (m/s) (m
2) (m
3/s)
1 99.52 275.49 275.39 0.94 0.87 66.51 8.22 19.01 546.67 0.39 19.49 0.040 0.01714 0.1309 4.073 13.3 546.7 7,287
2 58.66 274.00 275.00 2.40 2.23 64.71 8.15 45.84 527.66 1.00 19.10 0.040 0.01714 0.1309 4.051 13.3 527.7 6,997
3 49.32 274.80 274.00 1.44 1.34 60.08 8.02 25.50 481.83 0.60 18.10 0.040 0.01714 0.1309 4.007 13.1 481.8 6,319
4 28.19 275.39 273.40 0.47 0.89 57.30 7.96 16.29 456.33 0.40 17.50 0.040 0.01714 0.1309 3.988 13.1 456.3 5,957
5 21.15 271.86 273.00 1.18 2.23 55.93 7.87 38.88 440.04 1.00 17.10 0.040 0.01714 0.1309 3.956 12.9 440.0 5,697
6 8.69 257.15 272.00 0.17 0.31 52.52 7.64 5.23 401.16 0.14 16.10 0.040 0.01714 0.1309 3.878 12.7 401.2 5,092
7 2.84 255.90 271.86 1.01 1.13 52.04 7.61 31.45 395.93 0.86 15.96 0.040 0.01714 0.1309 3.868 12.7 395.9 5,013
8 0.00 255.92 271.00 1.18 1.31 49.90 7.30 35.20 364.47 1.00 15.10 0.040 0.01714 0.1309 3.764 12.3 364.5 4,491
9 -7.52 258.24 270.00 1.18 1.31 47.41 6.95 33.73 329.27 1.00 14.10 0.040 0.01714 0.1309 3.640 11.9 329.3 3,923
10 -17.03 273.40 269.00 1.18 1.31 44.92 6.58 32.25 295.54 1.00 13.10 0.040 0.01714 0.1309 3.511 11.5 295.5 3,396
11 -24.46 276.81 268.00 1.18 1.31 42.43 6.21 30.78 263.29 1.00 12.10 0.040 0.01714 0.1309 3.377 11.1 263.3 2,910
12 -26.6815 276.77 267.00 1.18 1.31 39.94 5.82 29.31 232.51 1.00 11.10 0.040 0.01714 0.1309 3.236 10.6 232.5 2,463
13 -33.5554 276.84 266.00 1.18 1.31 37.45 5.43 27.83 203.20 1.00 10.10 0.040 0.01714 0.1309 3.088 10.1 203.2 2,054
14 -50.8326 276.56 265.00 1.18 1.31 34.96 5.02 26.36 175.37 1.00 9.10 0.040 0.01714 0.1309 2.931 9.6 175.4 1,682
15 -82.9918 275.55 264.00 1.18 1.31 32.47 4.59 24.89 149.01 1.00 8.10 0.040 0.01714 0.1309 2.762 9.0 149.0 1,347
16 -100.772 276.76 263.00 1.18 1.31 29.98 4.14 23.41 124.13 1.00 7.10 0.040 0.01714 0.1309 2.579 8.4 124.1 1,048
262.00 1.18 1.31 27.49 3.66 21.94 100.71 1.00 6.10 0.040 0.01714 0.1309 2.377 7.8 100.7 783
261.00 1.18 1.31 24.99 3.15 20.46 78.78 1.00 5.10 0.040 0.01714 0.1309 2.150 7.0 78.8 554
260.00 1.18 1.31 22.50 2.59 18.99 58.31 1.00 4.10 0.040 0.01714 0.1309 1.887 6.2 58.3 360
259.00 0.90 1.00 20.01 1.96 13.45 39.32 0.76 3.10 0.040 0.01714 0.1309 1.569 5.1 39.3 202
258.24 0.81 0.31 18.12 1.43 3.99 25.87 0.24 2.34 0.040 0.01714 0.1309 1.268 4.2 25.9 107
258.00 2.88 1.11 16.99 1.29 12.25 21.88 0.85 2.10 0.040 0.01714 0.1309 1.184 3.9 21.9 85
257.15 0.51 0.72 12.99 0.74 1.81 9.63 0.15 1.25 0.040 0.01714 0.1309 0.819 2.7 9.6 26
257.00 3.39 4.78 11.77 0.66 7.53 7.82 1.00 1.10 0.040 0.01714 0.1309 0.761 2.5 7.8 19
256.00 0.27 0.38 3.59 0.08 0.26 0.29 0.08 0.10 0.040 0.01714 0.1309 0.187 0.6 0.3 0.2
255.92 2.84 0.10 2.93 0.010 0.03 0.03 0.02 0.02 0.040 0.01714 0.1309 0.046 0.2 0.0 0.004
255.90 0
HYDRAULIC PROPERTIES AT CE-R7
Discharge Rating Curve at CE-R7
255
256
257
258
259
260
261
262
263
0 100 200 300 400 500 600 700 800 900
Discharge (m3/s)
Ele
vat
ion (
EL
.m)
167

46
Elevation Peri-Left Peri-Right ∑S R Area ∑A ∆d d n I I^1/2 R^2/3 V A Q
X Y (EL.m) (m) (m) (m) (m) (m2) (m
2) (m) (m) (m/s) (m
2) (m
3/s)
1 57.52 238.70 240.72 0.44 26.72 51.55 1.805 11.68 93.03 0.36 6.94 0.040 0.0172 0.1313 1.482 4.9 93.0 453
2 36.87 240.72 240.36 0.44 0.56 24.39 3.335 6.71 81.34 0.36 6.58 0.040 0.0172 0.1313 2.232 7.3 81.3 596
3 10.15 240.36 240.00 1.23 1.55 23.39 3.191 17.34 74.64 1.00 6.22 0.040 0.0172 0.1313 2.167 7.1 74.6 531
4 6.75 237.48 239.00 1.23 1.55 20.62 2.779 15.45 57.30 1.00 5.22 0.040 0.0172 0.1313 1.977 6.5 57.3 372
5 1.62 233.90 238.00 0.64 0.81 17.84 2.346 7.29 41.85 0.52 4.22 0.040 0.0172 0.1313 1.765 5.8 41.8 243
6 0.00 233.78 237.48 0.59 0.84 16.40 2.108 6.24 34.56 0.48 3.70 0.040 0.0172 0.1313 1.644 5.4 34.6 187
7 -4.39 234.12 237.00 1.23 1.75 14.97 1.892 11.42 28.32 1.00 3.22 0.040 0.0172 0.1313 1.530 5.0 28.3 142
8 -9.51 241.34 236.00 1.23 1.75 12.00 1.409 9.28 16.90 1.00 2.22 0.040 0.0172 0.1313 1.257 4.1 16.9 70
9 -35.95 242.75 235.00 1.08 1.54 9.02 0.845 6.39 7.62 0.88 1.22 0.040 0.0172 0.1313 0.894 2.9 7.6 22.4
10 -42.57 242.80 234.12 1.55 0.21 6.41 0.193 0.66 1.23 0.12 0.34 0.040 0.0172 0.1313 0.333 1.1 1.2 1.3
11 -63.72 243.73 234.00 1.29 0.17 4.64 0.125 0.39 0.58 0.10 0.22 0.040 0.0172 0.1313 0.249 0.8 0.6 0.5
12 -78.545 247.16 233.90 1.55 1.62 3.18 0.060 0.19 0.19 0.12 0.12 0.040 0.0172 0.1313 0.153 0.5 0.2 0.1
13 -92.0397 252.17 233.78 0.00 0.00 0.00 0.00 0.00 0.00 0.00 0.040 0.0172 0.1313 0.000 0.0 0.0 0.0
HYDRAULIC PROPERTIES AT CE-R8
Discharge Rating Curve at CE-R8
233
234
235
236
237
238
239
240
241
0 100 200 300 400 500 600 700
Discharge (m3/s)
Ele
vat
ion
(E
L.m
)
X Y Elevation Peri-Left Peri-Right ∑S R Area ∑A ∆d d n I I^1/2 R^2/3 V A Q
(EL.m) (m) (m) (m) (m) (m2) (m
2) (m) (m) (m/s) (m
2) (m
3/s)
1 145.36 203.36 198.69 9.55 6.55 157.34 10.48 86.06 1,648.7 0.63 26.18 0.040 0.01429 0.1195 4.789 14.3 1,648.7 23,594
2 97.20 198.91 198.06 0.91 0.09 141.23 11.06 7.69 1,562.6 0.06 25.55 0.040 0.01429 0.1195 4.965 14.8 1,562.6 23,188
3 68.66 199.88 198.00 15.16 1.52 140.23 11.09 119.47 1,554.9 1.00 25.49 0.040 0.01429 0.1195 4.973 14.9 1,554.9 23,107
4 49.82 198.06 197.00 0.30 0.03 123.55 11.62 2.22 1,435.5 0.02 24.49 0.040 0.01429 0.1195 5.130 15.3 1,435.5 22,006
5 34.73 184.80 196.98 6.56 1.48 123.22 11.63 105.06 1,433.2 0.98 24.47 0.040 0.01429 0.1195 5.134 15.3 1,433.2 21,989
6 13.13 176.81 196.00 6.70 1.52 115.17 11.53 99.52 1,328.2 1.00 23.49 0.040 0.01429 0.1195 5.104 15.3 1,328.2 20,261
7 0.00 172.51 195.00 1.74 0.39 106.96 11.49 24.61 1,228.7 0.26 22.49 0.040 0.01429 0.1195 5.091 15.2 1,228.7 18,694
8 -12.28 177.05 194.74 1.85 1.12 104.82 11.49 68.34 1,204.1 0.74 22.23 0.040 0.01429 0.1195 5.091 15.2 1,204.1 18,318
9 -24.48 180.89 194.00 2.51 1.52 101.85 11.15 89.37 1,135.7 1.00 21.49 0.040 0.01429 0.1195 4.991 14.9 1,135.7 16,941
10 -40.05 191.46 193.00 2.51 1.52 97.83 10.70 85.93 1,046.3 1.00 20.49 0.040 0.01429 0.1195 4.854 14.5 1,046.3 15,180
11 -47.59 194.74 192.00 1.35 0.82 93.81 10.24 44.97 960.4 0.54 19.49 0.040 0.01429 0.1195 4.715 14.1 960.4 13,533
12 -62.4184 196.98 191.46 0.82 0.70 91.64 9.99 37.61 915.4 0.46 18.95 0.040 0.01429 0.1195 4.638 13.9 915.4 12,690
13 -88.2913 198.69 191.00 1.78 1.52 90.12 9.74 79.85 877.8 1.00 18.49 0.040 0.01429 0.1195 4.561 13.6 877.8 11,965
190.00 1.78 1.52 86.83 9.19 77.24 798.0 1.00 17.49 0.040 0.01429 0.1195 4.388 13.1 798.0 10,463
189.00 1.78 1.52 83.53 8.63 74.63 720.7 1.00 16.49 0.040 0.01429 0.1195 4.207 12.6 720.7 9,061
188.00 1.78 1.52 80.24 8.05 72.02 646.1 1.00 15.49 0.040 0.01429 0.1195 4.017 12.0 646.1 7,757
187.00 1.78 1.52 76.94 7.46 69.41 574.1 1.00 14.49 0.040 0.01429 0.1195 3.818 11.4 574.1 6,551
186.00 1.78 1.52 73.64 6.85 66.80 504.7 1.00 13.49 0.040 0.01429 0.1195 3.608 10.8 504.7 5,441
185.00 0.36 0.30 70.35 6.22 13.05 437.9 0.20 12.49 0.040 0.01429 0.1195 3.384 10.1 437.9 4,428
184.80 1.42 2.31 69.69 6.10 50.64 424.8 0.80 12.29 0.040 0.01429 0.1195 3.337 10.0 424.8 4,237
184.00 1.78 2.88 65.96 5.67 59.54 374.2 1.00 11.49 0.040 0.01429 0.1195 3.181 9.5 374.2 3,557
183.00 1.78 2.88 61.30 5.13 55.36 314.7 1.00 10.49 0.040 0.01429 0.1195 2.976 8.9 314.7 2,798
182.00 1.78 2.88 56.63 4.58 51.19 259.3 1.00 9.49 0.040 0.01429 0.1195 2.757 8.2 259.3 2,136
181.00 0.20 0.32 51.97 4.00 5.38 208.1 0.11 8.49 0.040 0.01429 0.1195 2.522 7.5 208.1 1,568
180.89 2.97 2.57 51.46 3.94 40.96 202.7 0.89 8.38 0.040 0.01429 0.1195 2.494 7.5 202.7 1,511
180.00 3.33 2.88 45.93 3.52 40.46 161.8 1.00 7.49 0.040 0.01429 0.1195 2.315 6.9 161.8 1,119
179.00 3.33 2.88 39.71 3.05 34.58 121.3 1.00 6.49 0.040 0.01429 0.1195 2.105 6.3 121.3 763
178.00 3.17 2.74 33.50 2.59 27.40 86.7 0.95 5.49 0.040 0.01429 0.1195 1.885 5.6 86.7 489
177.05 0.14 0.14 27.59 2.15 1.30 59.3 0.05 4.54 0.040 0.01429 0.1195 1.666 5.0 59.3 295
177.00 0.55 0.55 27.30 2.12 4.80 58.0 0.19 4.49 0.040 0.01429 0.1195 1.653 4.9 58.0 287
176.81 2.34 2.60 26.21 2.03 18.16 53.2 0.81 4.30 0.040 0.01429 0.1195 1.604 4.8 53.2 255
176.00 2.88 3.21 21.27 1.65 17.21 35.1 1.00 3.49 0.040 0.01429 0.1195 1.395 4.2 35.1 146
175.00 2.88 3.21 15.18 1.18 11.46 17.8 1.00 2.49 0.040 0.01429 0.1195 1.114 3.3 17.8 59
174.00 2.88 3.21 9.08 0.70 5.70 6.4 1.00 1.49 0.040 0.01429 0.1195 0.791 2.4 6.4 15
173.00 1.41 1.57 2.99 0.23 0.69 0.7 0.49 0.49 0.040 0.01429 0.1195 0.377 1.1 0.7 1
172.51 0
HYDRAULIC PROPERTIES AT CE-R9
Discharge Rating Curve at CE-R9
172
173
174
175
176
177
178
179
180
181
0 200 400 600 800 1,000 1,200
Discharge (m3/s)
Ele
vat
ion
(E
L.m
)
168


Appendix 9.1
1169

Appendix 9.1
2170

Appendix 9.1
3171
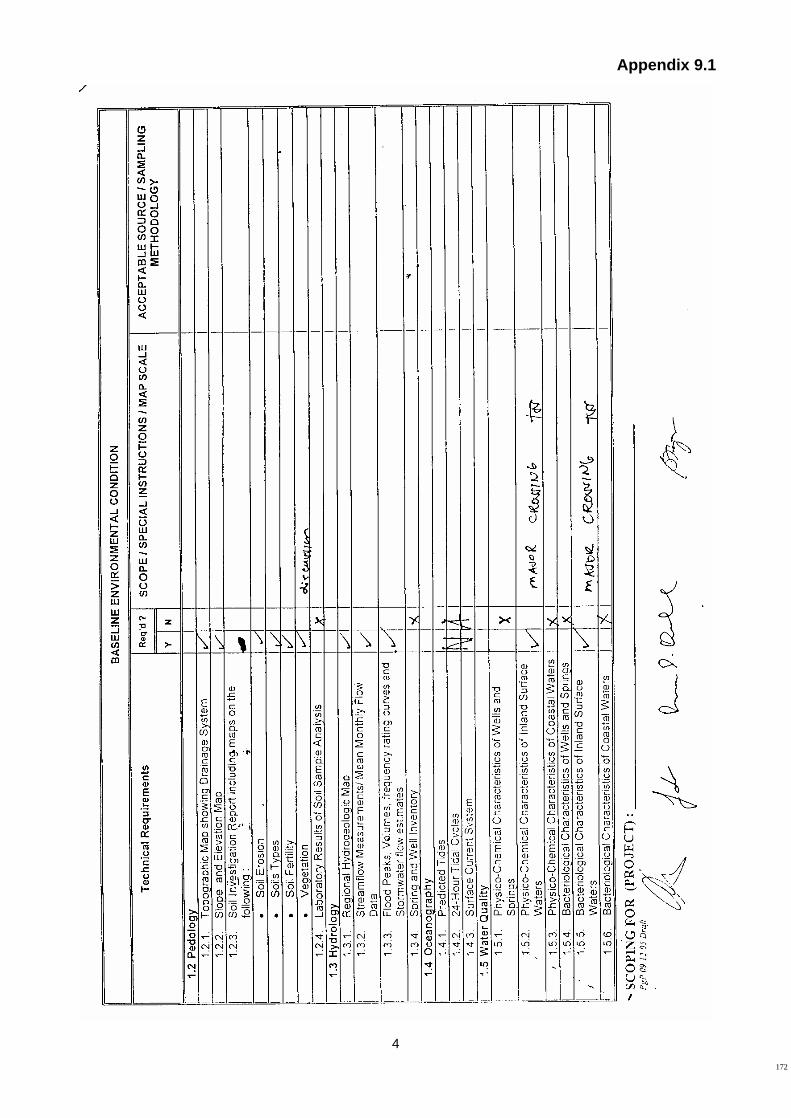
Appendix 9.1
4172
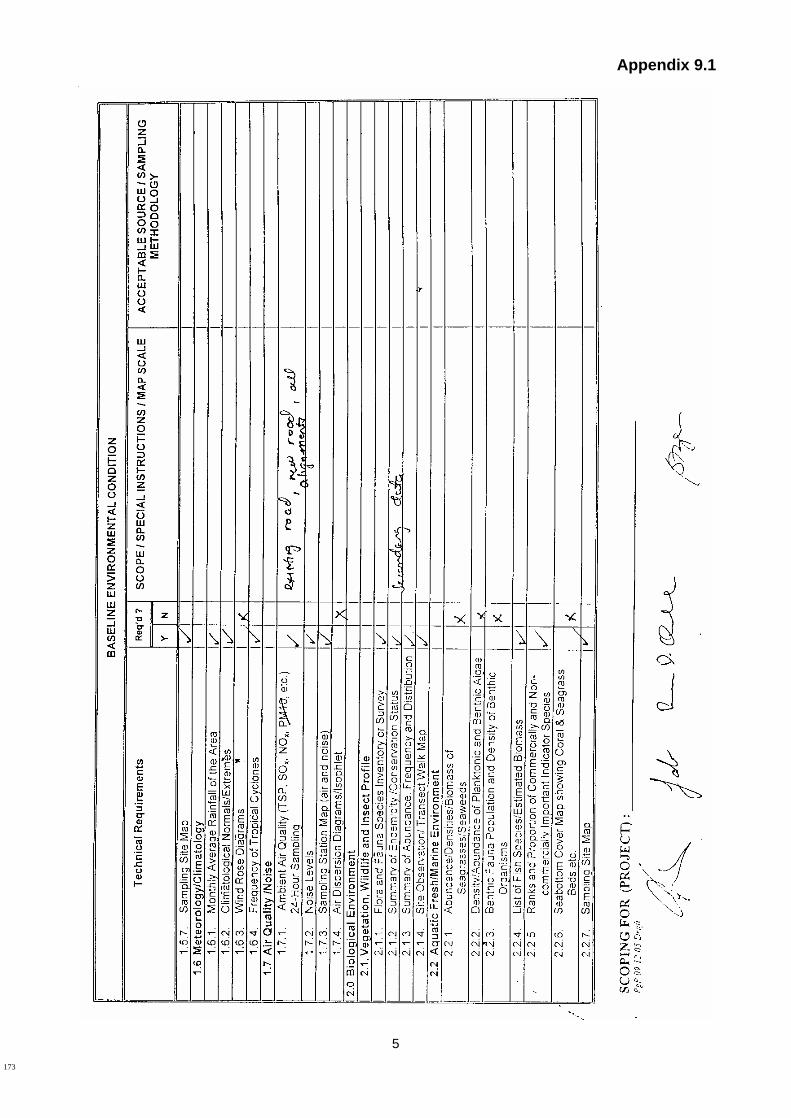
Appendix 9.1
5173

Appendix 9.1
6174
Appendix 9.1
7
175