Embed Size (px)
Citation preview

M2 Group Ltd ("M2")
ABN 74 091 575 021 | ACN 091 575 021
Appendix 4E
Annual Financial Report For the period ended 30 June 2014
This information is provided to ASX under ASX Listing Rule 4.3A. The report is based on accounts which have been audited. The audit report is included within the Annual Report.
1. DETAILS OF THE REPORTING PERIODCurrent period : 1 July 2013 to 30 June 2014 (“FY14”)
Previous corresponding period : 1 July 2012 to 30 June 2013 (“FY13”)
2. RESULT FOR ANNOUNCEMENT TO THE MARKET
Revenue and Net Profit $000
2.1 Revenue from ordinary activities up 50% to $1,024,381
2.2 Profit from ordinary activities after tax attributable to members up 52% to $66,963
2.3 Net profit for the period attributable to members up 52% to $66,963
The Dividend Reinvestment Plan (“DRP”) will operate for the FY14 final dividend. Shares will be issued at a 5% discount to the volume weighted average price of shares sold on the ASX in the 5 days following the record date. Election notices for the DRP must be received by no later than 10 October.
2.6 Explanation of Results
Revenue for FY14 increased 50% to $1.024 billion, which was above the expected guidance range. This increase is primarily attributable to the acquisition of Dodo Australia Holdings Pty Ltd (“Dodo”) and Eftel Ltd (“Eftel”) in May 2013 assisted by further organic growth within the period.
Net profit after tax (“NPAT”) increased 53% to $67.1 million, a result driven by the Company’s continual focus on internal business improvements and the realisation of synergies from earlier acquisitions.
Please refer to the management sections of the attached Annual Report for further review and analysis of M2’s operations and performance for FY14.
3. ADDITIONAL INFORMATION
Additional Appendix 4E disclosure requirements can be found in the attached Annual Report.
Dividend Information Amount per security
Franked amount per security
2.4 Dividends paid and to be paid:
FY14 interim dividend per share 11.5 cents 11.5 cents
FY14 final dividend per share 14.5 cents 14.5 cents
2.5 Record date for determination of entitlement to the final dividend:
FY14 interim dividend 19 March 2014
FY14 final dividend 9 October 2014
For
per
sona
l use
onl
y

M 2 G R O U P LT D
ANNUAL REPORT 2014
For
per
sona
l use
onl
y

Key Highlights
Added 15 Points of Interconnect to NBN
Achieved organic growth of
121k services
Completed rollout of 15 Dodo Connect Kiosks
Total of 1,573k services in operation at 30 June 2014
Launched the
new face of Commander
Exceeded $1 billion
in revenue
SG&A as a percentage
of revenue declined
1.8% to 20.7%
NET debt to EBITDA coverage less than 1.6x
Consumer customer
satisfaction scores exceeding
4.5 out of 5
For
per
sona
l use
onl
y

Chairman’s Letter 1CEO Review 3CFO Commentary 6Business Insights (OFR) 7Corporate Social Responsibility Statement 11Directors’ Report 13Remuneration Report 18Auditor’s Independence Declaration 29Corporate Governance Statement 30Financial Statements (Contents) 34 Consolidated Income Statement 35 Consolidated Statement of Comprehensive Income 36 Consolidated Statement of Financial Position 37 Consolidated Statement of Changes In Equity 38 Consolidated Statement of Cash Flows 39 Notes to the Consolidated Financial Statements 40 1 Corporate Information 40 2 Summary of Accounting Policies 40 3 Financial Risk Management Objectives and Policies 50 4 Significant Accounting Judgements, Estimates and Assumptions 56 5 Operating Segments 58 6 Revenue and Expenses 60 7 Income Tax 61 8 Dividends Paid and Proposed 63 9 Earnings Per Share 64 10 Cash and Cash Equivalents 65 11 Trade Receivables 66 12 Inventories 67 13 Other Assets 67 14 Financial Assets and Liabilities 68 15 Investment in an Associate 69 16 Plant and Equipment 70 17 Intangible Assets and Goodwill 70 18 Trade and Other Payables 72 19 Provisions 73 20 Interest-Bearing Loans and Borrowings 74 21 Other Non-Current Liabilities 74 22 Contributed Equity 75 23 Reserves 76 24 Related Party Disclosure 77 25 Key Management Personnel 79 26 Share Based Payment Plans 80 27 Business Combinations 82 28 Commitments 84 29 Contingencies 84 30 Deficiency in Net Current Position 84 31 Events After Balance Sheet Date 85 32 Parent Entity Information 85 33 Auditor’s Remuneration 85 Directors’ Declaration 86Independent Audit Report 87ASX Additional Information 89Corporate Directory 91
CONTENTS
For
per
sona
l use
onl
y

The M2 Team
More than 3,200 passionate and dedicated team members across Australia, New Zealand
and the Philippines
Diverse Product
OfferingStrong Organic
Growth
A full suite of traditional and next-generation telecom-munications products in addition to electricity and gas
Growth of 121,000 services in operation in FY14
For
per
sona
l use
onl
y

Brand
Strength
Acquisition
& Integration
Credentials
Increasing
Shareholder Returns
Strong brand recognition in Consumer and Business Segments, capable of being extended into other products
Proven success in securing and integrating EPS accretive acquisitions
Full Year dividend of 26c, an increase of 30% on the previous corresponding period
For
per
sona
l use
onl
y

M2 Annual Report 2014 - Chairman’s Letter
1
Fellow Shareholder,
Welcome to M2 Group Ltd’s Annual Report 2014.
In a year of increased competition, continued regulatory development and further changes to the face of the industry through the new government, M2 has continued to deliver increasing returns to shareholders.Record new sales activity for M2, in combination with internal initiatives to increase customer satisfaction and thus decrease custom-er churn, have resulted in strong organic growth in services in operation in energy, fixed voice and, importantly, broadband markets. This growth, combined with our conservative capital management inherent within the business, is being returned to shareholders through an-other record dividend.
ANOTHER RECORD FINANCIAL PERFORMANCEM2’s demonstrated organic growth has delivered revenues of $1.02 billion, an increase of 50%. These results were delivered in part through our investment back into the business, which will continue in a targeted and tightly controlled manner into fiscal year 2014/15.
We are pleased to report record profits with earnings before interest, tax, depreciation and amortisation1 'EBITDA' of $160.1 million, an increase of 48%; and net profit after tax ('NPAT') of $67.1 million, an increase of 53%. All results were within our stated guidance to market and are net of our investment back into the business.
In combination with our growth increasing returns to shareholders, M2 has always had an internal focus on cost control, which has delivered improvements to our bottom line. Our full year operating cash flow increased 38% to $85.6 million. Our net debt position is slightly improved on our forecast, sitting at $254.4 million at 30 June 2014. Repayment of debt while maintaining dividend returns to shareholders will be a continued focus of the Board.
With confidence in our financial position now and into the future, the Board has declared a final dividend of 14.5c, fully franked. This is based on full year payment of 70% of NPAT, per our dividend policy, which has been in place since M2 listed on the Australian Securities Exchange almost 10 years ago. This payout ratio enables reinvestment back into the business for growth, and balance sheet strength.
CHAIRMAN’S LETTER
For
per
sona
l use
onl
y

M2 Annual Report 2014 - Chairman’s Letter
2
EVOLVING WITH OUR CUSTOMERSOver the course of fiscal year 2013/14, M2 progressed the integration of Dodo and Eftel and completed two restructures of the business, to result in a cohesive and focussed team. Other investments into the business have included an increased marketing spend to take advantage of the strength of our brands and push sales. We have launched new products, such as Commander Phone, to meet the evolving needs of businesses and prepare them for the rollout of the National Broadband Network ('NBN').
At last year’s Annual General Meeting, shareholders approved a resolution to change our company name from M2 Telecommunications Group Ltd to M2 Group Ltd. This name change reflects our evolution as a company from being only a telecommunications provider to also being a provider of electricity and gas. Our entry into the utilities sector through the acquisition of Dodo was carefully considered and remains conservatively hedged. More detail on this is available later in this report. Energy is an exciting, rapid growth product for M2 and one that we expect will continue to drive new customer growth, revenue and profit as well as providing current customers with another reason to stay with M2.
BOARDYour Board is focussed on our strategy and governance, and continues to assess its performance and needs for the future.
Reflective of the size and growth of the Company, the Board is in the final stages of making additional appointments which will broaden the skills and experience at the table, add further weight to independence and likewise address diversity and balance.
CONCLUSIONAs always, at the core of the Company’s performance is our team, capably led by CEO Geoff Horth and our experienced executive manage-ment team. In a year of integration and business restructure, our team has remained dedicated to making the business the best that it can be, and flexible to the challenges presented by such changes. I would like to thank them for their positive attitude, creativity, hard work and efforts throughout the year.
As we stand ready to enter our 10th year as a publicly listed company and 15th year since inception, the strength of our brands, our sales channels and our competitive positioning give us confidence that we will continue to deliver positive organic growth well into FY15 and beyond.
On behalf of the Board, I would like to thank you, our shareholders, for your continued support on this journey.
Yours faithfully,
Craig FarrowChairman
(1) 'Earnings before interest, tax, depreciation and amortisation' (EBITDA) is a non-IFRS financial measure which is not audited. EBITDA is calculated using NPAT and adding back the impact of financing cost, income tax, depreciation and amortisation.
Key Dates
09
31
30
30
13-17
23
30OCT 2014
DEC 2014
OCT 2014
JUN 2015
OCT 2014
FEB 2015
OCT 2014
Record date for final FY14 dividend
Half year end
Annual General Meet-ing - Melbourne
Financial year end
DRP pricing period
Half year results released
Final FY14 dividend payment
For
per
sona
l use
onl
y

3
M2 Annual Report 2014 - CEO Review
Dear Valued Shareholder,
I am very pleased to bring to you this report on a year where M2 delivered another record set of financials on the back of outstanding organic growth in services in operation.
ANOTHER YEAR OF RECORD RESULTS – OUTSTANDING
ORGANIC GROWTHIn FY14, M2 delivered organic growth of 121,000 services in operation across fixed voice, mobile, energy and broadband products. This growth is the result of a comprehensive body of work that included new targeted marketing campaigns, the creation of new sales teams and the expansion of existing teams, the reinvigoration of our Commander Channel program, the launch of our Dodo Connect Kiosks and the release of several new products and offers.
Offsetting this growth is the decline in our mobile services in operation, which was partly the result of the elimination of a large number of low value mobile broadband services. This trend in mobile services in operation turned around in the fourth quarter of FY14 when the mobile portfolio returned to growth.
The year’s improvements delivered outstanding net organic growth of 121,000 services in operation. We are confident that, despite a competitive marketplace, we will be able to sustain this growth into FY15 and beyond. We will increase our marketing spend into FY15 in order to fully take advantage of the strength of our brands and offers; concurrently we will continue the expansion of our Commander Channel program and the rollout of our Dodo Connect Kiosks.
This growth has culminated in another year of record financial results for M2. As high-lighted in 'The Numbers That Matter', we have achieved more than $1 billion in revenues, more than $160 million in EBITDA and more than $67 million in NPAT. These results were achieved despite increased investment in our business, including costs associated with the integration of the Dodo and Eftel businesses.
CEO REVIEW
For
per
sona
l use
onl
y

4
M2 Annual Report 2014 - CEO Review
SIMPLIFICATION OF OUR CONSOLIDATED
BUSINESSThrough our acquisitions in 2012 and 2013, M2 gained a number of benefits, including network assets, widely recognised brands, im-proved sales and marketing capability and a more sizeable consum-er customer base. The Company also gained some complexity, with multiple billing and customer support systems, disparate customer support operations, additional premises and a number of duplicated functions.
Over the course of fiscal year 2014 we have been very focussed on the task of simplifying our business. This has involved a number of projects that were carried out with multiple objectives, including re-ducing complexity within the business, simplifying processes and consolidating systems and reducing our cost to serve. It also involved two business restructures to centralise our customer operations to two locations, helping to improve communication and customer ex-perience.
These projects have significant implications for the medium to long-term earnings efficiency of our business. This is perhaps best demonstrated by our cost to serve, which was reduced by 6% in the consumer segment and 13% in the business segment over the course of the year. These initiatives not only reduce costs but also im-prove effectiveness of our customer operations, which is evidenced by the 24% reduction in the number of telecommunications industry ombudsman complaints from the beginning of the period.
IMPROVEMENT AND EXPANSION OF OUR
BUSINESSOver the course of the year, we rolled out to new NBN points of in-terconnect, set up new Dodo Connect Kiosks in shopping centres around Victoria, we released a number new products and offers such as Commander Phone, the Commander Electricity and Telco bundle, our 4G mobile offering and we continue to develop more. While the Commander Telco and Electricity bundle is in its infancy, early indi-cations are that it is resonating with small business. The launch of Commander Phone has exceeded our expectations demonstrating the appetite of Australian small businesses to adopt hosted voice services as an alternative to a traditional PABX.
We have also implemented a number of initiatives in order to ensure we deliver on our objective of making M2 a great place to work. In addition to refreshing our Team Member Benefits package (which in-cludes benefits such as gym memberships, breakfast, fresh fruit and longevity rewards), we have introduced a purchased leave program to enable team members to ‘purchase’ up to two extra weeks leave per year; an internal social media platform to improve communication and networking within the group; and a new leadership development program to help to build leadership skills for the benefit of the team and business. Our team has shown commendable adaptability and passion throughout a period of change and integration and for that, I would like to thank them.
OUR NEWEST PRODUCT - ENERGYThrough the acquisition of Dodo, M2 became a retailer of electricity and gas in Victoria, and electricity in New South Wales, Queensland and South Australia. At the time of this acquisition, our management team and board undertook an in-depth review of this business to ensure that we had the necessary skills to manage a retail energy portfolio and to also better understand the retail market dynamics and in turn the market opportunity for M2. Pleasingly, we found the
prevailing industry conditions are supportive of a low-cost challenger brand taking market share.
Energy has been a strong area of growth for M2 in FY14 and is ex-pected to present a good growth opportunity in FY15 and beyond. In our consumer segment, Dodo Power and Gas is core to the prof-itability of our Dodo Connect Kiosks and is helping us to build this important new distribution network. In our business segment, energy provides compelling and unique bundle opportunities with telecom-munications, providing Commander with a clear point of difference in this significant and attractive market.
LOOKING FORWARDFor a business that has created a reputation for shareholder value creation through acquisitions it is now particularly pleasing to have created a platform for continued success through organic growth.
FY15 offers an enormous amount of promise and is a year in which we look forward to delivering more of the same: organic growth, re-cord profits and increased returns to shareholders.
Specifically, in the year ahead we will:
• Leverage our brand strength and create demand through targeted above and below the line marketing campaigns;
• Continue to augment our distribution to achieve long term sustain-able growth, via expansion of the Dodo Connect Kiosks as well as through our positioning of our Commander Dealers as our 'Small Business Experts' and trusted NBN advisors;
• Increase our efforts to cross sell our significant portfolio of ser-vices to existing customers
• Increase our range of product combinations, with consideration to be given to the launch of a Dodo Pay TV product and possible financial services product; and,
• Invest further in talent identification and skill development within our team.
We will do so with the perpetual M2 focus on the bottom line and delivering returns to shareholders.
We have been delighted to demonstrate our ability to grow organically in FY14 and we are pleased to forecast FY15 revenue growth of be-tween 8-9% and NPAT growth of between 15-20%.
I thank you for your continued support and look forward to delivering another excellent set of results to you next year.
Geoff HorthCEO
For
per
sona
l use
onl
y

5
THE NUMBERS THAT MATTER
TEAM
At 30 June 2014, M2 had more than 3200 team members across Aus-tralia, New Zealand and the Philippines. The passion and enthusiasm of our remarkable team has been, and continues to be, a key driver of the M2 success story.
FY10
0
500
1000
1500
2000
2500
3000
3500
FY11 FY12 FY13 FY14
NPAT
In FY14 NPAT rose to $67.1 million, an increase of more than 300% on our NPAT in FY10 and an improvement of 53% on the previous corresponding period.
FY10
0.00
10.00
20.00
30.00
40.00
50.00
60.00
70.00
FY11 FY12 FY13 FY14
DIVIDEND
The combined final and interim dividend of 26 cents per share is a sharp increase of 30% on the previous corresponding period and an improvement of 160% over 5 years. Growing returns to shareholders is a continued focus of M2 management.
FY10
0
5
10
15
30
25
20
FY11 FY12 FY13 FY14
REVENUE
M2 reported in excess of $1 billion in revenue in FY14, an increase of more than 150% in the last 5 years and 50% on the previous corre-sponding period. This result was achieved through both acquisitions completed in 2013 fiscal year but also as a result of the strong organic growth in services in 2014.
FY10
0
200
400
600
1200
1000
800
FY11 FY12 FY13 FY14
EBITDA
EBITDA rose 48% on the previous corresponding period, to $160.1 million, with a full year of contributions from the Dodo and Eftel busi-nesses. In FY14, EBITDA margin (EBITDA as a percentage of reve-nue) is 15.6%. EBITDA margins have more than doubled in the last five years and we believe further improvements are achievable in the years ahead.
FY10
0.00
20.00
40.00
60.00
80.00
100.00
120.00
140.00
180.00
160.00
FY11 FY12 FY13 FY14
EPS
M2 has steadily grown earnings per share every year since listing on the ASX in 2004, delivering 37.3 cents in FY14, an increase of more than 150% in the last 5 years and more than 36% on the previous corresponding period.
FY10
0
10
5
15
20
25
30
40
35
FY11 FY12 FY13 FY14
M2 Annual Report 2014 - CEO Review
For
per
sona
l use
onl
y

6
M2 Annual Report 2014 - CFO Commentary
RESULTS OVERVIEWRevenue was up 50% to $1.02 billion, following the acquisitions of Dodo and Eftel in the 2013 fiscal year, assisted further by organic growth within the period. EBITDA is at an all time high of $160.1 mil-lion, an increase of 48%.
NPAT increased 53% to $67.1 million, whilst earnings per share in-creased 36% to 37.3 cents. Efficiencies were achieved over the course of the year as a result of integration and simplification of the business, specifically around sales and service, as well as back-office and administration. As a result, SG&A as a percentage of revenue de-creased 1.8% to 20.7%. Benefits from acquisition synergy realisation activities in the year are forecast to flow through to FY15.
CASH FLOWStrong cash collections underpinned a good cash position at the end of the period. Cash flow from operating activities increased by 37.6% to $85.6 million. Free cash flows increased by 51.7% to $63.7 million, from tightly controlled capital expenditure in the year, which was just above 2% of revenue.
BALANCE SHEETOur balance sheet remains strong, with net assets increasing by $35.5 million for the year. Total net debt reduced by $22.7 million, with the committed debt facility reduction of $30 million across the period. Investments have been made within this period in Aggregato Global Ltd, as well as the listing on the Australian Securities Exchange of Inabox Group Limited, taking our current investments to $8.4 million (as detailed in note 15 to the financial statements).
DEBT MANAGEMENTThe Board and Management of M2 are committed to reduce debt in accordance with the funding arrangements entered into in May 2013, of $30 million per annum. With 2 years remaining on this loan, refi-nancing options are being considered for the coming financial year, well in advance of the expiry of our current funding facilities. With the strong operating performance of the Company, all banking covenants have been met and exceeded.
EQUITY MANAGEMENTOver the year, shares on issue increased by 2.2 million to 180.5 mil-lion shares at 30 June 2014. The increase was mainly due to the issue of shares under the dividend reinvestment plan.
CFO COMMENTARY
DIVIDEND POLICYAs outlined in the Chairman’s Letter, M2’s dividend policy has re-mained at 70% of reported net profit after tax since listing on the ASX. The declared amount reflects the Company’s current and project-ed cash position, and available franking credits. Consistent with this policy, the directors have declared a fully-franked, final dividend of 14.5 cents per share, bringing the full year dividend to 26.0 cents per share, an increase of 30% on the previous year. Given the preference by many shareholders to receive dividends in the form of shares, the directors have decided to continue the operation of the Dividend Re-investment Plan (DRP). A 5% discount applies to a volume weighted average price within the discount period prior to the dividend pay-ment date, discount period being the 10 – 16 October 2014.
RISK MANAGEMENTM2 maintains and adheres to clearly defined policies covering areas such as liquidity risk, market risk (including foreign exchange, interest rate and commodity price risk) and credit risk. The main sources of foreign exchange risk involve the purchase of contact centre services from the Philippines in Philippine peso (PHP), as well as equipment supplied in US dollars (USD). M2 uses interest rate swaps to manage interest rate risk; fixed rate swaps cover 75% of our gross debt. The commodity price risk is associated with the purchase of electricity and gas. The Company has entered into derivatives and swaps for a 12 month forward period, covering a projected customer load, in accordance with our wholesale energy risk management policy.
INTERNAL CONTROL AND ASSURANCEWe maintain an internal audit function with a Company-wide mandate, that is fully independent of the business operations, to monitor and provide assurance to the Board’s Audit Committee, and ultimately the Board, as to effectiveness of risk management and internal con-trol systems.
Darryl InnsChief Financial Officer
For
per
sona
l use
onl
y

M2 Annual Report 2014 - Business Insights
7
This information is supplementary to the Financial Statements and should be read in conjunction with the CEO Review, CFO Commen-tary, Directors’ Report, Financial Statements and the Notes to the Financial Statements.
M2 Group Strategy
We have two primary objectives at M2: to deliver outstanding share-holder returns and to be a great place to work. We believe that achieving our goal to be a great place to work is a critical success factor; an engaged and motivated team constantly striving to improve the business performance will invariably give us the best chance of delivering outstanding returns to shareholders.
The strategies to deliver on our goals are multi-faceted and centered on taking advantage of opportunities in the market, leveraging our brand strength and sales expertise and constantly striving to exceed the expectations of our customers.
Within the Consumer segment, our strategy is to:
• Take the proven Dodo brand proposition and extend it into other product and service categories, in order to:
o Increase average revenue per user
o Improve customer retention
o Further enhance brand perception
• Maintain our cost to serve advantage to ensure we are well posi-tioned to take advantage of the opportunities presented by the roll out of the NBN
• Expand our Dodo Connect Kiosks to expand our reach and pro-vide customers the opportunity to interact with us face to face
• Continue to improve our customer experience through refining processes and leveraging technology
Within the Business segment, our strategy is to:
• Expand our Commander channel program and position the brand as the Small Business NBN Experts
• Promote our simple communication and energy solutions to save businesses time and money:
o The unique Commander Telco + Energy bundle, whereby busi-ness customers save 20% on their monthly telco spend and 20% off their electricity usage rates when they have both prod-ucts with Commander
o The NBN-Ready Commander Phone, providing small business-es with a fully featured enterprise grade communication solu-tion without the significant upfront capital investment
In both segments, we will increase our focus on cross-selling our diverse range of products and offers to our current customer base.
In line with our objective to make M2 'a great place to work' in 2014, M2 appointed Melissa Fitzpatrick as HR Director to lead the Compa-ny’s strategy for team, with a particular focus on talent and leadership
development. An internal program was launched for the Company’s Senior Leadership Team in FY14, which was extended to other lead-ers in July 2014. There is more detail on this later in this report.
FY14 Operational highlights
Some of the Group operational highlights for FY14 are:
• 8% organic growth in services in operation with 121,000 post paid services added in the period including 70,000 new broadband subscribers and 37,000 new energy customers:
• The restructure of our sales and service operations for the Busi-ness and Consumer segments, improving sales conversion and customer experience
• Launch of the market-leading Dodo NBN offer, effectively har-nessing M2’s existing NBN infrastructure to launch a low-cost NBN offer to the Dodo target market
• The rollout of 14 new Dodo Connect Kiosks rolled out in shopping centres around Victoria, taking advantage of Dodo brand strength and generating sales in broadband and energy
• Launch of the Dodo 4G mobile offer to a receptive market, with mobile exhibiting growth in Q4
• Completion of an Engin brand refresh, taking this well-known brand as our lead to the SOHO and micro business markets
• The refresh of our Commander Channel program incorporating two new exciting product launches:
o The NBN-Ready Commander Phone, providing small business with a fully featured competitively priced hosted phone solution from one of Australia’s most trusted small business brands
o Our unique Commander Telco + Energy bundle, helping small business save even more money by bundling their telco and energy spend
• Connection of 15 new NBN Points of Interconnect (POIs), signifi-cantly expanding our NBN footprint
• Launch of our leadership development program under recently appointed HR Director Melissa Fitzpatrick, reinvesting in our team to make M2 'a great place to work'
Future Prospects
M2 moves forward having established a strong platform for growth in FY15 and beyond, as detailed in the above strategy. Guidance for FY15 is to deliver organic growth in Revenue and Profit is as follows:
FY15e
Revenue 8-9%
NPAT 15-20%
Capex (as a percentage of revenue) 2.5%
BUSINESS INSIGHTS
For
per
sona
l use
onl
y

8
The Consumer segment, comprising leading brands Dodo and iPri-mus, is the largest and fastest-growing portion of the M2 business in FY14. Key drivers for growth in the Consumer segment were 64,000 new broadband services added and 37,000 new energy services added in the year.
The Business segment exhibited a return to growth in services in operation in the fourth quarter of FY14, the result of a number of ini-tiatives including a refresh of the Commander channel program, the expansion of our internal sales team, the launch of our new Com-mander Phone product and our Commander Electricity offering.
The Wholesale segment remained stable in FY14.
The 'Other' revenue category is included for the purpose of clarity. This category includes equipment sales, New Zealand and interest.
FY14 revenues by product are as follows:
Other revenue includes commissions, other fees and charges, data centre and hardware sales.
Bundled revenue (a broadband and fixed voice service combined) constituted 30% of FY14 revenue.
Broadband and Energy were the strongest growth products through-out the year, growing 17% and 66% respectively. Broadband is an important product and a point of focus for targeted growth for the Group as roll out of the NBN progresses around Australia.
Energy is a fast-growing, profitable and strategically important prod-uct for M2, underpinning the Dodo Connect Kiosk expansion in FY15 and enabling the Commander Telco + Energy discount bundle, an offer which is unique in Australia.
Brands
M2 operates in the Business and Consumer segments under the well-recognised brands of Commander, Engin, iPrimus and Dodo.
M2 Annual Report 2014 - Business Insights
Brand strategy
Commander Commander Saves Business
Commander’s brand promise is to provide simple communication and energy solutions to save businesses time and money.
As small business specialists equipped with NBN-ready Commander phones and competitive NBN offers, Commander Dealers are well-placed to become the 'NBN Experts' ready to support businesses in their transition to the NBN.
Engin It's time we made a connection
Engin provides micro and SOHO businesses with a full suite of prod-ucts to future-proof their communication, from competitive broad-band and phone bundles to ePBX and SIP Trunking solutions.
iPrimus iPrimus has you covered
iPrimus was one of Australia’s first broadband challengers, providing value offerings to families around Australia through its own backbone network as well as fibre assets in 5 capital cities.
Dodo One Call - Connect & Save with Dodo
Dodo’s strategy is to be the one-stop utilities provider, providing great value to Australian households on a range of products and services including telecommunications, electricity, gas and insurance.
Dodo has a proven brand proposition, which has demonstrated suc-cess in being extended into other utilities and products.
Revenue and Products
At 30 June 2014, company revenues by segment were as follows:
c
e i d cc i d c e i d c i d c e c e c d d
Individuals and Families
Small Business
Micro / SOHO Business
Individuals and Families
CONSUMERBUSINESS
Fixed Voice NBN Data Mobile Hosted Voice Cloud Energy Insurance
55%
Consumer
33%
Business
9%
Wholesale
3%
Other
BUSINESS INSIGHTS
MA
RK
ET
SE
RV
ICE
S
= Commander = Engine = iPrimus = Dodoe i d
47%
Voice
31%
Bundled
7%
Other10%
Energy
12%
Mobile
24%
Data
For
per
sona
l use
onl
y

M2 Annual Report 2014 - Business Insights
9
NBN
M2 is an active NBN participant, with 31 NBN Points of Interconnect (POIs). Prior to deploying POI, M2 assesses the addressable market within that POI and builds a business case for each area before installation of equipment.
M2 is actively selling NBN products under its iPrimus, Dodo and Commander brands.
OUR PEOPLEKey Data
M2 is proud to have a diverse, experienced and loyal workforce. More than 3,000 M2 team members are located across Australia, New Zealand and the Philippines.
In Australia and New Zealand:
• The average age of team members is 34 years
• The average length of service (tenure) of our current team is 5.8 years
Leadership
In 2014, a formal Leadership Development Program was launched for all leaders in the company. M2 is committed to investing in and further developing a strategic leadership culture, in which our team’s skills are fostered and developed, and in which highly capable and empowered leaders act like owners and make a difference.
Topics of study on the Leadership Development Program include:
• Leadership Styles
• Emotional Intelligence (EQ)
• Coaching & Personal Development
• Teamwork & Communication
• Influencing & Negotiation
• Conflict Management
• Motivation & Engagement
Appointments to the Executive Management Team
M2 made two important additions to its Executive Management Team in 2014 improving the depth of talent and diversity of skills and experience across the team:
• Ashe-Lee Jegathesan was appointed Company Secretary and General Counsel in May 2014. Ashe-Lee brings more than 20 years of experi-ence as a practicing lawyer in both commercial firms and as an in-house General Counsel, including multiple roles in the IT and Telecommu-nications sector
• Melissa Fitzpatrick was appointed as HR Director in January 2014, to lead best practice in strategic human resources, organisational design, remuneration and benefits, and talent development. Melissa’s background includes significant experience in senior leadership and HR Director roles gained over a 25-year career across multiple sectors including IT and Telecommunications
Health and Safety
Ensuring the safety and wellbeing of our people is paramount. Whether our people are working in our retail kiosks, our corporate offices, our warehouses, or in transit in cars and planes, our focus is on keeping them out of harms way. Our Health and Safety Committees have implement-ed numerous measures to continually improve our safety focus, and M2s policies assist in ensuring the right structures are in place to guide and advise our teams.
2014 saw an intensive activity on safety in our Warehouse environments including regular safety audits and training for team members.
Being a Team Member
M2’s culture starts with the foundation that there are no employees: everyone is a ‘team member’. It is a language that is used consistently throughout the company, reflecting our team spirit, as well as our value of showing respect for each other.
Being a part of the M2 team brings both challenge and reward. Team members are recognised and rewarded in many ways including receiving length of service and achievement awards. The M2’s Benefits Program is highly valued by our team and focuses on healthy living and balance. Benefits include breakfast every day, fully paid gym memberships, fresh fruit, discounts on products and services, Purchased Leave, an Employee Share Plan, and a wide range of outstanding discounts on everything from cars, to holidays.
With an average length of service of 5.8 years our teams are highly skilled and committed to the M2 journey. Our team members tell us that it’s a fun and rewarding culture, that they love what they do, and that they’re here to make a difference.F
or p
erso
nal u
se o
nly

Melissa Fitzpatrick, HR Director
M2 Annual Report 2014 - Business Insights
10
Risks
Our ongoing management of risk includes regular assessment, reporting and internal audit. Following is a summary of the key strategic and op-erational risks faced by the business in the short to medium term.
Security
Security of customer data is of increasing relevance as a number of companies experience system and network breaches from external parties or internal human error. We have programs in place for security management, including the limitation of confidential information and secure areas. This program was intensified in FY14 to minimise the potential threat of disruption to core operations and ensure the security of confidential cus-tomer information, including a full security audit, and will continue to be progressed in FY15.
Energy
As a retailer of electricity, M2 purchases electricity via the Australian Energy Market Operator (AEMO) at the prevailing price. This is a compet-itive market and prices fluctuate with demand. M2 mitigates price volatility through the purchase of Over The Counter derivatives and Futures. The Company’s hedging strategy is set by the Board of Directors with a 12 month horizon, it is reviewed regularly and monitored by a dedicated sub-committee of the Audit & Risk Committee.
Supply
While we do own and operate a traditional voice network and fibre rings in five capital cities, we recognise that a significant portion of our services are on the networks of our suppliers. In every circumstance, we use the fastest and most reliable networks available to deliver services to our customers and maintain good relationships with our suppliers.
Regulation
Regulation is the final key area of risk for the M2 business and the industry as a whole and has the potential to influence supplier pricing as well as the way in which sales are conducted. We remain committed to regulatory compliance and to engaging with the regulators and other industry bodies.
Melissa Fitzpatrick,HR Director
For
per
sona
l use
onl
y

11
CORPORATE SOCIAL
RESPONSIBILITY
M2 TEAM MEMBERS ARE PASSIONATE AND COMMITTED TO COMMUNITY, FAMILY,
HELPING OTHERS, AND THE ENVIRONMENT.
Put simply, the M2 way is to:
M2 Annual Report 2014 - Corporate Social Responsibility
FUNDRAISING AND GIVINGNumerous charities are supported at M2 and fundraising efforts are driven from both the corporate and grass roots level. Every team member is able to access two full days of additional paid leave per annum to participate in Commu-nity or Volunteering activities. Our teams are encouraged to choose an activity or charity that they are personally con-nected with.
We sponsor many M2 team members in entering popular charity sporting events such as The Melbourne Marathon, The Sydney to the Gong bike race, and The Tough Mudder endurance race. In addition, the team holds regular fund-raisers supporting a variety of good causes such as Mo-vember, Pancake Day, and Pink Ribbon Day.
M2 has a close association with The Telco Together Foun-dation ('TTF'). Our CEO, Geoff Horth is on the TTF Advisory Board, and M2 Executive Director Vaughan Bowen is the founder and Chairman. M2 continues to donate the use of office space to the TTF, from M2’s Melbourne headquar-ters. The TTF supports a number of Australian commu-nities in need, making a significant positive social impact supporting causes such as homelessness, mental health, social inclusion and Indigenous health. For more informa-tion on TTF, please go to www.telcotogether.org.
During the Year
• The M2 team raised more than $60,000 for the victims of Ty-phoon Haiyan in the Philippines
• A team of 8 adventure-seeking M2 team members joined the Telco Together team (comprised of 19 Telco representatives) to climb Mt Kilimanjaro - Africa’s tallest mountain at 5,895m, raising over $160,000 for communities in need
• M2’s Workplace Giving Program enabled Team Members to opt-in to salary sacrifice donations directly to TTF from their pay
• M2 worked closely with Ronald McDonald House in Parkville, Melbourne, to design and completely fitout the 'Dodo Tree-house' Internet & Games Room which will open in August 2014. The M2 team is very proud to be able to provide a place of enjoyment for residents and to support such an amazing organisation that makes a real difference every day to children and families affected by illness
◊ Ronald McDonald House, Parkville, is dedicated to provid-ing a ‘home away from home’ for families with a seriously ill child undergoing specialist paediatric medical care at the Royal Children’s Hospital, Melbourne. Families come from all areas of regional Victoria, interstate and occasio ally overseas. Some families stay for just a night, others for much longer. It is a place for families to be together, with all the comforts of home during a difficult and stressful time.
GET
INVOLVED
GIVE
BACK
MAKE A
DIFFERENCE
For
per
sona
l use
onl
y

12
SUPPORTING FAMILIESThe value of quality time spent with family and within communities, and the importance of rest and personal renewal cannot be underestimated.
Some of our initiatives to help our team members with this include:
• The launch of Purchased Leave, allowing team members to access up to six weeks of Annual Leave per annum
• The option of Long Service Leave at half pay for double the Leave time
• Additional paid Parental Leave provided on top of the Government’s paid Parental Leave. M2 provides:
◊ An additional 7 weeks of paid leave for the primary caregiver
◊ An additional 2 weeks of paid leave for partners
• Flexible working hours or arrangements are provided wherever possible
• An Employee Assistance Program (EAP) which provides paid counselling on a variety of topics including family issues and marital stress
SUPPORTING OUR SERVICE MEN AND WOMENM2 supports those team members in the Army Reserves by granting two weeks of Defence Leave each year for Reserve service in addition to their Annual Leave.
'Top up' pay is provided, making up the difference between the Reserve pay and the team member’s usual base salary during those two weeks of leave.
OUR ENVIRONMENTM2 has adopted a leading approach towards recycling of both paper and rubbish, ensuring that the team participate every day in reducing waste and maximising recycling.
Efforts are underway to review and analyse all resource usage, with goals including reducing our travel and carbon footprint, and being smart about our power usage. Our team members have great ideas and as a company we are proactively keen to make a difference in environmental issues. During FY14 we decided to establish a ‘Green Team’ to lead all future environmental efforts.
M2 Annual Report 2014 - Corporate Social Responsibility
For
per
sona
l use
onl
y

13
M2 Annual Report 2014 - Director’s Report
DIRECTORS’ REPORT
In compliance with the provisions of the Corporations Act 2001 ('Corpora-tions Act'), the directors of M2 Group Ltd ('M2' or 'the Company') submit the following report for the Company and its controlled entities for the financial year ended 30 June 2014 ('FY14').
For
per
sona
l use
onl
y

BOARD OF
DIRECTOR S
Craig FarrowChairman
Vaughan BowenExecutive Director
John HyndNon Executive Director
Michael SimmonsNon Executive Director
David RampaNon Executive Director
14
M2 Annual Report 2014 - Director’s Report
DIRECTORSThe names and details of the directors of M2 during FY14 and at the date of this report are as follows:
Craig FarrowChairman B Ec, Dip FS, CPMgr, SA Fin, FCA, FAICD
Appointed Director 18 February 2000 Appointed Chairman 28 April 2006
Mr Farrow is Chairman/Partner of Brentnalls SA, Chartered Accoun-tants and former National Chairman of the Brentnalls National Affili-ation of Accounting Firms. He is Chairman of AIRR Holdings Limited and Tonkin Consulting Engineers and in 2012 was President of the Institute of Chartered Accountants in Australia. In addition, Mr Farrow is a director and Board adviser to several private consulting and trad-ing enterprises across the agribusiness, software and manufacturing sectors. Formerly Chairman of the Institute of Chartered Accountant’s Public Practice Advisory Committee, Mr Farrow is also highly award-ed, including being a Fellow of the Governor’s Leadership Foundation and receiving the Institute of Chartered Accountants 1999 National President’s Award for services to the Institute and the profession. Within the last 3 years, Mr Farrow has served as a director of Eftel Ltd (from 16 April 2013 until 14 June 2013), but held no other listed company directorships.
Mr Farrow is a member of M2’s Nomination & Remuneration and Audit & Risk Committees.
Vaughan Bowen Executive Director B Com, MAICD
Appointed Managing Director / CEO 14 February 2000 Appointed Executive Director 28 October 2011
Mr Bowen co-founded M2 in late 1999. In his nearly 12 years as Managing Director / CEO, he successfully steered M2 from a start-up technology enterprise to become a fast-growing, profitable, ASX
listed, national telecommunications company. With a proven ability to successfully execute and integrate acquisitions, Mr Bowen was appointed Executive Director in October 2011, with a core focus on mergers and acquisitions ('M&A'). In addition to his M&A mandate, Mr Bowen maintains a close, highly effective engagement with the M2 CEO and Executive Leadership team. Mr Bowen is a Director of NIA Limited, Chairman of Aggregato Global Ltd (of which M2 is a substan-tial shareholder) and is Chairman of the Telco Together Foundation, a charitable foundation he created and seeded in 2011. Mr Bowen is a member of the Australian Institute of Company Directors, was named as a finalist in the Entrepreneur of the Year in 2004 and 2009 and in 2012 he received the ACOMMS Communications Ambassador award for outstanding contributions to the Australian telecommunications industry.
Within the last three years, Mr Bowen has held no other listed com-pany directorships.
John HyndNon Executive Director LLB, MAICD
Appointed 18 February 2000
Mr Hynd is a business consultant with Hynd & Co Consultants and was the founding partner of Hynd & Co, a former commercial law firm in Adelaide. He has over 30 years experience in commercial transac-tions, corporate advice, corporate governance, insolvency and prop-erty development. A former member of the Council of the Law Society of South Australia, Mr Hynd’s broad business experience provides M2 with valuable assistance with legal perspectives and strategic planning.
Within the last three years, Mr Hynd has held no other listed company directorships.
Mr Hynd is a member of M2’s Audit & Risk Committee and is also a member of the Nomination and Remuneration Committee.
For
per
sona
l use
onl
y

15
M2 Annual Report 2014 - Director’s Report
Michael SimmonsNon Executive Director BCom, FCPA, ACIS
Appointed 26 November 2009
Mr Simmons brings to the Board considerable experience in the tele-communications sector, having previously held the position of Chief Executive Officer of ASX-listed SP Telemedia Limited ('SPT Group', now known as TPG Telecom Limited) since its listing in 2001. Prior to listing, the SPT Group was a wholly owned subsidiary of the Wash-ington H.Soul Pattinson Limited controlled NBN Television Group. He served in executive roles for nearly 26 years within the SPT/NBN Group of Companies, including as Chief Financial Officer and Chief Executive Officer. Following the acquisition of TPG Telecom Pty Ltd, Mr Simmons left the SPT Group to become the Managing Director of TERRiA, a telecommunications consortium of infrastructure-based telecommunications carriers, formed to bid for the contract to build the National Broadband Network (NBN).
Within the last three years, Mr Simmons has held no other listed com-pany directorships.
Mr Simmons is Chair of M2’s Audit & Risk Committee.
David RampaNon Executive Director B Bus, FAICD
Appointed December 2012
Mr D Rampa held senior Executive positions in both Telstra and Sing-tel Optus, where he was Director of the Wholesale Division, prior to working in Investment Banking in New York. In addition to his direc-torship with M2 Mr Rampa is a non-executive director of Inabox Ltd and Chairman of the advisory board at Aviation Logistics Pty Ltd, a ground and air patient transfer operation; he is also a partner at Hall Capital Strategies Pty Ltd, a Sydney based investment bank. Previously Mr Rampa was Deputy Chairman of the Service Provider Association, and in the United States of America, the President of ANZACC (Australian, New Zealand, and American Chamber of Com-merce) Midwest.
Mr Rampa is Chair of the Nomination and Remuneration Committee.
COMPANY SECRETARY
Ashe-lee JegathesanGeneral Counsel & Company Secretary LLB (Hons), MAICD
Appointed May 2014
Ms Jegathesan joined M2 in May 2014 to lead M2’s Legal and Regu-latory teams. Ms Jegathesan brings to M2 Group more than 20 years’ experience as a practicing lawyer, both in private practice with lead-ing law firms, and in-house particularly in the IT and Telecommuni-cations sector with global companies such as Nortel Networks, 3D Networks, and most recently, Melbourne IT Ltd, where she held the position of General Counsel and Company Secretary.
Ms Jegathesan was the recipient of the Lawyers Weekly 2012 Women in Law ACLA In-House Award. She is a member of the Law Institute of Victoria, the Australian Corporate Lawyers Association and the Australian Institute of Company Directors. Ms Jegathesan holds an honours degree in Law from the Australian National University.
FORMER AUDIT PARTNERSNo directors or officers of M2 have been a partner or director of Ernst & Young ('EY'), the Company’s auditor.
DIRECTORS’ SHAREHOLDINGS The following table sets out the details of each director’s relevant in-terest in M2 shares as at the date of this report. There are no options held by any directors of M2.
Director Holding at 30 June 2014
Craig Farrow 485,444
John Hynd 1,533,000
Vaughan Bowen 5,542,420
Michael Simmonds 11,988
David Rampa 3,500
PRINCIPAL ACTIVITYThe principal activity of the consolidated entity during the financial year was the supply of utilities (telecommunications services, electric-ity and gas) to residential and business customers within the Austra-lian market. M2 is also a reseller of insurance services to residential customers within Australia and telecommunications services to resi-dential and business customers in New Zealand.
REVIEW OF OPERATIONS AND RESULTSPlease refer to the Chairman’s Letter, CEO Review, CFO Commentary and the Business Insights for further details relating to M2’s opera-tions and results for FY14. This information is to be read in conjunc-tion with the Directors’ Report.
SIGNIFICANT CHANGES IN STATE OF AFFAIRSThere were no significant changes in the state of affairs during FY14.
SIGNIFICANT EVENTS AFTER BALANCE DATEOn 22 August 2014, the directors declared a final dividend on ordi-nary shares in respect of FY14. The total amount of the dividend is $26.2 million, which represents a fully franked dividend of 14.5 cents per share (calculated from shares on issue at 30 June 2014). This final dividend is scheduled be paid to shareholders on 30 October 2014.
LIKELY FUTURE DEVELOPMENTS AND RESULTSThe directors expect that the financial performance of the business will remain strong in the financial year ending 30 June 2015 ('FY15'), with confidence in the operational, marketing and sales strength demonstrated in FY14. The directors have released guidance for FY15, with revenue expected to increase by 8-9% and NPAT by between 15-20%.
ENVIRONMENTAL REGULATION AND
PERFORMANCEM2 is not subject to any significant environment regulation under any law of the Commonwealth or of a State or Territory.
For
per
sona
l use
onl
y

16
M2 Annual Report 2014 - Director’s Report
DIVIDENDS Details of dividends paid during FY14 and the final dividend declared for payment are as follows:
Payment Date
Cents per
share
Franking Total Dividend Paid/Declared
Dividends paid
Final Dividend
25 Oct 13 10 100% $17,587,382
Interim Dividend
16 Apr 14 11.5 100% $20,642,674
Total 21.5 $38,230,056
Dividend declared
30 Oct 14 100%
(1) Represents the gross dividend entitlement of all shareholders
SHARE OPTIONS
Options granted
No options were granted during FY14.
Unissued shares under option
At the date of this report, M2 has 1,666,669 unissued ordinary shares under option. The details of these options are as follows:
Number of unissued shares under option
Exercise price of option ($)
Expiry Date of Options
200,000 1.84 1 Jan 2015
166,666 2.99 1 Jan 2015
299,9991 3.14 1 Jan 2016
500,0041 3.29 1 Jan 2017
166,6661 6.19 1 Jan 2017
166,6661 6.47 1 Jan 2018
166,6681 6.75 1 Jan 2019
Total: 1,666,669
(1) Option is only available to exercise subject to the achievement of key performance indicators by the relevant holder in the preceding financial year.
Rights to participate in share issues
Under the terms of the M2 Executive Management Team Share Op-tion Plan, option holders have a right to participate in share issues.
In the event of a bonus issue of shares, option holders will receive a bonus issue of options, such that the proportion which the number of options held by holder bears to the number of shares on issue is the same both prior to and following the bonus issue of Shares.
If there is a pro rata share issue (except a bonus issue) to the holders of shares in the Company before the exercise of options, the exer-cise price applicable to each then outstanding option will be reduced according to a specified formula, which is consistent with the ASX Listing Rules.
Shares issued following exercise of options
M2 issued 404,999 ordinary shares during FY14 as a result of the exercise of an option. The details of these exercised options are as follows:
Number of shares issued
Amount paid for shares
Amount unpaid for shares
205,000 $337,200 Nil
199,999 $627,997 Nil
Total: 404,999 $965,197
INDEMNITIES AND INSURANCEM2’s Constitution provides that to the extent permitted by law and except as may be prohibited by the Corporations Act, each director and secretary of M2 (and its subsidiaries) is indemnified against any liability (other than for legal costs where the indemnity is limited to reasonable legal costs) incurred by that person in the performance of their role.
The directors of M2 are also party to a deed of access and indemnity.
M2 has, during the reporting period (and thereafter) paid premiums to maintain directors’ and officers’ insurance policies for the benefit of M2’s directors, company secretary and other officers, to the extent permitted by the Corporations Act. The terms of the insurance pol-icies prohibit M2 from disclosing the amount of premiums paid and the nature of the liabilities insured against.
AUDITOR INDEMNITYTo the extent permitted by law, the Company has agreed to indemnify its auditors, EY, as part of the terms of its audit engagement agree-ment against claims by third parties arising from or in relation to the audit (for an unspecified amount) unless this claim results from the auditor’s negligence, wrongful or willful acts or omissions. No payment has been made to indemnify EY during or since the financial year.
Ashe-lee Jegathesan, Company Secretary
For
per
sona
l use
onl
y

17
DIRECTORS’ MEETINGS The number of directors’ meetings, including meetings of each Board committee held during FY14 and the number of meetings attended by each director is as follows:
Director Board Meeting Audit & Risk Committee Nomination & Remuneration Committee
Eligible to Attend Attended Eligible to Attend Attended Eligible to Attend Attended
Craig Farrow 16 16 7 7 4 4
Vaughan Bowen 16 15 - - - -
John Hynd 16 14 7 6 4 3
Michael Simmons 16 14 7 7 - -
David Rampa 16 16 - - 4 4
REMUNERATION REPORT Refer to page 18 of this report for the Remuneration Report, which forms part of the directors’ report.
PROCEEDINGS ON BEHALF OF THE COMPANYNo proceedings have been brought on behalf of M2, nor has any application been made in respect of the Company under s.237 of the Corpo-rations Act.
NON-AUDIT SERVICESDetails of amounts paid in FY14 to M2’s external auditor, EY, for non-audit services are set out in the note 33 to the financial statements. The services to the Company largely related to assessment of the business continuation disruption risk, as part of the Company’s business continuity program.
In accordance with written and signed advice from the Audit & Risk Committee, pursuant to a resolution of this Committee, the directors are satisfied that the provision of non-audit services by EY is compatible with the general standards of independence for auditors imposed by the Corporations Act. The reasons being:
• the provision of non-audit services by EY was considered by the directors prior to the commencement of the engagement, and it was deter-mined that it would not impact the independence or integrity of the external auditor; and
• the nature of the services provided do not undermine the general principles relating to external auditor independence, including reviewing and auditing the auditor’s own work, acting in a management or decision making capacity for M2 or as an advocate, or jointly sharing in economic risk and rewards.
Further, the services provided are consistent with the provisions of M2’s Non-Audit Services Policy.
AUDITOR’S INDEPENDENCE DECLARATIONThe auditor’s independence declaration is included on page 29 of this report.
ROUNDING OFF OF AMOUNTSM2 is a company of the kind referred to in ASIC Class Order 98/0100, dated 10 July 1998 and in accordance with that Class Order, amounts in the Directors’ Report and the financial report are rounded off to the nearest thousand dollars, unless otherwise indicated.
This directors’ report is signed in accordance with a resolution of the directors made pursuant to s.298(2) of the Corporations Act.
On behalf of the directors
Craig FarrowChairman Melbourne, 22 August 2014
M2 Annual Report 2014 - Director’s Report
For
per
sona
l use
onl
y

18
Dear Shareholder,
I am pleased to present M2 Group’s remuneration report for 2014 for which we seek your support.
The Nomination and Remuneration Committee ('Committee') is responsible for en-suring that appropriate remuneration principles and structures are established to underpin the company’s performance-driven culture. The Committee has designed M2’s remuneration structure to include a key focus on 'at risk' compensation ensur-ing that there is a direct link between remuneration and performance (Company and individual), and that remuneration is properly aligned with shareholder interests.
Key principles are to ensure that the remuneration framework is transparent, com-petitive, and reasonable, with the understanding that it must successfully attract and retain high calibre executives. We understand that our success will be primarily de-termined by the strength of our leadership, and that an appropriate remuneration structure will assist in creating sustainable shareholder value.
2014 was the first full year of the company’s new Long Term Incentive Program ('LTI') for Executives, which we believe provides a mix of challenge and reward with the goal of focusing executives on the company’s long term sustainable success and further aligning with shareholder interests.
I trust that the company’s remuneration strategy will receive your support. We wel-come your feedback.
Yours sincerely,
David RampaChair - Nomination & Remuneration Committee
M2 Annual Report 2014 - Remuneration Report
REMUNERATION REPORT
For
per
sona
l use
onl
y

19
INTRODUCTIONThis remuneration report for FY14, which forms part of the directors’ report, outlines the remuneration arrangements of the Company in accordance with the requirements of the Corporations Act. The infor-mation in this report has been audited.
The key sections of this report include:
1 Remuneration Snapshot 19
2 Key Management Personnel 19
3 Remuneration Governance 19
3.1 Nomination and Remuneration Committee 19
3.2 Remuneration Consultants 19
3.3 2013 Annual General Meeting 19
3.4 Hedging of Remuneration 19
4 Director Remuneration 19
4.1 Remuneration Policy and Structure 19
4.2 Non-executive Director Fees 20
4.3 Executive Director Remuneration 20
5 Executive Remuneration 20
5.1 Remuneration Policy and Structure 20
5.2 Remuneration Mix 20
5.3 Fixed Remuneration 21
5.4 Short Term Incentive Plan 21
5.5 Long Term Incentive Plans 21
6 Remuneration Outcomes for FY14 23
6.1 M2 Financial Performance 23
6.2 FY14 Remuneration Details 23
6.3 FY14 STI Outcomes 25
6.4 FY14 LTI Outcomes 27
6.5 Employment Agreements 28
7 Related Party Transactions 28
1. REMUNERATION SNAPSHOTM2 performed strongly in FY14, with a 48% increase in EBITDA and a 53% increase in NPAT, delivering a 36% increase in EPS, and 30% increase in dividends.
Remuneration outcomes were reflective of M2’s performance, with the highlights noted below:
• Total fixed remuneration for Executives KMP increased by 11.5% from FY13 to FY14 whilst total remuneration packages overall in-creased by 16.8%
• Executives KMP achieved an average of 86.7% of STI awards for FY13 performance, paid in FY14, and 85.7% for FY14 (to be paid in FY15)
• 216,666 options held by Executive KMP vested in FY14
• The Company granted 116,942 performance rights to Executive KMP under the new Long Term Incentive Plan (LTI)
2. KEY MANAGEMENT PERSONNEL This report sets out the remuneration details of key management personnel ('KMP'), which include those persons with authority and responsibility for planning, directing and controlling the activities of the Company.
M2 has defined its KMP to include directors (executive and non-exec-utive) ('Director') and those executives who drive and are responsible for the principal business activities of the Company ('Executive').
The KMP for M2 during and since the end of FY14 include:
Directors:
Craig Farrow Chairman
Vaughan Bowen Executive Director
M2 Annual Report 2014 - Remuneration Report
John Hynd Non-executive director
Michael Simmons Non-executive director
David Rampa Non-executive director
Executives:
Geoff Horth Chief Executive Officer
Darryl Inns Chief Financial Officer
Scott Carter Business Director
Boris Rozenvasser Consumer Director
3. REMUNERATION GOVERNANCE
3.1 Nomination and Remuneration Committee ('Committee')
The role of the Committee is to assist and advise the Board on mat-ters relating to the appointment and remuneration of directors, Ex-ecutives and where appropriate, other employees of M2. It operates under the provisions of a Charter, a copy of which may be found on M2’s website.
The Committee consists of three independent non-executive direc-tors; David Rampa (Chair since January 2013), Craig Farrow and John Hynd (members).
3.2 Remuneration Consultants
Under the provisions of the Committee’s Charter, the Committee may engage the assistance and advice from external remuneration con-sultants. To ensure that any recommendations made by remuneration consultants are provided without undue influence being exerted by Executives, external remuneration consultants may only deliver their advice direct to members of the Committee.
During FY14, the Committee engaged the services of Guerdon Asso-ciates to benchmark director and executive remuneration, advise on long term incentive performance measures, assist with remuneration disclosure and engagement, and assist with documentation.
Guerdon Associates did not provide any services to Executives or other M2 management. They also did not make a 'remuneration rec-ommendation' in relation to director and executive remuneration as defined in the Corporations Act.
3.3 2013 Annual General Meeting ('AGM')
At the Company’s AGM in October 2013, 99.4% of votes received were in favour of adopting the remuneration report.
3.4 Hedging of Remuneration
In accordance with provisions of the Corporations Act, KMP and their closely related parties are prohibited from hedging any element of their remuneration that is unvested (due to time or other conditions) or is vested but subject to restriction on disposal.
4. DIRECTOR REMUNERATION
4.1 Remuneration Policy and Structure
M2’s non-executive director remuneration policy is to provide fair re-muneration that is sufficient to attract and retain non-executive direc-tors with the experience, knowledge, skills and judgment to steward the Company’s success.
Non-executive directors are paid fees for their services to the Com-pany. The current aggregate maximum sum is $850,000, which was approved by shareholders at the 2012 AGM. Non-executive director fees consist of base fees and fees for membership on board commit-tees, which are inclusive of superannuation contributions. The Chair-man of M2 receives a fee that is inclusive of board committee fees.
Actual fees paid to non-executive directors in FY14 totalled $540,000. The total fees paid are 20% less than the prior period. The difference is explained by the Chairman no longer receiving any incentive pay-ment associated with additional work performed in earlier years of
For
per
sona
l use
onl
y

20
M2’s high growth, offset to an extent by increases in base board and committee fees, and full year fees for an additional director who was only on the board for part of the prior year.
To preserve independence and impartiality, non-executive directors do not receive incentive or performance based remuneration (from Jan-uary 2013), nor are they entitled to retirement or termination benefits.
The level of non-executive director fees is reviewed annually against comparable market data.
Non-executive directors receive reimbursement of expenses incurred while carrying out their director duties. The Board also provides $2,000 each financial year for each director to utilise for the pur-pose of attending training or professional development courses and events. These amounts are not incorporated in the aggregate sum.
4.2 Non-executive Director Fees
The fees for FY14, as compared with FY13, are outlined in the below table. Actual amounts received by non-executive directors are out-lined in section 6.2.
FY14 FY13 %Increase
Chairman $240,000 $210,000 14%
Non-executive Director $80,000 $70,000 14%
Committee Chair $20,000 $10,000 100%
Committee member $10,000 $5,000 100%
The increase in fees from FY13 to FY14 is reflective of the Company’s growth and remains modest in comparison to the fees paid by com-panies of similar size.
4.3 Executive Director Remuneration
The Executive Director receives a mix of fixed and variable remuneration.
The fixed component consists of a cash salary, superannuation and a non-monetary benefit (car parking). The variable component consists of an incentive plan that was put in place in FY13 to reward the Exec-utive Director for his efforts in leading the Primus, and more recently, the Dodo and Eftel transactions.
Identifying and managing merger and acquisition activities is a key mandate for the Executive Director’s role, with the structure of his re-muneration reflective of this. The level of variable remuneration is there-fore proportionately higher, as it has been determined based on the value of the transaction and the financial benefit to M2. The financial benefit has been based on the transaction cost savings achieved by the Executive Director and the improvement in shareholder earnings.
A summary of the Executive Director’s incentive plan is detailed below:
Form of grant Cash payment
Maximum grant of the term $2 million
Frequency of grant Annual
Performance period 1 July 2012 to 30 June 2016
Performance measures/conditions
Payment of the bonus is only made if earnings improvement objectives (in respect of the acquired Primus and Dodo/Eftel businesses) are achieved.
This performance condition is considered to be appropriate as it is a direct measure of the perfor-mance of the acquired businesses, and earnings improvement drives increases to shareholder returns.
Termination Upon termination, the Executive Director shall be entitled to a pro-rata amount up until the end of the relevant financial year, subject to satisfying the performance condition
Change of Control Upon a change of control, the Exec-utive Director shall be entitled to a pro-rata amount, subject to satisfy-ing the performance condition
Discretion The board (excluding the executive director) retains discretion to vary incentive payment from this policy. However, full disclosure will be made in the event that discretion has been applied.
For FY14 performance, the Executive Director is entitled to an incen-tive payment of $650,000, as 100% of the earnings objectives for the Primus and Dodo/Eftel transactions were achieved. $500,000 of this incentive was paid during FY14, with the remaining $150,000 to be paid in September 2014.
5. EXECUTIVE REMUNERATION
5.1 Remuneration Policy and Structure
Executive remuneration consists of fixed remuneration and variable remuneration.
Fixed remuneration is comprised of cash salary, superannuation and other non-monetary benefits (including motor vehicles and car park-ing and in some circumstances relocation expenses). The levels are set to attract and retain qualified, skilled and experienced executives and are determined based on comparable market data.
Variable (or 'at risk') remuneration is comprised of a short term in-centive ('STI'), and a long term incentive ('LTI'). Incentives are set to reward Executives for achievement of financial, operational and stra-tegic objectives, and are designed to align Executive performance with shareholder returns.
From time to time, the Company may also agree to offer other forms of incentive remuneration to Executives, where the circumstances re-quire this. For example, the Consumer Director was entitled to, and received, a retention bonus on completion of 12 months service with M2 (period expired 1 May 2014) to ensure management stability and successful integration of the Dodo acquisition, in accordance with the terms of his employment agreement.
The Nomination & Remuneration Committee conducted a review of Executive remuneration in relation to a comparator group of ASX-list-ed companies of comparable operational scope and size to M2 in May 2013. This review indicated that adjustments were required to ensure M2 Executive remuneration approaches the market median, and these are outlined in sections 5.2, 5.3, 5.4 and 5.5. The Commit-tee will continue to monitor the remuneration structure to ensure it remains effective in retaining and motivating the team that has to date been very successful in building shareholder value.
5.2 Remuneration Mix
Variable remuneration for Executive KMP (other than the CEO) is gen-erally structured on the principle of 30% STI and 30% LTI calculated on base salary. The CEO’s variable remuneration is structured on the principle of 45% STI and 45% LTI calculated on base salary. The mix of fixed and variable remuneration varies between Executives, and is determined based on the extent to which they are in a position to directly influence Company performance.
M2 Annual Report 2014 - Renumeration ReportF
or p
erso
nal u
se o
nly

21
For example:
(1) STI calculated based on the maximum award that may be achieved, payment of which is subject to performance.(2) LTI calculated based on the grant and exercise value (as determined by AASB)
5.3 Fixed remuneration
The review by the Nomination & Remuneration Committee resulted in the fixed remuneration for the CEO, in particular, being increased to a position closer to the median of the market, along with revised LTI opportunities under the new performance rights plan. For FY14, fixed remuneration for the CEO was increased by 19%, for the CFO by 14% and for the Business Director by 8%.
5.4 Short Term Incentive Plan ('STI Plan')
The key features of M2’s STI Plan are outlined below.
Form of grant Cash payment
Frequency of grant Annual, following a determination of the Company and Executive performance for the relevant financial year
Vesting and performance period
12 months
Maximum award • Each Executive may earn up to a pre-de-termined fixed amount. The Board may choose to pay more than the maximum available, depending upon the circum-stances.
• The maximum award varies between Ex-ecutives and is dependent upon role and responsibilities
Profit gateway for maximum STI
• A pre-determined NPAT objective must be achieved before the full STI awards are paid to Executives
• If the NPAT objective is not achieved, Ex-ecutives are only entitled to a maximum of 50% of their STI award
Performance condi-tion and measures
• The STI award paid depends on the ex-tent to which Executives meet pre-deter-mined targets, which are expressed as key performance indicators (‘KPIs’)
• The KPIs are set following finalisation of the Company’s budget and strategic ob-jectives for the new financial year
• Individual KPIs cover both financial and non-financial performance measures, the mix of which varies between the Ex-ecutives depending upon their role and responsibilities.
Performance condi-tion and measures (continued)
KPIs include:
• Divisional earnings targets
• Divisional net growth objectives
• Management of functional expenses budget
• Debtor targets
• Customer service objectives
• Earnings improvement objectives
• Completion of specific projects or initia-tives
• Each KPI operates independently and is expressed as a percentage of the total available maximum STI
• The CEO’s STI award is in part de-termined according to the overall KPI achievement of the Executives, recognis-ing that the CEO’s primary task is to pro-vide leadership and direction to the Ex-ecutives to maximise their performance.
The above performance measures have been chosen by the Board as they are rep-resentative of the Company’s performance objectives which will drive shareholder value.
Performance Assessment
• Executive performance is assessed fol-lowing the determination of Company an-nual results for the preceding financial year
• Performance assessment takes the form of a traditional performance review, whereby the Executive is provided with a ‘rating’ based on the achievement of their objectives. This rating is determined by the CEO and Chairman, considered by the Nomination & Remuneration Com-mittee and approved by the Board.
• This traditional method of assessing Ex-ecutive performance ensures that an STI award is based upon the actual achieve-ment of objectives
Termination Executives who cease employment prior to the end of a financial year are not usually entitled to an STI award, however payment may be made at the discretion of the CEO and Board
The STI outcomes for FY14 are detailed in section 6.3 of this report.
Overall, Executives achieved an average of 85.7% for performance during FY14 based on performance against KPIs. This was a strong performance and reflective of M2’s business results and success over that period.
The STI plan as outlined above will apply in FY15.
5.5 Long Term Incentive Plans ('LTI Plan')
The Board introduced a new LTI Plan from 1 July 2013, as outlined in our 2013 Annual Report. The first grant of performance rights under the LTI Plan was made in September 2013. The LTI plan continues to operate, with further grants of performance rights to executives to be made in 2014.
Base Salary
LTI
STI
M2 Annual Report 2014 - Remuneration Report
For
per
sona
l use
onl
y

22
The key driver for the LTI Plan was to provide a variable remuneration component that was competitive, aligned to shareholder returns over a longer period, and also on terms that were acceptable to Australian investors, based on market standards. It has also been structured to appro-priately incentivise Executives and promote retention.
The key features of the LTI Plan are outlined below:
Form of Grant • Performance rights that can be settled in cash or M2 shares
• Executives are not required to pay for the performance rights
Frequency of grant Annual
Vesting date Upon expiry of the Performance Period
Performance period 3 year period from 1 July in the year of grant to 30 June at the end of the period
Performance measures and weighting • 50% Relative Total Shareholder Return ('RTSR')
• 50% EPS Growth
Performance hurdles • RTSR growth threshold: Index + 3%
• RTSR growth target: Index + 5%
• RTSR growth target: Index + 7%
• EPS Growth with a defined threshold and maximum performance requirement (full disclosure in the year of vesting in accord with company policy not to provide guidance)
Vesting scale Zero at threshold, 100% at maximum, straight line pro rata between threshold and maximum
Terminating Executives
If a good leaver, vesting will be on pro-rata basis at the discretion of the Board
Change of control Vesting on pro-rata basis at discretion of the Board
The RTSR test applying to half of the performance rights granted to Executives measures M2’s total shareholder return performance (share price growth plus dividends) relative to movements in the S&P/ASX 200 and S&P/ASX 200 Telecommunications Services indices over the three year performance period, with 50% of the RTSR-tested performance rights (i.e. 25% of the total number of performance rights in the grant) assessed against each index.
The Board believes this RTSR test is an appropriate performance measure because it provides a reward when the Company’s shareholder return exceeds investment returns for the market as a whole and/or for peers in its industry.
The EPS Growth test applying to the second half of the performance rights granted to Executives assesses the growth in M2’s earnings per share over the three-year performance period. Full disclosure of the performance requirements will be provided in the year of vesting in accord with company policy not to provide guidance over this period.
The Board believes this is an appropriate performance measure as EPS is directly related to shareholder returns and is consistent with the per-formance objectives set for Executives.
M2 Annual Report 2014 - Renumeration ReportF
or p
erso
nal u
se o
nly

23
6. REMUNERATION OUTCOMES FOR FY14This section provides a summary of the key financial results for M2 over the last five financial years, and also how those results have been reflected in KMP remuneration for FY14.
6.1 M2 Financial Performance
The table below sets out M2’s earnings and movements in shareholder wealth over the last five years:
FY14 FY13 FY12 FY11 FY10
Revenue $1,024.4 million $681.0 million $393.5 million $426.8 million $406.11 million
EBITDA $160.1 million $108.1 million $60.1 million $48.3 million $31.41 million
NPAT $67.1 million $43.8 million $33.0 million $27.6 million $16.6 million
NPAT Growth 53% 33% 20% 72% 119%
Share price1 $5.78 $6.02 $3.36 $3.28 $1.69
EPS 37.4 cents 27.4 cents 25.9 cents 22.6 cents 14.57 cents
EPS Growth 36% 6% 15% 56% 66%
Interim dividend 11.5 cents 10 cents 9 cents 7 cents 5 cents
Final dividend 14.5 cents 10 cents 9 cents 9 cents 5 cents
(1) Share price at 30 June of relevant year
6.2 FY14 Remuneration Details
The tables in this section detail the remuneration received by KMP during FY14. This information is disclosed in accordance with the Corporations Act and the Australian Accounting Standards.
Directors
The fees and remuneration received by non-executive directors in FY14 are set out below, including a comparison with FY13. This table also includes the amounts received by the Executive Director.
Year Salary & Fees
Cash STI(1)
Performance related% (2,3)
Non- monetary
benefits
Post Employment
Benefit (2)
Super- annuation
Other long term
benefits
Accrued Long Ser-
vice Leave(2)
Total Remuneration
$ $ % $ $ $ $
Craig Farrow Chairman
2014 2013
240,000 210,000
- 255,000
- 54.8
- -
- -
- -
240,000 465,000
Vaughan Bowen Executive Director
2014 2013
250,000 250,000
800,000 255,000
71.3 44.7
8,165 8,184
25,000 25,000
39,054 32,803
1,122,219 570,987
John Hynd Non-executive Director
2014 2013
100,000 80,000
- -
- -
- -
- -
- -
100,000 80,000
Michael Simmons Non-executive Director
2014 2013
100,000 80,000
- -
- -
- -
- -
- -
100,000 80,000
David Rampa Non-executive Director
2014 2013
100,000 40,000
- -
- -
- -
- -
- -
100,000 40,000
Total 2014 2013
790,000 660,000
800,000 510,000
- -
8,165 8,184
25,000 25,000
39,054 32,803
1,662,219 1,235,987
(1) No additional short term, long term or post-employment benefits were provided other than those set out above(2) Calculated based upon the value of the cash STI against total remuneration receive(3) From 1 July 2014, no share or performance based remuneration is payable to any non-executive director
M2 Annual Report 2014 - Remuneration Report
For
per
sona
l use
onl
y

24
The remuneration received by Executives in FY14 is set out below, including a comparison with FY13.
Executives
Short-Term Post Employment
Other long term
benefits
Share based payment
Total Remuneration
Base Salary STI(1, 2) Non- monetary
benefits
Superannuation Accrued Long Service
Leave
Value ascribed to
options & performace
rights(3)
$ $ $ $ $ $ $
Geoff Horth CEO
2014 2013
775,000 650,000
175,000 85,000
32,461 82,479
25,000 25,000
67,345 45,649
171,659 117,359
1,246,465 1,005,487
Darryl Inns CFO
2014 2013
400,000 350,000
90,000 43,013
17,165 22,087
25,000 25,000
6,964 79,461
33,863 40,399
572,992 559,960
Scott Carter Business Director
2014 2013
400,000 370,000
117,000 90,000
28,165 8,184
25,000 25,000
21,499 12,946
51,996 78,388
643,660 584,518
Boris Rozenvasser(4) Consumer Director
2014 2013
320,000 53,333
100,000 -
8,165 870
25,000 4,166
53,354 48,021
107,269 14,249
548,294 120,639
Totals 2014 2013
1,895,000 1,423,333
482,000 218,013
85,956 113,620
100,000 79,166
149,162 186,077
364,787 250,395
3,076,904 2,270,604
(1) STI paid during FY14 for FY13 performance(2) STI paid for Mr Boris Rozenvasser was a retention bonus agreed on the acquisition of Dodo(3) Calculation is the amortisation expense for options and performance rights(4) Boris Rozenvasser was appointed on 1 May 2013
Fixed remuneration for the CEO, CFO and Business Director were increased to reflect a position closer to the median of the market, following a review against a comparator group of ASX-listed companies of comparable operational scope and size to M2 in May 2013 (as outlined above in this report).
Performance rights holdings of key management personnel
30 June 2014 Balance at 1 July 2013
Granted as remuneration
Rights exercised
Rights Forfeited /Expired
Balance at 30 June 2014
Directors
Craig Farrow - - - - -
Vaughan Bowen - - - - -
John Hynd - - - - -
Michael Simmons - - - - -
David Rampa - - - - -
Executives
Geoff Horth - 50,645 - - 50,645
Darryl Inns - 22,099 - - 22,099
Scott Carter - 22,099 - - 22,099
Boris Rozenvasser - 22,099 - - 22,099
Total - 116,942 - - 116,942
M2 Annual Report 2014 - Renumeration ReportF
or p
erso
nal u
se o
nly

25
Option holdings of key management personnel
30 June 2014 Balance at 1 July 2013
Granted as remuneration
Options exercised
Options Forfeit-ed /Expired
Balance at 30 June 2014
Directors
Craig Farrow - - - - -
Vaughan Bowen - - - - -
John Hynd - - - - -
Michael Simmons - - - - -
David Rampa - - - - -
Executives
Geoff Horth 625,000 - (75,000) - 550,000
Darryl Inns 66,667 - (33,333) - 33,334
Scott Carter 166,667 - - - 166,667
Boris Rozenvasser 250,000 - - - 250,000
Total 1,108,334 - (108,333) - 1,000,001
Shareholdings of key management personnel
30 June 2014 Balance at 1 July 2013
Granted as remuneration
On exercise of options
Net change
Balance at 30 June 2014
Directors
Craig Farrow 515,444 - - (30,000) 485,444
Vaughan Bowen 5,042,420 - - 500,000 5,542,420
John Hynd 1,533,000 - - - 1,533,000
Michael Simmons 11,988 - - - 11,988
David Rampa - - - 3,500 3,500
Executives
Geoff Horth 55,625 - 75,000 15,000 70,625
Darryl Inns 292,083 - 33,333 (50,417) 241,666
Scott Carter 83,333 - - - 83,333
Boris Rozenvasser - - - - -
Total 7,533,893 - 108,333 438,083 7,971,976
6.3 STI Outcomes
Key Performance Indicators are set at the commencement of each Financial Year, and are objective and measurable.
Following a review of performance for FY14, the below outcomes were achieved by the Company, and each Executive.
Achievement of KPIs
The maximum STI amount for each Executive is only available upon M2 achieving its NPAT objective in the relevant financial year.
This was achieved in FY14, and as such, the maximum STI was available to Executives.
Measure Guidance Achieved % Achieved
NPAT Between $60M and $70M $67.1M 100%
M2 Annual Report 2014 - Remuneration Report
For
per
sona
l use
onl
y

26
The performance of each Executive against Key Performance Indicators is set out below:
Measure Guidance Achieved % Achieved
Darryl Inns Functional costs to budget 20 20
Debtor days 20 10
Cost and capex management and synergy realisation
40 30
Other – project specific 20 20
TOTAL 100 80
Scott Carter Division earnings 30 30
Division net sales 20 12
Other 50 45
TOTAL 100 87
Boris Rozenvasser Division earnings 30 18
Division net sales 30 30
Other 40 40
TOTAL 100 88
CEO KPIs
KPI % % Achieved
Effectively managing the performance of the Executive Team against their KPIs 30 25
Development of a 3 year Strategic Business Plan 30 30
Facilitate the renegotiation of terms and tenure of core supplier agreements 20 20
Other project specific KPI’s 20 13
Total 88
STI awards
The table below summarises the percentage that was earned by Executives for FY14 performance and the percentage that was forfeited, in ad-dition to the actual STI, which will be paid:
Executive STI FY14 Award %
STI FY14 Forfeited %
Actual STI to be paid $
Geoff Horth 88 12 198,000
Darryl Inns 80 20 80,000
Scott Carter 87 13 130,500
Boris Rozenvasser 88 12 105,600
Average 85.7
LTI Plan
The table below sets out a summary of the performance rights that were granted to Executives during FY14, including the vesting dates. Details of the performance hurdles for vesting are set out above in item 5.5.
Executive Number of Performance Rights granted FY 14
Performance Period Vesting Date
Geoff Horth 50,645 1 July 2013 to 30 June 2016 1 July 2016
Darryl Inns 22,099 1 July 2013 to 30 June 2016 1 July 2016
Scott Carter 22,099 1 July 2013 to 30 June 2016 1 July 2016
Boris Rozenvasser 22,099 1 July 2013 to 30 June 2016 1 July 2016
M2 Annual Report 2014 - Renumeration ReportF
or p
erso
nal u
se o
nly

27
6.4 Prior year legacy Executive Management Team Share Option Plan in operation
M2 operated an Executive Management Team Share Option Plan ('ESOP') between 2006 and 2012, whereby options for M2 shares were granted to individuals at a pre-determined exercise price.
The purpose of the ESOP was to reward Executives for individual and Company performance and provide a further avenue for the alignment of Executive objectives with those of shareholders.
No options have been granted under this plan since May 2013.
The following table outlines the major features of the ESOP:
Form of Grant Options to buy M2 shares
Grant frequency At the discretion of the Board
Vesting periods Options have been granted in 3 equal tranches, vesting 1 to 4 years from date of grant
Performance period Options have been granted in 3 equal tranches, vesting 1 to 4 years from date of grant
Performance conditions • The options have been 'premium priced options', i.e the exercise price has been higher than the M2 share price at grant date. The exercise price has been set higher for each successive tranche.
• For options granted post 2011, options may only be exercised subject to the minimum achieve-ment (60%) of the Executive’s STI KPIs in the financial year immediately prior to the relevant vesting date for each tranche.
• The Executive must remain in employment with M2 at the vesting date to be able to exercise the options, subject to the terms of the ESOP, and at the Company’s discretion.
Termination Under the terms of the ESOP, cessation of employment affects the Executives’ rights to exercise options. The effect depends on the manner in which the employment was terminated, and is at the Company’s discretion.
Change of control Under the terms of the ESOP, in a change of control situation, the Company has the discretion to determine the time or event upon which all outstanding options will become exercisable, and the time or event which all outstanding options will lapse
Legacy share option plan outcomes
The table below sets out a summary of the options that were held, vested and exercised by Executives during FY14, including those which have not yet vested at the date of this report. No options were granted in FY14.
Executive Total Op-tions under ESOP held
as at 30 June 2014
Exercise Price range
Expiry Date range
Number of options vested
FY14
Number of Options Exercised
FY14
Amount Paid Value of options
exercised $
Granted Jan 2010
Geoff Horth - $1.84 1 Jan 2015 - 75,000 $138,000 $468,000
Granted Dec 2011
Geoff Horth 300,000 $2.99-$3.29 1 Jan 2015 to 1 Jan 2017
100,000 - - -
Scott Carter 166,667 $2.99-$3.29 1 Jan 2016 to 1 Jan 2017
83,333 - - -
Darryl Inns 33,334 $2.99-$3.29 1 Jan 2017 33,333 33,333 $104,666 $203,331
Granted May 2013(1)
Geoff Horth 250,000 $6.19-$6.75 1 Jan 2017 to 1 Jan 2019
- - - -
Boris Rozenvasser 250,000 $6.19-$6.75 1 Jan 2017 to 1 Jan 2019
- - - -
(1) These options were granted to the CEO and Consumer Director following the completion of the Dodo acquisition and formed part of the negotiations during the sale process. The Board felt that this was the most appropriate method to ensure the smooth integration of this business into the wider M2 Group and to provide an incentive to realise the value from the acquisition. It further promotes teamwork across the Executive team (with other Executives being granted options on similar terms previously) and assists with the retention of key leaders).
M2 Annual Report 2014 - Remuneration Report
For
per
sona
l use
onl
y

28
6.5 Employment Agreements
The following key terms are contained in employment agreements for the Executive Director, CEO and other Executives:
Duration of agreement: Executive Director From 1 July 2013 for no fixed term
Chief Executive Officer From 1 July 2012 for no fixed term
Chief Financial Officer and Business Director
From 1 July 2011 for no fixed term
Consumer Director From 1 May 2013 for no fixed term
Period of notice required to terminate agreement (by the relevant KMP):
All Three months
Termination payments: Executive Director Upon termination for convenience by the Company, the Executive Director shall be entitled to an amount equal to what he would be entitled to as per relevant legislation.
Chief Executive Officer Upon termination for convenience by the Company the CEO shall be entitled to six months base salary (inclusive of a notice period).
Upon termination (for any reason excluding just cause) within 12 months of a change of control event, the CEO shall be entitled to a payment equal to 12 months base salary (and superannuation), inclusive of a notice period.
Other Executives Upon termination for convenience by the Company, the Executive shall be entitled to six months base salary (inclusive of notice period)
7. RELATED PARTY TRANSACTIONSThe following table summarises the total amount of transactions that were entered during 2014.
Directors Related party transactions
Craig Farrow Telecommunications services totalling $17,000 were provided to Brentnalls SA and Petcraky Pty Ltd. Mr Farrow is a director of both companies.
John Hynd Telecommunications services totalling $1,000 were provided to Hynd & Co Pty Ltd. Mr Hynd is a director of the firm Hynd & Co Pty Ltd.
Michael Simmons Telecommunications services totalling $2,000 were provided to Luab Pty Ltd. Mr Simmons is a director of Luab Pty Ltd.Telecommunications and Insurances services were also provided for Michael Simmons’s personal use.
M2 Annual Report 2014 - Renumeration ReportF
or p
erso
nal u
se o
nly

29
For
per
sona
l use
onl
y

30
M2 Annual Report 2014 - Corporate Governance Statement
CORPORATE GOVERNANCE
STATEMENT
M2 is committed to a sound corporate governance framework. We believe in transparency, accountability and integrity for the benefit of our shareholders, team members, customers and all other interested stakeholders.
Our corporate governance policies and charters are reviewed regu-larly to ensure these objectives continue to be met.
For FY14, M2’s corporate governance structure and principles were consistent with the ASX Corporate Governance Council’s Corporate Governance Principles and Recommendations ('ASX Recommenda-tions'). A summary of these arrangements is set out below. Consistent with the requirements of the ASX Listing Rules, to the extent of any inconsistency with the ASX Recommendations, these items are ad-dressed on an 'if not, why not' basis.
PRINCIPLE 1: LAY SOLID FOUNDATIONS FOR
MANAGEMENT AND OVERSIGHTThe Board has adopted a formal Board Charter that details the func-tions and responsibilities of the Board. Broadly, the Board is respon-sible for the strategic management and affairs of M2 for the benefit of the shareholders and other stakeholders. The Board delegates the responsibility for the development and implementation of M2’s strat-egy, and for the overall day-to-day management and operation of the Company, to the Chief Executive Officer and Executive Management Team. This delegation is effected through a formal delegation struc-ture from the Board and the Chief Executive Officer to the Execu-tive Management Team and other team members. This structure is regularly reviewed to ensure an appropriate division of functions and responsibilities to meet M2’s needs. In addition, M2 has also adopted formal charters to document the roles, responsibilities and obliga-tions of the executive team and the senior leadership team.
Individual directors receive a formal letter of appointment setting out the key terms and conditions of their engagement as a member of the Board. Similarly, each Executive’s employment contract includes a description of their duties, rights, responsibilities and key account-abilities, as well as their term of office and entitlements on termination.
The performance of the Board is regularly evaluated, both formally and informally. The performance of the Chief Executive Officer and the Executive Management Team is reviewed regularly, both formal-ly and informally, against measurable and qualitative metrics, which are aligned to M2’s financial and non-financial objectives. Details of the performance evaluation process are set out in the Remuneration Report. During FY14, the performance of executives was reviewed in accordance with that process.
Senior executives who join the Company undertake a tailored induc-tion program to provide them with an appropriate understanding of the Company and its financial position, strategy and operations as well as its governance structure and risk management framework and policies, and to enable them to participate fully and actively in the management of the company at the earliest opportunity.
In FY14 the Board approved an updated Board Charter, a copy of which is available on the company’s website (www.m2.com.au).
PRINCIPLE 2: STRUCTURE THE BOARD TO ADD
VALUEThe M2 Board consists of five directors, of which four are non-ex-ecutive directors. The qualifications of the current Board members are available on M2’s website and in the Directors’ Report contained within this Annual Report.
For the FY14 period, the four non-executive directors (Craig Farrow, David Rampa, John Hynd and Michael Simmons) were considered by the Board (applying the criteria set out in the ASX Recommenda-tions) to be independent. The Board regularly assesses the indepen-dent status of the directors and intends to continue to ensure that the majority of the non-executive directors continue to be indepen-dent directors, including by appointing new or additional independent non-executive directors in the future. Should a change in the status of any director occur, M2 intends to make timely disclosure and ex-planation to the ASX.
Vaughan Bowen is an executive director and a former substantial share-holder in M2, and accordingly is not considered to be independent.
The Chairman, Craig Farrow, is an independent, non-executive direc-tor. M2’s Chief Executive Officer is Geoff Horth, who is not a member of the Board.
The Board has established a Nomination and Remuneration Commit-tee (N&R Committee) and an Audit & Risk (A&R Committee) to support the Board in carrying out its overall responsibilities.
The N&R Committee consists of three independent, non-executive di-rectors David Rampa, Chair, Craig Farrow and John Hynd, who meet at least four times a year. The N&R Committee has adopted a formal Charter, which sets out its roles and responsibilities.
The process for recommending the selection, appointment and re-ap-pointment of directors to the Board is outlined in the Board Selection Policy. The N&R Committee aims to achieve a mix of diversity (gender and otherwise) and skills appropriate for M2’s size and industry. The Board and N&R Committee pay high regard to business skills that enable an appropriate understanding of M2’s current telecommuni-cations and energy businesses, and all Board members are expected to have sufficient financial literacy to effectively perform their roles.
The process for evaluating the performance of the Board, its Com-mittees and individual directors is established and maintained by the N&R Committee. This process is conducted regularly and was under-taken in FY14.
The Board is provided with information it requires to discharge its duties effectively. In addition to regular reports prepared by the Ex-ecutives being tabled for consideration and discussion by the Board, executives regularly attend meetings of the Board to provide updates on matters, and directors have access to the Executive Management
For
per
sona
l use
onl
y

31
Team to obtain any information they consider necessary. Where necessary, directors are also able to seek independent profes-sional advice to assist them in properly exercising their role, at M2’s expense.
The Directors may also seek assistance from the Company Secretary when required. The Company Secretary is accountable to the Board, through the Chair, on all governance matters, and has an internal reporting line to the CEO.
A copy of the Board Selection Policy and N&R Committee Charter is available on the Company’s website.
PRINCIPLE 3: PROMOTE ETHICAL AND RESPONSIBLE DECISION MAKINGM2 has established a number of policies, including a Code of Conduct, a Whistleblower policy and a Securities Trading Policy, to maintain integrity and confidence in M2 and appropriately safeguard the reasonable expectations of M2’s stakeholders. Each officer, team member and contractor of M2 is expected to comply with the policies (to the extent they are applicable to them) and report any unethical practices of which they become aware.
M2 recognises the value in fostering team member and board diversity in respect of gender, age, ethnicity and culture. M2’s policy for team member diversity is incorporated in its various HR policies, including the Diversity Policy and Equal Opportunity policy.
M2’s measurable objectives for achieving gender diversity:
Objective Target Date
Board: At least one of the next two director appointments desirably should be female, with appropriate skills and attributes
31 December 2014
Executive Team and Senior Leaders: To improve or at least maintain current male/female ratio statistics.
Annually
The table below sets out the number of females appointed or employed by M2, as at 15 July 2014 (in comparison to FY13):
Role 15 July 2014 August 2013 % Change
Number (%) Number (%)
Board 0 0 0 0 0
Executive 2 25 1 14.3 +3
Team Members / Contractors* 244 29 362 32 -1
*Includes full-time and part-time permanent roles, casual roles and contractors
M2 notes that the reduction in proportion of female participation in the organisation is due to a reduction in the total number of overall team members following recent business restructures. M2 is committed to reviewing its policies and practices to identify ways in which an increased participation of females in the organisation can be facilitated.
M2’s Code of Conduct, Whistleblower Policy, Securities Trading Policy and Diversity Policy are available on M2’s corporate website.
PRINCIPLE 4: SAFEGUARD INTEGRITY IN FINANCIAL REPORTINGM2 is committed to safeguarding the integrity of its financial reporting, and has established a structure of review and authorisation to ensure that reports on M2’s financial position are presented factually and accurately.
M2’s Audit and Risk Committee consists of three independent non-executive directors (Michael Simmons, Craig Farrow and John Hynd), and is chaired by Michael Simmons.
Each member of the A&R Committee has appropriate financial literacy and a sound understanding of the industry in which M2 operates. The qualifications of the members of the A&R Committee are set out on M2’s website.
The A&R Committee has adopted a formal charter, which sets out its roles and responsibilities, structure, membership require-ments, and the procedures it adopts in performing its role.
The A&R Committee meets at least seven times a year. The Chief Executive Officer, the Chief Financial Officer and M2’s internal auditor attend the meetings at the invitation of the Committee. The A&R Committee reports to the Board on its activities at the next full Board meeting following each A&R Committee meeting. M2’s external auditors also attend by invitation from time to time, and on at least one occasion each year, attend without management being present.
A copy of the A&R Committee Charter is available on the Company’s website.
M2 Annual Report 2014 - Corporate Governance Statement
For
per
sona
l use
onl
y

32
PRINCIPLE 5: MAKE TIMELY AND BALANCED
DISCLOSUREM2 is committed to making timely and balanced disclosures to the market to ensure the integrity of the market and M2’s compliance with its disclosure obligations under the Listing Rules and the Cor-porations Law.
M2 has established a Continuous Disclosure and Communications Policy which set outs the framework through which M2 ensures that its obligations to make timely disclosures on all relevant matters are met. The Executive Team considers its disclosure obligations on a regular basis. The policy also sets out the framework for external communications such as analyst briefings and responding to share-holder queries, as well as for safeguarding the confidentiality of cor-porate information.
Accountability for the Continuous Disclosure and Communications Policy rests at all levels of M2. All team members are expected to no-tify the Company Secretary if they become aware of any information which may be required to be disclosed to the ASX and the Company Secretary has the obligation to bring that information to the attention of the Chief Executive Officer and Chairman of the Board.
A summary of the Continuous Disclosure and Communications Policy is available on M2’s website.
PRINCIPLE 6: RESPECT THE RIGHTS OF
SHAREHOLDERSM2 seeks to ensure that its shareholders are able to easily access relevant information relating to M2, through a variety of means, in-cluding:
• ASX announcements in respect of annual and half year results, and on other occasions when M2 is aware of information that needs to be disclosed to the market;
• Analyst, media and shareholder briefings on annual and half year results, and on other occasions as required;
• M2’s corporate website;
• The option to subscribe to major announcements from the Company;
• A dedicated investor email address to contact the Company;
• M2’s Annual Report; and,
• M2’s Annual General Meeting including a Notice of Meeting and Explanatory Memorandum.
M2’s Continuous Disclosure and Communications Policy sets out M2’s policy on communicating with shareholders.
PRINCIPLE 7: RECOGNISE AND MANAGE RISKThe Board of M2 considers that the development of a risk mature culture is integral for the proper identification and management of M2’s strategic and operational risks. M2’s risk management policy sets out the framework for the identification, assessment, monitoring and management of M2’s material business risks.
The A&R Committee has oversight of the overall risk management policy and framework, and regularly reports to the Board on risk management. The A&R Committee has established a sub-committee (Wholesale Energy Risk Management Committee) to have oversight of specific risks relating to M2’s energy business.
The A&R Committee considers risk management and audit matters separately. In relation to risk management, the A&R Committee, and the Board, receive regular reports from the Executive Team, identi-fying M2’s material business risks and the effective management of those material risks. The A&R Committee also regularly receives re-ports from the internal audit function to the A&R Committee and re-ports to the Board in relation to these reports.
Recommendation 7.3 requires the Chief Executive Officer and the Chief Financial Officer to confirm that the declaration provided by them to the Board in accordance with section 295A of the Corpora-tions Act 2001 (Cth) was based on a sound system of risk manage-ment and internal controls and those systems and controls operate effectively in all material respects. This assurance was provided by the Chief Executive Officer and Chief Financial Officer to the Board for FY14.
PRINCIPLE 8: REMUNERATE FAIRLY AND
RESPONSIBLYM2’s N&R Committee assists the Board with its responsibilities in this area. The N&R Committee reports to the Board on its activities at the next full Board meeting following each N&R Committee meeting.
M2’s remuneration policy is aimed at ensuring that each individual’s remuneration reflects their accountabilities, responsibilities, duties and level of performance, and to ensure that remuneration is competitive in attracting, motivating and retaining staff of the highest quality. Remu-neration arrangements are reviewed annually.
Remuneration for the CEO, the executive director and other execu-tives consist of fixed salary, a short term incentive and a long term incentive.
Non-executive directors receive fixed fees for their services and are not entitled to receive any variable or incentive-based compensation. The Chairman of each Committee receives an additional amount to reflect the additional workload and responsibilities required of them. Non-executive directors are not entitled to retirement or termination benefits
Remuneration arrangements for the directors and key management personnel are described within the Remuneration Report.
M2 Annual Report 2014 - Corporate Governance Statement
For
per
sona
l use
onl
y

33
For
per
sona
l use
onl
y

34
FINANCIAL
STATEMENTS
Consolidated Income Statement 35Consolidated Statement of Comprehensive Income 36Consolidated Statement of Financial Position 37Consolidated Statement of Changes In Equity 38Consolidated Statement of Cash Flows 39 Notes to the Consolidated Financial Statements 40 1 Corporate Information 40 2 Summary of Accounting Policies 40 3 Financial Risk Management Objectives and Policies 50 4 Significant Accounting Judgements, Estimates and Assumptions 56 5 Operating Segments 58 6 Revenue and Expenses 60 7 Income Tax 61 8 Dividends Paid and Proposed 63 9 Earnings Per Share 64 10 Cash and Cash Equivalents 65 11 Trade Receivables 66 12 Inventories 67 13 Other Assets 67 14 Financial Assets and Liabilities 68 15 Investment in an Associate 69 16 Plant and Equipment 70 17 Intangible Assets and Goodwill 70 18 Trade and Other Payables 72 19 Provisions 73 20 Interest-Bearing Loans and Borrowings 74 21 Other Non-Current Liabilities 74 22 Contributed Equity 75 23 Reserves 76 24 Related Party Disclosure 77 25 Key Management Personnel 79 26 Share Based Payment Plans 80 27 Business Combinations 82 28 Commitments 84 29 Contingencies 84 30 Deficiency in Net Current Position 84 31 Events After Balance Sheet Date 85 32 Parent Entity Information 85 33 Auditor’s Remuneration 85For
per
sona
l use
onl
y

35
CONSOLIDATED INCOME STATEMENT FOR THE YEAR ENDED 30 JUNE 2014
Note 2014 $000
2013 $000
Revenue 6(a) 1,024,381 681,039
Cost of sales (651,904) (422,408)
Gross profit 372,477 258,631
Other income 6(b) (19) 2,989
Employee benefits expense 6(c) (90,488) (82,440)
Depreciation and amortisation 6(d) (46,425) (31,336)
Share based payments 26(a) (631) (563)
Other expenses 6(e) (122,021) (70,661)
Financing costs 6(f) (19,034) (11,739)
Share of profit of an associate 15 782 164
Profit before income tax 94,641 65,045
Income tax expense 7(a) (27,579) (21,267)
Profit for the year 67,062 43,778
Profit for the year attributable to:
• Non-controlling interests 99 (274)
• Owners of the Parent 66,963 44,052
67,062 43,778
Earnings per share for profit attributable to the ordinary equity holders of the Parent:
• Basic earnings per share (cents) 9 37.34 27.36
• Diluted earnings per share (cents) 9 37.00 27.02
The above consolidated income statement should be read in conjunction with the accompanying notes set out on page 40 to 85.
M2 Annual Report 2014 - Financial StatementsF
or p
erso
nal u
se o
nly

36
CONSOLIDATED STATEMENT OF COMPREHENSIVE INCOME FOR THE YEAR ENDED 30 JUNE 2014
M2 Annual Report 2014 - Financial Statements
Note 2014 $000
2013 $000
Profit for the year 67,062 43,778
Other comprehensive income
Items that may be reclassified subsequently to profit or loss
Exchange differences on translation of foreign operations 23 4 (3)
Changes in fair value of cash flow hedges 23 (2,744) 966
Movement in investment revaluation reserve 23 (1,795) 329
Total other comprehensive income, net of tax (4,535) 1,292
Total comprehensive income for the year, net of tax 62,527 45,070
Total comprehensive income attributable to:
• Non-controlling interests 99 (274)
• Owners of the Parent 62,428 45,344
62,527 45,070
The above consolidated statement of other comprehensive income should be read in conjunction with the accompanying notes set out on page 40 to 85.
For
per
sona
l use
onl
y

37
CONSOLIDATED STATEMENT OF FINANCIAL POSITION AS AT 30 JUNE 2014
Note 2014 $000
2013 $000
ASSETS
Current Assets
Cash and cash equivalents 10 40,969 47,995
Trade receivables 11 97,652 94,067
Inventories 12 5,388 4,884
Other current assets 13 26,178 29,190
Financial assets 14 - 733
Total Current Assets 170,187 176,869
Non-Current Assets
Plant and equipment 16 60,969 58,796
Intangible assets and goodwill 17 599,814 634,467
Deferred income tax asset 7(c) 16,032 12,600
Other non-current assets 13 4,155 5,256
Investment in an associate 15 8,435 4,022
Financial assets 14 2,178 1,003
Total Non-Current Assets 691,583 716,144
TOTAL ASSETS 861,770 893,013
LIABILITIES
Current Liabilities
Trade and other payables 18 184,657 184,464
Interest-bearing loans and borrowings 20 30,848 30,573
Income tax payable 7(c) 3,726 14,737
Provisions 19 10,044 22,016
Financial liabilities 14 2,564 787
Total Current Liabilities 231,839 252,577
Non-Current Liabilities
Interest-bearing loans and borrowings 20 264,638 294,677
Deferred tax liability 7(c) 22,912 28,881
Provisions 19 5,161 3,729
Other non-current liabilities 21 3,999 15,960
Financial Liabilities 14 535 -
Total Non-Current Liabilities 297,245 343,247
TOTAL LIABILITIES 529,084 595,824
NET ASSETS 332,686 297,189
EQUITY
Contributed equity 22 255,092 244,194
Reserves 23 (2,068) 1,903
Retained earnings 79,948 51,477
Parent interests 332,972 297,574
Non-controlling interests (286) (385)
TOTAL EQUITY 332,686 297,189
The above consolidated statement of financial position should be read in conjunction with the accompanying notes set out on page 40 to 85.
M2 Annual Report 2014 - Financial StatementsF
or p
erso
nal u
se o
nly

38
CONSOLIDATED STATEMENT OF CHANGES IN EQUITY FOR THE YEAR ENDED 30 JUNE 2014
Ordinary shares
Retained earnings
Reserves Owners of the Parent
Non- controlling
interest
Total
$000 $000 $000 $000 $000 $000
At 1 July 2013 244,194 51,477 1,903 297,574 (385) 297,189
Profit for the period - 66,963 - 66,963 99 67,062
Other comprehensive income - - (4,535) (4,535) - (4,535)
Total comprehensive income - 66,963 (4,535) 62,428 99 62,527
Options exercised 915 - (67) 848 - 848
Share option reserves - - 353 353 - 353
Shares issued 346 - - 346 - 346
Share rights reserve - - 278 278 - 278
Transactions cost on shares - - - - - -
Dividends paid - (28,855) - (28,855) - (28,855)
Dividend reinvestment plan 9,637 (9,637) - - - -
At 30 June 2014 255,092 79,948 (2,068) 332,972 (286) 332,686
At 1 July 2012 150,911 37,403 535 188,849 (111) 188,738
Profit for the period - 44,052 - 44,052 (274) 43,778
Other comprehensive income - - 1,292 1,292 - 1,292
Total comprehensive income - 44,052 1,292 45,344 (274) 45,070
Options exercised 2,814 - (487) 2,327 - 2,327
Share option reserves - - 563 563 - 563
Shares issued 84,099 - - 84,099 - 84,099
Share rights reserve - - - - - -
Transaction cost on shares (43) - - (43) - (43)
Dividend paid - (23,565) - (23,565) - (23,565)
Dividend reinvestment plan 6,413 (6,413) - - - -
Deferred tax adjustment - - - - - -
At 30 June 2013 244,194 51,477 1,903 297,574 (385) 297,189
The above consolidated statement of changes in equity should be read in conjunction with the accompanying notes set out on page 40 to 85.
M2 Annual Report 2014 - Financial StatementsF
or p
erso
nal u
se o
nly

39
CONSOLIDATED STATEMENT OF CASH FLOWS FOR THE YEAR ENDED 30 JUNE 2014
Note 2014 $000
2013 $000
CASH FLOWS FROM OPERATING ACTIVITIES
Receipts from customers 1,095,699 667,671
Payments to suppliers and employees (965,707) (569,769)
Interest received 1,481 809
Interest paid (18,798) (11,739)
Income tax paid (27,031) (24,736)
Net cash flows from operating activities 10(b) 85,644 62,236
CASH FLOWS USED IN INVESTING ACTIVITIES
Purchase of plant and equipment (13,493) (12,326)
Purchase of intangibles (10,367) (7,905)
Acquisition payments, net cash acquired (34) (153,834)
Payment for financial assets (7,500) -
Payment for short-term deposits - (8,627)
Proceeds from disposal of plant and equipment 118 -
Net cash flows used in investing activities (31,276) (182,692)
CASH FLOWS FROM FINANCING ACTIVITIES
Repayment of borrowings (33,387) (142,855)
Proceeds from borrowings - 307,630
Proceeds from issue of shares 848 2,327
Transaction costs of issue of shares - (43)
Dividends paid (28,855) (23,565)
Net cash flows from / (used) financing activities (61,394) 143,494
Net increase in cash and cash equivalents (7,026) 23,038
Cash and cash equivalents at beginning of year 47,995 24,957
Cash and cash equivalents at end of year 10(a) 40,969 47,995
The above consolidated statement of cash flows should be read in conjunction with the accompanying notes set out on page 40 to 85.
M2 Annual Report 2014 - Financial Statements
NOTES TO THE CONSOLIDATED
FINANCIAL STATEMENTS
FOR THE YEAR ENDED 30 JUNE 2014
For
per
sona
l use
onl
y

40
M2 Annual Report 2014 - Notes to the Financial Statements
NOTES TO THE CONSOLIDATED
FINANCIAL STATEMENTS
FOR THE YEAR ENDED 30 JUNE 2014
1. CORPORATE INFORMATIONThe consolidated financial report of M2 Group Ltd (the 'Company', 'M2', 'Group') for the year ended 30 June 2014 was authorised for issue in accordance with a resolution of the directors on 22 August 2014.
M2 is a for profit company limited by shares incorporated and domiciled in Australia whose shares are publicly traded on the Australian Securities Exchange ('ASX').
2. SUMMARY OF ACCOUNTING POLICIES
(a) Basis of preparation
The financial report is a general purpose financial report, which has been prepared in accordance with the requirements of the Corporations Act 2001, Australian Accounting Standards and other authoritative pronouncements of the Australian Accounting Standards Board. The financial report has also been prepared on a historical cost basis.
The financial report is presented in Australian dollars and all values are rounded to the nearest thousand dollars ($000's) unless otherwise stated.
Certain comparative figures have been reclassified to conform to the financial statement presentation adopted for the current year.
(b) Statement of compliance
The financial report complies with Australian Accounting Standards as issued by the Australian Accounting Standards Board and International Financial Reporting Standards ('IFRS') as issued by the International Accounting Standards Board.
(c) New and amended standards
The Group has adopted the following new and amended Australian Accounting Standards and AASB Interpretations as of 1 July 2013:
• AASB 13 Fair Value Measurement and AASB 2011-8 Amendments to Australian Accounting Standards arising from AASB 13
• AASB 10 Consolidated Financial Statements
• AASB 11 Joint Arrangement
• AASB 12 Disclosure of Interest in Other Entities
• AASB 119 Employee Benefits
• AASB 2013-3 Amendments to AASB 136 - Recoverable Amount Disclosures for Non-financial Assets
The adoption of these standards did not have a material impact on the financial statements.
For
per
sona
l use
onl
y

41
M2 Annual Report 2014 - Notes to the Financial Statements
2. SUMMARY OF ACCOUNTING POLICIES (CONTINUED)
Accounting Standards and Interpretations issued but not yet effective
Australian Accounting Standards and Interpretations that have recently been issued or amended but are not yet effective and have not been adopted by the Group for the annual period ended 30 June 2014 is outlined below:
Reference Title Summary Application Date of
Standard
Impact on Group Financial
Report
Application Date for
Group
AASB 9/IFRS 9
Financial Instruments
On 24 July 2014 The IASB issued the final version of IFRS 9 which replaces IAS 39 and includes a logical model for classification and measurement, a single, forward-looking 'expected loss' im-pairment model and a substantially-reformed approach to hedge accounting.
IFRS 9 is effective for annual periods beginning on or after 1 Janu-ary 2018. However, the Standard is available for early application. The own credit changes can be early applied in isolation without otherwise changing the accounting for financial instruments.
The final version of IFRS 9 introduces a new expected-loss im-pairment model that will require more timely recognition of ex-pected credit losses. Specifically, the new Standard requires entities to account for expected credit losses from when finan-cial instruments are first recognised and to recognise full lifetime expected losses on a more timely basis.
The AASB is yet to issue the final version of AASB 9. A revised version of AASB 9 (AASB 2013-9) was issued in December 2013 which included the new hedge accounting requirements, includ-ing changes to hedge effectiveness testing, treatment of hedging costs, risk components that can be hedged and disclosures.
AASB 9 includes requirements for a simplified approach for clas-sification and measurement of financial assets compared with the requirements of AASB 139.
The main changes are described below.
a. Financial assets that are debt instruments will be classified based on (1) the objective of the entity's business model for managing the financial assets; (2) the characteristics of the contractual cash flows.
b. Allows an irrevocable election on initial recognition to present gains and losses on investments in equity instruments that are not held for trading in other comprehensive income. Dividends in respect of these investments that are a return on investment can be recognised in profit or loss and there is no impairment or recycling on disposal of the instrument.
c. Financial assets can be designated and measured at fair value through profit or loss at initial recognition if doing so elimi-nates or significantly reduces a measurement or recognition inconsistency that would arise from measuring assets or liabil-ities, or recognising the gains and losses on them, on different bases.
d. Where the fair value option is used for financial liabilities the change in fair value is to be accounted for as follows:
• The change attributable to changes in credit risk are pre-sented in other comprehensive income (OCI)
• The remaining change is presented in profit or loss
AASB 9 also removes the volatility in profit or loss that was caused by changes in the credit risk of liabilities elected to be measured at fair value. This change in accounting means that gains caused by the deterioration of an entity’s own credit risk on such liabilities are no longer recognised in profit or loss.
Consequential amendments were also made to other standards as a result of AASB 9, introduced by AASB 2009-11 and superseded by AASB 2010-7, AASB 2010-10 and AASB 2014-1 – Part E.
1 January 2018
The Group has not yet fully
assessed the impact of the
changes.
1 July 2018
For
per
sona
l use
onl
y

42
M2 Annual Report 2014 - Notes to the Financial Statements
2. SUMMARY OF ACCOUNTING POLICIES (CONTINUED)
Reference Title Summary Application Date of
Standard
Impact on Group Financial
Report
Application Date for
Group
AASB 2013-3
Amend-ments to AASB 136 – Recover-able Amount Disclosures for Non-Fi-nancial Assets
AASB 2013-3 amends the disclosure requirements in AASB 136 Impairment of Assets. The amendments include the requirement to disclose additional information about the fair value measurement when the recoverable amount of impaired assets is based on fair value less costs of disposal.
1 January 2014
The Group has not yet fully
assessed the impact of the
changes.
1 July 2014
AASB 2013-5
Amend-ments to Australian Accounting Standards – Investment Entities
These amendments define an investment entity and require that, with limited exceptions, an investment entity does not consolidate its subsidiaries or apply AASB 3 Business Combinations when it obtains control of another entity.
These amendments require an investment entity to measure un-consolidated subsidiaries at fair value through profit or loss in its consolidated and separate financial statements.
These amendments also introduce new disclosure requirements for investment entities to AASB 12 and AASB 127.
1 January 2014
The Group has not yet fully
assessed the impact of the
changes.
1 July 2014
AASB 1031 Materiality The revised AASB 1031 is an interim standard that cross-referenc-es to other Standards and the Framework (issued December 2013) that contain guidance on materiality.
AASB 1031 will be withdrawn when references to AASB 1031 in all Standards and Interpretations have been removed.
AASB 2014-1 Part C issued in June 2014 makes amendments to eight Australian Accounting Standards to delete their references to AASB 1031. The amendments are effective from 1 July 2014.
1 January 2014
The Group has not yet fully
assessed the impact of the
changes.
1 July 2014
AASB 2013-9
Amend-ments to Australian Accounting Standards – Conceptual Framework, Materi-ality and Financial Instruments
The Standard contains three main parts and makes amendments to a number Standards and Interpretations.
Part A of AASB 2013-9 makes consequential amendments arising from the issuance of AASB CF 2013-1.
Part B makes amendments to particular Australian Accounting Standards to delete references to AASB 1031 and also makes minor editorial amendments to various other standards.
Part C makes amendments to a number of Australian Accounting Standards, including incorporating Chapter 6 Hedge Accounting into AASB 9 Financial Instruments.
^^ The Group has not yet fully
assessed the impact of the
changes.
^^
Amend-ments to
IAS 16 and IAS 38
Clarifi-cation of Acceptable Methods of Depre-ciation and Amortisation (Amend-ments to
IAS 16 and IAS 38)
IAS 16 and IAS 38 both establish the principle for the basis of de-preciation and amortisation as being the expected pattern of con-sumption of the future economic benefits of an asset.
The IASB has clarified that the use of revenue-based methods to calculate the depreciation of an asset is not appropriate because revenue generated by an activity that includes the use of an asset generally reflects factors other than the consumption of the eco-nomic benefits embodied in the asset.
The IASB also clarified that revenue is generally presumed to be an inappropriate basis for measuring the consumption of the eco-nomic benefits embodied in an intangible asset. This presumption, however, can be rebutted in certain limited circumstances.
1 January 2016
The Group has not yet fully
assessed the impact of the
changes.
1 July 2016
^^ The application dates of AASB 2013-9 are as follows:Part A –periods ending on or after 20 Dec 2013 Application date for the Group: period ending 30 June 2014Part B - periods beginning on or after 1 January 2014 Application date for the Group: period beginning 1 July 2014Part C - reporting periods beginning on or after 1 January 2015 Application date for the Group: period beginning 1 July 2015
For
per
sona
l use
onl
y

43
M2 Annual Report 2014 - Notes to the Financial Statements
2. SUMMARY OF ACCOUNTING POLICIES (CONTINUED)
Reference Title Summary Application Date of
Standard
Impact on Group Financial
Report
Application Date for
Group
IFRS 15 Revenue from Con-tracts with Customers
In May 2014, the IASB issued IFRS 15 Revenue from Contracts with Customers, which replaces IAS 11 Construction Contracts, IAS 18 Revenue and related Interpretations (IFRIC 13 Customer Loyalty Programmes, IFRIC 15 Agreements for the Construction of Real Estate, IFRIC 18 Transfers of Assets from Customers and SIC-31 Revenue—Barter Transactions Involving Advertising Services)
The core principle of IFRS 15 is that an entity recognises revenue to depict the transfer of promised goods or services to customers in an amount that reflects the consideration to which the entity ex-pects to be entitled in exchange for those goods or services. An entity recognises revenue in accordance with that core principle by applying the following steps:
(a) Step 1: Identify the contract(s) with a customer
(b) Step 2: Identify the performance obligations in the contract
(c) Step 3: Determine the transaction price
(d) Step 4: Allocate the transaction price to the performance ob-ligations in the contract
(e) Step 5: Recognise revenue when (or as) the entity satisfies a performance obligation
Early application of this standard is permitted.
1 January 2017
The Group has not yet fully
assessed the impact of the
changes.
1 July 2017
AASB 2014-2
Amend-ments to AASB 1053 – Transi-tion to and between Tiers, and related Tier 2 Disclosure Require-ments
[AASB 1053]
The Standard makes amendments to AASB 1053 Application of Tiers of Australian Accounting Standards to:
• clarify that AASB 1053 relates only to general purpose finan-cial statements;
• make AASB 1053 consistent with the availability of the AASB 108 Accounting Policies, Changes in Accounting Estimates and Errors option in AASB 1 First-time Adoption of Australian Accounting Standards;
• clarify certain circumstances in which an entity applying Tier 2 reporting requirements can apply the AASB 108 option in AASB 1; permit an entity applying Tier 2 reporting require-ments for the first time to do so directly using the require-ments in AASB 108 (rather that applying AASB 1) when, and only when, the entity had not applied, or only selectively ap-plied, applicable recognition and measurement requirements in its most recent previous annual special purpose financial statements; and
• specify certain disclosure requirements when an entity re-sumes the application of Tier 2 reporting requirements.
1 July 2014 The Group has not yet fully
assessed the impact of the
changes.
1 July 2014
(d) Basis of consolidation
The consolidated financial statements of the Group comprise the fi-nancial statements of M2 and all its subsidiaries ('the Group') where it is determined that there is a capacity to control. Control is defined when the Group is exposed, or has rights, to variable returns from its involvement with the subsidiary and has the ability to affect those returns through its power over the subsidiary.
The financial statements of the subsidiaries are prepared for the same reporting period as the parent company, using consistent accounting policies. In preparing the consolidated financial statements, all inter-company balances, transactions, unrealised gains and losses resulting from intra-group transactions and dividends have been eliminated in full.
Subsidiaries are fully consolidated from the date on which control is transferred to the Group and cease to be consolidated from the date on which control is transferred out of the Group. Investments in subsidiaries held by the Group are accounted for at cost in the separate financial statements of the parent entity less any impair-ment charges. Dividends received from subsidiaries are recorded as a component of other revenues in the separate income statement of
the parent entity, and do not impact the recorded cost of the invest-ment. Upon receipt of dividend payments from subsidiaries, the par-ent will assess whether any indicators of impairment of the carrying value of the investment in the subsidiary exist. Where such indicators exist, to the extent that the carrying value of the investment exceeds its recoverable amount, an impairment loss is recognised.
The acquisition of subsidiaries is accounted for using the acquisition method of accounting. The acquisition method of accounting involves recognising at acquisition date, separately from goodwill, the identifiable assets acquired, the liabilities assumed and any non-controlling interest in the acquiree. The identifiable assets acquired and the liabilities as-sumed are measured at their acquisition date fair values (see note 2(e)).
The difference between the above items and the fair value of the con-sideration (including the fair value of any pre-existing investment in the acquiree) is goodwill or a discount on acquisition.
After initial recognition, goodwill is measured at cost less any accu-mulated impairment losses. For the purpose of impairment testing, goodwill acquired in a business combination is, from the acquisition date, allocated to each of the Group’s cash-generating units that are
For
per
sona
l use
onl
y

44
M2 Annual Report 2014 - Notes to the Financial Statements
2. SUMMARY OF ACCOUNTING POLICIES (CONTINUED)
expected to benefit from the combination, irrespective of whether other assets or liabilities of the acquiree are assigned to those units.
Non-controlling interests are allocated their share of net profit after tax in the statement of comprehensive income and are presented within equity in the consolidated statement of financial position, sep-arately from the equity of the owners of the parent.
Losses are attributed to the non-controlling interest even if that re-sults in a deficit balance.
A change in the ownership interest of a subsidiary that does not result in a loss of control is accounted for as an equity transaction.
(e) Business combinations
Business combinations are accounted for using the acquisition meth-od. The consideration transferred in a business combination shall be measured at fair value, which shall be calculated as the sum of the acquisition-date fair values of the assets transferred by the acquirer, the liabilities incurred by the acquirer to former owners of the acquiree and the equity issued by the acquirer, and the amount of any non-con-trolling interest in the acquiree. For each business combination, the acquirer measures the non-controlling interest in the acquiree either at fair value or at the proportionate share of the acquiree’s identifiable net assets. Acquisition-related costs are expensed as incurred, and included in other expenses.
When the Group acquires a business, it assesses the financial assets and liabilities assumed for appropriate classification and designa-tion in accordance with contractual terms, economic conditions, the Group’s operating or accounting policies and other pertinent condi-tions as at the acquisition date. This includes the separation of em-bedded derivatives in host contracts by the acquiree.
Any contingent consideration to be transferred by the acquirer will be recognised at fair value at the acquisition date. Subsequent changes to the fair value of the contingent consideration which is deemed to be an asset or liability will be recognised in accordance with AASB 139 either in profit or loss or in other comprehensive income. If the contingent consideration is classified as equity, it should not be remeasured until it is finally settled within equity.
(f) Investment in associates
An associate is an entity over which the Group has significant influ-ence. Significant influence is the power to participate in the financial and operating policy decisions of the investee, but is not control or joint control over those policies. Investments in associates are ac-counted for using the equity method of accounting.
Under the equity method, the investment in an associate or a joint venture is initially recognised at cost. The carrying amount of the in-vestment is adjusted to recognise changes in the Group’s share of net assets of the associate or joint venture since the acquisition date. Goodwill relating to the associate or joint venture is included in the carrying amount of the investment and is neither amortised nor indi-vidually tested for impairment.
(g) Operating segments
An operating segment is a component of the Group that engages in business activities from which it may earn revenues and incur ex-penses (including revenues and expenses relating to transactions with other components of the same Group), whose operating results are regularly reviewed by the entity’s chief operating decision maker to make decisions about resources to be allocated to the segment and assess its performance and for which discrete financial informa-tion is available. This includes start-up operations which are yet to earn revenues. Management will also consider other factors in deter-mining operating segments such as the level of segment information presented to the board of directors.
Operating segments have been identified based on the information provided to the chief operating decision makers – being the executive management team.
Operating segments that meet the quantitative criteria as prescribed by AASB 8 are reported separately.
(h) Foreign currency translation
Functional and presentation currency
Both the functional and presentation currency of the Group and its Australian subsidiaries are Australian dollars ($). The New Zealand sub-sidiary’s functional currency is New Zealand dollars which is translated to the presentation currency (see below for consolidated reporting).
Transactions and balances
Transactions in foreign currencies are initially recorded in the func-tional currency by applying the exchange rates at the date of the transaction. Monetary assets and liabilities denominated in foreign currencies are translated at the rate of exchange at the reporting date.
Translation of Group Companies’ functional currency to presentation currency
The results of the New Zealand subsidiary are translated into Austra-lian dollars (presentation currency) as at the date of each transaction. Assets and liabilities are translated at exchange rates prevailing at reporting date.
Exchange variations resulting from the translation are recognised in the foreign currency translation reserve in equity.
On consolidation, exchange differences arising from the translation of the net investment in the New Zealand subsidiary are taken to the foreign currency translation reserve. If the New Zealand subsidiary were sold, the proportionate share of exchange differences would be transferred out of equity and recognised in the statement of compre-hensive income.
(i) Cash and cash equivalents
Cash and cash equivalents in the statement of financial position com-prise cash at bank and in hand and short-term deposits with an orig-inal maturity of three months or less that are readily convertible to known amounts of cash and which are subject to an insignificant risk of changes in value.
For the purposes of the statement of cash flow, cash and cash equiv-alents consist of cash and cash equivalents as defined above, net of outstanding bank overdrafts. Bank overdrafts are included with-in interest–bearing loans and borrowings in current liabilities on the statement of financial position.
( j) Trade receivables
Trade receivables, which generally have 14-60 day terms, are rec-ognised initially at fair value and subsequently measured at amor-tised cost which is the original invoice amount less an allowance for impairment.
Collectability of trade receivables is reviewed on an ongoing basis at an operating unit level. Individual debts that are known to be uncol-lectible are written off when identified. An impairment provision is rec-ognised when there is objective evidence that the Group will not be able to collect the receivable. Debts more than 90 days are reviewed by management. Financial difficulties of the debtor, default payments and information provided by collection agents are considered objec-tive evidence of impairment. The amount of the impairment loss is the receivable carrying amount compared to the present value of estimat-ed future cash flows, discounted at the original effective interest rate.
(k) Inventories
Inventories are valued at the lower of cost and net realisable value. Costs are accounted for on a first-in, first-out basis. Cost of finished goods comprise of cost of direct materials assigned on the basis of weighted average costs.
For
per
sona
l use
onl
y

45
M2 Annual Report 2014 - Notes to the Financial Statements
2. SUMMARY OF ACCOUNTING POLICIES (CONTINUED)
Net realisable value is the estimated selling price in the ordinary course of business, less estimated costs of completion and the esti-mated costs necessary to make the sale.
(l) Investments and financial assets
Investments and financial assets in the scope of AASB 139 Financial instruments: Recognition and Measurement are classified as either financial assets at fair value through profit or loss, loans and receiv-ables, held-to-maturity investments, or available-for-sale financial assets. The classification depends on the purpose for which the in-vestments were acquired or originated. Designation is re-evaluated at each financial year end, but there are restrictions on reclassifying to other categories.
When financial assets are recognised initially, they are measured at fair value, plus, in the case of investments not at fair value through profit or loss, directly attributable transactions costs.
Recognition and derecognition
All regular way purchases and sales of financial assets are recognised on the trade date i.e. the date that the Group commits to purchase the asset. Regular way purchases or sales are purchases or sales of financial assets under contracts that require delivery of the assets within the period established generally by regulation or convention in the market place. Financial assets are derecognised when the right to receive cash flows from the financial assets has expired or when the entity transfers substantially all the risks and rewards of the financial assets. If the entity neither retains nor transfers substantially all of the risks and rewards, it derecognises the asset if it has transferred control of the assets.
Subsequent measurement - Loans and receivables
Loans and receivables are non-derivative financial assets with fixed or determinable payments that are not quoted in an active market. After initial measurement, such financial assets are subsequently measured at amortised cost using the effective interest rate ('EIR') method, less impairment. Amortised cost is calculated by taking into account any discount or premium on acquisition and fees or costs that are an integral part of the EIR. The EIR amortisation is included in finance income in the statement of profit or loss. The losses arising from impairment are recognised in the statement of profit or loss in finance costs for loans and in cost of sales or other operating expens-es for receivables.
(m) Plant and Equipment
Plant and equipment is stated at historical cost less accumulated depreciation and any accumulated impairment losses. Such cost in-cludes the cost of replacing parts that are eligible for capitalisation when the cost of replacing the parts is incurred. Similarly, when each major inspection is performed, its cost is recognised in the carry-ing amount of the plant and equipment as a replacement only if it is eligible for capitalisation. All other repairs and maintenance are rec-ognised in profit or loss as incurred.
Depreciation is calculated on a straight-line basis over the estimated useful life of the specific assets as follows:
Plant and equipment – over 2 to 10 years Motor vehicles – over 4 to 5 years, determined by the life of the lease Leased equipment – over 2 to 5 years, determined by the life of the lease Switch cables – over 15 years
The assets’ residual values, useful lives and amortisation methods are reviewed, and adjusted if appropriate, at each financial year end.
Derecognition
An item of plant and equipment is derecognised upon disposal or when no further future economic benefits are expected from its use or disposal.
Any gain or loss arising on derecognition of the asset (calculated as
the difference between the net disposal proceeds and the carrying amount of the asset) is included in statement of comprehensive in-come in the year the asset is derecognised.
(n) Leases
The determination of whether an arrangement is or contains a lease is based on the substance of the arrangement and requires an as-sessment of whether the fulfilment of the arrangement is dependent on the use of a specific asset or assets and the arrangement conveys a right to use the asset, even if that right is not explicitly specified in an arrangement.
Group as a lessee
Finance leases, which transfer to the Group substantially all the risks and benefits incidental to ownership of the leased item, are capital-ised at the inception of the lease at the fair value of the leased prop-erty or, if lower, at the present value of the minimum lease payments. Lease payments are apportioned between the finance charges and reduction of the lease liability so as to achieve a constant rate of in-terest on the remaining balance of the liability. Finance charges are recognised as an expense in profit or loss.
Capitalised leased assets are depreciated over the shorter of the es-timated useful life of the asset and the lease term if there is no rea-sonable certainty that the Group will obtain ownership by the end of the lease term.
Operating lease payments are recognised as an expense in the State-ment of Comprehensive Income on a straight-line basis over the lease term. Operating lease incentives are recognised as a liability when received and subsequently reduced by allocating lease payments be-tween rental expense and reduction of the liability.
(o) Impairment of non-financial assets other than goodwill and indefinite intangibles
Non-financial assets other than goodwill and indefinite life intangibles are tested for impairment whenever events or changes in circum-stances indicate that the carrying amount may not be recoverable.
The Group conducts an annual internal review of asset values, which is used as a source of information to assess for any indicators of im-pairment. External factors, such as changes in expected future pro-cesses, technology and economic conditions, are also monitored to assess for indicators of impairment. If any indication of impairment exists, an estimate of the asset’s recoverable amount is calculated.
An impairment loss is recognised for the amount by which the as-set’s carrying amount exceeds its recoverable amount. Recoverable amount is the higher of an asset’s fair value less costs to sell and value-in-use. For the purposes of assessing impairment, assets are grouped at the lowest levels for which there are separately identifiable cash inflows that are largely independent of the cash inflows from other assets or groups of assets (cash-generating units). Non-finan-cial assets other than goodwill that suffered impairment are tested for possible reversal of the impairment whenever events or changes in circumstances indicate that the impairment may have reversed.
(p) Goodwill and intangibles
Goodwill
Goodwill acquired in a business combination is initially measured at cost of the business combination being the excess of the consider-ation transferred over the fair value of the Group’s net identifiable as-sets acquired and liabilities assumed. If this consideration transferred is lower than the fair value of the net identifiable assets of the subsidi-ary acquired, the difference is recognised in profit or loss.
After initial recognition, goodwill is measured at cost less any accu-mulated impairment losses.
For the purpose of impairment testing, goodwill acquired in a busi-ness combination is, from the acquisition date, allocated to each of the Group’s cash-generating units, or groups of cash-generating
For
per
sona
l use
onl
y

46
M2 Annual Report 2014 - Notes to the Financial Statements
2. SUMMARY OF ACCOUNTING POLICIES (CONTINUED)
units, that are expected to benefit from the synergies of the combina-tion, irrespective of whether other assets or liabilities of the Group are assigned to those units or groups of units. Each unit or group of units to which the goodwill is so allocated represents the lowest level within the Group at which the goodwill is monitored for internal management purposes, and is not larger than an operating segment determined in accordance with AASB 8.
Impairment is determined by assessing the recoverable amount of the cash-generating unit (group of cash-generating units), to which the goodwill relates.
The Group performs its impairment testing annually, or more fre-quently if events or changes in circumstances indicate that the car-rying value may be impaired, using discounted cash flows under the value-in-use methodology. Further details on the methodology and assumptions used are outline in note 17.
When the recoverable amount of the cash-generating unit (group of cash-generating units) is less than the carrying amount, an impair-ment loss is recognised.
Impairment losses recognised for goodwill are not subsequently reversed.
Intangibles
Intangible assets acquired separately or in a business combination are initially measured at cost. The cost of an intangible asset acquired in a business combination is its fair value as at the date of acquisition. Fol-lowing initial recognition, intangible assets are carried at cost less any accumulated amortisation and any accumulated impairment losses.
The useful lives of these intangible assets are assessed to be either finite or indefinite. Intangible assets with finite lives are amortised over their useful life and tested for impairment whenever there is an indi-cation that the intangible asset may be impaired. The amortisation period and the amortisation method for an intangible asset with finite useful life is reviewed at least at each financial year end. Changes in the expected useful life or the expected pattern of consumption of future economic benefits embodied in the asset are accounted for prospectively by changing the amortisation period or method, as ap-propriate, which is a change in accounting estimate. The amortisation expense on intangible assets with finite useful lives is recognised in profit or loss in the expense category consistent with the function of the intangible asset.
Indefeasible Rights to Use ('IRUs') of capacity are intangible assets am-ortised on a straight line basis over the remaining life of the contracts.
Trademarks, licenses and customer contracts are amortised over the period of expected future sales from the related asset. Software pur-chased is amortised over a period of between 2 years and 10 years, being the estimated useful life of the asset.
Brands have indefinite useful lives. Intangible assets with indefinite useful lives are tested for impairment annually either individually or at cash-generating unit level consistent with the methodology outlined for goodwill above. Such intangibles are not amortised. The useful life of an indefinite life is reviewed each reporting period to determine whether indefinite life assessment continues to be supportable. If not, the change in the useful life assessment from indefinite to finite is accounted for as a change in an accounting estimate and is thus accounted for on a prospective basis.
Software includes capitalised development costs. Research costs are expensed as incurred. An intangible asset arising from develop-ment expenditure on an internal project is recognised only when the Group can demonstrate the technical feasibility of completing the in-tangible asset so that it will be available for use or sale, its intention to complete and its ability to use or sell the asset, how the asset will generate future economic benefits, the availability of resources to complete the development and the ability to measure reliably the ex-penditure attributable to the intangible asset during its development. Following the initial recognition of the development expenditure, the cost model is applied requiring the asset to be carried at cost less any accumulated amortisation and accumulated impairment losses. Any
expenditure so capitalised is amortised over the period of expected benefit from the related project.
The carrying value of an intangible asset arising from development expenditure is tested for impairment annually when the asset is not yet available for use or more frequently when an indication of impair-ment arises during the reporting period.
Gains or losses arising from derecognition of an intangible asset are measured as the difference between the net disposal proceeds and the carrying amount of the asset and are recognised in profit or loss when the asset is derecognised.
(q) Trade and other payables
Trade and other payables are carried at amortised cost and due to their short-term nature they are not discounted. They represent liabil-ities for goods and services provided to the Group prior to the end of the financial year that are unpaid and arise when the Group becomes obliged to make future payments in respect of the purchase of these goods and services. The amounts are unsecured and are usually paid within 30 days of recognition.
(r) Interest-bearing loans and borrowings
All loans and borrowings are initially recognised at the fair value of the consideration received less directly attributable transaction costs.
After initial recognition, interest-bearing loans and borrowings are subse-quently measured at amortised cost using the effective interest method.
Borrowings are classified as current liabilities unless the Group has an unconditional right to defer settlement of the liability for at least 12 months after the reporting date.
Borrowing costs
Borrowing costs directly attributable to the acquisition, construction or production of a qualifying asset (i.e. an asset that necessarily takes a substantial period of time to get ready for its intended use or sale) are capitalised as part of the cost of that asset. All other borrowing costs are expensed in the period they occur. Borrowing costs consist of interest and other costs that an entity incurs in connection with the borrowing of funds. The Group does not currently hold qualifying assets but, if it did, the borrowing costs directly attributable with this asset would be capitalised (including any other associated costs di-rectly attributable to the borrowing and temporary investment income earned on the borrowing).
(s) Derivative financial instruments and hedge accounting
The Group uses derivative financial instruments, such as forward currency contracts, interest rate swaps and forward commodity con-tracts, to hedge its foreign currency risks, interest rate risks and com-modity price risks, respectively. Such derivative financial instruments are initially recognised at fair value on the date on which a deriva-tive contract is entered into and are subsequently remeasured at fair value. Derivatives are carried as financial assets when the fair value is positive and as financial liabilities when the fair value is negative.
Any gains or losses arising from changes in the fair value of derivatives are taken directly to profit or loss, except for the effective portion of cash flow hedges, which is recognised in other comprehensive income.
For the purpose of hedge accounting, hedges are classified as:
• Fair value hedges when hedging the exposure to changes in the fair value of a recognised asset or liability or an unrecognised firm commitment
• Cash flow hedges when hedging the exposure to variability in cash flows that is either attributable to a particular risk associated with a recognised asset or liability or a highly probable forecast transaction or the foreign currency risk in an unrecognised firm commitment
At the inception of a hedge relationship, the Group formally desig-nates and documents the hedge relationship to which the Group wishes to apply hedge accounting and the risk management objec-
For
per
sona
l use
onl
y

47
M2 Annual Report 2014 - Notes to the Financial Statements
2. SUMMARY OF ACCOUNTING POLICIES (CONTINUED)
tive and strategy for undertaking the hedge. The documentation in-cludes identification of the hedging instrument, the hedged item or transaction, the nature of the risk being hedged and how the entity will assess the effectiveness of changes in the hedging instrument’s fair value in offsetting the exposure to changes in the hedged item’s fair value or cash flows attributable to the hedged risk. Such hedges are expected to be highly effective in achieving offsetting changes in fair value or cash flows and are assessed on an ongoing basis to determine that they actually have been highly effective throughout the financial reporting periods for which they were designated.
Hedges that meet the strict criteria for hedge accounting are ac-counted for as described below:
Fair value hedges
The change in the fair value of a hedging derivative is recognised in the income statement as finance costs. The change in the fair value of the hedged item attributable to the risk hedged is recorded as part of the carrying value of the hedged item and is also recognised in the income statement as finance costs.
For fair value hedges relating to items carried at amortised cost, any adjustment to carrying value is amortised through profit or loss over the remaining term of the hedge using the Effective Interest Rate ('EIR') method. EIR amortisation may begin as soon as an adjustment exists and no later than when the hedged item ceases to be adjusted for changes in its fair value attributable to the risk being hedged.
If the hedged item is derecognised, the unamortised fair value is rec-ognised immediately in profit or loss.
When an unrecognised firm commitment is designated as a hedged item, the subsequent cumulative change in the fair value of the firm com-mitment attributable to the hedged risk is recognised as an asset or lia-bility with a corresponding gain or loss recognised in the profit and loss.
Currently, there are no financial instruments designated as Fair value hedges by the Group.
Cash flow hedges
The Group uses interest rate swaps to hedge exposure in changes in variable rate of its floating rate secured loan, as well as forward currency contracts to hedges of its exposure to foreign currency risk in forecast transactions, and a forward commodity contracts for its exposure to volatility in the commodity prices.
The effective portion of the gain or loss on the hedging instrument is recognised directly in other comprehensive income in the cash flow hedge reserve, while any ineffective portion is recognised immediate-ly in the income statement as other operating expenses.
Amounts recognised as other comprehensive income are transferred to profit or loss when the hedged transaction affects profit or loss, such as when the hedged financial income or financial expense is recognised or when a forecast sale occurs. When the hedged item is the cost of a non-financial asset or non-financial liability, the amounts recognised as other comprehensive income are transferred to the ini-tial carrying amount of the non-financial asset or liability.
If the forecast transaction or firm commitment is no longer expected to occur, the cumulative gain or loss previously recognised in equi-ty is transferred to the income statement. If the hedging instrument expires or is sold, terminated or exercised without replacement or rollover, or if its designation as a hedge is revoked, any cumulative gain or loss previously recognised in other comprehensive income remains in other comprehensive income until the forecast transaction or firm commitment affects profit or loss.
(t) Provisions and employee leave benefits
Provisions are recognised when the Group has a present obligation (legal or constructive) as a result of a past event, it is probable that an outflow of resources embodying economic benefits will be required
to settle the obligation and a reliable estimate can be made of the amount of the obligation.
When the Group expects some or all of a provision to be reimbursed, for example under an insurance contract, the reimbursement is rec-ognised as a separate asset but only when the reimbursement is vir-tually certain. The expense relating to any provision is presented in the statement of comprehensive income net of any reimbursement.
Provisions are measured at the present value of management’s best estimate of the expenditure required to settle the present obligation at the reporting date. The discount rate used to determine the pres-ent value reflects current market assessments of the time value of money and the risks specific to the liability. The increase in the provi-sion resulting from the passage of time is recognised in finance costs.
Employee leave benefits
(i) Wages, salaries, annual leave and sick leave
Liabilities for wages and salaries, including non-monetary benefits and annual leave expected to be settled within 12 months of the reporting date are recognised in other payables in respect of em-ployees’ services up to the reporting date. They are measured at the amounts expected to be paid when the liabilities are settled. Expens-es for sick leave are recognised when the leave is taken and are mea-sured at the rates paid or payable.
(ii) Long service leave
The liability for long service leave is recognised in the provision for employee benefits and measured as the present value of expect-ed future payments to be made in respect of services provided by employees up to the reporting date using the projected unit credit method. Consideration is given to expected future wage and salary levels, experience of employee departures, and periods of service. Expected future payments are discounted using market yields at the reporting date on national government bonds with terms to maturity and currencies that match, as closely as possible, the estimated fu-ture cash outflows.
(u) Share-based payment transactions
Equity settled transactions
The Group has provided benefits to its employees in the form of share-based payments, whereby employees rendered services in ex-change for shares or rights over shares (equity-settled transactions).
There are currently two plans in place to provide these benefits:
• the Employee Share Option Plan ('ESOP'), which provides benefits to directors, senior executives and selected employees
• Long Term Incentive Plan ('LTI'), which provides performance rights to Executives
The cost of these equity-settled transactions with employees is mea-sured by reference to the fair value of the equity instruments at the date at which they are granted. The fair value is determined by an external valuer using a binomial model; further details are given in note 26.
The cost of equity-settled transactions is recognised, together with a corresponding increase in the equity, over the period in which the performance and/or service conditions are fulfilled (the vesting peri-od), ending on the date on which the relevant employees become fully entitled to the award (the vesting date).
At each subsequent reporting date until vesting, the cumulative charge to the statement of comprehensive income is the product of:
(i) The grant date fair value of the award
(ii) The current best estimate of the number of awards that will vest, taking into account such factors as the likelihood of employee turnover during the vesting period and the likelihood of non-mar-ket performance conditions being met
(iii) The expired portion of the vesting period.
For
per
sona
l use
onl
y

48
M2 Annual Report 2014 - Notes to the Financial Statements
2. SUMMARY OF ACCOUNTING POLICIES (CONTINUED)
The charge to the Statement of Comprehensive Income for the year is the cumulative amount as calculated above less the amounts already charged in previous periods. There is a corresponding entry to equity.
Until an award has vested, any amounts recorded are contingent and will be adjusted if more or fewer awards vest than were originally an-ticipated to do so. Any award subject to a market condition is con-sidered to vest irrespective of whether or not that market condition is fulfilled, provided that all other conditions are satisfied.
If the terms of an equity-settled are modified, as a minimum an expense is recognised as if the terms had not been modified. An additional expense is recognised for any modification that increases the total fair value of the share-based payment arrangement, or is otherwise beneficial to the employee, as measured at the date of modification.
If an equity-settled award is cancelled, it is treated as if it had vest-ed on the date of cancellation, and any expense not yet recognised for the award is recognised immediately. However, if a new award is substituted for the cancelled award and designated as a replacement award on the date that it is granted, the cancelled and new award are treated as if they were a modification of the original award, as described in the previous paragraph.
The dilutive effect, if any, of outstanding options is reflected as addi-tional share dilution in the computation of diluted earnings per share (see note 9).
(v) Contributed equity
Ordinary shares are classified as equity. Incremental costs directly attributable to the issue of new shares are shown in equity as a de-duction, net of tax, from the proceeds.
(w) Revenue recognition
Revenue is recognised and measured at the fair value of the con-sideration received or receivable to the extent it is probable that the economic benefits will flow to the Group and the revenue can be re-liably measured. The following specific recognition criteria must also be met before revenue is recognised:
Rendering of services
The Group principally obtains revenue from providing telecommunica-tions, gas and electricity services. Telecommunication services include the following: fixed wire, mobile, data services and equipment sales. Products and services may be sold separately or in bundled packages.
Revenue for fixed wire, mobile and data services are recognised as revenue when services are rendered. Revenue from services provid-ed, but unbilled, are accrued at end of each period and unearned rev-enue (revenue billed in advance) for services to be provided in future periods is deferred.
Revenue from bundled offers is recognised when two or more ac-tivities or deliverables are sold under one single arrangement. The total fixed or determinable amount of the arrangement is allocated to the separate units of accounting based on its relative fair value. A delivered item is considered separate unit of accounting where it has value to the customer on a stand-alone basis and the fair value any undelivered items cannot be terminated by the customer without incurring penalties if the delivered item was returned.
Revenue from gas and electricity services supplied is recognised once the gas and electricity has been delivered to the customer and is measured through a regular review of usage meters. At the end of each reporting period, gas and electricity revenue includes an ac-crual for energy delivered to the customer but not yet billed (unbilled revenue).
Revenue for equipment sales is recognised when the device is deliv-ered to the end customer and the sale is considered complete.
Commission income
Commissions are received as incentives from upstream suppliers for connecting new customers. Revenue from such commissions is de-
ferred and recognised over a period of life in line with the average period related to the customers’ contracts.
Interest
Revenue is recognised as interest accrues using the effective inter-est method. This is a method of calculating the amortised cost of a financial asset and allocating the interest income over the relevant period using the effective interest rate, which is the rate that exactly discounts estimated future cash receipts through the expected life of the financial asset to the net carrying amount of the financial asset.
(x) Income tax and other taxes
Current tax assets and liabilities for the current period are measured at the amount expected to be recovered from or paid to the taxation authorities based on the current period’s taxable income. The tax rates and tax laws used to compute the amount are those that are enacted or substantively enacted at the reporting date.
Management periodically evaluates positions taken in the tax returns with respect to situations in which applicable tax regulations are sub-ject to interpretation and establishes provisions where appropriate.
Deferred income tax is provided on all temporary differences at the reporting date between the tax bases of assets and liabilities and their carrying amounts for financial reporting purposes.
Deferred income tax liabilities are recognised for all taxable tempo-rary difference except:
• When the deferred liabilities arise from the initial recognition of goodwill or of an asset or liability in a transaction that is not a busi-ness combination and that, at the time of the transaction, affects neither the accounting profit nor taxable profit or loss.
• When the taxable temporary difference is associated with invest-ments in subsidiaries, associates or interest in joint ventures, and the timing of the reversal of the temporary difference can be con-trolled and it is probable that the temporary difference will not reverse in the foreseeable future.
Deferred income tax assets are recognised for all deductible tem-porary differences, carry-forward of unused tax assets and unused tax losses, to the extent that it is probable that taxable profit will be available against which the deductible temporary differences and the carry-forward of unused tax credits and unused tax losses can be utilised, except:
• When the deferred income tax asset relating to the deductible temporary difference arises from the initial recognition of an asset or liability in a transaction that is not a business combination and, at the time of the transaction, affects neither the accounting profit nor taxable profit or loss.
• When the deductible temporary differences is associated with investments in subsidiaries, associates and interests in joint ven-tures, in which case a deferred tax asset is only recognised to the extent that it is probable that the temporary difference will reverse in the foreseeable future and taxable profit will be available against which the temporary difference can be utilised.
The carrying amount of deferred income tax assets is reviewed at each reporting date and reduced to the extent that it is no longer probable that sufficient taxable profit will be available to allow all or part of the deferred income tax asset to be utilised. Unrecognised deferred income tax assets are reassessed at each reporting date and are recognised to the extent that it has become probable that future taxable profit will allow the deferred tax asset to be recovered. Deferred income tax assets and liabilities are measured at the tax rates that are expected to apply to the year when the asset is realised or the liability is settled, based on tax rates (and tax laws) that have been enacted or substantively enacted at the reporting date.
Deferred tax assets and deferred tax liabilities are offset only if a le-gally enforceable right exists to set off current tax assets against cur-
For
per
sona
l use
onl
y

v
49
rent tax liabilities and the deferred tax assets and liabilities relate to the same taxable entity and the same taxation authority.
Tax consolidation legislation
The Group and its wholly-owned Australian controlled entities formed a tax consolidated group under Australia taxation law with effect from 1 July 2004 and are therefore taxed as a single entity from that date.
The head entity, M2 Group Ltd, and the controlled entities in the tax consolidated group continue to account for their own current and de-ferred tax amounts. The Group has applied the 'stand-alone taxpay-er' approach in determining the appropriate amount of current taxes arising from unused tax losses and unused tax credits assumed from controlled entities in the tax consolidated group.
In addition to its own current and deferred tax amounts the Group also recognises the current tax liabilities (or assets) and the deferred tax assets arising from unused tax losses and unused tax credits as-sumed from controlled entities in the tax consolidated group. Assets or liabilities arising under tax funding agreements with the tax consol-idated entities are recognised as amounts receivable from or payable to other entities in the Group via an intercompany account. Details of the tax funding agreement are detailed in note 7.
Any difference between the amounts assumed and amounts receivable or payable under the tax funding agreement are recognised as a contri-bution to (or distribution from) wholly-owned tax consolidated entities.
Other taxes
Revenues, expenses and assets are recognised net of the amount of GST except:
• When the GST incurred on a purchase of goods and services is not recoverable from the taxation authority, in which case the GST is recognised as part of the cost of acquisition of the asset or as part of the expense item as applicable.
• Receivables and payables are stated with the amount of GST in-cluded.
The net amount of GST recoverable from, or payable to, the taxation authority is included as part of receivables or payables in the state-ment of financial position.
Cash flows are included in the statement of cash flows on a gross basis and the GST component of cash flows arising from investing and financing activities, which is recoverable from, or payable to, the taxation authority are classified as operating cash flows.
Commitments and contingencies are disclosed net of the amount of GST recoverable from, or payable to, the taxation authority.
(y) Earnings per share
Basic earnings per share is calculated as net profit attributable to members of the parent, adjusted to exclude any costs of servicing equity (other than dividends) and preference share dividends, divided by the weighted average number of ordinary shares, adjusted for any bonus element.
Diluted earnings per share is calculated as net profit attributable to members of the parent, adjusted for:
• Costs of servicing equity (other than dividends) and preference share dividends.
• The after tax effect of dividends and interest associated with dilutive potential ordinary shares that have been recognised as expenses.
• Other non-discretionary changes in revenues or expenses during the period that would result from the dilution of potential ordinary shares divided by the weighted average number of ordinary shares and di-lutive potential ordinary shares, adjusted for any bonus element.
(z) Customer loyalty programme
In certain circumstances, for every dollar spent on certain types of phone calls or plans by the customer, up to 15% of the eligible calls or plans can be redeemed for travel booked through M2 Travel. The customer has up to 60 days to redeem their travel dollars upon ter-mination or expiration of their contract, after which the travel dollars are forfeited.
For dollars earned by the customers, the Group defers a portion of the revenue and recognises a liability at fair value to fulfil its obligation to supply the redemption.
When the obligation to supply the travel dollars is fulfilled the deferred revenue is recognised in the profit or loss in the period in which the obligation was fulfilled and the liability is extinguished.
(aa) Deferred acquisition cost
Deferred acquisition cost pertains to upfront commissions paid to internal and external sales personnel upon acquiring new service contracts. Upfront commissions paid to internal and external sales personnel are initially recognised at cost in the statement of financial position as Other assets (note 13) and subsequently amortised over the average term of the customer’s contract which is 24 months. The amortisation is included in cost of sales.
2. SUMMARY OF ACCOUNTING POLICIES (CONTINUED)
M2 Annual Report 2014 - Notes to the Financial StatementsF
or p
erso
nal u
se o
nly

v
50
3. FINANCIAL RISK MANAGEMENT OBJECTIVES AND POLICIES
The Group’s principal assets and liabilities subject to financial risk include cash and short-term deposits, trade and other receivables, trade and other payables, bank loans finance leases and an investment in a listed company.
Risk Exposures and Responses
The Group manages its exposure to key financial risks in accordance with the Group’s financial risk management policy. The objective of the policy is to support the delivery of the Group’s financial targets whilst protecting future financial security.
The main risks arising from the Group’s financial instruments are market risk (including interest rate risk, foreign exchange risk and commodity risk), liquidity risk and credit risk. The Group uses different methods to measure and manage different types of risks to which it is exposed. Such methods include monitoring levels of exposure to market risk and assessments of market forecasts for interest rate, foreign exchange and elec-tricity prices, and the use of derivative financial instruments to mitigate the volatility on the financial performance of the Group. Derivative financial instruments are entered into for hedging purposes and no speculative activity is undertaken. Aging analyses and monitoring of specific credit limits are undertaken to manage credit risk. Liquidity risk is monitored through the development of rolling cash flow forecasts and maintaining access to a prudent level of committed funding facilities.
The Board reviews and agrees policies for managing each of these risks as summarised below.
Primary responsibility for identification and control of financial risks rests with the Audit and Risk Management Committee under the authority of the Board. The Board reviews and agrees policies for managing each of the risks identified below, including setting of credit limits and cash flow forecasts.
(a) Market Risk
Market risk is the risk that the fair value of future cash flows for the Groups financial instruments will vary due to changes in market prices.
(i) Interest rate risk
The Group’s interest rate exposure relates primarily to short term cash and long-term loans, both that have floating interest rates. The amount of short term cash and deposits and outstanding loans at 30 June 2014 is disclosed in notes 10 and 20 respectively.
The Group reviews its interest rate exposure by reference to potential renewals of existing positions and alternative financing. The Group policy is to maintain 75% of its long term loans at fixed rates using interest rate swaps whereby the Group agrees to exchange at defined periods the net difference between fixed and floating interest rates based on an agreed notional principal amount. The interest rate swaps have the economic effect of converting borrowings from floating rates to fixed rates, which are lower than those available if the Group borrowed at fixed rates directly. These interest rate swaps are designated into a hedge relationship and satisfy the requirements for hedge accounting.
At the reporting date, the Group has the following financial assets and liabilities exposed to Australian floating interest rate risk:
Interest Rate Risk-exposure
2014 $000
2013 $000
Financial Assets
Cash and cash equivalents 40,969 47,995
Other assets 416 8,857
Financial assets - 1,003
Financial Liabilities
Interest-bearing loans and borrowings (71,250) (89,000)
Financial liabilities (1,030) (787)
Net exposure (30,895) (31,932)
M2 Annual Report 2014 - Notes to the Financial StatementsF
or p
erso
nal u
se o
nly

51
Sensitivity
The following sensitivity analysis is based on the interest rate risk exposures in existence at the reporting date.
At 30 June 2014, if interest rates had varied, as illustrated in the table below, with all other variables held constant, post tax profit would have been affected as follows:
Interest rate risk- sensitivity
Impact on pre-tax profit higher / (lower)
Impact on equity higher / (lower)
2014 $000
2013 $000
2014 $000
2013 $000
Consolidated
+1.0% (100 basis points) (299) (322) (10) 2
-0.5% (50 basis points) 149 161 5 (1)
The movements in profit are due to higher/lower interest costs from floating interest rate on long term loans, financial assets and cash balances. The movements in equity are due to higher/lower interest costs from variable rate of derivatives the Group has entered into which affects the cash flow equity reserve.
(ii) Foreign exchange risk
The Group is exposed to foreign exchange risk arising from various currency exposures, primarily with respect to, the United States dollar (USD), Philippine peso (PHP) and the New Zealand dollar (NZD).
The Group has transactional currency exposure resulting from purchase of inventory, payment of suppliers and liabilities denominated in a cur-rency other than the entity’s functional currency. These transactions are denominated in USD and PHP.
The Group has a subsidiary operating in New Zealand which exposes the Group to foreign exchange translation risk. The Group considers the New Zealand operations small and does not materially impact the Group financial statements. For this reason, management believe the exposure to NZD currency fluctuations is not material and has not designated derivatives towards the NZD exposure.
The Group's policy to manage its foreign exchange rate risk against its functional currency is to hedge firm commitments and highly probable forecast transactions over varying time horizons using forward exchange contracts for the USD exposure and non-deliverable forward contracts for the PHP exposure. These hedges are undertaken centrally by Group Treasury.
The Group’s exposure to foreign currency risk at the end of the reporting period, expressed in foreign currency, was as follows:
Foreign exchange risk-exposure
2014 2013
USD 000
PHP 000
NZD 000
USD 000
PHP 000
NZD 000
Cash and cash equivalents 793 121
Trade and other receivables 358 942
Trade and other payables (1,054) (134,426) (312) (714) (194,912) (603)
Interest bearing loans and borrowings (5,214) - - (7,474) - -
Net exposure with P&L Impact (6,268) (134,426) 839 (8,188) (194,912) 460
Foward exchange contracts
- buy foreign currency (cash flow hedges) 7,200 - - 1,600 - -
Non deliverable forward contracts
- buy foreign currency (cash flow hedges) - 1,416,000 - - 201,820 -
Net exposure with Equity Impact 7,200 1,416,000 - 1,600 201,820 -
3. FINANCIAL RISK MANAGEMENT OBJECTIVES AND POLICIES (CONTINUED)
M2 Annual Report 2014 - Notes to the Financial StatementsF
or p
erso
nal u
se o
nly

52
3. FINANCIAL RISK MANAGEMENT OBJECTIVES AND POLICIES (CONTINUED)
Sensitivity
At 30 June 2014, if foreign currency exchange rates varied, as illustrated in the table below, with all other variables held constant, the impact on the Group’s profit before tax and equity, expressed in Australia dollar, would have been affected as follows:
Foreign exchange risk- sensitivity
2014 2013
USD $000
PHP $000
NZD $000
USD $000
PHP $000
NZD $000
Impact in post-tax profit higher/(lower)
+10% (AUD strengthened) 605 297 (71) 803 442 (35)
-10% (AUD weakened) (739) (363) 87 (981) (540) 43
Impact in equity higher/(lower)
+10% (AUD strengthened) (457) (2,155) - (151) (479) -
-10% (AUD weakened) 587 2,634 - 198 596 -
(iii) Commodity price risk
The Group is exposed to commodity price risk associated with the purchase and/ or sale of electricity and to a lesser extent gas. To manage the price risks associated with electricity, the Group enters into derivative instruments such as options and swaps. To manage gas price risk, during the year the Group entered into a supply agreement which has the commercial effect of limiting the price paid from the national pool on a certain amount of gas.
Based on a quarterly forecast of the required electricity supply, the Group hedges the purchase price using future commodity purchase contracts. The forecast is deemed to be highly probable.
The following table details the commodity contracts outstanding as at balance date.
2014 $000
2013 $000
Current Assets
Electricity derivatives - 618
Current Liabilities
Electricity derivatives (598) -
(598) 618
Sensitivity
The following table summarises the impact of a 5 percent increase/decrease in the electricity price with all other variables held constant.
Commodity price risk- sensitivity
Effect of profit before tax Effect on equity
2014 $000
2013 $000
2014 $000
2013 $000
Consolidated
5% increase in electricity prices 268 2 910 297
5% decrease in electricity price (593) (8) (1,878) (290)
Profit before tax for the year would increase/decrease as a result of the inherent ineffectiveness in some commodity hedging relationships and some financial instruments which are valid economic hedges of these commodity price risks which do not qualify for cash flow hedge accounting under AASB 139 requirements.
M2 Annual Report 2014 - Notes to the Financial StatementsF
or p
erso
nal u
se o
nly

53
3. FINANCIAL RISK MANAGEMENT OBJECTIVES AND POLICIES (CONTINUED)
(b) Credit risk
Credit risk arises from the financial assets of the Group, which comprise cash and cash equivalents and trade and other receivables. The Group’s exposure to credit risk arises from potential default of the counter party, with a maximum exposure equal to the carrying amount of these financial assets (as outlined in each applicable note).
The Group does not hold any credit derivatives to offset its credit exposure.
The Group trades only with recognised, credit-worthy third parties, and as such collateral is not requested.
It is the Group’s policy that prior to all customers who wish to trade on credit terms are subject to credit verification procedures including an assessment of their independent credit worthiness, financial position, past experience and industry reputation. Credit limits are set for each indi-vidual customer in accordance with parameters set by the board and are regularly monitored.
In addition, receivable balances are monitored on an ongoing basis with the result that the Group’s exposure to bad debts is not significant.
There are no significant concentrations of credit risk within the Group.
(c) Liquidity risk
Liquidity risk arises from the financial liabilities of the Group and the Group’s subsequent ability to meet their obligations to repay their financial liabilities as and when they fall due.
The Group’s objective is to maintain a balance between continuity of funding and flexibility through the use of credit facilities, bank loans, finance leases and committed available credit lines.
The Group minimises liquidity risk by maintaining a significant level of cash and cash equivalents as well as ensuring the Group has access to the use of committed funding facilities as required. The Group monitors total cash inflows and outflows expected on a monthly basis.
The Group has access to the following credit facilities at the end of the reporting period:
2014 $000
2013 $000
Floating Rate
Undrawn
- Expiring within one year (bank overdraft) - -
- Expiring beyond one year (bank guarantees and credit facility) 67,508 68,952
Committed
- Expiring within one year (bank overdraft) - -
- Expiring beyond one year (bank guarantees and credit facility) 17,492 16,048
85,000 85,000
Non-derivative financial liabilities
The following liquidity risk disclosures reflect all contractually fixed pay-offs, repayments and interest resulting from recognised financial liabilities as of 30 June 2014. The timing of the liabilities cash flows is based on the contractual terms of the underlying contract.
In the instance where there are no contractual terms and the counterparty has a choice of when the amount is paid, the liability is allocated to the earliest period. When the Group is committed to make amounts available in instalments, each instalment is allocated to the earliest period.
The liquidity risks implied from the values shown in the table below, reflect a balanced view of cash inflows and outflows. Leasing obligations, trade payables and other financial liabilities mainly originate from the financing of assets used in ongoing operations such as plant and equipment and investments in working capital (e.g., inventories and trade receivables).
Liquid non-derivative assets such as cash and receivables are considered in the Group’s overall liquidity risk. The Group ensures that sufficient liquid assets are available to meet short-term cash payments.
M2 Annual Report 2014 - Notes to the Financial StatementsF
or p
erso
nal u
se o
nly

54
3. FINANCIAL RISK MANAGEMENT OBJECTIVES AND POLICIES (CONTINUED)
< 6 months $000
6-12 months $000
1-5 years $000
> 5 years $000
TOTAL $000
Year ended 30 June 2014
Non-derivative financial assets
Cash and cash equivalents 40,969 - - - 40,969
Trade and other receivables 92,323 5,329 - - 97,652
Loan receivable 72 74 15 - 161
Non-derivative financial liabilities
Trade and other payables (136,470) - (3,727) - (140,197)
Interest bearing loans and borrowings (15,000) (15,000) (263,237) - (293,237)
Total non-derivatives (18,106) (9,597) (266,949) - (294,652)
Derivative liabilities
Net settled (interest rate swaps) (349) (382) (300) - (1,031)
Net settled (non-deliverable forward contracts) (526) (550) - - (1,076)
Gross settled (forward exchange contracts)
- inflow - 4,036 4,232 - 8,268
- outflow - (4,195) (4,467) - (8,662)
Total derivatives (875) (1,091) (535) - (2,501)
Year ended 30 June 2013
Non-derivative financial assets
Cash and cash equivalents 47,995 - - - 47,995
Trade and other receivables 94,067 - - - 94,067
Other assets 8,717 90 50 - 8,857
Non-derivative financial liabilities
Trade and other payables (118,724) - (3,105) - (121,829)
Interest bearing loans and borrowings (14,259) (16,403) (294,588) - (325,250)
Total Non-derivatives 17,796 (16,313) (297,643) - (296,160)
Derivative liabilities
Net settled (interest rate swaps) (325) (463) 1,003 - 215
Net settled (non-deliverable forward contracts) 58 - - - 58
Gross settled (forward exchange contracts)
- inflow 1,732 - - - 1,732
- outflow (1,674) - - - (1,674)
Total derivatives (209) (463) 1,003 - 331
M2 Annual Report 2014 - Notes to the Financial StatementsF
or p
erso
nal u
se o
nly

55
3. FINANCIAL RISK MANAGEMENT OBJECTIVES AND POLICIES (CONTINUED)
(d) Fair value measurements
AASB 13 requires disclosure of fair value measurements by level of the following fair value measurement hierarchy:
(a) quoted prices (unadjusted) in active markets for identical assets or liabilities (level 1)
(b) inputs other than quoted prices included within level 1 that are observable for the asset or liability, either directly or indirectly (level 2), and
(c) inputs for the asset or liability that are not based on observable market data unobservable inputs) (level 3).
The following table presents the Group’s financial assets and financial liabilities measured and recognised at fair value at 30 June 2013 and
30 June 2014 on a recurring basis:
Level 1 $000
Level 2 $000
Level 3 $000
TOTAL $000
Year ended 30 June 2014
Available-for-sale financial assets
Quoted securities 2,178 - - 2,178
Derivative assets
Electricity derivatives - - - -
Forward exchange contracts - - - -
Interest rate swaps - - - -
2,178 - - 2,178
Derivative liabilities
Electricity derivatives - (598) - (598)
Forward exchange contracts - (1,470) - (1,470)
Interest rate swaps - (1,031) - (1,031)
- (3,099) - (3,099)
2,178 (3,099) - (921)
Level 1 $000
Level 2 $000
Level 3 $000
TOTAL $000
Year ended 30 June 2013
Available-for-sale financial assets
Quoted securities - - - -
Derivative Assets
Electricity derivatives - 618 - 618
Forward exchange contracts - 115 - 115
Interest rate swaps - 216 - 216
- 949 - 949
Derivative Liabilities
Electricity derivatives - - - -
Forward exchange contracts - - - -
Interest rate swaps - - - -
- - - -
- 949 - 949
M2 Annual Report 2014 - Notes to the Financial StatementsF
or p
erso
nal u
se o
nly

56
4. SIGNIFICANT ACCOUNTING JUDGEMENTS, ESTIMATES AND ASSUMPTIONS
The preparation of the financial statements requires management to make judgements, estimates and assumptions that affect the reported amounts in the financial statements. Management continually evaluates its judgements and estimates in relation to assets, liabilities, contingent liabilities, revenue and expenses. Management bases its judgements and estimates on historical experience and on other various factors it believes to be reasonable under the circumstances, the result of which form the basis of the carrying values of assets and liabilities that are not readily apparent from other sources.
Management has identified the following critical accounting policies for which significant judgements, estimates and assumptions are made. Ac-tual results may differ from these estimates under different assumptions and conditions and may materially affect financial results or the financial position reported in future periods. Further details of the nature of these assumptions and conditions may be found in the relevant notes to the financial statements.
(a) Significant accounting judgements
Recovery of deferred tax assets
Deferred tax assets are recognised for deductible temporary differences as management considers that it is probable that future taxable profits will be available to utilise those temporary differences. Significant management judgement is required to determine the amount of deferred tax assets that can be recognised, based upon the likely timing and the level of future taxable profits over the next four years.
Impairment of non-financial assets other than goodwill and indefinite life intangibles
The Group assesses impairment of all assets at each reporting date by evaluating conditions specific to the Group and to the particular asset that may lead to impairment. These include product performance, technology, economic and political environments and future product expectations. If an impairment trigger exists, the recoverable amount of the asset is determined.
Taxation
The Group’s accounting policy for taxation requires management’s judgement as to the types of arrangements considered to be a tax on income in contrast to an operating cost. Judgement is also required in assessing whether deferred tax assets and certain deferred tax liabilities are recognised on the statement of financial position. Deferred tax assets, including those arising from unrecouped tax losses, capital losses and temporary differences, are recognised only where it is considered more likely than not that they will be recovered, which is dependent on the generation of sufficient future taxable profits.
Assumptions about the generation of future taxable profits depend on management’s estimates of future cash flows. These depend on estimates of future carrier costs, commissions and sales volumes, operating costs, restoration costs, capital expenditure, dividends and other capital man-agement transactions. Judgements are also required about the application of income tax legislation. These judgements and assumptions are subject to risk and uncertainty, hence there is a possibility that changes in circumstances will alter expectations, which may impact the amount of deferred tax assets and deferred tax liabilities recognised on the statement of financial position and the amount of other tax losses and temporary differences not yet recognised. In such circumstances, some or all of the carrying amounts of recognised deferred tax asset and liabilities may require adjustment, resulting in a corresponding credit or charge to the statement of comprehensive income.
(b) Significant accounting estimates and assumptions
Impairment of trade and other receivables
Management reviews its trade and other receivables for objective evidence of impairment regularly. Significant financial difficulties of the debtor, the probability that the debtor will enter bankruptcy, and default or significant delay in payments are considered objective evidence that a re-ceivable is impaired. In determining this, management makes judgement as to whether there is observable data indicating that there has been a significant change in the payment ability of the debtor, or whether there have been significant changes with adverse effect in the technological, market, economic or legal environment in which the debtor operates in.
Where there is objective evidence of impairment, management makes judgements as to whether an impairment loss should be recorded as an expense. In determining this, management uses estimates based on historical loss experience for assets with similar credit risk characteristics. The methodology and assumptions used for estimating both the amount and timing of future cash flows are reviewed regularly to reduce any differences between the estimated loss and actual loss experience.
Valuation techniques used to determine fair value
Available for sale financial assets uses observable values such as publically available equity prices at the end of the reporting period in the valu-ation and is classified as in the hierarchy as level 1.
The fair value of derivative financial instruments that are not traded on an active market is determined by using valuation methodologies and assumptions that are based on market conditions existing at the valuation date. These are classified in the hierarchy as level 2. These include:
• The use of forward electricity price curve derived from various inputs such as electricity futures market in calculating electricity derivatives.
• The interest rate yield curve and applying the net present value to future cash flows used in valuing interest rate swaps.
• The fair value of forward exchange contracts as determined by using forward exchange market rates in valuing forward exchange contracts.
3. FINANCIAL RISK MANAGEMENT OBJECTIVES AND POLICIES (CONTINUED)
M2 Annual Report 2014 - Notes to the Financial StatementsF
or p
erso
nal u
se o
nly

57
Impairment of goodwill and intangibles with indefinite useful lives
The Group determines whether goodwill and intangibles with indefinite useful lives are impaired at least on an annual basis. This requires an es-timation of the recoverable amount of the cash-generating units, using a value-in-use discounted cash flow methodology, to which the goodwill and intangibles with indefinite useful lives are allocated.
Share-based payment transactions
The Group measures the cost of equity-settled transactions with employees by reference to the fair value of the equity instruments at the date at which they are granted. The fair value is determined with the assistance of an external valuer using a binomial model. The accounting estimates and assumptions relating to equity-settled share-based payments would have no impact on the carrying amounts of assets and liabilities within the next annual reporting period but may impact expenses and equity.
Estimation of useful lives of plant and equipment
The charge in respect of periodic depreciation is derived after determining an estimate of an asset’s expected useful life and the expected residual value at the end of its life. Increasing an asset’s expected life or its residual value would result in a reduced depreciation charge in the consolidated income statement.
The useful lives and residual values of Group assets are determined by management at the time the asset is acquired and reviewed annually for appropriateness. The lives are based on historical experience with similar assets as well as anticipation of future events which may impact their life such as changes in technology. Furthermore network infrastructure is only depreciated over a period that extends beyond the expiry of the associated licence under which the operator provides telecommunications services if there is a reasonable expectation of renewal or an alterna-tive future use for the asset.
Historically, changes in useful lives and residual values have not resulted in material changes to the Group’s depreciation charge.
Estimation of useful lives of intangible assets
The useful life used to amortise intangible assets relates to the future performance of the assets acquired and management’s judgement of the period over which economic benefit will be derived from the asset. The basis for determining the useful life for the most significant categories of intangible assets is as follows:
• Licence fees The estimated useful life principally reflects management’s view of the average economic life of the customer base and is assessed by reference to customer churn rates. An increase in churn rates may lead to a reduction in the estimated useful life and an increase in the amortisation charge. Historically, charges to the estimated useful lives have not had a significant impact on the Group’s results and financial position.
• Software The useful life is determined by management at the time the software is acquired and brought into use and is regularly reviewed for ap-propriateness. For computer software licences, the useful life represents management’s view of expected benefits over which the Group will receive benefits from the software but not exceeding the licence term. For unique software products controlled by the Group, the life is based on historical experience with similar products as well as anticipation of future events which may impact their life such as changes in technology. Historically, changes in useful lives have not resulted in material changes to the Group’s amortisation charge.
• Indefeasible Rights to Use ('IRU') The useful life is determined by the remaining life of the contracts. The assets will be fully amortised once the contracts expire.
Fair value of financial instruments
When the fair value of financial assets and financial liabilities recorded in the statement of financial position cannot be derived from active markets, their fair value is determined using valuation techniques including the discounted cash flow model. The inputs to these models are taken from observable markets where possible, but where this is not feasible, a degree of judgement is required in establishing fair values. The judgements include considerations of inputs such as liquidity risk, credit risk and volatility. Changes in assumptions about these factors could affect the re-ported fair value of financial instruments. See Note 3 for further discussion.
Unbilled revenue
Unbilled revenue for gas and electricity is estimated at the end of the reporting period. Customers are billed on a periodic and regular basis. Management estimates customer consumption between the last invoice date and the end of the reporting period. This is based on preliminary usage obtained from external regulators at an estimated billed rate. Various assumptions and financial models are used to determine the esti-mated unbilled rate.
4. SIGNIFICANT ACCOUNTING JUDGEMENTS, ESTIMATES AND ASSUMPTIONS (CONTINUED)
M2 Annual Report 2014 - Notes to the Financial StatementsF
or p
erso
nal u
se o
nly

58
5. OPERATING SEGMENTS
Identification of reportable segments
The Group has identified its operating segments based on the internal reports that are reviewed and used by the executive management team (chief operating decision makers) in assessing performance and in determining the allocation of resources.
The operating segments are identified by management based on the manner in which the product is sold, whether Consumer, Business or Wholesale. Discrete financial information about each of these operating businesses is reported to the executive management team on at least a monthly basis.
The reportable segments are based on operating segments determined by the similarity of the products produced and sold and/or the services provided, as these are the sources of the Group’s major risks and have the most effect on the rates of return.
Types of products and services
The Group has three operating segments: Consumer, Business and Wholesale. The Group’s risks and rates of return are affected predominantly by differences in the markets served by these business units. Prior to 1 July 2013, the Group identified two segments and with this change, prior period comparatives have been prepared based on the current three operating segments.
The Consumer segment offers telecommunication services targeted at the residential market, including fixed line voice services, and data ser-vices as well as mobile services. In addition to this, the Consumer segment offers both electricity and gas services and financial services such as car, home and contents insurance products.
The Business segment offers packaged telecommunications services and energy targeted particularly to the small business market offering fixed line voice services, terrestrial broadband internet services, mobile, voice and data and electricity bundles.
The Wholesale segment offers the full suite of fixed line voice services, including line rental services, mobile voice and data services, terrestrial broadband internet services and mobile telephones to the telecommunications reseller market at wholesale rates.
Accounting policies and inter-segment transactions
The accounting policies used by the Group in reporting segments internally are the same as those contained in note 2 to the accounts and in the prior periods except as detailed below:
Corporate charges
Corporate charges comprise non-segmental expenses incurred by the various business functions that support Consumer, Business and Whole-sale operations. Some of these business functions include IT, finance, facilities and equipment, commercial, and head office.
Except for head office charges, all other corporate charges are allocated to each business segment on proportionate basis linked to segment revenue so as to determine a segment result. Head office charges remain unallocated due to the difficulty in obtaining a reliable measurement of amounts that can be reasonably allocated between Consumer, Business and Wholesale.
Income tax expenses
Income tax expense is calculated based on the segment operating net profit using a notional charge of 30% (2013: 30%). No effect is given for taxable or deductible temporary differences.
Unallocated items
It is the Group’s policy that if items of revenue and expenses are not allocated to operating segments, then any associated assets and liabilities are also not allocated to segments. This is to avoid asymmetrical allocations within segments which management believe would be inconsistent.
Major customers
The Group has no significant clients that individually account for more than 10% of external revenue.
M2 Annual Report 2014 - Notes to the Financial StatementsF
or p
erso
nal u
se o
nly

59
5. OPERATING SEGMENTS (CONTINUED)
The following tables present revenue and profit information for the years ended 30 June 2014 and 30 June 2013.
Consumer Business Wholesale Total
2014 $000
2013 $000
2014 $000
2013 $000
2014 $000
2013 $000
2014 $000
2013 $000
Revenue
Sales to external customers 579,827 263,942 345,591 334,001 98,963 83,096 1,024,381 681,039
Total revenue per income statement 1,024,381 681,039
Consumer Business Wholesale Total
2014 $000
2013 $000
2014 $000
2013 $000
2014 $000
2013 $000
2014 $000
2013 $000
Result
Segment net operating profit after tax
42,643 28,210 37,360 28,341 8,582 8,480 88,585 65,031
Reconciliation of segment net profit after tax to net profit before tax
Income tax expense - current and deferred 27,579 21,267
Head office charges - interest expense (14,276) (8,804)
Head office charges - employee benefits (4,516) (4,313)
Head office charges - miscellaneous (2,731) (8,136)
Net profit before tax per the statement of comprehensive income 94,641 65,045
Consumer Business Wholesale Unallocated Total
2014 $000
2013 $000
2014 $000
2013 $000
2014 $000
2013 $000
2014 $000
2013 $000
2014 $000
2013 $000
Depreciation & Amortisation
23,177 10,809 13,732 13,710 4,874 2,431 4,642 4,386 46,425 31,336
Income tax expense 18,275 13,929 16,011 13,959 3,678 3,634 (10,385) (10,255) 27,579 21,267
M2 Annual Report 2014 - Notes to the Financial StatementsF
or p
erso
nal u
se o
nly

60
6. REVENUE AND EXPENSES
2014 $000
2013 $000
(a) Revenue
Rendering of services 1,022,826 680,230
Interest income 1,555 809
1,024,381 681,039
(b) Other income
(Loss) / gain on disposal of plant and equipment (19) (11)
Other - 3,000
(19) 2,989
(c) Employee benefits expense
Wages and salaries 76,596 71,097
Defined contribution superannuation expense 6,471 5,807
Annual leave provision 7,391 4,901
Long service leave provision 30 635
90,488 82,440
(d) Depreciation and amortisation
Depreciation 12,424 9,458
Amortisation of software 3,965 3,837
Amortisation of customer contracts 26,276 14,590
Amortisation of IRU 3,760 3,451
46,425 31,336
(e) Other expenses
Selling and marketing 23,027 6,523
Business development 4,962 2,950
Facilities and equipment 17,006 11,971
Corporate 1,045 7,319
Professional fees 8,459 9,555
Bank fees 4,916 3,424
Bad debts 10,055 9,061
Operating lease 10,837 12,564
Outsourcing cost 39,549 3,937
Other 2,165 3,357
122,021 70,661
(f) Financing costs
Finance charges payable under finance leases and hire purchase contracts 1,584 35
Finance charges payable on bank loans 16,802 11,704
Finance charges payable on other loans 648 -
19,034 11,739
M2 Annual Report 2014 - Notes to the Financial StatementsF
or p
erso
nal u
se o
nly

61
7. INCOME TAX
(a) Income tax expense
The major components of income tax expense are:
2014 $000
2013 $000
Consolidated income statement:
Current income tax
Current income tax charge 20,606 26,524
Adjustments in respect of current income tax of previous years (3,919) (3,432)
Deferred income tax
Relating to origination and reversal of temporary differences 10,892 (1,825)
Income tax expense reported in the consolidated income statement 27,579 21,267
(b) Numerical reconciliation between aggregate tax expense recognised in the statement of comprehensive income and tax expense calculated per the statutory income tax rate
A reconciliation between tax expense and the product of accounting profit before income tax multiplied by the Group’s applicable tax rate is as follows:
2014 $000
2013 $000
Accounting profit before income tax 94,641 65,045
At the Group's statutory income tax rate of 30% (2013: 30%) 28,392 19,513
Non-temporary differences 572 3,065
Share based payments 189 169
Adjustments in respect of current income tax of previous years (3,919) (3,432)
Temporary difference not previously adjusted 2,345 1,551
Other - 401
Aggregate income tax expense 27,579 21,267
M2 Annual Report 2014 - Notes to the Financial StatementsF
or p
erso
nal u
se o
nly

62
(c) Recognised deferred tax assets and liabilities
Deferred income tax at 30 June 2014 relates to the following:
2014 $000
2013 $000
Deferred tax assets
Trade receivables 5,622 3,728
Plant and equipment 1,463 2,406
Intangibles 263 491
Trade and other payables 50 861
Other provisions 7,210 3,577
Leases - 532
Transaction cost on issue of shares 272 447
Cash flow hedge 762 -
Tax losses and temporary differences 390 558
Gross deferred tax assets 16,032 12,600
Deferred tax liabilities
Plant and equipment - 11
Other assets - deferred acquisition cost 6,953 5,494
Intangibles 15,959 23,359
Trade and other payables - 17
Gross deferred tax liabilities 22,912 28,881
2014 $000
2013 $000
Tax expense in consolidated income statement 27,579 21,267
Amounts recognised in the consolidated statement of financial position:
Deferred tax asset 16,032 12,600
Deferred tax liability (22,912) (28,881)
(6,880) (16,281)
2014 Current Income Tax
2014 Deferred Income Tax
2013 Current Income Tax
2013 Deferred Income Tax
$000 $000 $000 $000
Opening balance (14,737) (16,281) (13,112) (6,360)
Charged to income (20,606) (10,892) (26,524) 1,825
Payments 27,031 - 24,736 -
Acquisitions - 20,106 - (11,746)
Prior Year adjustment 4,586 187 163 -
Closing balance (3,726) (6,880) (14,737) (16,281)
7. INCOME TAX (CONTINUED)
M2 Annual Report 2014 - Notes to the Financial StatementsF
or p
erso
nal u
se o
nly

63
(d) Tax consolidation
Members of the tax consolidated group and the tax-sharing agreement
M2 Group Ltd and its 100% owned Australian subsidiaries formed a tax consolidated group with effect from 1 July 2004. M2 Group Ltd is the head entity of the tax consolidated group. Members of the Group have entered into a tax sharing agreement that provides for the allocation of income tax liabilities between the entities should the head entity default on its tax payment obligations. No amounts have been recognised in the financial statements in respect of this agreement on the basis that the possibility of default is remote.
Tax effect accounting by members of the tax consolidated group
Measurement method adopted under AASB Interpretation 1052 Tax Consolidated Accounting
The head entity and the controlled entities in the tax consolidated group continue to account for their own current and deferred tax amounts. The Group has applied the stand-alone taxpayer approach in determining the appropriate amount of current taxes and deferred taxes to allocate to members of the tax consolidated group. The current and deferred tax amounts are measured in a systematic manner that is consistent with the broad principles in AASB 112 Income Taxes. The nature of the tax funding agreement is discussed further below.
In addition to its current and deferred tax amounts, the head entity also recognises current tax liabilities (or assets) and the deferred tax assets arising from unused tax losses and unused tax credits assumed from controlled entities in the tax consolidated group.
Nature of the tax funding agreement
Members of the tax consolidated group have entered into a tax funding agreement. The tax funding agreement requires payments to/from the head entity to be recognised via an inter-entity receivable/(payable) which is at call. To the extent that there is a difference between the amount charged under the tax funding agreement and the allocation under AASB Interpretation 1052, the head entity accounts for these as equity trans-actions with the subsidiaries.
7. INCOME TAX (CONTINUED)
8. DIVIDENDS PAID AND PROPOSED
2014 $000
2013 $000
(a) Recognised amounts
Declared and paid during the year
Dividends on ordinary shares:
Final franked dividend for 2013: 10.0 cents (2012: 9.0 cents) 17,850 14,123
Interim franked dividend for 2014: 11.5 cents (2013: 10.0 cents) 20,642 15,854
38,492 29,977
(b) Unrecognised amounts
Dividends on ordinary shares:
Final franked dividend for 2014: 14.5 cents (2013: 10.0 cents) 26,171 17,850
(c) Franking credit balance
The tax rate at which paid dividends have been franked is 30% (2013: 30%).
Dividends proposed will be franked at the rate of 30% (2013: 30%).
2014 $000
2013 $000
The amount of franking credits available for the subsequent financial year are:
Franking account balance as at the end of the financial year at 30% (2013: 30%) 27,449 15,487
Franking credits that will arise from the payment of income tax payable as at the end of the financial year. 5,777 7,716
Franking debits that will arise from the payment of dividends as at the end of the financial year. (11,216) (7,650)
22,010 15,553
M2 Annual Report 2014 - Notes to the Financial StatementsF
or p
erso
nal u
se o
nly

64
9. EARNINGS PER SHARE
Earnings per share for profit attributable to the ordinary equity holders of the Parent:
2014 2013
• Basic earnings per share (cents) 37.34 27.36
• Diluted earnings per share (cents) 37.00 27.02
The following reflects the information used in the basic and diluted earnings per share computations:
2014 $000
2013 $000
(a) Earnings used in calculating earnings per share
For basic and diluted earnings per share:
Net profit attributable to ordinary equity holders of the Parent 66,963 44,052
(b) Weighted average number of shares
No ('000) No ('000)
Weighted average number of ordinary shares for basic earnings per share 179,325 160,987
Effect of dilution:
Share options 1,667 2,072
Weighted average number of ordinary shares adjusted for the effect of dilution 180,992 163,059
There have been no transactions (e.g. share options) excluded from the calculation of diluted earnings per share that could potentially dilute basic earnings per share in the future because they are antidilutive for either of the periods presented.
There have been no transactions involving ordinary shares or potential ordinary shares that would significantly change the number of ordinary shares or potential ordinary shares outstanding between the reporting date and the date of completion of these financial statements.
(c) Information on the classification of securities
Options granted to employees (including KMP) are considered to be potential ordinary shares and have been included in the determination of diluted earnings per share to the extent they are dilutive. These options have not been included in the determination of basic earnings per share.
M2 Annual Report 2014 - Notes to the Financial StatementsF
or p
erso
nal u
se o
nly

65
10. CASH AND CASH EQUIVALENTS
2014 $000
2013 $000
Cash at bank and in hand 40,269 36,845
Short-term deposits 700 11,150
40,969 47,995
Cash at bank earns interest at floating rates based on daily bank deposit rates.
Short-term deposits are made for varying periods of between one day and three months, depending on the immediate cash requirements of the Group, and earn interest at the respective short-term deposit rates.
(a) Reconciliation to statement of cash flows
For the purposes of the statement of cash flows, cash and cash equivalents comprise the following at 30 June:
2014 $000
2013 $000
Cash at bank and in hand 40,269 36,845
Short-term deposits 700 11,150
40,969 47,995
(b) Reconciliation of net profit after tax to net cash flows from operations
2014 $000
2013 $000
Net profit after tax 67,062 43,778
Adjustments for:
Depreciation and amortisation 46,425 31,336
Share based payments 631 563
Loss / (gain) on disposal of plant and equipment 19 11
Loss / (gain) on foreign currency translation 269 698
Share in profit of an associate (782) (164)
Other income - (3,000)
Changes in assets and liabilities
(Increase)/decrease in trade receivables (10,500) (5,992)
(Increase)/decrease in inventories (504) 2,114
(Increase)/decrease in other assets (4,201) (5,547)
(Increase)/decrease in other receivables 8,493 319
Increase/(decrease) in trade and other payables (11,868) (274)
Increase/(decrease) in provisions (9,857) 1,556
Increase/(decrease) in current income tax payable (11,011) (1,339)
(Increase)/decrease in deferred tax asset 17,437 694
Increase/(decrease) in deferred tax liability (5,969) (2,517)
Net cash flows from operating activities 85,644 62,236
M2 Annual Report 2014 - Notes to the Financial StatementsF
or p
erso
nal u
se o
nly

66
11. TRADE RECEIVABLES
2014 $000
2013 $000
Trade receivables 116,392 106,505
Allowance for impairment loss (a) (18,740) (12,438)
97,652 94,067
(a) Allowance for impairment loss
Trade receivables are non-interest bearing and are generally on 14-60 day terms. A provision for impairment loss is made when there is objective evidence that a trade receivable is impaired. An impairment loss of $10.1 million (2013: $9.1 million) has been recognised by the Group in the current year. This amount has been included in the other expenses item. No individual amount within the impairment allowance is material.
Movements in the provision for impairment loss were as follows:
2014 $000
2013 $000
At 1 July 12,438 8,940
Charge for the year 10,055 9,061
Opening balance sheet adjustment 4,393 -
Amounts written off (8,146) (5,563)
At 30 June 18,740 12,438
At 30 June, the aging analysis of trade receivables is as follows:
2014 2013
Consolidated Gross $000
Allowance $000
Gross $000
Allowance $000
Current 73,573 273 77,381 194
31 - 60 days 8,867 541 6,133 272
61 - 90 days 2,601 821 3,042 555
91 days and over 31,351 17,105 19,949 11,417
Closing balance 116,392 18,740 106,505 12,438
Trade receivables that are past due but not considered impaired amounted to $16.0 million (2013: $11.0 million). The ageing analysis of these trade receivables as follows:
2014 $000
2013 $000
61 - 90 days 1,779 2,487
91 days and over 14,246 8,532
At 30 June 16,026 11,019
Each operating unit has been in direct contact with the relevant debtor and is satisfied that the payment will be received in full.
Other balances within trade and other receivables do not contain impaired assets and are not past due. It is expected that these other balances will be received when due.
(b) Fair value and credit risk
Due to the short-term nature of these receivables, their carrying value is assumed to approximate their fair value.
The maximum exposure to credit risk is the fair value of receivables. Collateral is not held as security, nor is it the Group’s policy to transfer (on-sell) receivables to special purpose entities.
M2 Annual Report 2014 - Notes to the Financial StatementsF
or p
erso
nal u
se o
nly

67
12. INVENTORIES
2014 $000
2013 $000
Finished goods 5,388 4,884
Total inventories 5,388 4,884
Inventory recognised as expense for the year ended 30 June 2014 totalled $28.8 million (2013: $10.4 million) for the Group. This expense has been included in cost of sales in the consolidated income statement.
13. OTHER ASSETS
2014 $000
2013 $000
Current
Bartercard trade balance 633 465
Prepayments 5,671 5,854
Security deposit 140 260
Short-term deposit 253 8,627
Deferred acquisition cost 19,397 13,814
Other 84 170
Total current other assets 26,178 29,190
Non-current
Deferred acquisition cost 3,660 4,859
Other 495 397
Total non-current other assets 4,155 5,256
Total other assets 30,333 34,446
Bartercard is a program which allows customers to pay a percentage of their bills with barter dollars. Bartercard trade balance refers to those receivables from such customers.
Short-term deposit comprise of security deposits to the Australia Energy Market Operator for Dodo Power and Gas trading accounts.
M2 Annual Report 2014 - Notes to the Financial StatementsF
or p
erso
nal u
se o
nly

68
14. FINANCIAL ASSETS AND LIABILITIES
2014 $000
2013 $000
Current assets
Electricity derivatives - cash flow hedges ((a)(iii)) - 618
Forward exchange contracts - cash flow hedges ((a)(ii)) - 115
- 733
Non-current assets
Investments - Available for Sale 2,178 -
Interest rate swaps - cash flow hedges ((a)(i)) - 1,003
2,178 1,003
Total assets 2,178 1,736
Current liabilities
Electricity derivatives - cash flow hedges ((a)(iii)) (598) -
Forward exchange contracts - cash flow hedges ((a)(ii)) (1,235) -
Interest rate swaps - cash flow hedges ((a)(i)) (731) (787)
Total liabilities (2,564) (787)
Non-current liabilities
Forward exchange contracts - cash flow hedges ((a)(ii)) (235) -
Interest rate swaps - cash flow hedges ((a)(i)) (300) -
(535) -
Total liabilities (3,099) (787)
Net financial assets / (liabilities) (921) 949
(a) Instruments used by the Group
The Group is party to derivative financial instruments in the normal course of business in order to hedge exposure to fluctuations in interest, for-eign exchange and commodity rates in accordance with the Group’s financial risk management policies (refer to note 3).
(i) Interest rate swaps – cash flow hedges
On 30 May 2013, the Group entered into two interest swap agreements to protect the syndicated loan facility from exposure to increasing interest rates. A hedge relationship was designated on this date. Under this interest rate swap, the Group is obliged to receive interest at variable rate and to pay interest at fixed rate of 3.0475% per annum. The swaps cover 75% of the floating rate exposure under the facility.
The contracts require settlement of net interest receivable or payable each 90 days. The next settlement is on the 22 September 2014.
The gain or loss from remeasuring the hedging instruments at fair value is recognised in other comprehensive income and deferred in equity in the cash flow hedge reserve, to the extent that the hedge is effective. It is reclassified into profit or loss when the hedged interest expense is recognised. In the year ended 30 June 2014 a loss of $0.7 million has been reclassified from other comprehensive income into interest expense. There has been no ineffectiveness for the year ended 30 June 2014.
(ii) Forward exchange contracts – cash flow hedges
The Group have designated into forward exchange hedge relationship to buy and sell specified amount of foreign currency denominated in USD and Philippine Peso in the future at stipulated exchange rates. The objective of entering the forward exchange contracts is to protect the Group against unfavourable exchange rate movements for high probable forecasted purchase of inventory and payments for services.
The forward exchange contracts mature within the next financial year and have been designated based on forecasted foreign currency denomi-nated purchases. Gains or losses recognised in the cash flow hedge reserve in equity on forward foreign exchange contracts as of 30 June 2014 will be released to the income statement when the underlying anticipated transactions affect the income statement or included in the carrying value of asset or liabilities acquired. In the year ended 30 June 2014 a loss of $0.4 million has been reclassified from other comprehensive income into inventory and outsourcing cost. The terms of the foreign currency forward contracts match the terms of the expected highly probable forecast transactions. As a result, there is no hedge ineffectiveness which requires recognition through profit or loss.
M2 Annual Report 2014 - Notes to the Financial StatementsF
or p
erso
nal u
se o
nly

69
(iii) Electricity derivatives – cash flow hedges
The Group manages this exposure of floating purchase price of electricity through purchase of electricity future contracts electricity from AEMO (Australian Energy Market Operator). The hedged anticipated electricity purchase and sale transactions are expected to occur continuously for each half hour period throughout the next quarter from the reporting date consistent with the forecast demand from customers over this period. Gains or losses recognised in the cash flow hedge reserve in equity on the forward foreign exchange contracts as of 30 June 2014 will be released to the income statement when the underlying anticipated purchase or sale transactions are recognised in the income statement.
In the year ended 30 June 2014 a loss of $2.5 million has been reclassified from other comprehensive income into cost of sales. The ineffective-ness recognised in the income statement for the current year was $0.4 million.
(b) Risk exposures and fair value measurements
Information about the Group’s exposure to credit risk, foreign exchange and interest rate risk and about the methods and assumptions used in determining fair values is provided in note 3. The maximum exposure to credit risk at the end of the reporting period is the carrying amount of each class of derivative financial assets mentioned above.
14. FINANCIAL ASSETS AND LIABILITIES (CONTINUED)
15. INVESTMENT IN AN ASSOCIATE
The Group holds a 33% (2013: 32%) ownership interest in Aggregato Global Pty Ltd ('Aggregato'). Aggregato is a specialist prepaid call card operator in the telecommunications industry, operating primarily in Australia and the USA.
On 5 September 2013, the Group provided an advance amount of $5.5 million to Aggregato Global Limited. The advance was provided under a formal Loan Deed. The loan was converted to equity on 30 May 2014. The conversion of debt into additional equity enabled Aggregato to enter into an agreement to acquire certain assets relating to the international calling card business of publicly listed telecommunications provider Tel.Pacific Limited (ASX: TPC, 'Tel Pacific').
Summarised financial information of associates
The following table illustrates the summarised financial information of the Group’s investment in Aggregato Global Pty Ltd. The information dis-close reflect the amounts presented in the financial statements for Aggregato.
2014 $000
2013 $000
Current assets 11,227 3,064
Non-current assets 46,615 15,616
Current liabilities (9,946) (3,572)
Non-current liabilities (22,210) (2,537)
Equity 25,686 12,570
Group's share in % 32.84% 32.00%
Carrying amount of investment 8,435 4,022
2014 $000
2013 $000
Revenue 49,242 3,699
Net Profit after tax 2,381 709
Group's share of profit for the year 782 164
Aggregato Global Pty Ltd does not have any contingent assets or liabilities as at 30 June 2014.
M2 Annual Report 2014 - Notes to the Financial StatementsF
or p
erso
nal u
se o
nly

70
16. PLANT AND EQUIPMENT
The reconciliation of carrying amounts at beginning and end of the year is as follows:
2014 $000
2013 $000
COST
At 1 July 89,967 59,584
Additions 14,715 12,613
Acquisition through business combinations - 18,264
Disposals (4,098) (494)
At 30 June 100,584 89,967
ACCUMULATED DEPRECIATION
At 1 July 31,171 8,476
Depreciation charge for the year 12,424 9,458
Acquisition through business combinations - 13,433
Disposals (3,980) (196)
At 30 June 39,615 31,171
NET BOOK VALUE 60,969 58,796
Plant and equipment with carrying amount of $1.8 million (2013: $1.3 million) are held under finance leases.
17. INTANGIBLE ASSETS AND GOODWILL
(a) Reconciliation of carrying amounts at the beginning and end of the period
Software Customer Contracts
IRU Brands Goodwill Total
$000 $000 $000 $000 $000 $000
Year ended 30 June 2014
Balance at the beginning of the year 21,489 75,525 28,431 50,506 458,516 634,467
Additions 8,447 1,924 - - 232 10,603
Adjustments to fair value from provisional accounts - - - - (11,255) (11,255)
Write-offs (9) 9 - - - -
Amortisation charge for the year (3,965) (26,276) (3,760) - - (34,001)
Balance at the end of the year 25,962 51,182 24,671 50,506 447,493 599,814
At 30 June 2014
Cost (gross carrying amount) 37,113 91,083 32,500 50,506 447,493 658,695
Accumulated amortisation and impairment (11,151) (39,901) (7,829) - - (58,881)
Balance at end of the year 25,962 51,182 24,671 50,506 447,493 599,814
M2 Annual Report 2014 - Notes to the Financial StatementsF
or p
erso
nal u
se o
nly

71
Software Customer Contracts
IRU Brands Goodwill Total
$000 $000 $000 $000 $000 $000
Year ended 30 June 2013
Balance at the beginning of the year 14,305 37,111 31,882 21,341 194,791 299,430
Additions 7,930 - - - - 7,930
Acquisitions 3,117 53,004 - 29,165 263,725 349,011
Write-offs (26) - - - - (26)
Amortisation charge for the year (3,837) (14,590) (3,451) - - (21,878)
Balance at the end of the year 21,489 75,525 28,431 50,506 458,516 634,467
At 30 June 2013
Cost (gross carrying amount) 29,584 95,766 32,500 50,506 458,516 666,872
Accumulated amortisation and impairment (8,095) (20,241) (4,069) - - (32,405)
Balance at end of the year 21,489 75,525 28,431 50,506 458,516 634,467
(b) Description of the Group’s intangible assets and goodwill
Software
Software purchased in the normal course of business is amortised over a remaining life of 2 to 10 year period.
Customer contracts
Customer contracts are acquired through the acquisition of businesses and are amortised over a remaining life of 2 to 4 year period.
Indefeasible Right to Use ('IRU')
IRUs are acquired through the acquisition of businesses and are amortised over the remaining life of contracts which range from 2 to 12 years.
Brands
Brands are acquired through the acquisition of businesses and have indefinite useful lives. Brands are not amortised but are subject to impairment testing on an annual basis or whenever there is an indication of impairment.
Goodwill
After initial recognition, goodwill acquired in a business combination is measured at cost less any accumulated impairment losses. Goodwill is not amortised but is subject to impairment testing on an annual basis or whenever there is an indication of impairment.
(c) Impairment tests for goodwill and intangibles with indefinite useful lives
Description of cash generating units and other relevant information
Goodwill acquired through business combinations has been allocated to and are tested at the level of their respective cash generating units for impairment testing as follows:
• Consumer cash generating unit
• Business cash generating unit
• Wholesale cash generating unit
The recoverable amount of the cash generating units has been determined based on a value-in-use calculation using cash flow projections based on financial budgets approved by senior management covering a five year period.
The pre-tax, risk-adjusted discount rate applied to cash flow projections is 10.8% (2013: 13%). The same discount rates are applied all cash generating units.
The long-term growth rate used to extrapolate the cash flows of the consumer, business and wholesale sales units beyond the five-year period is 2.5%. The senior management of the units believes the growth rate is justified based on the acquisitions during the financial year, which resulted in increased customer base.
17. INTANGIBLE ASSETS AND GOODWILL (CONTINUED)
M2 Annual Report 2014 - Notes to the Financial StatementsF
or p
erso
nal u
se o
nly

72
18. TRADE AND OTHER PAYABLES
2014 $000
2013 $000
Trade payables 62,293 61,086
Accrued expenses 43,359 43,580
Withholding tax payable 743 624
Goods and services tax payable 5,270 3,605
Unearned income 19,780 20,772
Deferred commission revenue 27,626 44,968
Other payables 25,586 9,829
184,657 184,464
Trade and other payables are non-interest bearing and are normally settled on 30-day terms.
Due to the short-term nature of these payables, their carrying value is assumed to approximate their fair value. Information regarding interest rate and liquidity risk exposure is set out in note 3.
The carrying amount of brands and goodwill are monitored as a collection of CGUs that comprise of consumer, business and wholesale segments as follows.
2014 $000
2013 $000
Cash generating units
Consumer cash generating unit 39,084 39,084
Business cash generating unit 9,438 9,438
Wholesale cash generating unit 1,984 1,984
Total brands 50,506 50,506
2014 $000
2013 $000
Cash generating units
Consumer cash generating unit 283,443 275,592
Business cash generating unit 141,343 153,918
Wholesale cash generating unit 22,707 29,006
Total Goodwill 447,493 458,516
Key assumptions used in value-in-use calculations for the cash generating units for 30 June 2014 and 30 June 2013.
The following describes each key assumption on which management has based its cash flow projections when determining the value-in-use of the above mentioned cash generating units:
• Budgeted gross margins – the basis used to determine the value assigned to the budgeted gross margin is the average gross margin achieved in the year immediately before the budgeted year adjusted for the budgeted growth.
• Budgeted overheads – the basis used to determine the value assigned to the budgeted overheads is the average overheads achieved in the year immediately before the budgeted year adjusted for budgeted increase.
• Discount rates – discount rates reflect management’s estimate of the time value of money and the risks specific to each unit. This is the benchmark used by management to assess operating performance and to evaluate future investment proposals. In determining appropriate discount rates for each unit, regard has been given to the yield on a ten-year government bond at the beginning of the budgeted year and a risk premium.
• Growth rate estimates – the basis used for growth rates reflect management’s estimate, determined by future investment in sales generation methods and by growth rates achieved within the previous period.
17. INTANGIBLE ASSETS AND GOODWILL (CONTINUED)
M2 Annual Report 2014 - Notes to the Financial StatementsF
or p
erso
nal u
se o
nly

73
19. PROVISIONS
2014 $000
2013 $000
Current
Employee benefits 8,807 10,251
Make good provision (a) 216 3,057
Onerous contracts (b) 1,021 8,708
10,044 22,016
Non-Current
Employee benefits 952 1,262
Make good provision (a) 3,847 994
Onerous contracts (b) 362 1,473
5,161 3,729
15,205 25,745
Movements in each class of provision, except employee benefits are set out below:
Make Good $000
Onerous contract $000
At 1 July 2013 4,051 10,181
Additional provisions recognised 1,320 334
Reversal of provisions made (447) (560)
Utilised amount (861) (8,572)
At 30 June 2014 4,063 1,383
(a) Make good provision
A make good provision is recognised where there is a clause in the lease agreement, where upon vacating an office premise, the Group is to make good the premises to its original condition.
(b) Onerous contracts
A provision for onerous contracts is recognised where the Group has a contract under which the unavoidable costs of meeting the obligations under the contract exceed the economic benefits expected to be received under it. During the year, a reduction of provision for onerous contracts has been recognised on the opening balance sheet of the acquired Dodo business.
Refer to note 2(t) for the relevant accounting policy and a discussion of significant estimations and assumptions applied in the measurement of these provisions.
M2 Annual Report 2014 - Notes to the Financial StatementsF
or p
erso
nal u
se o
nly

74
20. INTEREST BEARING LOANS AND BORROWINGS
2014 $000
2013 $000
Current
Obligations under finance leases and hire purchase contracts (note 28(a)) 812 737
Bank loans 27,399 27,399
Other financial liabilities (note 28(b)) 2,637 2,437
30,848 30,573
Non-Current
Obligations under finance leases and hire purchase contracts (note 28(a)) 665 588
Bank loans 252,832 280,231
Subordinated loan 8,237 8,237
Other financial liabilities (note 28(b)) 2,904 5,621
264,638 294,677
The unsecured subordinated loan matures on 1 August 2016. The effective interest rate is fixed at 8%.
(a) Fair values
The carrying amounts of the Group’s current and non-current borrowings are carried at amortised cost and approximate their fair values.
(b) Interest rate and liquidity risk
Details regarding interest rate and liquidity risk are disclosed in note 3.
(c) Defaults and breaches
During the current and prior years, there were no defaults or breaches on any of the loans.
(d) Assets pledged as security
Bank borrowings are secured by fixed and floating charges over the business assets of the entities within the Group. Business assets include debtors (less than 90 days), inventory and plant and equipment.
21. OTHER NON-CURRENT LIABILITIES
2014 $000
2013 $000
Deferred commission revenue 272 12,855
Other payables 3,727 3,105
3,999 15,960
M2 Annual Report 2014 - Notes to the Financial StatementsF
or p
erso
nal u
se o
nly

75
22. CONTRIBUTED EQUITY
2014 $000
2013 $000
Ordinary shares - issued and fully paid 255,092 244,194
No (000) No (000)
Movements in ordinary shares on issue
Balance at beginning of the year 178,320 156,572
Share issue due to exercise of share options (a) 405 1,088
Share issue due to dividend reinvestment plan (b) 1,688 1,625
Share issue for acquisition of subsidiaries (c) 78 19,035
Balance at end of the year 180,491 178,320
(a) Share options
Information relating to the M2 Executive Management Team Share Option Plan ('ESOP') including details of options issued, exercised and lapsed during the financial year and options outstanding at the end of the reporting period, is set out in note 26.
(b) Dividend reinvestment plan
The company has established a dividend reinvestment plan under which holders of ordinary shares may elect to have all or part of their dividend entitlements satisfied by the issue of new ordinary shares rather than by being paid in cash. Shares are issued under the plan at a 5% discount to the market price.
(c) Shares issued for acquisition of subsidiaries
The company issued 78,230 shares for $965,358 as consideration to those Eftel shareholders who made an ‘All Shares’ Election after 30 June 2013 and before 31 July 2013 in response to the acquisition of Eftel in 2013.
Capital management strategy
When managing capital, management’s objective is to ensure the entity continues as a going concern as well as to maintain optimal returns to shareholders and benefits for other stakeholders. Management also aims to maintain a capital structure that ensures the lowest cost of capital available to the entity.
Management are constantly adjusting the capital structure to take advantage of favourable costs of capital or high returns on assets. As the mar-ket is constantly changing, management may change the amount of dividends to be paid to shareholders, return capital to shareholders, issue new shares or sell assets to reduce debt.
During 2014, management declared dividends of $38.5 million (2013: $30.0 million).
The Group is not subject to externally imposed capital requirements.
M2 Annual Report 2014 - Notes to the Financial StatementsF
or p
erso
nal u
se o
nly

76
23. RESERVES
2014 $000
2013 $000
Employee equity benefits reserve (a) 1,277 713
Foreign currency translation reserve (b) (101) (105)
Cash flow hedge reserve (c) (1,778) 966
Investment revaluation reserve (d) (1,466) 329
(2,068) 1,903
Movements:
(a) Employee equity benefits reserve
At 1 July 713 637
Options exercised (67) (487)
Share option reserve (note 26(a)) 353 563
Share rights reserve (note 26(a)) 278 -
At 30 June 1,277 713
b) Foreign currency translation reserve -
At 1 July (105) (102)
Net translation during the year 4 (3)
At 30 June (101) (105)
(c) Cash flow hedge reserve -
At 1 July 966 -
Net gain/(loss) on revaluation (6,779) 966
Transfer to net profit 3,273 -
Deferred tax (note 7(c)) 762 -
At 30 June (1,778) 966
(d) Investment revaluation reserve -
At 1 July 329 -
Net gain/(loss) on revaluation (1,795) 329
At 30 June (1,466) 329
a) Employee equity benefits reserve
The employee equity benefits reserve arises on the grant of options to executives and senior employees under the 'M2 Executive Management Team Share Option Plan ('ESOP').
b) Foreign currency translation reserve
The translation reserve comprises exchange differences arising on translation of the financial statements of foreign operations, as described in note 2(h).
c) Cash flow hedge reserve
The hedging reserve is used to record gains or losses on a hedging instrument in a cash flow hedge that are recognised to other comprehensive income, as described in note 2(s). Amounts are reclassified to profit or loss when the associated hedged transaction affects profit or loss.
d) Investment revaluation reserve
The investment revaluation reserve is used to record net asset revaluations that are recognised in other comprehensive income.
M2 Annual Report 2014 - Notes to the Financial StatementsF
or p
erso
nal u
se o
nly

77
24. RELATED PARTY DISCLOSURE
(a) Subsidiaries
The consolidated financial statements include the financial statements of M2 Group Ltd and the subsidiaries listed in the following table.
Name Country of Incorporation
% Equity Interest
2014 2013
M2 Telecommunications Pty Ltd Australia 100 100
- People Telecom Pty Ltd Australia 100 100
- People Telecommunications Pty Ltd Australia 100 100
- M2 NZ Ltd New Zealand 70 70
- Southern Cross Telco Pty Ltd Australia 100 100
- M2 Clear Pty Ltd Australia 100 100
M2 Loyalty Programs Pty Ltd Australia 100 100
M2 Wholesale Pty Ltd Australia 100 100
- M2 Wholesale Services Pty Ltd Australia 100 100
- Wholesale Communications Group Pty Ltd Australia 100 100
M2 Commander Pty Ltd Australia 100 100
Primus Telecom Holdings Pty Ltd Australia 100 100
- Primus Network (Australia) Pty Ltd Australia 100 100
- Primus Telecom Pty Ltd Australia 100 100
- Hotkey Internet Services Pty Ltd Australia 100 100
- Primus Telecommunications Pty Ltd Australia 100 100
- Primus Telecommunications (Australia) Pty Ltd Australia 100 100
Dodo Australia Holdings Pty Ltd Australia 100 100
- Dodo Group Services Pty Ltd Australia 100 100
- Pendo Industries Pty Ltd Australia 100 100
- Dodo Services Pty Ltd Australia 100 100
- Dodo Insurance Pty Ltd Australia 100 100
- Secureway Pty Ltd Australia 100 100
- M2 Energy Pty Ltd (previously named Dodo Power and Gas Pty Ltd) Australia 100 100
- No Worries Online Pty Ltd Australia 100 -
Eftel Ltd Australia 100 100
- Eftel Wholesale Pty Ltd Australia 100 100
- Visage Telecom Pty Ltd Australia 100 100
- Keypoint Pty Ltd Australia 100 100
- ClubTelco Pty Ltd Australia 100 100
- Eftel Corporate Pty Ltd Australia 100 100
- Engin Pty Ltd Australia 100 100
- Datafast Telecommunications Pty Ltd Australia 100 100
- Eftel Retail Pty Ltd Australia 100 100
- Eftel Radio Pty Ltd Australia 100 100
- Eftel Tasmania Pty Ltd Australia 100 100
- Spacenet Holdings Pty Ltd Australia 100 100
- Eftel Rural Pty Ltd Australia 100 100
- Q-Net Australia Pty Ltd Australia 100 100
M2 Annual Report 2014 - Notes to the Financial StatementsF
or p
erso
nal u
se o
nly

78
24. RELATED PARTY DISCLOSURE (CONTINUED)
The following subsidiaries have been deregistered during the 2014 financial year or are in the process of deregistration.
Name Country of Incorporation
% Equity Interest
2014 2013
Orion Telecommunications Pty Ltd Australia - 100
Acquired through Eftel:
- Xcomm (WA) Pty Ltd Australia - 100
- Network Technology Pty Ltd Australia - 100
- Northvoice Communications Pty Ltd Australia - 100
- Vivanet Pty Ltd Australia - 100
- M Power Technologies Pty Ltd Australia - 100
- Tower.net Pty Ltd Australia - 100
- Southern Star Technologies Pty Ltd Australia - 100
- Quality Internet Services Pty Ltd Australia - 100
- Planet Netcom Pty Ltd Australia - 100
- Planet Netcom Radioworx Pty Ltd Australia - 100
- Datafast (Melbourne Central) Pty Ltd Australia - 100
- Datafast (Sites) Pty Ltd Australia - 100
- Viva.com Pty Ltd Australia - 100
- Vivanet Australia Pty Ltd Australia - 100
- Business Technologies Pty Ltd Australia 100 100
(b) Ultimate parent
M2 Group Ltd is the ultimate parent entity.
(c) Key management personnel ('KMP')
Details relating to KMP, including remuneration paid, are included in the remuneration report.
(d) Transactions and balances with key management personel and their related parties
The following table provides the total amount of transactions that were entered into with related parties for the relevant financial year.
Sales to related parties $000
Purchases to related parties $000
Directors
Craig Farrow(1) 2014 17 -
2013 13 -
Vaughan Bowen(2) 2014 1,297 742
2013 369 50
John Hynd(3) 2014 1 -
2013 - -
Michael Simmons(4) 2014 2 -
2013 - -
(1) Telecommunications services were provided to Brentnalls SA and Petcraky Pty Ltd. Mr Farrow is a director of both companies. (2) Membership fees were paid to Telco Together Foundation. Mr Bowen is the chairman of the Foundation. Telecommunication services were provided between M2 Group Ltd and Aggregato Global Limited and its subsidiaries. Mr Bowen is the Non-Executive Chairman of Aggregato Global Ltd, receiving a fee of $25,000pa for that position, and holds 8.16% of the shares of that company.As at 30 June 2014, there is a net receivable amount of $0.7 million outstanding from Aggregato to the Group.(3) Telecommunications services were provided to Hynd & Co Pty Ltd. Mr Hynd is a director of the firm Hynd & Co Pty Ltd.(4) Telecommunications services were provided to Luab Pty Ltd. Mr Simmons is a director of Luab Pty Ltd. Telecommunications and Insurances services were also provided to Michael Simmons.
M2 Annual Report 2014 - Notes to the Financial StatementsF
or p
erso
nal u
se o
nly

79
Terms and conditions of transactions with related parties
Outstanding balances at year-end are unsecured, interest free and settlement occurs in cash.
Allowance for impairment loss on trade receivables
For the year ended 30 June 2014, the Group has not made any allowance for doubtful debts relating to amounts owed by related parties as there were very little indicators to trigger such action (2013: $nil). An impairment assessment is undertaken each financial year by examining the financial position of the related party and the market in which the related party operates to determine whether there is objective evidence that a related party receivable is impaired. When such objective evidence exists, the Group recognises an allowance for the impairment loss.
25. KEY MANAGEMENT PERSONNEL
Compensation for key management personnel
2014 $000
2013 $000
Short-term employee benefits 4,061 3,372
Termination benefits - 179
Post employment benefits 125 129
Other long term benefits 188 225
Share-based payment 365 250
Total compensation 4,739 4,155
The compensation of each member of the Group’s 2014 key management personnel for the current and prior year is set out in the Remuneration Report as part of the Director’s Report.
M2 Annual Report 2014 - Notes to the Financial Statements
24. RELATED PARTY DISCLOSURE (CONTINUED)
For
per
sona
l use
onl
y

80
26. SHARE BASED PAYMENT PLANS
(a) Recognised share-based payment expenses
The expense recognised for employee services received during the year is shown in the table below:
2014 $000
2013 $000
Expense arising from equity-settled share based payment transactions
- M2 Executive Management Team Share Option ('ESOP') 353 563
- M2 Long Term Incentive Plan ('LTI') 278 -
Total expense arising from share based payment transactions 631 563
The share-based payment plans are described below. There have been no cancellations or modifications to any of the plans during 2014.
(b) Types of share-based payment plans
(i) M2 Executive Management Team Share Option Plan ('ESOP')
In February 2007, M2 introduced the M2 Executive Management Team Share Option Plan, and later in May 2009 this was extended to selected employees. The purpose of the ESOP was to provide an avenue for the alignment of Executive and employee objectives with those of sharehold-ers, and to provide an additional element to Executive and employee remuneration that was competitive to the external compensation environ-ment. The issue of options under ESOP further allows an opportunity for the Board to reward Executives and employees for their performance in a given period.
All senior Executives and selected employees of M2 were eligible to participate in the ESOP. However, the issue of options under the ESOP to Executive directors is subject to approval by M2 shareholders.
Under the ESOP, Executives and selected employees may be offered options to acquire M2 Shares. Any shares issued under the ESOP con-sequent upon exercise of the options will rank equally with all other M2 Shares and application will be made for them to be quoted on ASX. No application will be made for the options to be quoted on ASX.
Options issued under the ESOP vest (and may only then be exercised) one, two and three years (as determined by the M2 Board) after they are offered to the eligible Executive or employee.
Unless the M2 Board determines otherwise, no fee will be payable on the issue of any option under the ESOP. The exercise price for each option (payable on exercise of the option) will be determined by the Board at the time of issue of the option.
Options issued under the ESOP may be exercised, once they are vested, at any time within two years from the date on which they vest. Other than continuous service conditions with the Company, there are no performance conditions which must be met prior to the vesting or exercise of options.
Options are not generally transferable (and only with board approval) and cease to be exercisable at the end of the exercise period or within a specified time after the cessation of the Executive’s or employee’s employment (which time depends on the circumstances of the cessation).
An option holder may not attend and vote at annual general meetings and other shareholder meetings and is not entitled to participate in any rights issues unless the options have been exercised. Any bonus issue will proportionately increase the number of options held by any Executive or employee who has been granted options.
(ii) Long term incentive (LTI) plan
The M2 Board has introduced a LTI Plan from 1 July 2013 and all Executives have been invited to participate. The key driver of the LTI Plan is to provide a variable remuneration component that was competitive, aligned to shareholder returns over a longer period, and on terms that were acceptable to Australian investors, based on market standards. It has also been structured to appropriately incentivise Executives and promote retention.
The grant of the LTI is in the form of performance rights that can be settled in M2 shares or cash with a performance period of 1 July 2013 to 30 June 2016. As the rights vest upon satisfaction of certain performance conditions, the exercise price of the rights has been set at $0.00.
Other key features of the LTI Plan including performances measures and hurdles are outlined in the Remuneration Report.
M2 Annual Report 2014 - Notes to the Financial StatementsF
or p
erso
nal u
se o
nly

81
(c) Summaries of movements and other information
The following table illustrates the number and weighted average exercise prices (WAEP) of, and movements in, share options and performance rights:
Options (ESOP) Performance rights (LTI)
Number WAEP Number WAEP
Outstanding as at 30 June 2012 2,660,000 $2.489 - -
Granted 500,000 $6.47 - -
Expired - - - -
Forfeited - - - -
Exercised (1,088,332) $2.147 - -
Outstanding as at 30 June 2013 2,071,668 $3.810 - -
Granted - - 167,586 $0.00
Expired - - - -
Forfeited - - (13,812) -
Exercised (404,999) $2.692 - -
Outstanding as at 30 June 2014 1,666,669 $4.013 153,774 $0.00
The outstanding balance of share options ('ESOP') as at 30 June 2014 is represented by 1,666,669 executive options with exercise price ranging from $1.84 to $6.75, exercisable dates ranging from 1 January 2013 to 1 January 2019.
The outstanding balance of performance rights ('LTI') as at 30 June 2014 is represented by 167,586 share rights.
(d) Weighted average remaining contractual life
The weighted average remaining contractual life for the share options outstanding as at 30 June 2014 is 3 years (2013: 3 years).
(e) Range of exercise price
The range of exercise prices for all options outstanding at the end of the financial year was $1.84 to $6.75 (2013: $1.84 to $6.75).
The exercise price for the performance rights under the LTI is $0.00.
(f) Weighted average fair value
No options granted were in the 2014 financial year. The weighted average fair value of options granted in the 2013 financial year was $0.83.
The weighted average fair value of the performance rights granted in the 2014 financial year is $2.96. No performance rights were granted in the 2013 financial year.
(g) Option pricing model
The fair value of the equity-settled share options granted under the ESOP and performance rights under the LTI is estimated as at the grant date using a Binomial Model taking into account the terms and conditions upon which the options and performance rights were granted.
The following table lists the inputs to the Binomial Model used for the year ended 30 June:
20141 20132
Dividend yield (%) 3.36% 3.19%
Expected volatility (%) 31.54% 27.04%
Risk-free interest rate (%) 2.82% 2.52%
Expected life of option (years) 3 years 3 years
Option exercise price ($) $0.00 $6.19, $6.47, $6.75
Weighted average share price at measurement date ($) $5.66 $6.47
Model used Binomial Binomial
(1) These inputs were used for the performance rights under the LTI granted in the 2014 financial year.(2) These inputs were used for the share options granted under the ESOP in the 2013 financial year.
M2 Annual Report 2014 - Notes to the Financial Statements
26. SHARE BASED PAYMENT (CONTINUED)
For
per
sona
l use
onl
y

82
27. BUSINESS COMBINATIONS
Prior year acquisitions
(a) Dodo Group
On 1 May 2013, M2 Group Ltd completed the 100% acquisition of Dodo Australia Holdings Pty Ltd and its related bodies corporate ('Dodo'), a telecommunications, utilities and insurance provider to the residential market. The acquisition of Dodo complements M2’s existing consumer division, adding considerable scale and profit, the nationally recognised Dodo brand has demonstrated organic growth capability and refined back-of-house operations.
Dodo was acquired by M2 for a combination of cash and scrip consideration, valued at $203.9 million, on a debt-free and cash-free basis. The acquisition was funded via a 3 year, $400 million syndicated loan facility. This loan facility has also been utilised to refinance existing debts.
Due to the timing of the acquisition, the provisional fair value of the identified assets and liabilities of Dodo as of the date of acquisition have been reported for the year ended 30 June 2013.
After further assessment, the fair value of the identified assets and liabilities of Dodo as of the date of acquisition have been adjusted during the current year. Effects of these adjustments on balance sheet are illustrated in the following table:
Consolidated Provisional $000
Consolidated Final $000
Cash and cash equivalents 7,004 7,004
Trade and other receivables 23,605 22,152
Inventories 5,903 5,903
Other assets 974 974
Plant and equipment 1,815 1,815
Customer base 41,647 41,647
Brand names 26,388 26,388
Intangible assets 2,948 2,948
Deferred tax asset / (liability) (12,001) 7,714
Trade and other payables (105,326) (105,326)
Income tax payable (4) (4)
Provisions (10,107) (10,456)
Fair value of identifiable net assets (17,154) 759
Goodwill arising from acquisition 221,089 203,176
203,935 203,935
Consolidated Provisional $000
Consolidated Final $000
Purchase consideration:
Cash paid 157,688 157,688
Scrip paid 46,247 46,247
Total purchase consideration 203,935 203,935
M2 Annual Report 2014 - Notes to the Financial StatementsF
or p
erso
nal u
se o
nly
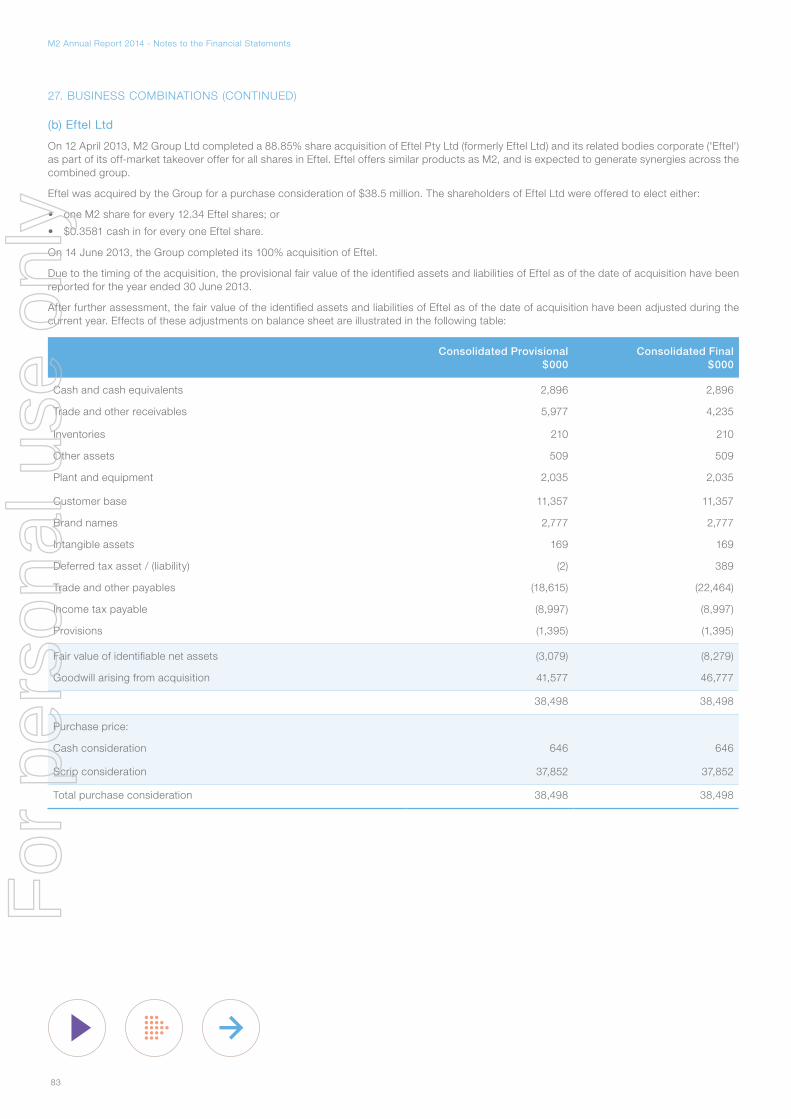
83
(b) Eftel Ltd
On 12 April 2013, M2 Group Ltd completed a 88.85% share acquisition of Eftel Pty Ltd (formerly Eftel Ltd) and its related bodies corporate ('Eftel') as part of its off-market takeover offer for all shares in Eftel. Eftel offers similar products as M2, and is expected to generate synergies across the combined group.
Eftel was acquired by the Group for a purchase consideration of $38.5 million. The shareholders of Eftel Ltd were offered to elect either:
• one M2 share for every 12.34 Eftel shares; or
• $0.3581 cash in for every one Eftel share.
On 14 June 2013, the Group completed its 100% acquisition of Eftel.
Due to the timing of the acquisition, the provisional fair value of the identified assets and liabilities of Eftel as of the date of acquisition have been reported for the year ended 30 June 2013.
After further assessment, the fair value of the identified assets and liabilities of Eftel as of the date of acquisition have been adjusted during the current year. Effects of these adjustments on balance sheet are illustrated in the following table:
Consolidated Provisional $000
Consolidated Final $000
Cash and cash equivalents 2,896 2,896
Trade and other receivables 5,977 4,235
Inventories 210 210
Other assets 509 509
Plant and equipment 2,035 2,035
Customer base 11,357 11,357
Brand names 2,777 2,777
Intangible assets 169 169
Deferred tax asset / (liability) (2) 389
Trade and other payables (18,615) (22,464)
Income tax payable (8,997) (8,997)
Provisions (1,395) (1,395)
Fair value of identifiable net assets (3,079) (8,279)
Goodwill arising from acquisition 41,577 46,777
38,498 38,498
Purchase price:
Cash consideration 646 646
Scrip consideration 37,852 37,852
Total purchase consideration 38,498 38,498
M2 Annual Report 2014 - Notes to the Financial Statements
27. BUSINESS COMBINATIONS (CONTINUED)
For
per
sona
l use
onl
y

84
28. COMMITMENTS
(a) Leasing commitments
Operating lease commitments – Group as lessee
The Group has entered into commercial leases on offices and certain plant and equipment. Future minimum lease payments under non-cancel-lable operating leases as at 30 June are as follows:
2014 $000
2013 $000
Within one year 8,495 8,836
After one year but not more than five years 31,721 34,511
More than five years 14,715 19,500
Total minimum lease payments 54,931 62,847
Finance lease and hire purchase commitments – Group as lessee
These lease contracts expire within one to four years. Future minimum lease payments under finance lease and hire purchase contracts as at 30 June are as follows:
2014 $000
2013 $000
Within one year 879 787
After one year but not more than five years 665 605
Total minimum lease payments 1,544 1,392
Less amounts representing finance charges (67) (67)
Present value of minimum lease payments 1,477 1,325
(b) Other financial liabilities
2014 $000
2013 $000
Within one year 2,637 2,437
After one year but not more than five years 2,904 5,621
Total minimum lease payments 5,541 8,058
These other financial liabilities relate to the Indefeasible Right to Use of capacity ('IRU') arising from the Primus acquisition.
(c) Capital commitments
The Group had contractual obligations to purchase plant and equipment, software and other value added services for $2.4 million at 30 June 2014 (2013: $0.8 million) principally relating to soft switches and gateways.
29. CONTINGENCIES
There are no contingent assets or liabilities as at Statement of Financial Position date.
30. DEFICIENCY IN NET CURRENT POSITION
As at 30 June 2014, the Group has a deficiency of net current assets of $61.7 million (2013: $75.7 million) which relates primarily to liabilities for deferred commission revenue of $27.6 million (2013: $45.0 million) and bank loan of $27.4 million (2013: $27.4 million).
Commission revenue is deferred and will be recognised in the next financial year through the income statement in line with the accounting policy (see note 2(w)) and is a non-cash item. The bank loan was raised to fund acquisitions and will be repaid from operating cash flow in the next financial year.
M2 Annual Report 2014 - Notes to the Financial StatementsF
or p
erso
nal u
se o
nly

85
31. EVENTS AFTER BALANCE DATEOn 22 August 2014, the directors declared a final dividend on ordinary shares in respect of the 2014 financial year. The total amount of the divi-dend is $26.2 million which represents a fully franked dividend of 14.5 cents per share (on shares issued as at 30 June 2014). This final dividend will be paid to shareholders on 30 October 2014.
32. PARENT ENTITY INFORMATION
The parent entity is M2.
2014 $000
2013 $000
Current assets 265,026 279,550
Total assets 574,731 587,736
Current liabilities 32,886 49,832
Total liabilities 290,049 336,780
Issued capital 255,091 244,194
Retained earnings 30,144 6,049
Equity reserves (553) 713
Total shareholders' equity 284,682 250,956
Profit or (loss) and total comprehensive income of the parent entity 62,587 30,087
The parent entity has no commitments or contingencies as of reporting date.
33. AUDITOR’S REMUNERATIONThe auditor of M2 Group Ltd is Ernst & Young.
2014 $
2013 $
Amounts received or due and receivable by Ernst & Young (Australia) for:
• An audit or review of the financial report of the entity and any other entity within the consolidated group
531,696 409,940
• Other services in relation to the entity and any other entities in the consolidated group:
- Due diligence and other assurance services 28,325 501,774
- Revenue assurance services - 86,000
560,021 997,714
M2 Annual Report 2014 - Notes to the Financial StatementsF
or p
erso
nal u
se o
nly

86
M2 Annual Report 2014 - Directors’ Declaration
DIRECTORS’
DECLARATION
In accordance with a resolution of the directors of M2 Group Ltd:
1. In the opinion of the directors:
(a) The financial statements, notes and the additional disclosures included in the directors’ report designated as audited, of the Company and of the consolidated entity are in accordance with the Corporations Act 2001, including:
(i) Giving a true and fair view of the Company’s and consolidated entity’s financial po-sition as at 30 June 2014 and of their performance for the year ended on that date
(ii) Complying with Accounting Standards (including the Australian Accounting Inter-pretations) and Corporations Regulations 2001
(b) The financial statements and notes comply with International Financial Reporting Stan-dards as disclosed in note 2(b)
(c) There are reasonable grounds to believe that the Company will be able to pay its debts as and when they become due and payable.
2. This declaration has been made after receiving the declarations required to be
made to the directors in accordance with section
295A of the Corporations Act 2001 for the financial year ended 30 June 2014.
On behalf of the directors,
Craig FarrowChairman Melbourne, 22 August 2014
For
per
sona
l use
onl
y

87
For
per
sona
l use
onl
y

88
For
per
sona
l use
onl
y

M2 Annual Report 2014 - ASX Additional Information
ASX ADDITIONAL
INFORMATION
89
Additional information required by the Australian Securities Exchance Ltd listing rules and now shown elsewhere in this report is as follows. This information is current as at 20 August 2014.
(a) Distribution of equity holders of securities
(i) Ordinary share capital
180,491,516 fully paid ordinary shares are held by 15,772 shareholders.
(ii) Options
1,666,669 options are held by 10 individual option holders.
The numbers of shareholders, by size of holding, in each class are:
Range Securities No of Holders
100,001 and Over 117,755,763 112
10,001 to 100,000 29,169,932 1,257
5,001 to 10,000 12,306,387 1,653
1,001 to 5,000 18,465,521 7,113
1 to 1,000 2,793,913 5,637
Total 180,491,516 15,772
Unmarketable Parcels 7,599 463
(b) Substantial holders
Names of the Company's substantial shareholders and the number of ordinary securities they hold a relevant interest in, as disclosed in the latest substantial holdings notices provided to the Company:
Name of substantial shareholder Name of registered holder(s) Number of ordinary shares % issued capital
Larry Kestleman Cannes Holdings Pty Ltd 12,605,038 7
Cannes Management Pty Ltd
CT Oz Pty Ltd
For
per
sona
l use
onl
y

ASX ADDITIONAL
INFORMATION
M2 Annual Report 2014 - ASX Additional Information
90
(c) Twenty Largest Shareholders
Names of M2's 20 largest shareholders of ordinary shares and the percentage of capital each holds:
Rank Name A/C Designation Number of Shares
%
1 HSBC CUSTODY NOMINEES (AUSTRALIA) LIMITED 20,748,751 11.50%
2 J P MORGAN NOMINEES AUSTRALIA LIMITED 18,976,695 10.51%
3 NATIONAL NOMINEES LIMITED 8,720,146 4.83%
4 UBS WEALTH MANAGEMENT AUSTRALIA NOMINEES PTY LTD
7,188,216 3.98%
5 CITICORP NOMINEES PTY LIMITED 5,684,941 3.15%
6 BNP PARIBAS NOMS PTY LTD <DRP> 5,139,611 2.85%
7 MR VAUGHAN BOWEN V G BOWEN FAMILY 3,773,750 2.09%
8 CANNES HOLDINGS PTY LTD <KESTELMAN FAMILY A/C> 3,621,887 2.01%
9 CANNES HOLDINGS PTY LTD <THE KESTELMAN FAMILY A/C> 2,700,000 1.50%
10 CANNES MANAGEMENT PTY LTD <KESTELMAN FAMILY NO 2 A/C> 2,398,113 1.33%
11 DENNIS N BASHEER SUPERANNUATION PTY LTD <DENNIS N BASHEER S/F A/C> 2,067,295 1.15%
12 RINDECO PTY LTD SLEPOY FAMILY 2,064,445 1.14%
13 THIRTY FOURTH ZULU PTY LTD <HAMILTON SUPERFUND A/C> 2,053,490 1.14%
14 CT OZ PTY LTD 1,953,536 1.08%
15 RINDECO PTY LTD <SLEPOY FAMILY A/C> 1,389,885 0.77%
16 CITICORP NOMINEES PTY LIMITED <COLONIAL FIRST STATE INV A/C> 1,204,741 0.67%
17 MR VAUGHAN GARFIELD BOWEN & MRS CAROLINA NUNN
<BOWEN FAMILY SUPER FUND A/C> 1,185,338 0.66%
18 EMTEL PTY LTD 920,000 0.51%
18 HYLAND SECURITIES PTY LTD <THE HYLAND A/C> 920,000 0.51%
19 REVEN PTY LIMITED <FAYE HAMILTON-HAMILTON FAMILYA/C> 890,389 0.49%
20 MIS INVESTMENTS PTY LTD <THE SLEPOY FAMILY NO 3 A/C> 876,520 0.49%
TOTAL 94,477,749 52.34%
Balance of Register 86,013,767 47.66%
Grand TOTAL 180,491,516 100.00%
VOTING RIGHTS – ORDINARY SHARESBy virtue of the Company’s Constitution, outlined in clause 10, voting rights for ordinary shares are:
(1) on a show of hands, every Member present, in person or by proxy, attorney or representative, has one vote; and
(2) on a poll every Member has:
(i) one vote for each fully paid share; and
(ii) for each partly paid share held by the Member, a fraction of a vote equivalent to the proportion which the amount paid (not credited) is of the total amounts paid and payable (excluding amounts credited) on the share.
RESTRICTED SECURITIESAt 30 June 2014, M2 had 102,894 shares (purchased by team members) held in escrow, per the terms of its Employee Share Plan (Salary Sacrifice).
ON-MARKET BUY-BACKThere is no on-market share buy-back in operation.
For
per
sona
l use
onl
y

M2 Annual Report 2014 - Corporate Directory
91
CORPORATE
DIRECTORY
M2 GROUP LTD
ACN 091 575 021
ABN 74 091 575 021
M2 is a publicly listed company, limited by shares. It is incorporated and domiciled in Australia.
REGISTERED OFFICE
Level 10, 452 Flinders Street Melbourne VIC 3000
Telephone : 03 9923 3000
Facsimile : 03 9674 6599
Web : www.m2.com.au
STOCK EXCHANGE
Australian Securities Exchange Ltd (ASX)
Issuer code: MTU
DIRECTORS
Craig Farrow Chairman
Vaughan Bowen Executive Director
John Hynd Non Executive Director
Michael Simmons Non Executive Director
David Rampa Non Executive Director
COMPANY SECRETARY
Ashe-lee Jegathesan
CHIEF EXECUTIVE OFFICER
Geoff Horth
CHIEF FINANCIAL OFFICER
Darryl Inns
AUDITOR
Ernst & Young
8 Exhibition Street Melbourne, VIC 3000
SHARE REGISTRY
Link Market Services Limited
Level 4, 333 Collins Street Melbourne, VIC 3000
Telephone: 02 8280 7111 or 1300 554 474
www.linkmarketservices.com.au
For
per
sona
l use
onl
y

www.m2.com.au
For
per
sona
l use
onl
y