Embed Size (px)
Citation preview

APPENDIX A Well Test Plan


WELL TEST PLAN
TIERRA DEL SOL SOLAR FARM SAN DIEGO COUNTY, TIERRA DEL SOL, CALIFORNIA
Prepared by: 605 Third Street Encinitas, California 92024 Prepared for: Tierra Del Sol Solar Farm, LLC County of San Diego c/o Soitec Solar Development, LLC Dept. Planning Land Use 4250 Executive Square, 770 5201 Ruffin Road, Suite B La Jolla, CA 92037 San Diego, CA 92123 Contact: Patrick Brown Contact: Jim Bennett
__________________ __________________ Stephen K. Dickey Trey Driscoll
Senior Hydrogeologist, PG, CHG, CEG Hydrogeologist, PG, CHG
JULY 2012

Well Test Plan Page ii 7123-5 Tierra Del Sol Solar Farm, LLC Dudek San Diego County, Tierra Del Sol, California July 2012
TABLE OF CONTENTS 1. Introduction ................................................................................................................. 1
1.1. Purpose of the Well Test Plan .............................................................................. 12. Geology ....................................................................................................................... 13. Proposed Aquifer Test: Well B ................................................................................... 1
3.1. Well B (Pumping Well)........................................................................................ 23.2. On-site Wells (Monitoring Wells) ....................................................................... 4
4. Proposed Well Test Analysis ...................................................................................... 74.1. Aquifer Hydraulic Properties Analysis ................................................................ 74.2. Groundwater Dependent Habitat Analysis ........................................................... 8
5. References ................................................................................................................. 10
LIST OF TABLES
TABLE 1 Well B – Exploratory Borehole Total Flow and Change if Flow TABLE 2 Well B – Simplified Lithologic Log TABLE 3 Well B – Construction Materials and Lengths/Volumes TABLE 4 On-site Wells – Well and Water Level Depth TABLE 5 Water Levels and Flow Rate Monitoring Frequency
LIST OF FIGURES
FIGURE 1 Regional Location Map FIGURE 2 Regional Watershed Map FIGURE 3 Parcels and Wells Locations Map FIGURE 4 Regional Geologic Map FIGURE 5 Groundwater Elevation Map FIGURE 6 Well B Half-Mile Well Test Radius of Influence FIGURE 7 Potentially Groundwater Dependent Vegetation FIGURE 8 Field Lithologic Log for Well B FIGURE 9 Well Completion Diagram for Well B
Well Test Plan Page 1 7123-5 Tierra Del Sol Solar Farm, LLC Dudek San Diego County, Tierra Del Sol, California July 2012
1. Introduction
1.1. Purpose of the Well Test Plan
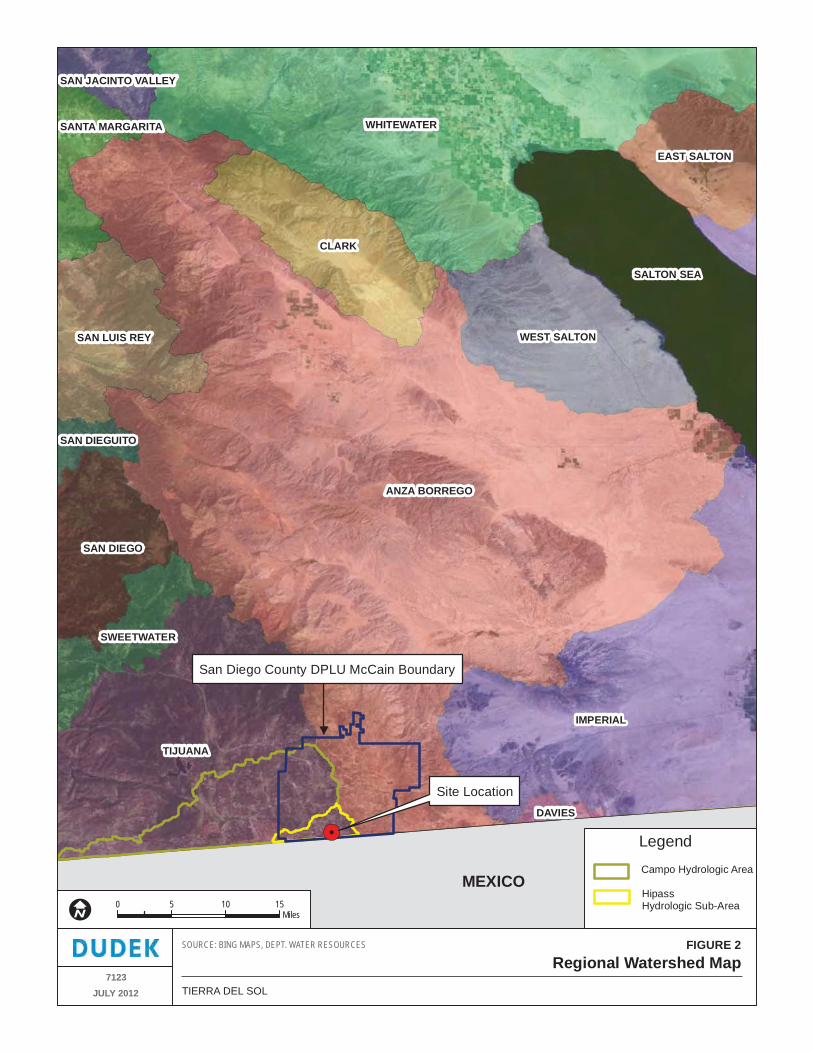
This Well Test Plan was prepared on behalf of Tierra Del Sol, LLC by Dudek for submittal to County of San Diego Department of Planning and Land Use (DPLU) to satisfy groundwater resource investigation scoping requirements outlined in Guidelines for Determining Significance and Report Format and Content Requirements – Groundwater Resources (DPLU, 2007). The Tierra Del Sol Solar Farm will, as much as feasible, use on-site groundwater as a source of supply to meet construction and operational water demands for the 444 acre concentrated photovoltaic (CPV) Tierra Del Sol Solar Farm (Project Site) located in Unincorporated San Diego County, Tierra Del Sol, California (Figures 1). The watershed for the Project Site is defined as the Hipass Hydrologic Subarea (911.85) which is contained within the Campo Hydrologic Area (911.80) and all within the Tijuana Hydrologic Unit (911.00); (Figure 2). The intent of this Well Test Plan is to establish methods and procedures for conducting an aquifer test of Well B and for analysis of the aquifer test data measured at Well B. The aquifer test and analysis will be used to measure hydraulic properties of the local fractured bedrock aquifer in the immediate area of Well B, and to assess the ability of this on-site groundwater resource to meet the water demands of the project. In addition, groundwater dependent habitat identified on the Project Site and near the Project Site will be evaluated to determine potential impacts from groundwater withdrawal at Well B.
2. Geology
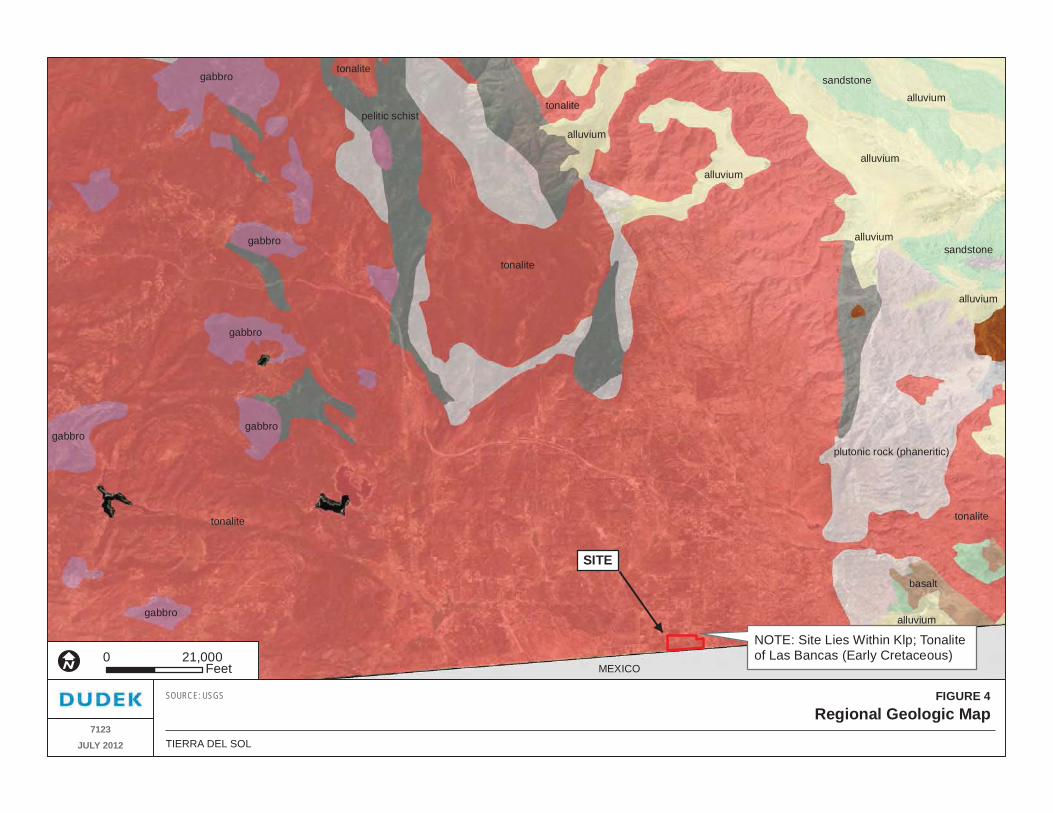
The Project Site is located on the eastern portion of the Peninsular Range geomorphic province which is a series of northwest-oriented mountain ranges extending from the Transverse Ranges near Los Angeles south through the Baja California peninsula. The Project Site geology consists of a thin cover of residual soil and weathered granitic rock overlying granitic bedrock, designated as Cretaceous age La Posta Tonalite (Figure 4; reference USGS OFR 2004-1361, Victoria Todd, 2004).
3. Proposed Aquifer Test: Well B
The aquifer test using Well B as a pumping well will be conducted in accordance with section 67.703.2 of the County of San Diego Groundwater Ordinance as well as the

Well Test Plan Page 2 7123-5 Tierra Del Sol Solar Farm, LLC Dudek San Diego County, Tierra Del Sol, California July 2012
County’s Guidelines for Determining Significance and Report Format and Content Requirements – Groundwater Resources (DPLU, 2007).
3.1. Well B (Pumping Well)
Well B is located in the eastern portion of the Project Site (Figure 3). Well B was initially drilled as an exploratory borehole in April 2012 to a total depth of 1,311 feet below ground surface (BGS) using a 6 5/8-inch percussion air-rotary bit by Stehly Brothers Drilling, Inc. (Stehly) of Valley Center, California. The discharge rate while airlifting Well B during drilling of the 6 5/8 exploratory borehole was 75 gallons per minute (GPM). The majority of the groundwater production was observed to occur from fractures located below 1,000 feet. Table 1 below provides a summary of fractures encountered and their associated flow rates.
Table 1 Well B – Exploratory Borehole Total Flow and Change in Flow

Well Test Plan Page 3 7123-5 Tierra Del Sol Solar Farm, LLC Dudek San Diego County, Tierra Del Sol, California July 2012
The pilot hole was drilled on April 18th and 25th 2012. A temporary 8 5/8” OD ASTM/ASME 5A536 steel conductor casing was set to 20 feet BGS and sealed with hydrated Hydroplug 3/8” bentonite pellets. The borehole simplified lithologic log is presented in Table 2 and a graphical log of the formations encountered by the pilot borehole is presented in Figure 8. The borehole lithology consisted primarily of weathered and unweathered granitic rock, medium to coarse grained, predominantly tonalite from 0 to 1,086 feet BGS. From 1,086 to 1,311 feet BGS, alternating zones of granodiortite and tonalite were encountered.
Table 2: Well B – Simplified Lithologic Log
On July 9th 2012, the borehole was reamed to 16 inches in diameter from 0-53 feet BGS with a tri-cone drilling bit for installation of a permanent surface seal. The surface seal was set to the required minimum 50 feet BGS to meet California Department of Water Resources (DWR) standards for drinking water wells. The conductor casing (10.75-inch O.D. by 0.250-inch wall thickness Grade B Mild Steel) was installed to 53 feet BGS in 20 foot sections. Each casing joint was cleaned with a grinder, fitted and tack welded into position. The casing was arc welded, cleaned and then inspected before the casing

Well Test Plan Page 4 7123-5 Tierra Del Sol Solar Farm, LLC Dudek San Diego County, Tierra Del Sol, California July 2012
was lowered into the borehole. On July 10h 2012, 10 sack sand/cement slurry was set from 0 to 53 feet BGS by tremie and high pressure trailer pump. A 1-inch diameter tremie pipe was installed to approximately 50 feet BGS. As the sand/cement slurry rose in the annulus between the borehole and conductor casing, tremie pipe was removed from the well. The final tremie depth was approximately 42 feet BGS when the sand/cement slurry was observed at the surface. A total of 3 cubic yards was set in the annulus. The theoretical volume of the borehole from 0 to 53 feet BGS was calculated to be 1.70 cubic yards. Therefore, the volume of cement set was greater than the theoretical volume. The greater volume was most likely due to wash-outs in the weathered granitic rock. The surface seal was inspected and approved by Peter Neubauer of the County of San Diego Department of Environmental Health (DEH). On July 12th 2012, the borehole was reamed to 10 inches in diameter from 53 to approximately 500 feet BGS. During drilling activities on July 12, 2012, the hammer on Stehly’s drill rig broke off and drilling ceased until the hammer was removed from the hole and repairs were made. Reaming activities resumed on July 16, 2012 and the borehole was reamed to 10 inches to a depth of 1,019 feet BGS. On July 19, 2012, 8-inch diameter by 0.188-inch wall thickness NEXSTEEL mild steel casing was installed to a depth of 1,019 feet BGS. The purpose of the 8” steel casing is to stabilize the borehole and prevent material from entering during airlifting and subsequent pumping. Well completion details are presented in Figure 9. While airlifting at total borehole depth, 120 GPM was produced.
Table 3: Well B – Construction Materials and Lengths/Volumes
Depth (Feet, BGS)
Borehole Diameter (Inches)
Material Volume Set (Yards3)
Theoretical Volume (Yards3)
0-53 16 10.75-inch O.D. by 0.250-inch wall California Steel Industries A 53 Grade B Mild Steel Casing
NA NA
0-53 16 Cement 3.0 1.70
53-1,019 10 8-inch O.D. by 0.188-inch wall NEXSTEEL Mild Steel Casing
NA NA
1,019-1,311 6.625 Open-cased, granite borehole NA NA
3.2. On-site Wells (Monitoring Wells)
Well 1: Well 1 initially pumped at a rate of 30 GPM; however, this rate reduced to 21 GPM after 4 minutes, 14 GPM after 21 minutes and no water production after 23 minutes of pumping. The depth to water while pumping dropped from the static water level of 45.58 feet (below top of 1-inch PVC sounding tube) to the pump intake at 273 feet below top of casing during the first 23 minutes of pumping. This pumping rate indicates that the

Well Test Plan Page 5 7123-5 Tierra Del Sol Solar Farm, LLC Dudek San Diego County, Tierra Del Sol, California July 2012
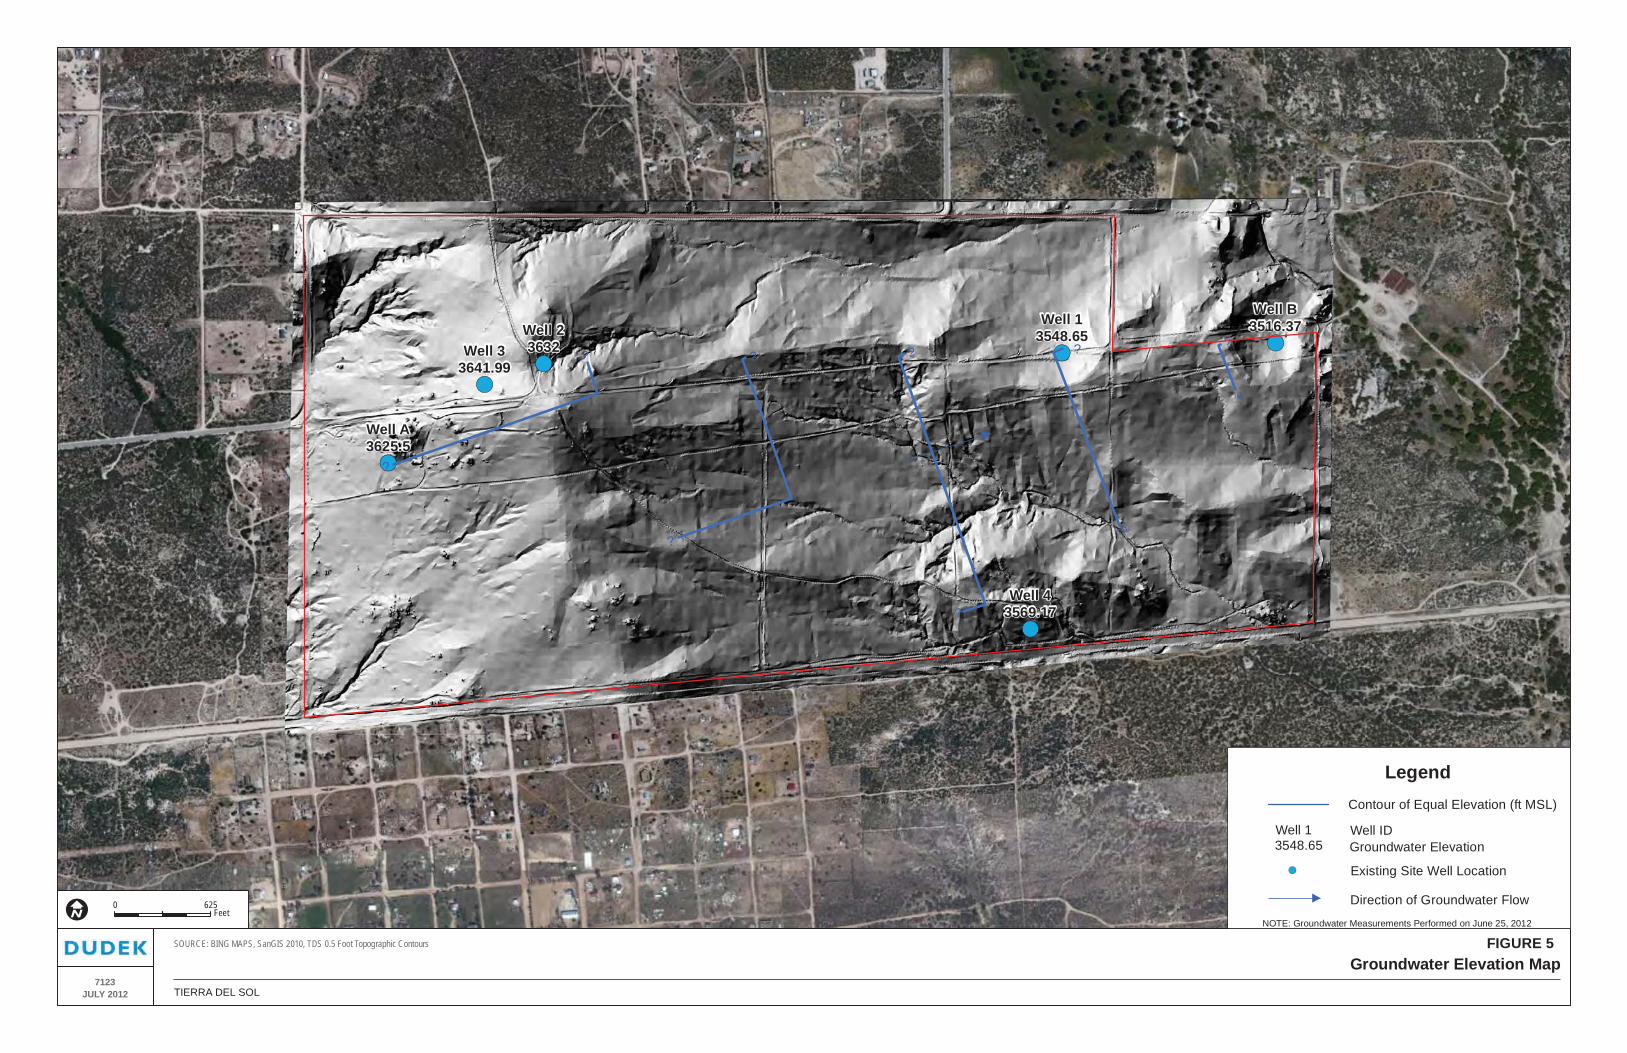
higher pumping rates observed in Well 1 are the result of removing water from casing storage and that the fractured granitic rock formation is not capable of yielding more than a few GPM from this well. A video log of Well 1 indicated that it is in good condition and lined with 4-inch PVC to total depth of 282 feet. Well 2: Well 2 was not pumped due to a short/fault of the existing down-hole wire to the submersible pump. The pump removed from the well was identified as a 1.5 horsepower pump. The pump was set 420 feet below top of casing (BTOC). Based on the expected pumping water level and performance curve of the pump the maximum well yield for Well 2 is in the probable range of 10 to 20 GPM. The actual pumping rate should be verified when the down-hole wiring is replaced. A video log of Well 2 indicated that the well is unlined (open to fractured granitic bedrock) to a total depth of 491.7 feet BTOC. Information provided by the property owners, Joe and Jan Brown, indicated that Well 2 was originally 600 feet deep. Loose broken material was observed predominantly between 459.8 and 473.7 feet BTOC and may be the source of the well obstruction between 491.7 and 600 feet. Well 3: A California Department of Water Resources (DWR) Driller’s Well Log was obtained from Frank’s Drilling of Guatay, California. The DWR Well Log indicates the estimated yield of the well is three GPM. Frank Thing of Frank’s Drilling also confirmed the low production rate of the well. Well 4: Well 4 is obstructed at 26.1 feet below top of casing due to a pipe stuck in the well associated with the former windmill. According to the property owners, Well 4 was originally 150 feet deep and produced approximately 10 GPM. Hand-dug Well: The Hand-dug Well onsite is dry to total depth of 25.6 feet below ground surface. The property owners report the Hand-dug well was originally 100 feet deep and produced approximately 3 GPM. Well A: Well A was drilled by Stehly in April 2012 as an exploration well to 1,000 feet BGS. The final flow rate measured in Well A was 1.8 GPM. A fracture zone from 57 to 62 feet BGS produced 7 GPM during drilling indicating hydraulic connection to the shallow aquifer system in Well A. Presented below in Table 2 is a summary of the On-site Wells’ well depth and depth to water levels. Water level elevations and direction of flow are also presented graphically in Figure 5.

Well Test Plan Page 6 7123-5 Tierra Del Sol Solar Farm, LLC Dudek San Diego County, Tierra Del Sol, California July 2012
Table 4 On-site Wells – Well and Water Level Depth
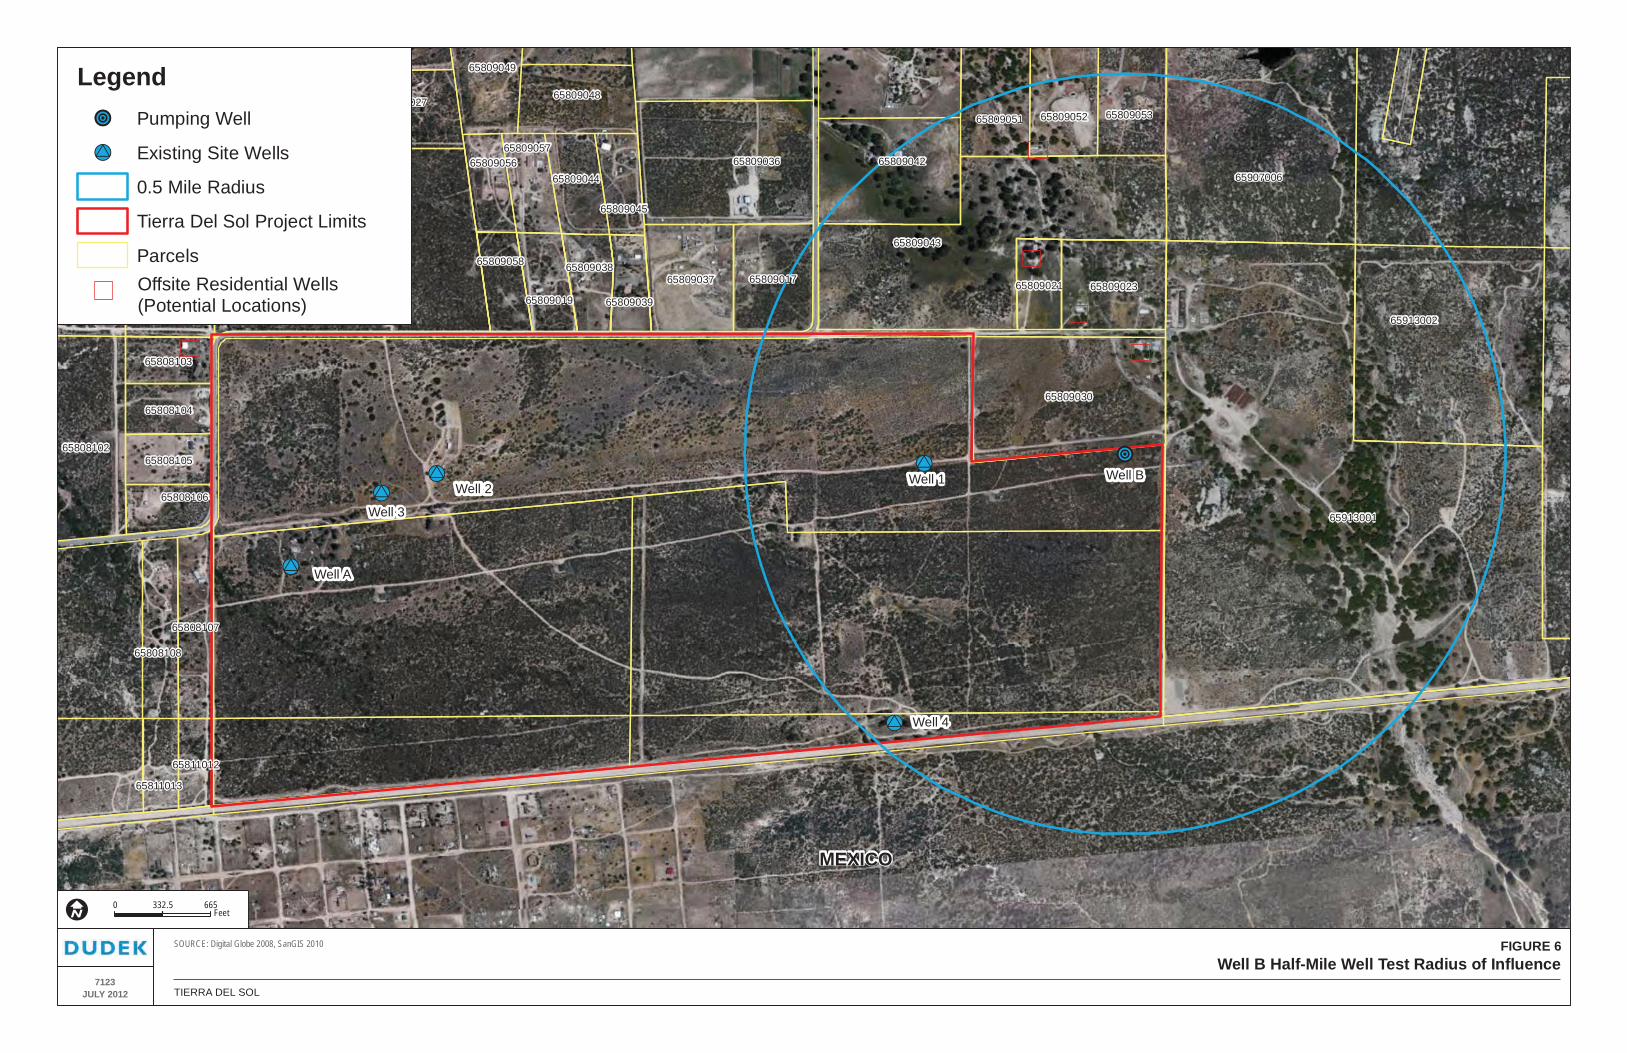
A submersible pump will be installed into Well B to sufficient depth to allow for constant rate pumping of the well for a period of up to 72 hours. In fractured rock aquifers, it is typical for the pumping level to draw down substantially to the depth of principal water bearing fractures under extended pumping at maximum rates. Therefore, we propose conducting a 12-hour step drawdown test to establish the optimal pumping rate for the 72-hour test. The flow rate for the constant rate test will likely be greater than 30 GPM. Prior to the step test, an In-Situ, Inc. Level Troll 700 pressure transducer/ datalogger or similar will be installed into a sounding tube in the pumping well (Well B) and into the well casings of five proposed observation wells (Well 1, Well 2, Well 3, Well 4 and Well A). Well 1 and Well 4 are located within 0.5-mile of Well B (Figure 4). In advance of the test, Dudek will contact property owners adjacent to the Project Site who have domestic wells located within 0.5-mile of Well B to inform them of the well tests and offer to monitor water levels during the well tests (Figure 6). Automatic water level and flow rate readings will be recorded at a minimum of the following frequencies during each well test per County guidelines:
Table 5: Water Level and Flow Rate Monitoring Frequency Time Since Pumping Started Monitoring Frequency
0 to 10 minutes 30 seconds
>10 to 30 minutes 2 minutes
>30 minutes to 2 hours 10 minutes
>2 hours to 12 hours 30 minutes
>12 to 24 hours 1 hour
Well Test Plan Page 7 7123-5 Tierra Del Sol Solar Farm, LLC Dudek San Diego County, Tierra Del Sol, California July 2012
Prior to the step test and constant rate test, water levels will be recorded for a period of at least seven days to identify long-term trends. In addition, barometric pressure will be recorded throughout the period of water level measurements. The recovery period from the step test as well as the 72-hour test will be a minimum of twice the duration of the pumping test and minimum recording frequency for water levels will be measured according to Table 1. Water level transducers will be left in the pumping well and observation wells for a period of at least seven days beyond the recovery period. Manual water level measurements will be recorded at the start of the test, periodically over the test interval and during recovery after pumping ceases in order to confirm the accuracy of the pressure transducer measurements. Flow will be measured using a Sensus in-line flow meter or similar equipped with a flow totalizer. Flow rates will be measured according to Table 1 while personnel are present on the Project Site during the tests. Field personnel will monitor flow rates and make adjustments as necessary to maintain the desired constant flow rate throughout the duration of the tests. A check valve will be installed in the discharge line to avoid backflow of water into the well when the pump is shut off. The discharge pipeline will extend a minimum of 300 feet away from Well B and will be placed outside any surface water drainage. Water will be dispersed via sprinklers to enhance evaporation during the tests and avoid any discharge water from flowing into a downstream surface water body or drainage course. The well pump valving, flowmeter, and water level monitoring equipment will be tested at least 24 hours prior to the start of the tests in accordance with County guidelines.
4. Proposed Well Test Analysis
4.1. Aquifer Hydraulic Properties Analysis
Aquifer transmissivity (the rate at which water flows through a vertical strip of the aquifer 1 foot wide and extending through the full saturated thickness, under a hydraulic gradient of 1 or 100 percent) will be estimated using the Copper-Jacob approximation to the Theis equation (Cooper-Jacob 1946) as follows:
T= 2.303 Q 4 ππππ ΔΔΔΔs
Where: T = transmissivity (feet2/day) [multiply by 7.48 to get units of gpd/ft] Q = average pumping rate (feet2/day) [multiply GPM by 193] ¶ = pi (3.14)

Well Test Plan Page 8 7123-5 Tierra Del Sol Solar Farm, LLC Dudek San Diego County, Tierra Del Sol, California July 2012
ΔΔΔΔS = difference in drawdown over one log cycle (feet)
The aquifer coefficient of storage (also called storativity) is the volume of water released from storage per unit decline in hydraulic head in the aquifer per unit area of the aquifer. Due to well loses and inefficiency of the pumping well, an observation well is required to calculate the coefficient of storage. The coefficient of storage will also be estimated using the Copper-Jacob approximation to the Theis equation (Cooper-Jacob 1946) as follows:
S= 2.25Tto/r2
Where: S = Coefficient of Storage (dimensionless)
T = transmissivity (feet2/day) to = intercept with x-axis, time (days) r = distance to observation well (feet) An estimate of groundwater drawdown at the nearest residential well induced by project pumping at 1 year will be estimated using the Cooper-Jacobs approximation of the Theis Non-Equilibrium Flow Equation (USGS 1962):
s= 264 Q log10 0.3 Tt . T r2S
Where:
s = predicted drawdown (feet) Q = average pumping rate (GPM) T = Transmissivity (gpd/ft) = t = time (days) r = distance from pumping well (feet) S = coefficient of storage (dimensionless)
Based on the actual results of the drawdown data collected during the aquifer test, the use of additional analysis methods will be evaluated, as appropriate, in consultation with the County Groundwater Geologist.
4.2. Groundwater Dependent Habitat Analysis
Potentially occurring groundwater dependent habitat on the Project Site and near the Project Site is depicted in Figure 7. The County’s Guideline 4.2.C from the Biological Guidelines for Determining Significance have the following threshold for determining a significant impact to riparian habitat or a sensitive natural community: “The project would draw down the groundwater table to the detriment of groundwater-dependent habitat, typically a drop of 3 feet or more from historical low groundwater levels.”
Well Test Plan Page 9 7123-5 Tierra Del Sol Solar Farm, LLC Dudek San Diego County, Tierra Del Sol, California July 2012
Well 1 is approximately 1,439 feet west of Well B (1,000 feet from the Open Water (OW) mapped on the Project Site and 1,800 feet from the open coast live oak woodland (LOW) mapped to the east of the Project Site) and is completed to a total depth of 282 feet BTOC. The water levels measured in June 2012 in Well B and Well 1 were 40.13 and feet below TOC and 48.85 feet BTOC, respectively. Well 4 is approximately 1,000 feet west of the LOW mapped on the Project Site (Figure 7). The water level in Well 4 in June 2012 was 8.83 BTOC. The neighboring property owner to the east, Robert Maupin, in the area of the off-site LOW reportedly has two shallow wells drilled to depths of 190 feet and 100 feet below land surface with well production capacity of 60 GPM and 100 GPM, respectively (Maupin, pers. comm. 2012). The water levels in the Maupin Wells have not been measured due to access limitations. Quercus agrifolia (coast live oak) associated with the LOW vegetation is a native drought resistant evergreen tree with a root system that consists of a deep taproot with several main roots that may tap groundwater if present within approximately 36 feet of the soil surface (Canadell, 1996). Based on past experience in San Diego County with fractured rock granitic aquifers conducting long-term pump tests from deep fractures (i.e. >1,000 feet), there is typically limited hydraulic connection with the shallow fracture system that would influence groundwater dependent habitat that extends to a maximum depth of 36 feet below ground surface. All on-site wells and, if accessible, the two wells located on the Maupin property to the east should be sufficient to monitor water level changes in the shallow portion of the aquifer and potential impacts to groundwater dependent habitat due to groundwater pumping from Well B.

Well Test Plan Page 10 7123-5 Tierra Del Sol Solar Farm, LLC Dudek San Diego County, Tierra Del Sol, California July 2012
5. References
Canadell, J. et al. 1996. Maximum Rooting Depth of Vegetation Types at the Global Scale. Oecologia 1996 108:583-595. Cooper, H.H., Jr. and C.E. Jacobs. 1946. A Generalized Graphical Method for Evaluating Formation Constraints and Summarizing Well Field History. Transactions, American Geophysical Union 27:526-34. DPLU. San Diego County Groundwater Ordinance – San Diego County Code of Regulatory Ordinances, Amendments effective October 14, 2011. DPLU 2007. County of San Diego Guidelines for Determining Significance and Report Format and Content Requirements – Groundwater Resources, March 19, 2007. Driscoll, Fletcher G. 1986. Groundwater and Wells (Second Edition) Johnsons Screens, St Paul, Minnesota. Maupin, R. 2012. Communication from Robert Maupin to Patrick Rentz (Dudek) regarding groundwater well and production rates, dated April 25, 2012. USGS (Todd, Victoria), 2004-1361 Open-File Report. Preliminary Geologic Map of the El Cajon 30’ x 60’ Quadrangle, Southern California. Version 1.0. USGS (J.G. Ferris, D.B.Knowles, R.H. Brown and R.W.Stallman) 1962. Theory of Aquifer Tests Ground-Water Hydraulics Water Supply Paper 1536-E.

!"#805
(/371
Ã76Ã79
Ã94
Ã86
Ã67
Ã195
Ã54
Ã52
Ã79
Ã78
San Diego
Santee
La Mesa
Coronado
Encinitas
Dana Point
Chula Vista
San Clemente
National City
Imperial Beach
San Juan Capistrano
Anza
Campo
Julian
PotreroJacumba
Bonsall
Aguanga
Murrieta
Descanso
Boulevard
Salton City
Pine Valley
Santa Ysabel
Pauma Valley
Valley Center
Warner Springs
Rancho Santa Fe
Palomar Mountain
!"#8
!"#5
!"#15
Salton Sea
SAN DIEGO
IMPE
RIA
L
RIVERSIDE
ORANGE
I0 5 10
Miles
FIGURE 1Regional Location Map
7123TIERRA DEL SOL
JULY 2012
San Diego C
ounty
Imperial C
ounty
Riverside County
San Diego County
MEXICO
P A C I F I C
O C E A N
Tierra Del SolProject
ANZA BORREGO
IMPERIAL
TIJUANA
WHITEWATER
CLARK
SALTON SEA
WEST SALTON
SAN DIEGO
SAN LUIS REY
EAST SALTON
SWEETWATER
SANTA MARGARITA
SAN JACINTO VALLEY
SAN DIEGUITO
DAVIES
FIGURE 2Regional Watershed Map
7123TIERRA DEL SOLJULY 2012
SOURCE: BING MAPS, DEPT. WATER RESOURCES
0 5 10 15MilesI
MEXICO
!.
Site Location
San Diego County DPLU McCain Boundary
LegendCampo Hydrologic Area
Hipass Hydrologic Sub-Area

!(!(
!(
!(
!(
!(
65913001
65809005 65809043
65809030
6580902365809037 6580901765808053
65808104
65808105
65808103
65808106
65808107
65809019
65809038
65809021
65809058
65809039
65811012
FIGURE 3
Parcels and Well Locations MapTIERRA DEL SOL
SOURCE: Digital Globe 2008, SanGIS 2010
JULY 2012
0 500250FeetI
7123
Well 1Well 2
Well 3
Well 4
Well A
Well B
Legend!( Existing Site Well
Adjoining Parcel
Subject Property Boundary
Residential Wells (Potential Locations)
tonalite
tonalite
alluvium
tonalite
plutonic rock (phaneritic)
pelitic schist
gabbro
alluvium
alluvium
alluvium
gabbro
basalt
gabbro
gabbro
alluvium
alluvium
tonalite
sandstone
gabbro
sandstonegabbro
alluviumgabbro
tonalite
TIERRA DEL SOL7123
JULY 2012
SOURCE: USGS
I
SITE
NOTE: Site Lies Within Klp; Tonalite of Las Bancas (Early Cretaceous)
FIGURE 4Regional Geologic Map
MEXICO0 21,000
Feet
!(!(
!(
!(
!(
!(
Well 23632
Well A3625.5
Well B3516.37
Well 33641.99
Well 43569.17
Well 13548.65
Groundwater Elevation MapTIERRA DEL SOL
SOURCE: BING MAPS, SanGIS 2010, TDS 0.5 Foot Topographic Contours
JULY 2012
0 625FeetI
7123
FIGURE 5
????
?
?
?
?
?
?
LegendContour of Equal Elevation (ft MSL)
Existing Site Well Location!(
Well 13548.65
Well IDGroundwater Elevation
Direction of Groundwater Flow
NOTE: Groundwater Measurements Performed on June 25, 2012
!U!U
!U
!U
!U
!U
!O
65811013
65808108
65808102
5808041
65808052
6580902665809027
6580905665809057
65809044
65809045
65809036 65809042
65809052 6580905365809051
65907006
65913002
65809049
65809048
65913001
65809005 65809043
65809030
6580902365809037 65809017
65808053
65808104
65808105
65808103
65808106
65808107
65809019
65809038
65809021
65809058
65809039
65811012
Well B Half-Mile Well Test Radius of InfluenceTIERRA DEL SOL
SOURCE: Digital Globe 2008, SanGIS 2010
JULY 2012
0 665332.5FeetI
7123
Well 1Well 2
Well 3
Well 4
Well A
Well B
MEXICO
Legend!O Pumping Well
!U Existing Site Wells
0.5 Mile Radius
Tierra Del Sol Project Limits
ParcelsOffsite Residential Wells (Potential Locations)
FIGURE 6

LOW
Well 1Well 2
Well 4
Well 3
Well B
Well A
BSC
GMX
CC
CC
GMX
CC
SOC
GMX
CC
NNW
DL
BSCNNW
NNWBSC
CCGMX
CC
CC
CCBSC
NNWBSCCC
BSCdBSC dBSC
BSC
RSCBSC
CC
RSC
CC
RSCBSC
CC
RSC
RSC
CC
BSS
BSC
CC
RSC
GMX/BSCBSC
NNW
BSC
NNW
NNWBSC
BSC
BSC
BSC
GMX/BSC
BSC
GMX
SOCGMX
BSC
BSC
CC
GMX
SOC
GMX
dBSC
BSC
BSC/RSC
GMX
CC/BSC
RSC
RSC
RSC
GMX
LOWGMX
RSC
NNWNNW
RSC
CC
GMX
GMXCC
GMX
FIGURE 7
Potentially Groundwater Dependent Vegetation SOURCE: Bing Maps, SanGIS
7123
0 500250FeetI
Tierra del Sol Solar Farm
Vegetation CommunitiesBSC, Flat-topped Buckwheat
BSC/RSC, Flat-topped Buckwheat/Red Shank Chaparral
BSS, Big Sagebrush Scrub
CC, Granitic Chamise Chaparral
CC/BSC, Granitic Chamise Chaparral/Flat-topped Buckwheat
DL, Disturbed Land
GMX, Granitic Mixed Chaparral
GMX/BSC, Granitic Mixed Chaparral/Flat-topped Buckwheat
LOW, Live Oak Woodland
NNW, Non-Native Woodland
OW, Open Water
RSC, Red Shank Chaparral
SOC, Southern Oak Chaparral
dBSC, disturbed Flat-topped Buckwheat
!. Existing Site Wells
OW
JULY 2012
Potentially GroundwaterDependent Vegetation