Embed Size (px)
Citation preview
Environmental Impact Statement
Air Quality Impact Assessment
Appendix 12

APPENDIX_ASK 2017a
ASK Consulting Engineers Pty Ltd ABN: 55 622 586 522 ACN: 128 491 967 PO Box 3901 South Brisbane QLD 4101
P: 07 3255 3355 F: 07 3844 7180 www.askconsulting.com.au
KUR-World Integrated Eco Resort Barnwell Road, Myola, Queensland
Air Quality Impact Assessment
Report: 8852R02V02
Prepared for:
Reever and Ocean Pty Ltd
26 October, 2017

8852R02V02.docx 2
Document Control
W:\8800\8852 - Kur World\ASKout\R02 air\8852R02V02.docx
Document Ref Date of Issue Status Author Reviewer
8852R02V01 25 October, 2017 Final MY AM
8852R02V02 26 October, 2017 Minor clarifications MY AM
Document Approval
Author Signature
Approver Signature
Name Michelle Yu Name Andrew Martin
Title Environmental Engineer Title Air Quality Manager
Disclaimer: This document and associated tasks were undertaken in accordance with the ASK Consulting Engineers Quality Assurance System, which is based on Australian Standard / NZS ISO 9001:2008. This document is issued subject to review, and authorisation by a Senior Consultant noted in the above table. If the table is incomplete, this document shall be considered as preliminary or draft only and no reliance shall be placed upon it other than for information to be verified later. This document is prepared for our Client's particular requirements which are based on a specific brief with limitations as agreed to with the Client. It is not intended for and should not be relied upon by a third party and no responsibility is undertaken to any third party without prior consent provided by ASK Consulting Engineers. The information herein should not be reproduced, presented or reviewed except in full. Prior to passing on to a third party, the Client is to fully inform the third party of the specific brief and limitations associated with the commission. The information contained herein is for the identified purpose of air quality assessment only. No claims are made and no liability is accepted in respect of design and construction issues falling outside of the specialist field of air quality science including and not limited to structural integrity, fire rating, architectural buildability and fit-for-purpose, waterproofing, safety design and the like. Supplementary professional advice should be sought in respect of these issues. Copyright: This report and the copyright thereof are the property of ASK Consulting Engineers Pty Ltd (ABN 55 622 586 522). It must not be copied in whole or in part without the written permission of ASK Consulting Engineers Pty Ltd. This report has been produced specifically for the Client and project nominated herein and must not be used or retained for any other purpose. www.askconsulting.com.au

8852R02V02.docx 3
Contents 1. Introduction 6
2. Study Area Description 7
2.1 Overview 7 2.2 Identification of Existing Sensitive Receptors 7
2.3 Description of Air Emission Sources in the Vicinity 10
3. Proposed Development 11
3.1 Master Plan 11 3.2 Construction Activities 13
3.2.1 On-site Construction Emission Sources 13 3.2.2 On-site Construction Staging 13 3.2.3 Off-site Road Construction 14
3.3 Operational Emissions 16 3.3.1 Sewage Treatment Plant 17 3.3.2 Potential Re-Use of Biosolids By-Product 18 3.3.3 Irrigation of Recycled Water 19 3.3.4 Power Generators and Boilers 19 3.3.5 Solid Wastes 19 3.3.6 Composting 20 3.3.7 Cooking Exhausts 20 3.3.8 Animal Farm 20
4. Qualitative Assessment of Impacts of Minor or Temporary Sources 22
4.1 Operational Impacts 22
4.2 Construction Impacts 22
5. Air Quality Criteria 23
5.1 Odour 23
5.1.1 Mareeba Shire Planning Scheme 23 5.1.2 Queensland Odour Impact Assessment Guideline 23
5.2 Other Relevant Pollutants 23
5.2.1 State Legislative Instruments 23 5.3 National Environmental Protection (Ambient Air Quality) Measure 24
5.4 National Environmental Protection (Air Toxics) Measure 24 5.5 Dust Deposition 24
5.6 Summary of Air Quality Values and Criteria 25
6. Meteorological Modelling 26
6.1 TAPM Meteorological Modelling 26

8852R02V02.docx 4
6.1.1 TAPM Fundamentals 26 6.1.2 TAPM Configuration 26 6.1.3 Observational Data Assimilation 29 6.1.4 TAPM Validation 30
6.2 Topography and Land Use 30 6.3 Calmet Modelling Configuration. 30
6.4 Calmet Results 31
7. Existing Air Quality 34
7.1 Overview 34 7.2 Local Air Emission Sources 34 7.3 Odour 34
7.4 Monitoring Data from other Locations 34 7.4.1 Overview of Available Air Quality Data 34 7.4.2 Earlville 34 7.4.3 Townsville Coast Guard 35 7.4.4 Townsville Port 35 7.4.5 Pimlico 35 7.4.6 Gladstone Memorial Park 36 7.4.7 South Gladstone 37 7.4.8 Toowoomba 37 7.4.9 Dust Deposition 38
7.5 Assumed Background Concentrations 38
8. Pollution Modelling Methodology 39
8.1 Overview 39 8.2 Calpuff Configuration 39 8.3 Odour Emission Inventory 39
8.3.1 Inlet Works 40 8.3.2 Belt Press Filter 40 8.3.3 Bypass Tank 40 8.3.4 Filtrate Well 41 8.3.5 Sludge Bin 41 8.3.6 Treated Wastewater 41 8.3.7 Summary 41
8.4 Road Construction Inventory 42
8.4.1 Source Configuration 43 8.4.2 Summary of Emission Inventory 43
8.5 Nitrogen Dioxide Modelling 43
8.5.1 Overview 43 8.5.2 Goldstone Method 44 8.5.3 Janssen Method 44
8852R02V02.docx 5
8.5.4 TMR Method 44 8.5.5 Ambient Ratio Method 2 (ARM2) 44 8.5.6 Conversion Relevant to this Study 45
9. Dispersion Modelling Results 46
9.1 Limitations 46 9.2 Odour Results 46
9.3 Suspended Particulate Results 49 9.4 Gas Concentration Results 51 9.5 Dust Deposition Results 52
10. Discussion 55
10.1 Summary of Modelling Results 55
10.2 Recommendations 55 10.2.1 Mitigation Measures 55 10.2.2 Vegetation Buffers 57 10.2.3 Dust Monitoring 57 10.2.4 Feedback and Complaints Register 57
10.3 Conclusions 58
References 59
Appendices Appendix A Glossary 61
Appendix B Emission Inventory Equations for Particulates 62

8852R02V02.docx 6
1. Introduction ASK Consulting Engineers Pty Ltd (ASK) has been commissioned by Natural Resource Assessments (NRA) to provide air quality consultancy services for the KUR-World Integrated Eco Resort development proposed to be located at Barnwell Road, Myola, Queensland. The development is to include residential, educational, sporting, leisure, accommodation, medical and retail uses.
This report presents an assessment of the air quality impacts associated with the existing uses as well as the development. It is to form an appendix to the Environmental Impact Statement (EIS) being submitted to the Queensland Coordinator-General for consideration by stakeholders such as Mareeba Shire Council and the Department of Environment and Heritage Protection (EHP).
The purpose of this report is to address the air quality requirements of the Terms of Reference as listed in Table 1.1.
Table 1.1 Air Quality Requirements of the Terms of Reference
Terms of Reference Relevant Sections of Report
12.3
Fully describe the characteristics of any contaminants or materials released that may be released as a result of the construction or operations of the proposal, including point source and fugitive emissions. Emissions (point source and fugitive) during construction, commissioning, operations and upset conditions should be described.
Sections 3.2 and 3.3
12.4
Predict the impacts of the releases from the activity on environmental values of the receiving environment using recognised quality assured methods. The description of impacts should take into consideration the assimilative capacity of the receiving environment and the practices and procedures that would be used to avoid or minimise impacts. The impact prediction must:
Sections 4, 9 and 10
12.4(a)
Address residual impacts on the environmental values (including appropriate indicators and air quality objectives) of the air receiving environment, with reference to sensitive receptors (for example, the locations of existing residences, places of work, schools, agricultural or ecologically significant areas/species). This should include all relevant values potentially impacted by the activity, under the EP Act, EP Regulation and Environmental Protection (Air) Policy 2008 (EPP (Air)).
Section 9
12.4(b) Address the cumulative impact of the release with other known releases of contaminants, materials or wastes associated with existing development and possible future development (as described by approved plans and existing project approvals)
Section 9
12.4(c) Quantify the human health risk and amenity impacts associated with emissions from the project for all contaminants whether or not they are covered by the National Environmental Protection (Ambient Air Quality) Measure or the EPP (Air).
Section 10.1
12.5
Describe the proposed mitigation measures and how the proposed activity will be consistent with best practice environmental management. Where a government plan is relevant to the activity or site where the activity is proposed, describe the activity’s consistency with that plan.
Section 10.2
12.6 Describe how the achievement of the objectives would be monitored, audited and reported, and how corrective actions would be managed.
Section 10.2.3
To aid in the understanding of the terms in this report a glossary is included in Appendix A.

8852R02V02.docx 7
2. Study Area Description
2.1 Overview The proposed location is on the Atherton Tablelands approximately 3 kilometres to the west of the centre of Kuranda as shown in Figure 2.1.
Figure 2.1 Location of KUR-World (Image from Google Earth Pro)
The site is currently occupied by a farmhouse, grazing land and forest. The immediate surrounding land uses follow:
• Residences and a small orchard off Monaro Close and High Chapparal Road are to the north. • Residences off Barnwell Road, Scrub Street, Kingfisher Road and Myola Road are to the north-east. • Residences off Warril Drive, Hilltop Close and Punch Close are to the east. • The Billabong tourist facility is to the south. • Residences and the Kuranda Pet Resort dog kennels off Boyles Road are to the west.
The zoning of the site is rural. The zoning of surrounding properties is either rural or rural-residential.
2.2 Identification of Existing Sensitive Receptors Sensitive land uses are defined in the State Planning Policy (Department of State Development, 2014) as caretakers accommodation, child care centre, community care centre, community residence, detention
4 km
8852R02V02.docx 8
facility, dual occupancy, dwelling house, dwelling unit, educational establishment, health care services, hospital, hotel, multiple dwelling, non-resident workforce accommodation, relocatable home park, residential care facility, resort complex, retirement facility, rooming accommodation, rural workers accommodation, short-term accommodation or tourist park.
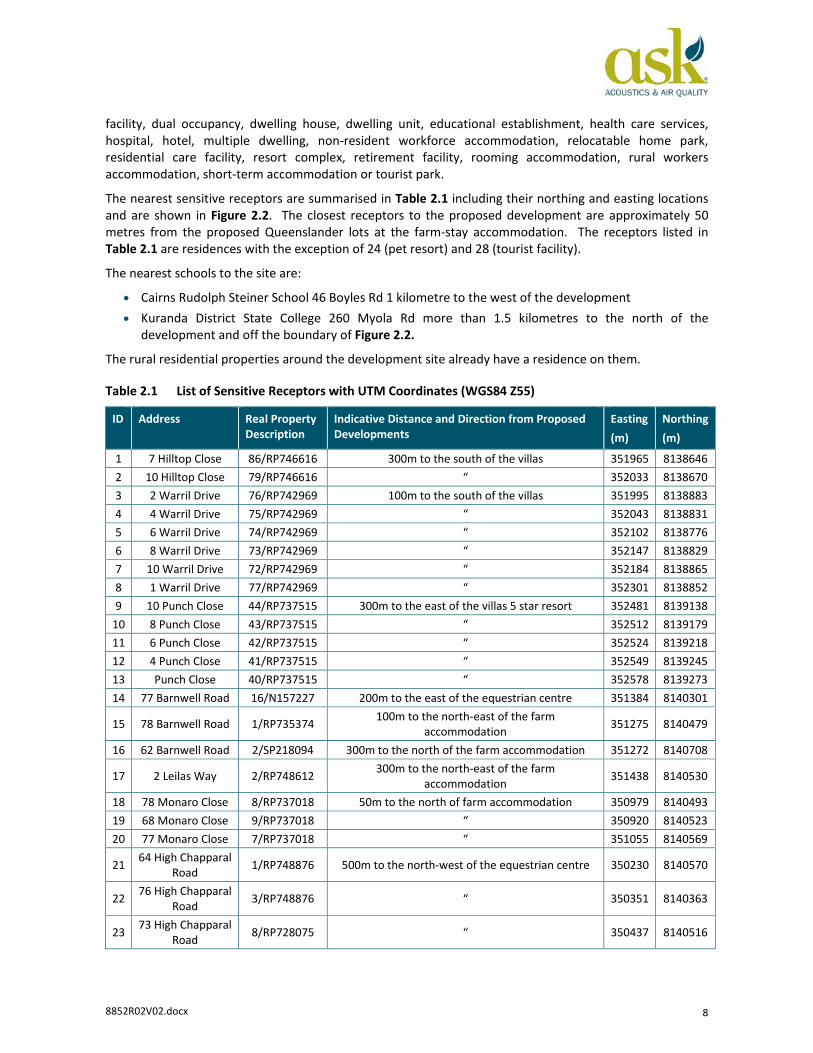
The nearest sensitive receptors are summarised in Table 2.1 including their northing and easting locations and are shown in Figure 2.2. The closest receptors to the proposed development are approximately 50 metres from the proposed Queenslander lots at the farm-stay accommodation. The receptors listed in Table 2.1 are residences with the exception of 24 (pet resort) and 28 (tourist facility).
The nearest schools to the site are:
• Cairns Rudolph Steiner School 46 Boyles Rd 1 kilometre to the west of the development • Kuranda District State College 260 Myola Rd more than 1.5 kilometres to the north of the
development and off the boundary of Figure 2.2.
The rural residential properties around the development site already have a residence on them.
Table 2.1 List of Sensitive Receptors with UTM Coordinates (WGS84 Z55)
ID Address Real Property Description
Indicative Distance and Direction from Proposed Developments
Easting (m)
Northing(m)
1 7 Hilltop Close 86/RP746616 300m to the south of the villas 351965 8138646 2 10 Hilltop Close 79/RP746616 “ 352033 8138670 3 2 Warril Drive 76/RP742969 100m to the south of the villas 351995 8138883 4 4 Warril Drive 75/RP742969 “ 352043 8138831 5 6 Warril Drive 74/RP742969 “ 352102 8138776 6 8 Warril Drive 73/RP742969 “ 352147 8138829 7 10 Warril Drive 72/RP742969 “ 352184 8138865 8 1 Warril Drive 77/RP742969 “ 352301 8138852 9 10 Punch Close 44/RP737515 300m to the east of the villas 5 star resort 352481 8139138
10 8 Punch Close 43/RP737515 “ 352512 8139179 11 6 Punch Close 42/RP737515 “ 352524 8139218 12 4 Punch Close 41/RP737515 “ 352549 8139245 13 Punch Close 40/RP737515 “ 352578 8139273 14 77 Barnwell Road 16/N157227 200m to the east of the equestrian centre 351384 8140301
15 78 Barnwell Road 1/RP735374 100m to the north-east of the farm accommodation 351275 8140479
16 62 Barnwell Road 2/SP218094 300m to the north of the farm accommodation 351272 8140708
17 2 Leilas Way 2/RP748612 300m to the north-east of the farm accommodation 351438 8140530
18 78 Monaro Close 8/RP737018 50m to the north of farm accommodation 350979 8140493 19 68 Monaro Close 9/RP737018 “ 350920 8140523 20 77 Monaro Close 7/RP737018 “ 351055 8140569
21 64 High Chapparal Road 1/RP748876 500m to the north-west of the equestrian centre 350230 8140570
22 76 High Chapparal Road 3/RP748876 “ 350351 8140363
23 73 High Chapparal Road 8/RP728075 “ 350437 8140516

8852R02V02.docx 9
ID Address Real Property Description
Indicative Distance and Direction from Proposed Developments
Easting (m)
Northing(m)
24 131 Boyles Road (Pet Resort) 4/RP749637 300m to the north-west of the villas 349941 8139832
25 165 Boyles Road 3/RP749637 600m to the west of the villas 349640 8139572 26 197 Boyles Road 1/RP866988 “ 349449 8139375 27 265 Boyles Road 2/RP734821 700m to the south-west of the villas 349765 8138872
28 186 Mount Haren Road (Billabong tourist facility)
44/RP851441 100m to the south-east of the small education centre 351217 8137600
Figure 2.2 Location of Site and Sensitive Receptors (Image from Google Earth Pro)

8852R02V02.docx 10
The receptor locations listed in Table 2.1 and identified in Figure 2.2 are existing receptors that have the potential to be impacted by the proposed Project. They were selected based on the presence of a sensitive land use and the distance and direction of the receptor from parts of the proposed development site that may include air emission sources.
2.3 Description of Air Emission Sources in the Vicinity A survey of potential air emission sources in the surrounding area was conducted on 22nd and 23rd February 2017 and the results are summarised in Table 2.2.
Table 2.2 List of Nearby Industrial Activities
Address Name Location relative to development Potential air emissions
56 Monaro Close A small orchard Approximately 100m to the north on Figure 2.2
Spray drift
45 Myola Rd Kuranda Landscape Supplies
Further to the east than the boundary of Figure 2.2 approximately 800m from the development
Dust and odour
47 Myola Rd Kuranda Raw Materials Further to the east than the boundary of Figure 2.2 approximately 800m from the development
Dust and odour
186 Mount Haren Road
Billabong tourist facility Approximately 100m to the south-east on Figure 2.2
Dust associated with recreational activities
131 Boyles Road Kuranda Pet Resort Approximately 300m to the west on Figure 2.2
Odour
46/RP851443 Quarry on Kennedy Highway opposite Windy Hollow Road
Further to the south than the boundary of Figure 2.2 approximately 1.5km from the development
Dust and suspended particulates
The landscape supplies, material supplies and quarry are all well over 500 metres from the development site. In addition, this quarry is not shown on key resource area mapping under the State Planning Policy. Thus due to the distance of these sources from the development site and for the quarry to be apparently not considered as a significant source under the State Planning Policy, dust and suspended particulates from these activities are considered very unlikely to impact on the development site.
The closest development area to the orchard is the proposed farm theme park and equestrian centre which are not considered sensitive to the potential spray drift. The proposed farm-stay accommodation is approximately 150 metres south-west of the orchard and is separated from the orchard by forest. Similarly, the Billabong tourist facility located approximately 100 metres from proposed locations for development activities is surrounded with forest. Thus it is considered very unlikely that impacts from spray drift and dust respectively would occur at the sensitive locations proposed for development activities.
The Kuranda Pet Resort is located approximately 300 metres west from the proposed development. The distance of the Kuranda Pet Resort from the proposed development is likely to be adequate to prevent its impacts from reaching the development.

8852R02V02.docx 11
3. Proposed Development
3.1 Master Plan The proposed development site consists of twelve allotments as described in Table 3.1 below covering approximately 680 hectares1 in Barnwell Road, Myola, approximately 22 kilometres directly north-west of Cairns. The site is currently used for cattle grazing. Surrounding properties include large rural residential allotments.
Table 3.1 Lot and Plan Details
Lot and Plan Details Area (hectares) Lot and Plan Details Area (hectares)
Lot 22 on N157227 37.26 Lot 20 on N157423 70.62 Lot 17 on N157227 57.71 Lot 95 on N157452 34.05 Lot 18 on N157227 63.01 Lot 43 on N157359 64.51 Lot 2 on RP703984 48.31 Lot 129 on NR456 65.89 Lot 1 on RP703984 16.19 Lot 131 on N157491 64.75 Lot 19 on N157452 39.60 Lot 290 on N157480 64.75
The proposed development is to include the following:
• The KUR-World educational campus and sporting facility is to include dining facilities, three storey accommodations, sports fields, swimming pool and training hall.
• An equestrian centre and farm theme park will include an arena, stables, accommodation and animal yards. There will be cattle paddocks and yards and horse stables.
• 342 accommodation villas are planned over approximately 34 hectares. • A village will include plaza, restaurant, bar, amphitheatre, convention centre, market area and
boutique retail precinct. A 3-star resort in the village will comprise 270 rooms, restaurant, bar, pool and children’s adventure park.
• A medical retreat will include accommodation and facilities for 60 guests and a herbal laboratory. • A 5-star eco-resort will include 200 two-storey villas, restaurant, pools, and function centre. • A small education centre in the southern zone will include 14 boarding cabins, kitchens, function
spaces and laboratories. • An adventure park in the southern zone will include a high ropes course, suspended bridges, zip lines
and rope ladders. • Other facilities include a golf course, horse riding and walking trails.
Electricity is to be provided via high voltage extensions along the Kennedy Highway. All refuse and waste will be disposed of at Mareeba and/or Cairns waste transfer facility. An Environmental Management Plan, Operational Plan, and Waste Management Plan will form part of the EIS.
The concept master plan shows the two main zones: the north zone and the south zone as shown in Figure 3.1. Most of the facilities will be in the northern zone.
1 This is the total property area, including proposed access road area.

8852R02V02.docx 12
Figure 3.1 KUR World Master Plan

8852R02V02.docx 13
3.2 Construction Activities
3.2.1 On-site Construction Emission Sources
Construction activities onsite will have the potential to generate particulates from construction dust and, to a lesser degree of impact, combustion products from plant exhausts.
Typical plant equipment used for construction include the following:
• Excavators • Dozers • Haul trucks • Loaders • Cranes • Graders • Scrapers
The main emissions from construction activities would be fugitive dust emissions originating from the following sources:
• Excavation • Filling • Material handling including loading and unloading of gravel and sand • Wheel-generated dust from hauling on unsealed road surfaces • Wind erosion of stockpiles and unsealed roads
Other emissions include combustion by-products from engine exhausts including suspended particulates, NOX, SO2, CO and volatile organic compounds (VOCs).
Construction activities in the southern zone will be minimal in comparison to those in the northern zone.
A qualitative assessment of impacts due to construction activities on-site is presented in Section 4.
3.2.2 On-site Construction Staging
The current Master Plan (Version G, 29 September 2017) features four sequential development stages over 7.5 years commencing in 2018.
Stage 1A (2018):
• Farm Theme Park and Equestrian Centre (Phase 1) • Residential Precinct: Queenslander Lots (21 lots) • Organic Produce Garden • Services and Infrastructure (Phase 1) • Environmental Area (Phase 1).
Stage 1B (2019-2020):
• Farm Theme Park and Equestrian Centre (Phase 2) • Residential Precinct: Lifestyle Villas (56 lots) • Open Space • KUR-Village (Phase 1) • Four Star Business and Leisure Hotel and Function Centre (Phase 1, 60 rooms) • Residential Precinct: Premium Villas (39 lots)

8852R02V02.docx 14
• Rainforest Education Centre and Adventure Park • Sevices and Infrastructure (including a sewerage treatment plant, access road from Mount Haren
Road to rainforest education centre) (Phase 2) • Environmental Area (Phase 2).
Stage 2 is planned to start immediately after the completion of Stage 1 and be constructed over a further two year period from 2021-2022. Stage 2 will include:
• KUR-Village (Phase 2) • Four Star Business and Leisure Hotel and Function Centre (Phase 2, 210 rooms) • Sporting Precinct • Golf Club House and Function Centre • Golf Course • Residential Precinct: Premium Villas (154 lots and 60 units) • Services and Infrastructure (Phase 3) • Environmental Area (Phase 3).
Stage 3 is planned to start immediately after the completion of Stage 2 and be constructed over a one year period in 2023-2024. Stage 3 will include:
• Health and Wellbeing Retreat (60 rooms) • Residential Precinct: Premium Villas (93 lots) • Five-Star Eco-Resort (200 rooms) • KUR-World Campus • Services and Infrastructure (Phase 4) • Environmental Area (Phase 4).
3.2.3 Off-site Road Construction
Off-site road construction activities also have the potential to impact sensitive receptors.
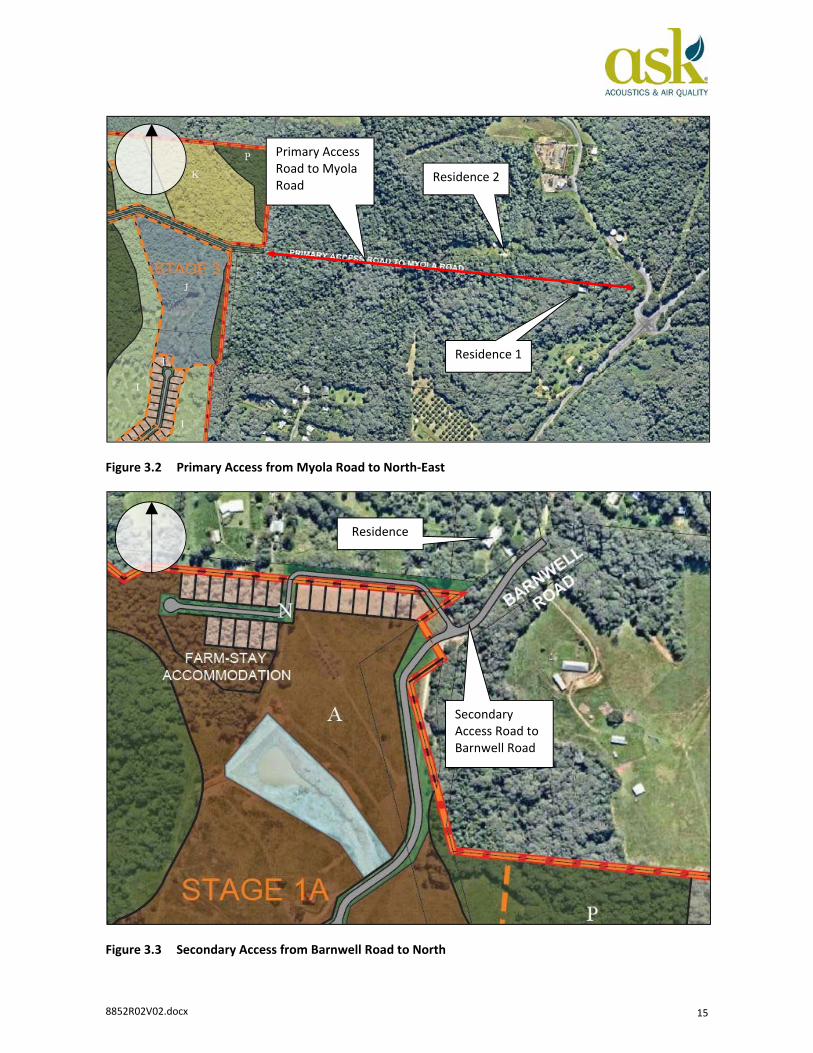
KUR-World intends to have three access points to the northern zone and an access to the southern zone (east-west access from the Rainforest Education Centre and Adventure Park) is under consideration. The primary access will be from the east of the site, being constructed from Myola Road along an existing gazetted road reserve (refer Figure 3.2). Secondary access will be provided from Barnwell Road in the north of the site (refer Figure 3.3). A third emergency access will be provided at Warril Drive in the east/south-east of the site and will be controlled by a gate (refer Figure 3.4).
There are two residences adjacent to the primary access road reserve:
• Residence 1 at 11 Myola Road • Residence 2 at 27 Myola Road.
8852R02V02.docx 15
Figure 3.2 Primary Access from Myola Road to North-East
Figure 3.3 Secondary Access from Barnwell Road to North
Primary Access Road to Myola Road Residence 2
Residence 1
Secondary Access Road to Barnwell Road
Residence

8852R02V02.docx 16
Figure 3.4 Tertiary (Emergency) Access from Warril Drive to East/South-East
There is no current existing road for the primary access and hence this will be constructed as part of the development. The secondary access road is an existing unsealed road. This will be sealed as part of the development. The tertiary access is an existing sealed road. However, the road ends outside the site boundary and hence it will have to be extended by approximately 90 metres to the west to reach the site boundary.
The air quality impacts at nearby sensitive receptors due to the sealing of the secondary access road and the extension of the tertiary access road are likely to be low. The fourth access road to the southern zone will be relatively far away from sensitive receptors and hence air quality impacts due to the construction of this road are not likely. Because of these reasons, the construction activities of these three roads are not assessed further in this report.
The construction activities for the primary access have the most potential to impact on sensitive receptors due to the nature of the activities and the proximity of the residences to the proposed road. Hence, detailed dispersion modelling was undertaken for these activities.
3.3 Operational Emissions Potential emissions due to the operation of the Project are presented in Table 3.2. The emission sources will be located in the northern zone only except for sewage pump stations and a power generator which will also exist in the southern zone.
Tertiary (Emergency)
Access Road to Warril Drive
8852R02V02.docx 17
Table 3.2 Operational Emissions
Emission source Potential emissions
Sewage treatment plant and sewage pump stations Odour Biosolid re-use Odour Irrigation of recycled water Odour Power generators Combustion by-products (particulates, NOX, SO2, CO etc) Boilers Combustion by-products (particulates, NOX, SO2, CO etc) Solid wastes Odour Composting Dust and odour
Cooking exhausts Odour, Combustion by-products (particulates, NOX, SO2, CO etc)
Animal farm and stables Dust and odour
3.3.1 Sewage Treatment Plant
The estimated wastewater volume that will be generated in the operation of the project will likely exceed the capacity of the Kuranda Wastewater Treatment Plant and reticulation network servicing the Mareeba Shire Council (Arup, 2017). Thus an onsite wastewater treatment plant is proposed to treat the wastewater generated onsite and produce high quality recycled water for non-potable re-use (Arup, 2017).
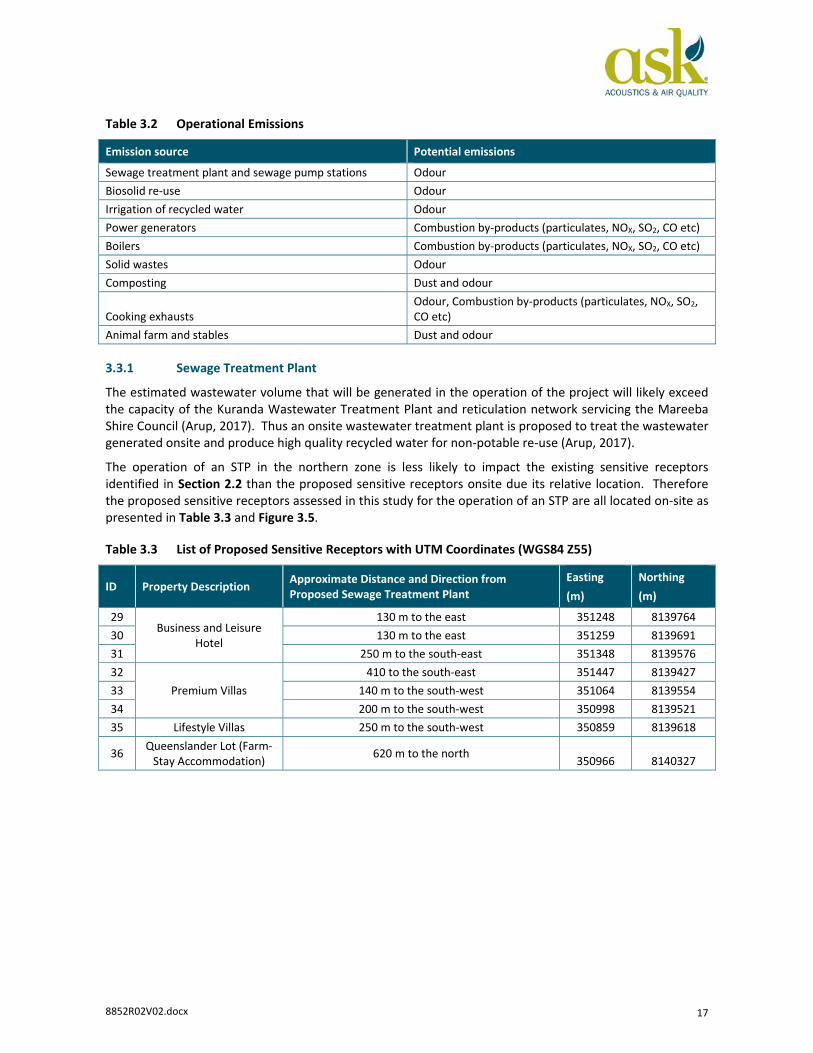
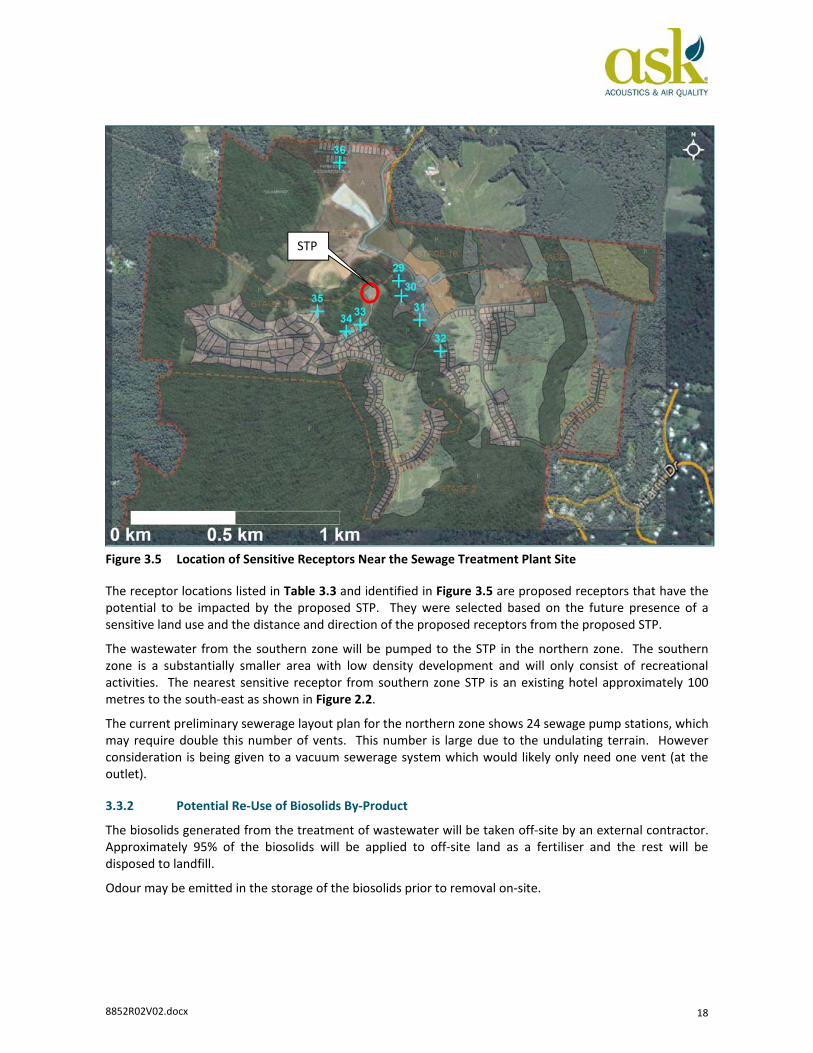
The operation of an STP in the northern zone is less likely to impact the existing sensitive receptors identified in Section 2.2 than the proposed sensitive receptors onsite due its relative location. Therefore the proposed sensitive receptors assessed in this study for the operation of an STP are all located on-site as presented in Table 3.3 and Figure 3.5.
Table 3.3 List of Proposed Sensitive Receptors with UTM Coordinates (WGS84 Z55)
ID Property Description Approximate Distance and Direction from Proposed Sewage Treatment Plant
Easting (m)
Northing (m)
29 Business and Leisure
Hotel
130 m to the east 351248 8139764 30 130 m to the east 351259 8139691 31 250 m to the south-east 351348 8139576 32
Premium Villas 410 to the south-east 351447 8139427
33 140 m to the south-west 351064 8139554 34 200 m to the south-west 350998 8139521 35 Lifestyle Villas 250 m to the south-west 350859 8139618
36 Queenslander Lot (Farm-Stay Accommodation) 620 m to the north 350966 8140327
8852R02V02.docx 18
Figure 3.5 Location of Sensitive Receptors Near the Sewage Treatment Plant Site
The receptor locations listed in Table 3.3 and identified in Figure 3.5 are proposed receptors that have the potential to be impacted by the proposed STP. They were selected based on the future presence of a sensitive land use and the distance and direction of the proposed receptors from the proposed STP.
The wastewater from the southern zone will be pumped to the STP in the northern zone. The southern zone is a substantially smaller area with low density development and will only consist of recreational activities. The nearest sensitive receptor from southern zone STP is an existing hotel approximately 100 metres to the south-east as shown in Figure 2.2.
The current preliminary sewerage layout plan for the northern zone shows 24 sewage pump stations, which may require double this number of vents. This number is large due to the undulating terrain. However consideration is being given to a vacuum sewerage system which would likely only need one vent (at the outlet).
3.3.2 Potential Re-Use of Biosolids By-Product
The biosolids generated from the treatment of wastewater will be taken off-site by an external contractor. Approximately 95% of the biosolids will be applied to off-site land as a fertiliser and the rest will be disposed to landfill.
Odour may be emitted in the storage of the biosolids prior to removal on-site.
STP
8852R02V02.docx 19
3.3.3 Irrigation of Recycled Water
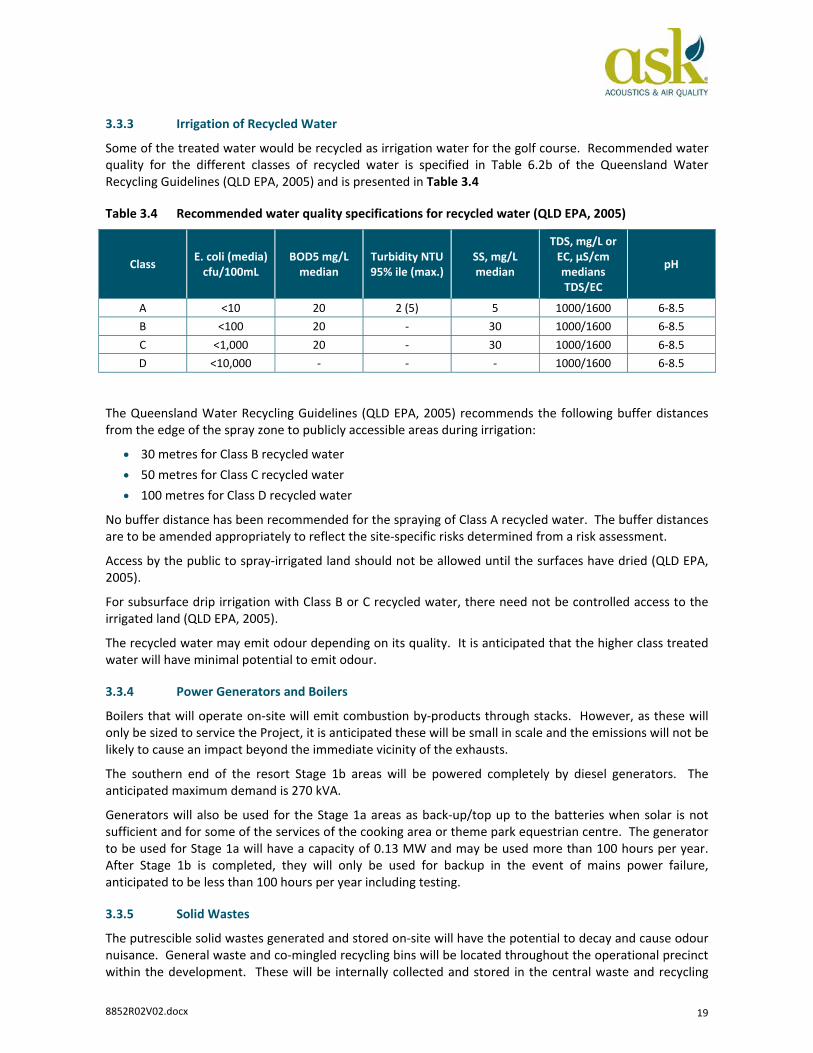
Some of the treated water would be recycled as irrigation water for the golf course. Recommended water quality for the different classes of recycled water is specified in Table 6.2b of the Queensland Water Recycling Guidelines (QLD EPA, 2005) and is presented in Table 3.4
Table 3.4 Recommended water quality specifications for recycled water (QLD EPA, 2005)
Class E. coli (media) cfu/100mL
BOD5 mg/L median
Turbidity NTU 95% ile (max.)
SS, mg/L median
TDS, mg/L or EC, µS/cm medians TDS/EC
pH
A <10 20 2 (5) 5 1000/1600 6-8.5 B <100 20 - 30 1000/1600 6-8.5 C <1,000 20 - 30 1000/1600 6-8.5 D <10,000 - - - 1000/1600 6-8.5
The Queensland Water Recycling Guidelines (QLD EPA, 2005) recommends the following buffer distances from the edge of the spray zone to publicly accessible areas during irrigation:
• 30 metres for Class B recycled water • 50 metres for Class C recycled water • 100 metres for Class D recycled water
No buffer distance has been recommended for the spraying of Class A recycled water. The buffer distances are to be amended appropriately to reflect the site-specific risks determined from a risk assessment.
Access by the public to spray-irrigated land should not be allowed until the surfaces have dried (QLD EPA, 2005).
For subsurface drip irrigation with Class B or C recycled water, there need not be controlled access to the irrigated land (QLD EPA, 2005).
The recycled water may emit odour depending on its quality. It is anticipated that the higher class treated water will have minimal potential to emit odour.
3.3.4 Power Generators and Boilers
Boilers that will operate on-site will emit combustion by-products through stacks. However, as these will only be sized to service the Project, it is anticipated these will be small in scale and the emissions will not be likely to cause an impact beyond the immediate vicinity of the exhausts.
The southern end of the resort Stage 1b areas will be powered completely by diesel generators. The anticipated maximum demand is 270 kVA.
Generators will also be used for the Stage 1a areas as back-up/top up to the batteries when solar is not sufficient and for some of the services of the cooking area or theme park equestrian centre. The generator to be used for Stage 1a will have a capacity of 0.13 MW and may be used more than 100 hours per year. After Stage 1b is completed, they will only be used for backup in the event of mains power failure, anticipated to be less than 100 hours per year including testing.
3.3.5 Solid Wastes
The putrescible solid wastes generated and stored on-site will have the potential to decay and cause odour nuisance. General waste and co-mingled recycling bins will be located throughout the operational precinct within the development. These will be internally collected and stored in the central waste and recycling

8852R02V02.docx 20
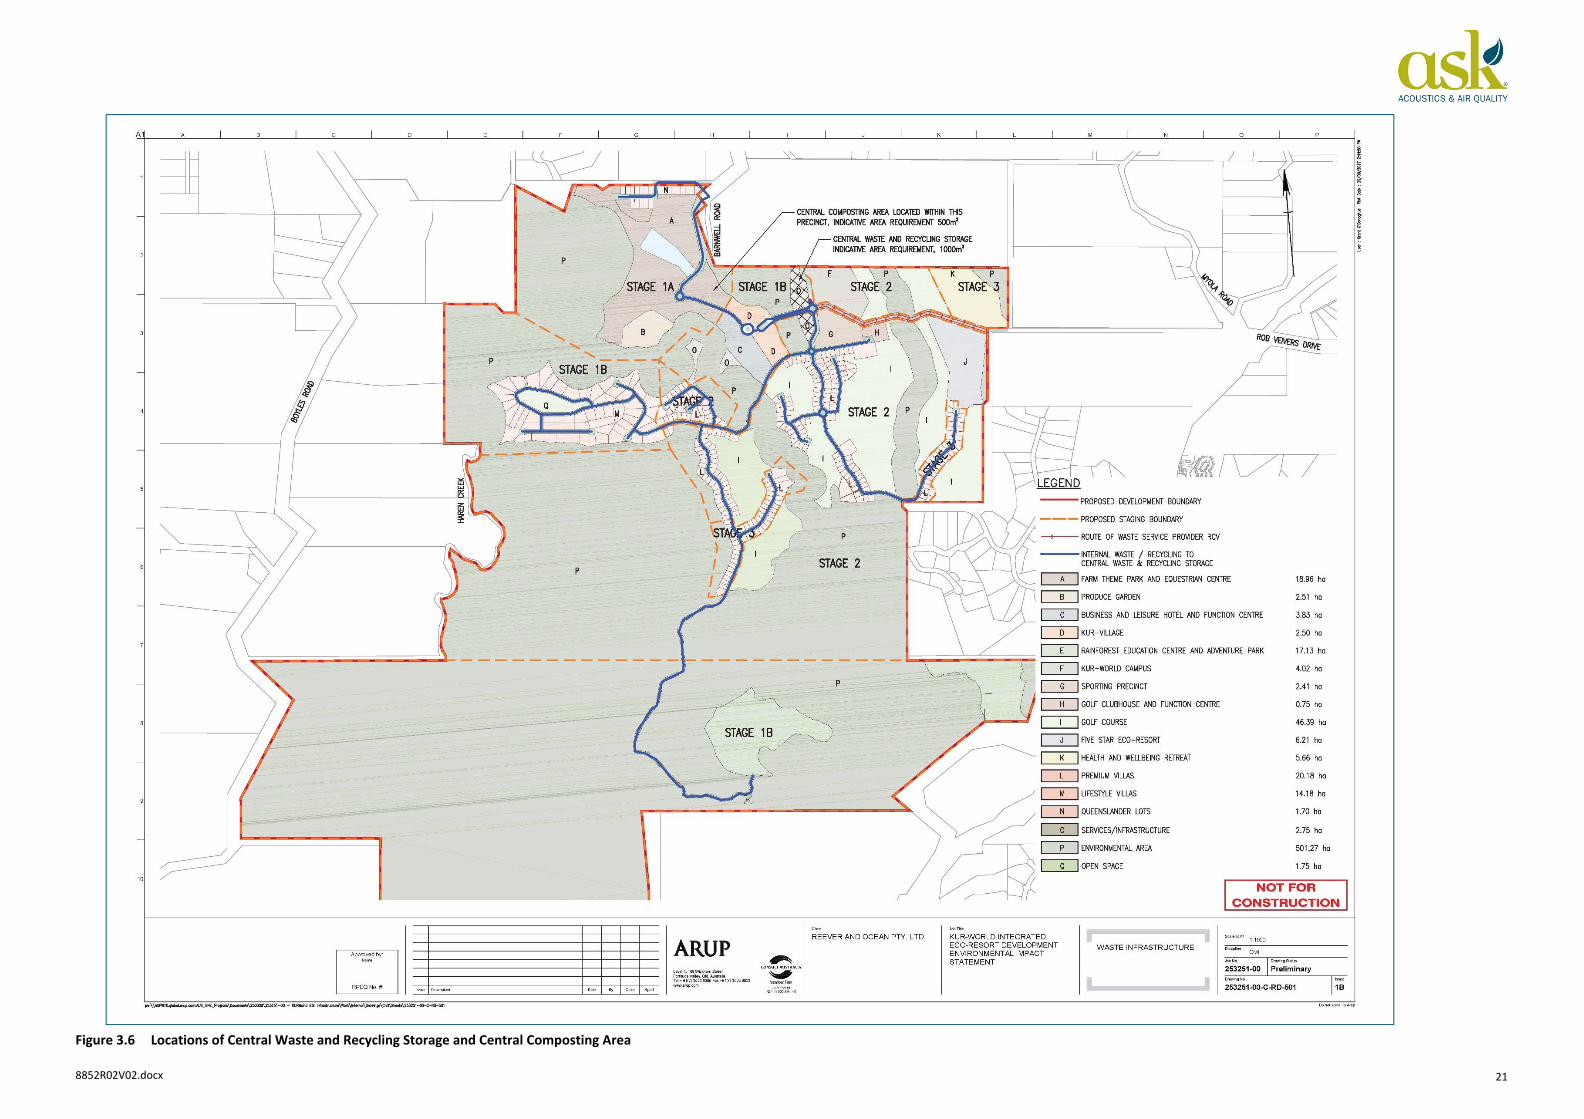
storage facility prior to collection by the waste service provider. The location of the central waste and recycling storage facility is shown in Figure 3.6. The central waste and recycling storage facility will include the following:
• Maintenance hub, storage area and charging station for the electric collection vehicles (ECVs) and electric vehicles (EVs) servicing internal collection of general waste and co-mingled recycling
• Storage of extra bins • A compactor unit to compact the general waste prior to storage • Roll on roll off (RORO) containers for storage of compacted wastes and recyclables prior to collection • Ramped access for ECVs to tip wastes and recyclables into the compactor or RORO containers • Bin washing facilities.
The storage facility will be constructed with materials that will be easily cleaned and prevent the absorption of liquid and odours. The floors will be graded and drained to the sewerage system. A close-fitting and self-closing door or gate operable from within the rooms is recommended to be fitted to all waste and recyclable storage areas. The waste storage rooms, areas and containers will be constructed in a manner to prevent the entry of vermin. A mechanical exhaust ventilation system will be installed for the waste storage rooms exhausting at a rate of 5 L/s/m2, with a minimum rate of 100 L/s.
3.3.6 Composting
Organic green waste from the golf course and resort landscaping or maintenance and organic manure and used bedding material from the equestrian centre stables will be composted on-site in the farm theme park and equestrian centre precinct and may use an open windrow or in-vessel composting technology. Composting is a potential odour and dust source.
Compost produced will be applied within the development such as in the golf course area and the garden.
The location of the composting area is shown in Figure 3.6.
3.3.7 Cooking Exhausts
Cooking exhausts on-site will emit odour and combustion by-products mainly through the exhaust vents.
3.3.8 Animal Farm
The animal farm is a potential source of fugitive odour from any spoilt animal feed and excreta. The unsealed roads and surfaces are also potential sources of fugitive dust.
8852R02V02.docx 21
Figure 3.6 Locations of Central Waste and Recycling Storage and Central Composting Area

8852R02V02.docx 22
4. Qualitative Assessment of Impacts of Minor or Temporary Sources
4.1 Operational Impacts Odour and dust from the farm are consistent with the existing activities on the site and sufficiently minor not to require quantitative modelling. With proper management, odour from solid waste storage and odour and waste from the animal farm can be prevented or minimised. Recommended control measures to facilitate proper management are contained in Section 10.2.
The diesel generators at the southern end of the development will need to be located away from sensitive receptors. Since little accommodation is proposed for the southern end of the resort and the Billabong Hotel is located a substantial distance away and separated by dense vegetation from the site, it is likely that the location of power generators at the southern zone can be chosen so as not to impact any sensitive receptor. Measures are still recommended to prevent people accommodated in the southern area to be exposed to the generators’ emissions.
Similarly, the generators for Stage 1a will also need to be located away from sensitive receptors for the period that they are used to supplement normal power.
4.2 Construction Impacts The nearest existing sensitive receptor from the Stage 1A development site (Receptor 18) is approximately 50 metres to the north of the farm-stay accommodation. The nearest existing receptor downwind along the prevailing wind direction (Receptor 24) is approximately 300 metres to the north-west of the Stage 1B westernmost villa. All of the existing sensitive receptors are separated by dense trees from the development site apart from Receptors 18 and 19 which would likely be partially screened from the northernmost farm-stay by existing trees near the property boundaries.
The dense trees separating the receptors from the development site will act as barriers and natural filters preventing onsite emissions from readily reaching the receptors and hence would reduce the likely impacts. They could also act as wind breaks minimising wind erosion. As the winds are generally from the south-east quarter, onsite emissions will generally be blown towards the north-west where the separation distance to the receptors are likely to be large enough for the emitted pollutants to be dispersed to acceptable levels before reaching the receptors. The most susceptible receptors to elevated pollutant levels due to construction activities would be Receptors 18 and 19 due to their proximity to the development site and the absence of dense vegetation separating them from the development. However, the northernmost accommodation is relatively small and hence, construction works in the vicinity would only be of short duration, less than one year.
Construction activities in the southern zone will be minimal. The nearest existing sensitive receptor is located approximately 100 metres to the southeast of the site and surrounded by dense trees. Dominant winds would blow the construction emissions away from this sensitive receptor. This receptor is unlikely to be impacted by the short-duration construction activities in the vicinity.
Good practice control measures should be sufficient to avoid exceedance of criteria and complaints and are recommended in Section 10.2.

8852R02V02.docx 23
5. Air Quality Criteria
5.1 Odour
5.1.1 Mareeba Shire Planning Scheme
The Mareeba Shire Planning Scheme Version 1/2011 (Mareeba Shire Council, 2013) does not provide specific criteria for assessing odour impacts or impacts from STPs.
5.1.2 Queensland Odour Impact Assessment Guideline
In the absence of any Mareeba Shire Council criteria, the appropriate criteria are considered to be those contained in the Queensland Odour Impact Assessment Guideline (EHP, 2013a). The EHP (2013a) specifies an annoyance threshold for odour of 0.5 ou (odour units 2) for wake-free stacks and 2.5 ou for other sources, to be compared to the 99.5 percentile one hour model predictions. EHP explains the basis for these criteria as being a 99.5 percentile 3-minute average of 5 ou, and a one-hour-to-three-minute peak-to-mean ratio of 10 for wake-free stacks and 2 for other sources.
The sources in this assessment are affected by the wake of buildings and trees, so the appropriate criterion is 2.5 ou.
The criterion is to be applied at existing or likely future sensitive receptors.
5.2 Other Relevant Pollutants Construction activities have potential to generate particulates. Construction equipment exhausts will emit combustion products including sulphur dioxide (SO2), nitrogen oxides (NOx), particulates, carbon monoxide (CO) and volatile organic compounds (VOCs). VOCs may include benzene, benzo(a)pyrene, formaldehyde, toluene and xylene.
5.2.1 State Legislative Instruments
The Environmental Protection (Air) Policy (EPP Air) (2008) under the Environmental Protection Act (1994) provides objectives for air quality indicators (pollutants). Those objectives that are relevant to this project and human health and wellbeing have been summarised in Table 5.1.
Table 5.1 Air Quality Criteria (EPP Air) for Health and Wellbeing
Air Quality Indicator Period Criteria (µg/m3)
benzene 1 year 10
CO 8 hours 11,000 2
formaldehyde 1 day 54
NO2 1 hour 250 2
1 year 62
PM2.5 1 day 25
1 year 8
2 One odour unit is defined as the concentration at which 50% of the panellists in an odour analysis can detect the odour while the rest cannot.

8852R02V02.docx 24
Air Quality Indicator Period Criteria (µg/m3)
PM10 1 day 50 1
Total Suspended Particulates (TSP) 1 year 90 Notes: 1.Five allowable exceedances are currently allowed although the intent of this was to cater for regional events.
2. Allowance is made to exclude one day.
Note that the EPP Air also contains a criterion for visibility reducing particles, but this is a measure of regional air quality and is not relevant to point sources. The impact of visible particles from point sources is addressed by the PM2.5 criteria.
5.3 National Environmental Protection (Ambient Air Quality) Measure The EPP(Air) incorporates the goals nominated within the previous 2003 version of the National Environmental Protection (Ambient Air Quality) Measure. The current NEPM (Ambient Air Quality) dated February 2016 has multiple changes including the new standards and goals listed in Table 5.2. Exceedances of particulate standards are no longer allowed apart from the exceptional events defined below.
Table 5.2 New Standard and Goals in 2016 NEPM (Ambient Air Quality)
Air Quality Indicator Period Criteria (µg/m3)
PM2.5 goals for 2025 1 day 20
1 year 7
PM10 1 year 25 Notes: For the purpose of reporting compliance against PM10 and PM2.5 1 day average standards, jurisdictions shall exclude monitoring data that has been determined as being directly associated with an exceptional event (bushfire, jurisdiction authorised hazard reduction burning or continental scale windblown dust that causes exceedance of 1 day average standards).
These goals have not yet been adopted into the EPP(Air) so it is thus not clear how much reduction of existing background concentrations is expected to assist with achievement of the 2025 goals, and how much is to be achieved by restrictions on development. Thus these goals have not been adopted for this assessment.
5.4 National Environmental Protection (Air Toxics) Measure The EPP(Air) also incorporates as standards, the investigation levels contained in the National Environmental Protection (Air Toxics) Measure.
5.5 Dust Deposition Whilst there are no quantitative limits for dust deposition specified in legislation, there are guidelines designed to avoid nuisance caused by dust deposition fallout onto near horizontal surfaces.
The Department of Environment and Heritage Protection (EHP 2013b) suggests the guideline that deposited matter averaged over one month should not exceed 120 mg/m2/day (3.6 g/m2/month). For extractive industries, it is the insoluble component of analysed dust that is used.
It should be noted that this value is a guideline for the level that may cause nuisance at a sensitive receptor such as a residence or sensitive commercial land use. It is not normally necessary to achieve this level at the boundary, but boundary measurement can assist in the assessment of whether there is risk of nuisance occurring or not.
8852R02V02.docx 25
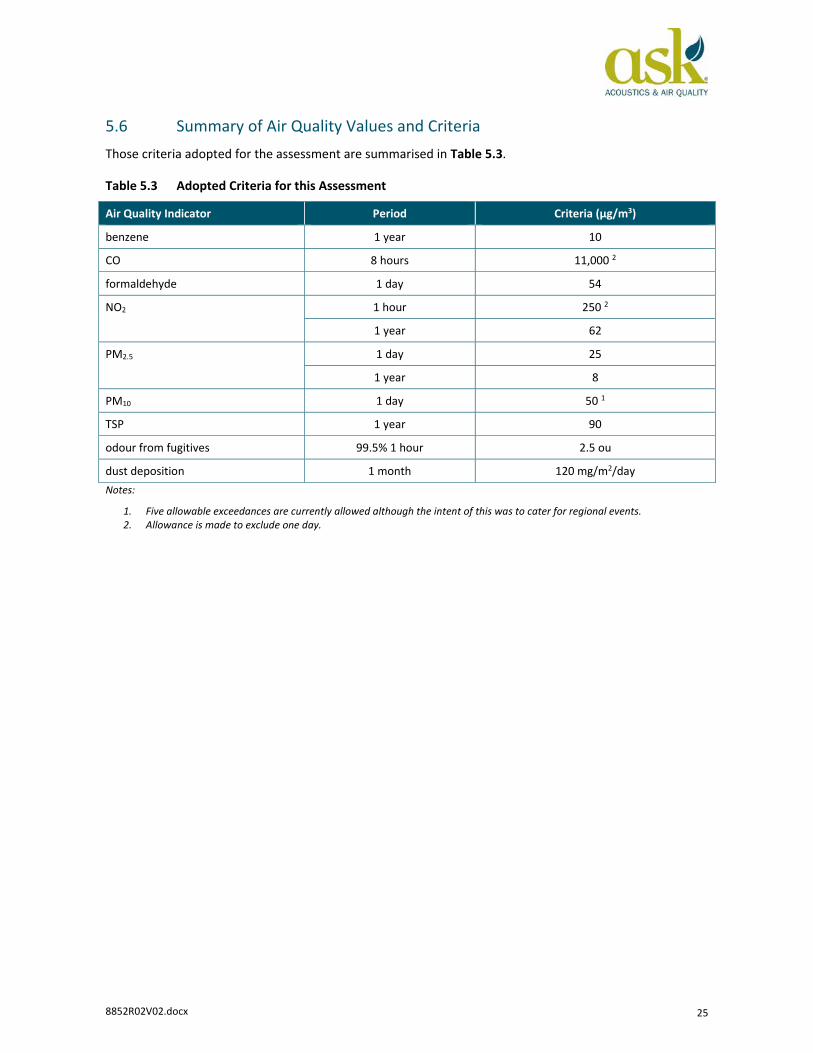
5.6 Summary of Air Quality Values and Criteria Those criteria adopted for the assessment are summarised in Table 5.3.
Table 5.3 Adopted Criteria for this Assessment
Air Quality Indicator Period Criteria (µg/m3)
benzene 1 year 10
CO 8 hours 11,000 2
formaldehyde 1 day 54
NO2 1 hour 250 2
1 year 62
PM2.5 1 day 25
1 year 8
PM10 1 day 50 1
TSP 1 year 90
odour from fugitives 99.5% 1 hour 2.5 ou
dust deposition 1 month 120 mg/m2/day Notes:
1. Five allowable exceedances are currently allowed although the intent of this was to cater for regional events. 2. Allowance is made to exclude one day.
8852R02V02.docx 26
6. Meteorological Modelling
6.1 TAPM Meteorological Modelling
6.1.1 TAPM Fundamentals
The meteorological component of The Air Pollution Model (TAPM) was used to provide wind fields over the region.
The databases required to run TAPM are provided by CSIRO and include global and Australian terrain height data, vegetation and soil type datasets, sea surface temperature datasets and synoptic scale meteorological datasets.
The Australian terrain data is in the form of 9-second grid spacing (approximately 0.3 kilometres) and is based on data available from Geosciences Australia. Australian vegetation and soil type data is on a longitude/latitude grid at 3-minute grid spacing (approximately 5 kilometres) and is public domain data provided by CSIRO Wildlife and Ecology.
The synoptic scale meteorology dataset used is a six-hourly synoptic scale analysis on a longitude/latitude grid at 0.75 or 1.0-degree grid spacing (approximately 75 kilometres or 100 kilometres). The database is derived from US NCEP reanalysis synoptic product.
TAPM dynamically fits the gridded data for the selected region to finer grids taking into account terrain, surface type and surface moisture conditions. It produces detailed fields of hourly estimated temperature, winds, pressure, turbulence, cloud cover and humidity at various levels in the atmosphere as well as surface solar radiation and rainfall.
6.1.2 TAPM Configuration
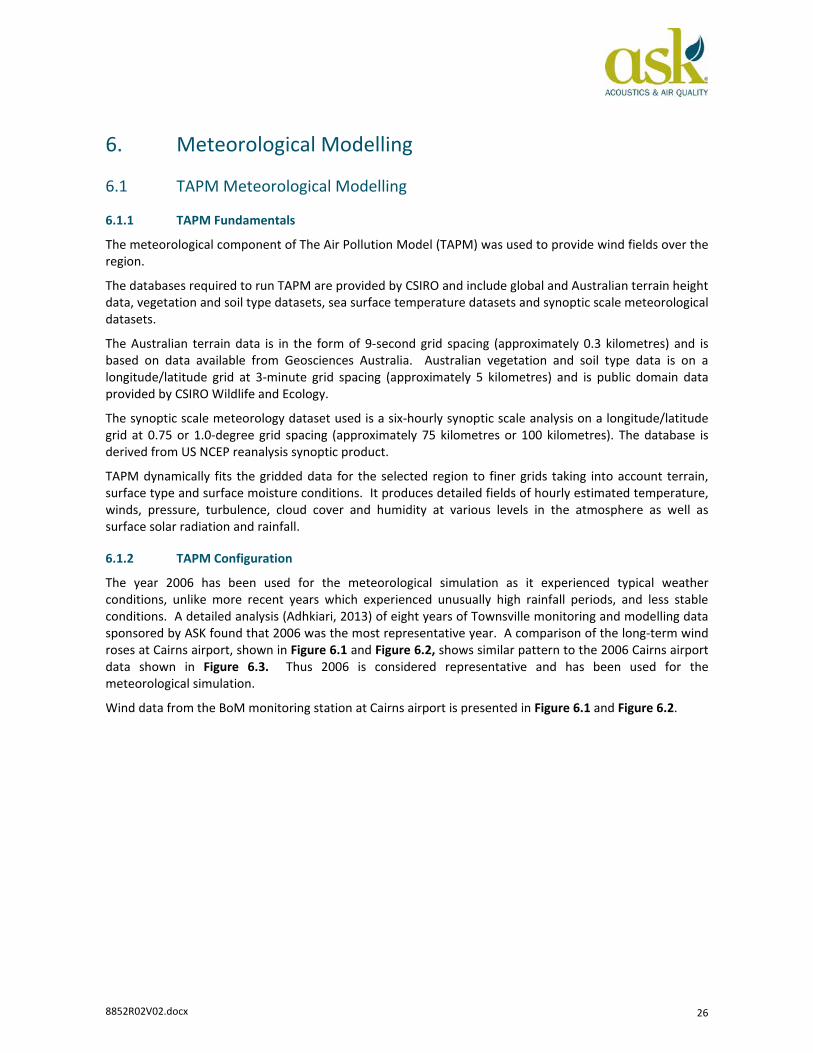
The year 2006 has been used for the meteorological simulation as it experienced typical weather conditions, unlike more recent years which experienced unusually high rainfall periods, and less stable conditions. A detailed analysis (Adhkiari, 2013) of eight years of Townsville monitoring and modelling data sponsored by ASK found that 2006 was the most representative year. A comparison of the long-term wind roses at Cairns airport, shown in Figure 6.1 and Figure 6.2, shows similar pattern to the 2006 Cairns airport data shown in Figure 6.3. Thus 2006 is considered representative and has been used for the meteorological simulation.
Wind data from the BoM monitoring station at Cairns airport is presented in Figure 6.1 and Figure 6.2.
8852R02V02.docx 27
Figure 6.1 Morning (9am) Wind Rose from Cairns Airport

8852R02V02.docx 28
Figure 6.2 Afternoon (3pm) Wind Rose from Cairns Airport
8852R02V02.docx 29
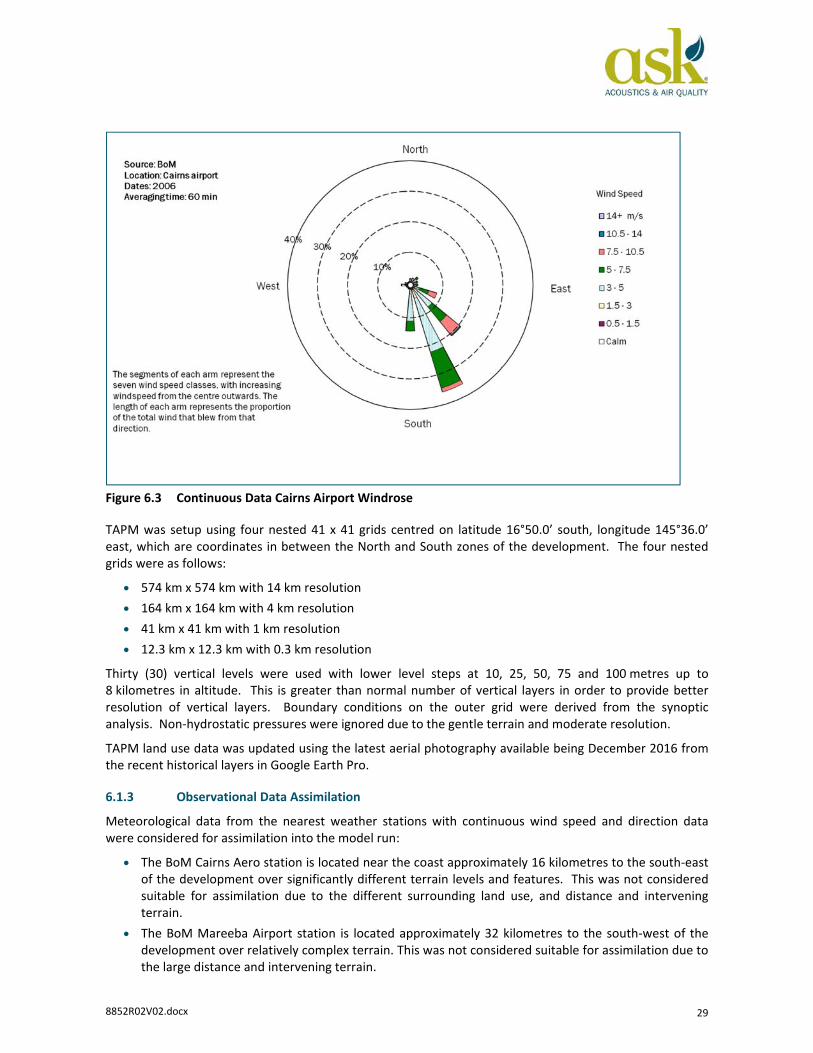
Figure 6.3 Continuous Data Cairns Airport Windrose
TAPM was setup using four nested 41 x 41 grids centred on latitude 16°50.0’ south, longitude 145°36.0’ east, which are coordinates in between the North and South zones of the development. The four nested grids were as follows:
• 574 km x 574 km with 14 km resolution • 164 km x 164 km with 4 km resolution • 41 km x 41 km with 1 km resolution • 12.3 km x 12.3 km with 0.3 km resolution
Thirty (30) vertical levels were used with lower level steps at 10, 25, 50, 75 and 100 metres up to 8 kilometres in altitude. This is greater than normal number of vertical layers in order to provide better resolution of vertical layers. Boundary conditions on the outer grid were derived from the synoptic analysis. Non-hydrostatic pressures were ignored due to the gentle terrain and moderate resolution.
TAPM land use data was updated using the latest aerial photography available being December 2016 from the recent historical layers in Google Earth Pro.
6.1.3 Observational Data Assimilation
Meteorological data from the nearest weather stations with continuous wind speed and direction data were considered for assimilation into the model run:
• The BoM Cairns Aero station is located near the coast approximately 16 kilometres to the south-east of the development over significantly different terrain levels and features. This was not considered suitable for assimilation due to the different surrounding land use, and distance and intervening terrain.
• The BoM Mareeba Airport station is located approximately 32 kilometres to the south-west of the development over relatively complex terrain. This was not considered suitable for assimilation due to the large distance and intervening terrain.

8852R02V02.docx 30
• Note that the BoM metadata for Kuranda Railway Station does not list a continuous wind speed and direction sensor.
Thus the TAPM model run without assimilation was used for detailed modelling to avoid the introduction of non-representative meteorological data.
6.1.4 TAPM Validation
The TAPM GIS visualisation tool was used to examine the final windfields generated by the model. The last few hours of the year were reviewed to ensure the model completed the run correctly. The windfields in the inner grid throughout the month of June were examined in detail to understand the local wind patterns, influence of topography. The following patterns were observed:
• Topography to the south-east of the site around the Barron Gorge influenced the windfields substantially, with a reduced wind speed and directions tending to follow the local terrain. Other topographic features had minimal influence at the resolution modelled by TAPM.
• Morning winds were mostly light to moderate south-easterlies. • Afternoon winds were mostly moderate south-easterlies. • Night winds were mostly light south-easterlies.
6.2 Topography and Land Use For the purpose of providing topographic data for the detailed modelling, the coordinates of a rectangular grid representative of the area around the proposed site were derived using WGS84 coordinates from Google Earth Professional. The south-west corner coordinates were (348400, 8136400), north-east corner coordinates were (353600, 8141600) and the grid interval was 80 metres with zero height receptors.
The WGS84 and GDA94 grids are identical to an accuracy of less than one metre. All coordinates in this report are rounded off to the nearest metre and are valid for both coordinate grids.
Gridded topographic data for Calmet was created using Global Mapper to process data from Geosciences Australia using the Kriging method and combine it with gridded LiDAR data. The Geosciences Australia data used was Shuttle Radar Topography Mission (SRTM) elevations on a 1-second grid (approximately 30 metre spacing) along with the LiDAR data for the development area provided by NRA Environmental Consultants.
6.3 Calmet Modelling Configuration. The Calmet configuration used is consistent with NSW OEH guidance (TRC 2011).
The model was run over the full year of 2006 based on a 3-dimensional grid produced using the Caltapm utility program to convert TAPM data to MM5 format suitable for Calmet to read. The Calmet grid was set to grid spacing of 80 metres and 65 by 65 grid points. Twelve vertical layers were modelled with cell face heights of 0, 20, 40, 80, 160, 300, 450, 650, 900, 1200, 1700, 2300, and 3200 metres. This is greater than normal number of vertical layers in order to provide better resolution of vertical layers.
Mixing height calculation parameters were set to default values. Temperature prediction parameters were set to default.
Divergence minimisation was used. The critical Froude number was set to 1. Slope flow effects were included. The radius of influence of terrain features was set to 1.5 kilometres being approximately half the distance between ridges.
The output from Calmet was a three dimensional grid of wind-field data for incorporation into Calpuff.
8852R02V02.docx 31
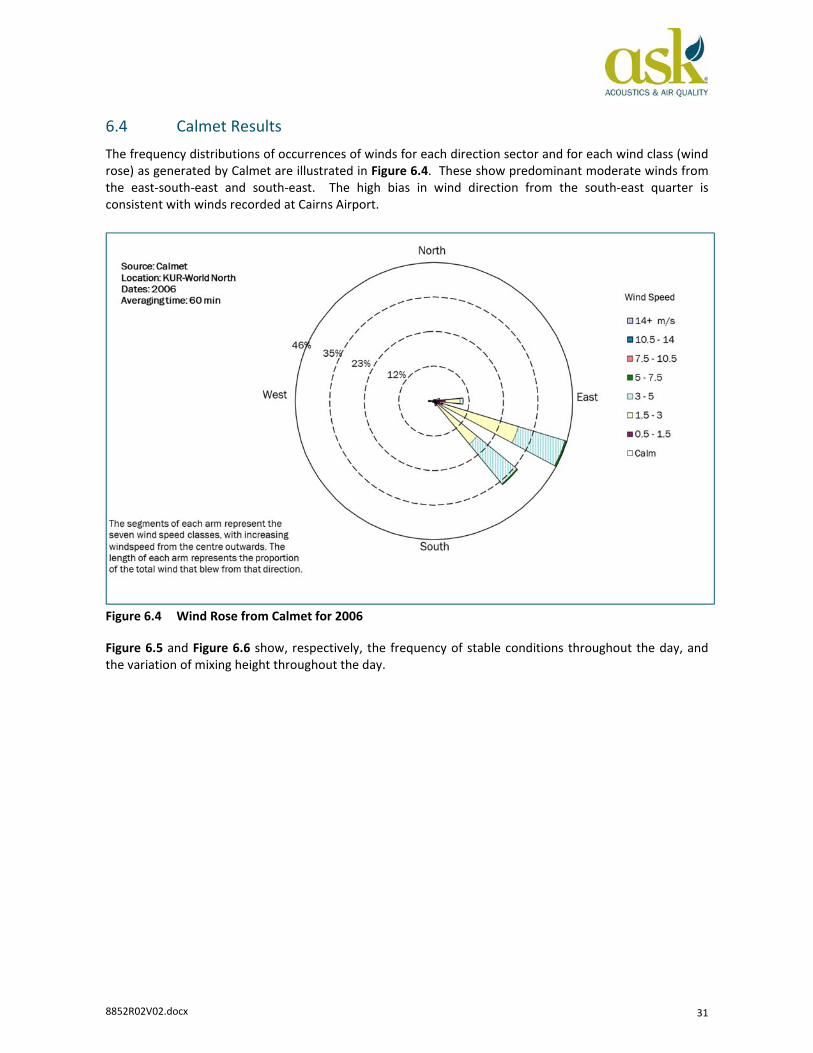
6.4 Calmet Results The frequency distributions of occurrences of winds for each direction sector and for each wind class (wind rose) as generated by Calmet are illustrated in Figure 6.4. These show predominant moderate winds from the east-south-east and south-east. The high bias in wind direction from the south-east quarter is consistent with winds recorded at Cairns Airport.
Figure 6.4 Wind Rose from Calmet for 2006
Figure 6.5 and Figure 6.6 show, respectively, the frequency of stable conditions throughout the day, and the variation of mixing height throughout the day.
8852R02V02.docx 32
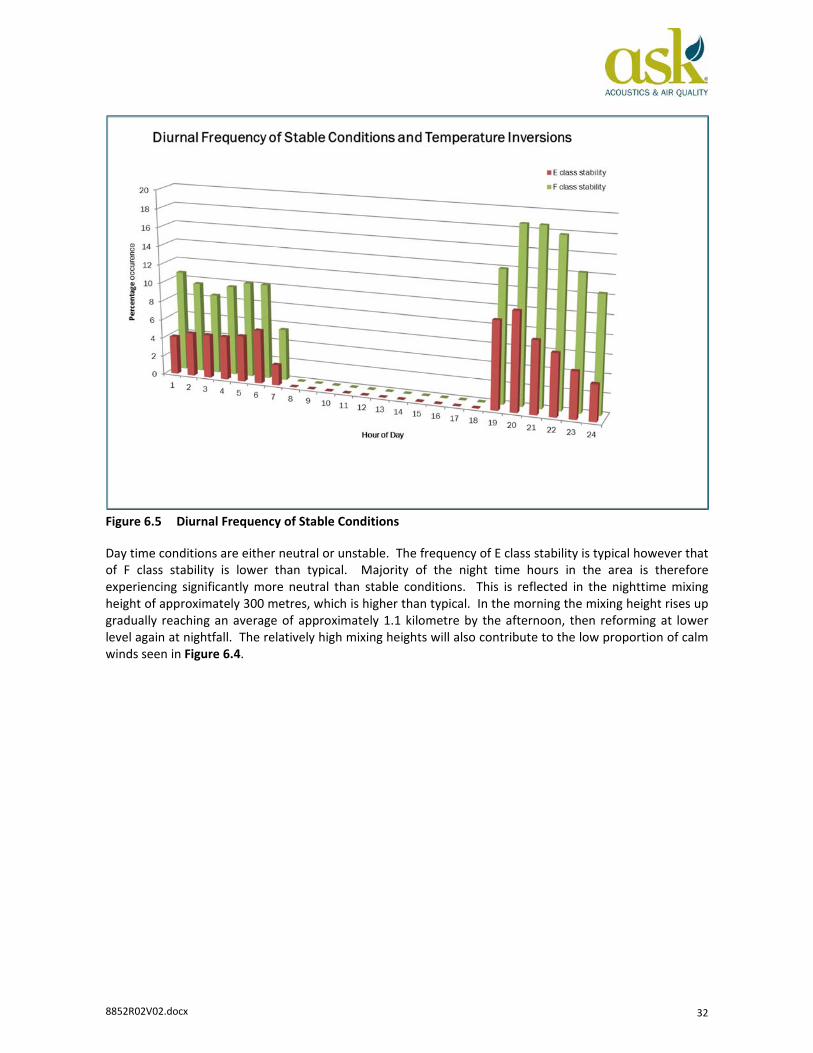
Figure 6.5 Diurnal Frequency of Stable Conditions
Day time conditions are either neutral or unstable. The frequency of E class stability is typical however that of F class stability is lower than typical. Majority of the night time hours in the area is therefore experiencing significantly more neutral than stable conditions. This is reflected in the nighttime mixing height of approximately 300 metres, which is higher than typical. In the morning the mixing height rises up gradually reaching an average of approximately 1.1 kilometre by the afternoon, then reforming at lower level again at nightfall. The relatively high mixing heights will also contribute to the low proportion of calm winds seen in Figure 6.4.
8852R02V02.docx 33
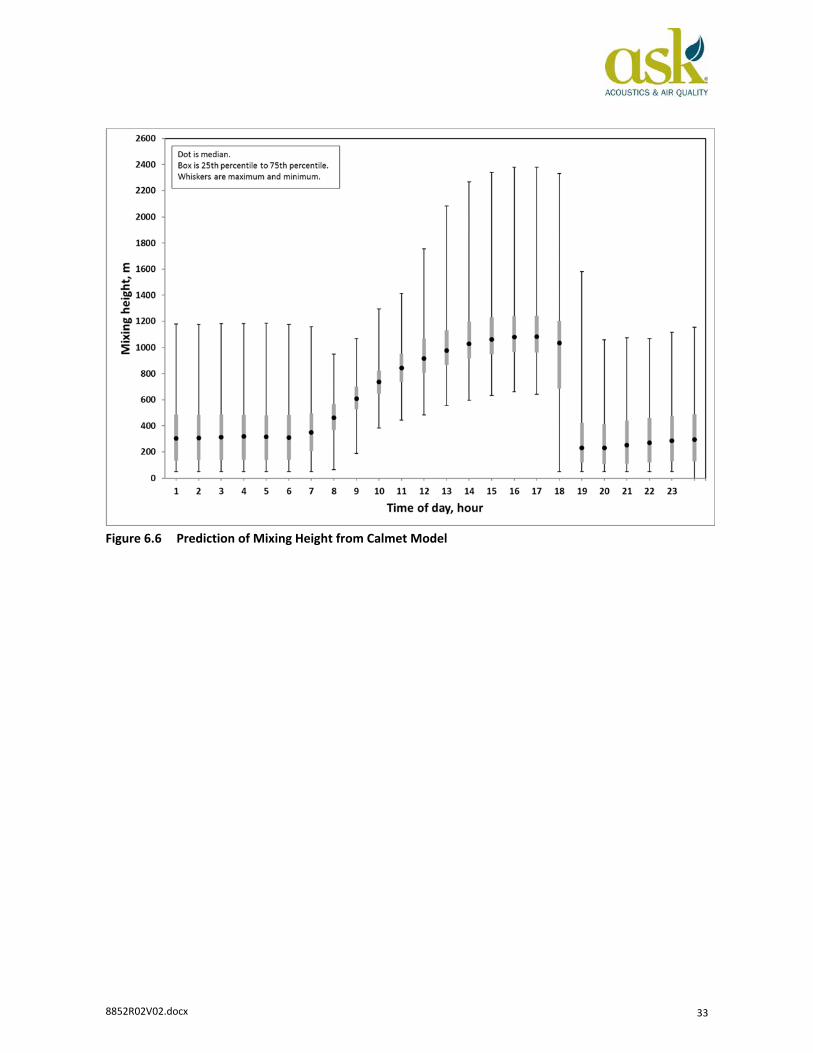
Figure 6.6 Prediction of Mixing Height from Calmet Model

8852R02V02.docx 34
7. Existing Air Quality
7.1 Overview Based on the rural nature of the regional area, it is expected that the air quality for the study area would be acceptable for the majority of the time with possible exceptions including dust and particulates. The existing air quality would be influenced by sporadic traffic on unsealed roads as well as bushfires and controlled burning. Although, localised or short-term degradation of the air quality environment would most likely be due to smoke and dust from fires, it could also be affected by emissions from the construction and operation of the project. Some construction and operational activities have not been modelled as part of this assessment as the impacts are likely to be short-term and low-risk.
7.2 Local Air Emission Sources As discussed in Section 2.3, no medium impact air quality sources were observed within 300 metres of the site. Low to medium impact air quality sources are widely dispersed and surrounded by dense trees. These sources are very unlikely to have any impact on the site but some of these have minor potential to impact the sensitive receptors nearest them, which are sufficiently far from the site that the activities onsite are unlikely to cause discernible contribution to the impacts.
7.3 Odour The only regional sources of odour are occasional vegetation fires. Unlike other air quality criteria, odour criterion relates to the source under assessment and any associated odours. Odours from other sources are not considered a cumulative impact unless associated with a similar source.
For the purpose of comparison with criterion, regional background odour is normally assumed to be zero.
7.4 Monitoring Data from other Locations
7.4.1 Overview of Available Air Quality Data
Available local and regional monitoring data have been used to review the existing background. In the absence of continuous monitoring data, it is recommended by Victoria (2001) to use the 70th percentile as a background concentration for dispersion modelling.
The nearest ambient air monitoring station operated by Department of Science, Information Technology and Innovation (DSITI) was Earlville in western Cairns in the 1990s, and more recently DSITI has monitored at three stations in Townsville, as discussed in the sections below.
7.4.2 Earlville
Monitoring of TSP was undertaken in Mulgrave Road, Earlville, until 1999. The monitoring site is approximately 4 kilometres to the west of the wharf adjacent to a busy road and near light industry uses. The average concentration from 1995 to 1999 was 24 µg/m3:
• 26 µg/m3 in 1995 • 31 µg/m3 in 1996 • 21 µg/m3 in 1997 • 20 µg/m3 in 1998 • 21 µg/m3 in 1999.

8852R02V02.docx 35
This is considered to be the most representative long-term monitoring site in the region, although surrounding land uses will tend to generate more particulates than at the development site. The TSP measurements from this location have been adopted as a conservatively high background.
7.4.3 Townsville Coast Guard
Monitoring at the Townsville Coast Guard site began in 2007 as part of the Townsville Dust Monitoring Program, implemented in response to community concerns about dust impacts from the Port of Townsville operations. In May 2014 the Townsville Coast Guard station and the Townsville Port monitoring station were amalgamated into one joint monitoring station at the Townsville Coast Guard. Due to the high activity levels from freight shipping including bulk handling, this location is likely to have higher pollutant concentrations than in the development area. The station measures:
• meteorological data • PM10 • TSP • metals.
7.4.4 Townsville Port
Established by the Port of Townsville Limited in 1994, the Townsville Port monitoring station was located on the western boundary of the Townsville Harbour. It monitored the impact of port activities on nearby residential areas. In May 2014 this station was amalgamated with the Townsville Coast Guard station to form one joint monitoring station at the Townsville Coast Guard. It was classified as a peak (port operations) station and due to the high activity levels from freight shipping including bulk handling, is likely to have higher pollutant concentrations than in the development area. The station measured:
• meteorological data • PM10 • TSP.
7.4.5 Pimlico
The Pimlico monitoring station was established in June 2004 to measure air pollutants in the Townsville area. It is classified as a neighbourhood station and was located at Latitude: -19.2871; Longitude: 146.7813 within the TAFE North Pimlico Campus grounds until the site was redeveloped in February 2016. The station measured:
• meteorological data • ozone • sulfur dioxide • oxides of nitrogen • PM10.
This is considered to be the most representative site for PM10 and acid gases, and the measured concentrations are presented in Table 7.1.

8852R02V02.docx 36
Table 7.1 Concentrations Recorded by Queensland DSITI Air Quality Monitoring Station at Pimlico in Townsville from 2007 until 2015
Year 75th percentile 1-hour NO2
concentration (µg/m3)
Annual NO2 concentration
(µg/m3)
75th percentile 1-
hour SO2
concentration (µg/m3)
75th percentile 24-
hour SO2
concentration (µg/m3)
Annual SO2 concentration
(µg/m3)
75th percentile 24-hour PM10 concentration
(µg/m3)
2007 30 8 5 3 3 15
2008 32 11 3 0 0 19
2009 36 9 3 3 0 18
2010 30 9 5 3 0 16
2011 not available 11 10 5 3 18
2012 32 9 5 3 3 16
2013 24 8 3 3 0 18
2014 26 8 5 3 3 17
2015 28 8 5 3 3 21
Average 30 9 5 3 1 18
7.4.6 Gladstone Memorial Park
Established in 2009, the Memorial Park station uses differential optical absorption spectroscopy (DOAS) equipment to monitor pollutants over a light path from the Entertainment Centre to Memorial Park. It is classified as a neighbourhood station and is located at Latitude: -23.8426; Longitude: 151.2534. The station measures:
• ozone • nitrogen oxides • sulfur dioxide • air toxics (organic pollutants).
This is considered to be the most representative site for organic pollutants, and the measured concentrations are presented in Table 7.2.
Table 7.2 Concentrations Recorded by Monitoring Station at Gladstone Memorial Park
Year
Annual average benzene (µg/m3)
Maximum 24h toluene
(µg/m3)
Annual average toluene (µg/m3)
Maximum 24h
xylene (µg/m3)
Annual average xylene (µg/m3)
Maximum 24h
formadehyde (µg/m3)
2009 i.d. 5 i.d. 34 i.d. 6 2010 i.d. 8 i.d. 33 i.d. 5 2011 i.d. 7 4 39 29 5 2012 i.d. 27 i.d. 149 i.d. 5 2013 i.d. 11 i.d. 79 i.d. 6 2014 4 18 8 127 51 5 2015 5 11 7 90 52 5
8852R02V02.docx 37
Year
Annual average benzene (µg/m3)
Maximum 24h toluene
(µg/m3)
Annual average toluene (µg/m3)
Maximum 24h
xylene (µg/m3)
Annual average xylene (µg/m3)
Maximum 24h
formadehyde (µg/m3)
Average 5 12 6 79 44 5 Note: i.d. = insufficient data
7.4.7 South Gladstone
Established in 1992, the monitoring station is located in the grounds of the South Gladstone State School in a residential district. Since the Townsville and Mackay monitoring stations do not include PM2.5, the South Gladstone station is considered the most representative for the development and the measured concentrations at this station are presented in Table 7.3.
Table 7.3 Concentrations of Fine Particulates (PM2.5) Recorded by Queensland DSITI Air Quality Monitoring Station at South Gladstone for 2009-2015
Year 75th percentile 24-hour PM2.5 concentration (µg/m3) Annual PM2.5 concentration (µg/m3)
2009 10.5 1 9.2 1
2010 7.6 6.2 2011 7.6 7.5 2012 5.9 5.2 2013 6.3 5.6 2014 7.5 6.0 2015 5.2 4.3
Average 6.7 5.8 Note: 1 This data was not included in the average since the DSITI NEPM report for 2009 stated that there was a much higher than normal incidence and severity of wind blow dust events throughout Queensland.
7.4.8 Toowoomba
The Toowoomba DSITI monitoring station located at Willowburn Oval was the only CO monitoring station in Queensland outside of the Brisbane CBD, but closed down recently due to flooding. It was surrounded by residential and light industry areas. It is considered the most representative station and will be used for estimating background levels of CO for the purposes of this assessment. Table 7.4 shows that the averaged maximum 8-hour background CO is 2.2 ppm (2750 µg/m3).
Table 7.4 Concentrations of Carbon Monoxide Recorded by Queensland DSITI Air Quality Monitoring Station at Toowoomba for 2003-2010
Year Maximum 8-hour average CO (ppm)
2003 2.6
2004 3.4
2005 2.3
2006 1.9
2007 2.2
2008 1.9
2009 1.8
8852R02V02.docx 38
Year Maximum 8-hour average CO (ppm)
2010 1.7
Average 2.2
7.4.9 Dust Deposition
Dust deposition varies substantially depending on local sources and season. Any dust deposition data for the local area is not publicly available. In industrial areas, insoluble dust deposition levels are typically in the order of 50 mg/m2/day. For this locality in a well-forested area with few local sources, background insoluble dust deposition levels are assumed to be 30 mg/m2/day.
7.5 Assumed Background Concentrations The estimated background air quality for key pollutants has been summarised with the estimated concentrations listed in Table 7.5, based on long term average at the stations with the most representative data. These are well within the criteria contained in Table 5.3. It is anticipated that the criteria would only be exceeded during regional events such as bushfires, dust storms or the afternoon cane fire haze events during harvesting season.
Table 7.5 Estimated Background Air Quality
Pollutant Averaging period Assumed Background (µg/m3)
TSP 1 year 24 PM10 24 hours 18 PM2.5 24 hours 6.7 1 year 5.8 NO2 1 hour 30 1 year 9 SO2 1 hour 5 24 hours 3 1 year 1 CO 8 hours 2.2 Benzene 1 year 5 Toluene 24 hours 12 Annual average 6 Xylene 24 hours 79 Annual average 44 Formaldehyde 24 hours 5 Benzo(a)pyrene Annual average 0.1 ng/m3
Dust deposition Annual average 30 mg/m2/day

8852R02V02.docx 39
8. Pollution Modelling Methodology
8.1 Overview In order to predict what happens to the pollutants after they are emitted to air, a mathematical model is used to simulate their dispersion and deposition. It is accepted by regulatory agencies that this type of modelling has associated uncertainties. These are normally addressed by using statistics over long simulation times, and deriving emission rates based on published emission factors or data representing high emission conditions.
With sources close to ground level, the critical wind conditions tend to be near-calm i.e. low wind speeds. Gaussian plume models such as Ausplume and Aermod cannot model calm conditions and have low accuracy in light winds, especially in valleys where katabatic flows are present and where drainage flows turn to follow the valley. Calpuff, being a non-steady-state Lagrangian puff model, is able to simulate stagnation over time, which is critical in near-calm conditions. Its meteorological pre-processor Calmet performs diagnostic simulation of terrain effects on the wind field. It has a specific slope flow algorithm that predicts katabatic flows (Scire, J.S. & Robe, F.R., 1997).
Due to the low source height for emissions sources associated with the Project, the worst conditions may be near-calm conditions. In near-calm conditions there is little turbulent mixing and less dilution by incoming wind.
Thus Calpuff (Version 7.2.1) was chosen as the most appropriate model.
8.2 Calpuff Configuration The three dimensional wind fields from Calmet were entered into Calpuff for the full year 2006. For the modelling of the emissions from the sewage treatment plant, Calpuff was run over a smaller computational grid (3.68 kilometres x 3.44 kilometres) with spacing of 80 metres, and with a sampling grid over a 3.28 kilometres x 2.24 kilometres domain with a nesting factor of 2 to achieve a resolution of 40 metres. For the modelling of the emissions from the road construction, Calpuff was run over a smaller computational grid (0.96 kilometres x 0.96 kilometres) with spacing of 80 metres, and with a sampling grid over a 0.72 kilometres x 0.64 kilometres domain with a nesting factor of 4 to achieve a resolution of 20 metres.
Wind speed profile was set to the Industrial Source Complex (ISC) Rural exponents. Light wind conditions were not invoked until the wind speed dropped below 0.2 m/s. Transitional plume rise and partial penetration of boundary layers were included. Briggs rise algorithm was used since the sources are not very hot.
The emissions were modelled as puffs (not slugs). Puff-splitting was turned off.
Dispersion coefficients were derived by the model using turbulence generated by micrometeorology. The Heffter curve was used to compute time-dependent dispersion beyond 550 metres. The partial plume height adjustment method was used to allow winds to approach hills as terrain increases.
The minimum turbulence velocity, sigma v, was set to 0.2 m/s.
8.3 Odour Emission Inventory Plans for the STP are not available at the time of writing of this report. Most of the operational STPs however have similar components and operations. It has been assumed that the proposed STP for the development would have similar components and operation to a similar-sized STP in Canungra previously assessed by ASK (2017). The modelled odour sources of the STP are graphically presented in Figure 8.1 and
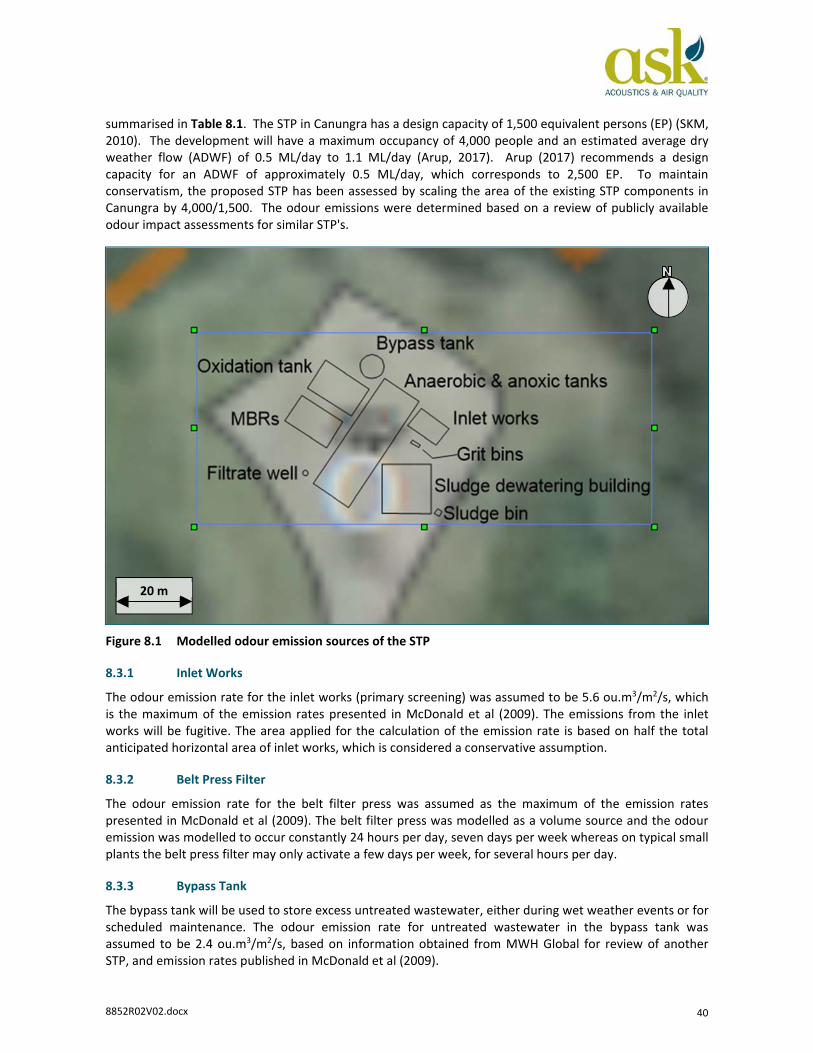
8852R02V02.docx 40
summarised in Table 8.1. The STP in Canungra has a design capacity of 1,500 equivalent persons (EP) (SKM, 2010). The development will have a maximum occupancy of 4,000 people and an estimated average dry weather flow (ADWF) of 0.5 ML/day to 1.1 ML/day (Arup, 2017). Arup (2017) recommends a design capacity for an ADWF of approximately 0.5 ML/day, which corresponds to 2,500 EP. To maintain conservatism, the proposed STP has been assessed by scaling the area of the existing STP components in Canungra by 4,000/1,500. The odour emissions were determined based on a review of publicly available odour impact assessments for similar STP's.
Figure 8.1 Modelled odour emission sources of the STP
8.3.1 Inlet Works
The odour emission rate for the inlet works (primary screening) was assumed to be 5.6 ou.m3/m2/s, which is the maximum of the emission rates presented in McDonald et al (2009). The emissions from the inlet works will be fugitive. The area applied for the calculation of the emission rate is based on half the total anticipated horizontal area of inlet works, which is considered a conservative assumption.
8.3.2 Belt Press Filter
The odour emission rate for the belt filter press was assumed as the maximum of the emission rates presented in McDonald et al (2009). The belt filter press was modelled as a volume source and the odour emission was modelled to occur constantly 24 hours per day, seven days per week whereas on typical small plants the belt press filter may only activate a few days per week, for several hours per day.
8.3.3 Bypass Tank
The bypass tank will be used to store excess untreated wastewater, either during wet weather events or for scheduled maintenance. The odour emission rate for untreated wastewater in the bypass tank was assumed to be 2.4 ou.m3/m2/s, based on information obtained from MWH Global for review of another STP, and emission rates published in McDonald et al (2009).
20 m

8852R02V02.docx 41
To represent the statistical occurrence of emission from the bypass tank, a variable emission rate has been used for this source, with odour emissions modelled to occur two hours each day, staggered from 5am to midday, and from 3pm to 10pm, Sunday to Saturday (a total of 14 hours per week). Over the course of a full year, this will result in a total emission time of 728 hours, which allows for the scheduled maintenance (9 hours per week, 468 hours in a year) and approximately 11 days (260 hours) of storage for other upset events.
8.3.4 Filtrate Well
Odour is emitted from the filtrate well when untreated wastewater (with the exception of primary treatment) is bypassed and released. Due to the turbulence in the well, odour is typically stronger from this source than from the bypass tank (ASK, 2017), and therefore a higher odour emission rate of 9.9 ou.m3/m2/s was applied based on the results of odour measurements by CEE (2006) of a flow splitter located at the Merrimac WWTP. To represent the statistical occurrence of emissions from the filtrate well, odour emissions were modelled to occur two hours every day during summer months (between 8am to 11am and 3pm to 6pm), totalling 180 hours per year, or approximately 7.5 days.
8.3.5 Sludge Bin
The odour emission rate applied for the dewatered sludge bin was 9 ou.m3/m2/s, based on the odour emission rate applied for sludge by CEE (2006) for the assessment of the Pimpama WWTP. Potential for overspill was taken into account in the estimation of the source dimension.
8.3.6 Treated Wastewater
It has been assumed that the quality of the treated wastewater onsite will be equivalent to Class A and is likely to have insubstantial odour. No odour emissions were included from treated wastewater in storage areas.
8.3.7 Summary
The odour emission rates for other sources were obtained via review of emission rates presented in the SKM odour assessment for Canungra, and odour impact assessments for Pimpama WWTP (CEE, 2006) and Googong WWTP (MWG Global, 2009) and the emission rates presented in McDonald et al (2009).
The modelled emissions for the STP are presented in Table 8.1. With the exception of the dewatering belt filter press, all sources were modelled as area sources.
Table 8.1 Odour Emission Factors Derived
Odour Source
Specific Odour Emission Rate
(SOER) (ou.m3/m2/s)
Modelled Unit
Quantity
Exposed Area (per unit) m2
Total Odour Emission
Rate (ou.m3/s)
Publication Source Emission Variability
Inlet Works 5.6 1 53.3 299
Canungra STP (SKM, 2010),
McDonald et al (2009)
Constant
Grit Bins 5.0 3 0.67 10 Pimpama WWTP (CEE, 2006) Constant
Anaerobic Tank 2.7 1 130.7 357
Canungra STP (SKM, 2010),
McDonald et al (2009)
Constant
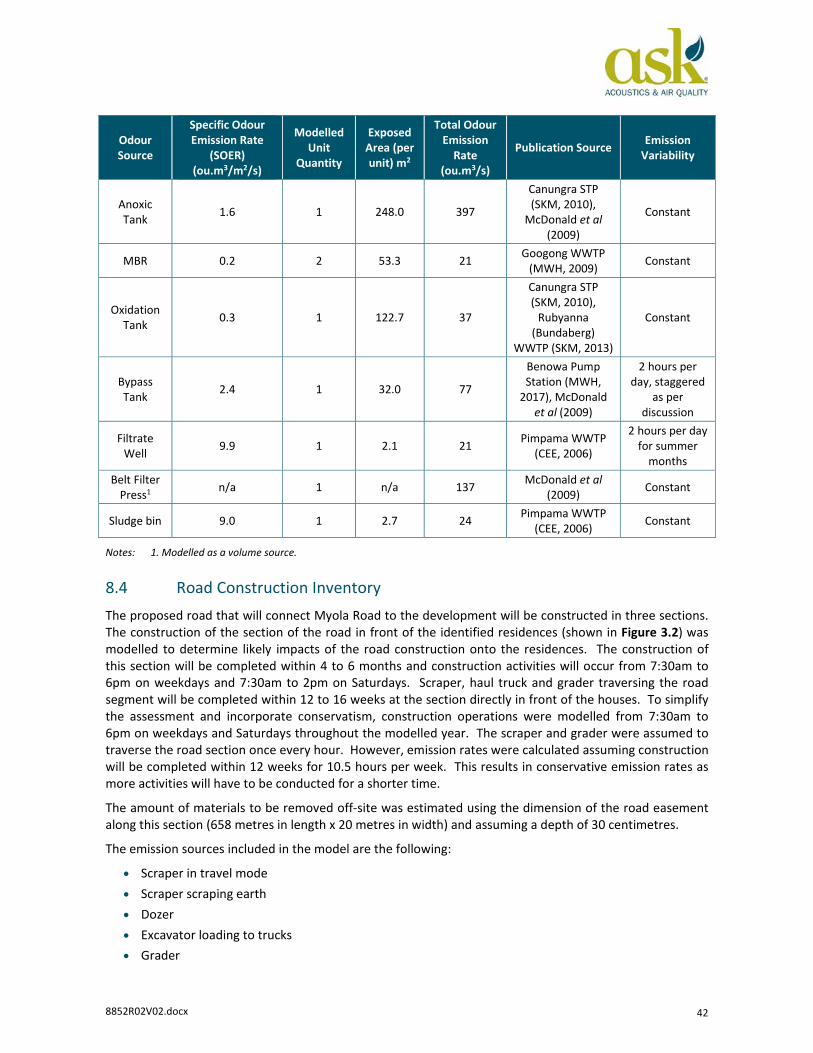
8852R02V02.docx 42
Odour Source
Specific Odour Emission Rate
(SOER) (ou.m3/m2/s)
Modelled Unit
Quantity
Exposed Area (per unit) m2
Total Odour Emission
Rate (ou.m3/s)
Publication Source Emission Variability
Anoxic Tank 1.6 1 248.0 397
Canungra STP (SKM, 2010),
McDonald et al (2009)
Constant
MBR 0.2 2 53.3 21 Googong WWTP (MWH, 2009) Constant
Oxidation Tank 0.3 1 122.7 37
Canungra STP (SKM, 2010),
Rubyanna (Bundaberg)
WWTP (SKM, 2013)
Constant
Bypass Tank 2.4 1 32.0 77
Benowa Pump Station (MWH,
2017), McDonald et al (2009)
2 hours per day, staggered
as per discussion
Filtrate Well 9.9 1 2.1 21 Pimpama WWTP
(CEE, 2006)
2 hours per day for summer
months Belt Filter
Press1 n/a 1 n/a 137 McDonald et al (2009) Constant
Sludge bin 9.0 1 2.7 24 Pimpama WWTP (CEE, 2006) Constant
Notes: 1. Modelled as a volume source.
8.4 Road Construction Inventory The proposed road that will connect Myola Road to the development will be constructed in three sections. The construction of the section of the road in front of the identified residences (shown in Figure 3.2) was modelled to determine likely impacts of the road construction onto the residences. The construction of this section will be completed within 4 to 6 months and construction activities will occur from 7:30am to 6pm on weekdays and 7:30am to 2pm on Saturdays. Scraper, haul truck and grader traversing the road segment will be completed within 12 to 16 weeks at the section directly in front of the houses. To simplify the assessment and incorporate conservatism, construction operations were modelled from 7:30am to 6pm on weekdays and Saturdays throughout the modelled year. The scraper and grader were assumed to traverse the road section once every hour. However, emission rates were calculated assuming construction will be completed within 12 weeks for 10.5 hours per week. This results in conservative emission rates as more activities will have to be conducted for a shorter time.
The amount of materials to be removed off-site was estimated using the dimension of the road easement along this section (658 metres in length x 20 metres in width) and assuming a depth of 30 centimetres.
The emission sources included in the model are the following:
• Scraper in travel mode • Scraper scraping earth • Dozer • Excavator loading to trucks • Grader
8852R02V02.docx 43
• Wheel-generated dust from truck movements • Wind erosion
Equations used to calculate the emission rates are presented in Appendix B.
8.4.1 Source Configuration
Wind erosion was modelled as an area source with a dimension of 658 metres by 20 metres, initial sigma z of 1 metre and an effective height of 0.
All the other sources were modelled as volume sources evenly spread along the road section.
The dust emissions from the excavator loading to trucks were modelled as volume sources with effective height of 5 metres, initial sigma y of 4.7 metres and initial sigma z of 4.7 metres.
All other emission sources were modelled with an effective height of 2.6 metres, initial sigma y of 4.7 metres and initial sigma z of 2.4 metres.
8.4.2 Summary of Emission Inventory
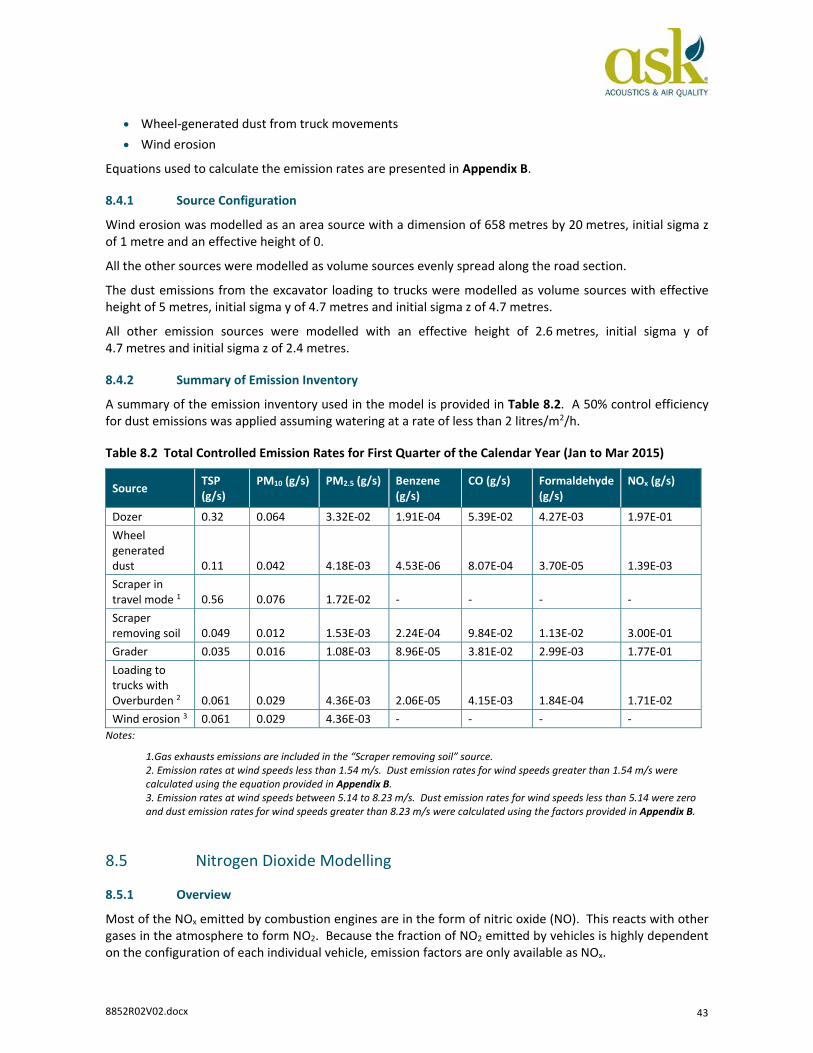
A summary of the emission inventory used in the model is provided in Table 8.2. A 50% control efficiency for dust emissions was applied assuming watering at a rate of less than 2 litres/m2/h.
Table 8.2 Total Controlled Emission Rates for First Quarter of the Calendar Year (Jan to Mar 2015)
Source TSP (g/s)
PM10 (g/s) PM2.5 (g/s) Benzene (g/s)
CO (g/s) Formaldehyde (g/s)
NOx (g/s)
Dozer 0.32 0.064 3.32E-02 1.91E-04 5.39E-02 4.27E-03 1.97E-01 Wheel generated dust 0.11 0.042 4.18E-03 4.53E-06 8.07E-04 3.70E-05 1.39E-03 Scraper in travel mode 1 0.56 0.076 1.72E-02 - - - - Scraper removing soil 0.049 0.012 1.53E-03 2.24E-04 9.84E-02 1.13E-02 3.00E-01 Grader 0.035 0.016 1.08E-03 8.96E-05 3.81E-02 2.99E-03 1.77E-01 Loading to trucks with Overburden 2 0.061 0.029 4.36E-03 2.06E-05 4.15E-03 1.84E-04 1.71E-02 Wind erosion 3 0.061 0.029 4.36E-03 - - - -
Notes:
1.Gas exhausts emissions are included in the “Scraper removing soil” source. 2. Emission rates at wind speeds less than 1.54 m/s. Dust emission rates for wind speeds greater than 1.54 m/s were calculated using the equation provided in Appendix B. 3. Emission rates at wind speeds between 5.14 to 8.23 m/s. Dust emission rates for wind speeds less than 5.14 were zero and dust emission rates for wind speeds greater than 8.23 m/s were calculated using the factors provided in Appendix B.
8.5 Nitrogen Dioxide Modelling
8.5.1 Overview
Most of the NOx emitted by combustion engines are in the form of nitric oxide (NO). This reacts with other gases in the atmosphere to form NO2. Because the fraction of NO2 emitted by vehicles is highly dependent on the configuration of each individual vehicle, emission factors are only available as NOx.
8852R02V02.docx 44
A typical proportion of NO2 in urban airsheds during peak concentration events is 20%. This includes both regional sources and local sources. The contribution from regional sources would have built up over a longer time period i.e. NO emissions would have had substantial time to react to form NO2. In a rural environment, the proportion would be lower.
The rate of conversion from NO to NO2 is related to a large number of factors. The most critical are ozone concentration, hydrocarbon concentration and the amount of sunlight, which increases the rate of the reverse reaction. Both hydrocarbons and ozone can be responsible for oxidising NO to form NO2. Generally, the conditions that favour NO2 formation are when ozone concentrations are high and sunlight low. This scenario could occur in the late afternoons following a clear day. In rural areas, ozone concentrations are low, so NO2 formation is not favoured.
8.5.2 Goldstone Method
An equation for estimating the concentration of NO2 based on NOx concentrations has been derived from monitoring data by M. Goldstone (1988). This is:
[NO2] = 5.27 x ln[NOx] – 3.6 ppb; (r2 = 0.71)
The equation is based on concentrations of NOx reaching 200 ppb. That corresponds to a NO2 concentration of 24 ppb or 12% of NOx. Peak concentrations predicted in this study are of similar magnitude. There is considerable scatter in the data as indicated by the coefficient of determination, r2=0.71. Therefore it is considered appropriate to be conservative and allow for a 15% conversion rate from NOx to NO2.
8.5.3 Janssen Method
The Janssen Method (Middleton et al 2007) is a popular technique for estimating conversion of nitrogen oxides to NO2 downwind of a source. It is based on aircraft-based measurements taken downwind of power stations. A plot of NO2/NOx ratios against distance for different ozone concentrations is provided as Figure 1 in Middleton et al (2007).
8.5.4 TMR Method
TMR (2014) have defined a method for calculating the proportion of NOx that is NO2:
(1) Assume 10% at 20 metres. (2) For freeways, assume it increases linearly to 20% and 30% at 60 metres for morning and evening
peak periods respectively. For other roads assume it increases to 30% and 45% at 60 metres for morning and evening peak periods respectively.
(3) At greater than 60 metres, assume it increases linearly to 100% at 100 metres. ASK considers this method highly conservative but adequate for the purposes of screening.
8.5.5 Ambient Ratio Method 2 (ARM2)
The Ambient Ratio Method 2 (ARM2) uses NO2 and NOx data from ambient monitoring stations. The NO2:NOX ratios are plotted against the corresponding NOX concentrations. The upper bound 98th percentile NO2:NOX ratios are used to generate an equation equating the NO2:NOx ratio to NOx concentration. Although the NO2:NOx ratios derived from known NOx concentrations using this method are conservative, the results are more realistic than the TMR Method and hence, ARM2 was utilised in this assessment.
Brisbane City Council is currently developing a local version of the ARM2 Method using data from South Brisbane station. The following equation was derived (BCC, 2017): = 10.281 × ( [ μ / ]) .
8852R02V02.docx 45
This is intended to be applied to the 99.9th percentile 1-hour average concentration and a 70th percentile background concentration (BCC, 2017). The minimum NO2/NOx is to be the emitted NO2:NOx ratio and maximum is to be 0.9 (BCC, 2017).
8.5.6 Conversion Relevant to this Study
This assessment utilised the ARM2 Method for calculating the NO2 levels at the receptors assuming a minimum of 20% NO2 to NOx emitted.
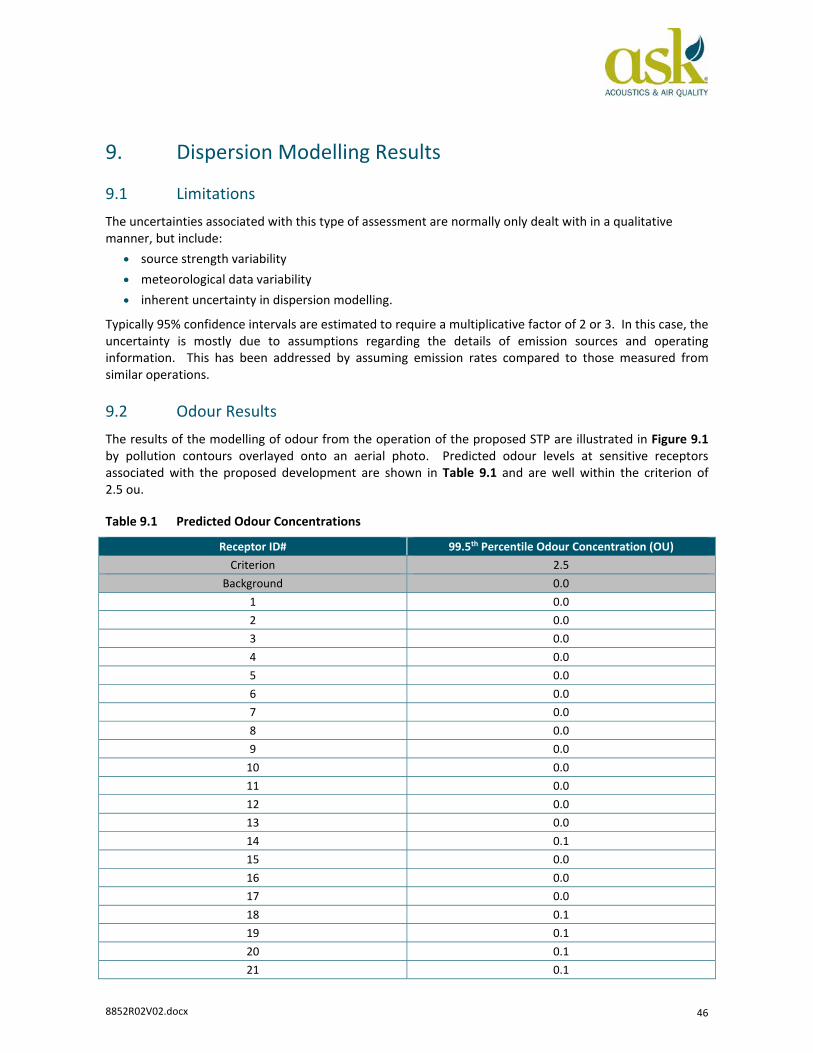
8852R02V02.docx 46
9. Dispersion Modelling Results
9.1 Limitations The uncertainties associated with this type of assessment are normally only dealt with in a qualitative manner, but include:
• source strength variability • meteorological data variability • inherent uncertainty in dispersion modelling.
Typically 95% confidence intervals are estimated to require a multiplicative factor of 2 or 3. In this case, the uncertainty is mostly due to assumptions regarding the details of emission sources and operating information. This has been addressed by assuming emission rates compared to those measured from similar operations.
9.2 Odour Results The results of the modelling of odour from the operation of the proposed STP are illustrated in Figure 9.1 by pollution contours overlayed onto an aerial photo. Predicted odour levels at sensitive receptors associated with the proposed development are shown in Table 9.1 and are well within the criterion of 2.5 ou.
Table 9.1 Predicted Odour Concentrations
Receptor ID# 99.5th Percentile Odour Concentration (OU) Criterion 2.5
Background 0.0 1 0.0 2 0.0 3 0.0 4 0.0 5 0.0 6 0.0 7 0.0 8 0.0 9 0.0
10 0.0 11 0.0 12 0.0 13 0.0 14 0.1 15 0.0 16 0.0 17 0.0 18 0.1 19 0.1 20 0.1 21 0.1

8852R02V02.docx 47
Receptor ID# 99.5th Percentile Odour Concentration (OU) 22 0.2 23 0.1 24 0.1 25 0.1 26 0.0 27 0.0 28 0.0 29 1.0 30 1.3 31 0.3 32 0.1 33 0.1 34 0.1 35 0.7 36 0.1
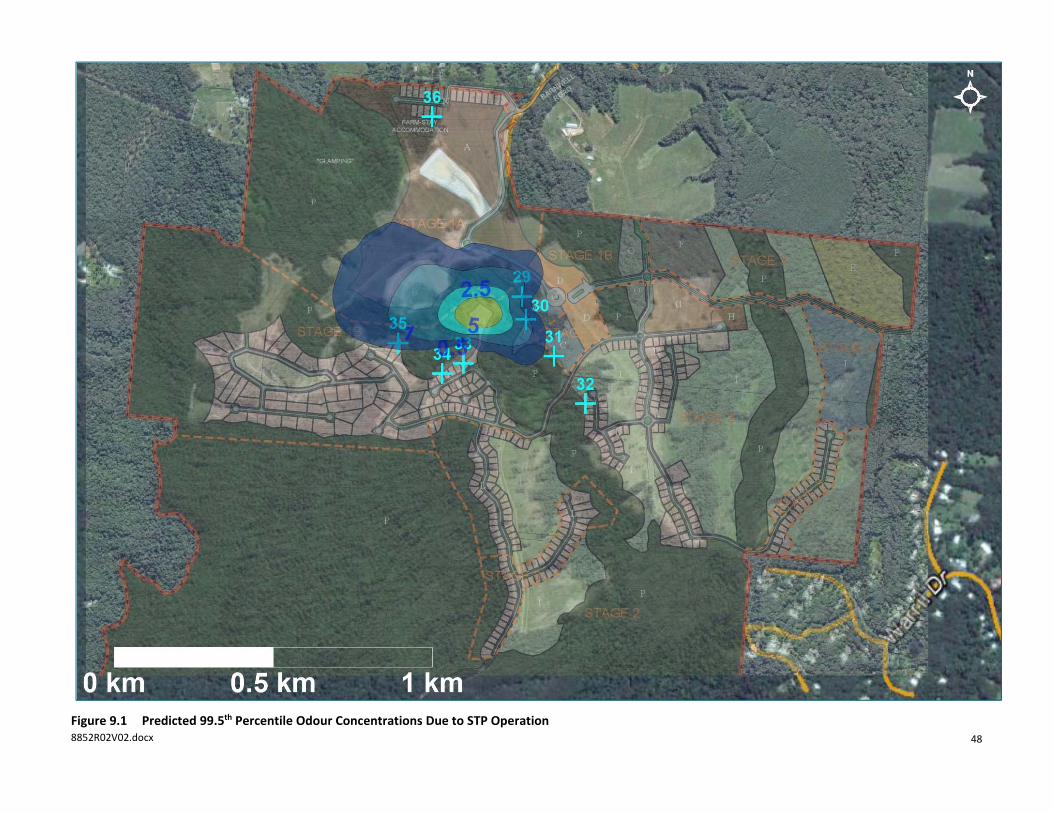
8852R02V02.docx 48Figure 9.1 Predicted 99.5th Percentile Odour Concentrations Due to STP Operation
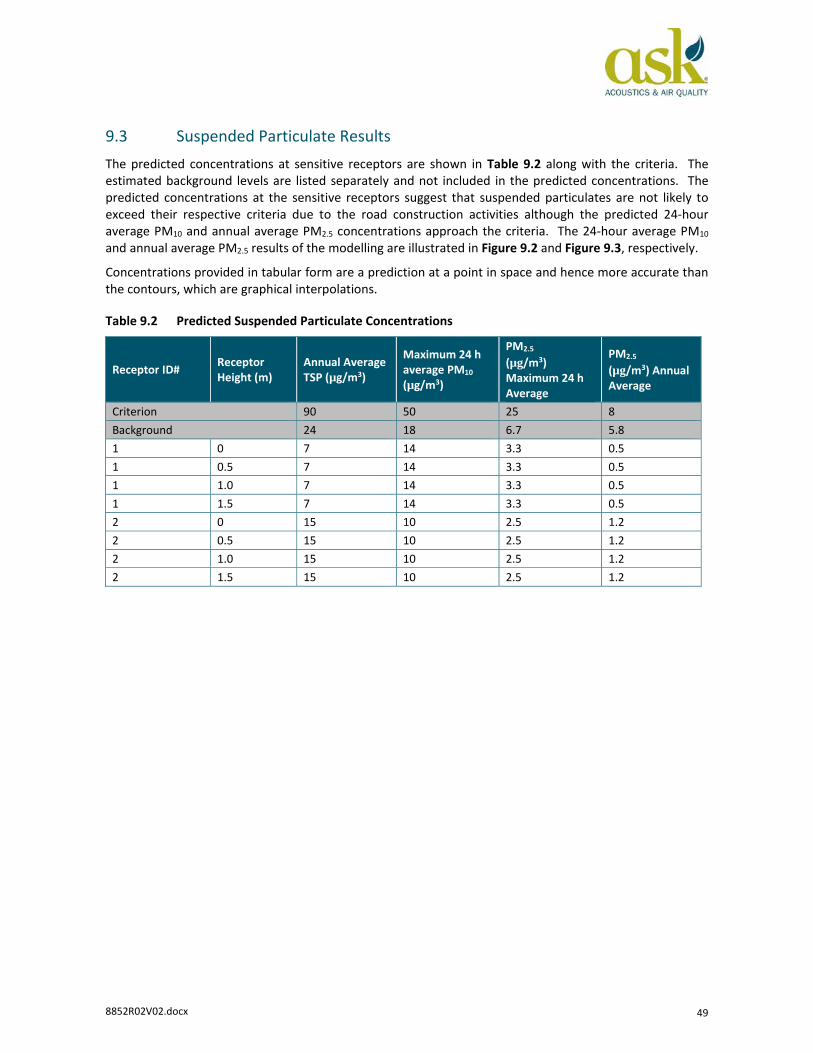
8852R02V02.docx 49
9.3 Suspended Particulate Results The predicted concentrations at sensitive receptors are shown in Table 9.2 along with the criteria. The estimated background levels are listed separately and not included in the predicted concentrations. The predicted concentrations at the sensitive receptors suggest that suspended particulates are not likely to exceed their respective criteria due to the road construction activities although the predicted 24-hour average PM10 and annual average PM2.5 concentrations approach the criteria. The 24-hour average PM10 and annual average PM2.5 results of the modelling are illustrated in Figure 9.2 and Figure 9.3, respectively.
Concentrations provided in tabular form are a prediction at a point in space and hence more accurate than the contours, which are graphical interpolations.
Table 9.2 Predicted Suspended Particulate Concentrations
Receptor ID# Receptor Height (m)
Annual Average TSP (µg/m3)
Maximum 24 h average PM10 (µg/m3)
PM2.5 (µg/m3) Maximum 24 h Average
PM2.5 (µg/m3) Annual Average
Criterion 90 50 25 8 Background 24 18 6.7 5.8 1 0 7 14 3.3 0.5 1 0.5 7 14 3.3 0.5 1 1.0 7 14 3.3 0.5 1 1.5 7 14 3.3 0.5 2 0 15 10 2.5 1.2 2 0.5 15 10 2.5 1.2 2 1.0 15 10 2.5 1.2 2 1.5 15 10 2.5 1.2
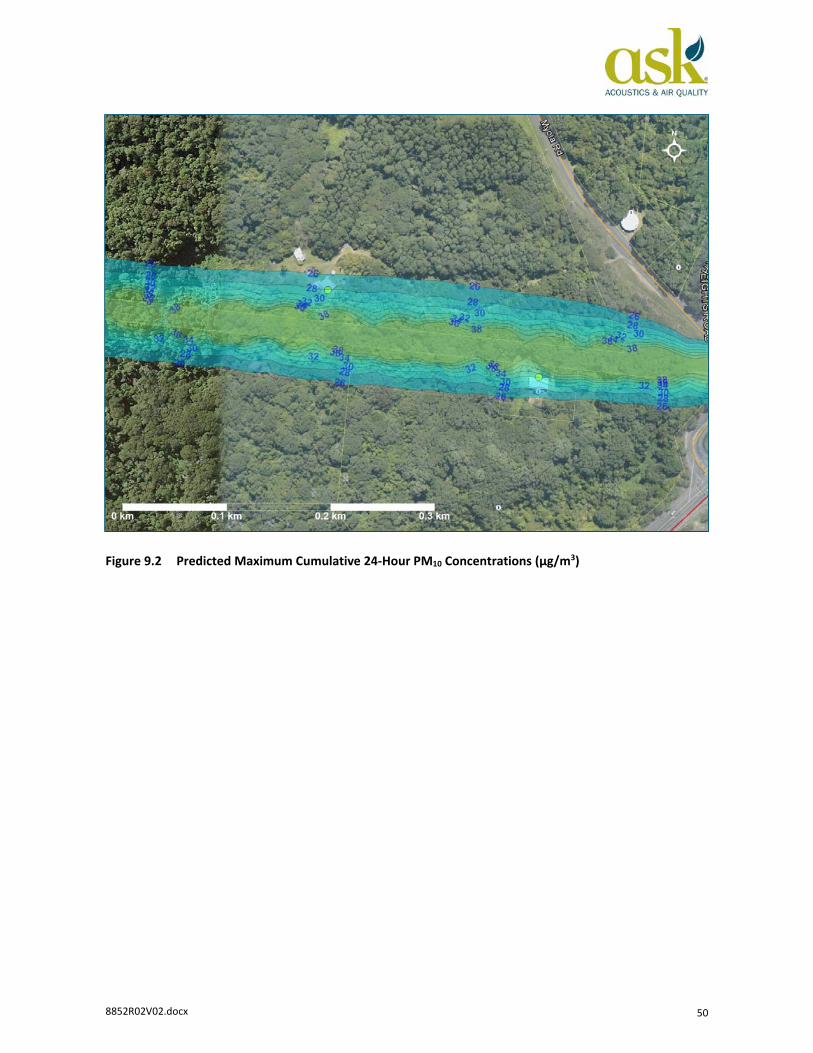
8852R02V02.docx 50
Figure 9.2 Predicted Maximum Cumulative 24-Hour PM10 Concentrations (µg/m3)
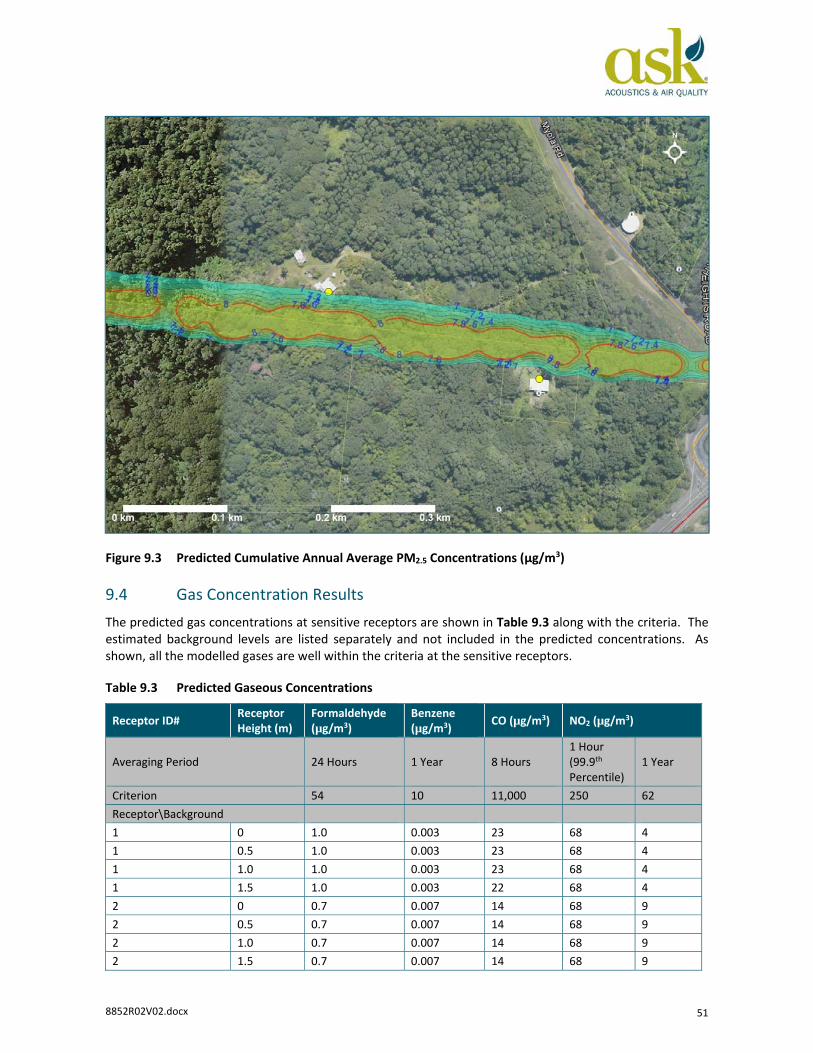
8852R02V02.docx 51
Figure 9.3 Predicted Cumulative Annual Average PM2.5 Concentrations (µg/m3)
9.4 Gas Concentration Results The predicted gas concentrations at sensitive receptors are shown in Table 9.3 along with the criteria. The estimated background levels are listed separately and not included in the predicted concentrations. As shown, all the modelled gases are well within the criteria at the sensitive receptors.
Table 9.3 Predicted Gaseous Concentrations
Receptor ID# Receptor Height (m)
Formaldehyde (µg/m3)
Benzene (µg/m3) CO (µg/m3) NO2 (µg/m3)
Averaging Period 24 Hours 1 Year 8 Hours 1 Hour (99.9th Percentile)
1 Year
Criterion 54 10 11,000 250 62 Receptor\Background 1 0 1.0 0.003 23 68 4 1 0.5 1.0 0.003 23 68 4 1 1.0 1.0 0.003 23 68 4 1 1.5 1.0 0.003 22 68 4 2 0 0.7 0.007 14 68 9 2 0.5 0.7 0.007 14 68 9 2 1.0 0.7 0.007 14 68 9 2 1.5 0.7 0.007 14 68 9
8852R02V02.docx 52
9.5 Dust Deposition Results The results of the dust deposition modelling are illustrated in Figure 9.4. The predicted dust deposition levels at sensitive receptors are shown in Table 9.4 along with the criterion and estimated background levels. The estimated background levels (30 mg/m2/day) are listed separately and not included in the predicted concentrations. The maximum monthly cumulative levels including background at the two receptors are 165 and 208 mg/m2/day, exceeding the criterion of 120 mg/m2/day. Assuming a water application of greater than 2 L/m2/h is applied during road construction, a 75% control efficiency is to be expected and the maximum monthly cumulative levels including background at the two receptors will be 98 and 119 mg/m2/day, just below the criterion of 120 mg/m2/day. The results of the dust deposition modelling with 75% control efficiency are illustrated in Figure 9.5. With proper mitigation measures such as water application of more than 2 L/m2/h and ceasing operations when dust is generated and blown towards the sensitive receptors, the dust deposition criterion can be complied with at the sensitive receptors. It is also important to note that dispersion modelling does not take into account the dense vegetation that will help reduce the dust levels from reaching Receptor 2.
Table 9.4 Predicted Dust Deposition Levels Not Including Background
Receptor ID# Annual Average Dust Deposition (mg/m2/day)
Maximum monthly deposition (mg/m2/day)
Maximum monthly deposition (mg/m2/day) at 75% control efficiency
Averaging Period Annual average 30 days 30 days Criterion 120 120 Receptor\Background 30 30 1 65 135 68 2 148 178 89
8852R02V02.docx 53
Figure 9.4 Predicted Cumulative 30-day Average Dust Deposition Levels (mg/m2/day) – 50% Control Efficiency
8852R02V02.docx 54
Figure 9.5 Predicted Cumulative 30-day Average Dust Deposition Levels (mg/m2/day) – 75% Control Efficiency
8852R02V02.docx 55
10. Discussion
10.1 Summary of Modelling Results The 99.5th percentile odour concentration at the worst-affected receptor due to the operation of the STP is 1.3 ou, well within the criterion of 2.5 ou.
The predicted pollutant levels at the worst-affected receptors due to the primary access road construction activities are summarised in Table 10.1.
Table 10.1 Summary of predicted levels at the worst affected receptor
Pollutant Averaging period
Assumed Background
(µg/m3)
Concentration at worst affected
receptor (µg/m3)
Cumulative concentration at worst affected
receptor (µg/m3)
Criteria (µg/m3)
TSP 1 year 24 15 39 90
PM10 24 hours 14 14 32 50
PM2.5 24 hours 6.7 3.3 10 25
1 year 5.8 1.2 7 8
NO2 1 hour 30 68 98 250
1 year 9 9 18 62
CO 8 hours 2.2 23 25 11,000
Benzene 1 year 5 0.007 5 10
Formaldehyde 24 hours 5 1.0 6 54
Dust deposition (Watering <2 L/m2/h)
Annual average 30 mg/m2/day 178 mg/m2/day 208 mg/m2/day 120 mg/m2/day
Dust deposition (Watering >2 L/m2/h)
Annual average 30 mg/m2/day 89 mg/m2/day 119 mg/m2/day 120 mg/m2/day
10.2 Recommendations
10.2.1 Mitigation Measures
Mitigation measures that are recommended for the project are listed in Table 10.2.
Table 10.2 Mitigation Measures Applicable to the Project
Source Activities Mitigation Measures
Construction Excavation and filling Water with truck-mounted sprays.

8852R02V02.docx 56
Source Activities Mitigation Measures Material handling including loading and unloading of gravel and sand
Water prior to loading, minimise drop height, cease operation or minimise activity during dry, windy conditions
Wheel-generated dust from hauling on unsealed road surfaces
Water with truck-mounted sprays.
Wind erosion from stockpiles and unsealed roads
Water with sprays, create windbreaks using shade cloth on stockpiles or strategically locating stockpiles next to dense trees. Revegetate as soon as practical using hydraulic mulch seeding.
Engine exhaust Regularly maintain equipment. Turn-off engines when not in use.
Monitoring
The construction site manager and relevant sub-contractors should undertake daily visual monitoring to identify if dust or exhaust plumes reach the site boundary, and initiate additional control measures if this occurs.
Sewage Treatment Plant -
Prevent anaerobic conditions other than in the anaerobic and anoxic tanks by ensuring proper aeration and/or minimising detention times of wastewater, minimise storage times of biosolids onsite.
Sewage Reticulation -
Due to the large number of rising mains required, a vacuum system is preferred. Assessment should be undertaken to determine a suitable odour treatment of ventilation point(s), including analysis of detention times. A separation distance of at least 50 metres from vents to the sensitive receptors should be achieved unless: • odour filters are installed and 30 metres separation is provided • site-specific dispersion modelling demonstrates less is acceptable.
Storage and Handling of Biosolids
Handling and storage of biosolids
Locate biosolids storage and handling in an area at least 50 metres away from sensitive receptors.
Composting and application of composts
Composting of green wastes and manure
Ensure aerobic conditions are maintained, using an enclosed composter that has a mechanism to agitate the waste. Locate activity at least 50 metres away from sensitive receptors. Schedule processing and application of composts when wind conditions are favourable (i.e. non-calm conditions and no sensitive receptors downwind)
Irrigation of Recycled Water
Irrigation of treated water to golf course areas
Use high quality recycled water (Class A only) for irrigation, apply appropriate buffer distance recommended in Section 3.3.3 and keep public off irrigated areas until the surface covering is dry.
Power Generator -
Turn off equipment when not needed. Locate vents away from sensitive receptors.
Boilers - Vents should be located on rooftops.
Solid Wastes Disposal and storage of solid wastes
Bins for wastes are to be placed in dispersed locations, bin contents are to be regularly emptied, big bins for storage of wastes prior to removal onsite are to be placed in locations at least 6 metres away from sensitive receptors. Ensure at least weekly removal of wastes onsite.
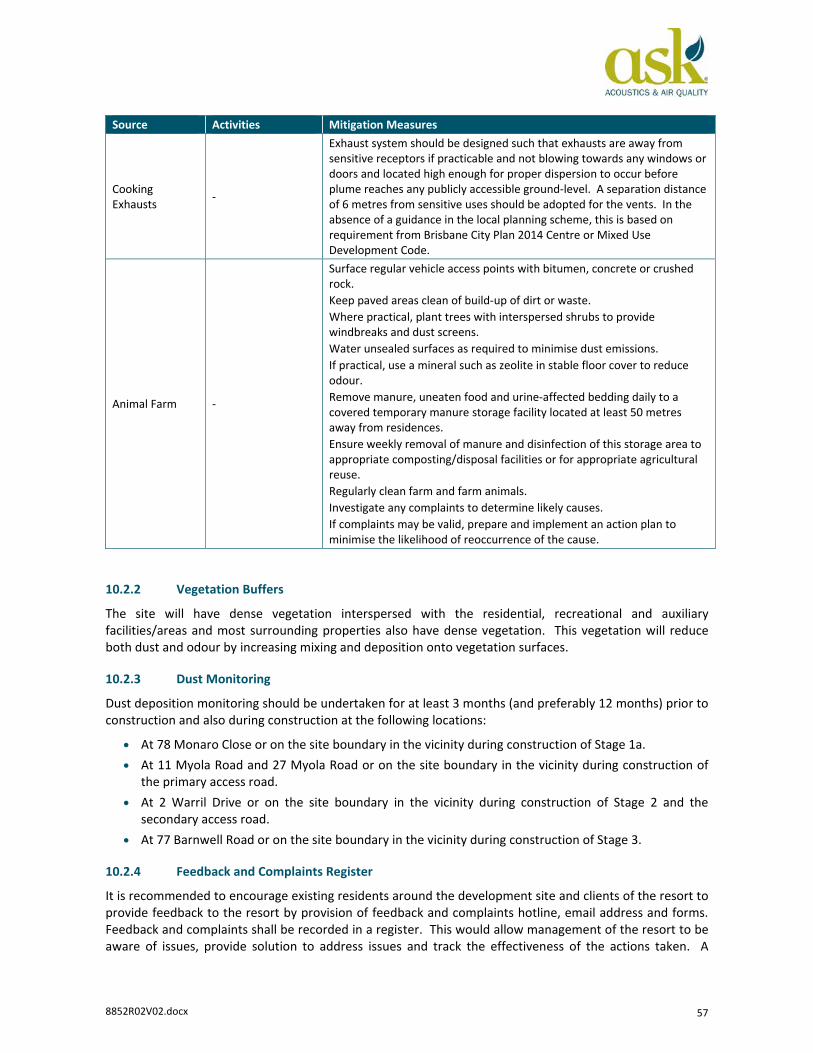
8852R02V02.docx 57
Source Activities Mitigation Measures
Cooking Exhausts -
Exhaust system should be designed such that exhausts are away from sensitive receptors if practicable and not blowing towards any windows or doors and located high enough for proper dispersion to occur before plume reaches any publicly accessible ground-level. A separation distance of 6 metres from sensitive uses should be adopted for the vents. In the absence of a guidance in the local planning scheme, this is based on requirement from Brisbane City Plan 2014 Centre or Mixed Use Development Code.
Animal Farm -
Surface regular vehicle access points with bitumen, concrete or crushed rock. Keep paved areas clean of build-up of dirt or waste. Where practical, plant trees with interspersed shrubs to provide windbreaks and dust screens. Water unsealed surfaces as required to minimise dust emissions. If practical, use a mineral such as zeolite in stable floor cover to reduce odour. Remove manure, uneaten food and urine-affected bedding daily to a covered temporary manure storage facility located at least 50 metres away from residences. Ensure weekly removal of manure and disinfection of this storage area to appropriate composting/disposal facilities or for appropriate agricultural reuse. Regularly clean farm and farm animals. Investigate any complaints to determine likely causes. If complaints may be valid, prepare and implement an action plan to minimise the likelihood of reoccurrence of the cause.
10.2.2 Vegetation Buffers
The site will have dense vegetation interspersed with the residential, recreational and auxiliary facilities/areas and most surrounding properties also have dense vegetation. This vegetation will reduce both dust and odour by increasing mixing and deposition onto vegetation surfaces.
10.2.3 Dust Monitoring
Dust deposition monitoring should be undertaken for at least 3 months (and preferably 12 months) prior to construction and also during construction at the following locations:
• At 78 Monaro Close or on the site boundary in the vicinity during construction of Stage 1a. • At 11 Myola Road and 27 Myola Road or on the site boundary in the vicinity during construction of
the primary access road. • At 2 Warril Drive or on the site boundary in the vicinity during construction of Stage 2 and the
secondary access road. • At 77 Barnwell Road or on the site boundary in the vicinity during construction of Stage 3.
10.2.4 Feedback and Complaints Register
It is recommended to encourage existing residents around the development site and clients of the resort to provide feedback to the resort by provision of feedback and complaints hotline, email address and forms. Feedback and complaints shall be recorded in a register. This would allow management of the resort to be aware of issues, provide solution to address issues and track the effectiveness of the actions taken. A

8852R02V02.docx 58
complaints driven system is a suitable method of monitoring achievement of air quality objectives given the relatively low risk to an odour impact.
10.3 Conclusions • There are no medium-impact sources existing close enough to the development site that are likely to
cause or contribute to unacceptable ambient air quality levels in the vicinity. • Among the air quality impact sources proposed as part of the development and presented in this
assessment, the construction activities and sewage treatment plant have the most potential to impact the sensitive receptors.
• As discussed in Section 4, the on-site construction activities are short-lived and the measures specified in Section 10.2 should be sufficient to manage emissions. Dense trees surrounding the development site would reduce the likely construction impacts that will be experienced at most of the existing sensitive receptors.
• Dispersion modelling has been conducted to predict the likely odour impacts due to the operation of the northern STP. The predicted results are well within the criterion at the existing and future sensitive receptors suggesting that the operation of the northern STP is not likely to cause odour nuisances at these locations.
• Dispersion modelling has also been conducted to predict road construction impacts. The predicted results are well within the criterion apart from the deposited dust levels. It is possible to minimise deposited dust levels by watering using more than 2 L/m2/h and constant visual monitoring to immediately cease operations when substantial dust is generated and being blown towards the receptors.
• Other sources in the proposed development, such as sewage reticulation vents, diesel generators and waste storage are manageable using appropriate separation distances, and control measures.
8852R02V02.docx 59
References Adhikari S (2013) Representative Meteorological Years for Air Dispersion Modelling, report submitted to
Griffith University for degree of Bachelor of Science.
Arup (2017), Water and Wastewater Infrastructure, Basis of Design, Reference number 253251-WAT-Memo 1, technical memorandum from Nathan Lee Long to Mark Lawson, 28 March 2017.
ASK (2017), The Barn Yard Odour Impact Assessment, undertaken for Elbina Pty Ltd.
BCC (2017), Ongoing Development of ARM2 Method for the Brisbane City Council, a series of personal communications between Abbie Brooke, Andrew Martin and Robin Smit.
Consulting Environmental Engineers (2006), Report on Odour Modelling for Revised Pimpama Wastewater Treatment Plant, undertaken for Gold Coast Water.
EHP (2013a), Guideline: Odour Impact Assessment from Developments, Queensland Department of Environment and Heritage Protection.
EHP (2013b), Guideline: Application requirements for activities with impacts to air, Queensland Department of Environment and Heritage Protection.
Environment Australia (2012), National Pollutant Inventory Emission Estimation Technique Manual for Mining Version 3.1.
Goldstone, M. (1998) Narrows Bridge Widening Air Quality Impact Assessment, Report for Main Roads Western Australia.
Mareeba Shire Council (2013), Mareeba Shire Planning Scheme Version 1/2011.
McDonald, A, Cesca, J, Witherspoon, J, Mackenzie, R & Barbu, E (2009), Development of a Wastewater Treatment Plant Odour Emissions Database and its Application for Process Improvements
Middleton D, Luhana L, Sokhi R (2007), Review of methods for NO to NO2 conversion in plumes at short range, United Kingdom Environment Agency Science Report SC030171/SR2, Bristol.
MWH (2009), Googong New Town Water Recycling Plant (Draft) Odour Impact Assessment, undertaken for Canberra Investment Corporation
QLD EPA (2005), Queensland Water Recycling Guidelines, December 2005.
Sinclair Knight Merz (SKM) (2013), Rubyanna WWTP Odour Impact Assessment Study, undertaken for Bundaberg Regional Council
Sinclair Knight Merz (SKM) (2010), Canungra WWTP Odour Study, undertaken for Queensland Urban Utilities

8852R02V02.docx 60
Scire J.S. & Robe F.R. (1997), Fine-Scale Application of the CALMET Meteorological Model to a Complex Terrain Site, Air and Waste Management Association’s 90th Annual Meeting.
Department of State Development (2014), State Planning Policy July 2014, Department of State Development, Infrastructure and Planning.
TRC (2011), Generic Guidance and Optimum Model Settings for the Calpuff Modeling System for Inclusion into the ‘Approved Methods for the Modeling and Assessment of Air Pollutants in NSW, Australia’, prepared for NSW Office of Environment and Heritage.
Victoria (2001), State Environment Protection Policy (Air Quality Management).
8852R02V02.docx 61
Appendix A Glossary Parameter or Term Description
ASK ASK Consulting Engineers Pty Ltd
BoM Bureau of Meteorology
CO Carbon monoxide
DSITI Department of Science, Information Technology and Innovation
EHP Queensland Department of Environment and Heritage Protection
EPA Queensland Environmental Protection Act 1994
EPP (Air) Queensland Environmental Protection (Air) Policy 2008
EP Equivalent persons
L/s Litres per second
MBR Membrane Bioreactor
NOx Oxides of nitrogen including nitric oxide and nitrogen dioxide
OCF Odour control facility
ou Odour Units
SO2 Sulphur dioxide
STP Sewage treatment plant
TAPM The Air Pollution Model developed by CSIRO and used by ASK for meteorological modelling
UTM Universal Transverse Mercator coordinate system

8852R02V02.docx 62
Appendix B Emission Inventory Equations for Particulates Loading Overburden to Trucks by Excavator
Equation 10 of Environment Australia (2012) has been used because it provides a method of varying emission rates with wind speed.
= 0.0016 . ..
where
E = Emission Factor with units kg/t of overburden U = mean wind speed (m/s) M = soil moisture content (%) k = 0.74 for TSP k = 0.35 for PM10
Bulldozing Overburden
Equations 16 and 17 of Environment Australia (2012) have been used. = 2.6 × ( ) .( ) . = 0.34 × ( ) .( ) . where
E = Emission factor with units kg/h/vehicle s = Material silt content (%) M = Soil moisture content (%)
Wheel Dust Generation from Light Vehicles on Unpaved Roads
From Section A1.1.11 of Environment Australia (2012):
= × ×. − 0.0013
Where: E = Emission factor k = Constant (1.69 for TSP, and 0.51 for PM10) B = 0.6 for TSP and 0.5 for PM10
C = 0.3 for TSP and 0.2 for PM10 s = Material silt content (%) S = vehicle speed (km/h) M = Moisture content (%)
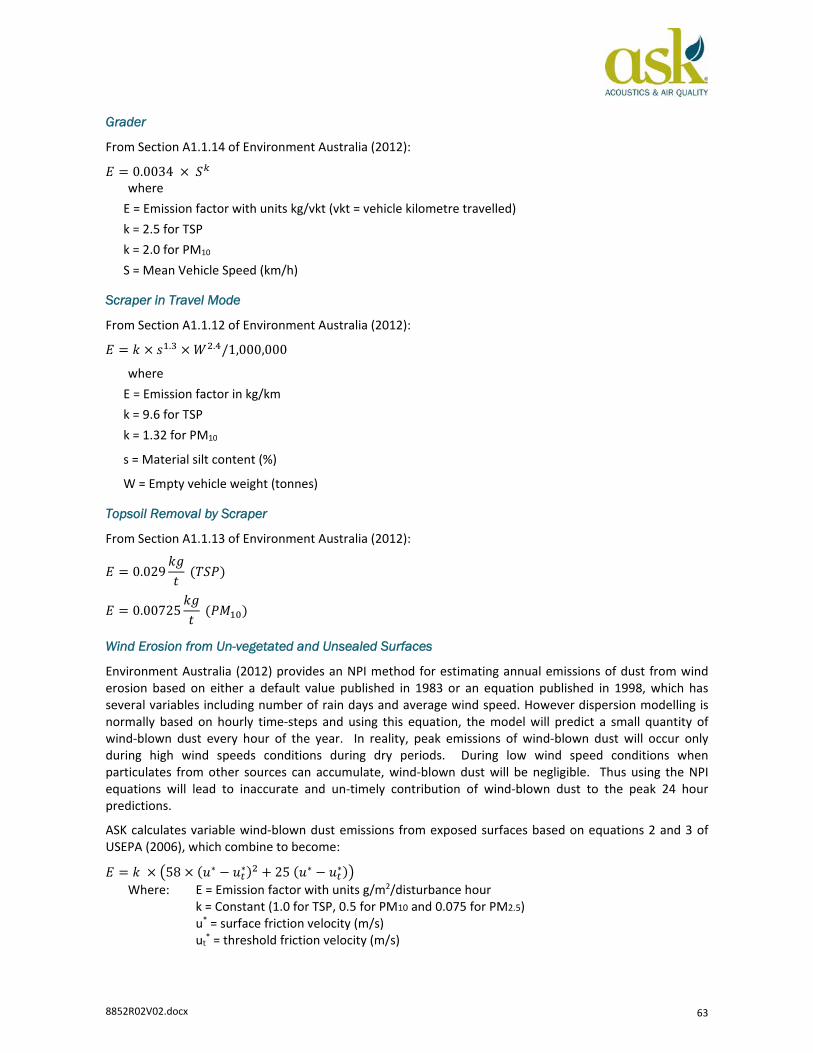
8852R02V02.docx 63
Grader
From Section A1.1.14 of Environment Australia (2012): = 0.0034 × where
E = Emission factor with units kg/vkt (vkt = vehicle kilometre travelled) k = 2.5 for TSP k = 2.0 for PM10 S = Mean Vehicle Speed (km/h)
Scraper in Travel Mode
From Section A1.1.12 of Environment Australia (2012): = × . × . /1,000,000
where E = Emission factor in kg/km k = 9.6 for TSP k = 1.32 for PM10
s = Material silt content (%)
W = Empty vehicle weight (tonnes)
Topsoil Removal by Scraper
From Section A1.1.13 of Environment Australia (2012): = 0.029 ( ) = 0.00725 ( )
Wind Erosion from Un-vegetated and Unsealed Surfaces
Environment Australia (2012) provides an NPI method for estimating annual emissions of dust from wind erosion based on either a default value published in 1983 or an equation published in 1998, which has several variables including number of rain days and average wind speed. However dispersion modelling is normally based on hourly time-steps and using this equation, the model will predict a small quantity of wind-blown dust every hour of the year. In reality, peak emissions of wind-blown dust will occur only during high wind speeds conditions during dry periods. During low wind speed conditions when particulates from other sources can accumulate, wind-blown dust will be negligible. Thus using the NPI equations will lead to inaccurate and un-timely contribution of wind-blown dust to the peak 24 hour predictions.
ASK calculates variable wind-blown dust emissions from exposed surfaces based on equations 2 and 3 of USEPA (2006), which combine to become: = × 58 × ( ∗ − ∗) 25( ∗ − ∗)
Where: E = Emission factor with units g/m2/disturbance hour k = Constant (1.0 for TSP, 0.5 for PM10 and 0.075 for PM2.5) u* = surface friction velocity (m/s) ut
* = threshold friction velocity (m/s)
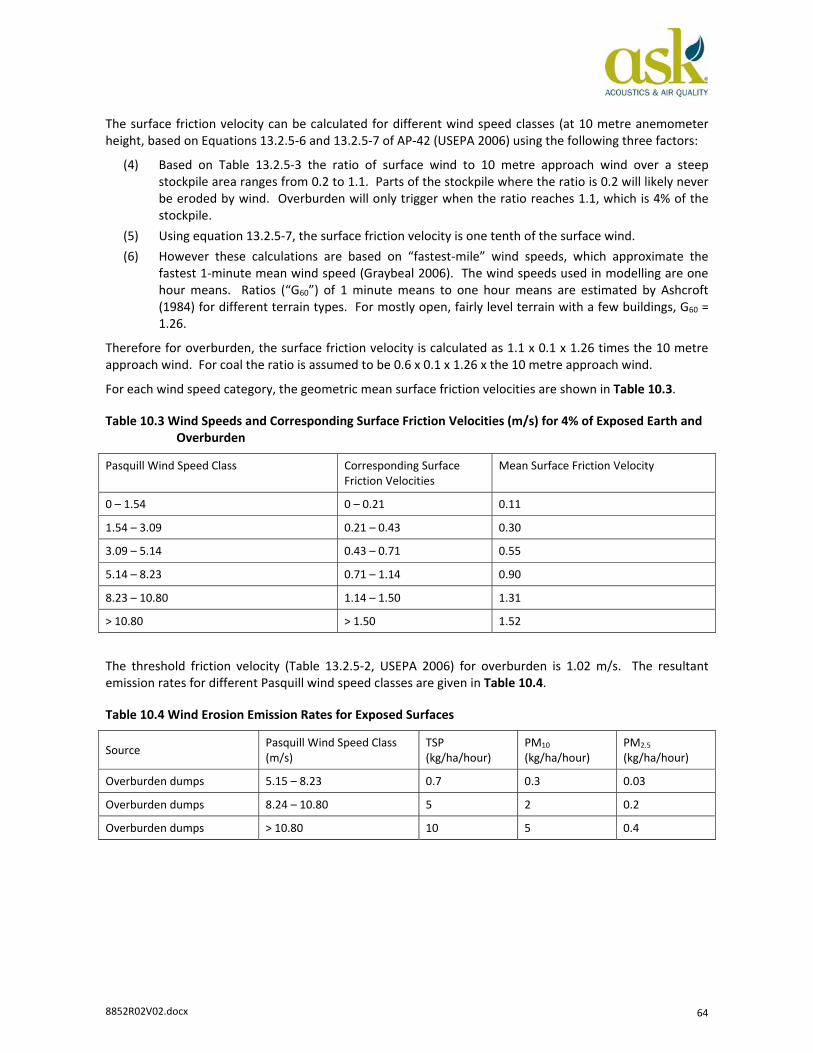
8852R02V02.docx 64
The surface friction velocity can be calculated for different wind speed classes (at 10 metre anemometer height, based on Equations 13.2.5-6 and 13.2.5-7 of AP-42 (USEPA 2006) using the following three factors:
(4) Based on Table 13.2.5-3 the ratio of surface wind to 10 metre approach wind over a steep stockpile area ranges from 0.2 to 1.1. Parts of the stockpile where the ratio is 0.2 will likely never be eroded by wind. Overburden will only trigger when the ratio reaches 1.1, which is 4% of the stockpile.
(5) Using equation 13.2.5-7, the surface friction velocity is one tenth of the surface wind. (6) However these calculations are based on “fastest-mile” wind speeds, which approximate the
fastest 1-minute mean wind speed (Graybeal 2006). The wind speeds used in modelling are one hour means. Ratios (“G60”) of 1 minute means to one hour means are estimated by Ashcroft (1984) for different terrain types. For mostly open, fairly level terrain with a few buildings, G60 = 1.26.
Therefore for overburden, the surface friction velocity is calculated as 1.1 x 0.1 x 1.26 times the 10 metre approach wind. For coal the ratio is assumed to be 0.6 x 0.1 x 1.26 x the 10 metre approach wind.
For each wind speed category, the geometric mean surface friction velocities are shown in Table 10.3.
Table 10.3 Wind Speeds and Corresponding Surface Friction Velocities (m/s) for 4% of Exposed Earth and Overburden
Pasquill Wind Speed Class Corresponding Surface Friction Velocities
Mean Surface Friction Velocity
0 – 1.54 0 – 0.21 0.11
1.54 – 3.09 0.21 – 0.43 0.30
3.09 – 5.14 0.43 – 0.71 0.55
5.14 – 8.23 0.71 – 1.14 0.90
8.23 – 10.80 1.14 – 1.50 1.31
> 10.80 > 1.50 1.52
The threshold friction velocity (Table 13.2.5-2, USEPA 2006) for overburden is 1.02 m/s. The resultant emission rates for different Pasquill wind speed classes are given in Table 10.4.
Table 10.4 Wind Erosion Emission Rates for Exposed Surfaces
Source Pasquill Wind Speed Class (m/s)
TSP (kg/ha/hour)
PM10 (kg/ha/hour)
PM2.5 (kg/ha/hour)
Overburden dumps 5.15 – 8.23 0.7 0.3 0.03
Overburden dumps 8.24 – 10.80 5 2 0.2
Overburden dumps > 10.80 10 5 0.4