Embed Size (px)
Citation preview

Appendices
Page
Appendix 1:
Companies that constitute the Pharmaceutical Task Group plus Roche 2-3
Appendix 2:
What price for a year of life-Stockholm Network 4-39
Appendix 3:
Methodology 40
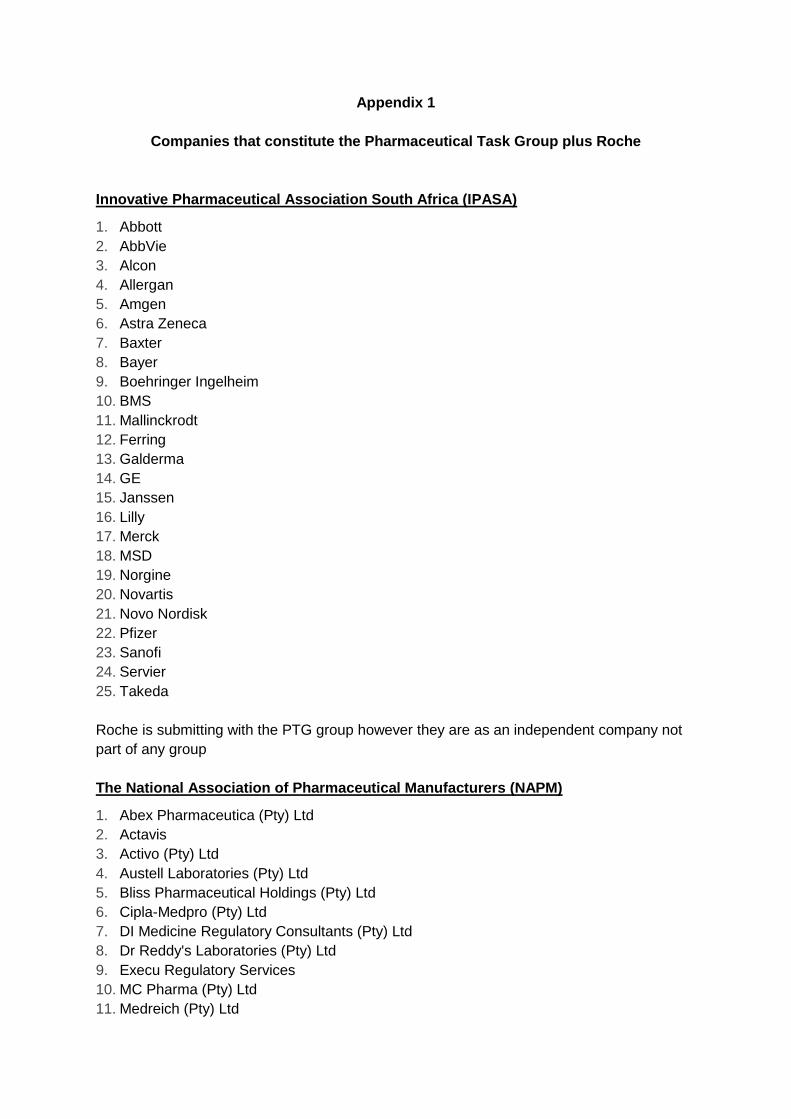
Appendix 1
Companies that constitute the Pharmaceutical Task Group plus Roche
Innovative Pharmaceutical Association South Africa (IPASA)
1. Abbott
2. AbbVie
3. Alcon
4. Allergan
5. Amgen
6. Astra Zeneca
7. Baxter
8. Bayer
9. Boehringer Ingelheim
10. BMS
11. Mallinckrodt
12. Ferring
13. Galderma
14. GE
15. Janssen
16. Lilly
17. Merck
18. MSD
19. Norgine
20. Novartis
21. Novo Nordisk
22. Pfizer
23. Sanofi
24. Servier
25. Takeda
Roche is submitting with the PTG group however they are as an independent company not
part of any group
The National Association of Pharmaceutical Manufacturers (NAPM)
1. Abex Pharmaceutica (Pty) Ltd
2. Actavis
3. Activo (Pty) Ltd
4. Austell Laboratories (Pty) Ltd
5. Bliss Pharmaceutical Holdings (Pty) Ltd
6. Cipla-Medpro (Pty) Ltd
7. DI Medicine Regulatory Consultants (Pty) Ltd
8. Dr Reddy's Laboratories (Pty) Ltd
9. Execu Regulatory Services
10. MC Pharma (Pty) Ltd
11. Medreich (Pty) Ltd

12. Metonoia Pharma Consulting
13. Moteli Consultants
14. Mylan SA (Pty) Ltd
15. MRA Regulatory Consultants
16. Pharma Dynamics (Pty) Ltd
17. Prima Pharma
18. Ranbaxy SA (Pty) Ltd
19. Teva Pharmaceuticals
20. Zydus Healthcare SA (Pty) Ltd
Pharmaceuticals Manufactured in South Africa (PHARMISA)
1. Adcock Ingram
2. Aspen Pharmacare
3. ATKA Pharma
4. Fresenius-Kabi
5. Litha Healthcare
6. National Bioproducts Institute
7. Specpharm
8. Sandoz
The Self-Medication Manufacturers Association of South Africa (SMASA)
1. Adcock Ingram Healthcare (Pty) Ltd
2. Aspen Pharmacare Ltd
3. Bayer Consumer Care (Pty) Ltd
4. Boehringer-Ingelheim South Africa (Pty) Ltd
5. FDC SA (Pty) Ltd
6. GlaxoSmithKline SA (Pty) Ltd
7. iNova Pharmaceuticals (Pty) Ltd
8. Johnson & Johnson (Pty) Ltd
9. Merck (Pty) Ltd
10. MSD (Pty) Ltd
11. Norgine (Pty) Ltd
12. Novartis South Africa (Pty) Ltd
13. Takeda (Pty) Ltd
14. Pfizer Laboratories (Pty) Ltd
15. Reckitt Benckiser (Pty) Ltd
16. Sandoz SA (Pty) Ltd
17. Smith & Nephew (Pty) Ltd
18. Vital Health Foods (Pty) Ltd
Associate Members:
19. Dischem Pharmacies
20. MassMart Holdings
21. MediRite Pharmacies SA (Shoprite Checkers)
22. Clicks Holdings (Pty) Ltd
23. Imperial Health Sciences
24. X-Procure Software SA (Pty) Ltd

Appendix 2
What price for a year of life-Stockholm Network

1
A HEALTHY MARKET?
What Price for a Year of Life?
The Threshold Discussion in Health
Technology Assessment

2
What Price for a Year of Life?
The Threshold Discussion in Health
Technology Assessment
Prepared by the Stockholm Network Research Team For additional information or comments please contact Paul Healy, Policy Analyst at the Stockholm Network ([email protected]) or Dr. Meir Pugatch, Director of Research at the Stockholm Network ([email protected]). Acknowledgments to Kristian Niemietz for his assistance in the preparation and authoring of this paper while he was a Research Officer for Health and Welfare at the Stockholm Network. © Stockholm Network 2008. The views expressed in this publication are those of the authors and do not necessarily represent the corporate view of the Stockholm Network or those of its member think tanks.

3
Executive Summary
Governments all over the world have tried to prioritise spending of taxpayers’ money on healthcare in a
variety of ways. The latest of these methods – and one which is on the rise – is known as Health
Technology Assessment (HTA). All health systems engage in rationing but when health care
expenditure decisions are based on HTA it becomes crucially important to understand how this process
works, not least for to patients trying to find out what kind of access they can get to the latest
medicines and treatment.
Specifically the question of spending limits (so-called ‘thresholds’) becomes significant. From the point of
view of governments, the aim of HTA is to provide decision-makers with more accurate, evidence-based
tools for prioritising healthcare treatments in terms of their utility, efficiency and cost-effectiveness.
HTA institutions are charged, in other words, with checking which types of spending deliver ‘value for
money’ to the public. In practice, however, it is not at all clear to what extent national HTA bodies -
such as the National Institute for Health and Clinical Excellence (NICE) in the UK or the Institute for
Quality and Efficiency in Health Care (IQWiG) in Germany - are able to state clearly what ‘value for
money’ actually means. Typically, HTA institutions measure the ‘benefits’ of a treatment as the period by
which a patient's life is extended and improved. But once this figure is known, up to what cost per year,
month or day should a treatment be considered ‘cost-effective’? Is there a monetary ‘threshold’ above
which a new medicine should not be reimbursed (or, in other words, should be denied) in a given
country?
These questions are far from being simple and straightforward. In fact they represent the significant
complexities and built-in conflicts associated with the HTA process, not least in the context of
determining the economic ‘threshold’ of a given medicine.
Moreover, due to the moral sensitivity of this topic – effectively announcing what a life is worth - no
country in the world actually publishes an official threshold value above which it declares a medicine to
be ‘unworthy’ of public reimbursement. To date, only NICE has published what could be considered an
approximate threshold.
Consequently, this paper concludes that HTA institutions have so far failed to live up to expectations of
a scientific, fact-based alternative to politically determined rationing of health care spending. Instead, it
seems that decision making has passed from one arbitrary body to another. No HTA institution in the

4
world defines clearly what it means by ‘cost-effectiveness’, nor do they explain how they trade off cost-
effectiveness against other variables. The UK model of HTA may currently be the most transparent one,
but even this model suffers from such ambiguity that to call it a ‘best-practice model’ would be
inappropriate.
The reasoning behind HTA failures remains a matter of speculation. Current rulings do not oblige HTA
institutions like NICE to exercise more than a minimum degree of consistency and transparency.
The criticisms that are highlighted in this report refer to the current implementation of cost-
effectiveness thresholds. Nevertheless the paper argues that, within the framework of government-
funded health systems which ultimately focus on cost-containment, thresholds may still provide an
improvement over purely politically determined cut-off points. By using thresholds more explicitly, HTA
decisions may become more transparent and open for all interested parties who wish to monitor the
process, to understand it better and to either support or challenge it. This would at least bring clarity
and predictability for all those involved.
But to achieve this end, current practices would have to be substantially changed:
• Thresholds would need to be made more explicit and transparent, thus preventing the HTA
institution or other political bodies from making decisions that are based on discretion and/or
facing the criticisms that may be directed at these decisions.
• There would need to be greater transparency in decisions that ‘trade’ cost-effectiveness with
other technically important variables, such as the quality of evidence or the expected cost-utility
of new medicines over the longer term.
• HTA-related threshold figures should be much more aligned with government healthcare
spending budgets as a whole, and specifically be adjusted to reflect the increase in healthcare
expenditure over time, rather than being perceived as a constant, one-time, calculation.
Finally and most importantly, the paper notes that, even if it were to be greatly improved, the threshold
concept would still reflect a very static and inflexible way of calculating the value of a given medicine to
the public. This principle is arguably based on the model of ‘one size fits all’, in which the decision about
the value of a medicine is based on a collective logic decided by the HTA body without taking into
consideration the individual preferences and choices of patients and the public. Yet this does not
necessarily have to be the case. By shifting to a model which is based on greater collaboration and

5
partnerships between the public and the private sectors (such as by working with private healthcare
providers and insurers), and by allowing consumers a greater degree of choice and say in the HTA
prioritisation process (such as via the use of ‘top-ups’) the threshold concept, and indeed the HTA
model as a whole, could become more flexible and ultimately more suited to the individual preferences
and choices of the public.

6
Contents
Executive summary p.3
Introduction p.7
Is health ‘priceless’? p.9
Evidence-based versus ‘politics-based’ medicine p.10
The Mathematic or Mechanistic model (More for Less) p.13
Equal Distribution (Less for More) p.14
Interest-Group Driven Policy (Rent Seeking) p.15
From league tables to thresholds p.17
What price for a year of life? - The theory p.18
The Medicare Standard p.18
The Expert Standard p.19
The Non-Medical Sector Standard p.19
What price for a year of life? - The practice p.21
UK p.21
Australia p.24
New Zealand and others p.26
Is the threshold a measure of ‘generosity’? p.27
Conclusion p.31
Policy Recommendations p.32
References p.34
7
Introduction
“There is no known piece of work which tells you what the threshold should be.” Michael Rawlins, Chairman of NICE [Select Committee on Health First Report, December 2007]
What is the value of an extra year of life? Which price is acceptable, and how much is ‘too much’?
Attaching a monetary value on a year of life may appear cynical and inhuman. Yet every healthcare
system in the world answers this question in one way or another - even if its decision-makers and
stakeholders would strongly deny it, and may indeed be unaware of it.
When healthcare spending decisions are based on Health Technology Assessment (HTA), the question
of spending limits becomes significant. As discussed in our previous papers in this series, the aim of HTA
from the point of view of governments is to provide decision-makers with more accurate, evidence-
based tools for prioritising healthcare treatments in terms of their utility, efficiency and cost-
effectiveness. HTA institutions are charged, in other words, with checking which types of spending
deliver ‘value for money’ to the public. But such an exercise is entirely pointless if it is never specified
what ‘value for money’ means. HTA institutions typically measure the ‘benefits’ of a treatment as the
period by which the treatment extends the life of a beneficiary (roughly speaking). But once this figure is
known - up to which cost per year (month, day) of life saved should a treatment be considered as ‘cost-
effective’? What is ‘value for money’? £10,000 per year? £50,000? £100,000? There is no obvious answer
– and some groups in society may think it immoral even to ask the question.
However, if an HTA body does not specify a numerical threshold, it does not mean that it does not use
one. It means that it either decides on a case-by-case basis, or that it establishes an invisible threshold.
The case-based approach carries the risk of unsystematic or arbitrary decisions; moreover, it raises the
question of why systematic evaluation of treatments is performed at all if the resulting data are later
used at random. The approach of the ‘invisible’ or ‘hidden’ threshold means that criteria for decisions
concerning life and death are established behind closed doors. In the real world, the most common
solutions will be intermediate cases, meaning the HTA body does not use an exact threshold but a
guiding value. Decisions will fluctuate around it with greater or smaller deviations.
The current international trend towards HTA-based decision-making may make the question of the
maximum value of a year of life unavoidable in the near future. The Stockholm Network’s series of

8
papers on this issue has documented the rise and spread of HTA. In the first paper, Pugatch and Ficai
(2007) prepared the ground with a general description of HTA and why it has become more
widespread. In the second paper, Pugatch and Davison (2007) looked at cross-country differences in the
importance and scope of HTA, and related these to characteristics of health care systems. Building on
this, Niemietz and Pugatch (2007) compared the main actors of HTA in two representative countries, a
leader in HTA (the UK) and a follower (Germany). This paper adds an additional layer by providing a
normative statement on the strengths and weaknesses of HTA, and by giving policy recommendations.
The paper suggests that the HTA system is far from being a purely scientific mechanism and that HTA
systems and/or decisions that are taking place within the HTA framework can be politically abused, both
for simple cost-cutting reasons and because of the desire to avoid more challenging and profound
healthcare reforms.
However the authors also argue that this is not the essence of the HTA process and that HTA is not
necessarily a mechanism for cutting a healthcare budget, rather of ensuring that a given budget is used in
the best possible way. Whether the budget is big or small, at least in theory HTA aims to ensure that
every penny is spent where it is most urgently needed, which means, where it can achieve the most.
In this context we can identify the crucial variable that determines whether HTA bodies effectively act
as rationing agencies or as drivers of medical innovation – the cost threshold. It is the maximum cost
accepted per life year saved, the cut-off point above which treatments are no longer recommended,
which determines the character of HTA decisions. Yet due to the moral sensitivity of this topic –
effectively announcing what a life is worth – and even though some countries use HTA findings
frequently and openly, no country in the world actually publishes an official threshold value above which
it declares medicine to be ‘unworthy’ of public reimbursement. The UK, by publishing what can be called
the next best thing to a cost threshold, is a unique exception.
Therefore, the threshold discussion is preliminary at this stage. But as the role of HTA is growing in
importance, it is likely that the threshold discussion will become more explicit and relevant. This paper
ties in directly where the last one ended, and takes a look at this sensitive and highly emotional issue.

9
Is health ‘priceless’?
To begin tackling this question, there needs to be an appreciation that each healthcare treatment
provides both a benefit and a cost. In an ideal situation one could argue that treatments should be
provided without cost considerations, and that governments ought to fund any intervention that is
‘medically necessary’. However, the problem with this view is that there does not appear to be a clear
dividing line between ‘necessary’ and ‘unnecessary’ treatments. Moreover, healthcare decisions are not
simply about a ‘yes’ or a ‘no’. Even when unanimous consensus is reached that a certain treatment is
highly beneficial and should be provided, do the crucial questions only begin to arise. To whom should it
be provided? Only to high-risk groups or as a routine treatment? With what intensity and/or frequency
should it be available? If a major medical device is needed, how many exemplars of it should be available
per 1,000 citizens? How often should it be maintained? How often should it be replaced by an improved
follow-up product? Even in the most advanced healthcare system, these variables could always be further
improved, and improvements can always deliver some additional health benefits. These additional
benefits can ultimately be viewed in terms of additional years of life (or improved quality of life). The life-
extending effect may often amount only to a few weeks, and it will seldom be observed in one concrete
individual but rather in a slightly higher statistical survival probability. But nevertheless, even the impact
of incremental improvements in a treatment can, in the end, be expressed in terms of the duration of a
longer life and/or improved quality of life.
With this in mind, we note that health systems in different countries regularly identify cost pressures
that render them unable to fund every possible treatment. Some observers have claimed that these cost
pressures derive from problems relating to the revenue a health system receives from the national
treasury. This is because any demand for additional funding needs to be financed through tax increases.
Others believe that it is excessive demand that leads to rationing and that this demand is fuelled by the
fact that health systems are government-run, and where services are often perceived as ‘free’. This
argument likens government-run health systems to a supermarket where people pay a fixed sum upon
arrival, and can then pick any goods they like. In such a supermarket, it is argued that clients would pick
as many goods as they could carry, and always go for the highest quality. Bit by bit, the operators of the
supermarket would silently stash away the more expensive products from their shelves. However, the
‘free at the point of use’ character of health services is not an exclusive phenomenon of government
provision, so to some degree, the ‘supermarket’ analogy would still be present in a free market system.1
1 There would, of course, be a huge difference in degree. Under full freedom of contract, insurance companies
could experiment with various mechanisms to incentivise clients and providers to economise.

10
Private insurance companies, too, face the need to prioritise and limit their reimbursement catalogues in
some way, as is the case for private hospitals that face a multitude of investment possibilities of which
they could only select a few. It is true that HTA is mostly used by governments, but that is simply
because Western healthcare systems are mainly, sometimes entirely, state-funded.
Even without any waste or fraud, we could easily imagine a society spending 30%, 40%, 50% or more of
its economic output on health care. But the question is whether there is a point beyond which the
benefits from spending money on health are lower than the benefits from spending it on something else.
One could imagine a society spending large sums of money on treatments with very small benefits,
whilst experiencing a lack of resources in other potentially life-saving areas such as road safety, internal
security or safety standards in building projects.
Health care spending, thus, competes for limited funds like any other type of spending. From the
perspective of public spending and financing, there is a need for a more systematic and objective
mechanism to help decision-makers determine which treatments should be funded by the state and at
what cost. But the real challenge here is not the question of whether it is socially and economically
desirable to have an HTA system but how to ensure that such a system does not end up being used (and
possibly abused) in a manner that contradicts its underlying objectives.
Evidence-based versus ‘politics-based’ medicine
The key operation in HTA is the cost-effectiveness analysis, a technique of comparing health benefits
with the costs associated for a particular treatment. Before it can be performed, the abstract and multi-
layered concept of ‘health benefits’ must somehow be quantified.2 This takes place in two steps:
1. Clinical trial data are used to estimate the additional life span a treatment enables a patient to
live. This is expressed in years.
2. Patient survey data are used to estimate the quality of life in these years. It is expressed as a
number between 0 and 1, where 1 stands for a condition of full health, and 0 for the worst
imaginable health status – death.3
2 The measurement of costs is simpler, even though it has its own complexities. If a treatment takes place over
several years, it is not obvious which discount rate should be used. Neither is there a consensus about how to
treat indirect costs, such as the productivity loss through limited ability to work, or the costs of care to family
members if a patient is no longer able to support himself.

11
When these two figures are multiplied, we end up with an index, which contains both length and quality
of life – the Quality Adjusted Life Year (QALY). The QALY indicates how one can statistically ‘trade-off’
length and quality of life against one another. For example, 4 years lived in a health status of 1 (full
health), 5 years lived in a health status of 0.8 (fairly good health) and 20 years lived in a health status of
0.2 (very poor health) are worth the same to the surveyed patients – 4*1 = 5*0.8 = 20*0.2 = 4 QALYs.
The use of QALYs requires a large amount of data, which is often not available. In practice, HTA
institutions often fall back on the less demanding figure of unadjusted life years gained. Alternatively,
international organisations such as the World Bank or the World Health Organisation sometimes
express health outcomes in Disability Adjusted Life Years (DALYs). DALYs follow a similar logic as QALYs
insofar as they adjust the number of life years gained by the health related quality of life, the difference
being that they use fixed weights set by health experts for several morbidity types. This paper will largely
talk about the use of QALYs but the findings could also refer to other outcome measures.
A cost-effectiveness analysis links the QALYs achieved with the money spent on a particular treatment,
by deriving the so-called ‘cost-per-QALY ratio’. Hence, a treatment costing 100 gold coins and saving 5
QALYs, a treatment costing 60 gold coins and saving 3 QALYs, and a treatment costing 20 gold coins
and saving 1 QALY would all be equally cost-effective – their cost-per-QALY ratio is 100/5 = 60/3 =
20/1 = 20 gold coins per QALY.
When cost-per-QALY ratios are known for most available or potentially available treatments,
treatments can then be ranked by their cost-effectiveness. Such ranking lists, called ‘league tables’, are
sometimes available in medical journals. League tables are topped with treatments that can save many
life years with relatively few resources. These include, for example, a GP’s advice to a patient to give up
smoking, or neurosurgical interventions after an accident. Both types of treatments deliver a very low
cost-per-QALY ratio, though for different reasons. Recommendations concerning a healthy lifestyle may
not often be adhered to, but the price of providing them is negligible. Emergency interventions, in turn,
may be very expensive. But if they permit a 30-year-old (who would otherwise not survive) to live until,
say, the age of 75, then dividing the cost by the number of life years saved shows that these
interventions are extremely cost-effective. Descending the league table, one finds treatments with an
ever-higher cost per QALY ratio. The treatments at the bottom are either very costly, or deemed
ineffective, or both. But the table could, in theory, be extended indefinitely.
3 This is not entirely accurate as health statuses so bad that the patient may prefer to be dead are imaginable, and
negative values for the quality of life are indeed sometimes used in health economics.

12
In this context, HTA is nothing other than a healthcare policy that consciously makes use of cost-per-
QALY figures, and prefers treatments that rank further up on a league table over ones that rank further
down. Using a hypothetical league table (table 1, p.13), we can imagine a health policy based entirely on
HTA, which will help us illustrate its rationale. Let us assume that the league table is based on a
hypothetical country in which nine treatments are potentially available (column 1). The cost-per-QALY
ratio is precisely known for each treatment (column 2). Overall, the table ranks all treatments by their
cost per QALY, in an ascending order. Each treatment corresponds to a specific illness and, for the sake
of simplicity, it will be assumed that each illness has one million potential sufferers, who could each
benefit from an additional unit of QALY (i.e. QALY of 1) when undergoing the treatment. Consequently,
each treatment, if applied to all potential patients, could save a maximum of one million QALYs (column
3). Column 4 shows the total cost of each treatment when applied to all potential patients. If all
treatments were offered to all patients, the total costs would be 11,250 million gold coins. Let us also
assume that since this country faces budgetary constraints, only a fixed sum of 3,750 million gold coins is
available for healthcare treatments, a third of what would ideally be needed. The crucial question for any
type of healthcare policy now becomes how to make best use of this limited budget? How should
priorities be set?

13
Table 1: League table for a hypothetical healthcare system
Column 1 Column 2 Column 3 Column 4 Column 5 Column 6
Treatments Cost per QALY (in gold coins)
Maximum QALYs saved (in millions)
Potential total treatment
costs† (in million gold coins)
Cumulative costs (in gold coins)
Well-organised patient or producer group
A 250 1 250 250 No
B 500 1 500 750 No
C 750 1 750 1,500 Yes
D 1,000 1 1,000 2,500 Yes
E 1,250 1 1,250 3,750 No
F 1,500 1 1,500 5,250 No
G 1,750 1 1,750 7,000 No
H 2,000 1 2,000 9,000 Yes
I 2,250 1 2,250 11,250 No
† Cost per QALY * Number of QALYs;
We can now think of at least three scenarios, each corresponding to one particular prioritisation
strategy. These scenarios represent thought experiments. The political reality of healthcare systems
suggests that reimbursement and financing decisions hardly follow any of these strategies to the letter,
not to mention the fact that it is not always clear which spending strategies are being used by different
governments, if any. However, the validity of these thought experiments lies in the fact that daily politics
sometimes delivers the same results as if the thought models used here had been followed.
The "mathematic or mechanistic" HTA body (more for less)
If all healthcare policy was executed by a perfectly mechanistic HTA body, one without any political
interests of its own and with only mathematical calculations in mind, then it would be based on the
league table only. The HTA body would first pick the treatment that ranks highest on the list, and
provide it to all potentially eligible patients. If it still has money left, it would include the second

14
treatment to all eligible patients. If it still has money left, it would include the third treatment, and so
forth until the budget is depleted. Column 5 shows the cumulative costs of providing treatments to all
eligible patients, beginning with treatment A through to I. This HTA body would choose to fund the
treatments that have a cumulative cost equal (or closest to) their total budget, and supply all treatments
up to that point. In this example, the said HTA body would fully supply treatments A, B, C, D and E,
which together would just cost as much as the 3,750 million gold coins that it has at its disposal. But it
also means that treatment F, G, H and I would not be provided by the state. The result is that a
significant number of patients would not have access to subsidised treatments and would have to
purchase these treatments out of their own pocket. This may work for those patients that are able to
pay for these treatments, but what about the patients who cannot? A mathematic HTA model can
therefore be very effective from a statistical and economic point of view but can prove very cruel from a
social point of view.
Equal distribution (less for more)
What would be an alternative for priority setting, if the total budget was the same but no HTA
information was produced or utilised? Healthcare policy does, of course, not follow any explicit
algorithm. One has to work with assumptions about the political process, on which there is no general
consensus. One could imagine a government attempting to treat all patients equally, no matter which
illness they suffer from. That would mean that government does not prioritise patients by selecting
treatments. It instead offers all treatments alike, but as resource constraints do not disappear, as each
treatment can only be offered to a fraction of those who want to receive it. In our example, the health
budget is only a third of what would be needed to treat everybody, so each treatment would be offered
but only to one third of its respective potential patients.
A more realistic variant of this prioritisation model is that decision-makers are not interested in equality
per se, but want to avoid being associated with restricting access to care. It would then promise to offer
all treatments, but not provide a sufficient budget to fund them. As a result, congestion occurs and
waiting lists crowd out a fraction of the potential patients. Another variant is that government includes
all treatments in its reimbursement catalogue, but sets fixed sectoral budgets and adds more
burdensome bureaucratic limitations on the actual ability to allocate these budgets. To the degree that
budgets draw to a close, doctors become wearier with prescriptions, and some patients go untreated or
under-treated. Such prioritisations by crowding-out do not apply to an equal fraction of all patient
groups as in the model. Rather they occur in a non-systematic and unpredictable fashion and can

15
therefore be thought of as concerning all groups alike. The end result is the same. In theory more
treatments are available to patients, but in practice many patients find it very difficult, and at times even
impossible (given their medical condition), to gain access to such treatments. This model may be
politically attractive to policymakers, because they are not being perceived as 'cruel', but in practice it
can make many patients miserable or even shorten their life, particularly when the system is faced with
increasing demands of patients to gain access to services and technologies in a timely and effective
fashion.
Interest group-driven policy (rent seeking)
An alternative interpretation of the political process is that of the Public Choice School, which assumes
that government spending decisions are largely driven by their beneficiaries’ ability to organise and
exercise political pressure. In health care, this means that decisions will be affected by different pressure
and interest groups. In our hypothetical discussion, one could imagine a health care policy based solely
on serving interest groups. In column 6 of table 1, it has been assumed that the potential beneficiaries of
treatments C, D and H have political lobbies while the others have not.4 Hence, it is these treatments
that will be covered by the health system. In other words, in this model, decision to reimburse or not to
reimburse a given treatment will be based on the political power of the groups that are interested in this
treatment.
Table 2: Three ways of health care prioritisation compared
Health care policy based
on…
Treatments provided
Money spent (in million gold coins) QALYs saved (in m)
‘Evidence-based’: Pure HTA
A, B, C, D, E (250+500+750+1000+1250 =) 3,750
5
‘Politics-based’ I: Equal distribution
One third of each 1/3 *
(250+500+750+1000+1250+1500+1750+2000+2250)= 3,750
3
‘Politics-based’ II: Interest group-
driven
C, D, H 750+1000+2000 =
3,750
3
4 In reality, of course, the question will not be answered by a ‘yes’ or ‘no’. Groups will have differing degrees of organisational power. Public Choice economics would suggest that the share each group gets of the public trough will divide up more or less along these lines.

16
Table 2 (p.15) compares the outcomes of all three prioritisation modes with a fixed budget, applied to
the hypothetical healthcare system presented in table 1. It shows that the alternatives based on
deliberate political decisions save 40% less QALYs than HTA, which (in this example) is logical because
HTA is a conscious maximisation of QALYs from a given budget while the other approaches are not.
The above are only a selection of possible alternatives. Other options are conceivable, such as
prioritisation by total costs instead of cost-effectiveness. Intuitively, it is clear that this alternative will
save far fewer QALYs than what is feasible. Expensive treatments whose high costs are justified by their
outstanding performance would be excluded. Cheap treatments would be covered even when they
hardly deliver any benefits. Alternatively, ‘ideological’ positions clearly play a role in health care. Parties,
for example, hold differing views about the role of the pharmaceutical industry, or of preventive
medicine. It is easy to see why this attempt, which judges a particular health sector not on the outcomes
it produces, but on perceived inherent merits or de-merits, will fall short of producing optimal results.5
Note that the above is by no means a demonstration that HTA is an appropriate mechanism of
allocating health care resources. It is an explanation of the HTA process within the specific set of
assumptions on which HTA is based. Among them is the notion that QALYs are a sensible health
outcome measure, which one could question. And even if all the methodological assumptions were true,
it would still be doubtful whether HTA institutions were or could really be fully independent, and act
without any political agenda of their own.
What the above demonstrates is that HTA may have serious flaws but no more so than the common
policy alternatives which are less transparent and more discretionary. However, we also note that even
if it were perfected the HTA model would still suffer from some serious social flaws, not least with
regard to its exclusionary features.
Thus we should treat the HTA model for what it is – an explicit prioritisation mechanism – no more and
no less.
5 The above describes, of course, a very limited view of health care. For most people, health care is not about
‘maximising QALYs/DALYs’ but about wellbeing in a wider sense, which can include the use of health goods and
services which have no demonstrable clinical effect.

17
From league tables to thresholds
As discussed, the above scenarios denote thought experiments. In theory, a purely HTA-based health
policy would require exorbitant amounts of high-quality information. It would need solid appraisals of all
treatments available or potentially available in the healthcare system, subdivided for all patient subgroups
and all treatment intensities. But in reality, even an HTA body with a large budget can only carry out a
small number of appraisals per year.6 League tables are thus more of an eye-catcher than of practical
relevance.
The league table logic can also be approached from the opposite perspective. In the above scenarios, the
starting position was a fixed budget. The budget was spent by descending a league table until it was
exhausted. The last treatment to be included cost 1,250 gold coins. This represented the cut-off point.
Reversing this approach, one could think of the cut-off point as the starting position. The HTA body
receives the order to accept every treatment with a cost per QALY ratio of or below 1,250 gold coins
and to reject every treatment with a higher cost per QALY ratio. Just as above, treatments A, B, C, D
and E would have been selected and the rest rejected. 3,750 million gold coins would have been spent
and 5 million QALYs saved.
In this example it makes no difference whether the budget is fixed and the cut-off point adjusts to it, or
whether the cut-off point is fixed and the budget adjusts. But under real-world conditions, the second
option has several advantages. First of all, it does not require perfect information. It is also applicable in
cases where an HTA body only has the resources to screen a small fraction of selected treatments. But
it is also theoretically more convincing. Healthcare budgets are not simply ‘fixed’. They are finite, which
is something very different. In the above example, both options led to the same result, but with a few
alterations the identity of the table breaks down. Imagine in the following year, five new innovative
treatments are invented, all of which come at a cost-per-QALY ratio of 250 gold coins (and are again
able to save 1m QALYs each). With a fixed budget, all five would be offered but treatment E would now
be crowded out, even though its price-performance-ratio has not worsened. With the threshold of
1,250 it is the total budget that would have to adapt. It would rise to 5,000 gold coins – which makes
sense. With a greater number of cost-effective treatments available, health care has become a more
‘attractive investment’, and it is sensible to spend more on it in total. It is the very logic of HTA not to
look at total costs but at the cost-performance-ratio. This also raises the question of why one should
not apply this logic to the healthcare system as a whole? But this is a discussion for another paper.
6 NICE, for example, published 86 sets of guidance in its first five years, see Raftery (2006) p. 1266/7

18
What price for a year of life? The theory
Having derived – within the assumptions of HTA – the rationale for a threshold, the really problematic
question arises – what threshold to choose? Which price to put on a year of life? Several figures have
been circulated, but none of them appear to be theoretically well-grounded – which is not to discredit
those who suggested them. Such numbers could not be anything else but arbitrary. It is sometimes said
that the number should reflect ‘society’s preferences’, but this is an empty slogan. ‘Society’ has no
preferences, and even when assuming a group of perfectly homogeneous individuals, these preferences
would not be very obvious.7
The ‘Medicare Standard’
A review of possible threshold numbers that have so far been proposed can be found in Eichler et al
(2005). Perhaps the first number ever to be cited was the so-called ‘Medicare Dialysis Standard’ –
$50,000 (US) for a QALY. It originates from a ruling by the US public health fund Medicare that
concerned a programme to treat patients with chronic renal failure. The ruling intended to make sure
that the treatment was only applied in serious cases, so that it resulted in the mentioned cost-per-QALY
number. Since then, $50,000 has frequently been cited in the US medical literature as a reasonable
standard for cost-effectiveness. One obvious weakness of this figure is that even though it referred to
the value of the US dollar in 1982, it was still in circulation years later. The suspicion arises that the
Medicare Standard has been cited so often because $50,000 is a neat round amount, not because there
is any plausible theoretical assumption backing it. Adjusted for inflation, the Medicare Standard would
have to be around $105,000 today.8 But even if one constructed something like an ‘inflation-indexed
Medicare Standard’, it would still not account for the fact that the US today is a much wealthier country
than it was in 1982 (despite the recent credit crunch). Consequently, most citizens would probably be
willing to spend more on health care, even in real terms, than they would have done 26 years ago. The
Medicare Standard may have been considered a reasonable form of best-practice by many stakeholders
in the US in the early 1980s, however, it is currently not an appropriate uniform recommendation.
7 When using a questionnaire, it is likely that the outcome depends hugely on how the question is formulated.
Asking, for example,
“John Smith, 42, has a fatal disease. A cure that would save him is available, but it costs £50,000. Should
government pay?” would probably deliver a very different outcome than:
“A hospital thinks of overhauling one of its medical devices, which it uses to treat 10,000 patients suffering from a
deadly disease. The overhaul would raise the probability of success from 88% to 88.001%, but it costs £50,000.
Should government pay? 8 Calculation prepared by authors, US annual inflation data from www.econstat.com

19
The ‘Expert Standard’
While the Medicare Standard comes from a practical application, one could alternatively think of an
expert consensus establishing a threshold. This is the approach chosen by Newhouse (1998), who
surveyed health economists in the US and the UK for their suggestion. It turned out that the ‘average
health economist’ favours a threshold of around $60,000 (US) per life year saved (most likely referring
to the US dollar of 1998). This ‘Expert Standard’ cannot be directly compared to the ‘Medicare
Standard’ because it uses a different denominator; it is based on the absolute number of life years, not
on quality-adjusted life years. By definition, a QALY is at most one year but can be much shorter. It is
thus not clear which standard is more ‘generous’. As before, this suggestion is limited to a particular
time and place.
The Non-Medical Sector Standard
As a third option, one could derive a threshold from other spending areas where a price tag is put on a
life span. A sector with obvious parallels to health care is road safety. Investments such as straightening
blind bends, widening narrow spots and fortifying roadsides can reduce the likelihood of accidents. But
even the most developed infrastructure system still has lots of such road spots left. Only a fraction of all
potentially life-saving investments in infrastructure is actually realised. Just like in health care, planning
authorities must use an upper cost limit for how much they are willing to spend on reducing the
likelihood of a fatal accident by, say, 0.001 percentage points a year. Investment decisions would
otherwise be unsystematic. Limited funds would go to relatively safe road spots while the riskier ones
would go unimproved. Of course, planning authorities would not publicly declare that they use such a
cost limit, let alone publish a number. But it could be worked out from looking at past investment
decisions. With estimates about the impact of an investment on the probability of accidents available and
publicly used, it could be checked whether some number acted as an invisible dividing line between
approved and rejected investments. For several categories of public spending, retrospective analyses
have indeed found evidence that such implicit thresholds existed. But it also found that the variation
between types of spending was enormous. In the US, it ranged from $36,000 (US) in residential safety
and $4,200,000 for environmental safety. The impression arises that visibility plays a large role; the
perception of environmental dangers may be a much stronger one than that for safety lacks in residential
infrastructure.
Still, at least two strong arguments could be made for the transmission of non-medical sector thresholds
to the decisions of HTA bodies. First, a cross-sector harmonisation of thresholds is entirely sensible.

20
There is no reason why a life span saved through improvements in road safety should be worth less, or
more, than a life span saved through improvements in health care. If a shift from one to the other
resulted in more people living longer, then there is no reason not to undertake that shift. Second, the
empirical evidence for de facto thresholds is much greater in the non-medical sector, perhaps simply
because roads have been built for centuries while HTA is a rather new phenomenon.
A strong point against this approach is that whilst there is evidence that quasi-thresholds are used
outside of medical spending, it does not appear that this use has been systematic or consistent, neither
within a sector nor across sectors. In other words, it could well be that in the search for a consensus-
based threshold in the non-medical sectors we are just as much stumbling in the dark as we are in the
medical sector. The argument for a cross-sector transfer of a threshold then becomes circular. Just as
one could say that HTA bodies should study the behaviour of road planning authorities and adopt a
threshold from them, one could say that road planning authorities should study the behaviour of HTA
bodies to adopt a threshold.
The problem with any fixed number is that even if it is based on a wide consensus it is very specific to a
particular place and time. The WHO has attempted to define a uniform standard which, theoretically,
any country could adopt at any time. In its 2002 Health Report, it proposed to set a threshold of three
times GDP per capita. Compared to the Medicare Standard and the Expert Standard, this approach has
the advantage that it adjusts automatically to a country’s ability to pay and to the price level. This
automatism is sensible if policy recommendations are derived from the threshold, because a figure that
would need periodical adjustment would be subject to ‘political cycles’. Adjustment would be delayed in
times of budget pressures, while an over-adjustment would be likely in proximity to elections. But it is
still overly simplistic.
Most economists would agree that health care is a ‘luxury good’, which means that richer societies tend
to spend a larger proportion of their income (a larger absolute amount anyway) on health care than
poor societies. It is incompatible with this insight that the same proportional threshold should be applied
to Switzerland and to Nicaragua. Further, a figure that is only based on a country’s GDP cannot take
account of the crucial factor of demographics. In an ageing and increasingly multi-morbid society, a dollar
or a pound spent on health care may well buy greater health gains than it would in a young society.

21
What price for a year of life? The practice
Most Western countries have established institutions that weigh up the benefits and costs of medicines.
The activities of these HTA institutions are difficult to compare across countries. Some institutions
appraise just new treatments, whilst others also look into established remedies. Some bodies can only
make recommendations, whilst others have tools to implement them into medical practice. Some only
appraise drugs, whilst others appraise every type of medical spending. Their common denominator is
that their role is to evaluate whether a particular health treatment constitutes ‘value for money’, yet
they do not specify what they mean by ‘value for money’.
The following section will describe how this issue is handled in a number of countries where HTA is
widely used.
United Kingdom
In the UK, the National Institute for Health and Clinical Excellence (NICE) is an outstanding example of
a HTA agency. NICE appraisals cover the whole range of healthcare spending types, and their
recommendations are binding throughout the National Health Service (NHS). Unusual for such a
technical body, NICE activities are frequently reported in daily newspapers, and the Institute is fairly
well-known by the general public. Unsurprisingly, its behaviour is under careful scrutiny, in particular its
criteria for accepting or declining a technology. On several occasions, observers have reckoned that the
cut-off point used by NICE must lie between £20, 000 and £30, 000 per QALY, though NICE has
repeatedly repudiated this figure. The UK Parliament Health Select Committee’s protocol states that
“[p]revious witnesses had reported to the committee that NICE had a threshold or a cutoff point of
£30, 000 cost per QALY above which no technology would be approved. The institute was clear that
this was not the case.” However, whilst not calling this a ‘threshold’ or a ‘cut-off point’, NICE’s Guide to
the Methods of Technology Appraisal (2004) openly states that these two figures play a crucial role in their
recommendations. The Institute explains that treatments that cost less than £20, 000 per QALY would
be frequently approved for their cost-effectiveness. When costs lie between £20, 000 and £30, 000,
additional factors are taken into account, such as the reliability of results, the ‘innovative nature’ of the
technology, wider societal costs of the disease and the broader health status of the population group
that the treatment applies to. Above a ratio of £30, 000, additional evidence supporting the treatment
“has to be increasingly strong” for the treatment to find approval.

22
This information suggests that instead of a single fixed value, NICE uses a threshold interval. Treatments
with a cost per QALY below the interval would be routinely accepted and treatments with values above
the interval would be routinely rejected. Within the interval, cost per QALY values would be traded off
against other objectives. This could mean that within the interval, a relatively high cost per QALY ratio
can be compensated with unambiguousness in the data, or with relevance for a group that is considered
disadvantaged. This could be considered a compromise between a mechanistic classification and a
balancing of several competing objectives.
But is this self-depiction in line with NICE’s actual behaviour ? And how important are the ‘additional
factors’ commonly used when cost per QALY is between £20,000 and £30,000? Devlin and Parkin
(2003) have developed a model that imitates the decision-making process of NICE. They have expressed
the probability that NICE rejects a technology as a mathematical function defined by a number of
variables. The authors specify several versions of the model, of which some are more and some less
successful in predicting NICE’s actual behaviour.9 While NICE behaviour cannot be fully explained by
these models, they do show that treatments with a higher cost per QALY are more likely to be
rejected, as are those that are based on more uncertain data. This uncertainty infers that there are
several cost-per-QALY estimates which are far apart.10 There is also some evidence that NICE is less
likely to reject a technology when a greater number of people would benefit from its use. However, the
authors find no particular confirmation that the NICE threshold interval is really defined by £20,000 and
£30,000. In fact, two treatments were shown to have been rejected, even though their cost per QALY
ratio was below £20,000 and five were accepted, even though the value was above £30,000. But there
does seem to be a certain consistency in NICE decisions, and rejected technologies with a low cost per
QALY ratio are indeed accompanied by large uncertainty. How NICE trades off this uncertainty against
cost-effectiveness, however, is not clear. A surprising result of the study is that the upper bound of the
threshold interval threshold seems in fact to be closer to £35, 000-£40, 000, or even higher.11
9 Devlin & Parkin (2003) p. 13-18 & p. 30
The degree of explanation (R2) ranges from 24% to 52%. Between 85% and 91% of all decisions are correctly
classified, meaning that the models predict a rejection when NICE really rejected and an acceptation when NICE
really accepted a technology. The estimates include 33 observations from the period of 1999-2002. 10 Devlin & Parkin (2003) p. 8
This uncertainty is expressed as the spread between the most ‘optimist’ and the most ‘pessimist’ cost per QALY
estimate, divided by the mean value. 11 Devlin & Parkin (2003) p. 19 & p. 32

23
It must be noted that the models developed by Devlin and Parker portray NICE as an insulated
institution. While NICE decisions may appear relatively consistent, these models cannot capture
inconsistencies of the threshold use that result from the interaction of NICE with the rest of the health
system. Not all health care spending decisions in the NHS are based on NICE appraisals. NICE appraises
only a fraction of all available treatments; it does not appraise the whole range nor was it set up do so.
According to what was explained earlier, this means that the remainder of spending decisions must be
based on different prioritisation modes.
The NHS uses differing allocation algorithms in parallel, and there is some evidence that these do not
simply coexist but sometimes even collide. Most spending decisions are made by Primary Care Trusts
(PCTs). PCTs also trade off competing objectives and distribute their budget between a variety of
possible uses. When a PCT decides that it has spent ‘enough’ on X and would rather spend more on Y,
this can be perceived as the PCT using a ‘threshold’, and that additional spending on X would result in
values above it. We could call this an ‘implicit threshold’ or a ‘notional threshold’. In reality, PCTs do
not make their decisions in this way, which is why estimates of implicit thresholds can be expected to be
very unsystematic. Nevertheless, Martin et al (2007) have tried to express the PCTs’ spending decisions
in such terms (they speak of the ‘marginal cost of a life year saved’). The authors find that there is
indeed variation across treatments, but that it appears safe to conclude that the PCTs’ notional
thresholds are below the NICE threshold. Converted into QALYs, the values are around £19, 000 for
cancer and £12, 000 for circulatory diseases.12 A subsequent report on other disease areas hardens their
evidence.13 This result would surprise observers who view NICE as the government’s ‘rationing
watchdog’. But it does not make NICE a driver for better health outcomes. The House of Commons
Health Committee Report on NICE finds that NICE-approved technologies do not come on top of
PCT-approved ones, but rather crowd them out even if the latter are superior in terms of cost-
effectiveness.14 It is mandatory for PCTs to make NICE-approved technologies available within three
months. If the various implicit PCT thresholds were, on average, on a par with the NICE threshold, this
would not be a problem. The PCTs would then withdraw some technologies they would otherwise have
supplied, and add some technologies they would otherwise not have supplied. NICE-induced extra
spending and extra-saving could roughly cancel each other out. But if the NICE threshold is
systematically above the implicit PCT threshold and their budget does not adjust, then there will be
cases in which the PCTs withdraw a more cost-effective technology in order to afford a less cost-
12 Martin et al (2007) p. 30 13 Martin et al (2007a) p. 35-37 14 House of Commons Health Select Committee (2007) p. 60-63
24
effective one. As an example, the report mentions Alteplase, an expensive drug given to stroke patients.
According to Nigel Dudley, a stroke medicine consultant, under-funding of basic stroke services and
rehabilitation units were a much more pressing problem but had not yet been subject of a NICE
appraisal. In Dudley’s experience, routine availability of Alteplase came at the expense of these more
basic services.
This raises two important points. First, it is highly distorting to operate two different thresholds within
one health system, be that notional or ‘real’ ones. In such a case, reallocations do not always take place
from cost-ineffective to cost-effective treatments, but sometimes simply from the low-threshold-area to
the high-threshold-area. The report recommends that NICE appraisals should apply to many more
treatments. There should be a preliminary appraisal that is less thorough but can be performed much
more quickly. This should give a first orientation. Remaining uncertainties could be sorted out in a later
and more thorough appraisal. A lower threshold should be used for the preliminary appraisal than for
the final one.15 The report also recommends a closer coordination between NICE and the PCTs.
The second grave inconsistency is that the NICE threshold seems to be completely unrelated to other
parts of the NHS budget. The PCTs’ budgets are not adjusted to meet costly NICE approvals. At the
same time, the NICE threshold has been constant since 1999, even though the overall NHS budget has
been greatly expanded since that time.16
Coming back to our earlier discussion, a greater synergy should be adopted and applied between the
various bodies of the UK’s national health system (this principle should also be applied in other
countries). This also means that the total budget that is being allocated to the financing of healthcare
technologies should be a function of the threshold, or an implicit threshold should be a function of the
budget.
Australia
Australia has been at the forefront of incorporating HTA procedures into its health system. It was the
first country in the world to make the economic evaluation of drugs mandatory for producers. There
are several HTA agencies on various levels, with the body that has the most obvious impact on health
15 House of Commons Health Committee (2007) p. 56 & p. 98 16 Ibid. p. 67/68

25
policy being the Pharmaceutical Benefits Advisory Committee (PBAC). Australia has a national health
insurance system in which all drugs are included in a positive list. The Pharmaceutical Benefits Schedule
(PBS) is subsidised by the government with the patient only having to pay a fixed co-payment. The PBAC
evaluates newly launched drugs and recommends whether or not they should be included in the positive
list. PBAC evaluations have advisory status; whether or not a drug is eligible for subsidies is ultimately
decided by the government.
Even though the PBAC performs cost-effectiveness analyses, it has never explained exactly what it
means by ‘cost-effectiveness’. It has not named a threshold, but this does not mean it does not use one.
In such a case, it is possible to examine a HTA body’s previous decisions and check whether a ‘hidden
threshold’ can be tracked – if all treatments with a cost-per-QALY below £X has been approved, and all
treatments with a cost-per-QALY above £X rejected, then this figure acts as an unpublished threshold
for this HTA body. For the Australian case, just such a retrospective study has been carried out by
George et al (1999).
The methodological problem, which makes it hard to compare HTAs between Australia and the UK, lies
in the fact that most appraisals express health benefits in terms of life years gained, without adjusting
them for quality. Of those studies that used QALYs as a denominator, only one has resulted in a
rejection, and it referred to an extreme outlier. This permits no sensible statement about a hidden
threshold in terms of QALYs, because any number between $22, 000 and $122, 000 Australian dollars
(AUD) would qualify as a candidate for this hidden threshold.
The authors thus limit their analysis to studies using the absolute number of life years as a denominator.
The authors show that the PBAC at least acts with a minimum level of consistency. When decisions are
grouped into acceptances and rejections, the average cost per life year in the second group is so much
greater than in the first group that this difference can no longer be explained by coincidental variation.17
Arranging all decisions in a league table, it shows that no treatment with a cost per life year ratio below
$37, 000 (AUD) has ever been rejected; while no treatment with a ratio above $69, 000 (AUD) has
ever been accepted at the price proposed by the producer. Within that interval, several drugs have been
17 George et al (1999) p. 6
In other words, the authors perform a hypothesis test. Grouping all studies into rejections and acceptances, H0
says that the average cost per life year saved was the same in both groups. It can clearly be rejected, with a p-value
of 0.0008.
26
recommended under the condition that the producer accepts a lower price.18 This appears to be a very
broad interval, but is due to the authors’ approach, which defines a range that classifies each single
PBAC decision correctly. It could be narrowed if some misclassifications were accepted.
Unfortunately, George et al examine only drug appraisals from the period of 1991 to 1996, expressed in
1995 prices. It is not clear whether the threshold boundaries have since been adjusted. If so, expressed
in 2007 prices, they would correspond to an interval of £23, 000 - £43, 000.19 If they have not been
updated, they would correspond to £17, 000 - £32, 000.20
It is not clear whether the variations within the interval are to be interpreted as inconsistencies or as an
inclusion of factors other than cost-effectiveness. Like NICE, the PBAC takes other variables into
account, such as uncertainty, or the relevance of the drug to a group the PBAC considers disadvantaged.
It does, however, not state which weight it attaches to these factors, or whether it systematises their
inclusion at all.
Regarding consistency, it is obviously problematic that the PBAC is only concerned with
pharmaceuticals. Medical devices and procedures are appraised by institutions at their own or hospital
level.21 This institutional diversity makes it unlikely that similar implicit thresholds will be used across
categories. If inconsistently applied across a health system, thresholds can bias resource use. If the PBAC
threshold is substantially higher than the threshold for non-medicinal therapies, then resources will be
diverted to drug prescriptions even though they would be more urgently needed in non-medicinal
treatment capacities. If the PBAC threshold is substantially lower, the opposite can occur.
New Zealand and others
Together with Australia, New Zealand has been one of the pioneers in the establishment of HTA
procedures. New Zealand operates a public drug reimbursement system with a positive list, the
‘Pharmaceutical Schedule’. Recommendations whether a particular drug should be included in the list are
given by the Pharmaceutical Management Agency (PHARMAC), the HTA agency for drugs.
18 George et al (1999) p. 6-8 & p. 13 19 Calculation is the authors’ own, Australian inflation rate figures from the Reserve Bank of Australia (2008),
exchange rates from the Oanda currency converter (2008). 20 Oanda currency converter (2008) 21 Healy et al (2006) p. 52-53

27
While neither a threshold nor a guideline value is published, and no systematic retrospective study is
available, Pritchard (2000) has claimed that a value of roughly $20, 000 (NZ) per QALY seems to be an
invisible dividing line.22 In this value has kept pace with the price level, it would today correspond to
£10,000.23 (If this is not the case, it would only be somewhat above £8, 000).
With consistency in mind, again, it is problematic that the PHARMAC’s activities are confined to the
evaluation of drugs.
For other countries, even less information about implicit thresholds is available. In the Swedish health
care system, HTA plays an important role, mostly through the Swedish Council on Technology
Assessment in Health Care (SBU) and the Pharmaceutical Benefits Board (LBF). Sorenson et al (2007)
have described it as ‘likely’ that the Swedish institutions use a threshold interval ranging from £25, 000
to £40, 000 per QALY.24 The authors also believe that the German Institute for Quality and Efficiency in
Health Care (IQWiG) uses ranges from £15, 000 to £30, 000.25
Is the threshold a measure of ‘generosity’?
In the UK, NICE has repeatedly been criticised for an excessive focus on cost-cutting. However, as far
as comparisons are possible, the cost per QALY threshold interval which NICE officially operates on
(£20, 000 - £30, 000) is not lower than the cut-off point which other developed countries use. It could
even be higher because NICE has frequently approved therapies that cost substantially more than
£30,000 per QALY.
Still, none of the above means that patients in the UK have better access to drugs than patients in
Australia or New Zealand. Other factors of a health system may well be more important determinants
than the threshold itself. Australia and New Zealand have a much stronger developed culture of private
healthcare spending. The share of patients’ out-of-pocket spending in total health spending is 17% in
New Zealand and 20% in Australia, compared to 13% in the UK. The biggest block of out of pocket
spending, both in Australia and in New Zealand, is for pharmaceuticals. Private health insurance
22 Pritchet (2000) quoted in Eichler et al (2004) p. 522 & 525 and in SChlander p. 24 23 Calculation mine, New Zealand’s inflation data from the Reserve Bank of New Zealand (2008), exchange rate
from the Oanda currency converter (2008) 24 Sorenson et al (2007) p. 75 25 Sorenson et al (2007) p. 113

28
contributes 4% to total spending in New Zealand and 7% in Australia26 whereas in the UK, private
insurance tends to be much more about niche products than about complements to state health care,
although this is starting to shift. In Australia, 43% of the population take out complementary private
health insurance to cover additional expenses.27 This figure is somewhat lower in New Zealand, but
New Zealand has a different way of targeting public money than the UK. While the NHS is clearly
rooted in the philosophy of state-provided comprehensive and universal health care coverage, in New
Zealand the role of the state in financing healthcare, including the financing of medicines, is a more
subsidiary one. It makes targeted transfers to low-income earners rather than providing services for free
to rich and poor alike. This is reflected in the use of ‘Concession Cards’, a form of health care voucher
that equips poor people with medical purchasing power. People who can afford to pay a greater share of
their bills themselves are expected to do so.28
With regard to the use of HTA, the findings of the PBAC and of PHARMAC are less absolute than
those of NICE. In Australia, if a drug is classified as cost-ineffective but the government would still like to
have it on the positive list, a form of reference pricing applies. The drug can still be included in the list,
and the patient would pay the differential between the prices the producer charges and the maximum
price the government is willing to pay (a ‘Special Patient Contribution’).29 A partial subsidisation of a
drug, going along with additional charges to the patient, is also an option in New Zealand.30
The situation in the UK is very different. Top-up payments, the practice of patients personally
purchasing treatments that are deemed too costly for the NHS to provide, have never been explicitly
acknowledged, at least until now. Current Department of Health (DH) guidelines have prohibited these
type of payments completely to NHS patients. However, the UK is shortly expected to adopt the
findings of a wide-scale review being headed by Professor Mike Richards, the UK National Cancer
Director.31 The review has been prompted by widespread media coverage that has condemned the
refusal of top-ups within the NHS. One particular example included a patient with advanced breast
cancer, who wanted to follow her doctor’s advice to privately top-up her NHS care. The NHS provides
chemotherapy, however this was likely to be insufficient in her advanced stage of breast cancer and so
26 OECD (2007) Chart 6 27 Healy et al (2006) p. 60 28 French et al (2001) p. 54 - 59 29 Medicare Australia (2007) 30 French et al (2001) p. 58 31
http://news.bbc.co.uk/1/hi/health/7706921.stm (accessed 4 November 2008)

29
the patient’s doctor recommended combining chemotherapy with a medicinal therapy using the new
cancer drug Avastin. But Avastin is unavailable on the NHS, and so would have to be paid for privately,
as was recommended by the patient’s doctor. However, DH intervened because it claims that a patient
who purchases one element of a treatment privately thereby implicitly issues a statement of intent,
signalising that they wanted to become a private patient. Therefore, an NHS patient cannot be a private
patient at the same time (at least not in the same ’episode of care’). A spokesman of the DH stated that
such top-up payments would create a two-tier NHS because some people could not afford drugs like
Avastin.32 The health minister argued top-ups would be ‘the end of the founding principles of the NHS’.
This interpretation often seems seriously flawed. Private top-up payments by some patients do not
appear to siphon resources away from poorer patients, but instead represent additional resources,
made available and borne entirely by their beneficiaries. The DH adheres to a literal interpretation of
the term ‘equal access to health care’, which does not refer to raising health standards for not-so-well-
off, but to lowering the standards for those who happen to be well off. If outlawing top-ups leads to a
narrowing of the gap in health care, it only does so by lowering the upper bar instead of raising the
lower one. Those who lose out from this decision are those who would only be able to scrape together
the money for an excess payment, but are unable to purchase the whole treatment privately. Some
people who purchase an entire treatment privately are effectively paying twice, paying for the NHS with
their tax money, and for private treatments with their net wage. The DH guidance thus raises the
barrier to private treatment, limiting this option to people on the upper income scale.
If top-up payments were common on the NHS for a whole variety of treatments, people could foresee
and prepare for situations in which sudden high health payments were necessary. In such an
environment, where a risk becomes predictable and assessable, a supplementary insurance industry
could thrive. The French health system is an example. In France, health care is not ‘free’. Different co-
payment rates apply for most services and products, and most of them are very high by international
comparisons. But eventual incurrence of these high payments is foreseeable, which is why this risk
becomes manageable (in the sense of ‘insurable’). Some 90% of the French population take out some
form of supplementary insurance to cover co-payment costs. This insurance sector, which comprises
for-profit companies and cooperatives, contributes 12% (more than 1% of GDP) to French healthcare
32 BBC News 31 January 2008

30
spending.33 As a result, French citizens are less dependent on the decisions of their government in health
care than British citizens.
And this is the main problem associated with the NICE threshold. Some observers have complained that
the threshold was too low and should be elevated.34 However, the problem with the threshold, as with
any NHS decision, is that health care in the UK rests almost entirely on one single pillar. With an NHS
that always claimed to be able to provide universal and comprehensive health care for free, and that
does not permit its patients to take some matters into their own hands, no back up in the form of
supplementary insurance, health savings or other, could develop. Health care rationing is clearly a
relevant issue in countries like Australia in New Zealand as well, but patients have at least some
opportunities to circumnavigate the limits of their statutory health system. Most Britons have no such
opportunity.
The key challenge is thus not to raise the NICE threshold. The key challenge is to give NHS patients the
power to use the NHS system more effectively, including the ability to use their own income when
making decisions that concern their personal health, thus becoming less dependent on the NICE
threshold.
33 Elkan (2003) p. 5-7. Out of pocket spending contributes another 10%. 34 House of Commons Health Committee (2007) p. 6 & p. 101

31
Conclusion
It is a general property of health goods and services that almost any amount of resources could be
sensibly spent on them and still provide some extra benefits. The problematic question of where to
draw the line and address other goals would therefore be present in any health system, regardless of
how it is organised. The current debate about rationing, however, reflects a dilemma inherent to public
decision making. To find a threshold which reflects ‘society’s preferences’ is a virtually impossible task,
given that ‘society’ has no collective or uniformed preferences as to what this threshold should be.
HTA institutions are often portrayed as fact-based alternatives to politically determined healthcare
spending, though as yet they have failed to live up to this promise. Instead, decision-making seems to
have passed from one form of arbitrary decision-making body to another. Even in countries where the
use of HTA is advanced, stakeholders of the respective health systems have no way of knowing what
HTA decisions are really based on. No HTA institution in the world defines clearly what it means by
‘cost-effectiveness’, nor do any of them explain how they trade off cost-effectiveness against other
variables (or even how they define and measure these other variables). The UK model of HTA may
currently be the most transparent one, but even this model suffers from such ambiguity that to call it a
‘best-practice-model’ would be inappropriate.
Current rulings do not oblige HTA institutions like NICE to exercise more than a minimum degree of
consistency and transparency. For example, NICE has previously rejected Liquid Based Cytology
treatment, which had a cost-effectiveness ratio of £1,100; yet approved the drug Orlistat, which had a
ratio of £46, 000. The reasoning behind this, if there is one, remains a matter of speculation. What this
highlights is that it is entirely possible for an HTA body to reject a technology with a cost per QALY of
£x as ‘cost-ineffective’, while at the same time accepting a technology with a cost per QALY of 2£x as
‘cost-effective’. In such a case the reason could only be a matter of speculation. Was the latter
technology relevant to a population group the HTA body considers disadvantaged? Did it perceive the
technology as particularly innovative and worth promoting? Or did an adjustment for uncertainty render
the first technology unattractive? If so, how much uncertainty is the HTA body willing to accept, and
how does it know whether this is in line with the risk tolerance of most of its stakeholders?
This picture becomes even more uncertain when analysing consistency not only at the level of the HTA
body itself, but at the level of the health system as a whole. In the UK, it appears that PCTs on average
set lower implicit thresholds for cost-effectiveness than those set by NICE. Yet providing NICE-
approved treatments remains mandatory for PCTs, even if it means cutting back on other forms of

32
spending. However despite this, the UK is probably one of the more consistent systems. In countries
where HTA bodies examine only a specific set of technologies, such as only drugs or only new market
launches, gaps may be much larger, though evidence on implicit cut-off points unrelated to cost-
effectiveness studies is even rarer than when related to cost-effectiveness.
The wider problem in the current practice remain that thresholds are not, or at least do not appear to
be, related to the total health budget. By and large, setting random limits on individual treatments that
are unconnected to what a government is willing to spend on health care in overall terms, seems illogical
and short-sighted.
Even if it were to be greatly improved, the threshold concept would still reflect a very static and
inflexible way of calculating the value of a given medicine to the public. This principle is arguably based
on the ‘one size fits all’ model, in which the decision about the value of a medicine is based on a
collective logic decided by the HTA body, without taking into consideration the individual preferences
and choices of patients and the public.
Yet this does not necessarily have to be the case. By shifting to a model which is based on greater
collaboration and partnership between the public and private sectors (such as by working with private
healthcare providers and insurers), and by allowing consumers a greater degree of choice and say in the
HTA prioritisation process (such as via the use of ‘top-ups’) the threshold concept, and indeed the HTA
model as a whole, could become more flexible and ultimately more suited to the individual preference
and choices of the public.
Policy Recommendations
The criticisms highlighted in this paper refer to the current implementation of cost-effectiveness
thresholds.
Nevertheless, the HTA model is here to stay. As such it can be argued that, within the framework of
government-funded health systems, which ultimately focus on cost-containment, thresholds may still
provide an improvement over cut-off points that are either non-transparent, discretionary or both.
By using thresholds more explicitly, HTA decisions may become more transparent and open for all
interested parties who wish to monitor the process, to understand it better and to either support or

33
challenge it. This would at least bring clarity and predictability for all those involved. But to achieve this
end, the current practice would have to be substantially changed:
• Thresholds would need to be made explicit and transparent, thus preventing the HTA
institution or other political bodies from making decisions that are based on discretion and/or
facing the criticisms that may be directed at these decisions. This is the only way to enforce
consistency in decision-making. If a government wants to subsidise a particular population group,
such as patients it considers disadvantaged or treatments that are considered more socially
‘urgent’ then it should do so openly.
• It also follows that there would need to be greater transparency in decisions that ‘trade’ cost-
effectiveness with other technically important variables, such as quality of evidence or the
expected cost-utility of new medicines over the long term. Accordingly, it should be pre-defined
how the certainty of the studies’ outcomes is measured, and how a good cost-effectiveness ratio
is set off against a poor degree of evidence.
• In terms of the systemic architecture of national health systems, HTA-related threshold figures
should be much more aligned with government healthcare spending budgets as a whole, and
specifically be adjusted to reflect the increase in healthcare spending over time, rather than
being perceived as a constant, one-time, calculation. This would prevent the crowding out of
relatively cost-effective technologies by relatively cost-ineffective ones, like what results from
the strains on PCTs’ budgets in the UK. As a result, funding could increase strongly in years in
which the HTA body approves many technologies, and increase less or even stagnate in years in
which there are less cost-effective innovations. The total health budget would thus be
determined, or at least strongly influenced, by the cost-effectiveness threshold.

34
References
Devlin, N. & Parkin, D. “Does NICE have a cost-effectiveness threshold and what other factors
influence its decisions? A discrete choice analysis”,Department of Economics Discussion Paper Series No.
03/01, City University London.
Eichler, H-G., Kong, S., Gerth, W., Mavros, P. & Jönsson, B. “Use of Cost-Effectiveness Analysis in
Health-Care Resource Allocation Decision-Making: How Are Cost-Effectiveness Thresholds Expected to
Emerge?”Value in Health Vol. 7 No. 5 p. 518-528, ISPOR (2004).
Elkan, W. “Health Care: Can Britain Learn from France?” 4th IEA Discussion Paper, Institute of Economic
Affairs (2003).
French, S., Old, A. & Healy, J. “Health Care Systems in Transition: New Zealand”, European Observatory
on Health Systems and Policies (2001).
George, D., Harris, A. & Mitchell, A. “Cost-Effectiveness of Analysis and the Consistency of Decision
Making: Evidence from Pharmaceutical Reimbursement in Australia 1991-96”, Working paper 89, Centre
for Health Program Evaluation (CHPE) (1999).
Healy, J., Sharman, E. & Lokuge, B. “Australia: Health System Review”; Health Systems in Transition Vol. 8
No. 5, European Observatory on Health Systems and Policies (2006)
Martin, S., Rice, N. & Smith, P. “The link between healthcare spending and health outcomes. Evidence
from English programme budgeting data, Quest for Quality and Improved Performance (QQIP) Project,
The Health Foundation (2007).
Martin, S., Rice, N. & Smith, P. “Further evidence on the link between healthcare spending and health
outcomes in England” Research Paper No. 32, Center for Health Economics (CHE), University of York
(2007).
Medicare Australia, Mediguide (2007).
35
National Institute for Health and Clinical Excellence (NICE), Guide to the Methods of Technology Appraisal
(2004).
National Institute for Health and Clinical Excellence (NICE), 2002/005 NICE present evidence to Health
Select Committee.
Raftery, J. “Review of NICE’s recommendations 1999-2005”, forthcoming in British Medical Journal Vol.
332 (2006) p. 1266-1268.
Reserve Bank of Australia (RBA), Inflation Calculator (2008).
Reserve Bank of New Zealand, CPI Inflation Calculator (2008).
Satchell, G. ‘I have been denied vital cancer drug’, BBC News, 31 January 2008.

Appendix 3
Methodology
57 Smart medicines (biological, biologics and oncology agents) used in the private sector for the
2008-2011 period based on IMSi data were selected.
These were categorized into 3 categories :
o Cancer agents (the most often used chemotherapies )
o Oncology biologics
o Chronic disease biologics (i.e. Medicines used to treat MS & RA)
The data was looked at from various perspectives over time with reference to:
o % Of Total Medicines Consumed In The Private Sector for the three categories and
the total
o The cost the these medicines compared to Administration Plus Managed Care Fees
o The change in annual expenditure in these medicines compared to the annual
change in Admin/Managed care costs.
o The cost of 14 smart drugs launched into the market in the 24 month prior to end
December 2011 to assess the impact of newly introduced medicines of the type
described herein.
i IMS TPM December 2008- December 2011.