Embed Size (px)
Citation preview

APPENDICES


APPENDIX A: BRIDGE DRAWINGS AND PHOTOS


A-1
APPENDIX A: BRIDGE DRAWINGS AND PHOTOS
List of Figures
Figure A-1: Bridge location........................................................................................................................................ 2Figure A-2: Horsetail Creek Bridge ......................................................................................................................... 2Figure A-3: Bridge during retrofit ............................................................................................................................ 3Figure A-4: Typical formwork w/ steel ..................................................................................................................... 3Figure A-5: Strain gauge application ........................................................................................................................ 3Figure A-6: Replicated steel reinforcing ................................................................................................................... 3Figure A-7: Typical beam pour ................................................................................................................................. 4Figure A-8: Surface preparation: abrasion .............................................................................................................. 4Figure A-9: Fiber optic gauge placement.................................................................................................................. 4Figure A-10: Tack coat and epoxy application......................................................................................................... 4Figure A-11: Saturation of CFRP w/ epoxy.............................................................................................................. 4Figure A-12: Epoxy application................................................................................................................................. 4Figure A-13: GFRP application to test beams.......................................................................................................... 5Figure A-14: CFRP application to test beam............................................................................................................ 5Figure A-15: In situ epoxy mixing ............................................................................................................................. 5Figure A-16: CFRP application to test beam............................................................................................................ 5Figure A-17: Second coat of epoxy/CFRP................................................................................................................. 5Figure A-18: Completed carbon reinforcement ....................................................................................................... 5Figure A-19: Testing of Control beam ...................................................................................................................... 6Figure A-20: Early cracking of Control beam.......................................................................................................... 6Figure A-21: Control beam shear sections................................................................................................................ 6Figure A-22: Shear failure of Control beam............................................................................................................. 6Figure A-23: Shear failure through sections............................................................................................................. 6Figure A-24: Completed shear failure....................................................................................................................... 6Figure A-25: Crack pattern around failure.............................................................................................................. 7Figure A-26: Support point: rotation at failure ....................................................................................................... 7Figure A-27: Load point: crushing at failure ........................................................................................................... 7Figure A-28: Flexure-only beam testing.................................................................................................................... 7Figure A-29: Failure of Flexure-only beam .............................................................................................................. 7Figure A-30: Diagonal tension failure ....................................................................................................................... 7Figure A-31: Failure similar to Control beam.......................................................................................................... 8Figure A-32: CFRP transverse rupture .................................................................................................................... 8Figure A-33: Fiber optic ............................................................................................................................................. 8Figure A-34: Cracking at failure ............................................................................................................................... 8Figure A-35: Flexure-only beam at failure ............................................................................................................... 8Figure A-36: Load point at failure ............................................................................................................................ 9Figure A-37: Debonding of CFRP at support........................................................................................................... 9Figure A-38: Fiber optic comparison gauges............................................................................................................ 9Figure A-39: Overall view of Shear-only test ........................................................................................................... 9Figure A-40: Loading of Shear-only beam ............................................................................................................. 10Figure A-41: Failure of Shear-only ......................................................................................................................... 10Figure A-42: Concrete crushing at midspan........................................................................................................... 10Figure A-43: Shear-only beam support point......................................................................................................... 10Figure A-44: S&F deflection under high load ........................................................................................................ 10Figure A-45: Visible S&F beam deflections............................................................................................................ 11Figure A-46: S&F beam shear sections ................................................................................................................... 11Figure A-47: Maximum loading of S&F beam....................................................................................................... 11Figure A-48: Increase moment max. loading.......................................................................................................... 11

A-2
Figure A-1: Bridge location
Figure A-2: Horsetail Creek Bridge

A-3
Figure A-3: Bridge during retrofit
Figure A-4: Typical formwork w/ steel
Figure A-5: Strain gauge application
Figure A-6: Replicated steel reinforcing
A-4
Figure A-7: Typical beam pour
Figure A-8: Surface preparation: abrasion
Figure A-9: Fiber optic gauge placement
Figure A-10: Tack coat and epoxy application
Figure A-11: Saturation of CFRP w/ epoxy
Figure A-12: Epoxy application
A-5
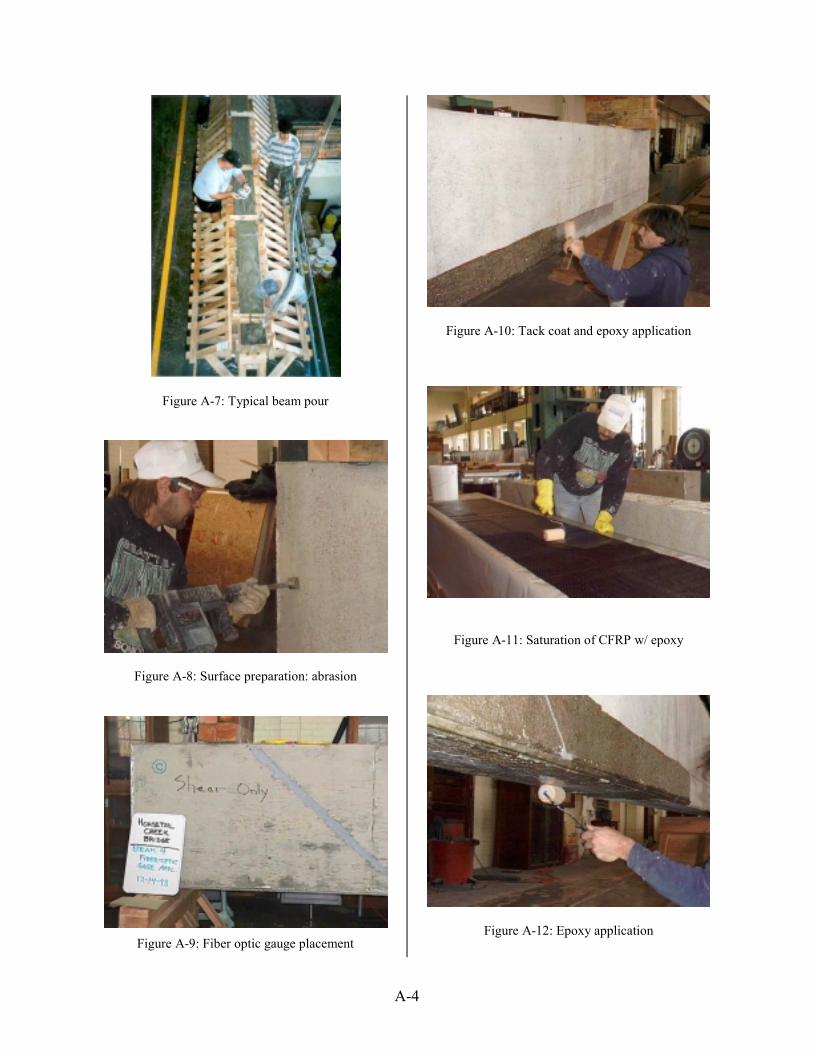
Figure A-13: GFRP application to test beams
Figure A-14: CFRP application to test beam
Figure A-15: In situ epoxy mixing
Figure A-16: CFRP application to test beam
Figure A-17: Second coat of epoxy/CFRP
Figure A-18: Completed carbon reinforcement

A-6
Figure A-19: Testing of Control beam
Figure A-20: Early cracking of Control beam
Figure A-21: Control beam shear sections
Figure A-22: Shear failure of Control beam
Figure A-23: Shear failure through sections
Figure A-24: Completed shear failure
A-7
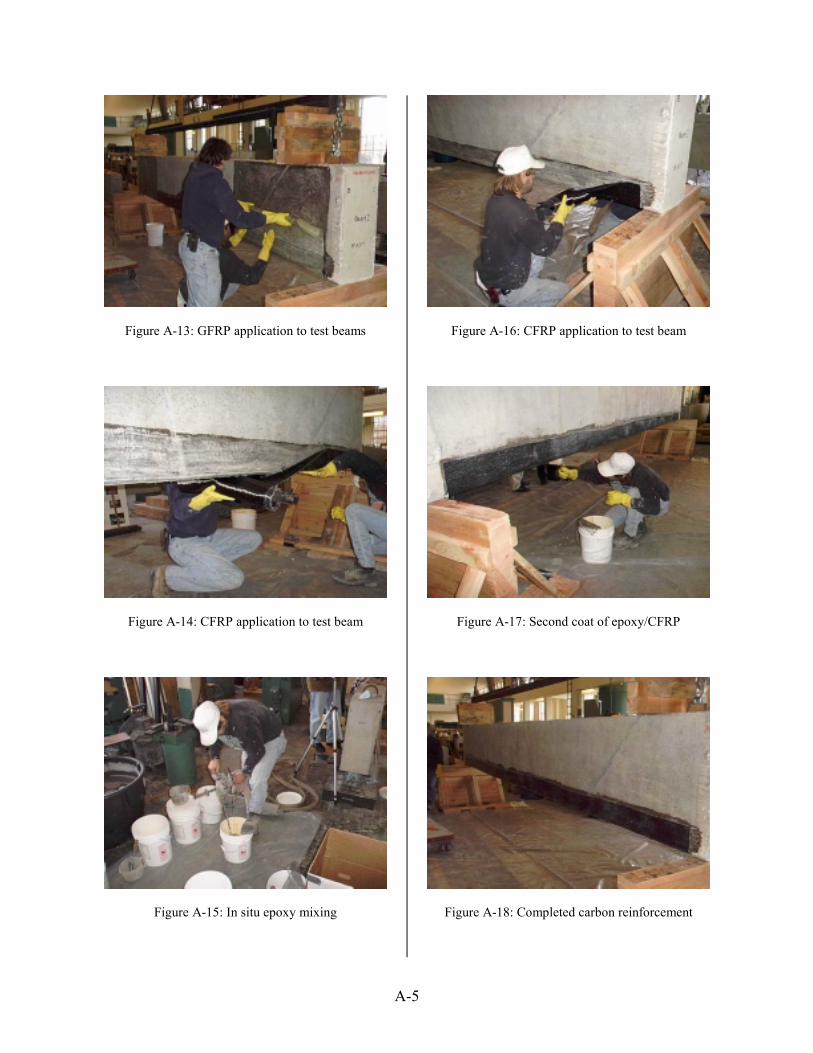
Figure A-25: Crack pattern around failure
Figure A-26: Support point: rotation at failure
Figure A-27: Load point: crushing at failure
Figure A-28: Flexure-only beam testing
Figure A-29: Failure of Flexure-only beam
Figure A-30: Diagonal tension failure

A-8
Figure A-31: Failure similar to Control beam
Figure A-32: CFRP transverse rupture
Figure A-33: Fiber optic
Figure A-34: Cracking at failure
Figure A-35: Flexure-only beam at failure
A-9
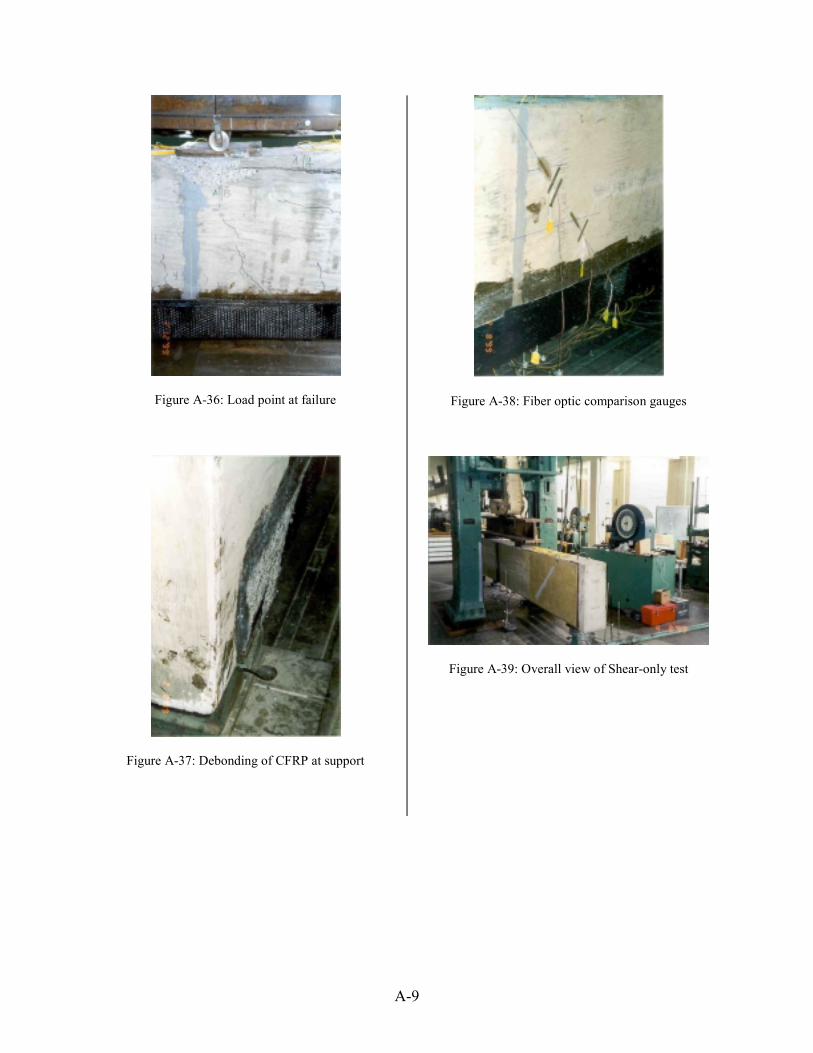
Figure A-36: Load point at failure
Figure A-37: Debonding of CFRP at support
Figure A-38: Fiber optic comparison gauges
Figure A-39: Overall view of Shear-only test

A-10
Figure A-40: Loading of Shear-only beam
Figure A-41: Failure of Shear-only
Figure A-42: Concrete crushing at midspan
Figure A-43: Shear-only beam support point
Figure A-44: S&F deflection under high load
A-11
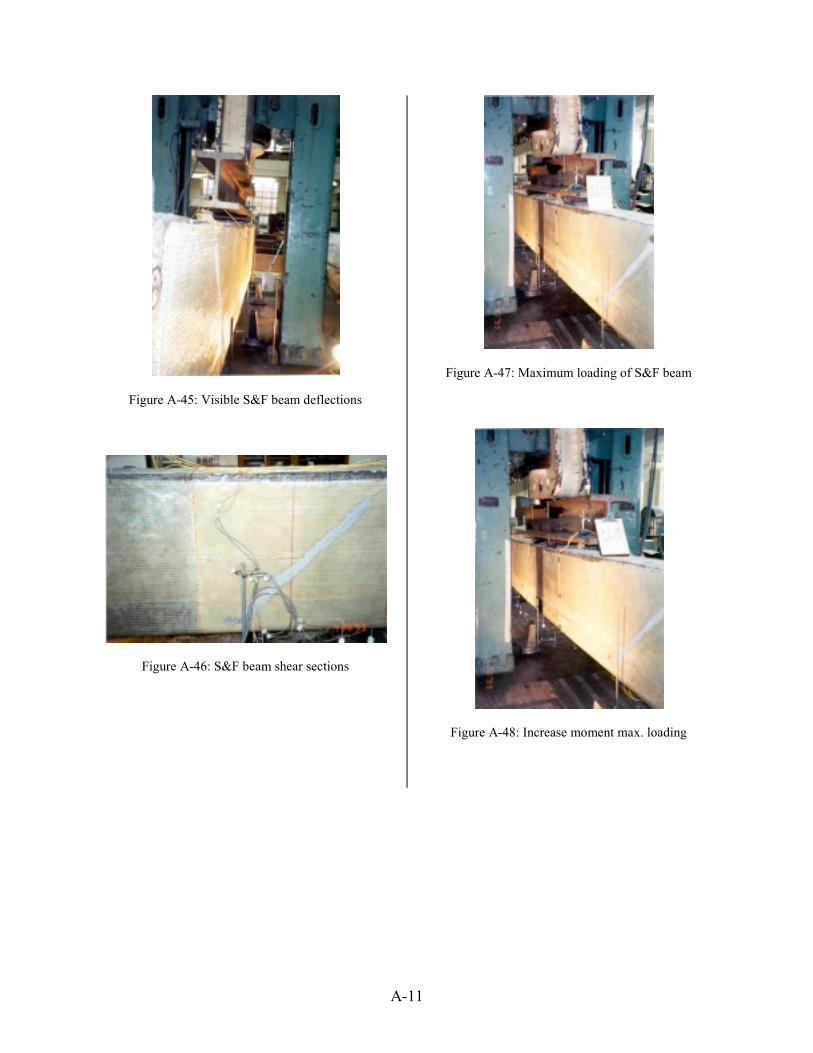
Figure A-45: Visible S&F beam deflections
Figure A-46: S&F beam shear sections
Figure A-47: Maximum loading of S&F beam
Figure A-48: Increase moment max. loading

APPENDIX B: CALCULATIONS FOR LOAD RATING ANDDESIGN OF EXPERIMENTAL BEAMS

B-1
APPENDIX B: CALCULATIONS FOR LOAD RATING ANDDESIGN OF EXPERIMENTAL BEAMS
Load Rating Calculations
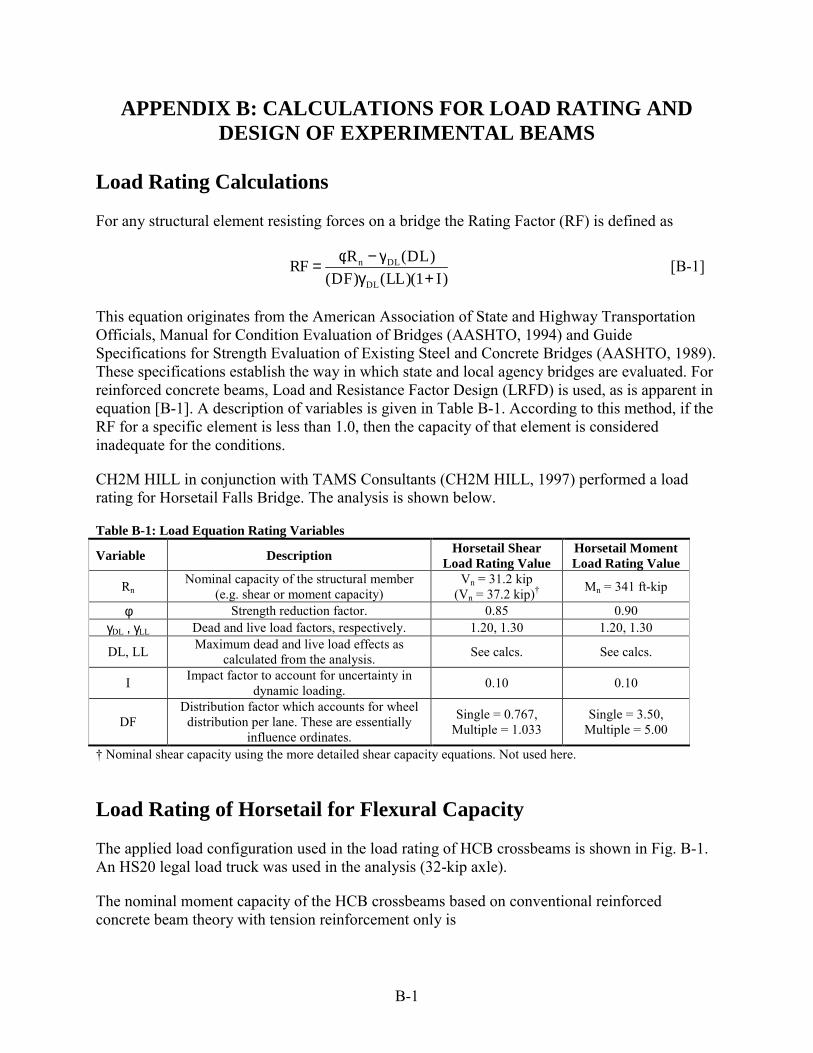
For any structural element resisting forces on a bridge the Rating Factor (RF) is defined as
)I1)(LL()DF()DL(RRF
DL
DLn
+γγ−φ= [B-1]
This equation originates from the American Association of State and Highway TransportationOfficials, Manual for Condition Evaluation of Bridges (AASHTO, 1994) and GuideSpecifications for Strength Evaluation of Existing Steel and Concrete Bridges (AASHTO, 1989).These specifications establish the way in which state and local agency bridges are evaluated. Forreinforced concrete beams, Load and Resistance Factor Design (LRFD) is used, as is apparent inequation [B-1]. A description of variables is given in Table B-1. According to this method, if theRF for a specific element is less than 1.0, then the capacity of that element is consideredinadequate for the conditions.
CH2M HILL in conjunction with TAMS Consultants (CH2M HILL, 1997) performed a loadrating for Horsetail Falls Bridge. The analysis is shown below.
Table B-1: Load Equation Rating Variables
Variable Description Horsetail ShearLoad Rating Value
Horsetail MomentLoad Rating Value
RnNominal capacity of the structural member
(e.g. shear or moment capacity)Vn = 31.2 kip
(Vn = 37.2 kip)† Mn = 341 ft-kip
φ Strength reduction factor. 0.85 0.90γDL=,=γLL Dead and live load factors, respectively. 1.20, 1.30 1.20, 1.30
DL, LL Maximum dead and live load effects ascalculated from the analysis. See calcs. See calcs.
I Impact factor to account for uncertainty indynamic loading. 0.10 0.10
DFDistribution factor which accounts for wheel
distribution per lane. These are essentiallyinfluence ordinates.
Single = 0.767,Multiple = 1.033
Single = 3.50,Multiple = 5.00
† Nominal shear capacity using the more detailed shear capacity equations. Not used here.
Load Rating of Horsetail for Flexural Capacity
The applied load configuration used in the load rating of HCB crossbeams is shown in Fig. B-1.An HS20 legal load truck was used in the analysis (32-kip axle).
The nominal moment capacity of the HCB crossbeams based on conventional reinforcedconcrete beam theory with tension reinforcement only is
B-2
Mn=Asfy(d-a/2) [B-2]
where a = (Asfy)/(0.85fc’b) [B-3]
This is a close approximation provided the beam is ductile (steel yields before crushing of theconcrete). The properties for the crossbeams were assumed according to unknown materialproperties for bridges built before 1959 and in lieu of testing (AASHTO, 1989, Ch. 6). Usinginformation from the original plans:
a=(5.00in2*33,000psi)/(0.85*2500psi*12in)
a=6.471-in
Mn=(5.00in2*33,000psi) (28.0in-(6.471in/2))
Mn=4,086,200 lb-in=341 kip-ft
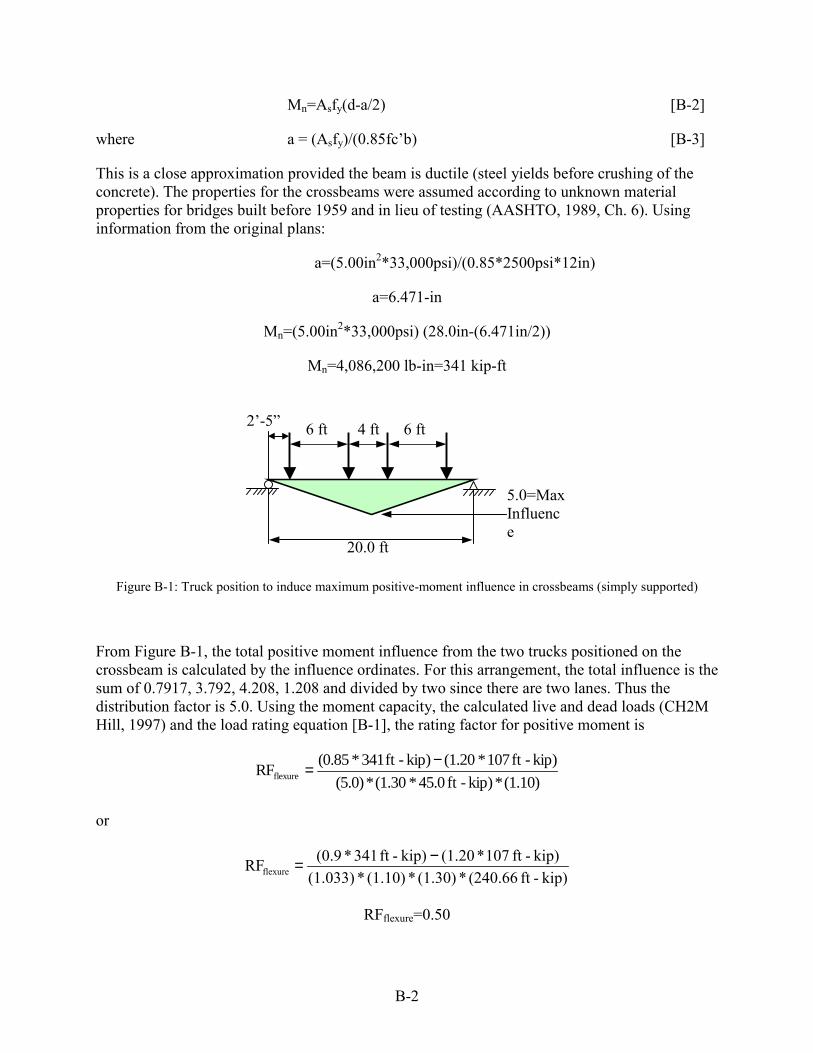
Figure B-1: Truck position to induce maximum positive-moment influence in crossbeams (simply supported)
From Figure B-1, the total positive moment influence from the two trucks positioned on thecrossbeam is calculated by the influence ordinates. For this arrangement, the total influence is thesum of 0.7917, 3.792, 4.208, 1.208 and divided by two since there are two lanes. Thus thedistribution factor is 5.0. Using the moment capacity, the calculated live and dead loads (CH2MHill, 1997) and the load rating equation [B-1], the rating factor for positive moment is
(1.10)*kip)-ft 45.0*(1.30*(5.0)kip)-ft 107*(1.20kip)-ft 341*(0.85
RFflexure−=
or
kip)-ft (240.66*(1.30) *(1.10)*(1.033)kip)-ft 107*(1.20kip)-ft 341*(0.9RFflexure
−=
RFflexure=0.50
6 ft 6 ft4 ft
20.0 ft
2’-5”
5.0=MaxInfluence
B-3
Load Rating of Horsetail for Shear Capacity
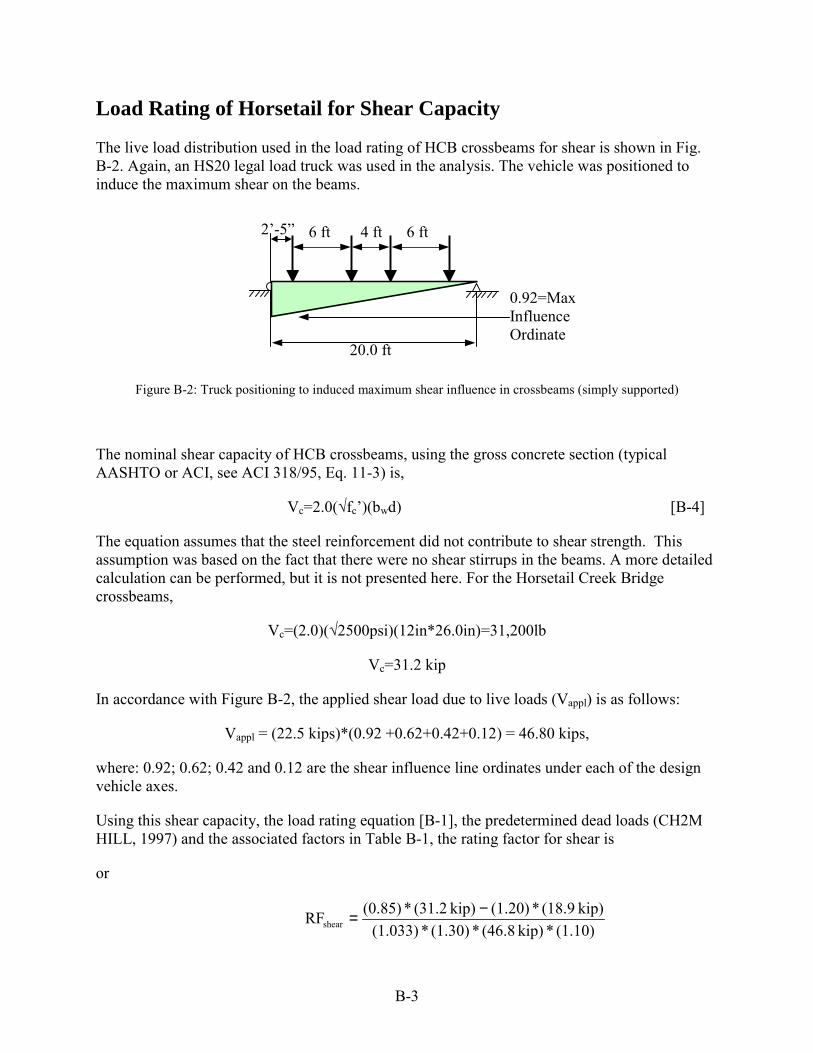
The live load distribution used in the load rating of HCB crossbeams for shear is shown in Fig.B-2. Again, an HS20 legal load truck was used in the analysis. The vehicle was positioned toinduce the maximum shear on the beams.
Figure B-2: Truck positioning to induced maximum shear influence in crossbeams (simply supported)
The nominal shear capacity of HCB crossbeams, using the gross concrete section (typicalAASHTO or ACI, see ACI 318/95, Eq. 11-3) is,
Vc=2.0(√fc’)(bwd) [B-4]
The equation assumes that the steel reinforcement did not contribute to shear strength. Thisassumption was based on the fact that there were no shear stirrups in the beams. A more detailedcalculation can be performed, but it is not presented here. For the Horsetail Creek Bridgecrossbeams,
Vc=(2.0)(√2500psi)(12in*26.0in)=31,200lb
Vc=31.2 kip
In accordance with Figure B-2, the applied shear load due to live loads (Vappl) is as follows:
Vappl = (22.5 kips)*(0.92 +0.62+0.42+0.12) = 46.80 kips,
where: 0.92; 0.62; 0.42 and 0.12 are the shear influence line ordinates under each of the designvehicle axes.
Using this shear capacity, the load rating equation [B-1], the predetermined dead loads (CH2MHILL, 1997) and the associated factors in Table B-1, the rating factor for shear is
or
(1.10)*kip) (46.8*(1.30)*(1.033)kip) (18.9*(1.20)kip) (31.2*(0.85)RFshear
−=
6 ft 6 ft4 ft
20.0 ft
2’-5”
0.92=MaxInfluenceOrdinate

B-4
RFshear= 0.06
Since the rating factor is much lower than one, the deficient member requires immediateattention. Such a low rating suggests that the crossbeams should have shown significant distress.However, this is mainly a result of the ultra conservative load rating evaluation procedureadopted by AASHTO and ACI, which does not necessarily represent the real load capacity.Horsetail Creek Bridge did not show any visible signs of structural distress.
Development of Similar beams for testing
Rationale
The mechanical properties of the steel reinforcement used in Horsetail Creek Bridge beams wereunknown. It is believed that the steel with which the bridge was constructed has a yield stress ofapproximately 33 ksi. For bridges constructed before 1959, AASHTO suggests using 33 ksi forthe yield strength of the steel reinforcement if the steel cannot be tested (AASHTO, 1994).Current construction methods typically require steel with 60 ksi yield strength. Acquiring steelwith yield strength less than 60 ksi is quite difficult. To achieve a 33 ksi yield strength, a specialorder of steel would have been required, which would have been too expensive for this study.Thus, a reevaluation of the beam strength and serviceability criteria was necessary.
Structural Issues
Regarding reinforced concrete design, there are two important issues of concern: strength andserviceability.
StrengthThere are two design philosophies governing the way a member is designed for safety:Load and Resistance Factor Design (LRFD) and Allowable Stress Design (ASD). LRFDemphasizes on adequate prediction of the member strength and factoring the loads alongwith the predicted strength. This is the predominant design method used for reinforcedconcrete. ASD uses more strength-of-materials (mechanics) relationships to calculate thestress developed in a member than does LRFD. Prescribed limits of stress are establishedand the designer must ensure that these stresses are not achieved. LRFD is not currentlyutilized in the design of FRP strengthened RC beams. However, due to the more realisticand less conservative predictions of the method, LRFD concepts were adopted andadapted to develop design criteria for this study. For development of the full-scale beams,strength criteria were considered important.
ServiceabilityServiceability refers to the day-to-day performance of the structural member and must beassured at service load levels, not at ultimate strength. Prescribed limits are established,such as maximum permissible crack widths and deflections. Due to the nature of theconducted experiments, serviceability was not a major concern in designing the full-scalebeams.

B-5
Horsetail Creek Bridge Beams Prior to Strengthening
There are two types of primary bending elements in HCB: crossbeams (orthogonal to traffic) andlongitudinal beams (parallel to traffic). Prior to strengthening, the only structural differencebetween the two beam types was that the crossbeams had one more 1 in2 flexural rebar than thelongitudinal beams. Consequently, the crossbeams had a slightly higher capacity in bending.Load rating showed the crossbeams had a lower shear rating factor. For this reason, theexperimental beams were designed after the crossbeams. The beam dimensions and steelreinforcement positions for the crossbeams are shown in Figures 2-1 and 2-2. There were noshear steel stirrups, which are now required by current standards1.
Matching Moment CapacityThe critical section for any flexural loading of the beam is likely to be near the midspan2.In an effort to keep the full-size beams as close to the original as possible, the number ofsteel reinforcement bars and locations, the estimated concrete strength, and the beamdimensions remained the same. The only parameter that was changed in order to matchcapacity with the original beam was the cross-sectional area of the flexural steelreinforcement. The calculations for determining the required steel cross-sectional area aregiven below. These calculations neglect the 5/8-in square bars near the top, which werefound have little affect.
The moment capacity, Mn, was approximately
Mn=Asfy(d-a/2) [B-5]
where “a” is the equivalent rectangular Whitney stress block (Whitney, 1956). Thiscondition is only true, provided the steel yields before the concrete crushes at the topcompression fibers. The balance steel ratio, ρb, is the ratio where simultaneous yieldingof the steel and crushing of the concrete occurs (Nilson, 1997). For the pre-strengthenedHCB beams,
ρb=yy
c1 f000,87
000,87f
'f85.0
+β [B-6]
If the steel ratio of the beam is lower than this value, yielding of the tension steelprecedes crushing of the concrete. Hence,
ρb=000,33000,33
000,87000,33
2500)85.0( 85.0+
=0.0397
ρ=As/bd = 5.00 in2 / (12 in * 28 in)= 0.0149
1 Design of reinforced concrete bridges is specified by the AASHTO Guide Specifications for Highway Bridges, 16th
Edition.2 Midspan refers to the section at the geometric center between two support points, that is ½ the span length.
B-6
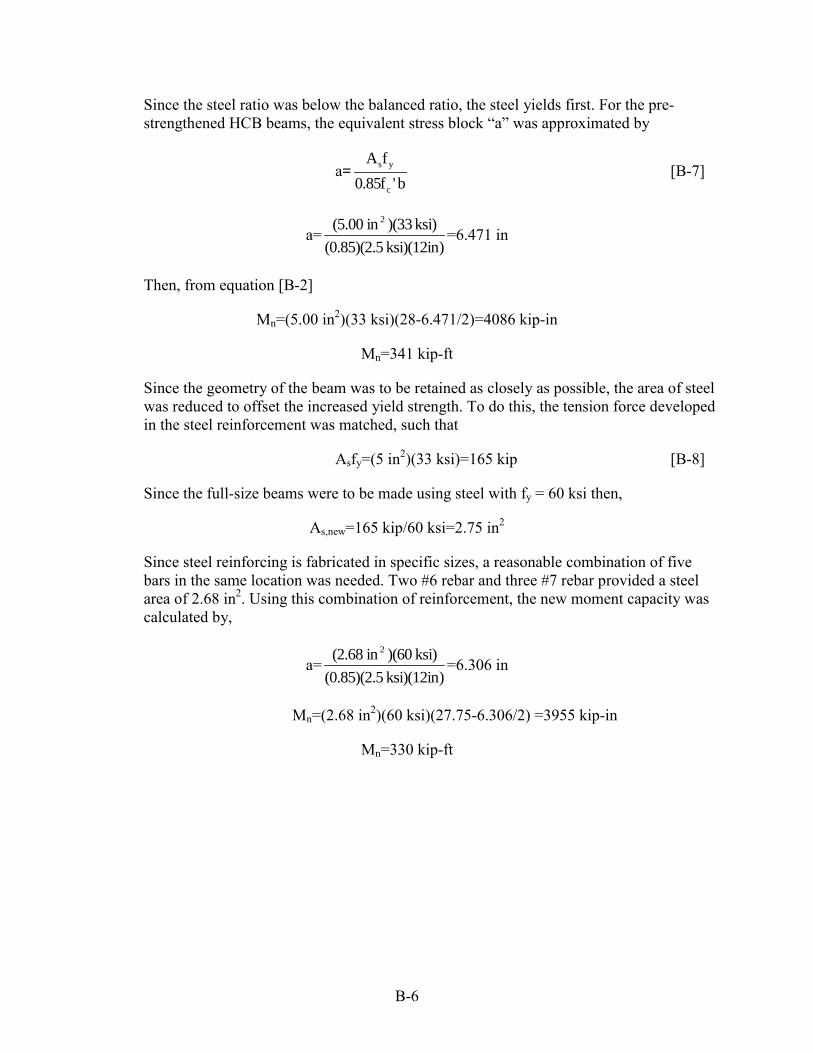
Since the steel ratio was below the balanced ratio, the steel yields first. For the pre-strengthened HCB beams, the equivalent stress block “a” was approximated by
a=b'f85.0
fA
c
ys [B-7]
a=ksi)(12in) (0.85)(2.5
ksi) )(33 in(5.00 2
=6.471 in
Then, from equation [B-2]
Mn=(5.00 in2)(33 ksi)(28-6.471/2)=4086 kip-in
Mn=341 kip-ft
Since the geometry of the beam was to be retained as closely as possible, the area of steelwas reduced to offset the increased yield strength. To do this, the tension force developedin the steel reinforcement was matched, such that
Asfy=(5 in2)(33 ksi)=165 kip [B-8]
Since the full-size beams were to be made using steel with fy = 60 ksi then,
As,new=165 kip/60 ksi=2.75 in2
Since steel reinforcing is fabricated in specific sizes, a reasonable combination of fivebars in the same location was needed. Two #6 rebar and three #7 rebar provided a steelarea of 2.68 in2. Using this combination of reinforcement, the new moment capacity wascalculated by,
a=ksi)(12in) (0.85)(2.5
ksi) )(60 in(2.68 2
=6.306 in
Mn=(2.68 in2)(60 ksi)(27.75-6.306/2) =3955 kip-in
Mn=330 kip-ft
B-7
References
American Association of State and Highway Transportation Officials (AASHTO), 1994Manual for Condition Evaluation of Bridges.
American Association of State and Highway Transportation Officials (AASHTO), 1989.Guide Specifications for Strength Evaluation of Existing Steel and Concrete Bridges.
American Concrete Institute (ACI), 1995. Building Code and Commentary for StructuralConcrete Design, ACI, Place of Publication.
CH2M HILL and TAMS Consultants, 1997. Load Rating Calculation Book No. 9090 forHorsetail Creek Bridge No. 04543. Contact: CH2M HILL, Inc., 2300 NW Walnut Blvd,Corvallis, Oregon 97330.
Nilson, A.H., 1997. Design of Concrete Structures, 12th Edition, McGraw-Hill: NewYork.
Whitney, C.S., and E. Cohen, 1957. “Guide for Ultimate Strength Design of ReinforcedConcrete,” Journal of the American Concrete Institute, ACI, Title No. 53-25, June, 1957.
B-8
Notation
Table B-2: Appendix B Notation
Variable Description US StandardUnits† Metric Units†
a Equivalent Whitney stress block depth converted fromthe depth to the neutral axis in mm
As Area of primary tension reinforcing steel in2 mm2
As,newNew area of primary tension reinforcing steel,converted for new tension reinforcement in2 mm2
b Compression flange/block width in mmbw Web width of the beam in mm
d Structural depth of the primary steel reinforcing fromthe top compression fibers in the beam in mm
DFDistribution factor which accounts for wheeldistribution per lane. In this analysis, these areinfluence ordinates.
~ ~
DL, LL Maximum applied dead and live load, respectively Varies Variesfc’ 28-day specified compressive strength of the concrete psi kPafy Steel reinforcing yield stress ksi MPaI Impact factor ~ ~
Mn Nominal moment capacity kip-ft kN-mRF rating factor of the structural element ~ ~
RFflexure Rating factor in flexure ~ ~Rn General nominal structural capacity ~ ~Vc Shear capacity of the concrete section kip kNVn Nominal shear capacity kip kNVs Shear capacity of the steel stirrups kip kNβ1 ~ ~φ Strength reduction factor ~ ~
γDL=,=γLL Dead and live load factors, respectively ~ ~
ρbBalance steel ratio where simultaneous crushing of theconcrete would occur with yielding of the tension steel. ~ ~
† Typical units presented. The use of “~” implies the variable has no units.

APPENDIX C: EXPERIMENTAL DATA

C-1
APPENDIX C: EXPERIMENTAL DATA
List of Figures
Figure C-1. Control Beam deflection characteristics............................................................................................... 2Figure C-2. Control Beam strain at 1067 mm from beam end................................................................................ 3Figure C-3. Control Beam strain at 1500 mm from beam end................................................................................ 3Figure C-4. Control Beam compressive strain comparison..................................................................................... 4Figure C-5. Control Beam tensile strain comparison............................................................................................... 4Figure C-6. Control Beam evidence of shear crack formation................................................................................ 5Figure C-7. Control Beam failure by shear crack formation.................................................................................. 5Figure C-8. Flexure-Only Beam deflection characteristics ..................................................................................... 6Figure C-9. Flexure-Only Beam strain 1067 mm from beam end .......................................................................... 6Figure C-10. Flexure-Only Beam strain 1500 mm from beam end ........................................................................ 7Figure C-11. Flexure-Only Beam compressive strain comparison ......................................................................... 7Figure C-12. Flexure-Only Beam tensile strain comparison ................................................................................... 8Figure C-13. Flexure-Only Beam early tensile strain comparison ......................................................................... 8Figure C-14. Flexure-Only Beam strain for comparison with fiber optic strain gauges ...................................... 9Figure C-15. Flexure-Only Beam evidence of shear crack formation .................................................................... 9Figure C-16. Flexure-Only Beam failure by shear crack formation..................................................................... 10Figure C-16. Shear-Only Beam deflection characteristics .................................................................................... 10Figure C-17. Shear-Only Beam strain 1067 mm from beam end ......................................................................... 11Figure C-18. Shear-Only Beam strain 1500 mm from beam end ......................................................................... 11Figure C-19. Shear-only beam compressive strain comparison............................................................................ 12Figure C-20. Shear-Only Beam tensile strain comparison .................................................................................... 12Figure C-21. Shear-Only Beam yielding of tension reinforcing steel ................................................................... 13Figure C-22. Shear-Only Beam failure: steel yields and concrete crushes .......................................................... 13Figure C-23. S&F Beam deflection characteristics ................................................................................................ 14Figure C-24. S&F Beam strain 1067 mm from beam end ..................................................................................... 14Figure C-25. S&F Beam strain 1500 mm from beam end ..................................................................................... 15Figure C-26. S&F Beam compressive strain comparison...................................................................................... 15Figure C-27. S&F Beam tensile strain comparison................................................................................................ 16Figure C-28. Common resistance strain gauge locations (dimensions in mm) .................................................... 20Figure C-29. Gauge type comparison—S&F Beam ............................................................................................... 20Figure C-30. Strain from flexural fiber optic strain gauges—S&F Beam ........................................................... 21Figure C-31. Strain from shear fiber optic strain gauges embedded in concrete—S&F Beam ......................... 21Figure C-32. Comparison of shear fiber optic strain gauges embedded in concrete and on top of the FRP
reinforcement—S&F beam............................................................................................................................. 22Figure C-33. Fiber optic strain gauge locations (dimensions in mm) ................................................................... 23Figure C-34. Control Beam cracking (a) and crack responsible for failure (b) .................................................. 24Figure C-35. Diagonal tension crack responsible for failure of F-Only Beam..................................................... 25Figure C-36. S-Only Beam (a) and flexural cracks (darkened for contrast) in GFRP near ultimate load (b) . 25Figure C-37. Comparison of beam cracking (dimensions in mm) ........................................................................ 26Figure C-38. Fiber optic vs. resistance strain gauge comparison—F-Only Beam............................................... 29Figure C-39. Principal compression stress trajectories for a homogeneous simple beam uniformly loaded
(after Nilson, 1997) .......................................................................................................................................... 29
List of Tables
Table C-1 Resistance strain gauge identification ................................................................................................... 16Table C-2. Fiber optic strain gauge identification.................................................................................................. 22
C-2
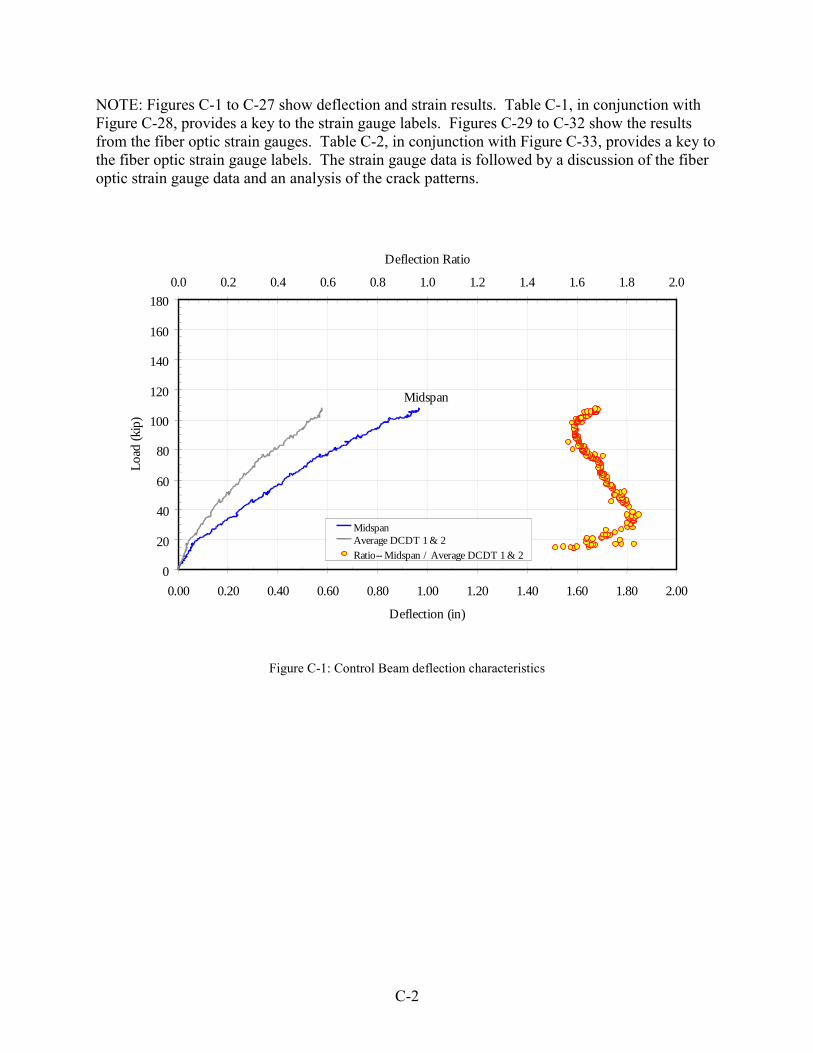
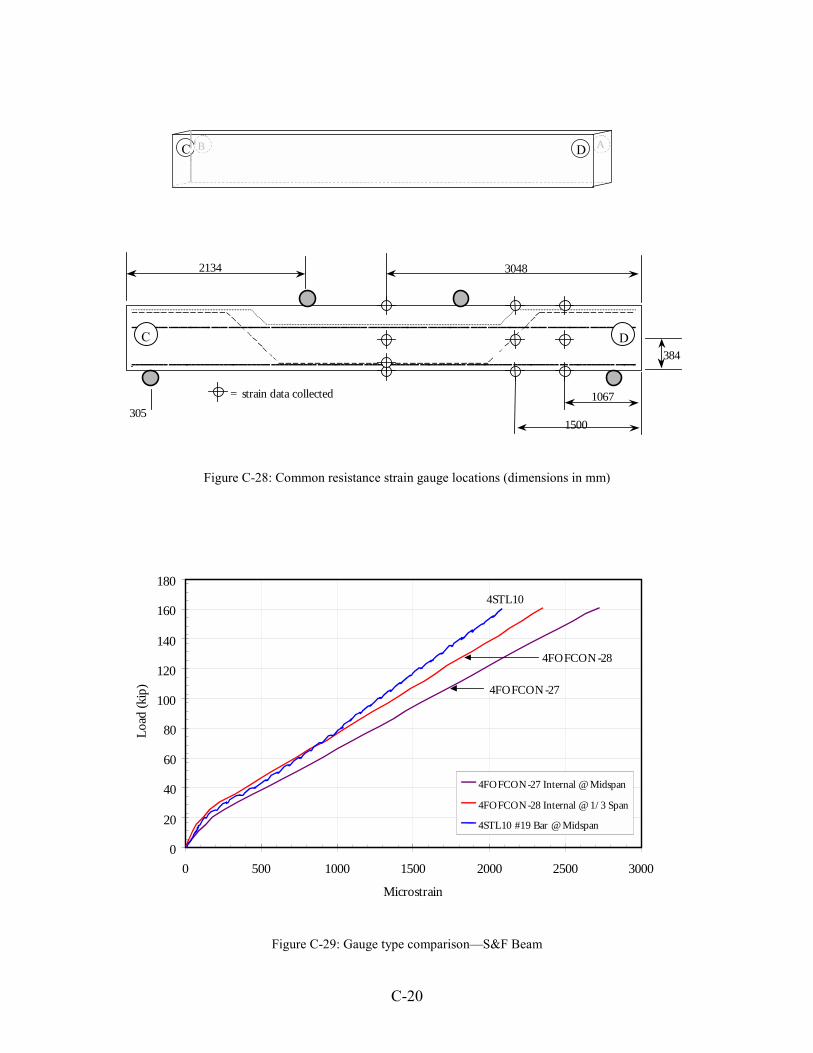
NOTE: Figures C-1 to C-27 show deflection and strain results. Table C-1, in conjunction withFigure C-28, provides a key to the strain gauge labels. Figures C-29 to C-32 show the resultsfrom the fiber optic strain gauges. Table C-2, in conjunction with Figure C-33, provides a key tothe fiber optic strain gauge labels. The strain gauge data is followed by a discussion of the fiberoptic strain gauge data and an analysis of the crack patterns.
0
20
40
60
80
100
120
140
160
180
0.00 0.20 0.40 0.60 0.80 1.00 1.20 1.40 1.60 1.80 2.00
Deflection (in)
Load
(kip
)
0.0 0.2 0.4 0.6 0.8 1.0 1.2 1.4 1.6 1.8 2.0
Deflection Ratio
MidspanAverage DCDT 1 & 2Ratio-- Midspan / Average DCDT 1 & 2
Midspan
Figure C-1: Control Beam deflection characteristics

C-3
0
20
40
60
80
100
120
-1000 -800 -600 -400 -200 0 200
Microstrain
Load
(kip
)
1CON16 Top @ 1067mm1CON5 Midheight @ 1067mm1CON10 Bottom @ 1067mm
1CON16
1CON10
1CON5
Figure C-2: Control Beam strain at 1067 mm from beam end
0
20
40
60
80
100
120
-2000 -1500 -1000 -500 0 500 1000 1500 2000
Microstrain
Load
(kip
)
1CON15 Top @ 1500mm1STL4 #16 Bar @ 1500mm1STL7 #22 Bar @ 1500mm
1CON15 1STL7
1STL4
Figure C-3: Control Beam strain at 1500 mm from beam end

C-4
0
20
40
60
80
100
120
-2000 -1500 -1000 -500 0 500
Microstrain
Load
(kip
)
1CON13 Top @ midspan1CON15 Top @ 1500mm1CON16 Top @ 1067mm
1CON13 1CON161CON15
Figure C-4: Control Beam compressive strain comparison
0
20
40
60
80
100
120
-500 0 500 1000 1500 2000
Microstrain
Load
(kip
)
1STL18 #22 bar @ midspan1STL7 #22 Bar @ 1500mm1STL8 #22 Bar @ 1067mm
1STL18
1STL7
1STL8
Figure C-5: Control Beam tensile strain comparison

C-5
0
20
40
60
80
100
120
-2000 -1000 0 1000 2000 3000 4000
Microstrain
Load
(kip
)
1CON6 Midheight @ 1500mm1STL3 Bent Bar @ 1500mm
1STL3(Failed)
1CON6
Evidence ofShear CrackFormation
Figure C-6: Control Beam evidence of shear crack formation
0
20
40
60
80
100
120
-2000 -1500 -1000 -500 0 500Microstrain
Load
(kip
)
1STL1 Bent Bar @ 1067mm
1CON15 Top @ 1500mm
1STL1
Indication ofShear Crack
Propagation &Beam Failure
1CON15
Figure C-7: Control Beam failure by shear crack formation
C-6
0
20
40
60
80
100
120
140
160
180
0.00 0.20 0.40 0.60 0.80 1.00 1.20 1.40 1.60 1.80 2.00Deflection (in)
Load
(kip
)0.0 0.2 0.4 0.6 0.8 1.0 1.2 1.4 1.6 1.8 2.0
Deflection Ratio
MidspanAverage DCDT 1 & 2Ratio-- Midspan / Average DCDT 1 & 2
Midspan
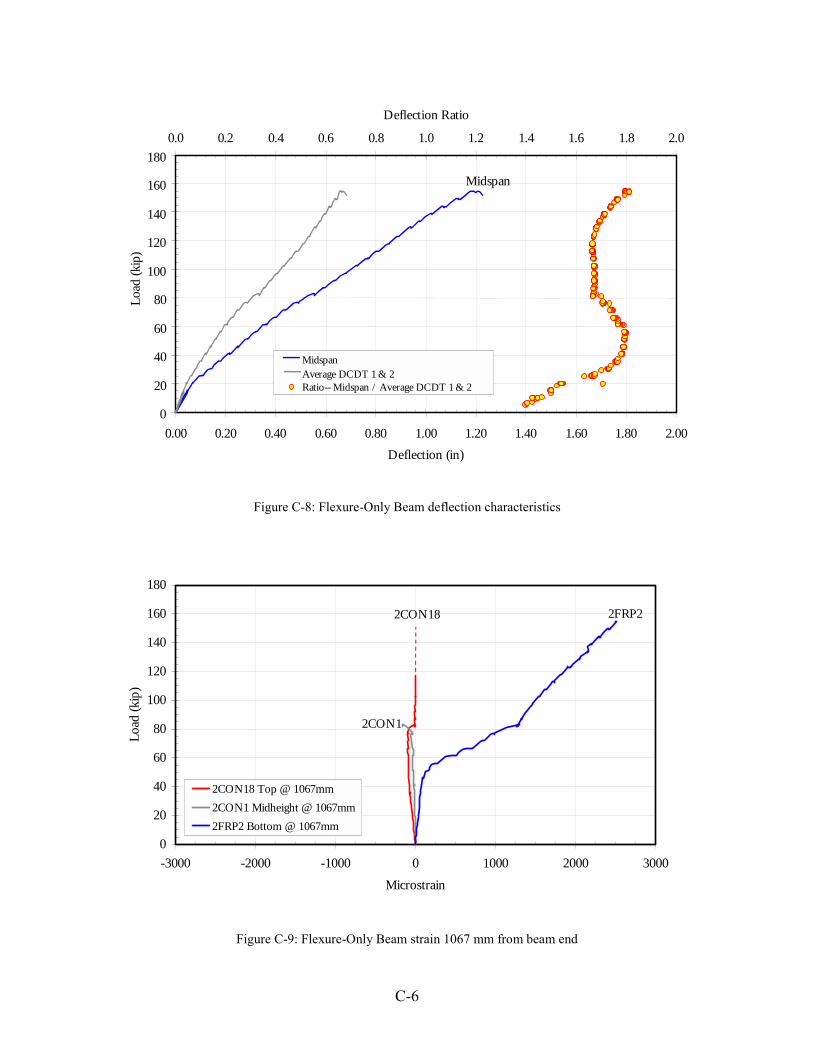
Figure C-8: Flexure-Only Beam deflection characteristics
0
20
40
60
80
100
120
140
160
180
-3000 -2000 -1000 0 1000 2000 3000
Microstrain
Load
(kip
)
2CON18 Top @ 1067mm2CON1 Midheight @ 1067mm2FRP2 Bottom @ 1067mm
2CON1
2FRP22CON18
Figure C-9: Flexure-Only Beam strain 1067 mm from beam end

C-7
0
20
40
60
80
100
120
140
160
180
-3000 -2000 -1000 0 1000 2000 3000
Microstrain
Load
(kip
)
2CON17 Top @ 1500mm
2CON19 Midheight @ 1500mm
2FRP3 Bottom @ 1500mm
2CON17 2FRP3
2CON19
Figure C-10: Flexure-Only Beam strain 1500 mm from beam end
0
20
40
60
80
100
120
140
160
180
-3000 -2500 -2000 -1500 -1000 -500 0 500
Microstrain
Load
(kip
)
2CON13 Top @ Midspan2CON17 Top @ 1500mm2CON18 Top @ 1067mm
2CON172CON13 2CON18
Figure C-11: Flexure-Only Beam compressive strain comparison
C-8
0
20
40
60
80
100
120
140
160
180
-1000 -500 0 500 1000 1500 2000 2500 3000
Microstrain
Load
(kip
)
2FRP10 Bottom @ Midspan2FRP3 Bottom @ 1500mm2FRP2 Bottom @ 1067mm
2FRP3 2FRP22FRP10
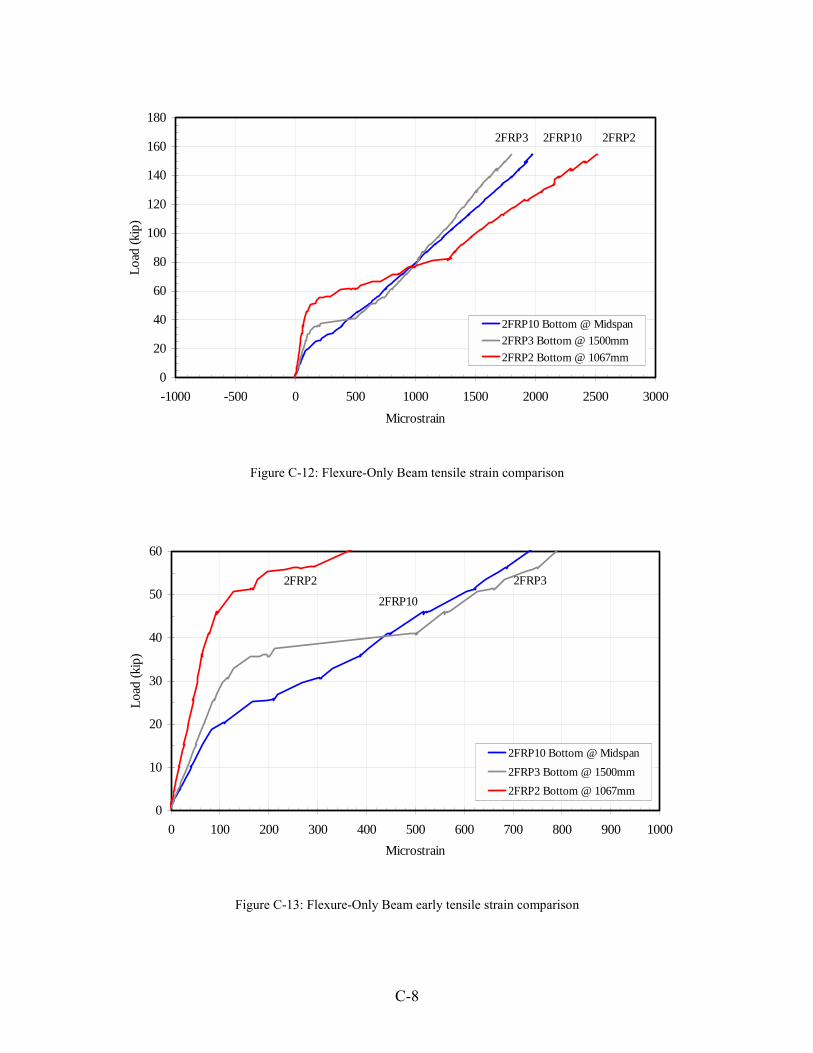
Figure C-12: Flexure-Only Beam tensile strain comparison
0
10
20
30
40
50
60
0 100 200 300 400 500 600 700 800 900 1000Microstrain
Load
(kip
)
2FRP10 Bottom @ Midspan2FRP3 Bottom @ 1500mm2FRP2 Bottom @ 1067mm
2FRP32FRP2
2FRP10
Figure C-13: Flexure-Only Beam early tensile strain comparison

C-9
0
20
40
60
80
100
120
140
160
180
-50 0 50 100 150 200 250 300 350 400 450 500
Microstrain
Load
(kip
)2SHR16 High Shear Comparison2SHR14 Midheight Shear Comparison2SHR15 Low Shear Comparison
Low gauge fails
High gauge
Mid gauge
Figure C-14: Flexure-Only Beam strain for comparison with fiber optic strain gauges
0
10
20
30
40
50
60
70
80
90
100
-50 100 250 400 550 700 850 1000 1150 1300 1450
Microstrain
Load
(kip
)
2STL5 Bent Bar @ 1500mm, A-D End2STL9 Bent Bar @ 1500mm, B-C End2FRP2 Bottom @ 1067mm2FRP3 Bottom @ 1500mm2SHR15 Low Shear Comparison
2SHR15
2FRP32STL9
2FRP2
2STL5
Shear Crack Affected
Figure C-15: Flexure-Only Beam evidence of shear crack formation

C-10
0
20
40
60
80
100
120
140
160
180
0 200 400 600 800 1000 1200 1400 1600Microstrain
Load
(kip
)
2STL5 Bent Bar @ 1500mm, A-D End
2STL5
Figure C-16: Flexure-Only Beam failure by shear crack formation
0
20
40
60
80
100
120
140
160
180
0.00 0.20 0.40 0.60 0.80 1.00 1.20 1.40 1.60 1.80 2.00
Deflection (in)
Load
(kip
)
0.0 0.5 1.0 1.5 2.0 2.5
Deflection Ratio
MidspanAverage DCDT 1 & 2Ratio-- Midspan / Average DCDT 1 & 2
Midspan
Extrapolated
Figure C-16: Shear-Only Beam deflection characteristics
C-11
0
20
40
60
80
100
120
140
160
180
-3000 -2000 -1000 0 1000 2000 3000
Microstrain
Load
(kip
)
3CON2 Top @ 10673GFRP15 Midheight @ 10673GFRP18 Bottom @ 1067
3CON2 3GFRP18
3GFRP15
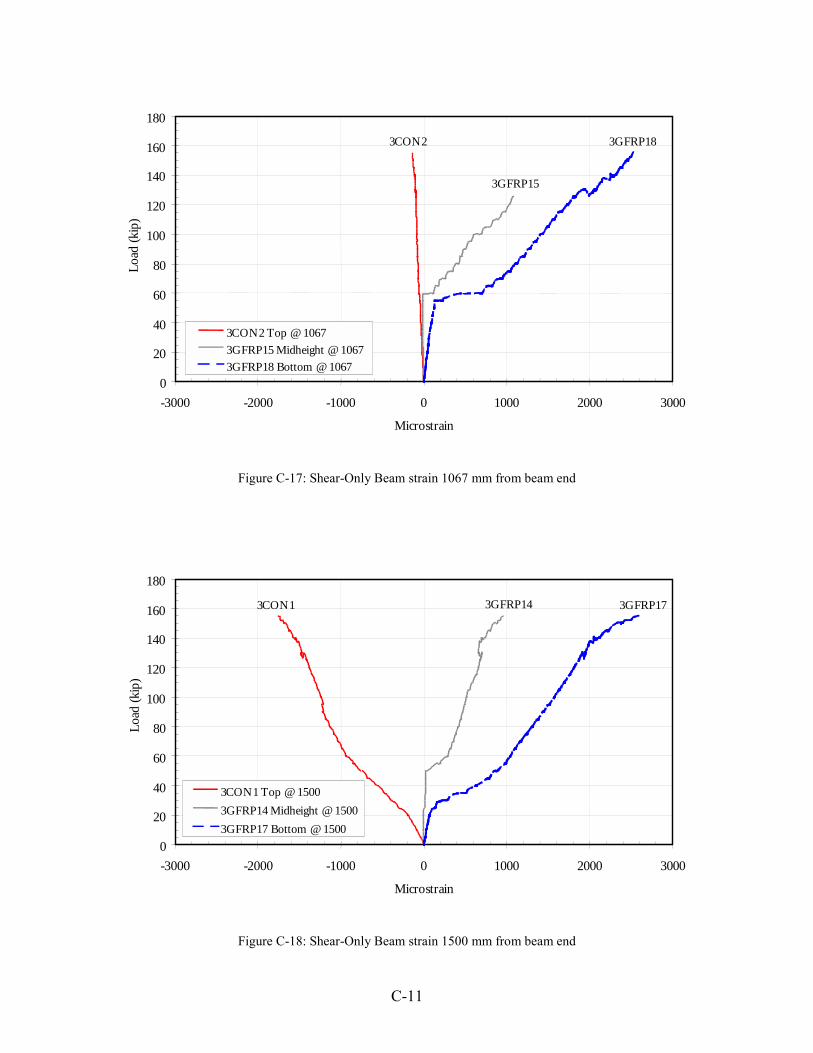
Figure C-17: Shear-Only Beam strain 1067 mm from beam end
0
20
40
60
80
100
120
140
160
180
-3000 -2000 -1000 0 1000 2000 3000
Microstrain
Load
(kip
)
3CON1 Top @ 15003GFRP14 Midheight @ 15003GFRP17 Bottom @ 1500
3CON1 3GFRP173GFRP14
Figure C-18: Shear-Only Beam strain 1500 mm from beam end

C-12
0
20
40
60
80
100
120
140
160
180
-3000 -2500 -2000 -1500 -1000 -500 0Microstrain
Load
(kip
)
3CON13 Top @ Midspan3CON1 Top @ 15003GFRP4 Near Top, 76mm under load point3CON2 Top @ 10673CON5 Near midspan 76mm from top
3CON23CON133CON1
3GFRP4
3CON5
Figure C-19: Shear-only beam compressive strain comparison
0
20
40
60
80
100
120
140
160
180
-500 0 500 1000 1500 2000 2500 3000
Microstrain
Load
(kip
)
3GFRP9 Bottom on GFRP 203mm from midspan3GFRP17 Bottom @ 15003GFRP18 Bottom @ 10673GFRP16 Near support, 76mm from bottom3STL7 #22 Bar @ Midspan
3STL7
3GFRP18
3GFRP173GFRP93GFRP16
Figure C-20: Shear-Only Beam tensile strain comparison
C-13
0
20
40
60
80
100
120
140
160
180
0 1000 2000 3000 4000 5000 6000 7000 8000 9000 10000Microstrain
Load
(kip
)
3STL7 #22 Bar @ Midspan
3STL8 #19 Bar @ MidspanInitial Cracking
Steel Yielding
3STL7
3STL8
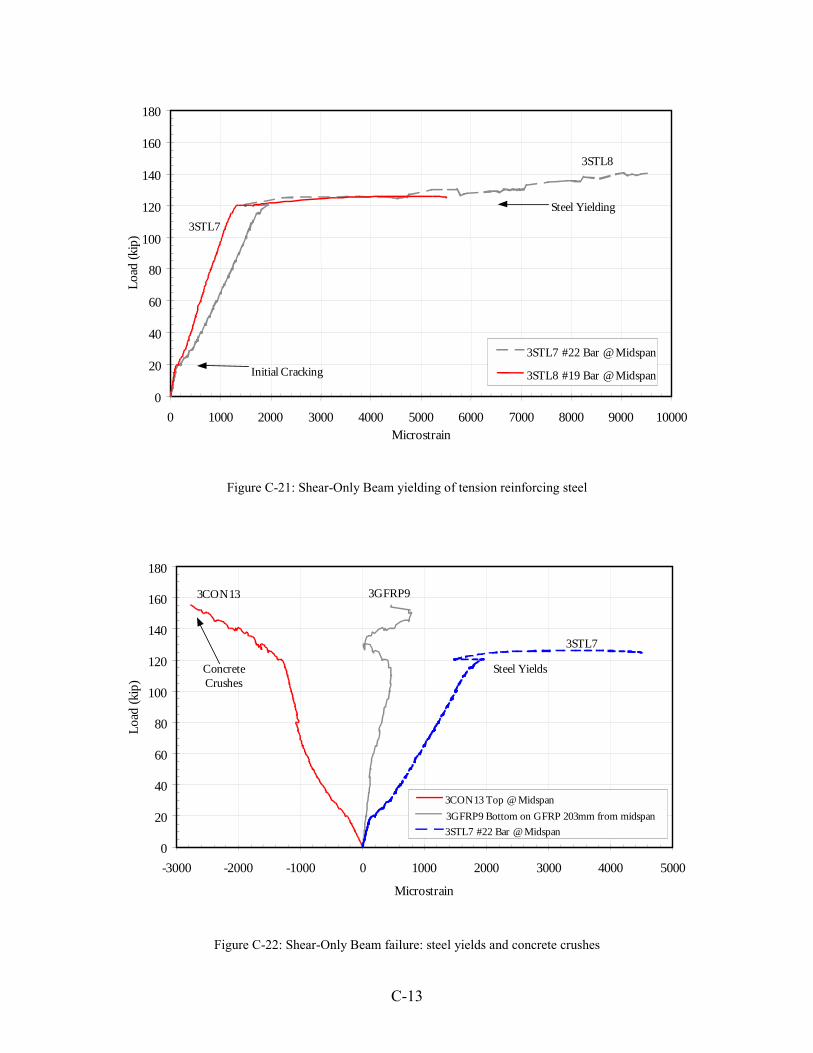
Figure C-21: Shear-Only Beam yielding of tension reinforcing steel
0
20
40
60
80
100
120
140
160
180
-3000 -2000 -1000 0 1000 2000 3000 4000 5000
Microstrain
Load
(kip
)
3CON13 Top @ Midspan3GFRP9 Bottom on GFRP 203mm from midspan3STL7 #22 Bar @ Midspan
3STL7
3GFRP93CON13
ConcreteCrushes
Steel Yields
Figure C-22: Shear-Only Beam failure: steel yields and concrete crushes
C-14
0
20
40
60
80
100
120
140
160
180
0.00 0.20 0.40 0.60 0.80 1.00 1.20 1.40 1.60 1.80 2.00
Deflection (in)
Load
(kip
)0.0 0.2 0.4 0.6 0.8 1.0 1.2 1.4 1.6 1.8 2.0
MidspanAverage DCDT 1 & 2Ratio--Midspan / Average DCDT 1 & 2
Midspan
Deflection Ratio
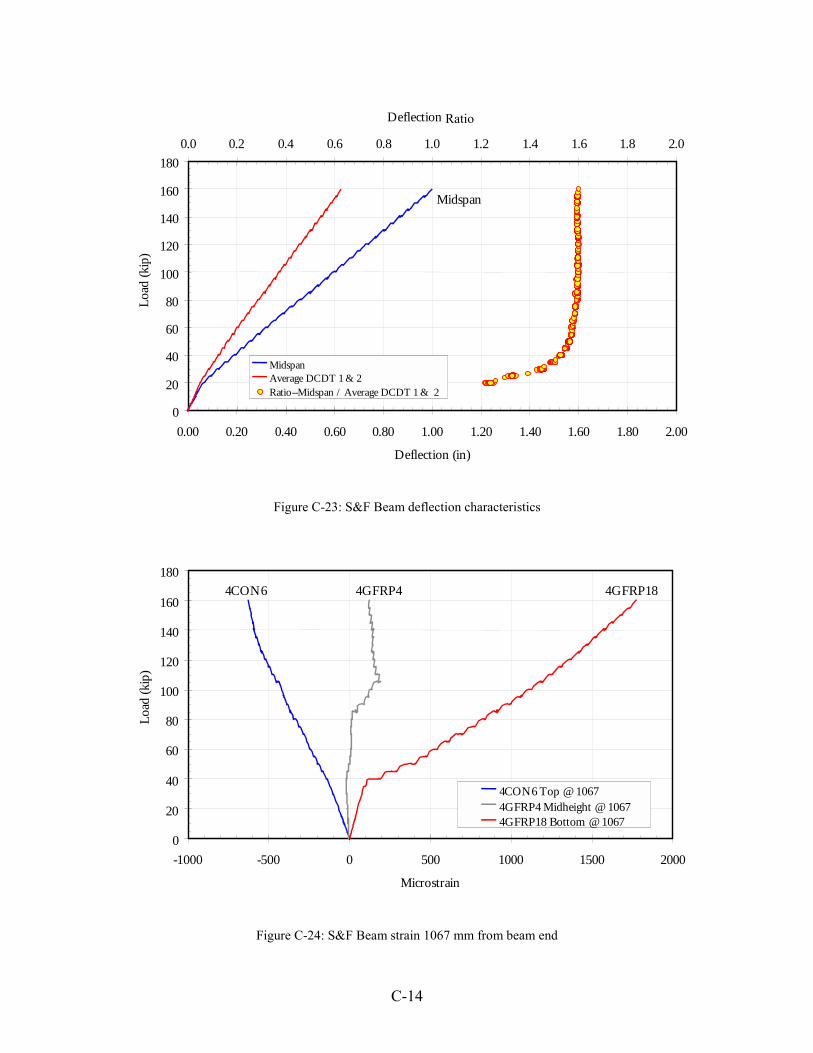
Figure C-23: S&F Beam deflection characteristics
0
20
40
60
80
100
120
140
160
180
-1000 -500 0 500 1000 1500 2000
Microstrain
Load
(kip
)
4CON6 Top @ 10674GFRP4 Midheight @ 10674GFRP18 Bottom @ 1067
4CON6 4GFRP4 4GFRP18
Figure C-24: S&F Beam strain 1067 mm from beam end
C-15
0
20
40
60
80
100
120
140
160
180
-1200 -1000 -800 -600 -400 -200 0 200
Microstrain
Load
(kip
)
4CON3 Top @ 1500
4GFRP1 Midheight @ 1500
4CON3 4GFRP1
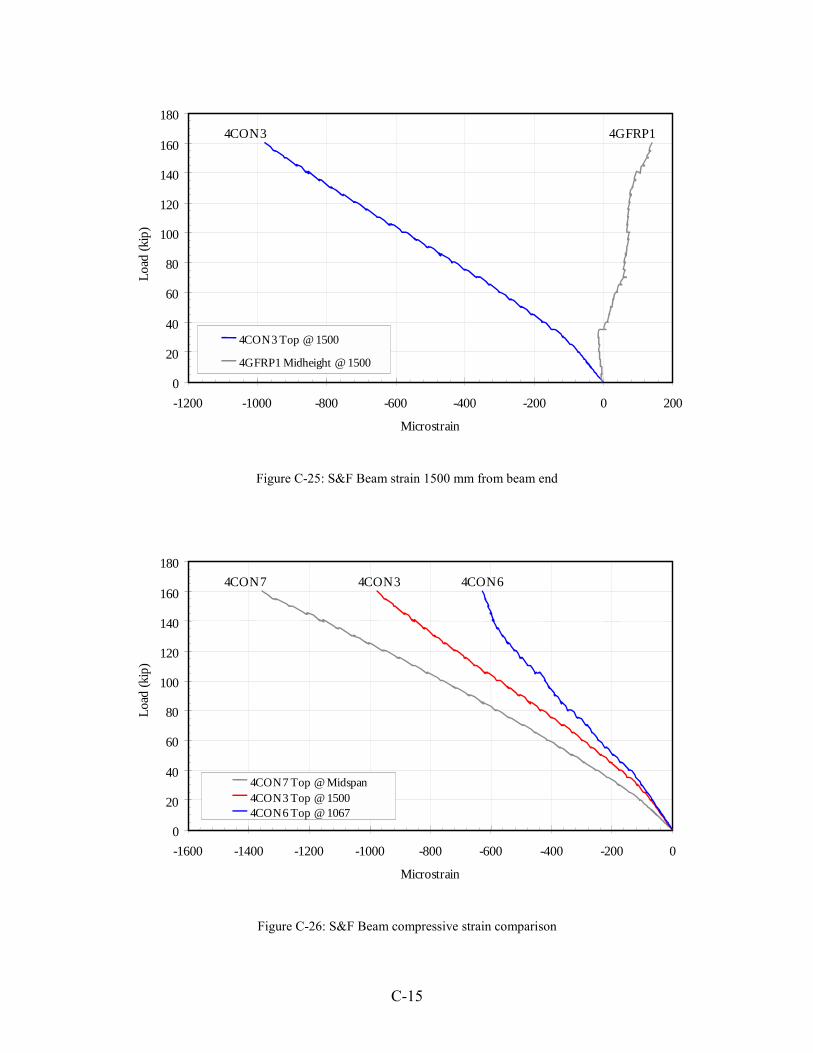
Figure C-25: S&F Beam strain 1500 mm from beam end
0
20
40
60
80
100
120
140
160
180
-1600 -1400 -1200 -1000 -800 -600 -400 -200 0
Microstrain
Load
(kip
)
4CON7 Top @ Midspan4CON3 Top @ 15004CON6 Top @ 1067
4CON7 4CON3 4CON6
Figure C-26: S&F Beam compressive strain comparison
C-16
0
20
40
60
80
100
120
140
160
180
-500 0 500 1000 1500 2000 2500 3000Microstrain
Load
(kip
)
4CFRP14 Bottom @ midspan4STL9 #19 Bar @ midspan4CFRP17 Near bottom @ midspan4GFRP18 Bottom @ 1067
4CFRP144CFRP17 4STL9
4GFRP18
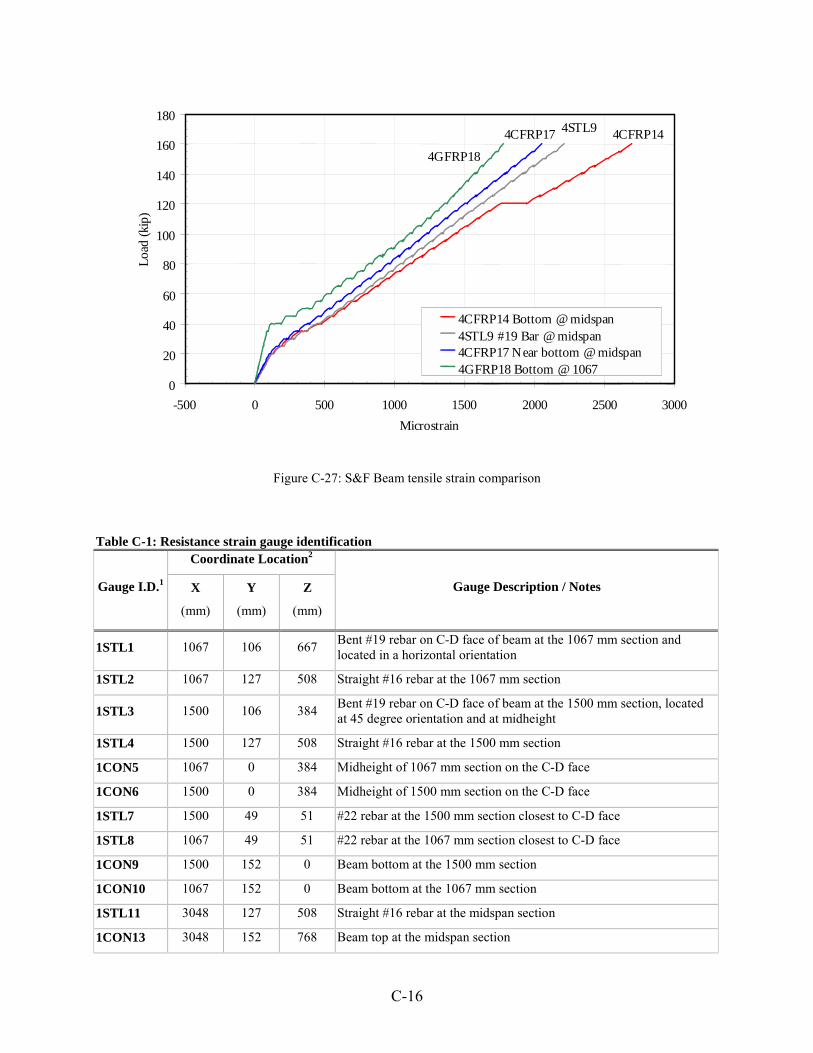
Figure C-27: S&F Beam tensile strain comparison
Table C-1: Resistance strain gauge identificationCoordinate Location2
Gauge I.D.1 X
(mm)
Y
(mm)
Z
(mm)
Gauge Description / Notes
1STL1 1067 106 667 Bent #19 rebar on C-D face of beam at the 1067 mm section andlocated in a horizontal orientation
1STL2 1067 127 508 Straight #16 rebar at the 1067 mm section
1STL3 1500 106 384 Bent #19 rebar on C-D face of beam at the 1500 mm section, locatedat 45 degree orientation and at midheight
1STL4 1500 127 508 Straight #16 rebar at the 1500 mm section
1CON5 1067 0 384 Midheight of 1067 mm section on the C-D face
1CON6 1500 0 384 Midheight of 1500 mm section on the C-D face
1STL7 1500 49 51 #22 rebar at the 1500 mm section closest to C-D face
1STL8 1067 49 51 #22 rebar at the 1067 mm section closest to C-D face
1CON9 1500 152 0 Beam bottom at the 1500 mm section
1CON10 1067 152 0 Beam bottom at the 1067 mm section
1STL11 3048 127 508 Straight #16 rebar at the midspan section
1CON13 3048 152 768 Beam top at the midspan section

C-17
Coordinate Location2
Gauge I.D.1 X
(mm)
Y
(mm)
Z
(mm)
Gauge Description / Notes
1CON14 3048 0 384 Midheight at the midspan section
1CON15 1500 152 768 Beam top at the 1500 mm section
1CON16 1067 152 768 Beam top at the 1067 mm section
1CON17 3048 152 0 Beam bottom at the midspan section
1STL18 3048 49 51 #22 rebar at the midspan section closest to C-D face
2CON1 1067 0 384 Beam midheight at the 1067 mm section
2FRP2 1067 152 -tFRP3 Beam bottom at the 1067 mm section
2FRP3 1500 152 -tFRP Beam bottom at the 1500 mm section
2STL5 1500 106 384 Bent #19 rebar on the A-D end at the midheight of the 1500 mmsection (closest to C-D face, oriented at 45 degrees)
2STL7 3048 127 508 Straight #16 rebar at the midspan section
2FRP8 3048 -tFRP 102-tFRPSide of beam at the midspan section located 102 mm from the bottomface of the CFRP surface
2STL9 4597 106 384 Bent #19 rebar at the midheight 4597mm from the B-C end (closes toC-D face, oriented at 45 degrees)
2FRP10 3048 152 -tFRP Beam bottom at the midspan section
2STL11 3048 152 51 #22 rebar at the midspan section (center bar of the three #22 rebars)
2CON12 3048 0 384 Beam midheight at the midspan section
2CON13 3048 152 768 Beam top at the midspan section
2SHRMID14
Middle gauge of 3 used for comparison to fiber optic shear gauges, seedetails
2SHRLOW15
Low gauge of 3 used for comparison to fiber optic shear gauges, seedetails
2SHRHIGH16
High gauge of 3 used for comparison to fiber optic shear gauges, seedetails
2CON17 1500 152 768 Beam top at the 1500 mm section
2CON18 1067 152 768 Beam top at the 1067 mm section
2CON19 1500 0 384 Beam midheight at the 1500 mm section
3CON1 1500 152 768 Beam top at the 1500 mm section
3CON2 1067 152 768 Beam top at the 1067 mm section
3STL3 1500 106 384 Bent #19 rebar on the A-D end at the midheight of the 1500 mmsection (closest to C-D face, oriented at 45 degrees)
3FRP4 2134 -tFRP 692Located 76 mm from the top surface of beam under the load point onthe C-D face and D end, located on the FRP surface and orientedhorizontal
C-18
Coordinate Location2
Gauge I.D.1 X
(mm)
Y
(mm)
Z
(mm)
Gauge Description / Notes
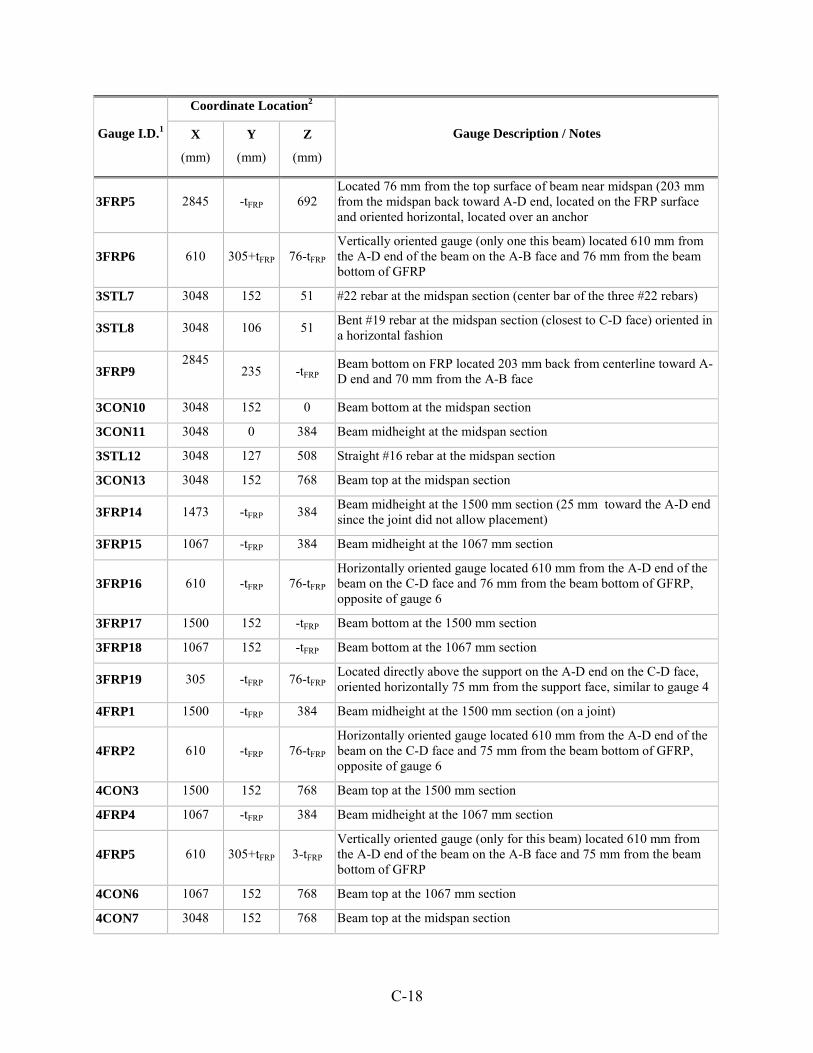
3FRP5 2845 -tFRP 692Located 76 mm from the top surface of beam near midspan (203 mmfrom the midspan back toward A-D end, located on the FRP surfaceand oriented horizontal, located over an anchor
3FRP6 610 305+tFRP 76-tFRP
Vertically oriented gauge (only one this beam) located 610 mm fromthe A-D end of the beam on the A-B face and 76 mm from the beambottom of GFRP
3STL7 3048 152 51 #22 rebar at the midspan section (center bar of the three #22 rebars)
3STL8 3048 106 51 Bent #19 rebar at the midspan section (closest to C-D face) oriented ina horizontal fashion
3FRP92845
235 -tFRPBeam bottom on FRP located 203 mm back from centerline toward A-D end and 70 mm from the A-B face
3CON10 3048 152 0 Beam bottom at the midspan section
3CON11 3048 0 384 Beam midheight at the midspan section
3STL12 3048 127 508 Straight #16 rebar at the midspan section
3CON13 3048 152 768 Beam top at the midspan section
3FRP14 1473 -tFRP 384 Beam midheight at the 1500 mm section (25 mm toward the A-D endsince the joint did not allow placement)
3FRP15 1067 -tFRP 384 Beam midheight at the 1067 mm section
3FRP16 610 -tFRP 76-tFRP
Horizontally oriented gauge located 610 mm from the A-D end of thebeam on the C-D face and 76 mm from the beam bottom of GFRP,opposite of gauge 6
3FRP17 1500 152 -tFRP Beam bottom at the 1500 mm section
3FRP18 1067 152 -tFRP Beam bottom at the 1067 mm section
3FRP19 305 -tFRP 76-tFRPLocated directly above the support on the A-D end on the C-D face,oriented horizontally 75 mm from the support face, similar to gauge 4
4FRP1 1500 -tFRP 384 Beam midheight at the 1500 mm section (on a joint)
4FRP2 610 -tFRP 76-tFRP
Horizontally oriented gauge located 610 mm from the A-D end of thebeam on the C-D face and 75 mm from the beam bottom of GFRP,opposite of gauge 6
4CON3 1500 152 768 Beam top at the 1500 mm section
4FRP4 1067 -tFRP 384 Beam midheight at the 1067 mm section
4FRP5 610 305+tFRP 3-tFRP
Vertically oriented gauge (only for this beam) located 610 mm fromthe A-D end of the beam on the A-B face and 75 mm from the beambottom of GFRP
4CON6 1067 152 768 Beam top at the 1067 mm section
4CON7 3048 152 768 Beam top at the midspan section
C-19
Coordinate Location2
Gauge I.D.1 X
(mm)
Y
(mm)
Z
(mm)
Gauge Description / Notes
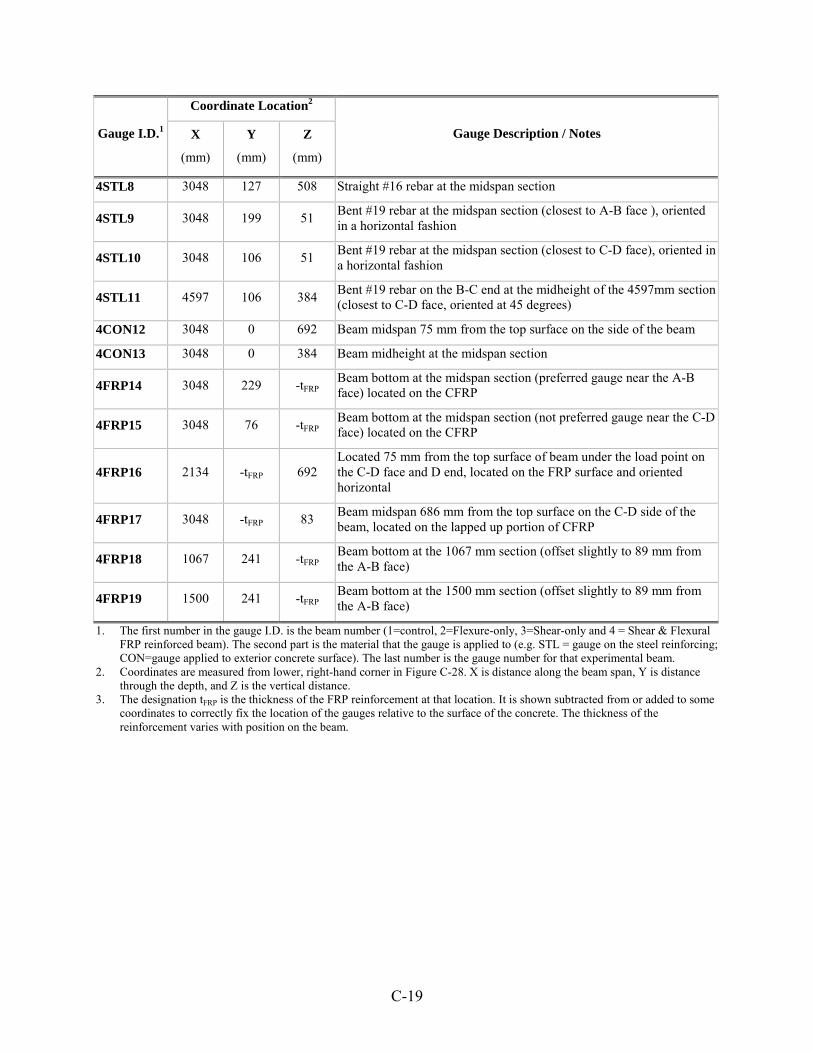
4STL8 3048 127 508 Straight #16 rebar at the midspan section
4STL9 3048 199 51 Bent #19 rebar at the midspan section (closest to A-B face ), orientedin a horizontal fashion
4STL10 3048 106 51 Bent #19 rebar at the midspan section (closest to C-D face), oriented ina horizontal fashion
4STL11 4597 106 384 Bent #19 rebar on the B-C end at the midheight of the 4597mm section(closest to C-D face, oriented at 45 degrees)
4CON12 3048 0 692 Beam midspan 75 mm from the top surface on the side of the beam
4CON13 3048 0 384 Beam midheight at the midspan section
4FRP14 3048 229 -tFRPBeam bottom at the midspan section (preferred gauge near the A-Bface) located on the CFRP
4FRP15 3048 76 -tFRPBeam bottom at the midspan section (not preferred gauge near the C-Dface) located on the CFRP
4FRP16 2134 -tFRP 692Located 75 mm from the top surface of beam under the load point onthe C-D face and D end, located on the FRP surface and orientedhorizontal
4FRP17 3048 -tFRP 83 Beam midspan 686 mm from the top surface on the C-D side of thebeam, located on the lapped up portion of CFRP
4FRP18 1067 241 -tFRPBeam bottom at the 1067 mm section (offset slightly to 89 mm fromthe A-B face)
4FRP19 1500 241 -tFRPBeam bottom at the 1500 mm section (offset slightly to 89 mm fromthe A-B face)
1. The first number in the gauge I.D. is the beam number (1=control, 2=Flexure-only, 3=Shear-only and 4 = Shear & FlexuralFRP reinforced beam). The second part is the material that the gauge is applied to (e.g. STL = gauge on the steel reinforcing;CON=gauge applied to exterior concrete surface). The last number is the gauge number for that experimental beam.
2. Coordinates are measured from lower, right-hand corner in Figure C-28. X is distance along the beam span, Y is distancethrough the depth, and Z is the vertical distance.
3. The designation tFRP is the thickness of the FRP reinforcement at that location. It is shown subtracted from or added to somecoordinates to correctly fix the location of the gauges relative to the surface of the concrete. The thickness of thereinforcement varies with position on the beam.
C-20
AC DB
305
2134
384
1067= strain data collected
1500
3048
C D
Figure C-28: Common resistance strain gauge locations (dimensions in mm)
0
20
40
60
80
100
120
140
160
180
0 500 1000 1500 2000 2500 3000
Microstrain
Load
(kip
)
4FOFCON-27 Internal @ Midspan
4FOFCON-28 Internal @ 1/3 Span
4STL10 #19 Bar @ Midspan
4FOFCON-28
4FOFCON-27
4STL10
Figure C-29: Gauge type comparison—S&F Beam

C-21
0
20
40
60
80
100
120
140
160
180
0 500 1000 1500 2000 2500 3000
Microstrain
Load
(kip
s)
4FOFFRP-26 External @ 1/3 Span
4FOFCON-27 Internal @ Midspan4FOFCON-28 Internal @ 1/3 Span
4FOFCON-29 External @ Midspan
4FOFFRP-26
4FOFCON-27
4FOFCON-284FOFCON-28
Figure C-30: Strain from flexural fiber optic strain gauges—S&F Beam
0
20
40
60
80
100
120
140
160
180
0 500 1000 1500 2000 2500 3000
Microstrain
Load
(kip
)
4FOSCON-02 Shear Gauge under FRP
4FOSCON-03 Shear Gauge under FRP4FOSCON-04 Shear Gauge under FRP
4FOSCON-05 Shear Gauge under FRP
4FOSCON-034FOSCON-02
4FOSCON-04
4FOSCON-05
Figure C-31: Strain from shear fiber optic strain gauges embedded in concrete—S&F Beam
C-22
0
20
40
60
80
100
120
140
160
180
0 500 1000 1500 2000 2500 3000Microstrain
Load
(kip
)
4FOSCON-02 Shear Gauge under FRP
4FOSFRP-12 Shear Gauge on top of FRP4FOSCON-03 Shear Gauge under FRP
4FOSFRP-F5 Shear Gauge on top of FRP
4FOSFRP-F5
4FOSCON-024FOSFRP-12
4FOSCON-03
Gauge 2 & 12 at samebeam location.
Gauge 3 & 5 at samebeam location.
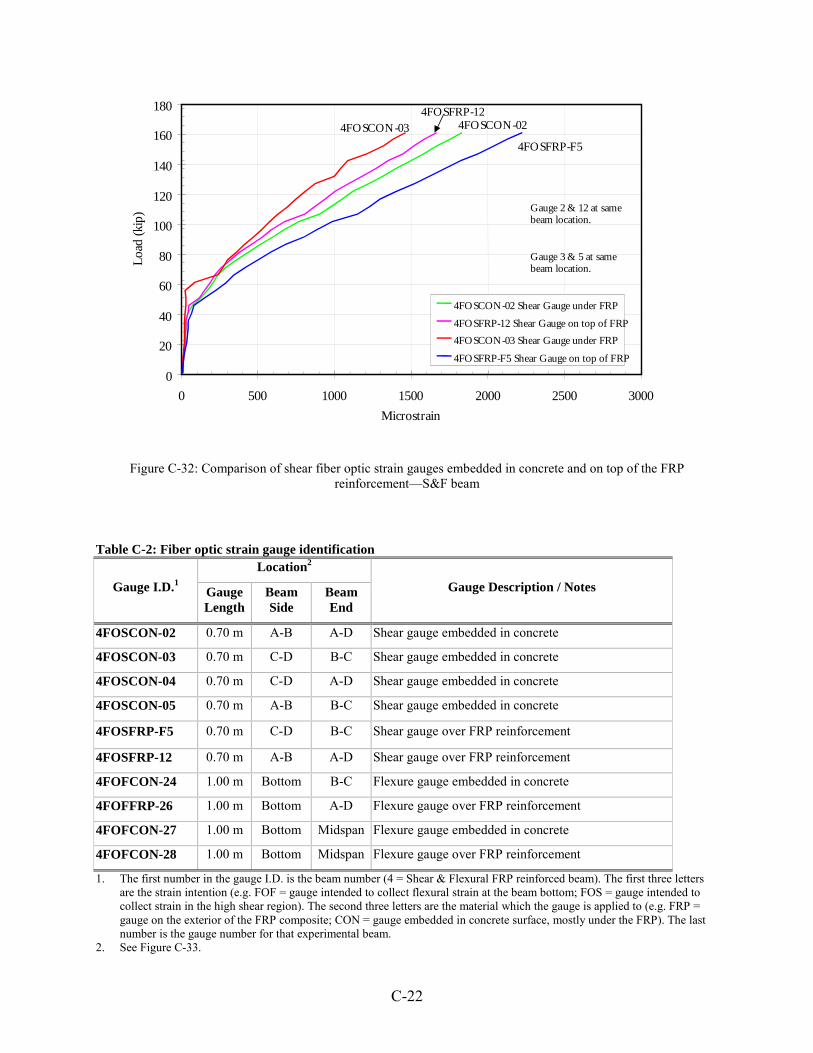
Figure C-32: Comparison of shear fiber optic strain gauges embedded in concrete and on top of the FRPreinforcement—S&F beam
Table C-2: Fiber optic strain gauge identificationLocation2
Gauge I.D.1 GaugeLength
BeamSide
BeamEnd
Gauge Description / Notes
4FOSCON-02 0.70 m A-B A-D Shear gauge embedded in concrete
4FOSCON-03 0.70 m C-D B-C Shear gauge embedded in concrete
4FOSCON-04 0.70 m C-D A-D Shear gauge embedded in concrete
4FOSCON-05 0.70 m A-B B-C Shear gauge embedded in concrete
4FOSFRP-F5 0.70 m C-D B-C Shear gauge over FRP reinforcement
4FOSFRP-12 0.70 m A-B A-D Shear gauge over FRP reinforcement
4FOFCON-24 1.00 m Bottom B-C Flexure gauge embedded in concrete
4FOFFRP-26 1.00 m Bottom A-D Flexure gauge over FRP reinforcement
4FOFCON-27 1.00 m Bottom Midspan Flexure gauge embedded in concrete
4FOFCON-28 1.00 m Bottom Midspan Flexure gauge over FRP reinforcement
1. The first number in the gauge I.D. is the beam number (4 = Shear & Flexural FRP reinforced beam). The first three lettersare the strain intention (e.g. FOF = gauge intended to collect flexural strain at the beam bottom; FOS = gauge intended tocollect strain in the high shear region). The second three letters are the material which the gauge is applied to (e.g. FRP =gauge on the exterior of the FRP composite; CON = gauge embedded in concrete surface, mostly under the FRP). The lastnumber is the gauge number for that experimental beam.
2. See Figure C-33.

C-23
Typical FRP Reinforced BeamA BD C
Beam
End
Beam Bottom6096
762
610Typical Shear Gauge (on beam side)
Typical Flexure Gauge (on beam bottom, 3 total)
Figure C-33: Fiber optic strain gauge locations (dimensions in mm)
Crack Patterns
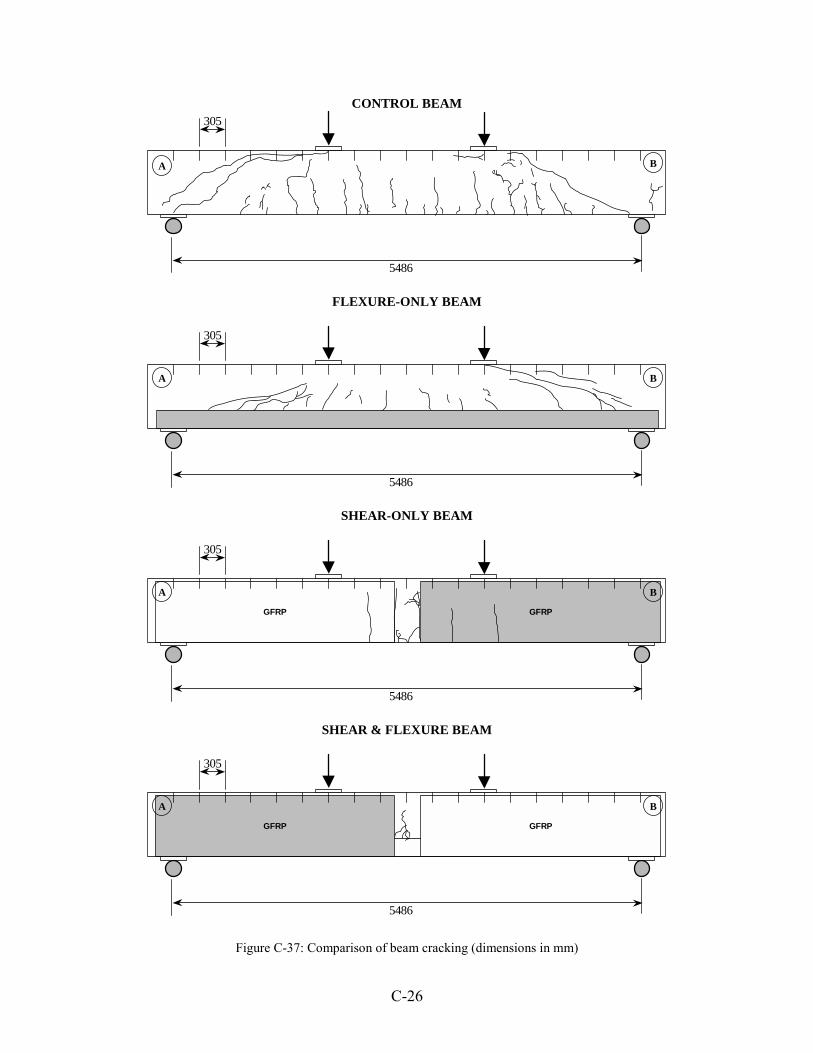
Flexural cracks are located near the midspan and are oriented nearly perpendicular to the longaxis of the beam. Shear cracks are diagonal cracks that appear in the shear span (i.e. between theload and support points). A more appropriate term is diagonal tension cracks or inclinedcracking. These cracks are the result of combined bending and shear forces realigning theprincipal tension direction (recall Mohr’s circle of stress). The cracks only occur when bendingforces are restrained and inclined cracking is unrestrained. A diagonal tension crack thatpropagates through the entire beam results in shear failure. Shear crack and diagonal tensioncrack are used interchangeably in the following discussion.
Cracking was thoroughly mapped in the Control and F-Only beams. The S-Only and S&F beamcracks were mostly concealed under the FRP reinforcement.
Control Beam Cracking
For this beam test, load was briefly held steady at selected load levels to document cracking.Cracking of the Control Beam followed expected behavior. Loading from zero to 15 kip (66.7kN) did not produce any notable cracking. First cracks appeared around 18 kip (80 kN) near themidspan. These flexural cracks increased in length and quantity up to approximately 60 kips(267 kN) at which time the first evidence of shear cracks was visible. The critical shear cracksdid not completely develop until near the ultimate load of 107 kip (476 kN). Critical shear crackswere fully visible on both ends of the beam. Ultimately, one crack propagated from the supportto the load point at approximately a 45o angle resulting in failure. Figure C-34 shows crackingbefore ultimate load and the diagonal tension crack responsible for failure. Both high shearregions of the beam developed shear cracks, but the critical crack occurred on the A-D end of theControl beam.
Flexure-Only Beam Cracking
Flexure-Only Beam cracking patterns were similar to the Control Beam. This similarity wasanticipated. As was observed with the Control Beam, a critical diagonal tension crack resulted in

C-24
beam collapse. This critical shear crack, shown in Fig. C-35, developed at a higher load (approx.80 kip, 356 kN) than the Control Beam. A complete assessment of cracking is not possible sincethe CFRP covered the main portion of the beam where tension cracks developed. Visible cracksduring the test were fewer in number and did not appear to propagate as high as the ControlBeam test. The shear crack that developed in the F-only Beam was visibly wider than the crackin the Control Beam. This is likely due to the additional resistance provided by the CFRPallowing extended deflection beyond the formation of the diagonal tension crack. The failingcrack formed on the B-C end of the beam.
Shear-only Beam Cracking
Very little evidence of cracking could be seen through the GFRP on the S-only beam. Whencracking did affect the glass FRP composite, it was visible as a color change (whitening of theepoxy). This is shown in Fig. C-36. These tension cracks occurred just prior to ultimate load.Since the composite is unidirectional (vertical fibers only) these vertical cracks do little to reducethe vertical shear strength provided by the FRP (unless numerous cracks cause debonding).Ultimately, the concrete at the top-midspan crushed.
Shear & Flexure Beam Cracking
The only evidence of cracking on the fully strengthened beam was at the midspan. These tensioncracks were slightly audible and visible at about 120 kip (534 kN). As the load approached themachine limit, these cracks only increased in length. Even during the second loading, crackingwas only visible at the midspan section.
A comparison of the crack patterns is shown in Figure C-37. No effort was made to size thecracks for this study.
(a) (b)
Figure C-34: Control Beam cracking (a) and crack responsible for failure (b)

C-25
Figure C-35: Diagonal tension crack responsible for failure of F-Only Beam
(a) (b)
Figure C-36: S-Only Beam (a) and flexural cracks (darkened for contrast) in GFRP near ultimate load (b)
C-26
CONTROL BEAM
A B
5486
305
FLEXURE-ONLY BEAM
B
5486
305
A
SHEAR-ONLY BEAM
GFRPGFRP
B
5486
305
A
SHEAR & FLEXURE BEAM
GFRPGFRP
B
5486
305
A
Figure C-37: Comparison of beam cracking (dimensions in mm)

C-27
Beam Failure Modes
Shear Failure of Control Beam
The Control Beam was deficient in shear as expected based on the load rating calculations shownin Appendix B. The Control Beam exhibited classical diagonal tension failure. It is possible thatthe designer/engineer of Horsetail Creek Bridge anticipated diagonal tension cracking, thusbending two of the five flexural bars through the high shear zone. It is more likely, however, thatthe bent steel was simply intended for negative moment reinforcement over the columns. Thebent bars provided minimal reinforcement once the diagonal tension crack initiated.
Shear Failure of Flexure-Only Beam
The F-Only Beam failed in shear but at a higher load than the Control Beam. Since shearreinforcement was absent, the addition of CFRP for flexure was not expected to add shearstrength. From a conventional design standpoint, horizontal structural components are not usedto resist diagonal tension cracking. Diagonal tension cracks were visible at slightly elevated loadlevels over the Control Beam. However, since the CFRP was wrapped up the sides (see Figure 2-2), the CFRP was able to equilibrate forces across the diagonal tension cracks. In addition, theCFRP also increased the beams flexural rigidity reducing the strain for any given load incomparison to the Control Beam.
The CFRP fibers were able to maintain integrity of the beam in the presence of the shear crack.Since the fiber orientation was horizontal, the vertical strain component eventually reached alevel that failed the matrix of the composite on the side of the beam. The shear cracks were thenable to propagate completely through the beam.
It would be advantageous to apply a composite with strength in two principal directions toprovide horizontal and vertical strength. The most effective resistance to diagonal tension crackswould be an FRP with its principal direction oriented orthogonal to the crack (aligned with theprincipal tension strains). The difficulty is predicting the beam response, since a composite withuniquely directional properties will be applied to a beam supposedly homogeneous and isotropic.To simplify the analysis considerably two separate systems might be applied to strengthen thebeam. One system for flexure and one for shear (i.e. one horizontal and one vertical like the weband the flange in an I-beam). For construction simplicity, a single bi-directional system withorthogonal fibers could be used.
Flexural strengthening should not be used to increase the design shear capacity (although it wasobserved to). Predictability of this behavior is not reliable. If a moment deficiency exists,moment strengthening should be performed and vice versa for shear deficiency. For design, theF-Only Beam would have the same strength as the Control Beam and less than the S-Only Beam.Experimentally, it has an equivalent strength as the S-only beam. It was experimentally studiedto examine the independent effect of flexural reinforcement with CFRP.
C-28
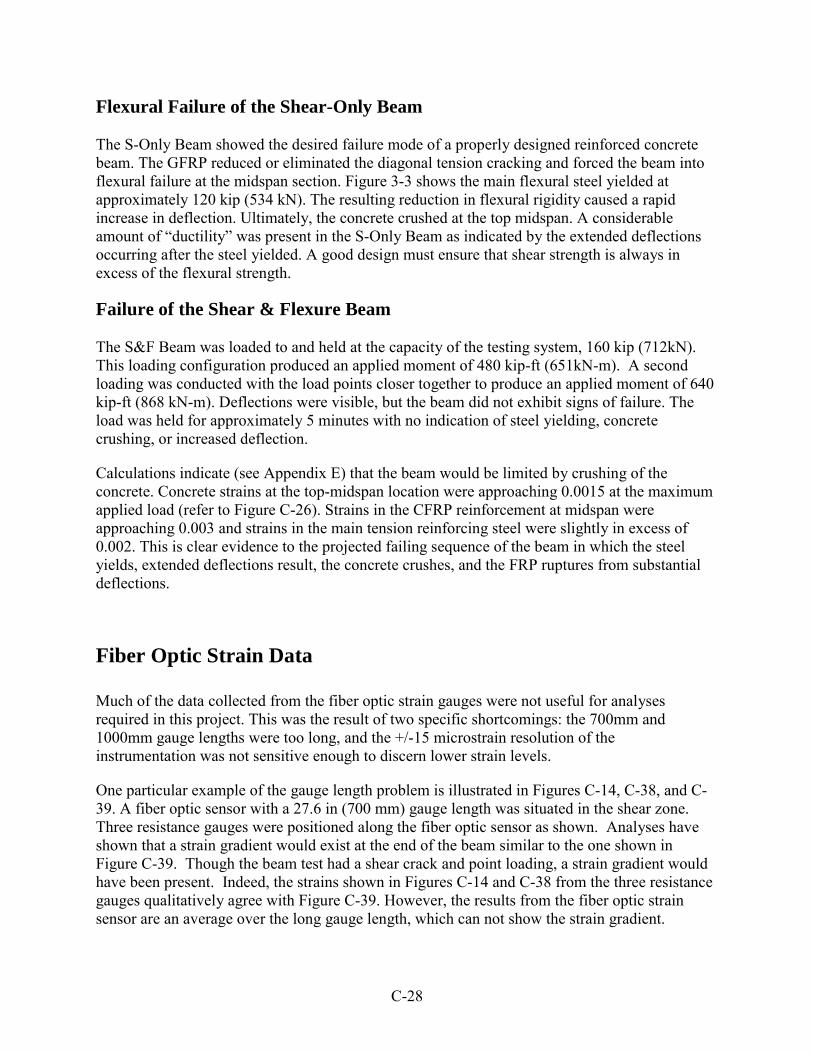
Flexural Failure of the Shear-Only Beam
The S-Only Beam showed the desired failure mode of a properly designed reinforced concretebeam. The GFRP reduced or eliminated the diagonal tension cracking and forced the beam intoflexural failure at the midspan section. Figure 3-3 shows the main flexural steel yielded atapproximately 120 kip (534 kN). The resulting reduction in flexural rigidity caused a rapidincrease in deflection. Ultimately, the concrete crushed at the top midspan. A considerableamount of “ductility” was present in the S-Only Beam as indicated by the extended deflectionsoccurring after the steel yielded. A good design must ensure that shear strength is always inexcess of the flexural strength.
Failure of the Shear & Flexure Beam
The S&F Beam was loaded to and held at the capacity of the testing system, 160 kip (712kN).This loading configuration produced an applied moment of 480 kip-ft (651kN-m). A secondloading was conducted with the load points closer together to produce an applied moment of 640kip-ft (868 kN-m). Deflections were visible, but the beam did not exhibit signs of failure. Theload was held for approximately 5 minutes with no indication of steel yielding, concretecrushing, or increased deflection.
Calculations indicate (see Appendix E) that the beam would be limited by crushing of theconcrete. Concrete strains at the top-midspan location were approaching 0.0015 at the maximumapplied load (refer to Figure C-26). Strains in the CFRP reinforcement at midspan wereapproaching 0.003 and strains in the main tension reinforcing steel were slightly in excess of0.002. This is clear evidence to the projected failing sequence of the beam in which the steelyields, extended deflections result, the concrete crushes, and the FRP ruptures from substantialdeflections.
Fiber Optic Strain Data
Much of the data collected from the fiber optic strain gauges were not useful for analysesrequired in this project. This was the result of two specific shortcomings: the 700mm and1000mm gauge lengths were too long, and the +/-15 microstrain resolution of theinstrumentation was not sensitive enough to discern lower strain levels.
One particular example of the gauge length problem is illustrated in Figures C-14, C-38, and C-39. A fiber optic sensor with a 27.6 in (700 mm) gauge length was situated in the shear zone.Three resistance gauges were positioned along the fiber optic sensor as shown. Analyses haveshown that a strain gradient would exist at the end of the beam similar to the one shown inFigure C-39. Though the beam test had a shear crack and point loading, a strain gradient wouldhave been present. Indeed, the strains shown in Figures C-14 and C-38 from the three resistancegauges qualitatively agree with Figure C-39. However, the results from the fiber optic strainsensor are an average over the long gauge length, which can not show the strain gradient.

C-29
0
20
40
60
80
100
120
140
160
180
0.000 0.001 0.002 0.003 0.004 0.005 0.006 0.007 0.008 0.009Strain
Tot
al A
pplie
d Lo
ad (k
ip)
0
89
178
267
356
445
534
623
712
801
kN
Fiber optic gauge
Bottom resistancegauge
Top and midheightresistance gauges
x
z
Fiber opticgauge
3 resistancegauges
Beam
End
Shear Crack
Figure C-38: Fiber optic vs. resistance strain gauge comparison—F-Only Beam
x
zPrincipal Compression Stress TrajectoriesBe
am E
nd
CL
Symmetry
Figure C-39: Principal compression stress trajectories for a homogeneous simple beam uniformly loaded (afterNilson, 1997)
Fiber optic strain sensors are expected to play an important role in structural monitoring. For thestrain sensors based on Bragg gratings (the type used in this project), the gauge length is easilyvaried from about 20mm to over 1500mm. In addition, recent advances in instrumentation haveincreased the sensitivity to less than one microstrain.

APPENDIX D: EQUIPMENT SPECIFICATIONS


D-1
APPENDIX D: EQUIPMENT SPECIFICATIONS
Sensor Equipment
Resistance Strain Gauges
Since strains were monitored on the internal steel reinforcement, on the concrete surface and onthe surface of the FRP an appropriate gauge needed to be selected. To meet the needs ofuniformity and economy, wire resistance gauges of 60-mm “active” length were chosen. Theseconcrete-specific gauges were of sufficient length to integrate across aggregate non-uniformitieson the beam surface. After adequate, but minimal preparation, these gauges were also easilyapplied to steel reinforcement (See Fig. A24, Appendix A).
Description: Wire resistance strain gauge with polyester backing; wire leads.
Manufacturer: Tokyo Sokki Kenkyujo Co., Ltd.
Distributor: (USA sales) Texas Measurements, Inc. 409-764-0442
Model: PL-60-11
Active Length: 60-mm
Resistance: 120-ohms
Gauge factor: 2.1
Displacement Transducers
Beam deflections were monitored at three points on the beam tension face (bottom). LinearVariable Differential Transformers (LVDT) powered with Direct-Current (DCDT) were chosenfor ease of use and calibration. A style of DCDT with a loose core rather than a spring-loadedcore was used to minimize the possibility of damage at beam failure.
Description: LVDT, DC powered (DCDT)
Manufacturer: Solartron Metrology
US offices: Buffalo NY 716-634-4452
Models used:
� DFG5 (serial no. 121316, nominal range +/- 5-mm)
Note: Type DFG5 = DCDT1
D-2
� DFG15 (serial no. 69784, nominal range +/- 15-mm)
Note: Type DFG15 = DCDT2
� DFG15 (serial no. 72870, nominal range +/- 15-mm)
Note: Type DFG15 = DCDT3
Mechanical Dial Indicator
Midspan deflections were measured using a dial indicator for all tests to confirm the results fromDCDT measurements. Only one dial gauge was used, located at midspan (equivalent to DCDT2).
Description: Mechanical dial indicator
Range: 0-1 inch (small divisions 0.001 inch)
Manufacturer: Varies
Loading Machine
A 600-kip, hydraulic Baldwin Test Machine with a load-indicating dial equipped with a peak-indicating needle was used. In addition to the indicating needle, an electronic pressure sensorwith signal conditioning provided a load signal. This load signal was monitored during all tests.The sensor was calibrated using the load dial as a standard. The load dial had been calibrated andcertified within a year of all testing.
Fiber Optic Strain Sensing System
Strain GaugesThe fiber optic strain sensors were based on Bragg gratings. Nominal gauge lengths were700mm and 1000mm.
Spectrum AnalyzerAndo Corporation AQ-6330 Optical Spectrum Analyzer. The window was set for 220 datapoints per nanometer (nm) so the smallest resolvable wavelength difference was approximately 5picometers (pm). At a wavelength of 1300nm, 1pm was equivalent to 1 microstrain. The long-term resolution based on the manufacturer’s specifications was +/-70 pm. Short term (within anhour) resolution was approximately +/-15 pm. The light sources used in conjunction with thespectrum analyzer were Optiphase, Inc. Broad Band Optical Source BBS-13-0150.

D-3
DemodulatorBlue Road Research Model BRR-3SA with a sensitivity of +/-150 microstrain over a dynamicrange of +/-8000 microstrain. This demodulator had a built-in light source.
Data AcquisitionNational Instruments, DAQCard-AI-16XE-50 with 16 analog inputs.
Pulse Velocity Tester
Manufacturer: CNS Farnell
Model: PUNDIT 6
Signal Conditioning and Data Acquisition Systems
Control Beam Test
Signal conditioning and data acquisition were achieved using a single hardware systemmanufactured by ADAC Corporation.
Signal Conditioning and Analog to Digital (A/D) Conversion
Description: Strain gauge bridge completion and preamplifiers were contained in amodule with terminals for strain inputs, as well as for high-level signals.This module was connected via a 6-foot ribbon cable to a 12-bit A/Dconverter board, which resided in the Data Acquisition PC (personalcomputer).
Manufacturer: ADAC Corporation, Woburn, MA 01801, (781) 935-3200
Model No.: 4012BGEX (strain gauge amp and bridge completion); TB5525 &5302EN (terminal board and enclosure) 5525MF (A/D board)
Personal Computer
486DX/66 IBM-compatible running Windows 3.11
Data Acquisition Software
LabTech Notebook for Windows, version 9.0 was used for data collection. This allowedreal-time monitoring of signals and produced an ASCII record file in tabular form.

D-4
Flexure-Only Beam Test
Strain data from the Control Beam test was noisy. In addition, the ADAC strain measuringsystem was found to have insufficient strain zeroing capabilities. For these reasons, a moresophisticated strain measuring system by Hewlett Packard was obtained. This system was basedon the HP 3852A scanning voltmeter, and HP Vee 5.0 software. The HP system had much widerzeroing capability, higher rejection of power-line-frequency noise and better strain resolution.For the Flexure-Only Beam test, the HP system was used to gather strains only; an entirelyseparate PC data system was used concurrently to log displacement and load data. A markersignal was applied, common to both systems, for synchronizing the systems. In addition, PCclocks were closely synchronized before testing.
A. Strain Monitoring
Signal Conditioning and A/D Conversion
Description: 5-½ -digit integrating voltmeter with terminal board, bridge completionand amplifiers for strain gauges.
Manufacturer: Hewlett-Packard Corp., Palo Alto CA 94303, (800) 452-4844
Model: 3852A mainframe with 44701A integrating voltmeter, 44705A relaymultiplexer, and 44717A relay multiplexer for 120-ohm strain gauges.
Personal Computer
486DX/66 IBM-compatible; Windows 95
Data Acquisition Software
HP Vee for Win 95, version 5.0
B. Load and DCDT monitoring
Signal Conditioning and A/D Conversion
Description: PC data acquisition system with on-board signal conditioning and 14-bitA/D conversion.
Manufacturer: Validyne Engineering, Northridge, CA (800) 423-5851
Model: UPC-607
Personal Computer
486DX/66 IBM-compatible

D-5
Data Collection Software
Validyne “EasySense” for DOS
Shear-Only Beam Test
The HP 3852A/HP Vee system was further developed so load and displacements could bemonitored along with all strains. A single PC and data system was used. All data were written toa single data file. Four to six strains of interest were plotted in real time for monitoring duringthe test.
Shear & Flexure Beam Test
This beam used the same system as the Shear-Only Beam test.

APPENDIX E: DESIGN CALCULATIONS FOR FRPRETROFITTED REINFORCED CONCRETE MEMBERS


E-1
APPENDIX E: DESIGN CALCULATIONS FOR FRPRETROFITTED REINFORCED CONCRETE MEMBERS
The method used to design the FRP strengthening scheme for HCB is presented here asoriginally proposed (Kachlakev, 1998). The calculations are based on the actual materials used inthe construction of the bridge and the experimental beams.
OSU Design Method
As suggested in Chapter 2, a design process for shear and flexure was used to predict the strengthof the experimental beams, hereafter referred to as the OSU Method. The following assumptionsare necessary for this design process to be valid.
Introduction and design philosophy
The adopted design philosophy is outlined below. FRP composite materials are consideredbrittle, because they exhibit linear stress-strain diagrams to failure. It should be noted thatconcrete is also considered a brittle material and yet, reinforced concrete flexural membersexhibit ductile behavior at failure. In regular reinforced concrete design, this ductile behavior isachieved through limiting the amount of steel reinforcement in the balanced area, and assuringthat steel yields prior to concrete crushing. Thus, the yielding of steel reinforcement converts thebehavior of an otherwise brittle system to a ductile system. There is no reason to expect that theaddition of another brittle material (FRP) to the already ductile system will result in a brittlefailure, as long as the total area of the reinforcement is restricted to 75% or less of the balancedsection.
It is known that the load-deflection curve of an under-reinforced beam consist of two regions,i.e., linear-elastic prior to steel yielding followed by ideally-plastic response afterward.Theoretically, this behavior is similar to the behavior exhibited by a FRP strengthened beam.With increasing cross sectional area of FRP reinforcement, the nearly horizontal ideally-plasticportion of the curve increases in slope, eventually becoming identical to that of the linear-elasticportion. At this point, the ductile behavior of the system (concrete-steel-FRP) changes to brittlebehavior. When areas of FRP and steel reinforcement are in the prescribed limits, a significantchange in the behavior of the system occurs at yielding of steel. Under very little increase ofload, the deflections become excessive, thus allowing for redistribution of moments to areas ofredundancy, and warning of impending failure.
The parameters that affect the strengthening design of reinforced concrete beams include thefollowing factors: a) the effects of initial strain; b) FRP/steel reinforcement ratios; c) materialproperties of concrete, steel reinforcement and FRP composites; d) stress of the steelreinforcement at working loads; e) deflections under working loads, f) failure mechanisms, andg) behavior of the strengthened beam under service loads. The restrictions include consideringflexural behavior only (shear is not considered) and assuming a pre-cracked concrete section.

E-2
General Assumptions
1. Classical beam theory assumptions apply.
2. Elastic and homogeneous concrete material.
3. Elastic-perfectly plastic steel reinforcement.
4. Linear elastic behavior of FRP materials up to failure.
5. Strength provided by components is the summation of parts (e.g. total shear strength is thestrength of the concrete plus steel plus FRP).
Assumptions Specific to Flexure
F1. Plane-cross sections remain plane during bending.
F2. Five failure modes are possible.
F3. Shear strength is in excess of flexural strength.
Assumptions Specific to Shear
S1. Limiting FRP-concrete bond stress is 200 psi.
S2. Limiting FRP-concrete interfacial strain is 0.004.

E-3
Flexural Design Input Requirements
The following two tables give the needed information to begin the strengthening design.
Table E-1: FRP strengthening input requirements for the actual bridge and experimental beamsUS Standard Value Metric Value
Input Variable Horsetail Exper. Horsetail Exper.Existing Concrete Section
Area of tensile steel As =5.00 in2
fy =33 ksi2.68
fy =60 ksi 3226 mm2 1729
Area of compressive steel‡ As’ = 0.00 in2 0.00 0.0 0.0Depth of tensile steel d = 28.00 in 27.75 711 mm 705Depth of compressive steel d' = 0.0 0.0 0.0 0.0Width of reinforced concretesection b = 12.0 in 12.0 305 mm 305
Height of reinforced concretesection h = 30.00 in 30.25 762 mm 768
Concrete clear cover cc cc = 1.5 in 2.063 38 mm 52cc + diameter/2 cs = 2.0 in 2.50 51 mm 64
Beam GeometryBeam clear span length Lcr = 240 in 216 in 6096 mm 5490‡ Small steel reinforcing bars do exist above the elastic neutral axis, but were found to be near the neutral axis after cracking andnear ultimate and are disregarded for design. If compressive reinforcement is available and placed to increase the resisting C-force, it should be included in design.
Table E-2: Design material properties for the actual bridge beams and experimental beams
US Standard Value Metric ValueInput VariableHorsetail Exper. Horsetail Exper.
ConcreteCompressive strength fc’ = 2500 psi 3000 17.2 MPa 20.6Elastic modulus‡ Ec = 2850 ksi 3120 19.7 GPa 21.6Ultimate strain (crushing) εcu = 0.003 0.003 0.003 0.003
Steel ReinforcingYield strength fy = 33 ksi 60 228 MPa 414Elastic Modulus Es = 29,000 ksi 29,000 200 Gpa 200Strain at yield εy = fy/Es .0011 .0021 0.0011 0.0021
CFRP Reinforcement†
Reinforcement type CARBON FABRIC (epoxy saturated, composite properties)Tensile strength ffu = 110 ksi 758 MPaElastic modulus Ef = 9,000 ksi 62.0 GPaUltimate strain εfu = 0.0122 0.0122FRP thickness per ply tf = 0.041 in 1.04 mm
GFRP Reinforcement†
Reinforcement type GLASS FABRIC (epoxy saturated, composite properties)Tensile strength ffu = 60 ksi 414 MPaElastic modulus Ef = 3,000 ksi 20.7 GPaUltimate strain εfu = 0.02 0.02FRP thickness per ply tf = 0.051 in 1.30 mm† Design properties based on manufacturer literature. The same material was used for the experimental beams as was used toretrofit the actual bridge.‡ Ec = 57000 (fc’)½

E-4
Loads and Existing Section Capacity
The information provided in this section is arranged to accommodate the load rating proceduresas prescribed by ODOT and AASHTO (1989, 1994). In general, for flexural strengthening, a pre-retrofit moment capacity and required moment capacity will need to be provided. Acceptedreinforced concrete theory should be used to calculate the existing section capacity.
Table E-3: Design loads and capacity input for actual bridge beams onlyInput Variable US Standard Value Metric ValueLive load moment MLL = 241 ft-kip† 326 kN-mDead load moment MDL = 107 ft-kip 145 kN-mTotal unfactored moment MWL = 355 ft-kip 481 kN-mExisting section capacity Mn,exist = 341 ft-kip 462 kN-m† Not including impact factor.
Rating FactorConventional load rating requires the calculation of a rating factor. If the rating factor isbelow 1.0, the structural member is considered inadequate for the required load andaccepted factors. Load rating of the HCB is presented in Appendix B. It was determinedfor flexure to be RF = 0.50, for HCB beams.
Design Procedure and Assumptions
Comments for the following calculations will be provided to clarify the procedure. A systematicprocess is given resulting in recommended FRP strengthening scheme.
Moment and Curvature at Steel Yield
Calculate the moment and curvature at yield for the unstrengthened section.
ρs=As/bd=(5.00 in2)/(12 in)(28 in)= 0.0149 [E-1]
ns=Es/Ec=(29,000 ksi)/(2850 ksi)=10.18 [E-2]
k=[(ρs*ns)2+2(ρs*ns)]1/2-(ρs*ns)=0.419 [E-3]
cy=(k)(d)=(0.419)(28.0 in)=11.74 in [E-4]
These commonly used equations assume elastic material behavior (particularly for the concrete).The equations are only valid for a singly reinforced concrete beam (i.e. neglecting the presenceof any compression steel).
Concrete strain εcy at steel yield:

E-5
���
���
��
�
−=��
����
����
��
�
�
−=ε
ksi000,29ksi33
in74.11in00.28in74.11
Ef
cdc
s
y
y
ycy [E-5]
================εcy=0.00082 in/in
Note that εcy is limited to ½ εcu = 0.003/2 = 0.0015, in order to preserve the validity of the linearapproximation.
Moment My at yielding of the steel reinforcement:
My=(As*fy)(d-cy/3) [E-6]
My=(5.00in2*33ksi)(28.00in-11.74in/3)/12
My=331ft-kip
This equation is only valid for a singly reinforced section. The corresponding curvature atyielding of the steel reinforcement is calculated by
φy=εcy/cy=(0.00082)/(11.74in)= 6.98x10⁻⁵in-1 [E-7]
Strain in the Beam at the Level of FRP Laminate
Assume that the dead load plus an additional 10% of the live load will be acting on the beam atthe time of retrofit. Calculate the applied moment
Mretrofit=0.1*(248ft-kip)+(107ft-kip)=132 ft-kip [E-8]
φretrofit=(Mret/My)(φy)=(132/331)( 6.98x10⁻⁵in-1) [E-9]
φretrofit =2.79x10⁻⁵in-1
Assuming a linear slope of the moment curvature diagram.
Assume that the depth of the neutral axis equals that at yield when the beam is retrofit. Thisallows calculation of strain in the beam at the level of FRP laminate at the time of retrofit.
εb,retrofit=(h-cy)φretrofit [E-10]
εb,retrofit=(30.0in-11.74-in)*2.79x10⁻⁵in-1=0.00051in/in
Area of the FRP Required to Resist the Ultimate Projected Moment
This calculation relies on the load rating procedure to find the required capacity.
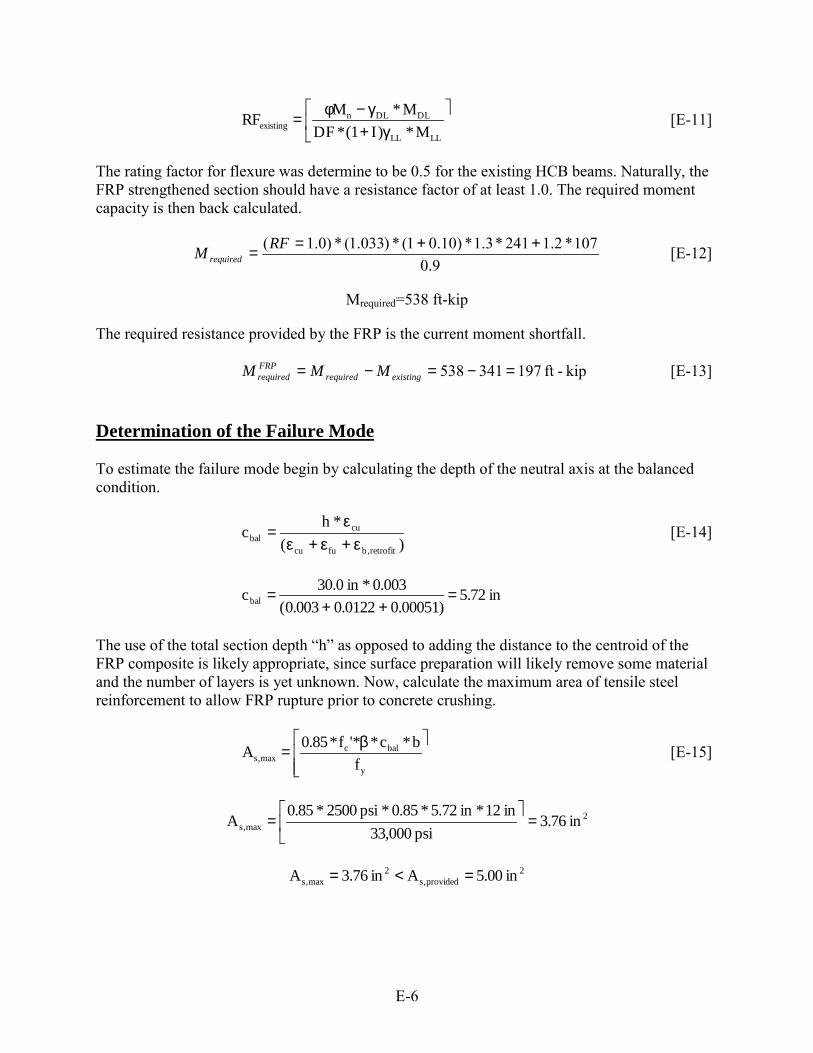
E-6
���
�
γ+γ−φ=
LLLL
DLDLnexisting M*)I1(*DF
M*MRF [E-11]
The rating factor for flexure was determine to be 0.5 for the existing HCB beams. Naturally, theFRP strengthened section should have a resistance factor of at least 1.0. The required momentcapacity is then back calculated.
9.0107*2.1241*3.1*)10.01(*)033.1(*)0.1( ++== RFM required [E-12]
Mrequired=538 ft-kip
The required resistance provided by the FRP is the current moment shortfall.
kip-ft 197341538 =−=−= existingrequiredFRPrequired MMM [E-13]
Determination of the Failure Mode
To estimate the failure mode begin by calculating the depth of the neutral axis at the balancedcondition.
)(*h
cretrofit,bfucu
cubal ε+ε+ε
ε= [E-14]
in72.5)00051.00122.0003.0(
0.003* in0.30cbal =++
=
The use of the total section depth “h” as opposed to adding the distance to the centroid of theFRP composite is likely appropriate, since surface preparation will likely remove some materialand the number of layers is yet unknown. Now, calculate the maximum area of tensile steelreinforcement to allow FRP rupture prior to concrete crushing.
�
���
� β=y
balcmax,s f
b*c*'*f*85.0A [E-15]
2max,s in76.3
psi 000,33in 12*in 72.5*85.0*psi 2500*85.0
A =�
��
�=
2provided,s
2max,s in00.5A in76.3A =<=
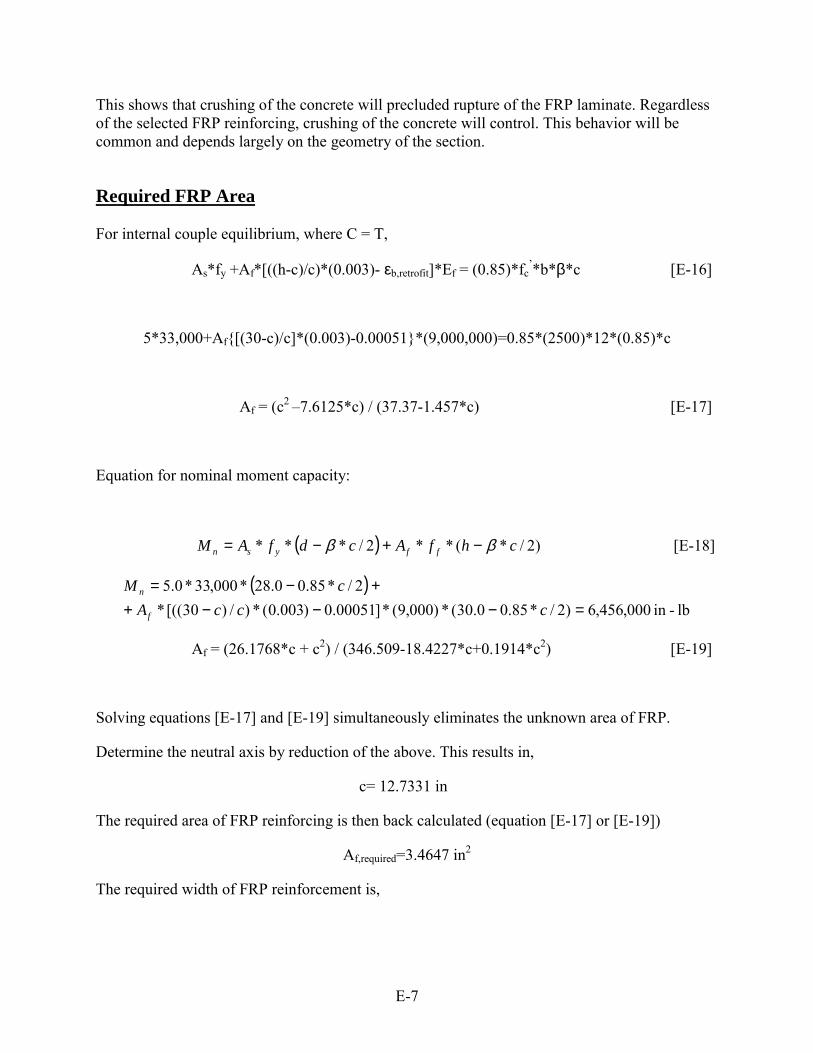
E-7
This shows that crushing of the concrete will precluded rupture of the FRP laminate. Regardlessof the selected FRP reinforcing, crushing of the concrete will control. This behavior will becommon and depends largely on the geometry of the section.
Required FRP Area
For internal couple equilibrium, where C = T,
As*fy +Af*[((h-c)/c)*(0.003)-=εb,retrofit]*Ef = (0.85)*fc’*b*β*c [E-16]
5*33,000+Af{[(30-c)/c]*(0.003)-0.00051}*(9,000,000)=0.85*(2500)*12*(0.85)*c
Af = (c2 –7.6125*c) / (37.37-1.457*c) [E-17]
Equation for nominal moment capacity:
( ) )2/*(**2/*** chfAcdfAM ffysn ββ −+−= [E-18]
( )lb-in 000,456,6)2/*85.00.30(*)000,9(*]00051.0)003.0(*)/)30[((*
2/*85.00.28* 000,33* 0.5=−−−+
+−=cccA
cM
f
n
Af = (26.1768*c + c2) / (346.509-18.4227*c+0.1914*c2) [E-19]
Solving equations [E-17] and [E-19] simultaneously eliminates the unknown area of FRP.
Determine the neutral axis by reduction of the above. This results in,
c= 12.7331 in
The required area of FRP reinforcing is then back calculated (equation [E-17] or [E-19])
Af,required=3.4647 in2
The required width of FRP reinforcement is,

E-8
inin
int
Ab
f
requiredffrp 5.84
in-ply/ 041.0 4647.3
2
2, === [E-20]
Since most FRP materials are manufactured to specific widths and thickness, select the mostappropriate configuration. In this case, 24 inch widths are available and providing 4 layers at 12inches wide will be adequate. Thus,
22
,, 936.3in 24*in-ply/ 041.0*4 inin
bt
Atotalf
fprovidedf === [E-21]
Using the selected FRP area, determine the position of the neutral axis at ultimate load.
As*fy+Af*[((h-cult)/cult)*(0.003)-=εb,retrofit]*Ef=(0.85)*fc’*b*β* cult
Af = (cult 2 –7.6125* cult) / (37.37-1.457* cult)
cult=13.10 in
Note that, for this method, adding more area of FRP reinforcing will resulting in a predictedlowering of the neutral axis (c increases). Check the failure mode by,
( )ret,bfuult
ultult,c *
chc
ε+ε�
��
�
−=ε [E-22]
εc,ult=0.00969 >> 0.003
which implies that crushing of the concrete controls.
The moment capacity after strengthening with FRP, according to equation [E-18] is,
Mn=6,825,804 in-lb=569 ft-kip
Following load rating requirements, the rating factor after strengthening can be calculated from[E-11]
0.111.1kip-ft 45*3.1*)10.01(*0.5
kip-ft 107*2.1kip-ft 569*85.0 >=���
�
+−=retrofitRF
The retrofitted beam then satisfies strength requirements.
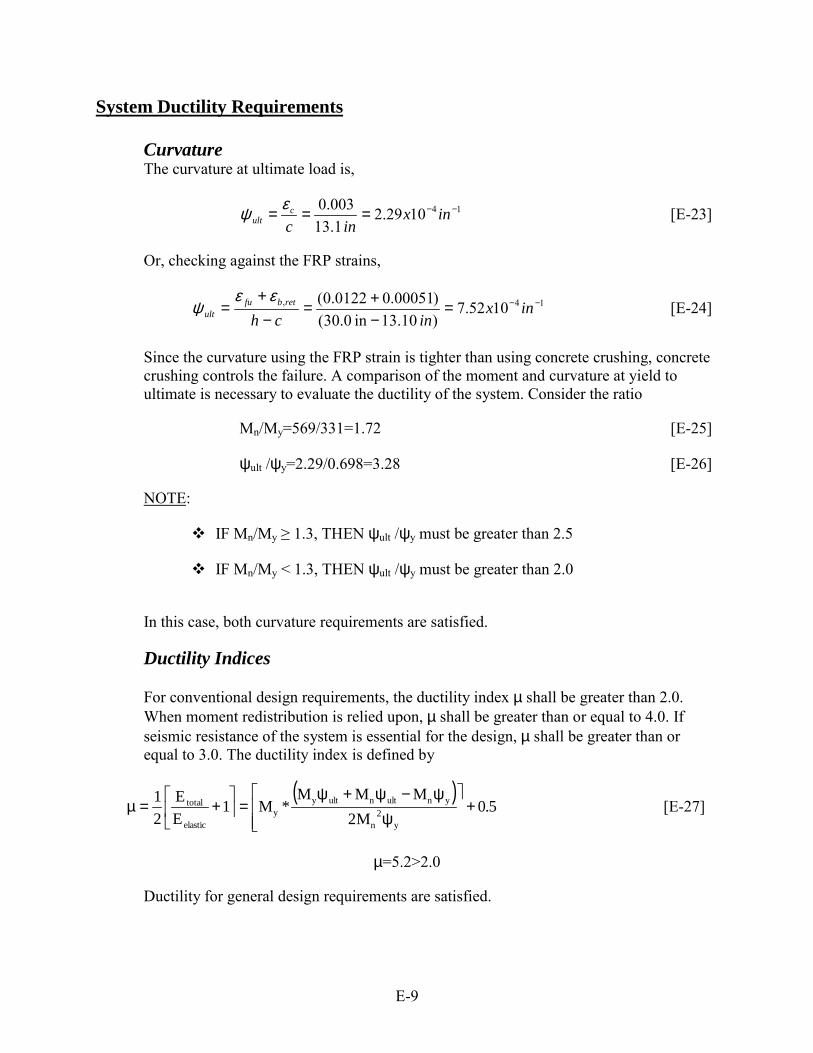
E-9
System Ductility Requirements
CurvatureThe curvature at ultimate load is,
141029.23.11
003.0 −−=== inxinc
cult
εψ [E-23]
Or, checking against the FRP strains,
14, 1052.7) 10.13in 0.30()00051.00122.0( −−=
−+=
−+
= inxinch
retbfuult
εεψ [E-24]
Since the curvature using the FRP strain is tighter than using concrete crushing, concretecrushing controls the failure. A comparison of the moment and curvature at yield toultimate is necessary to evaluate the ductility of the system. Consider the ratio
Mn/My=569/331=1.72 [E-25]
ψult /ψy=2.29/0.698=3.28 [E-26]
NOTE:
� IF Mn/My ≥ 1.3, THEN ψult /ψy must be greater than 2.5
� IF Mn/My < 1.3, THEN ψult /ψy must be greater than 2.0
In this case, both curvature requirements are satisfied.
Ductility Indices
For conventional design requirements, the ductility index µ shall be greater than 2.0.When moment redistribution is relied upon, µ shall be greater than or equal to 4.0. Ifseismic resistance of the system is essential for the design, µ shall be greater than orequal to 3.0. The ductility index is defined by
( )
5.0M2
MMM*M1
EE
21
y2
n
ynultnultyy
elastic
total +�
���
�
ψψ−ψ+ψ
=��
��
�+=µ [E-27]
µ=5.2>2.0
Ductility for general design requirements are satisfied.

E-10
Service Level Deflections
Calculations of moment of inertia and hence deflections will be consistent with currentmethods. That is, the FRP will be considered in the same manner as steel, transformingthe respective area using a modular ratio. These calculations must be performed, but areomitted here, since they do not provide new insight into FRP strengthening.
Stresses and Strains Developed Under Working Loads
It is necessary to check service level stresses and compare against allowable values.These calculations are only necessary if the working load moment is greater than 80% ofthe yield moment. From before,
MWL=355 k-ft >0.8*My=265 ft-kip [E-28]
The following conditions must be satisfied:
� Tensile Steel Reinforcing – εs ≤ 0.80*εy
� Concrete in Compression -- σc ≤ 0.45*fc’
� FRP composite – εf ≤ 0.30*εfu
If these limits are not satisfied then serviceability will govern the design and thepreviously calculated reinforcing will need to be changed.
Elastic Stresses and Strains
For these calculations, assume that the provided FRP area will be used in design (Af =3.936 in2). Internal equilibrium is described by
C=T [E-29]
Or,
0.5*c*b*εc*Ec,eff=As*Es*εs+Af*Ef*εf [E-30]
The strain in the FRP is geometrically related by,
retrofit,fsf cdch ε−ε��
�
�
−−=ε [E-31]
In addition, the concrete strain is related by,
sc cdc �
�
�
−=ε [E-32]

E-11
Since linear elastic behavior of the concrete is desired, the limiting strain of 0.002 in theconcrete will be required. The effective elastic modulus is then,
Eeff=fc’/0.002=2500 psi/0.002=1.25x106 psi [E-33]
The strain in the steel as related to the depth to the neutral axis is,
��
���
+��
�
�
−−
ε=ε
ff
sseff2
retrofit,bs
E*AE*A
)cd()E*b*ch(
[E-34]
���
��
���
+��
�
�
−−
=ε
6
662s
10x0.9*984.010x0.29*0.5
)c28()10x25.1*0.12*c0.30(
00051.0
When simplified, equation [E-34] will give a quadratic relationship in the neutral axislocation c. In order to develop another equation to solve simultaneously with [E-34],equate the applied moment to the resisting couple created by the tension reinforcement,
)3/ch(*E*A)3/cd(*E*AM fffsssWL −ε+−ε= [E-35]
Where
ret,fsf cdch ε−���
�
−−ε=ε [E-36]
Combining equations [E-34] and [E-35] a solution for c should be achievable.
END OF FLEXURAL DESIGN
Shear Design Process
Designing an FRP reinforced beam for shear is different than flexure in that the strains of theFRP will be limited. Ultimate capacity (failure) calculations are not appropriate in this case,since strain limits the effectiveness of the concrete-FRP bond. For this reason, experimentalstudies have suggested that the strain in the FRP jacket be limited to a value of 0.004. Sheardesign is outlined as follows for the HCB beams and summarized for the experimental beams.For shear design, the use of the subscript “j” will designate the various properties of the FRPjacket. This notation will be useful in separating flexure and shear variables.

E-12
Concrete Shear Capacity
Typical reinforced concrete design will be used to calculate the concrete contribution to shearcapacity. The shear capacity calculation here include the d = 28” assumption. The actual bridgehas a changing depth due to the roadway crowning. The calculations here are for comparison toexperimental. The simplified capacity,
)d)(b('f0.2V cc = [E-37]
kips 6.33lb 600,33)0.28)(12(25000.2Vc ===
Steel Shear Capacity
In the case of the Horsetail Creek Bridge and the experimental beams, no stirrups were provided.Thus,
0s
dfAV yv
s == [E-38]
Shear Deficiency
Assuming that the total capacity is the sum of the constituent capacities, the required resistanceof the FRP shear jacket is,
[ ]csdemandj VVVV +φ−=φ [E-39]
kip 6.60))kip 6.33(85.0kip 2.89(Vj =−=φ
The FRP jacket must then resist a total force of 71.3 kips if a Φ-factor of 0.85 is used. This is theresistance to be provided by the FRP at a limited strain of 0.005.
Require FRP Jacket Thickness
)(cotDE2V
tjjj
j
θεφ
≥ [E-40]
Where θ is the angle between the shear crack and the principal direction of the FRP jacket fibers(assumed unidirectional). Using the known values,
in 0.198 )1)("12)( 3000)(005.0(2
1.37crackshear 45for )45(cot2
==≥ksi
kipsDEV
tjjj
j
εφ
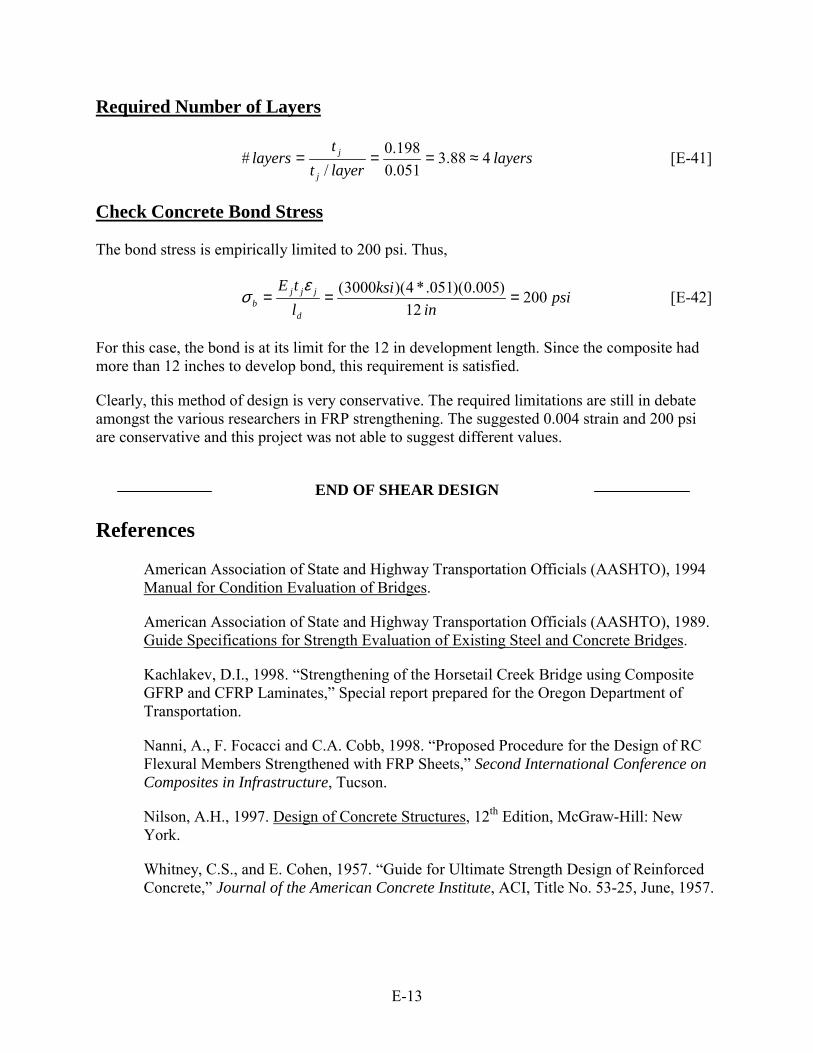
E-13
Required Number of Layers
layerslayertt
layersj
j 488.3051.0198.0
/# ≈=== [E-41]
Check Concrete Bond Stress
The bond stress is empirically limited to 200 psi. Thus,
psiin
ksiltE
d
jjjb 200
12)005.0)(051.*4)(3000( ===
εσ [E-42]
For this case, the bond is at its limit for the 12 in development length. Since the composite hadmore than 12 inches to develop bond, this requirement is satisfied.
Clearly, this method of design is very conservative. The required limitations are still in debateamongst the various researchers in FRP strengthening. The suggested 0.004 strain and 200 psiare conservative and this project was not able to suggest different values.
END OF SHEAR DESIGN
References
American Association of State and Highway Transportation Officials (AASHTO), 1994Manual for Condition Evaluation of Bridges.
American Association of State and Highway Transportation Officials (AASHTO), 1989.Guide Specifications for Strength Evaluation of Existing Steel and Concrete Bridges.
Kachlakev, D.I., 1998. “Strengthening of the Horsetail Creek Bridge using CompositeGFRP and CFRP Laminates,” Special report prepared for the Oregon Department ofTransportation.
Nanni, A., F. Focacci and C.A. Cobb, 1998. “Proposed Procedure for the Design of RCFlexural Members Strengthened with FRP Sheets,” Second International Conference onComposites in Infrastructure, Tucson.
Nilson, A.H., 1997. Design of Concrete Structures, 12th Edition, McGraw-Hill: NewYork.
Whitney, C.S., and E. Cohen, 1957. “Guide for Ultimate Strength Design of ReinforcedConcrete,” Journal of the American Concrete Institute, ACI, Title No. 53-25, June, 1957.
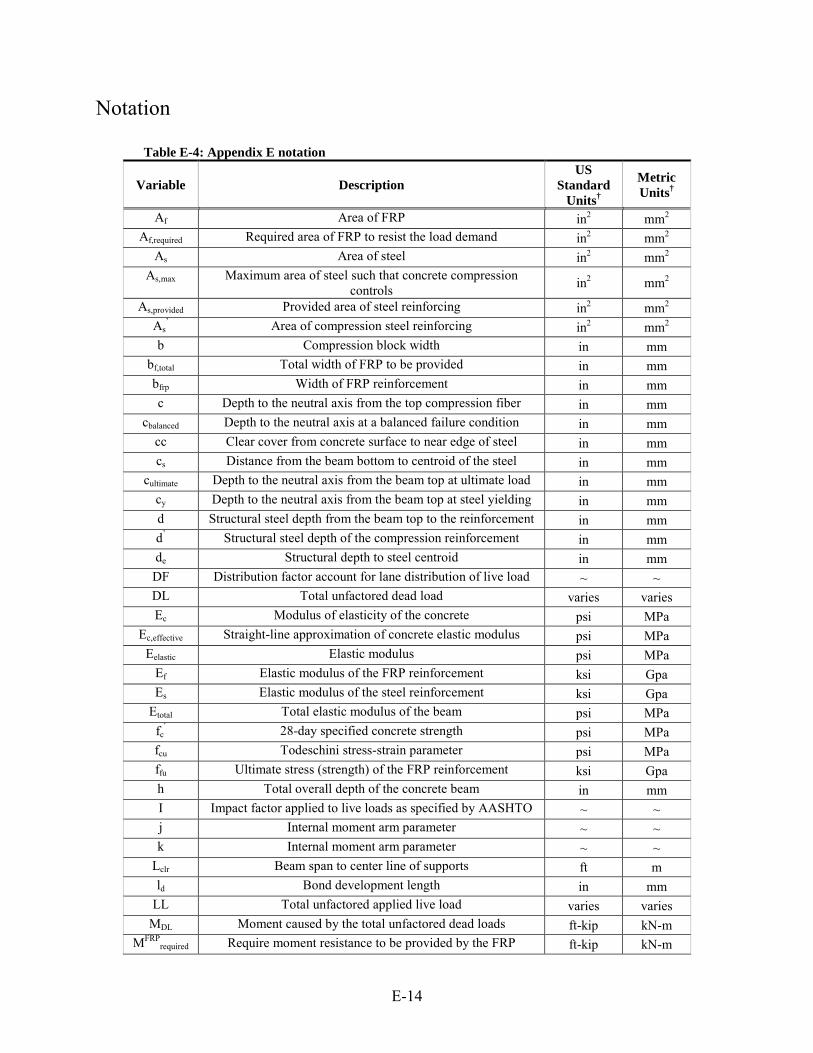
E-14
Notation
Table E-4: Appendix E notation
Variable DescriptionUS
StandardUnits†
MetricUnits†
Af Area of FRP in2 mm2
Af,required Required area of FRP to resist the load demand in2 mm2
As Area of steel in2 mm2
As,max Maximum area of steel such that concrete compressioncontrols in2 mm2
As,provided Provided area of steel reinforcing in2 mm2
As’ Area of compression steel reinforcing in2 mm2
b Compression block width in mmbf,total Total width of FRP to be provided in mmbfrp Width of FRP reinforcement in mmc Depth to the neutral axis from the top compression fiber in mm
cbalanced Depth to the neutral axis at a balanced failure condition in mmcc Clear cover from concrete surface to near edge of steel in mmcs Distance from the beam bottom to centroid of the steel in mm
cultimate Depth to the neutral axis from the beam top at ultimate load in mmcy Depth to the neutral axis from the beam top at steel yielding in mmd Structural steel depth from the beam top to the reinforcement in mmd’ Structural steel depth of the compression reinforcement in mmde Structural depth to steel centroid in mmDF Distribution factor account for lane distribution of live load ~ ~DL Total unfactored dead load varies variesEc Modulus of elasticity of the concrete psi MPa
Ec,effective Straight-line approximation of concrete elastic modulus psi MPaEelastic Elastic modulus psi MPa
Ef Elastic modulus of the FRP reinforcement ksi GpaEs Elastic modulus of the steel reinforcement ksi Gpa
Etotal Total elastic modulus of the beam psi MPafc
’ 28-day specified concrete strength psi MPafcu Todeschini stress-strain parameter psi MPaffu Ultimate stress (strength) of the FRP reinforcement ksi Gpah Total overall depth of the concrete beam in mmI Impact factor applied to live loads as specified by AASHTO ~ ~j Internal moment arm parameter ~ ~k Internal moment arm parameter ~ ~
Lclr Beam span to center line of supports ft mld Bond development length in mm
LL Total unfactored applied live load varies variesMDL Moment caused by the total unfactored dead loads ft-kip kN-m
MFRPrequired Require moment resistance to be provided by the FRP ft-kip kN-m

E-15
Variable DescriptionUS
StandardUnits†
MetricUnits†
MLL Moment caused by the total unfactored live loads ft-kip kN-mMn,existing Existing section moment capacity, prior to strengthening ft-kip kN-mMrequired Required moment capacity to resist the applied loads ft-kip kN-mMretrofit Total unfactored moment applied at the time of retrofit ft-kip kN-mMWL Working load moment (services level loads) ft-kip kN-mMy Moment at which the primary tension steel reinforcing yields ft-kip kN-mns Ratio of steel elastic modulus over concrete elastic modulus ~ ~RF Load rating factor as defined by AASHTO ~ ~
RFexisting Existing section rating factor ~ ~RFretrofit Rating factor after retrofit of the beam ~ ~
Rn Nominal resistance (any mode) varies variestf Thickness of the FRP reinforcement per layer in mmtj Thickness of the FRP jacket for shear strengthening in mm
Vc Shear strength of concrete section alone kips kNVdemand Factored applied loads shear force demand on the sections kips kN
β Equivalent stress block parameter for location of C-force ~ ~ε0 Todeschini stress-strain parameter ~ ~
εb,retrofit Strain at the time of retrofit at the level of FRP to be added ~ ~εc Strain in the concrete top compression fiber ~ ~
εc,ultimate Strain in the concrete top compression fiber at ultimate load ~ ~εcu Ultimate (crushing strain of the concrete), typically 0.003 ~ ~εcy Strain in the concrete top compression fiber at steel yielding ~ ~εfu Ultimate (rupture) strain of the FRP reinforcement ~ ~εs Strain in the steel reinforcing ~ ~εy Yield strain of the steel reinforcement ~ ~φ General strength reduction factor ~ ~
γDL Dead load factor ~ ~γLL Live load factor ~ ~µ Ductility index ~ ~ρs Tension steel reinforcement ratio, typically As/(bd) ~ ~σb Bond stress limitation at FRP-concrete interface psi MPaσc Stress in the concrete psi MPa
ψretrofit Curvature at the time of retrofit in-1 mm-1
ψult Curvature at ultimate load in-1 mm-1
ψy Curvature at yielding of the primary steel tensionreinforcement in-1 mm-1
† Typical units given. The use of “~” implies variable has no units.