Embed Size (px)
Citation preview

209
Appendices

210
List of Bank Indonesia Regulations in 2007
No No. PBI Date Description
1 9/1/PBI/2007 24/1/2007 The Commercial Bank Rating System based on Sharia Principles
2 9/2/PBI/2007 5/3/2007 Daily Report of Commercial Bank
3 9/3/PBI/2007 16/3/2007 Government Securities Auction and Administration
4 9/4/PBI/2007 26/3/2007Revocation of Several Bank Indonesia Board of Governor Decree and Bank Indonesia
Circular Letters concerning Prudential Banking Principles
5 9/5/PBI/2007 30/3/2007 Sharia Interbank Money Market
6 9/6/PBI/2007 30/3/2007Second Amendment to Bank Indonesia Regulation number 7/2/PBI/2005 concerning
Assets Quality of Commercial Banks
7 9/7/PBI/2007 4/5/2007
Amendment to Bank Indonesia Regulation number 8/3/PBI/2006 concerning
Business Conversion of Conventional Commercial Banks to Commercial Banks
conducting Business Based on Sharia Principles and Establishment of Bank Offices
conducting Business Based on Sharia Principles by Conventional Commercial Banks
8 9/8/PBI/2007 6/6/2007Employment of Foreign Manpower and Knowledge Sharing Program in Banking
Sector
9 9/9/PBI/2007 18/6/2007Amendment to Bank Indonesia Regulation number 8/21/PBI/2006 concerning Asset
Quality Rating of Commercial Banks conducting Business based on Sharia Principles
10 9/10/PBI/2007 30/8/2007Amendment to Bank Indonesia Regulation number 6/14/PBI/2004 concerning
Issuance, Circulation, Withdrawal, Destruction of Rupiah Currency
11 9/11/PBI/2007 5/9/2007 Foreign Currency Trader
12 9/12/PBI/2007 21/9/2007Amendment to Bank Indonesia Regulation number 8/17/PBI/2006 concerning
Incentives in Bank Consolidation
13 9/13/PBI/2007 1/11/2007The Minimum Capital Adequacy Requirement for Commercial Banks Accounted on
Market Risk
14 9/14/PBI/2007 30/11/2007 Debtors Information System
15 9/15/PBI/2007 30/11/2007The Implementation of Risk Management by Commercial Bank in Utilizing the
Information Technology
16 9/16/PBI/2007 3/12/2007Amendment to Bank Indonesia Regulation number 7/15/PBI/2005 concerning
Minimum Tier One Capital for Commercial Banks
17 9/17/PBI/2007 4/12/2007 The Rural Banks Rating System based on Sharia Principles
18 9/18/PBI/2007 17/12/2007
Revocation of Bank Indonesia Board of Governor Decree number 31/153/KEP/DIR
dated 20th November 1998 concerning Liquidity Credit to State Owned Pawnshop
through PT Bank Ekspor Impor Indonesia (PERSERO), Bank Indonesia Board of
Governor Decree number 31/154/KEP/DIR dated 20th November 1998 concerning
Liquidity Credit to State Owned Pawnshop through PT Bank Bumi Daya (PERSERO),
and Bank Indonesia Board of Governor Decree number 31/155/KEP/DIR dated 20th
November 1998 concerning Liquidity Credit to State Owned Pawnshop through PT
Bank Umum Koperasi Indonesia
19 9/19/PBI/2007 17/12/2007Implementation of Sharia Principles in Collecting and Distributing Fund and Sharia
Banks Services

211
Various Important Regulations and Policies in Economic and Finance Areas in 2007
Date Regulation/Policy Description
January
8 Third Amendment to Government Regulation Number 12 of 2001 regarding Import and/or Release of Particular Taxable Strategic Goods which Exempted from Value Added Tax
Government Regulation No. 7 of 2007
10 Operational Guidelines on the Collection of Restaurant Tax Governor of DKI Jakarta Regulation No. 22 of 2007
29 Technical Guidelines on Productive Financing Program for Cooperatives and Micro Business (P3KUM) based on Sharia Principles
State Minister for Cooperatives Small and Medium Enterprises Regulation No. 06/Per/M.KUKM/2007
February
12 Technical Guidelines on Productive Financing Program for Conventional Cooperatives and Micro Business (P3KUM)
State Minister for Cooperatives Small and Medium Enterprises Regulation No. 08/Per/M.KUKM/II/2007
21 Standar and Quality Specification of Gas Fuel in a form of LPG for Motor Vehicle Sold in Domestic Market
Directorate General of Oil and Natural Gas Decree No. 2527 K/24/DJM/2007
23 Principles of Regional Budget Management Riau Archipelago Regional Regulation No. 3 of 2007
26 General Guidelines for Enhancing Productivity and Production of Rice, Corn, and Soybean through Seed Assistance in 2007
Minister of Agriculture Regulation No. 23/PERMENTAN/SR.120/2/2007
26 Price Reference for Seed of Rice, Corn, and Soybean in 2007 Minister of Agriculture Regulation No. 24/PERMENTAN/SR.120/2/2007
March
1 Procedures for Procurement, Calculation and Payment of Subsidized Fuel in 2007
Minister of Finance Regulation No. 25/PMK.02/2007
2 Guidance on Production of Soybean Seed Minister of Agriculture Regulation No. 28/Permentan/SR.120/3/2007
2 Auction of Government Securities in Primary Market Minister of Finance Regulation No. 26/PMK.08/2007
2 Buyback Auction of Government Securities Minister of Finance Regulation No. 7/PMK.08/2007
5 Calculation of Tax on Motor Vehicle and Change of Ownership in 2007
Minister of Home Affair No. 9 of 2007
28 Legalization of Framework Agreement on Comprehensive Economic Cooperation Among the Governments of the Member Countries of the Association of Southeast ASEAN Nations and The Republic of Korea
Presidential Regulations No. 11 of 2007
28 Calculation of Tax on Motor Vehicle and Change of Ownership in 2007
Governor of DKI Jakarta Regulation No. 51 of 2007
29 Official Price of 3 kgs LPG Container and Stove Related to Kerosene Conversion Program for Poor Family
Minister of Industry Regulation No. 28/M-IND/PER/3/2007
30 Import Regulation on Colored Multifunction Machines, Copier Machine, and Printer
Minister of Trade Regulation No. 15/M-DAG/PER/3/2007
31 Rice Policy Presidential Instruction RI No. 3 of 2007

212
April
2 Price Reference for Buying Unhusked Rice by Government Minister of Agriculture/Chief of Food Securities Board Regulation No. 38/Permentan/OT.140/4/2007
3 Import Duty Exemption on Raw Material for Production of Motor Vehicle Component
Minister of Finance Regulation No. 34/PMK.011/2007
13 Guidelines for Regional Bond Offering Chief of Bapepam-LK DecreeNo. KEP-66/BL/2007
27 Price Reference for Particular Fuel in 2007 Minister of Energy and Mineral Resources Decree No. 1720 K/12/MEM/2007
30 Fourth Amendment to Minister of Industry and Trade Regulation Number 527/MPP/Kep/9/2004 regarding Sugar Import
Minister of Trade Regulation No. 18/M-DAG/PER/4/2007
May
1 Fourth Amendment to Government Regulation Number 12 of 2001 regarding Import and/or Release of Particular Taxable Strategic Goods which Exempted from Value Added Tax
Government RegulationNo. 31 of 2007
8 Export Reference Price on Particular Export Goods Minister of Trade Regulation No.20/M-DAG/PER/5/2007
31 General Guidelines of Empowerment and Development of Independent Agribusiness Institution in Community in 2007
Minister of Agriculture Regulation No. 47/Permentan/OT.140/5/2007
June
4 Operational Guidelines on Government Regulation Number 41/PMK.010/2007 of April 19, 2007 regarding Import Duty Exemption on Raw Material and Particular Part to Manufacture Heavy Equipment by Heavy Equipment Industry
Directorate General of Custom and Excise Regulation No. P-16/BC/2007
27 Operational Guidelines Minister of Finance Number 34/PMK.011/2007 of April 3, 2007 regarding Import Duty Exemption to Produce Motor Vehicle Component
Directorate General of Custom and Excise Regulation No. 19/BC/2007
July
3 Import Tariff Associated with ASEAN-Korea Free Trade Area (AK-FTA)
Minister of Finance Regulation No. 75/PMK.011/2007
9 Second Amendment to Minister of Home Affair Number 15 of 2007 regarding Calculation of Tax on Motor Vehicle and Change of Ownership which is not Covered by Minister of Home Affair Number 9 of 2007 regarding Calculation of Tax on Motor Vehicle and Change of Ownership
Minister of Home Affair Regulation No. 32 of 2007
13 Operational Guidelines on Rice for Poor Family Program (RASKIN) in 2007
Governor of DKI Jakarta Regulation No. 93 of 2007
16 Tariff on Air Conditioned Economy Class Passenger Trains Minister of Transportation Regulation No. KM 29 of 2007
16 Tariff on economy Class Passenger Trains Minister of Transportation Regulation No. KM 31 of 2007
17 Credit on Food and Energy Security Minister of Finance RegulationNo. 79/PMK.05/2007
30 Sixth Amendment to Minister of Finance Regulation Number 92/PMK.02/2005 regarding Particular Type of Export Good and its Export Tax
Minister of Finance Regulation No. 83/PMK.02/2007
Date Regulation/Policy Description

213
31 Selling Price of Piped Natural Gas to Non Household and Small Consumers of PT PGN
Minister of Energy and Mineral Resources Regulation No. 007 of 2007
August
6 Export Reference Price on Particular Export Goods Minister of Trade Regulation No. 32/M-DAG/PER/8/2007
7 Import Duty Exemption on Hot Rolled Coil (HRC) < 2 mm by National Steel Industry
Minister of Finance Regulation No. 85/PMK.011/2007
15 Amendment to Act Number 11 of 1995 on Excise Act No. 39 of 2007
31 Import Duty on Rice Minister of Finance Regulation No. 93/PMK.011/2007
31 Seventh Amendment to Minister if Finance Regulation Number 92/PMK.02/2005 on Particular Export Goods and Export Tax
Minister of Finance Regulation No. 94/PMK.011/2007
31 Export Reference Price on Particular Export Goods Minister of Trade RegulationNo. 35/M-DAG/PER/8/2007
September
5 Import Duty Exemption on Equipment and Raw Material Used to Prevent Environmental Pollution
Minister of Finance Regulation No. 101/PMK.04/2007
5 Import Duty Exemption on Medicine Funded Using Government Budget for Public Needs
Minister of Finance Regulation No. 102/PMK.04/2007
5 Import Duty Exemption on Science Books Minister of Finance Regulation No. 103/PMK.04/2007
5 Import Duty Exemption on Seeds Used for Development of Agriculture, Livestock, and Fishery Industry
Minister of Finance Regulation No. 105/PMK.04/2007
5 Import Duty Exemption on Re-import of Exported Goods Minister of Finance Regulation No. 106/PMK.04/2007
5 Supervision on Import and Export Goods Minister of Finance Regulation No. 107/PMK.04/2007
6 Primary Dealer System Minister of Finance Regulation No. 108/PMK.08/2007
10 Integrated Single Window Service for Investment Governor of DKI Jakarta Regulation No. 112 of 2007
12 Third Amendment to Minister if Home Affair Regulation Number 15 of 2007on Calculation of Tax on Motor Vehicle and Change of Ownership Which is Not Covered by Minister if Home Affair Regulation Number 9 of 2007on Calculation of Tax on Motor Vehicle and Change of Ownership
Minister of Home Affair Regulation No. 43 of 2007
14 Amendment to Minister of Finance regulation Number 110/PMK.010/2006 regarding Goods Classification System and Import Duty
Minister of Finance Regulation No. 110/PMK.011/2007
19 Import Duty Exemption on Sea Product Catch Using Legalized Equipment
Minister of Finance Regulation No. 113/PMK.04/2007
20 BULOG Budget Related to Stock and Distribution Management and Rice Price Stabilization
Minister of Finance Regulation No.117/PMK.02/2007
24 Value Added Tax Paid by Government for Domestic Cooking Oil Minister of Finance Regulation No.118/PMK.011/2007
26 Export Reference Price on Particular Good Minister of Trade Regulation No.39/M-DAG/PER/9/2007
Date Regulation/Policy Description

214
28 Enhancing Effectiveness of Development of Small and Medium Scale Industry through One Village One Product Approach-OVOP in Industrial Center
Minister of Industry RegulationNo.78/M-IND/PER/9/2007
October
1 Province Minimum Wage of Gorontalo in 2008 Governor of Gorontalo Decree No. 267/28/K/2007
5 Procedure of Subsidized Cooking Oil Distribution to the Public Minister of Trade RegulationNo. 42/M-DAG/PER/10/2007
11 Province Minimum Wage and Sectoral Minimum Wage of Central Kalimantan in 2008
Governor of Central Kalimantan Regulation No. 29 of 2007
11 Province Minimum Wage of South Sulawesi in 2008 Governor of South Sulawesi Decree No. 2765/X/2007
11 Amendment to Minister of Trade Regulation Number 20/M-DAG/PER/9/2005 regarding Salt Import
Minister of Trade Regulation No. 44/M-DAG/PER/10/2007
22 Province Minimum Wage of Southeast Sulawesi in 2008 Governor of Southeast Sulawesi Regulation No. 25 of 2007
22 Province Minimum Wage of West Java in 2008 Governor of West Java DecreeNo. 561/Kep.519-Bangsos/2007
23 Amendment to Act Number 18 of 2006 regarding Government Budget in 2007
Act No. 41 of 2007
24 Import Duty Associated to Common Effective Preferential Tariff (CEPT) scheme
Minister of Finance Regulation No. 129/PMK.011/2007
24 Province Minimum Wage of Bali in 2008 Governor of Bali Regulation No. 41 of 2007
25 Export Reference Price on Particular Good Minister of Trade Regulation No. 45/M-DAG/PER/10/2007
26 Province Minimum Wage and Sectoral Minimum Wage of West Kalimantan in 2008
Governor of West Kalimantan Decree No. 917 of 2007
30 Allocation of Profit Sharing Fund of Income Tax Article Number 25 and 29 Domestic Private Taxpayers and Income Tax Article Number 21 in 2007
Minister of Finance Regulation No. 131.1/PMK.07/2007
30 Province Minimum Wage of DKI Jakarta in 2008 Governor of West Kalimantan Regulation No. 143 of 2007
30 Amendment to Minister of Finance Regulation Number 75/PMK.011/2007 regarding Import Duty Associated with ASEAN Korea-Free Trade Agreement (AK-FTA)
Minister of Finance Regulation No. 131/PMK.011/2007
30 Province Minimum wage of Banten in 2008 Governor of Banten Decree No. 561/Kep.680-Huk/2007
31 Province Minimum wage of East Kalimantan in 2008 Governor of East Kalimantan Decree No. 561/K.534/2007
November
1 Third Amendment to Minister of Finance Regulation Number 43/PMK.04/2005 regarding Basic Price and Excise of Tobacco Product
Minister of Finance Regulation No. 134/PMK.04/2007
1 Import Duty on Goods Related to ASEAN Integration System of Preference (AISP) for New ASEAN Member (Cambodia, Laos, Myanmar, and Vietnam)
Minister of Finance Regulation No. 135/PMK.011/2007
5 Province Minimum Wage of East Nusa Tenggara in 2008 Governor of NTT Decree No. 326/KEP/HK/2007
Date Regulation/Policy Description

215
8 Third Amendment to Directorate General of Custom and Excise Number 07/BC/2005 on Procedure of Retail Selling Price of Tobacco Product
Directorate General of Custom and Excise Regulation No. P-30/BC/2007
12 Custom Supervision on Import Minister of Finance Regulation No. 139/PMK.04/2007
12 Temporary Imports Minister of Finance Regulation No. 140/PMK.04/2007
12 Province Minimum Wage of DI Yogyakarta (DIY) in 2008 Governor of DIY Decree No. 171/KEP/2007
16 Revocation of West Java Governor Decree Number 561/Kep.1020.Bangsos/2006 and West Java Governor Decree Number 561/Kep.1142.Bangsos/2006 on Province Minimum Wage of Bandung, Sumedang, Kota Bandung, and Cimahi in 2007
Governor of West Java Decree No. 561/Kep.569-Bangsos/2007
19 Province Minimum Wage of Nanggroe Aceh Darussalam in 2008 Governor of NAD Regulation No. 67 of 2007
19 Minimum Wage in 35 Cities in Central Java Province in 2008 Governor of Central Java Decree No. 561.4/51/2007
20 Allocation of Special Allocation Fund in 2008 Minister of Finance Regulation No. 142/PMK.07/2007
21 Minimum Wage in East Java Cities in 2008 Governor of East Java Decree No. 188/399/KPTS/013/2007
22 Custom Regulation on Export Minister of Finance Regulation No. 145/PMK.04/2007
22 Exemption or Leniency on Import Duty of goods which become broken, vanished, reduced in quality, volume or weight.
Minister of Finance Regulation No. 147/PMK.04/2007
22 Re-export of Imported Goods Minister of Finance Regulation No. 149/PMK.04/2007
22 Minimum Wage of Bogor, Bekasi, Purwakarta, Sumedang, Bandung Barat, Kota Depok, Bekasi, and Cimahi in 2008
Governor of West Java Decree No. 561/KEP.575.Bangsos/2007
26 Amendment to Minister of Finance Regulation Number 127/PMK.03/2007 regarding Administration of Tax on Building and Land Revenue from Oil, Mining and Solar Energy Sector
Minister of Finance Regulation No. 151/PMK.03/2007
26 Province Minimum Wage of Riau in 2008 Governor of Riau RegulationNo. 38 of 2007
26 Province Minimum Wage of Riau Archipelago in 2008 Governor of Riau Archipelago Decree No. 355 of 2007
26 Export Reference Price on Particular Goods Minister of Trade Regulation No. 46/M-DAG/PER/11/2007
27 Third Amendment to Minister of Finance Decree Number 254/KMK.03/2001 regarding Appointment of Income Tax Collector Article Number 22, Type and Size of Tax, and Administration of Payment and Reporting
Minister of Finance Regulation No. 154/PMK.03/2007
27 Fiscal Capacity Mapping Associated With Channeling Government Foreign Loan to Regional in a form of Grant
Minister of Finance Regulation No. 153/PMK.07/2007
30 Province Minimum Wage of Jambi in 2008 Governor of Jambi Decree No. 416/Kep.Gub/DISNAKERTRANS/2007
Date Regulation/Policy Description

216
December
3 Operational Guidelines of Import Duty on Goods Associated with ASEAN-Korea Free Trade Area (AK-FTA)
Directorate General of Custom and Excise Circular Letter No. SE-23/BC/2007
10 Release of Imported Goods to be Used with Guarantee Minister of Finance Regulation No. 160/PMK.04/2007
18 Sectoral Province Minimum Wage of DKI Jakarta in 2008 Governor of DKI Jakarta Regulation Jakarta No. 171 of 2007
18 Province Minimum Wage of North Sumatera in 2008 Governor of North Sumatera Decree No. 561/PU48/K/2007
19 Export Reference Price on Particular Goods Minister of Trade RegulationNo. 48/M-DAG/PER/12/2007
27 Amendment to Presidential Regulation Number 77 of 2007 Regarding Negative Investment List and Sectors Open For Investment Under Certain Condition
Presidential RegulationNo. 111 of 2007
28 Import Regulation on Used Capital Goods Minister of Trade Regulation No. 49/M-DAG/PER/12/2007
28 Import Duty Exemption for Upstream Activity of Natural Gas, Oil, and Solar Energy
Minister of Finance Regulation No. 177/PMK.011/2007
Date Regulation/Policy Description

217
1. Gross Domestic Product by Expenditures 2182. Gross Domestic Product by Sectors 2193. Terms of Trade Effect on Gross Domestic
Product 220
4. Selected Agricultural Products 2205. Production, Harvested Area, and Average
Productivity of Food Crops 221
6. Selected Mining and Quarrying Products 2217. PLN Electric Power Distributions 2228. Regional Daily Minimum Wage by Province 2229. Approved Domestic Investment Projects by
Sector 223
10. Approved Distribution of Domestic Investment Projects by Province 224
11. Approved Foreign Direct Investment Projects by Sector 225
12. Approved Distribution of Foreign Direct Investment Projects by Province 226
13. Approved Foreign Direct Investment Projects by Country of Origin 227
14. Consumer Price Index 22815. Wholesale Price Index 22916. Inflation Rates in 45 Cities 23017. Balance of Payments 23118. Export Value of Non-Oil/Gas by Commodity 23219. Export Volume of Non-Oil/Gas by Commodity 23320. Export Value of Non-Oil/Gas by Country of
Destination 234
21a. Import Value of Non-Oil/Gas by Group of Commodities 235
21b. Import Volume of Non-Oil/Gas by Group of Commodities 236
22. Import Value of Non-Oil/Gas by Country of Origin (C&F) 237
23. Exports of Oil/Gas 23824. Money Supply 23925. Changes in Money Supply and its Affecting
Factors 240
26. Interest Rates on Time Deposits by Denomination and Group of Banks 240
27. Interbank Money Market in Jakarta (Average Transaction Volume Interbank Money Market Morning & Evening Session - Various Maturity)
241
28. Issuance, Repayment, and Outstanding of Bank Indonesia Certificates (SBIs) 242
29. Discount Rates on Bank Indonesia Certificates (SBIs) 243
30. Government Revenues & Expenditures 24431. Budget Deficit Financing 24532. Funds Mobilization by Commercial Banks 24633. Commercial Banks’ Demand Deposits in Rupiah
and Foreign Currency by Group of Banks 247
34. Commercial Banks’ Time Deposits in Rupiah and Foreign Currency by Maturity 248
35. Commercial Banks’ Time Deposits in Rupiah by Ownership 249
36. Certificate of Deposits 25037. Commercial Banks’ Saving Deposits by Type of
Deposits 251
38. Interest Rates on Rupiah Credits by Group of Banks 252
39. Commercial Banks’ Credits in Rupiah and Foreign Currency by Economic Sector 252
40. Commercial Banks’ Credits in Rupiah and Foreign Currency by Type of Credit and Economic Sector
253
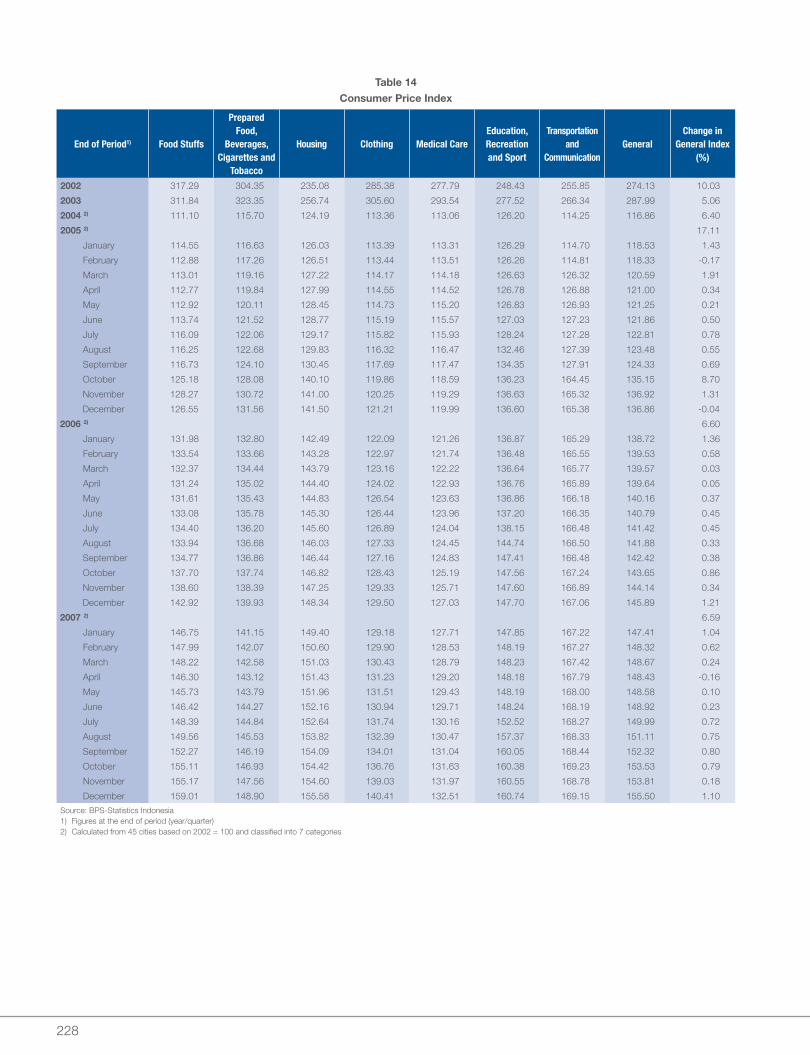
41. Commercial Banks’ Credits in Rupiah and Foreign Currency by Group of Banks and Economic Sector
254
42. Flow of Banknotes in Bank Indonesia Head Office and Regional Offices 254
43. Flow of Coins in Bank Indonesia Head Office and Regional Offices 255
44. World Economic Growth 25545. World Inflation Rate 25646. Interest Rates (%) and Exchange Rates 25647. World Trade Volume and Price 25748. Current Accounts in Industrial and Developing
Countries 257
Statistic Tables

218
Table 1
Gross Domestic Product by Expenditures
billions of rupiah
Type of Expenditure 2002 2003 2004 2005 2006* 2007**
Constant Prices 2000
Consumption 1,031,083.2 1,077,997.5 1,130,357.7 1,178,430.7 1,224,491.8 1,284,496.4
Private 920,749.6 956,593.4 1,004,109.0 1,043,805.1 1,076,928.1 1,131,186.7
Government 110,333.6 121,404.1 126,248.7 134,625.6 147,563.7 153,309.6
Gross domestic fixed capital formation 307,584.6 309,431.1 354,865.7 393,500.5 403,161.9 440,078.2
Change in stock 13,085.0 45,996.7 25,099.1 33,508.3 29,026.8 911.9
Statistical discrepancy 10,454.6 -26,895.8 8,757.2 -8,535.4 16,961.3 56,986.9
Exports of goods and services 566,188.4 599,516.4 680,621.0 793,613.0 868,256.5 937,849.2
less Import of goods and services 422,271.4 428,874.6 543,183.8 639,701.9 694,605.3 756,348.3
Gross Domestic Product 1,506,124.4 1,577,171.3 1,656,516.8 1,750,815.2 1,847,292.9 1,963,974.3
Net factor income from abroad -56,357.0 -81,230.8 -80,468.1 -107,381.7 -113,857.5 -116,241.2
Gross National Product 1,449,767.4 1,495,940.5 1,576,048.7 1,643,433.5 1,733,435.4 1,847,733.1
less Net indirect tax 57,684.9 65,876.5 46,040.6 34,698.9 55,425.6 56,308.9
less Depreciation 75,306.2 78,858.6 82,825.8 87,540.8 92,364.6 98,198.7
National Income 1,316,776.3 1,351,205.4 1,447,182.2 1,521,193.8 1,585,645.2 1,693,225.5
Current Market Prices
Consumption 1,364,183.3 1,535,779.4 1,723,943.9 2,010,576.9 2,380,735.5 2,841,068.3
Private 1,231,964.5 1,372,078.0 1,532,888.3 1,785,596.4 2,092,655.7 2,511,308.2
Government 132,218.8 163,701.4 191,055.6 224,980.5 288,079.9 329,760.1
Gross domestic fixed capital formation 353,967.0 392,788.6 515,381.2 655,854.3 805,470.3 983,830.9
Change in stock 35,979.5 122,681.9 36,911.1 39,974.6 42,382.2 169.7
Statistical discrepancy -5,553.7 -165,677.9 -87,673.3 -47,163.0 -69,837.1 -27,114.5
Exports of goods and services 595,514.0 613,720.8 739,639.3 945,121.8 1,036,316.5 1,161,956.4
less Import of goods and services 480,815.3 462,940.9 632,376.1 830,083.4 855,587.8 1,002,507.0
Gross Domestic Product 1,863,274.8 2,036,351.9 2,295,826.2 2,774,281.1 3,339,479.6 3,957,403.9
Net factor income from abroad -54,513.1 -77,413.9 -105,350.1 -135,000.5 -142,268.9 -156,567.6
Gross National Product 1,808,761.7 1,958,938.0 2,190,476.1 2,639,280.6 3,197,210.7 3,800,836.3
less Net indirect tax 71,186.3 85,272.2 62,534.0 53,719.3 98,142.7 112,188.8
less Depreciation 93,163.8 101,817.6 114,791.3 138,714.1 166,974.0 197,870.2
National Income 1,644,411.6 1,771,848.2 2,013,150.8 2,446,847.2 2,932,094.0 3,490,777.3
Memorandum item:
GDP
in billions of rupiah 1,863,274.8 2,036,351.9 2,295,826.2 2,774,281.1 3,339,479.6 3,957,403.9
in millions of $ 198,926.7 237,335.9 256,681.2 288,374.8 369,422.5 438,052.3
Per Capita Gross Domestic Product
in thousands of rupiah 8,828.1 9,535.7 10,610.1 12,675.5 15,029.7 17,581.4
in $ 942.5 1,111.4 1,186.2 1,317.6 1,662.6 1,947.1
Per Capita Gross National Product
in thousands of rupiah 8,569.8 9,173,183.9 10,123.2 12,089.0 14,384.0 14,004.5
in $ 914.9 1,069.1 1,131.8 1,256.6 1,591.6 1,550.2
Per Capita National Income
in thousands of rupiah 7,791.1 8,297,092.3 9,303.7 11,208.7 13,190.4 12,862.1
in $ 831.8 967.0 1,040.2 1,165.1 1,459.2 1,423.7Source: BPS-Statistics Indonesia* Provisional figures** Incomplete figures

219
Table 2
Gross Domestic Product by Sectors
billions of rupiah
SectorsConstant Prices 2000 Current Prices
2002 2003 2004 2005 2006* 2007** 2002 2003 2004 2005 2006* 2007**
Agriculture, livestock, forestry 232,973.5 240,387.3 247,163.6 253,881.7 262,402.8 271,586.9 298,876.8 305,783.5 329,124.6 364,169.3 433,223.4 547,235.6
Foods crops 115,925.5 119,164.8 122,611.7 125,801.8 129,548.6 134,075.6 153,666.0 157,648.8 165,558.2 181,331.6 214,346.3 268,124.4
Non-food crops 36,585.6 38,693.9 38,849.3 39,810.9 41,318.0 42,751.3 43,956.4 46,753.8 49,630.9 56,433.7 63,401.4 84,459.2
Livestock and products 29,393.5 30,647.0 31,672.5 32,346.5 33,430.2 34,530.7 41,328.9 37,354.2 40,634.7 44,202.9 51,074.7 62,095.8
Forestry 17,986.5 17,213.7 17,433.8 17,176.9 16,686.9 16,401.4 18,875.7 18,414.6 20,290.0 22,561.8 30,065.7 35,734.1
Fishery 33,082.3 34,667.9 36,596.3 38,745.6 41,419.1 43,827.9 41,049.8 45,612.1 53,010.8 59,639.3 74,335.3 96,822.1
Mining and quarrying 169,932.0 167,603.8 160,100.5 165,222.6 168,028.9 171,361.7 161,023.8 167,572.3 205,252.0 309,014.1 366,505.4 440,826.2
Crude petroleum and natural gas 108,130.6 103,087.2 98,636.3 96,894.6 95,853.1 94,718.6 93,092.0 95,152.1 118,484.9 177,605.9 200,081.6 234,157.5
Mining (excluding oil and gas) 49,066.5 51,007.3 46,947.1 52,694.2 55,239.6 58,250.3 51,277.5 53,313.2 65,122.4 104,599.1 130,700.6 160,459.0
Quarrying 12,734.9 13,509.3 14,517.1 15,633.8 16,936.2 18,392.8 16,654.3 19,107.0 21,644.7 26,809.1 35,723.2 46,209.7
Manufacturing 419,388.1 441,754.9 469,952.4 491,561.4 514,100.3 538,077.9 553,746.6 591,597.6 644,342.6 760,361.3 919,532.7 1,068,806.4
Oil and gas 52,179.5 52,609.3 51,583.9 48,658.8 47,851.2 47,816.3 69,660.0 100,344.9 94,263.4 138,440.9 172,094.9 182,296.3
Petroleum and refinery 21,820.0 22,374.1 22,322.3 21,207.2 20,806.9 20,776.6 43,448.5 50,989.5 59,062.0 89,629.6 117,952.2 122,096.5
LNG 30,359.5 30,235.2 29,261.6 27,451.6 27,044.3 27,039.7 26,211.5 49,355.4 35,201.4 48,811.3 54,142.7 60,199.8
Non-oil and gas 367,208.6 389,145.6 418,368.5 442,902.6 466,249.1 490,261.6 484,086.7 491,252.7 550,079.2 621,920.4 747,437.8 886,510.1
Food, beverage and tobacco 113,474.8 116,528.6 118,149.3 121,395.6 130,148.9 136,722.4 145,809.2 154,154.8 163,553.7 177,753.1 212,725.5 264,080.3
Textile, leather product and footwear
48,484.9 51,483.6 53,576.3 54,277.1 54,944.2 52,922.5 69,811.3 67,575.1 71,474.1 77,087.2 90,119.3 93,605.5
Wood and wood product 20,510.3 20,754.3 20,325.5 20,138.5 20,006.2 19,657.6 29,575.6 29,898.4 31,225.9 35,247.5 44,605.4 54,884.6
Paper and printing 20,045.2 21,731.0 23,384.2 23,944.2 24,444,8 25,861.0 23,685.8 27,792.4 31,036.3 33,898.8 39,637.5 45,404.2
Chemical and rubber product
45,171.4 50,008.7 54,513.6 59,293.1 61,947.9 65,470.0 73,790.8 56,760.5 64,012.6 76,213.6 94,078,8 110,769.3
Cement and non-metal quarrying goods
12,830.6 13,735.9 15,045.2 15,618.1 15,700.1 16,233.3 19,010.9 19,215.6 21,588.3 24,589.1 29,014.1 32,816.6
Basic metal, iron and steel 8,935.5 8,222.9 8,008.0 7,712.0 8,076.8 8,213.3 14,046.0 13,421.3 16,154.6 18,382.7 20,687.0 22,907.9
Transportation, machine and equipment
94,982.0 103,414.7 121,683.3 136,744.6 147,063.8 161,375.6 105,015.6 118,171.9 145,971.3 172,957.1 209,460.5 254,468.3
Others 2,773.9 3,265.9 3,683.1 3,779.4 3,916.4 3,805.9 3,341.4 4,262.7 5,062.4 5,791.3 7,109.7 7,573.4
Electricity, gas and water supply 9,868.2 10,349.2 10,897.6 11,584.1 12,251.1 13,525.2 15,391.9 19,144.2 23,730.3 26,693,8 30,354,8 34,726.2
Construction 84,469.8 89,621.8 96,334.4 103,598.4 112,233.6 121,901.0 101,573.5 125,337.1 151,247.6 195,110.6 251,132.3 305,215.7
Trade, hotels, and restaurants 243,409.3 256,516.6 271,142.2 293,654.0 312,520.8 338,945.7 314,646.8 335,100.4 368,555.9 431,620.2 501,542.1 590,822.3
Wholesale and retail trade 199,649.1 210,653.3 222,290.0 241,887.1 257,847.1 280,747.0 245,564.3 260,578.4 287,553.5 338,667.2 393,047.1 467,790.4
Hotels and restaurants 43,760.2 45,863.3 48,852.2 51,766.9 54,673.7 58,198.7 69,082.4 74,522.0 81,002.4 92,953.0 108,495.0 123,031.9
Transportation and communication
76,173.1 85,458.4 96,896.7 109,261.5 124,975.7 142,944.5 97,970.2 118,916.4 142,292.0 180,584.9 231,808.6 265,256.9
Transportation 52,386.5 57,463.0 62,495.7 66,404.7 70,807.0 72,775.9 66,117.7 79,535.5 88,310.3 110,157.3 142,799.0 149,926.6
Communication 23,786.6 27,995.4 34,401.0 42,856.8 54,168.7 70,168.6 31,852.6 39,380.9 53,981.7 70,427.6 89,009.6 115,330.3
Finance, rental and business service
130,928.1 140,374.4 232,543.4 161,252.2 170,074.3 183,659.3 154,442.2 174,074.5 194,410.9 230,522.7 269,121.4 305,216.0
Bank1) 71,727.0 76,434.0 81,420.1 85,570.1 87,697.1 94,721.8 81,916.7 89,795.4 96,466.9 110,677.4 124,498.4 140,610.9
Rental and business services 59,201.1 63,940.4 69,703.2 75,682.1 82,377.2 88,937.5 72,525.5 84,279.1 97,944.0 119,845.3 144,623.0 164,605.1
Services 138,982.3 145,104.9 152,906.1 160,799.3 170,705.4 181,972.1 165,602.8 198,825.9 236,870.3 276,204.2 336,258.9 399,298.6
Public administration 70,482.4 71,147.7 72,323.6 73,700.1 76,618.4 80,778.2 83,293.5 101,605.6 121,129.4 135,132.8 167,799.7 205,343.9
Private 68,499.9 73,957.2 80,582.5 87,099.2 94,087.0 101,193.9 82,309.4 97,220.3 115,740.9 141,071.4 168,459.2 193,954.7
GROSS DOMESTIC PRODUCT 1,506,124.4 1,577,171.3 1,656,516.8 1,750,815.2 1,847,292.9 1,963,974.3 1,863,274.7 2,036,351.9 2,295,826.2 2,774,281.1 3,339,479.6 3,957,403.9
Non-Oil/Gas 1,345,814.2 1,421,474.8 1,506,296.6 1,605,261.8 1,703,588.6 1,821,439.4 1,700,522.7 1,840,854.9 2,083,077.9 2,458,234.3 2,967,303.1 3,540,950.1
Oil/Gas 160,310.1 155,696.5 150,220.2 145,553.4 143,704.3 142,534.9 162,752.0 195,497.0 212,748.3 316,046.8 372,176.5 416,453.8
Source: BPS-Statistics Indonesia1) Including non-bank financial institutions and financial supporting services.* Provisional figures** Incomplete figures

220
Table 4
Selected Agricultural Products
Item 2002 2003 2004 2005 2006 2007
Food crops (thousands of tons)
Paddy 51,489.7 52,137.6 54,088.5 54,151.1 54,663.6 57,048.6 1)
Corn 9,654.1 10,886.4 11,225.2 12,523.9 11,610.6 10,152.0 2)
Cassava 16,913.1 18,523.8 19,424.7 19,321.2 19,927.6 12,617.0 2)
Sweet potatoes 1,771.6 1,991.5 1,901.8 1,857.0 1,851.8 1,258.0 2)
Peanuts 718.1 785.5 837.5 836.3 838.0 636.0 2)
Soybeans 673.1 671.6 723.5 808.4 749.0 405.0 2)
Mung beans 288.1 335.2 310.4 309.7 - - 2)
Estate crops (thousands of tons)
Dry rubber 403.7 396.1 403.8 432.2 450.4 191.2 3)
Palm oil 6,195.6 6,923.5 8,479.3 10,119.0 10,869.4 4,505.3 3)
Palm Kernel 1,209.7 1,529.2 1,862.0 2,115.9 2,315.8 966.3 3)
Chocolate 48.2 56.6 54.9 55.1 55.6 22.2 3)
Coffee 26.7 29.4 29.2 24.8 25.1 2.0 3)
Tea 120.4 126.2 125.5 128.2 114.4 54.0 3)
Kina 0.6 0.8 0.7 0.8 1.4 0.1 3)
Sugar cane 1,901.3 1,991.6 2,051.6 2,241.7 2,266.7 287.2 3)
Tobacco 5.3 5.2 2.7 4.0 3.9 1.2 3)
Forestry (thousands of M3)
Logs 8,660.0 11,423.5 13,548.9 24,222.6 21,792.1 -
Sawn timber 623.5 762.6 433.0 1,471.6 679.2 -
Plywood 1,694.4 6,110.5 4,514.3 4,533.7 3,811.8 -
Livestock
Meat (thousands of ton) 1.769.8 1.872.6 2.020.4 1.817.0 2.062.9 2.169.8
Eggs (thousands of ton) 945.8 973.6 1.107.4 1.051.5 1.204.4 1.297.2
Milk (millions of liter) 493.4 553.4 549.9 536.0 616.5 636.9
Fishery (thousands of tons)
Sea 4.073.5 4.383.1 1.006.1 1.273.0 1.106.0 -
Land 305.0 308.7 260.0 890.0 727.0 -
Source: Ministry of Agriculture, Ministry of Forestry, BPS-Statistics Indonesia1) ARAM III2) Data up to August 20073) Data up to May 2007
Table 3
Terms of Trade Effect on Gross Domestic Product
billions of rupiah
Item 2002 2003 2004 2005 2006* 2007**
1 Export of goods and services at current market prices 595,514.0 613,720.8 739,639.3 945,121.8 1,036,316.5 1,161,956.4
2 Export of goods and services at constant market prices 566,188.4 599,516.4 680,621.0 793,613.0 868,256.5 937,849.2
3 Export deflator (1:2) x 100) 105.2 102.4 108.7 119.1 119.4 123.9
4 Imports of goods and services at current market prices 480,815.3 462,940.9 632,376.1 830,083.4 855,587.8 1,002,507.0
5 Imports of goods and services at constant market prices 422,271.4 428,874.6 543,183.8 639,701.9 694,605.3 756,348.3
6 Import deflator (4:5) x 100) 113.9 107.9 116.4 129.8 123.2 132.5
7 Terms of trade index (3:6) x 100) 92.4 94.8 93.3 91.8 96.9 93.5
8 Changes in terms of trade index (%) -5.39 2.67 -1.57 -1.68 5.58 -3.53
9 Real import capacity of export (1:6) x 100) 523,004.4 568,559.1 635,318.2 729,043.9 810,413.1 876,646.1
10 Terms of trade effect (9 - 2) -43,184.0 -30,957.3 -45,302.7 -62,952.0 -54,090.4 -61,203.1
11 Changes in terms of trade effect (%) 218.19 -28.31 46.34 38.96 -14.08 13.15
12 GDP at constant 2000 market prices 1,506,124.4 1,577,171.3 1,656,516.8 1,750,815.2 1,847,292.9 1,963,974.3
13 Changes in GDP at constant market prices (%) 4.38 4.72 5.03 5.69 5.51 6.32
14 Gross Domestic Income (10 - 12) -1,549,308.4 -1,608,128.6 -1,701,819.5 -1,813,608.1 -1,900,745.3 -2,025,177.4
15 Changes in Gross Domestic Income (%) 6.37 3.80 5.83 6.57 4.80 6.55Source: BPS-Statistics Indonesia* Provisional figures** Incomplete figures

221
Table 6
Selected Mining and Quarrying Products
Product Unit 2002 2003 2004 2005 2006 20072)
Oil and Gas Mining
Crude oil1) Millions of barrels 474.9 421.0 438.5 387.7 381.5 253.3
LNG Thousands of metric tons 1,352,878.0 1,347,349.0 1,390,466.0 1,338,782.0 1,292,364.0 867,115.0
LPG Thousands of metric tons 1,792.6 1,921.8 1,677.6 1,581.7 1,861.3 1,249.5
Non-Oil/Gas Mining
Coal Thousands of metric tons 103,060.4 114,610.1 126,850.8 141,058.5 178,168.9 106,880.8
Nickel Thousands of metric tons 4,366.2 4,395.4 4,119.0 3,707.0 4,353.8 2,967.6
Copper Thousands of metric tons 3,786.7 3,328.3 2,810.3 3,553.8 2,938.0 1,992.2
Tin Thousands of metric tons 88.1 71.7 70.3 78.4 80.9 54.3
Bauxite Thousands of metric tons 1,283.5 1,262.6 1,330.8 1,419.7 1,501.9 970.4
Iron sand Thousands of metric tons 378.6 245.4 94.3 32.2 5.5 -
Gold Thousands of kilograms 142.2 141.0 92.4 142.0 85.4 92.4
Silver Thousands of kilograms 288.8 235.2 262.9 348.4 261.4 179.2
Source: BPS-Statistic Indonesia1) Including condenser 2) Data up to August 2006
Table 5
Production, Harvested Area, and Average Productivity of Food Crops
Description 2002 2003 2004 2005 2006 2007
Production (thousands of tons)
Paddy 51,489.7 52,137.6 54,088.5 54,151.1 54,663.6 57,048.6 1)
Corn 9,654.1 10,886.4 11,225.2 12,523.9 11,610.6 10,152.0 2)
Cassava 16,913.1 18,523.8 19,424.7 19,321.2 19,927.6 12,617.0 2)
Sweet potatoes 1,771.6 1,991.5 1,901.8 1,857.0 1,851.8 1,258.0 2)
Peanuts 718.1 785.5 837.4 836.3 838.0 636.0 2)
Soybeans 673.1 671.6 723.5 808.4 749.0 405.0 2)
Mung beans 288.1 335.2 310.4 309.7 - -
Harvested area (thousands of hectares)
Paddy 11,521.2 11,488.0 11,923.0 11,839.1 11,854.9 -
Corn 3,126.8 3,358.5 3,356.9 3,626.0 3,346.4 -
Cassava 1,276.5 1,244.5 1,255.8 1,213.5 1,222.8 -
Sweet potatoes 177.3 197.5 184.6 178.3 176.2 -
Peanuts 647.0 683.4 723.4 720.5 706.6 -
Soybeans 544.5 526.8 565.2 621.5 581.6 -
Mung beans 313.6 330.4 311.8 308.0 - -
Productivity (quintal per hectare)
Paddy 44.7 45.4 45.4 45.7 46.2 -
Corn 30.9 32.4 33.4 34.5 34.7 -
Cassava 132.0 149.0 155.0 159.0 163.0 -
Sweet potatoes 100.0 101.0 103.0 104.0 105.0 -
Peanuts 11.1 11.5 11.6 11.6 11.9 -
Soybeans 12.4 12.8 12.8 13.1 12.9 -
Mung beans 9.2 10.1 n.a. 10.1 - -Source: BPS-Statistics Indonesia1) ARAM III2) Data up to August 2007

222
Table 7
PLN Electric Power Distributions
millions of KWJ
2002 2003 2004 2005 2006 2007
Total 86,504 89,782 99,111 105,992 111,402 119,969
Social 1,849 2,021 2,224 2,421 2,596 2,896
House hold 33,799 35,541 38,322 40,906 43,422 46,950
Business 11,208 12,584 14,128 15,628 16,887 19,036
Industry 36,753 36,361 40,057 42,123 43,280 45,432
Public 2,547 2,920 3,626 3,878 4,188 4,595
Multipurpose 205 356 752 1,035 1,030 1,060
Source: PT Perusahaan Listrik Negara (PLN)
Table 8
Regional Daily Minimum Wage by Province
rupiah
Province 2002 2003 2004 2005 2006 2007
Nanggroe Aceh Darussalam 330,000 425,000 550,000 620,000 820,000 850,000
North Sumatera 464,000 505,000 537,000 600,000 737,794 761,000
West Sumatera 385,000 435,000 480,000 540,000 650,000 650,000
Riau 394,000 437,500 476,875 551,500 637,000 710,000
Riau Archipelago n.a. 557,000 760,000 805,000
Jambi 304,000 390,000 425,000 485,000 563,000 658,000
South Sumatera 331,500 403,500 460,000 503,700 604,000 753,000
Bangka Belitung n.a. n.a. n.a. 560,000 640,000 830,000
Bengkulu 295,000 330,000 363,000 430,000 516,000 516,000
Lampung 310,000 350,000 377,500 405,000 505,000 555,000
Banten 360,000 475,000 515,000 585,000 661,613 661,613
DKI Jakarta 591,266 631,554 671,550 711,843 819,100 816,100
West Java 280,779 320,000 366,500 408,260 447,654 447,654
Central Java 314,500 340,400 365,000 390,000 450,000 500,000
DI Yogyakarta 312,750 360,000 365,000 400,000 460,000 460,000
East Java 245,000 281,750 310,000 340,000 390,000 448,500
Bali 341,000 341,000 425,000 447,500 510,000 622,000
East Nusa Tenggara 330,000 350,000 400,000 450,000 550,000 600,000
West Kalimantan 380,000 400,000 420,000 445,200 512,000 560,000
Central Kalimantan 362,000 425,000 482,250 523,698 634,260 665,973
South Kalimantan 377,500 425,000 482,212 536,300 629,000 745,000
East Kalimantan 500,000 540,000 572,652 600,000 684,000 766,500
North Sulawesi 438,000 495,000 545,000 600,000 713,500 750,000
Central Sulawesi 350,000 410,000 450,000 490,000 575,000 615,000
South Sulawesi 375,000 415,000 455,000 510,000 612,000 673,200
Southeast Sulawesi 325,000 390,000 470,000 498,600 573,400 640,000
Maluku 285,000 370,000 450,000 500,000 575,000 635,000
North Maluku 322,000 322,000 400,000 440,000 528,000 660,000
Gorontalo 375,000 410,000 430,000 435,000 527,000 560,000
Papua 530,000 600,000 650,000 700,000 822,500 987,000Source: Ministry of Manpower and Transmigration

223
Table 9
Approved Domestic Investment Projects by Sectorbillions of rupiah
Sector 2002 2003 2004 2005 2006 2007*
Agriculture, forestry and fishery 1,453.7 1,929.1 1,847.9 4,494.1 8,767.8 21,948.4
Agriculture 1,452.2 1,657.9 1,845.0 4,338.7 8,712.5 21,118.3
Forestry 0.0 176.9 0.0 140.4 53.3 0.0
Fishery 1.5 94.3 2.9 15.0 2.0 830.1
Mining 786.7 752.8 662.4 982.3 437.4 3,346.1Manufacturing 15,853.5 40,442.7 20,631.6 26,807.9 131,753.3 144,226.2
Food 4,967.6 4,246.6 10,271.5 8,073.0 13,789.3 17,847.7
Textile 440.0 2,111.7 1,476.8 710.4 1,279.0 1,024.3
Wood 409.1 562.9 120.7 685.3 731.5 185.1
Paper 150.1 245.0 1,741.1 6,478.8 82,465.4 83,527.1
Chemical and pharmaceutical 1,953.1 30,204.6 3,046.2 1,686.5 24,281.0 33,396.7
Non-metal mineral 217.1 932.5 313.5 3,310.5 1,666.9 4,577.6
Basic metal 7,179.2 0.0 0.0 0.0 0.0 0.0
Metal products 0.0 1,002.6 748.8 1,951.2 5,458.3 1,744.7
Others 537.3 1,136.8 2,913.0 3,912.2 2,081.9 1,923.0
Construction 1,499.8 1,773.7 1,473.1 1,537.9 3,028.4 1,223.2Hotel 683.2 929.7 552.1 4,049.7 8,913.7 1,417.9Transportation 3,117.7 2,022.0 1,885.1 2,375.1 1,930.3 1,109.7Real estate and office buildings 255.1 1.4 0.0 0.0 1.0 481.5Other services 1,612.6 633.4 9,695.4 10,330.4 7,935.3 15,123.3Total 25,262.3 48,484.8 36,747.6 50,577.4 162,767.2 188,876.3Source: Investment Coordination Board (BKPM)* Data up to October 2007

224
Table 10
Approved Distribution of Domestic Investment Projects by Provincebillions of rupiah
Province 2002 2003 2004 2005 2006 2007*
Java and Madura 12,780.9 11,283.4 20,456.3 23,086.8 26,603.8 48,552.9
DKI Jakarta 4,013.7 2,667.6 3,481.0 4,079.7 2,697.6 5,605.2
West Java 5,587.3 5,567.3 7,555.6 11,029.4 8,540.8 21,539.1
Banten 1.558.4 3.621.9 5,136.5 6,305.7 4,063.6
Central Java 1,462.9 1.947.2 6.013.6 1.856.7 3,809.9 1,285.7
DI Yogyakarta 43.4 23.0 7.7 646.9 89.6 4.0
East Java 1,673.6 1,078.3 3,398.4 5,474.1 5,160.2 16,055.3
Sumatera 5,946.2 3,500.9 10,217.8 13,235.9 43,455.3 41,365.6
DI Aceh 1.2 98.9 71.0 0.0 218.6 5.7
North Sumatera 2,275.6 868.5 3,400.7 3,598.2 11,247.0 9,349.4
West Sumatera 0.0 289.8 712.3 512.5 1,847.2 1,934.6
Riau 1,474.2 770.7 4,289.7 4,805.6 21,241.8 4,874.3
Jambi 447.4 107.4 691.0 2,109.0 834.2 17,710.9
South Sumatera 12.0 839.9 358.2 1,297.1 2,983.2 4,732.1
Bangka Belitung 301.0 0.0 0.0 0.0 1,487.0
Bengkulu 55.2 81.9 104.2 169.1 0.0 754.8
Lampung 1,680.6 443.8 590.7 744.4 5.083.3 516.3
Kalimantan 2,722.9 2,100.2 2,465.4 5,212.2 78,789.7 68,217.5
West Kalimantan 23.7 485.5 336.2 1,544.1 21,280.2 26,402.4
Central Kalimantan 491.8 516.0 254.7 965.5 2,099.3 20,563.6
South Kalimantan 149.4 346.4 353.5 666.8 1,613.9 17,941.1
East Kalimantan 2,058.0 752.3 1,521.0 2,035.8 53,796.3 3,310.4
Sulawesi 3,546.0 29,766.9 2,593.7 4,034.4 4,578.7 9,352.5
North Sulawesi 127.8 142.3 374.6 460.0 59.4 393.1
Central Sulawesi 94.8 217.7 1,179.3 2,773.4 72.0 0.0
South Sulawesi 141.4 29,239.8 646.1 133.2 2,407.3 3,765.6
Southeast Sulawesi 3,182.0 167.1 393.0 667.8 2,040.0 5,193.8
Gorontalo 0.7 0.0 0.0
Nusa Tenggara 15.4 128.1 0.0 34.0 275.8 57.9
West Nusa Tenggara 0.4 5.8 0.0 34.0 0.0 3.5
East Nusa Tenggara 15.0 122.3 0.0 0.0 275.8 54.4
Bali 28.8 706.5 830.3 3,245.2 8,527.6 665.9East Timor 0.0 0.0 0.0 0.0 0.0 0.0Maluku 68.0 2.9 140.1 121.1 5.0 823.6Papua 154.1 995.9 44.0 1,607.8 531.3 19,840.4Total 25,262.3 48,484.8 36,747.6 50,577.4 162,767.2 188,876.3Source: Investment Coordination Board (BKPM)* Data up to October 2007

225
Table 11
Approved Foreign Direct Investment Projects by Sectormillions of $
Sector 2002 2003 2004 2005 2006 2007*
Agriculture, forestry and fishery 458.9 178.9 329.7 606.0 963.5 1.491.6
Agriculture 446.3 57.2 196.9 462.0 845.2 1.261.7
Forestry 8.9 95.2 0.2 128.6 13.6 17.4
Fishery 3.7 26.5 132.6 15.4 104.7 212.5
Mining 49.2 17.8 66.3 775.9 325.7 817.6Manufacturing 3,208.2 6,457.4 6,334.3 6,028.0 8,307.4 27,209.4
Food 267.3 408.5 721.8 642.6 1,035.2 1,724.4
Textile 89.9 123.1 407.9 139.5 163.0 274.5
Wood 30.4 235.0 15.5 102.2 138.8 223.9
Paper 10.0 1,300.0 67.0 227.8 1,170.5 6,883.7
Chemical and pharmaceutical 1,872.7 3,034.6 3,413.5 2,878.9 1,528.4 15,267.4
Non-metal mineral 32.6 711.4 37.7 368.1 785.1 319.1
Basic metal 348.9 0.0 0.0 0.0 0.0 0.0
Metal products 0.0 323.4 1,013.5 695.0 2.918.9 1.611.9
Others 556.4 321.4 657.4 973.9 567.5 904.5
Construction 287.7 787.7 954.0 1,777.2 2,561.3 1,908.5Hotel 254.6 488.2 587.2 259.1 258.3 354.8Transportation 3,713.2 4,160.2 586.5 3,107.3 294.0 4,690.4Real estate and office building 7.4 10.3 339.6 124.8 57.2 1,043.9Other services 1,764.9 1,106.7 1,079.7 901.0 2,856.6 2,629.0Total 9,744.1 13,207.2 10,277.3 13,579.3 15,624.0 40,145.2Source: Investment Coordination Board* Data up to October 2007

226
Table 12
Approved Distribution of Foreign Direct Investment Projects by Provincemillions of $
Province 2002 2003 2004 2005 2006 2007*
Java and Madura 4,780.9 7,430.6 8,100.0 10,632.2 6,976.3 12,395.7
DKI Jakarta 3,373.4 5,611.6 1,728.4 5,206.1 2,673.8 6,081.9
West Java 1,053.6 1,294.2 2,671.6 1,438.3 1,605.0 3,764.9
Banten 383.2 585.0 2,774.1 1,353.9 1,223.6
Central Java 71.6 89.7 3,371.4 627.3 163.7 329.1
DI Yogyakarta 19.8 17.4 3.5 59.5 49.7 23.7
East Java 262.5 417.7 325.1 526.9 1,130.2 972.5
Sumatera 2,078.2 1,541.2 1,111.6 1,355.8 4,876.1 15,640.3
Nanggroe Aceh Darussalam 0.0 82.5 9.5 2.4 227.9 59.3
North Sumatera 44.5 57.6 151.5 235.8 1,516.5 423.7
West Sumatera 10.0 45.3 32.1 144.6 64.7 123.5
Riau 1,152.4 1,175.3 536.4 296.1 2,288.2 13,703.5
Jambi 21.6 0.6 35.7 21.9 121.9 56.9
South Sumatera 764.0 178.8 80.0 611.9 386.3 934.5
Bangka Belitung 19.6 52.6 58.6 37.5 86.8
Bengkulu 0.0 0.0 1.4 12.1 41.6 0.8
Lampung 85.7 1.1 265.0 31.0 191.5 251.3
Kalimantan 2,236.6 780.7 158.6 1,005.3 2,958.9 5,407.0
West Kalimantan 1.3 33.0 38.8 296.6 469.1 498.5
Central Kalimantan 8.9 32.2 24.3 66.4 203.3 510.4
South Kalimantan 34.0 2.1 7.1 80.9 1.594.2 267.3
East Kalimantan 2,192.4 713.4 88.4 561.4 692.3 4,130.8
Sulawesi 380.2 225.2 363.2 310.7 361.7 6,223.5
North Sulawesi 1.3 181.3 50.0 73.2 206.6 39.9
Central Sulawesi 0.3 0.0 0.5 170.2 3.0 1,044.5
Gorontalo 0.1 85.6 3.5 14.6 1.7
South Sulawesi 373.6 43.8 226.1 54.8 136.0 5,126.5
Southeast Sulawesi 5.0 0.0 1.0 9.0 1.5 10.9
Nusa Tenggara 121.9 2,806.0 18.9 59.3 32.5 42.7
West Nusa Tenggara 119.4 2,805.6 15.9 54.7 27.2 22.9
East Nusa Tenggara 2.5 0.4 3.0 4.6 5.3 19.8
Bali 86.6 198.5 414.3 191.5 227.3 182.4East Timor 0.0 0.0 0.0 0.0 0.0 0.0Maluku 0.0 3.0 59.9 10.7 69.7 128.6Papua 59.7 222.0 51.0 13.8 121.5 125.0Total 9,744.1 13,207.2 10,277.5 13,579.3 15,624.0 40,145.2Source: Investment Coordination Board* Data up to October 2007

227
Table 13
Approved Foreign Direct Investment Projects by Country of Originmillion of $
Country of Origin 2002 2003 2004 2005 2006 2007*
Europe 1,358.3 1,264.1 1,956.4 2,125.3 2,220.3 2,133.0
Netherlands 244.1 99.4 258.8 472.3 78.2 645.0
Belgium 7.1 5.9 10.2 16.4 3.2 4.6
United Kingdom 720.0 966.1 1,317.2 1,529.1 1,038.5 865.8
Germany 35.7 170.8 29.9 40.1 19.9 36.0
France 262.6 5.7 9.2 8.8 355.9 91.8
Switzerland 74.3 0.3 299.0 27.5 477.7 234.4
Others 14.5 15.9 32.1 31.1 246.9 255.4
America 480.9 380.0 206.6 634.7 395.8 13.531.1
United States 467.7 173.5 133.3 91.3 161.7 13.319.0
Canada 7.2 2.3 1.4 534.7 210.2 4.8
Others 6.0 204.2 71.9 8.7 23.9 207.3
Asia 6,138.1 2,661.5 6,431.2 6,649.9 6,856.3 11,090.1
Hong Kong 1,712.0 169.5 20.1 101.9 398.7 258.9
Japan 510.4 1,252.2 1,683.5 916.0 443.6 598.3
South Korea 369.7 122.1 402.3 617.5 877.4 895.4
Malaysia 71.6 155.3 461.4 485.5 2,328.3 2,364.6
Philippines 63.2 39.7 13.2 12.6 42.5 3.7
Singapore 3,328.0 518.9 576.5 1,267.0 2,165.9 5,556.7
Taiwan 37.7 136.7 68.5 129.5 218.6 51.4
Thailand 4.7 9.8 98.9 122.0 125.0 328.3
Others 40.8 257.3 3,106.8 2,997.9 256.3 1,032.8
Australia 233.0 125.6 588.4 523.4 50.2 441.8Africa 875.5 4,462.2 360.9 151.9 1,487.5 1,716.9Joint countries 658.3 4,313.8 733.8 3,494.1 4,613.9 11,232.3Total 9,744.1 13,207.2 10,277.3 13,579.3 15,624.0 40,145.2
Source: Investment Coordination Board* Data up to October 2007
228
Table 14
Consumer Price Index
End of Period1) Food Stuffs
Prepared Food,
Beverages, Cigarettes and
Tobacco
Housing Clothing Medical CareEducation, Recreation and Sport
Transportation and
CommunicationGeneral
Change in General Index
(%)
2002 317.29 304.35 235.08 285.38 277.79 248.43 255.85 274.13 10.03
2003 311.84 323.35 256.74 305.60 293.54 277.52 266.34 287.99 5.06
2004 2) 111.10 115.70 124.19 113.36 113.06 126.20 114.25 116.86 6.40
2005 2) 17.11
January 114.55 116.63 126.03 113.39 113.31 126.29 114.70 118.53 1.43
February 112.88 117.26 126.51 113.44 113.51 126.26 114.81 118.33 -0.17
March 113.01 119.16 127.22 114.17 114.18 126.63 126.32 120.59 1.91
April 112.77 119.84 127.99 114.55 114.52 126.78 126.88 121.00 0.34
May 112.92 120.11 128.45 114.73 115.20 126.83 126.93 121.25 0.21
June 113.74 121.52 128.77 115.19 115.57 127.03 127.23 121.86 0.50
July 116.09 122.06 129.17 115.82 115.93 128.24 127.28 122.81 0.78
August 116.25 122.68 129.83 116.32 116.47 132.46 127.39 123.48 0.55
September 116.73 124.10 130.45 117.69 117.47 134.35 127.91 124.33 0.69
October 125.18 128.08 140.10 119.86 118.59 136.23 164.45 135.15 8.70
November 128.27 130.72 141.00 120.25 119.29 136.63 165.32 136.92 1.31
December 126.55 131.56 141.50 121.21 119.99 136.60 165.38 136.86 -0.04
2006 2) 6.60
January 131.98 132.80 142.49 122.09 121.26 136.87 165.29 138.72 1.36
February 133.54 133.66 143.28 122.97 121.74 136.48 165.55 139.53 0.58
March 132.37 134.44 143.79 123.16 122.22 136.64 165.77 139.57 0.03
April 131.24 135.02 144.40 124.02 122.93 136.76 165.89 139.64 0.05
May 131.61 135.43 144.83 126.54 123.63 136.86 166.18 140.16 0.37
June 133.08 135.78 145.30 126.44 123.96 137.20 166.35 140.79 0.45
July 134.40 136.20 145.60 126.89 124.04 138.15 166.48 141.42 0.45
August 133.94 136.68 146.03 127.33 124.45 144.74 166.50 141.88 0.33
September 134.77 136.86 146.44 127.16 124.83 147.41 166.48 142.42 0.38
October 137.70 137.74 146.82 128.43 125.19 147.56 167.24 143.65 0.86
November 138.60 138.39 147.25 129.33 125.71 147.60 166.89 144.14 0.34
December 142.92 139.93 148.34 129.50 127.03 147.70 167.06 145.89 1.21
2007 2) 6.59
January 146.75 141.15 149.40 129.18 127.71 147.85 167.22 147.41 1.04
February 147.99 142.07 150.60 129.90 128.53 148.19 167.27 148.32 0.62
March 148.22 142.58 151.03 130.43 128.79 148.23 167.42 148.67 0.24
April 146.30 143.12 151.43 131.23 129.20 148.18 167.79 148.43 -0.16
May 145.73 143.79 151.96 131.51 129.43 148.19 168.00 148.58 0.10
June 146.42 144.27 152.16 130.94 129.71 148.24 168.19 148.92 0.23
July 148.39 144.84 152.64 131.74 130.16 152.52 168.27 149.99 0.72
August 149.56 145.53 153.82 132.39 130.47 157.37 168.33 151.11 0.75
September 152.27 146.19 154.09 134.01 131.04 160.05 168.44 152.32 0.80
October 155.11 146.93 154.42 136.76 131.63 160.38 169.23 153.53 0.79
November 155.17 147.56 154.60 139.03 131.97 160.55 168.78 153.81 0.18
December 159.01 148.90 155.58 140.41 132.51 160.74 169.15 155.50 1.10
Source: BPS-Statistics Indonesia1) Figures at the end of period (year/quarter)2) Calculated from 45 cities based on 2002 = 100 and classified into 7 categories

229
Table 15
Wholesale Price Index1)
Group 2002 2003 2004 2005 2006 2007Change 2007 to 2006 (%)
Agriculture 125 130 137 148 172 214 24.72
Mining and quarrying 121 123 135 147 169 187 10.81
Manufacturing 124 130 136 158 195 218 11.94
Import 112 114 127 149 162 186 14.64
Export 108 109 121 145 154 167 8.68
Oil and Gas 106 115 149 210 229 241 5.36
Non-Oil and Gas 109 107 112 125 130 143 10.42
General Index 118 122 131 151 172 195 13.59
Source: BPS-Statistics Indonesia1) Annual figure is the average of monthly index over the year

230
Table 16
Inflation Rates in 45 Citiespercent
City 2002 2003 20041) 2005 2006 2007
Lhokseumawe 10.99 4.53 7.36 17.57 11.47 4.18
Banda Aceh 10.14 3.50 6.97 41.11 9.54 11.00
Padang Sidempuan 10.18 4.07 8.99 18.47 10.02 5.87
Sibolga 11.58 3.94 6.64 22.39 5.03 7.13
Pematang Siantar 9.41 2.51 7.31 19.67 6.07 8.37
Medan 9.49 4.46 6.64 22.91 5.96 6.42
Padang 10.22 5.55 6.98 20.47 8.05 6.90
Pekanbaru 11.66 6.65 8.92 17.10 6.31 7.53
Batam 9.14 4.27 4.22 14.79 4.59 4.84
Jambi 12.62 3.79 7.25 16.50 10.66 7.42
Palembang 12.25 5.03 8.94 19.92 8.44 8.21
Bengkulu 10.11 4.14 4.67 22.22 6.52 5.00
Bandar Lampung 10.32 5.44 5.22 21.17 6.03 6.58
Pangkal Pinang - - 9.00 17.44 6.42 2.64
Jakarta 9.08 5.78 5.87 16.06 6.03 6.04
Tasikmalaya 10.29 3.88 5.92 20.83 8.44 7.72
Serang/Cilegon 9.68 5.21 6.40 16.11 5.33 6.31
Bandung 11.97 5.69 7.56 19.56 6.30 5.25
Cirebon 10.53 3.35 3.27 16.82 8.45 7.87
Purwokerto 8.77 2.89 6.32 14.54 6.18 6.15
Surakarta 8.64 1.73 5.15 13.88 6.07 3.28
Semarang 13.56 6.07 5.98 16.46 7.73 6.75
Tegal 11.27 1.86 5.25 18.39 10.40 8.89
Yogyakarta 12.01 5.73 6.95 14.98 6.84 7.99
Jember 9.75 5.20 6.24 16.86 7.78 7.25
Kediri 8.87 1.13 6.38 16.84 5.91 6.85
Malang 9.74 3.23 6.28 15.74 6.70 5.93
Surabaya 9.15 4.79 6.06 14.12 7.67 6.27
Denpasar 12.49 4.56 5.97 11.31 4.30 5.91
Mataram 7.96 1.82 6.61 17.72 4.17 8.76
Kupang 9.77 5.45 8.28 15.16 9.72 8.44
Pontianak 8.61 5.48 6.06 14.43 6.31 8.56
Sampit 7.59 3.06 6.67 11.90 7.75 7.57
Palangkaraya 9.18 5.68 7.25 12.12 7.72 7.96
Banjarmasin 9.18 6.77 7.52 12.94 11.04 7.78
Balikpapan 11.38 5.92 7.60 17.28 5.52 7.27
Samarinda 10.26 7.99 5.65 16.64 6.50 9.18
Manado 15.22 0.69 4.69 18.73 5.09 10.13
Palu 13.36 5.84 7.01 16.33 8.69 8.13
Makassar 8.25 3.01 6.47 15.20 7.21 5.71
Kendari 10.35 2.41 7.72 21.45 10.57 7.53
Gorontalo - - 8.64 18.56 7.54 7.02
Ternate 6.40 6.27 4.82 19.42 4.80 10.43
Ambon 9.47 2.51 3.44 16.67 5.12 5.85
Jayapura 13.91 8.39 9.45 14.15 9.52 10.35
National Inflation 10.03 5.06 6.40 17.11 6.60 6.59Source: BPS-Statistics Indonesia1) Since 2004 calculated based on survey in 45 cities and classified into 7 categories, 2002=100

231
Table 17
Balance of Paymentsmillions of $
Items 2002 2003 2004 2005 2006 2007*
I Current Account 7,823 8,106 1,563 278 10,836 11,009
1. Trade balance 23,512 24,563 20,152 17,534 29,660 33,083
a. Export f.o.b 59,165 64,109 70,767 86,995 103,528 118,014
b. Import f.o.b -35,653 -39,546 -50,615 -69,462 -73,868 -84,930
2. Services (net) -15,690 -16,456 -8,811 -9,122 -9,888 -11,103 3. Income (net) -10,917 -12,927 -13,800 -15,875 4. Current transfer (net) 1,139 4,793 4,863 4,903II Capital Transaction -1,102 -949 1,852 345 2,943 2,753 A. Public Sector -190 -833 ... 333 350 530 B. Private Sector -912 -116 1,852 12 2,593 2,223
1. Direct Investment 145 -597 -1,512 5,271 2,211 1,164
2. Portfolio Investment 1,222 2,251 4,409 4,190 4,174 6,981
3. Others Investment -2,279 -1,770 -1,045 -9,449 -3,792 -5,922
C. Total (I+II) 6,721 7,157 3,415 623 13,779 13,762 D. Errors and Omissions (net) -1,694 -3,502 -3,106 -178 731 -1,219 E. Overall Balances (C+D) 5,027 3,655 309 444 14,510 12,543 F. Monetary Movement1) -5,027 -3,655 -309 -444 -14,510 -12,543 Change in International Reserves -4,021 -4,257 674 663 -6,902 -12,543 a.l. Transaction IMF -1,006 603 -983 -1,107 -7,608 0
Notes:
1. Foreign Assets (IRFCL) 32,037 36,296 36,320 34,724 42,586 56,920
Equivalent to imports and payments on government foreign debt (no. of months)
6.6 7.1 5.7 4.3 4.5 5.7
2. Current Account/GDP (%) 4.5 3.4 0.6 0.1 2.9 2.5
1) Minus (-) : Suplus and vice versa, since 2000 monetary movement based on International Reserve and Foreign Currency Liquidity (IRFCL) international reserves, replacing Gross Foreign Assets (GFA).
* Provisional Figures

232
Table 18
Export Value of Non-Oil/Gas by Commoditymillions of $
Items
2002 2003 2004 2005 2006 2007
ValueShare
(%)Value
Share (%)
ValueShare
(%)Value
Share (%)
ValueShare
(%)Value
Share (%)
Total Export 46,308 100.0 48,876 100.0 54,482 100.0 66,752 100.0 80,578 100.0 93,142 100.0
Agriculture 2,640 5.7 2,750 5.6 2,430 4.5 2,870 4.3 3,465 4.3 4,543 4.9
Coffee 225 0.5 273 0.6 274 0.5 522 0.8 598 0.7 572 0.6
Tea 101 0.2 100 0.2 63 0.1 118 0.2 134 0.2 164 0.2
Spice 191 0.4 203 0.4 150 0.3 158 0.2 195 0.2 294 0.3
Tobacco 68 0.1 48 0.1 44 0.1 290 0.4 326 0.4 217 0.2
Chocolate 536 1.2 410 0.8 360 0.7 645 1.0 833 1.0 868 0.9
Shrimps 864 1.9 928 1.9 802 1.5 833 1.2 922 1.1 1,421 1.5
Others 655 1.4 787 1.6 736 1.4 305 0.5 457 0.6 1,006 1.1
Mining 3,849 8.3 4,145 8.5 4,636 8.5 8,010 12.0 11,361 14.1 9,575 10.3
Copper 1,805 3.9 1,924 3.9 1,755 3.2 3,488 5.2 4,588 5.7 4,093 4.4
Nickel 52 0.1 62 0.1 106 0.2 139 0.2 204 0.3 166 0.2
Coal 1,812 3.9 2,054 4.2 2,677 4.9 4,343 6.5 6,192 7.7 5,070 5.4
Bauxite 21 0.0 20 0.0 17 0.0 24 0.0 55 0.1 41 0.0
Others 159 0.3 85 0.2 82 0.2 17 0.0 323 0.4 204 0.2
Manufacturing 39,819 86.0 41,981 85.9 47,416 87.0 55,872 83.7 65,752 81.6 79,024 84.8
Textiles & Product Textile 7,158 15.5 7,294 14.9 7,507 13.8 8,554 12.8 9,597 11.9 12,832 13.8
- Garments 3,996 8.6 4,147 8.5 4,364 8.0 4,959 7.4 5,699 7.1 7,382 7.9
Wood Products 3,343 7.2 3,247 6.6 3,164 5.8 2,940 4.4 2,894 3.6 5,153 5.5
- Plywoods 1,797 3.9 1,708 3.5 1,501 2.8 1,798 2.7 1,829 2.3 2,812 3.0
Palm Oil 2,151 4.6 2,521 5.2 3,353 6.2 3,708 5.6 5,087 6.3 5,183 5.6
Chemical Product 1,308 2.8 1,576 3.2 1,896 3.5 4,450 6.7 5,317 6.6 4,246 4.6
Metal Product 614 1.3 887 1.8 1,787 3.3 561 0.8 803 1.0 1,538 1.7
Electrical Appliances 2,776 6.0 3,205 6.6 3,396 6.2 9,774 14.6 9,187 11.4 8,351 9.0
Cement 115 0.2 92 0.2 100 0.2 184 0.3 263 0.3 227 0.2
Paper 2,156 4.7 2,061 4.2 2,171 4.0 3,238 4.9 3,872 4.8 4,194 4.5
Rubber Products 1,604 3.5 2,146 4.4 2,878 5.3 793 1.2 991 1.2 2,898 3.1
Others 18,594 40.2 18,952 38.8 21,166 38.8 21,668 32.5 27,742 34.4 34,401 36.9

233
Table 19
Export Volume of Non-Oil/Gas by Commoditythousands of ton
Description
2002 2003 2004 2005 2006 2007
VolumeShare
(%)Volume
Share (%)
VolumeShare
(%)Volume
Share (%)
VolumeShare
(%)Volume
Share (%)
Total Export 177,352 100.0 165,171 100.0 196,938 100.0 206,652 100.0 288,215 100.0 307,846 100.0
Agriculture 2,097 1.2 2,075 1.3 2,351 1.2 2,273 1.1 3,170 1.1 3,591 1.17
Coffee 360 0.2 335 0.2 383 0.2 440 0.2 407 0.14 588 0.19
Tea 107 0.1 89 0.1 63 0.0 101 0.0 95 0.03 140 0.05
Spice 144 0.1 126 0.1 130 0.1 132 0.1 117 0.04 202 0.07
Tobacco 34 0.0 29 0.0 31 0.0 84 0.0 94 0.03 78 0.03
Chocolate 410 0.2 278 0.2 313 0.2 440 0.2 620 0.22 607 0.20
Shrimps 136 0.1 140 0.1 144 0.1 125 0.1 131 0.05 210 0.07
Others 907 0.5 1,077 0.7 1,288 0.7 951 0.5 1,706 0.59 1,767 0.57
Mining 124,533 70.2 116,212 70.4 142,853 72.5 153,129 74.1 220,485 76.5 223,935 72.74
Copper 3,207 1.8 2,489 1.5 2,043 1.0 2,527 1.2 2,264 0.79 3,916 1.27
Nickel 2,944 1.7 2,640 1.6 3,686 1.9 3,447 1.7 4,355 1.51 5,116 1.66
Coal 81,554 46.0 93,058 56.3 119,239 60.5 129,596 62.7 190,947 66.25 179,680 58.37
Bauxite 1,170 0.7 1,053 0.6 1,257 0.6 2,462 1.2 6,871 2.38 3,393 1.10
Others 35,658 20.1 16,971 10.3 16,628 8.4 15,098 7.3 16,048 5.57 31,830 10.34
Manufacturing 50,722 28.6 46,884 28.4 51,734 26.3 51,250 24.8 64,560 22.40 80,319 26.09
Textiles & Product Textile
1,962 1.1 1,722 1.0 1,837 0.9 1,786 0.9 1,934 0.67 2,842 0.92
- Garments 371 0.2 355 0.2 360 0.2 400 0.2 446 0.15 588 0.19
Wood Products 7,016 4.0 6,123 3.7 5,892 3.0 3,915 1.9 3,189 1.11 8,408 2.73
- Plywoods 3,997 2.3 3,456 2.1 2,622 1.3 2,916 1.4 2,392 0.83 4,876 1.58
Palm Oil 7,064 4.0 6,676 4.0 9,778 5.0 10,269 5.0 12,771 4.43 13,785 4.48
Chemical Product 4,181 2.4 4,743 2.9 4,439 2.3 7,055 3.4 9,231 3.20 8,681 2.82
Metal Product 305 0.2 318 0.2 502 0.3 399 0.2 454 0.16 597 0.19
Electrical Appliances 461 0.3 444 0.3 517 0.3 730 0.4 756 0.26 866 0.28
Cement 6,365 3.6 4,398 2.7 5,148 2.6 5,438 2.6 7,626 2.65 8,708 2.83
Paper 3,805 2.1 3,205 1.9 3,513 1.8 5,819 2.8 6,567 2.28 6,750 2.19
Rubber Products 1,963 1.1 2,031 1.2 2,535 1.3 335 0.2 365 0.13 2,409 0.78
Others 17,600 9.9 17,224 10.4 17,574 8.9 15,503 7.5 21,668 7.52 27,272 8.86

234
Table 20
Export Value of Non-Oil/Gas by Country of Destinationmillions of $
Continent/Country
2002 2003 2004 2005 2006 2007
ValueShare
(%)Value
Share (%)
ValueShare
(%)Value
Share (%)
ValueShare
(%)Value
Share (%)
Africa 1,126 2.4 1,255 2.6 1,301 2.4 1,669 2.5 1,996 2.48 2,466 2.6
America 8,699 18.8 8,374 17.1 9,109 16.7 11,117 16.7 12,895 16.0 13,685 14.7
United States 7,354 15.9 7,140 14.6 7,664 14.1 9,342 14.0 10,629 13.2 11,176 12.0
Latin America 577 1.2 525 1.1 655 1.2 935 1.4 1,316 1.6 1,513 1.6
Canada 381 0.8 390 0.8 460 0.8 468 0.7 543 0.7 552 0.6
Others 387 0.8 320 0.7 331 0.6 372 0.6 407 0.5 443 0.5
Asia 26,462 57.1 28,937 59.2 33,751 61.9 41,605 62.3 50,697 62.9 59,847 64.3
ASEAN 9,456 20.4 10,239 20.9 12,251 22.5 14,610 21.9 16,679 20.7 20,032 21.5
Brunei Darussalam 32 0.1 31 0.1 28 0.1 36 0.1 39 0.0 42 0.0
Malaysia 1,929 4.2 2,346 4.8 2,727 5.0 3,284 4.9 3,901 4.8 4,702 5.0
Philippines 789 1.7 965 2.0 1,411 2.6 1,414 2.1 1,416 1.8 1,862 2.0
Singapore 5,120 11.1 5,111 10.5 5,918 10.9 7,080 10.6 7,912 9.8 8,912 9.6
Thailand 998 2.2 1,108 2.3 1,485 2.7 1,980 3.0 2,126 2.6 2,763 3.0
Myanmar 51 0.1 68 0.1 568 0.1 652 1.0 1,027 1.3 1,355 1.5
Vietnam 477 1.0 558 1.1 56 1.0 73 0.1 148 0.2 271 0.3
Cambodia 61 0.1 51 0.1 56 0.1 89 0.1 107 0.1 121 0.1
Laos 0 0.0 0 0.0 1 0.0 2 0.0 4 0.0 4 0.0
Hong Kong 1,258 2.7 1,286 2.6 1,296 2.4 1,456 2.2 1,721 2.1 1,749 1.9
India 1,245 2.7 1,726 3.5 2,147 3.9 2,898 4.3 3,517 4.4 4,898 5.3
Iraq 28 0.1 17 0.0 50 0.1 86 0.1 72 0.1 12 0.0
Japan 6,545 14.1 7,055 14.4 8,266 15.2 9,853 14.8 12,253 15.2 13,365 14.3
South Korea 1,904 4.1 1,827 3.7 1,783 3.3 2,689 4.0 3,408 4.2 3,814 4.1
Pakistan 246 0.5 306 0.6 405 0.7 629 0.9 777 1.0 889 1.0
China 2,144 4.6 2,756 5.6 3,317 6.1 4,015 6.0 5,624 6.98 6,808 7.3
Saudi Arabian 463 1.0 409 0.8 375 0.7 526 0.8 641 0.8 947 1.0
Taiwan 1,209 2.6 1,220 2.5 1,473 2.7 1,814 2.7 2,306 2.9 2,389 2.6
Others 1,964 4.2 2,096 4.3 2,388 4.4 3,016 4.5 3,692 4.6 4,943 5.3
Australia/Oceania 1,359 2.9 1,360 2.8 1,325 2.4 1,525 2.3 2,008 2.5 2,489 2.7
Europe 8,662 18.7 8,950 18.3 8,996 16.5 10,836 16.2 12,983 16.1 14,656 15.7
- European Community 7,532 16.3 8,424 17.2 8,320 15.3 10,131 15.2 12,159 15.1 13,548 14.5
= Netherlands 1,548 3.3 1,425 2.9 838 3.2 2,148 3.2 2,633 3.3 2,831 3.0
= Belgium & Luxembourg 786 1.7 889 1.8 623 1.5 988 1.5 1,144 1.4 1,315 1.4
= United Kingdom 1,412 3.0 1,140 2.3 1,546 2.2 1,282 1.9 1,446 1.8 1,465 1.6
= Italy 622 1.3 766 1.6 837 1.5 958 1.4 1,213 1.5 1,401 1.5
= Germany 1,257 2.7 1,461 3.0 1,739 2.8 1,782 2.7 2,042 2.5 2,324 2.5
= France 618 1.3 696 1.4 1,210 1.1 614 0.9 721 0.9 803 0.9
= Others 1,289 2.8 2,048 4.2 1,527 2.8 2,360 3.5 2,959 3.7 3,409 3.7
- Former Soviet Union 71 0.2 108 0.2 138 0.3 204 0.3 269 0.3 317 0.3
- Other Eastern Europe 309 0.7 305 0.6 236 0.4 - - - - - -
- Others 750 1.6 113 0.2 302 0.6 501 0.8 555 0.7 790 0.8
TOTAL 46,307 100.0 48,876 100.0 54,482 100.0 66,752 100.0 80,578 100.0 93,142 100.0

235
Table 21a
Import Value of Non-Oil/Gas by Group of Commoditiesmillions of $
Item
2002 2003 2004 2005 2006 2007
ValueShare
(%)Value
Share (%)
ValueShare
(%)Value
Share (%)
ValueShare
(%)Value
Share (%)
Total Import 31,068 100.0 33,740 100.0 42,738 100.0 58,108 100.0 62,775 100.0 71,907 100.0
I. Consumption Goods 2,780 8.9 2,321 6.9 3,327 7.8 4,165 7.2 4,932 7.9 7,241 10.1
1. Food & beverages (primary), mainly for
household
485 1.6 324 1.0 476 1.1 407 0.7 583 0.9 797 1.1
2. Food & beverages (processed), mainly for
household
969 3.1 807 2.4 866 2.0 1,162 2.0 1,305 2.1 2,070 2.9
3. Passenger cars 71 0.2 146 0.4 304 0.7 480 0.8 436 0.7 337 0.5
4. Transport equipment, non-industrial 18 0.1 13 0.0 35 0.1 237 0.4 220 0.3 241 0.3
5. Durable consumption goods 208 0.7 175 0.5 322 0.8 484 0.8 574 0.9 1,048 1.5
6. Semi-durable consumption goods 343 1.1 294 0.9 378 0.9 620 1.1 754 1.2 1,496 2.1
7. Non-durable consumption goods 640 2.1 472 1.4 649 1.5 747 1.3 1,014 1.6 1,104 1.5
8. Others 46 0.1 92 0.3 95 0.2 26 0.0 46 0.1 148 0.2
II. Raw Material 23,322 75.1 25,665 76.1 31,058 72.7 42,533 73.2 45,697 72.8 51,168 71.2
1. Food & beverages (primary), mainly for
industry
1,375 4.4 1,644 4.9 1,871 4.4 1,347 2.3 1,355 2.2 2,010 2.8
2. Food & beverages (processed), mainly for
industry
587 1.9 724 2.1 715 1.7 811 1.4 916 1.5 991 1.4
3. Raw materials (primary), for industry 2,082 6.7 2,201 6.5 2,623 6.1 2,554 4.4 2,737 4.4 3,155 4.4
4. Raw materials (processed), for industry 13,965 45.0 14,911 44.2 18,892 44.2 22,992 39.6 26,150 41.7 29,259 40.7
5. Fuel & lubricants (primary) 3 0.0 4 0.0 16 0.0 14 0.0 31 0.0 10 0.0
6. Fuel & lubricants (processed) 179 0.6 157 0.5 202 0.5 278 0.5 154 0.2 172 0.2
7. Parts & accessories for capital goods 2,781 9.0 3,105 9.2 3,746 8.8 10,238 17.6 10,630 16.9 11,334 15.8
8. Parts & accessories for transport equipment 2,349 7.6 2,918 8.6 3,195 7.5 4,299 7.4 3,724 5.9 4,237 5.9
III. Capital Goods 4,967 16.0 5,753 17.1 8,354 19.5 11,411 19.6 12,147 19.3 13,498 18.8
1. Capital goods (except transport equipment) 4,399 14.2 5,217 15.5 6,807 15.9 9,033 15.5 9,292 14.8 10,672 14.8
2. Passenger cars 71 0.2 202 0.6 368 0.9 480 0.8 436 0.7 337 0.5
3. Transport equipment for industry 497 1.6 334 1.0 1,178 2.8 1,897 3.3 2,419 3.9 2,489 3.5

236
Table 21b
Import Volume of Non-Oil/Gas by Group of Commoditiesthousands of ton
Items
2002 2003 2004 2005 2006 2007
VolumeShare
(%)Volume
Share (%)
VolumeShare
(%)Volume
Share (%)
VolumeShare
(%)Volume
Share (%)
Total Import 40,912 100.0 41,217 100.0 44,940 100.0 53,097 100.0 55,810 100.0 59,390 100.0
I. Consumption Goods 3,427 8.4 3,377 8.2 2,958 7.8 3,502 6.6 3,496 6.3 5,254 8.8
1. Food & beverages (primary), mainly for
household
650 1.6 593 1.4 889 1.1 882 1.7 980 1.8 1,174 2.0
2. Food & beverages (processed), mainly for
household
2,354 5.8 2,353 5.7 1,381 2.0 1,785 3.4 1,680 3.0 3,134 5.3
3. Passenger motor cars 8 0.0 20 0.0 36 0.7 57 0.1 49 0.1 42 0.1
4. Transport equipment, non-industrial 8 0.0 11 0.0 25 0.1 45 0.1 49 0.1 53 0.1
5. Durable consumption goods 71 0.2 72 0.2 133 0.8 165 0.3 169 0.3 233 0.4
6. Semi-durable consumption goods 160 0.4 189 0.5 304 0.9 313 0.6 306 0.5 355 0.6
7. Non-durable consumption goods 174 0.4 136 0.3 189 1.5 253 0.5 261 0.5 258 0.4
8. Others 3 0.0 5 0.0 1 0.2 1 0.0 2 0.0 4 0.0
II. Raw Material 0.0 0.0 0.0
1. Food & beverages (primary), mainly for
industry
0.0 0.0 0.0
2. Food & beverages (processed), mainly for
industry
36,678 89.7 36,895 89.5 40,787 72.7 47,504 89.5 50,284 90.1 52,198 87.9
3. Raw materials (primary), for industry 5,605 13.7 5,341 13.0 5,967 4.4 5,807 10.9 6,024 10.8 6,261 10.5
4. Raw materials (processed), for industry 1,451 3.5 1,719 4.2 1,272 1.7 1,992 3.8 1,937 3.5 1,600 2.7
5. Fuel & lubricants (primary) 11,246 27.5 11,614 28.2 11,242 6.1 12,158 22.9 13,250 23.7 12,873 21.7
6. Fuel & lubricants (processed) 17,341 42.4 17,193 41.7 20,923 44.2 25,626 48.3 27,309 48.9 29,313 49.4
7. Parts & accessories for capital goods 26 0.1 29 0.1 85 0.0 97 0.2 127 0.2 72 0.1
8. Parts & accessories for transport equipment 167 0.4 184 0.4 265 0.5 295 0.6 147 0.3 167 0.3
III. Capital Goods 409 1.0 378 0.9 521 8.8 903 1.7 867 1.6 1,189 2.0
1. Capital goods (except transport equipment) 433 1.1 438 1.1 513 7.5 626 1.2 623 1.1 723 1.2
2. Passenger motor cars 0 0.0 0 0.0 0 0.0 0 0.0 0 0.0 0 0.0
3. Transport equipment for industry 807 2.0 945 2.3 1,194 19.5 2,091 3.9 2,030 3.6 1,939 3.3
1. Capital Goods (excluding transportation) 685 1.7 854 2.1 879 15.9 1,268 2.4 1,322 2.4 1,562 2.6
2. Passenger cars 8 0.0 20 0.0 36 0.9 57 0.1 49 0.1 42 0.1
3. Transport equipment for Industry 113 0.3 71 0.2 279 2.8 765 1.4 659 1.2 334 0.6

237
Table 22
Import Value of Non-Oil/Gas by Country of Origin (C&F)millions of $
Continent/Country
2002 2003 2004 2005 2006 2007
ValueShare
(%)Value
Share (%)
ValueShare
(%)Value
Share (%)
ValueShare
(%)Value
Share (%)
Africa 404 1.3 418 1.2 565 1.3 614 1.1 597 1.0 661 0.9
America 4,480 14.4 4,699 13.9 5,898 13.8 6,278 10.8 6,606 10.5 8,145 11.3
United States 3,318 10.7 3,503 10.4 4,055 9.5 4,290 7.4 4,576 7.3 5,469 7.6
Latin America 612 2.0 710 2.1 989 2.3 1,175 2.0 1,221 1.9 1,529 2.1
Canada 511 1.6 442 1.3 818 1.9 749 1.3 713 1.1 1,071 1.5
Others 39 0.1 45 0.1 35 0.1 64 0.1 96 0.2 75 0.1
Asia 18,391 59.2 20,745 61.5 25,593 59.9 40,543 69.8 43,134 68.7 48,503 67.5
ASEAN 5,121 16.5 6,031 17.9 7,709 18.0 16,386 28.2 17,907 28.5 19,140 26.6
Brunei Darussalam 2 0.0 4 0.0 5 0.0 8 0.0 4 0.0 4 0.0
Malaysia 998 3.2 1,107 3.3 1,394 3.3 1,934 3.3 2,271 3.6 2,903 4.0
Philippines 153 0.5 245 0.7 279 0.7 458 0.8 445 0.7 533 0.7
Singapore 2,274 7.3 2,241 6.6 3,039 7.1 9,874 16.99 11,119 17.71 10,511 14.6
Thailand 1,439 4.6 2,178 6.5 2,866 6.7 3,961 6.82 3,787 6.03 4,483 6.2
Myanmar 45 0.1 21 0.1 104 0.2 123 0.2 258 0.4 657 0.9
Vietnam 132 0.4 234 0.7 20 0.0 26 0.0 21 0.0 32 0.0
Cambodia 1 0.0 2 0.0 1 0.0 2 0.0 2 0.0 2 0.0
Laos - 0.0 0 0.0 0 0.0 0 0.0 0 0.0 3 0.0
Hong Kong 304 1.0 303 0.9 323 0.8 1,281 2.2 1,633 2.6 29,363 40.8
India 792 2.5 869 2.6 1,227 2.9 1,075 1.9 1,429 2.3 1,917 2.7
Iraq 3 0.0 0 0.0 0 0.0 0 0.0 0 0.0 1,745 2.4
Japan 5,660 18.2 6,432 19.1 7,385 17.3 10,303 17.7 9,275 14.8 0 0.0
South Korea 1,815 5.8 2,071 6.1 2,321 5.4 3,272 5.6 3,425 5.5 9,375 13.0
Pakistan 61 0.2 63 0.2 61 0.1 76 0.1 66 0.1 3,762 5.2
China 2,714 8.7 3,110 9.2 4,370 10.2 5,439 9.4 6,701 10.7 66 0.1
Saudi Arabian 220 0.7 224 0.7 236 0.6 213 0.4 248 0.4 9,346 13.0
Taiwan 1,289 4.1 1,130 3.3 1,420 3.3 1,847 3.2 1,879 3.0 352 0.5
Others 411 1.3 511 1.5 540 1.3 650 1.1 570 0.9 2,170 3.0
Australia/Oceania 2,145 6.9 2,016 6.0 2,735 6.4 2,720 4.7 3,322 5.3 3,591 5.0
Europe 5,648 18.2 5,863 17.4 7,948 18.6 7,953 13.7 9,117 14.5 11,007 15.3
- European Community 4,258 13.7 5,002 14.8 6,598 14.7 6,632 11.4 7,724 12.3 9,346 13.0
= Netherlands 452 1.5 508 1.5 314 1.6 356 0.6 618 1.0 619 0.9
= Belgium & Luxembourg 252 0.8 250 0.7 704 1.2 716 1.2 349 0.6 383 0.5
= United Kingdom 530 1.7 630 1.9 2,174 1.7 2,160 3.7 714 1.1 787 1.1
= Italy 548 1.8 474 1.4 604 2.0 622 1.1 616 1.0 756 1.1
= Germany 1,616 5.2 1,615 4.8 545 0.8 458 0.8 2,149 3.4 2,628 3.7
= France 538 1.7 638 1.9 853 4.8 738 1.3 1,184 1.9 1,633 2.3
= Others 321 1.0 889 2.6 1,403 3.1 1,584 2.7 2,094 3.3 2,540 3.5
- Former Soviet Union 234 0.8 161 0.5 280 0.7 442 0.8 469 0.7 443 0.6
- Other Eastern Europe 97 0.3 79 0.2 103 1.2 - - -
- Others 1,059 3.4 620 1.8 967 2.3 879 1.5 924 1.5 1,217 1.7
TOTAL 31,068 100.0 33,740 100.0 42,738 100.0 58,108 100.0 62,775 100.0 71,907 100.0

238
Table 23
Export of Oil/Gas1)
Item 2002 2003 2004 2005 2006 2007
Export Value2)
Oil and Oil Products 6,548 7,469 7,605 9,523 10,911 12,496
Gas
- LNG 5,595 6,744 7,304 8,734 9,953 9,723
- LPG 323 326 366 477 175 210
- Natural Gas 392 695 1,010 1,509 1,910 3,443
Total 12,858 15,234 16,285 20,243 22,949 25,872 Export Volume
Oil and Oil Products (million of barrel) 271 261 212 186 177 178
Gas
- LNG (millions of MMBTU)3) 1,360 1,387 1,323 1,215 1,172 1,080
- LPG (thousands of metric ton) 1,312 1,170 1,101 1,076 364 337
- Natural Gas (millions of MMBTU)3) 99 170 223 250 265 293
1) Free on board value2) Consist of crude oil and oil products in millions of $3) MMBTU: Million British Thermal Unit

239
Table 24
Money Supplybillions of rupiah
End of PeriodM1 1) Quasi Money 2) M2 3)
Outstanding Share (%) Outstanding Share (%) OutstandingChange (%)
Annual Quarterly2002 191,939 21,71 691,969 78,29 883,908 4.7 2.8
2003 223,799 23,42 731,893 76,58 955,692 8.1 3.2
2004 4) 253,818 24,56 779,710 75,44 1,033,528 8.1 4.7
2005 4) 281,905 23,43 921,310 76,57 1,203,215 16.4 4.6
2006 4)
January 281,412 23,63 909,422 76,37 1,190,834 17.2
February 277,265 23,22 916,599 76,78 1,193,864 18.0
March 277,293 23,20 917,774 76,80 1,195,067 17.1 -0.7
April 282,400 23,57 915,613 76,43 1,198,013 14.7
May 304,663 24,62 932,840 75,38 1,237,503 18.3
June 313,415 24,99 940,590 75,01 1,254,005 16.8 4.9
July 311,822 24,98 936,414 75,02 1,248,236 14.7
August 329,372 25,93 941,006 74,07 1,270,378 13.8
September 333,905 25,86 957,491 74,14 1,291,396 12.3 3.0
October 346,414 26,13 979,244 73,87 1,325,658 13.7
November 342,645 25,60 995,910 74,40 1,338,555 14.6
December 361,073 26,13 1,021,001 73,87 1,382,074 14.9 7.0
2007 4)
January 344,840 25,28 1,019,067 74,72 1,363,907 14.5
February 346,573 25,36 1,020,247 74,64 1,366,820 14.5
March 341,833 24,84 1,034,114 75,16 1,375,947 15.1 -0.4
April 351,259 25,39 1,032,318 74,61 1,383,577 15.5
May 352,629 25,31 1,040,468 74,69 1,393,097 12.6
June 381,376 26,27 1,070,598 73,73 1,451,974 15.8 5.5
July 397,823 27,01 1,075,129 72,99 1,472,952 18.0
August 402,035 27,03 1,085,506 72,97 1,487,541 17.1
September 411,281 27,19 1,101,475 72,81 1,512,756 17.1 4.2
October 414,996 27,12 1,115,149 72,88 1,530,145 15.4
November 424,435 27,27 1,131,765 72,73 1,556,200 16.3
December 460,842 28,05 1,182,361 71,95 1,643,203 18.9 8.6
1) Consists of currency and demand deposits2) Consists of time and saving deposits in rupiah and foreign currency, and demand deposits in foreign currency held by residents3) Consists of narrow money (M1) and quasi money4) Excluding frozen banks data (7 banks since April 4, 1998, 3 banks since August 21, 1998, 38 banks since March 13, 1999, 1 bank since April 23, 1999, 1 bank since January 28, 2000, 2
banks since October 20, 2000, and 1 bank since October 30, 2001).

240
Table 25
Changes in Money Supply and its Affecting Factorsbillions of rupiah
Item 2002 2003 2004 2005 2006 20072007
I II III IVMoney Supply
M2 39,854 71,784 77,836 169,687 178,859 261,129 -6,127 76,027 60,782 130,447
M1 14,208 31,860 30,019 28,087 79,168 99,769 -19,240 39,543 29,905 49,561
Currency 4,344 13,856 14,723 15,051 26,693 32,410 -21,391 17,097 13,612 23,092
Demand Deposits 9,864 18,004 15,296 13,036 52,475 67,359 2,151 22,446 16,293 26,469
Quasi Money 1) 25,646 39,924 47,817 141,600 99,691 161,360 13,113 36,484 30,877 80,886
Affecting Factors:
Net foreign assets 16,721 21,124 -8,173 49,436 100,182 111,438 44,117 39,140 22,838 5,343
Net claims on central government -19,355 -31,338 18,134 882 7,587 -9,010 -58,833 -16,699 8,693 57,829
Claims on business sector 60,143 77,532 148,976 123,039 98,228 203,925 8,957 63,301 52,824 78,843
Claims on official entities/state enterprises 4,552 1,198 2,832 1,140 10,887 17,206 -3,914 9,153 1,311 10,656
Claims on private enterprises and individuals 55,591 76,334 146,144 121,899 87,341 186,719 12,871 54,148 51,513 68,187
Net other items -17,655 4,466 -81,974 -3,672 -15,334 -57,027 -12,172 -9,716 -23,572 -11,567
1) Consists of time and saving deposits in rupiah and foreign currency, and demand deposits in foreign currency held by residents
Table 26
Interest Rates on Time Deposits by Denomination and Group of Banks1)
percent per annum
Maturity
December 2002 December 2003 December 2004 December 2005 December 2006 December 2007
RupiahForeign
CurrencyRupiah
Foreign Currency
RupiahForeign
CurrencyRupiah
Foreign Currency
RupiahForeign
CurrencyRupiah
Foreign Currency
State Banks
1 Month 12.84 2.63 6.61 1.60 6.17 3.90 11.84 3.98 8.71 4.24 7.00 3.89
3 Month 13.65 2.73 7.11 1.68 6.47 2.86 11.71 4.00 9.60 4.11 7.33 4.09
6 Month 13.86 2.71 7.96 1.90 6.99 6.45 10.21 3.82 10.53 4.24 7.13 4.07
12 Month 15.67 3.32 10.55 2.13 7.17 2.34 11.49 3.58 11.80 4.02 8.41 3.65
24 Month 18.05 5.57 16.13 2.36 8.09 2.10 12.46 3.90 11.86 3.87 10.80 3.69
Private National Banks
1 Month 12.90 2.33 6.63 1.17 6.58 1.95 12.23 3.53 9.16 4.00 7.31 3.94
3 Month 13.77 2.69 7.20 1.40 6.98 2.51 11.95 3.47 9.88 3.74 7.64 4.14
6 Month 13.91 2.73 8.65 1.57 7.38 2.51 10.14 3.11 10.79 4.13 7.90 4.02
12 Month 14.73 3.25 10.07 2.32 7.12 2.64 9.90 3.02 11.48 3.71 7.87 4.27
24 Month 17.18 6.23 15.55 3.01 8.87 … 10.18 … 11.96 2.75 11.59 3.92
Regional Government Banks
1 Month 12.81 2.48 6.78 1.20 6.86 7.00 10.28 3.32 8.77 3.78 7.24 3.73
3 Month 13.56 2.65 7.31 1.31 7.09 … 10.86 4.06 9.35 4.04 6.76 4.01
6 Month 14.14 4.17 8.63 1.41 7.29 … 9.92 2.04 10.83 3.81 7.74 3.96
12 Month 14.44 3.50 10.84 2.75 6.82 … 9.46 2.05 11.47 4.43 8.73 4.44
24 Month 17.72 … 17.01 … 9.47 … 8.50 … 10.94 … 10.17 -
Foreign Banks & Joint Banks
1 Month 10.50 1.86 6.54 1.70 6.06 1.82 10.51 3.45 8.48 4.28 7.27 4.40
3 Month 9.89 1.92 6.66 1.67 5.81 2.10 11.67 3.63 9.50 4.47 7.30 4.44
6 Month 9.66 2.39 6.38 2.00 6.02 1.94 10.38 3.48 10.80 4.34 7.58 4.63
12 Month 11.68 2.40 8.61 2.45 6.09 2.20 12.53 2.78 10.96 3.48 8.29 4.42
24 Month 15.97 3.21 15.80 3.10 4.74 … 9.55 … 10.52 4.35 9.83 4.80
Commercial Banks
1 Month 12.81 2.44 6.62 1.26 6.43 1.98 11.98 3.70 8.96 4.14 7.19 4.01
3 Month 13.63 2.65 7.14 1.54 6.71 2.14 11.75 3.68 9.71 4.11 7.42 4.26
6 Month 13.79 2.70 8.25 1.84 7.12 4.90 10.17 3.56 10.70 4.22 7.65 4.27
12 Month 15.28 3.24 10.39 2.23 7.07 2.32 10.95 3.07 11.63 3.71 8.24 4.21
24 Month 18.02 5.28 16.13 2.71 8.12 2.10 12.39 3.90 11.84 4.22 10.83 4.52

241
Table 27
Interbank Money Market in Jakarta
(Average Transaction Volume of Interbank Money Market Morning & Evening Session - Various Maturity)1)
PeriodValue of Transaction (Billions of Rupiah)
Weighted Average Interest Rate (Percent per Annum)
2002 January - December 3,749 14.20
2003 January - December 3,598 8.95
2004 January - December 4,460 6.20
2005 January - December 6,188 7.11
2004
January - March 4,410 6.91
April - June 3,543 5.93
July - September 4,835 6.02
October - December 5,052 5.92
2005
January - March 5,914 5.33
April - June 6,197 6.72
July - September 5,843 7.39
October - December 6,798 8.99
2006
January 7,579 9.80
February 7,942 10.24
March 8,446 10.44
January - March 7,989 10.16
April 8,256 11.04
May 8,413 10.24
June 7,192 10.13
April - June 7,954 10.47
July 8,259 10.79
August 8,310 10.51
September 8,877 8.94
July - September 8,482 10.08
October 8,838 6.87
November 8,078 5.99
December 10,554 6.16
October - December 9,157 6.34
2007
January 11,586 5.25
February 11,653 5.24
March 14,506 7.58
January - March 12,582 6.02
April 11,685 8.40
May 11,486 6.92
June 12,115 5.88
April - June 11,762 7.07
July 12,029 5.33
August 11,538 5.30
September 16,293 6.71
July - September 13,287 5.78
October 12,495 6.34
November 15,020 7.16
December 12,877 4.86
October - December 13,464 6.121) Daily average figures

242
Table 28
Issuance, Repayment, and Outstanding of Bank Indonesia Certificates (SBIs)billions of rupiah
End of Period Issuance Repayment Outstanding 1)
January - December 2002 1,009,912 988,259 77,113
January - December 2003 1,225,665 1,197,376 105,402
January - December 2004 1,194,384 1,197,054 102,732
2005
January 118,995 100,671 114,756
February 118,437 117,733 122,570
March 123,692 188,328 122,851
April 110,781 53,995 92,516
May 98,141 111,002 104,283
June 148,605 149,109 103,166
July 94,859 99,501 96,786
August 83,682 95,045 93,629
September 46,573 40,996 51,972
October 38,791 40,891 44,252
November 56,365 38,394 46,699
December 80,628 65,257 70,047
2006
January 109,258 71,184 94,715
February 122,397 103,954 118,419
March 164,739 160,847 132,071
April 147,512 128,151 137,860
May 156,861 143,262 164,438
June 201,958 201,072 168,155
July 169,997 164,047 168,153
August 242,712 231,775 178,716
September 178,419 182,384 182,574
October 103,299 113,790 175,458
November 341,337 302,862 202,000
December 206,999 206,999 209,400
2007
January 271,000 243,000 226,491
February 236,000 235,400 235,850
March 239,346 235,000 244,271
April 247,549 239,346 237,407
May 320,441 305,408 259,059
June 252,966 260,582 260,068
July 284,111 252,966 272,258
August 330,875 352,564 274,425
September 264,842 262,422 263,384
October 337,536 332,980 234,401
November 267,711 269,400 265,468
December 152,401 174,783 273,925Notes:SBI was introduced in February 1984. SInce July 1998, the selling of SBIs was executed by Stop Out Rate (SOR) system action.1) Daily average

243
Table 29
Discount Rates on Bank Indonesia Certificates (SBIs)1)
percent per annum
Period 7 Days 14 Days 1 Months 3 Months 6 Months 12 Months
2002March - - 16.76 16.89 - - June - - 15.11 15.18 - - September - - 13.22 14.11 - - December - - 13.02 13.12 - -
2003March - - 11.40 11.97 - - June - - 9.53 10.18 - - September - - 8.66 8.75 - - December - - 8.31 8.34 - -
2004 2)
March - - 7.42 7.33 - - June - - 7.34 7.25 - - September - - 7.39 7.31 - - December - - 7.43 7.29 - -
2005 2)
January - - 7.42 7.30 - - February - - 7.43 7.27 - - March - - 7.44 7.31 - - April - - 7.70 7.51 - - May - - 7.95 7.81 - - June - - 8.25 8.05 - - July - - 8.49 8.45 - - August - - 9.51 8.54 - - September - - 10.00 9.25 - - October - - 11.00 12.09 - - November - - 12.25 12.83 - - December - - 12.75 12.83 - -
2006 2)
January - - 12.75 12.92 - - February - - 12.74 12.92 - - March - - 12.73 12.73 - - April - - 12.74 12.65 - - May - - 12.50 12.16 - - June - - 12.50 12.16 - - July - - 12.25 12.16 - - August - - 11.75 11.36 - - September - - 11.25 11.36 - - October - - 10.75 11.36 - - November - - 10.25 9.50 - - December - - 9.75 9.50 - -
2007 2)
January - - 9.50 9.50 - - February - - 9.25 8.10 - - March - - 9.00 8.10 - - April - - 9.00 8.10 - - May - - 8.75 7.83 - - June - - 8.50 7.83 - - July - - 8.25 7.83 - - August - - 8.25 7.83 - - September - - 8.25 7.83 - - October - - 8.25 7.83 - - November - - 8.25 7.83 - - December - - 8.00 7.83 - -
1) Weighted-average rate, end of period SBI2) Since the issuance of SUN in 1999, the weighted-average of 3 months SBI-rate has been presented in 5 digit number for the basis to calculate SUN’s coupon variable rate3) SBI can be issued with the maturity of 1 to 12 months, but since adoption of auction system in July 1998, there are also SBI with the maturity of 1 & 3 months.

244
Table 30
Government Revenues & Expendituresbillions of rupiah
Item 2002 1) 2003 1)
2004 2005 2006 2007
Budget 2)Realiza-
tion 3)
Budget-r II 2)
Realiza-tion 3)
Budget-r 2)
Realiza-tion 4)
Budget-r 2)
Realiza-tion 4)
Government Revenues and Grants 298,605 341,396 349,934 403,366 540,126 495,154 659,115 637,797 694,088 708,494
Domestic Revenues 298,528 340,929 349,300 403,104 532,671 493,858 654,882 635,940 690,265 706,791
Tax Revenues 210,088 242,048 272,175 280,559 351,974 346,997 425,053 409,055 492,011 491,835
Domestic Taxes 199,512 230,934 260,224 267,817 334,403 331,759 410,226 395,822 474,551 470,906
Income Tax (PPh) 101,874 115,016 133,968 119,515 180,253 175,543 213,698 208,834 251,748 238,740
Non-Oil/Gas 84,404 95,293 120,835 99,020 143,017 140,403 175,012 165,644 214,481 194,736
Oil/Gas 17,469 19,723 13,133 20,494 37,236 35,140 38,686 43,190 37,268 44,004
Value Added Tax (PPN) 65,153 77,082 86,273 102,573 102,671 101,295 132,876 123,033 152,057 155,187
Land and Building Tax (PBB) 6,228 8,677 8,031 11,684 13,375 16,184 18,154 20,716 22,026 23,619
Duties on Land and Building Transfer 1,600 2,229 2,668 3,001 3,661 3,429 4,386 3,179 3,966 5,936
Excise Duties 23,189 26,277 27,671 29,173 32,245 33,256 38,523 37,772 42,035 44,681
Other Taxes 1,469 1,654 1,614 1,872 2,198 2,050 2,590 2,287 2,720 2,743
International Trade Taxes 10,575 11,114 11,951 12,742 17,570 15,239 14,827 13,233 17,460 20,929
Import Duties 10,344 10,885 11,636 12,444 16,591 14,921 13,583 12,142 14,418 16,691
Export Tax 231 230 315 298 980 318 1,244 1,091 3,042 4,238
Non-Tax Revenues 88,440 98,880 77,125 122,546 180,697 146,860 229,829 226,885 198,254 214,956
Natural Resource Revenues 64,755 67,739 47,241 96,717 144,361 110,441 165,695 164,773 115,053 133,018
Oil 47,686 48,871 28,248 72,742 102,196 72,805 122,964 125,146 78,235 99,156
Natural Gas 12,325 12,631 15,754 18,801 36,364 30,983 36,825 32,941 29,484 25,628
Natural Resource 4,744 6,238 3,238 5,174 5,801 6,653 5,906 6,686 7,334 8,234
Profit Transfer from SOEs 9,760 12,833 11,454 10,644 12,000 12,777 20,800 21,451 21,800 23,222
Bank Indonesia Surplus - - - - - - 0 0 13,669 13,669
Other Non-Tax Revenues (PNBP) 13,925 18,308 18,430 15,185 24,336 23,643 43,334 40,661 47,731 45,047
Grants 78 468 634 262 7,455 1,296 4,233 1,857 3,823 1,704
Government Expenditures 322,180 376,505 374,351 427,176 565,070 509,622 699,099 670,591 752,373 757,245
Central Government Expenditures 223,976 256,191 255,309 297,454 411,667 359,158 478,250 444,197 498,172 503,977
Routine Expenditures 186,651 186,944 184,438 236,003 326,924 301,557 408,470 385,266 426,488 439,570
Personnel Expenditures 39,480 47,662 56,738 52,743 61,167 54,339 79,075 72,873 97,983 90,373
Material Expenditures 12,777 14,992 17,280 15,518 42,312 29,240 55,992 47,066 61,824 54,150
Interest Payment 87,667 65,351 65,651 62,486 60,982 65,151 82,495 79,026 83,555 79,551
Domestic Debt 25,406 46,356 41,276 39,286 42,307 43,496 58,155 54,897 58,803 53,822
Foreign Debt 62,261 18,995 24,375 23,200 18,675 21,655 24,340 24,129 24,752 25,728
Subsidies 43,628 43,899 26,362 91,529 119,089 120,784 107,628 107,410 105,073 150,214
Fuel 31,162 30,038 14,527 69,025 89,194 95,737 80,609 85,136 55,604 83,792
Non-Fuel 12,466 9,901 10,995 16,076 23,643 17,892 21,367 15,911 49,469 49,308
Tax born by Government - 3,960 840 6,429 6,253 7,156 5,651 6,363 0 17,114
Social Aid - - - - - - 41,018 43,392 52,272 50,678
Other Routine Expenditures 3,099 15,042 18,407 13,727 43,374 32,043 42,262 35,500 25,781 14,604
Development Expenditures 37,325 69,247 70,871 61,450 84,743 57,601 69,780 58,931 71,684 64,407
Rupiah Financing 25,608 47,510 50,500 48,018 54,747 33,454 55,258 52,292 70,826 66,223
Project Aid 11,717 21,737 20,371 13,432 29,997 24,147 25,475 19,829 23,205 14,391
Regional Expenditures 98,204 120,314 119,042 129,723 153,402 150,464 220,850 226,394 254,201 253,268
Balancing Funds 94,657 111,070 112,187 122,868 146,160 143,251 216,798 222,348 244,608 244,007
Revenue Sharing 24,884 31,370 26,928 36,700 52,567 49,729 59,564 65,133 62,726 62,947
General Allocation Funds 69,159 76,978 82,131 82,131 88,766 88,762 145,664 145,652 164,787 164,823
Special Allocation Funds 613 2,723 3,128 4,036 4,828 4,760 11,570 11,563 17,094 16,237
Special Autonomy and Equalization Funds 3,548 9,244 6,855 6,855 7,243 7,213 4,052 4,047 9,593 9,261
Source: Ministry of Finance1) State Budget Figures2) State Budget Approved by Parliament3) Central Government Financial Statement4) Preliminary realization January 1 - December 31, 2007 (unaudited, revised version IV)

245
Table 31
Budget Deficit Financingbillions of rupiah
Item 2002 1) 2003 1)
2004 2005 2006 2007
Budget 2)Realiza-
tion 3)
Budget-r II 2)
Realiza-tion 3)
Budget-r 2)
Realiza-tion 4)
Budget-r 2)
Realiza-tion 4)
I. Domestic Financing 17,024 34,562 40,556 51,867 29,786 24,659 55,258 52,292 70,826 66,223
1. Domestic Banks (SILPA/SIKPA) 5) -8,140 10,705 19,199 25,727 4,271 700 17,907 15,223 10,622 8,420
2. Non-Domestic Banks 25,164 23,857 21,358 26,141 25,515 23,959 37,351 37,069 60,204 57,803
a. Privatization 7,665 7,301 5,000 3,520 0 0 1,000 400 2,000 304
b. Asset Recovery 19,439 19,661 5,000 15,751 8,625 6,558 2,580 2,684 1,658 2,413
c. Domestic Bonds, net -1,939 -3,105 11,358 6,870 22,086 22,596 35,772 35,986 58,546 57,086
i. Government Bonds 1,991 11,319 32,500 23,362 43,315 46,824 43,315 47,324 99,266 117,149
ii. Domestic Debt/Bond Amortization -3,931 -14,424 -21,142 -16,492 -21,229 -24,228 -7,543 -11,339 -40,720 -60,063
d. Government Investment Fund - - - - -5,195 -5,195 -2,000 -2,000 -2,000 -2,000
II. Foreign Financing, net 6,550 548 -16,139 -28,057 -4,842 -10,260 -15,274 -19,316 -12,540 -23,924
1. Gross Drawing 18,809 20,360 28,237 18,434 35,541 26,870 37,550 33,409 42,210 33,998
Program Loan 7,170 1,792 8,500 5,059 11,270 12,309 12,075 13,580 19,005 19,608
Project Loan 11,639 18,568 19,737 13,375 24,271 14,561 25,475 19,829 23,205 14,391
International Obligation
2. Amortization -12,259 -19,812 -44,376 -46,491 -40,383 -37,130 -52,824 -52,725 -54,751 -57,922
Net Financing 23,574 35,109 24,418 23,810 24,944 14,399 39,984 32,975 58,285 42,299
Source: Ministry of Finance1) State Budget Figures2) State Budget Approved by Parliament3) Central Government Financial Statement4) Preliminary realization January 1 - December 31, 2007 (unaudited, revised version IV)5) Excessed Budget Financing (SILPA) and Shortage of Budget Financing (SIKPA)

246
Table 32
Funds Mobilization by Commercial Banks1)
billions of rupiah
End of Period
Demand Deposits Time DepositsSaving
DepositsTotal
RupiahForeign
CurrencySub Total
Rupiah 2) Foreign Currency
Sub Total
2002 130,877 73,189 204,067 365,771 81,710 447,480 193,468 845,015
2003 155,898 68,861 224,759 356,287 76,840 433,127 244,440 902,326
2004
March 155,529 72,712 228,241 331,602 73,782 405,384 247,991 881,616
June 163,796 81,279 245,075 337,841 71,091 408,932 261,041 915,048
September 165,622 80,175 245,797 340,411 71,038 411,449 270,996 928,242
December 171,661 75,482 247,143 352,723 68,567 421,290 296,647 965,080
2005
March 177,592 77,170 254,762 351,599 70,055 421,654 284,657 961,073
June 193,561 80,559 274,120 376,493 78,236 454,729 284,415 1,013,264
September 185,917 93,732 279,649 409,322 113,432 522,754 280,749 1,083,152
December 194,533 88,122 282,655 456,739 112,935 569,674 281,757 1,134,086
2006
January 194,318 85,801 280,119 457,340 110,384 567,724 274,555 1,122,398
February 196,370 85,175 281,545 468,331 113,043 581,374 271,700 1,134,619
March 193,434 86,276 279,710 471,782 109,631 581,413 268,319 1,129,442
April 194,735 82,182 276,917 475,618 105,932 581,550 270,318 1,128,785
May 214,736 83,862 298,598 483,298 114,485 597,783 275,629 1,172,010
June 215,132 83,240 298,372 489,962 111,595 601,557 279,534 1,179,463
July 211,881 85,835 443,787 485,376 105,907 591,283 281,729 1,316,799
August 231,906 85,826 462,213 487,223 110,214 597,437 284,038 1,343,688
September 230,307 84,318 314,625 500,122 110,062 610,184 291,999 1,216,808
October 236,385 90,630 327,015 504,082 114,363 618,445 299,479 1,244,939
November 240,060 86,751 326,811 515,295 112,006 627,301 309,028 1,263,140
December 251,219 88,568 339,787 511,356 113,234 624,590 334,380 1,298,757
2007
January 246,238 89,047 335,285 513,614 111,371 624,985 331,028 1,291,298
February 248,376 91,328 339,704 521,716 103,253 624,969 331,199 1,295,872
March 241,249 91,473 332,722 526,291 110,074 636,365 333,841 1,302,928
April 246,810 93,008 339,818 526,306 106,238 632,544 338,716 1,311,078
May 243,624 100,033 343,657 518,868 115,201 634,069 339,323 1,317,049
June 263,807 107,306 371,113 520,872 116,536 637,408 355,320 1,363,841
July 282,542 95,641 378,183 520,999 126,193 647,192 364,547 1,389,922
August 284,829 97,986 382,815 523,253 127,561 650,814 371,483 1,405,112
September 278,478 102,106 380,584 521,690 132,531 654,221 378,936 1,413,741
October 284,663 100,149 384,812 524,212 135,246 659,458 388,560 1,432,830
November 289,627 97,095 386,722 531,156 137,307 668,463 398,472 1,453,657
December 311,037 96,247 407,284 543,285 138,245 681,530 439,371 1,528,1851) Including deposits owned by the Central Government and non-residents2) Including certificates of deposits

247
Table 33
Commercial Banks’ Demand Deposits in Rupiah and Foreign Currency by Group of Banksbillions of rupiah
End of Period
State Banks Private National Banks Regional Development Banks Foreign Banks & Joint Banks Total
RupiahForeign
CurrencySub Total
RupiahForeign
CurrencySub Total
RupiahForeign
CurrencySub Total
RupiahForeign
CurrencySub Total
RupiahForeign
CurrencySubTotal
2002 51,320 22,413 73,733 44,238 24,922 69,160 25,758 23 25,781 9,561 25,831 35,392 130,877 73,189 204,067
2003 64,181 17,290 81,471 53,401 27,180 80,581 27,081 40 27,121 11,235 24,351 35,586 155,898 68,861 224,759
2004
March 63,411 17,258 80,669 54,298 30,496 84,794 25,266 86 25,352 12,554 24,872 37,426 155,529 72,712 228,241
June 66,444 19,563 86,007 57,147 32,187 89,334 27,148 95 27,243 13,057 29,434 42,491 163,796 81,279 245,075
September 64,340 22,037 86,377 58,406 29,828 88,234 28,779 68 28,847 14,097 28,242 42,339 165,622 80,175 245,797
December 63,597 19,251 82,848 62,493 27,311 89,804 30,417 62 30,479 15,154 28,858 44,012 171,661 75,482 247,143
2005
January 63,634 18,688 82,322 60,437 29,074 89,511 30,881 102 30,983 16,041 28,630 44,671 170,993 76,494 247,487
February 65,405 18,643 84,048 61,754 28,912 90,666 31,881 48 31,929 16,485 30,684 47,169 175,525 78,287 253,812
March 65,347 18,416 83,763 61,167 27,481 88,648 33,468 47 33,515 17,613 31,226 48,839 177,595 77,170 254,765
April 63,683 20,632 84,315 58,191 29,166 87,357 33,137 70 33,207 14,456 32,896 47,352 169,467 82,764 252,231
May 63,823 18,667 82,490 60,402 28,565 88,967 33,360 56 33,416 24,083 32,121 56,204 181,668 79,409 261,077
June 76,714 18,994 95,708 60,337 28,042 88,379 38,765 49 38,814 17,747 33,475 51,222 193,563 80,560 274,123
July 68,753 20,743 89,496 58,539 29,079 87,618 39,711 47 39,758 16,099 31,436 47,535 183,102 81,305 264,407
August 68,537 23,563 92,100 62,742 32,399 95,141 43,341 33 43,374 17,261 33,771 51,032 191,881 89,766 281,647
September 67,665 23,871 91,536 59,253 34,660 93,913 42,060 34 42,094 16,939 35,167 52,106 185,917 93,732 279,649
October 66,401 22,561 88,962 56,806 34,461 91,267 39,952 48 40,000 15,002 35,181 50,183 178,161 92,251 270,412
November 69,554 20,868 90,422 57,954 34,742 92,696 44,961 54 45,015 14,952 36,734 51,686 187,421 92,398 279,819
December 70,624 23,256 93,880 60,352 32,874 93,226 50,656 43 50,699 12,901 31,948 44,849 194,533 88,121 282,654
2006
January 72,378 20,437 92,815 58,590 33,881 92,471 49,065 39 49,104 14,285 31,444 45,729 194,318 85,801 280,119
February 70,329 19,767 90,096 57,691 34,186 91,877 51,398 28 51,426 16,952 31,196 48,148 196,370 85,177 281,547
March 71,024 20,305 91,329 56,044 34,452 90,496 53,676 25 53,701 12,690 31,494 44,184 193,434 86,276 279,710
April 69,146 18,985 88,131 56,214 33,278 89,492 56,595 29 56,624 12,780 29,883 42,663 194,735 82,175 276,910
May 74,051 20,614 94,665 60,556 32,766 93,322 65,810 27 65,837 14,319 30,454 44,773 214,736 83,861 298,597
June 74,910 20,547 95,457 60,488 32,767 93,255 66,604 33 66,637 13,129 29,894 43,023 215,131 83,241 298,372
July 72,908 20,492 93,400 62,363 34,652 97,015 63,176 103 63,279 13,435 30,589 44,024 211,882 85,836 297,718
August 78,712 21,337 100,049 65,714 33,934 99,648 72,350 71 72,421 15,131 30,486 45,617 231,907 85,828 317,735
September 76,444 23,400 99,844 66,518 31,701 98,219 71,348 28 71,376 15,997 29,186 45,183 230,307 84,315 314,622
October 75,606 24,258 99,864 70,944 33,538 104,482 72,981 29 73,010 16,854 32,803 49,657 236,385 90,628 327,013
November 76,106 23,396 99,502 71,579 32,429 104,008 74,259 30 74,289 18,115 30,896 49,011 240,059 86,751 326,810
December 89,194 22,732 111,926 71,261 34,979 106,240 74,740 31 74,771 16,025 30,826 46,851 251,220 88,568 339,788
2007
January 85,374 23,302 108,676 73,235 34,359 107,594 69,984 32 70,016 17,645 31,354 48,999 246,238 89,047 335,285
February 83,526 22,702 106,228 73,829 33,494 107,323 73,361 34 73,395 17,660 35,098 52,758 248,376 91,328 339,704
March 80,392 24,319 104,711 69,422 33,558 102,980 76,205 34 76,239 15,230 33,560 48,790 241,249 91,471 332,720
April 79,825 24,218 104,043 73,144 36,063 109,207 76,595 31 76,626 17,246 32,696 49,942 246,810 93,008 339,818
May 78,366 23,953 102,319 70,665 41,282 111,947 76,219 30 76,249 18,374 34,768 53,142 243,624 100,033 343,657
June 85,362 32,081 117,443 79,167 40,038 119,205 77,342 31 77,373 21,936 35,156 57,092 263,807 107,306 371,113
July 92,124 23,977 116,101 86,828 37,025 123,853 81,026 27 81,053 22,564 34,612 57,176 282,542 95,641 378,183
August 88,923 28,219 117,142 85,991 36,422 122,413 87,470 29 87,499 22,445 33,316 55,761 284,829 97,986 382,815
September 84,726 28,758 113,484 83,813 38,593 122,406 87,812 33 87,845 22,127 34,722 56,849 278,478 102,106 380,584
October 85,609 26,127 111,736 89,263 39,571 128,834 83,947 26 83,973 25,844 34,422 60,266 284,663 100,146 384,809
November 87,467 23,898 111,365 89,407 38,127 127,534 85,562 27 85,589 27,191 35,043 62,234 289,627 97,095 386,722
December 122,110 23,852 145,962 94,424 36,561 130,985 69,202 167 69,369 25,301 35,667 60,968 311,037 96,247 407,284

248
Table 34
Commercial Banks’ Time Deposits in Rupiah and Foreign Currency by Maturitybillions of rupiah
End of Period 24 Months 12 Months 6 Months 3 Months 1 Month 1) Others Total
2002 21,447 23,161 20,131 77,078 248,834 56,830 447,480
2003 9,667 31,735 24,516 66,836 232,283 68,090 433,127
2004 4,986 15,458 28,341 47,749 247,897 76,858 421,290
2005
January 5,695 15,027 28,453 48,727 246,015 74,125 418,042
February 4,036 14,673 28,017 48,872 251,151 65,278 412,027
March 4,744 15,666 28,289 49,551 246,697 76,704 421,651
April 6,202 15,531 27,389 54,966 256,483 83,135 443,706
May 4,862 16,996 24,343 60,097 260,951 78,911 446,160
June 6,738 16,909 20,931 61,357 263,001 85,792 454,728
July 5,216 18,043 21,413 60,806 266,924 96,562 468,964
August 4,991 17,605 17,897 63,729 276,093 99,705 480,020
September 4,848 20,419 16,037 65,942 311,077 104,431 522,754
October 3,165 18,580 15,693 64,786 327,130 104,838 534,192
November 2,731 19,539 16,647 62,748 343,194 99,958 544,817
December 4,007 24,144 17,297 61,356 351,672 111,199 569,675
2006
January 4,014 30,383 17,414 63,566 343,054 109,291 567,722
February 4,117 38,843 20,029 64,495 355,468 98,407 581,359
March 4,775 41,384 22,599 67,558 337,614 107,486 581,416
April 4,981 43,781 24,738 69,471 340,574 102,670 586,215
May 4,597 45,708 25,318 74,180 346,842 101,142 597,787
June 5,081 46,995 24,911 72,212 339,917 112,448 601,564
July 5,195 48,122 27,027 73,793 329,713 107,433 591,283
August 4,427 50,691 28,332 75,036 330,012 108,938 597,436
September 4,878 50,058 28,942 78,987 329,918 117,401 610,184
October 5,196 50,792 31,923 80,508 343,700 106,326 618,445
November 5,557 51,042 31,709 81,183 347,324 110,486 627,301
December 6,764 49,799 29,601 80,580 340,942 116,904 624,590
2007
January 6,428 46,919 28,149 79,973 359,842 103,674 624,985
February 6,537 46,488 26,887 77,646 377,153 90,258 624,969
March 6,447 47,613 26,309 74,921 363,904 117,170 636,364
April 6,509 47,670 24,438 73,354 374,210 106,363 632,544
May 6,505 45,503 24,246 74,421 369,478 113,916 634,069
June 6,444 44,874 24,175 73,578 367,435 120,902 637,408
July 6,437 45,058 24,216 72,904 382,971 115,608 647,194
August 5,022 43,859 25,050 70,669 381,628 124,586 650,814
September 4,810 43,391 29,141 71,087 374,877 130,911 654,217
October 4,726 43,141 30,654 71,650 383,264 126,022 659,457
November 4,681 42,720 31,290 72,818 386,552 130,402 668,463
December 4,352 43,343 30,684 75,365 389,505 138,280 681,5291) Including matured time deposits

249
Table 35
Commercial Banks’ Time Deposits in Rupiah by Ownershipbillions of rupiah
End of Period
ResidentsNon-Resi-dents
TotalGovern-ment
Official Entities
Insurance Compa-
nies
State Enter-prises
Private Enter-prises
Social Institu-tions
Coopera-tives
Individuals Others Sub Total
2002 7,869 8,998 27,469 14,434 54,461 31,126 1,204 215,591 2,094 363,248 2,523 365,771
2003 7,226 8,040 27,078 10,157 59,461 31,540 1,181 208,333 1,030 354,046 2,243 356,289
2004
March 8,651 4,711 24,357 9,898 56,866 24,682 414 199,628 861 330,068 1,535 331,603
June 8,742 5,015 25,309 12,056 62,518 24,513 387 197,147 694 336,381 1,464 337,845
September 8,182 4,764 22,498 12,284 66,609 24,042 441 199,028 758 338,606 1,809 340,415
December 5,745 5,129 24,688 11,568 67,498 23,849 440 209,189 2,801 350,907 1,815 352,722
2005
January 7,227 5,062 24,350 11,685 67,669 22,905 392 207,626 1,011 347,927 1,788 349,715
February 9,256 4,843 21,096 11,537 68,017 21,971 395 205,236 809 343,160 1,756 344,916
March 10,295 4,821 23,241 11,559 67,696 22,957 427 207,728 936 349,660 1,939 351,599
April 10,378 4,989 24,499 11,187 73,560 22,376 430 223,741 1,001 372,161 1,777 373,938
May 11,804 5,101 23,809 11,184 69,500 22,337 421 225,089 1,051 370,296 1,777 372,073
June 12,427 4,822 25,916 12,183 67,210 22,123 513 228,364 986 374,544 1,949 376,493
July 13,276 4,880 25,868 15,311 68,550 23,236 472 229,635 1,366 382,594 1,863 384,457
August 14,119 4,302 26,661 14,347 65,862 23,530 541 242,500 1,109 392,971 2,088 395,059
September 14,713 4,293 27,557 13,130 68,626 23,511 492 253,673 1,194 407,189 2,133 409,322
October 13,969 4,544 28,049 14,807 66,184 24,284 551 266,631 1,360 420,379 1,852 422,231
November 13,198 4,541 28,549 14,206 68,429 24,944 518 274,395 1,250 430,030 2,343 432,373
December 10,612 4,852 31,179 17,452 70,244 26,949 529 292,171 1,187 455,175 1,564 456,739
2006
January 16,192 4,697 30,227 18,101 66,883 25,930 528 291,924 1,250 455,732 1,608 457,340
February 20,421 4,950 31,079 23,356 67,304 27,707 550 290,398 1,014 466,779 1,552 468,331
March 22,142 4,990 32,718 20,705 67,279 28,048 523 292,590 1,385 470,380 1,402 471,782
April 23,107 5,025 33,546 23,348 64,668 29,142 562 293,460 1,291 474,149 1,469 475,618
May 28,014 5,111 33,095 24,154 66,800 29,374 560 293,223 1,429 481,760 1,538 483,298
June 29,195 5,081 35,412 22,384 68,939 28,221 667 297,249 1,202 488,350 1,612 489,962
July 28,747 4,908 35,313 22,412 67,722 28,607 594 294,438 983 483,724 1,652 485,376
August 30,130 4,743 34,859 19,881 69,169 29,455 607 295,540 1,109 485,493 1,730 487,223
September 29,542 5,133 36,182 26,764 72,618 29,412 595 296,760 1,253 498,259 1,863 500,122
October 29,223 4,700 36,774 25,280 75,017 30,492 579 299,113 1,046 502,224 1,858 504,082
November 26,590 4,682 36,948 30,648 78,162 31,999 599 303,507 1,027 514,162 1,133 515,295
December 19,508 4,869 38,793 19,435 86,341 31,262 625 308,422 1098 510,353 1,003 511,356
2007
January 23,821 4,918 35,521 19,860 87,710 30,055 679 308,658 1,245 512,467 1,147 513,614
February 26,772 6,196 33,946 22,076 90,491 29,580 607 309,460 1,305 520,433 1,283 521,716
March 28,455 5,504 37,097 23,263 90,223 29,819 602 308,158 1,474 524,595 1,696 526,291
April 36,575 5,685 38,299 20,760 87,490 29,863 611 304,011 1,158 524,452 1,854 526,306
May 37,860 5,562 37,292 21,126 90,342 29,356 625 293,712 1,289 517,164 1,704 518,868
June 35,377 5,355 37,682 20,590 97,758 29,092 610 290,954 1,695 519,113 1,759 520,872
July 34,494 5,227 38,049 16,633 97,864 29,356 677 295,517 1,256 519,073 1,926 520,999
August 35,962 4,815 33,109 16,990 100,151 29,115 743 298,624 1,910 521,419 1,834 523,253
September 36,825 4,909 34,714 17,455 98,973 29,088 701 295,459 1,676 519,800 1,890 521,690
October 36,076 4,734 35,400 18,090 100,176 30,280 716 295,111 1,841 522,424 1,788 524,212
November 32,628 4,782 34,389 21,048 106,588 29,585 700 298,280 1,340 529,340 1,816 531,156
December 21,797 4,841 36,210 23,586 118,803 30,339 666 303,321 1,601 541,164 2,121 543,285

250
Table 36
Certificate of Depositsbillions of rupiah
End of Period State Banks Non-State Banks Total
2002 1,768 1,397 3,165
2003 641 1,165 1,806
2004 498 291 789
2005 497 256 753
2006
January 474 246 720
February 5,117 168 5,285
March 480 168 648
April 5,150 170 5,320
May 5,391 163 5,554
June 5,397 145 5,542
July 4,166 221 4,387
August 5,315 210 5,525
September 5,385 358 5,743
October 4,829 374 5,203
November 4,860 343 5,203
December 4,504 353 4,857
2007
January 4,552 369 4,921
February 4,567 353 4,921
March 4,838 311 5,150
April 4,816 297 5,113
May 4,684 301 4,985
June 4,119 287 4,406
July 4,197 371 4,569
August 5,782 488 6,270
September 6,037 589 6,626
October 6,035 556 6,591
November 7,449 539 7,989
December 8,923 240 9,163

251
Table 37
Commercial Banks’ Saving Deposits by Type of Deposits
End of Period
Saving Deposits Withdrawable Anytime
Saving Deposits Other Saving Deposits Total
Depositors (thousands)
Outstanding (billions Rp)
Depositors (thousands)
Outstanding (billions Rp)
Depositors (thousands)
Outstanding (billions Rp)
Depositors (thousands)
Outstanding (billions Rp)
2002 68,010 191,177 750 1,116 1,028 1,175 69,789 193,468
2003 69,370 241,366 761 1,318 1,334 1,756 71,465 244,439
2004
March 68,558 242,511 873 3,436 1,454 2,043 70,885 247,990
June 90,539 256,772 862 2,386 1,391 1,886 92,793 261,043
September 59,433 267,171 769 2,355 945 1,469 61,147 270,995
December 70,391 292,609 801 2,457 872 1,581 72,064 296,647
2005
January 71,018 282,024 627 2,050 923 1,550 72,568 285,624
February 70,694 279,744 683 2,223 919 1,556 72,296 283,523
March 71,586 280,615 815 2,517 903 1,526 73,304 284,658
April 71,417 281,080 794 2,655 836 1,438 73,047 285,173
May 72,309 276,976 861 2,998 851 1,482 74,020 281,456
June 72,362 278,750 744 4,129 871 1,536 73,978 284,415
July 72,187 280,012 742 4,101 838 1,476 73,767 285,589
August 72,214 283,322 701 3,934 759 1,377 73,674 288,633
September 73,061 275,633 698 3,769 730 1,347 74,489 280,749
October 73,101 267,603 714 4,248 747 1,342 74,562 273,193
November 72,837 266,926 756 4,680 745 1,441 74,338 273,047
December 73,790 275,690 736 4,553 750 1,513 75,276 281,756
2006
January 73,821 268,312 754 4,759 708 1,485 75,283 274,556
February 74,375 265,580 763 4,669 700 1,450 75,838 271,699
March 74,588 262,027 824 4,807 707 1,484 76,118 268,319
April 66,683 263,506 806 5,369 638 1,444 68,127 270,319
May 69,131 268,072 913 5,997 703 1,559 70,748 275,628
June 68,268 271,886 859 6,138 700 1,509 69,827 279,534
July 66,785 274,148 824 6,017 709 1,563 68,317 281,729
August 66,068 276,739 842 5,673 750 1,623 67,660 284,036
September 66,068 276,739 842 5,673 750 1,623 67,660 284,036
October 67,003 291,799 853 6,382 643 1,300 68,499 299,480
November 87,614 300,854 896 6,832 604 1,344 89,113 309,030
December 67,201 325,564 1,023 7,399 640 1,417 68,864 334,380
2007
January 67,651 322,512 984 7,072 622 1,445 69,258 331,029
February 65,999 322,622 1,048 7,169 668 1,409 67,715 331,199
March 66,271 324,959 1,066 7,419 631 1,465 67,968 333,842
April 65,722 330,157 1,065 7,139 588 1,420 67,376 338,715
May 60,741 330,541 1,169 7,606 371 1,177 62,281 339,324
June 64,820 346,932 1,076 7,146 449 1,242 66,345 355,321
July 63,202 355,149 1,134 7,494 523 1,905 64,859 364,548
August 72,515 361,510 1,169 7,487 464 2,486 74,148 371,483
September 72,345 368,671 1,183 7,629 453 2,636 73,981 378,936
October 71,936 377,507 1,258 8,141 458 2,911 73,652 388,559
November 71,893 386,944 1,317 8,425 450 3,102 73,659 398,470
December 69,267 426,809 1,392 9,451 440 3,108 71,099 439,369

252
Table 38
Interest Rates on Rupiah Credits by Group of Banks1)
percent
End of Period
State BanksRegional Development
BanksPrivate National
BanksForeign Banks &
Joint BanksCommercial Banks
Working Capital
Invest-ment
Working Capital
Invest-ment
Working Capital
Invest-ment
Working Capital
Invest-ment
Working Capital
Invest-ment
2002 18.85 17.50 19.93 17.89 18.21 18.30 15.71 16.09 18.25 17.82
2003 16.18 15.54 19.08 17.20 14.66 15.75 11.02 12.60 15.07 15.68
2004 14.32 14.10 17.54 16.24 13.13 13.91 9.33 11.44 13.41 14.05
2005 15.71 14.98 16.85 15.51 16.95 16.23 14.50 15.55 16.23 15.66
2006
March 15.89 15.05 16.90 15.61 17.13 16.65 14.20 15.14 16.35 15.90
June 15.71 15.09 16.77 15.47 16.93 16.66 13.64 15.69 16.15 15.94
September 15.64 15.11 16.70 15.55 16.50 16.13 12.71 15.00 15.82 15.66
December 15.36 14.98 16.60 15.28 15.41 15.42 11.42 13.21 15.07 15.10
2007
January 15.20 14.75 16.28 15.16 15.34 15.21 10.84 12.50 14.90 14.85
February 15.11 14.70 16.35 15.17 15.16 14.98 10.44 12.22 14.71 14.71
March 14.89 14.49 16.20 15.22 14.84 14.73 10.54 12.48 14.49 14.53
April 14.76 14.44 15.97 15.09 14.54 14.46 10.35 12.21 14.30 14.38
May 14.60 14.22 15.90 15.19 14.25 14.22 10.16 12.06 14.06 14.16
June 14.40 14.03 15.79 15.02 14.07 14.04 9.86 11.57 13.88 13.99
July 14.26 13.81 15.71 14.99 13.84 13.88 9.86 11.56 13.71 13.82
August 14.54 13.98 15.64 14.93 13.50 13.69 9.85 11.37 13.66 13.75
September 13.90 13.43 15.66 14.81 13.24 13.49 10.04 11.32 13.31 13.45
October 13.68 13.27 15.51 14.71 13.13 13.37 10.19 10.53 13.16 13.28
November 13.64 13.19 15.37 14.70 13.12 13.26 10.25 10.70 13.16 13.19
December 13.47 12.93 15.33 14.61 12.96 13.11 10.23 10.56 13.00 13.011) Weighted average
Table 39
Commercial Banks’ Credits in Rupiah and Foreign Currency by Economic Sector1)
billions of rupiah
Item 2002 2003 2004 2005 20062007
Mar Jun Sep Dec
Credit in Rupiah 271,851 342,026 438,880 566,444 639,153 640,239 689,779 732,986 793,186
Agriculture 19,121 20,759 26,604 29,437 34,932 33,715 36,289 37,036 41,123
Mining 2,441 1,546 1,467 2,247 2,658 2,611 2,740 2,599 2,789
Manufacturing 64,986 67,323 77,299 98,096 104,457 102,276 104,302 108,304 115,172
Trade 56,854 74,787 97,988 121,216 145,871 147,758 162,444 173,292 186,881
Services 44,581 68,007 86,045 110,100 126,325 123,768 137,087 147,198 165,965
Others 83,868 109,603 149,476 205,349 224,910 230,111 246,917 264,557 281,256
Credit in Foreign Currency 93,559 95,917 114,668 123,226 147,984 154,475 165,207 174,275 201,926
Agriculture 3,211 3,548 5,772 7,241 10,071 9,304 10,160 12,044 14,783
Mining 3,654 3,515 6,263 5,627 11,238 12,559 16,185 13,717 22,551
Manufacturing 56,049 55,801 66,304 71,582 77,976 79,857 80,525 81,618 88,636
Trade 9,124 9,470 13,046 12,893 16,525 18,663 19,074 22,987 28,789
Services 16,402 21,123 21,812 24,844 31,313 33,444 37,562 43,301 46,476
Others 5,119 2,460 1,471 1,041 861 649 1,700 607 691
Total 365,410 437,942 553,548 689,670 787,137 794,714 854,986 907,260 995,112
Agriculture 22,332 24,307 32,376 36,678 45,003 43,019 46,449 49,080 55,906
Mining 6,095 5,061 7,730 7,874 13,896 15,169 18,925 16,316 25,340
Manufacturing 121,035 123,125 143,603 169,678 182,433 182,133 184,827 189,922 203,808
Trade 65,978 84,257 111,035 134,109 162,396 166,421 181,518 196,279 215,670
Services 60,983 89,129 107,858 134,944 157,638 157,212 174,650 190,499 212,441
Others 88,987 112,063 150,947 206,390 225,771 230,761 248,617 265,164 281,947
1) Excluding inter-bank loans, loans to the Central Government and non-residents, and aid counterpart funds

253
Table 40
Commercial Banks’ Credits in Rupiah and Foreign Currency by Type of Credit and Economic Sector1)
billions of rupiah
Items 2002 2003 2004 2005 20062007
Mar Jun Sep Dec
Working Capital Credits 282,486 343,626 436,684 557,207 638,264 644,791 691,737 737,554 811,347
Agriculture 10,336 11,703 18,889 21,014 25,804 24,171 26,227 27,483 31,924
Mining 2,497 2,951 3,575 4,239 8,503 9,967 10,151 7,614 14,693
Manufacturing 89,555 92,045 106,948 130,374 141,670 142,145 143,211 14,764 159,118
Trade 55,804 70,147 91,548 112,072 137,103 140,332 153,414 16,764 185,623
Services 35,307 54,718 64,777 83,120 99,414 97,416 110,117 122,013 138,041
Others 88,987 112,062 150,947 206,388 225,770 230,760 248,617 548,916 281,948
Investment Credits 82,924 94,316 116,864 132,463 148,872 149,923 163,249 169,706 183,764
Agriculture 11,996 12,604 13,487 15,664 19,199 18,847 20,222 21,597 23,982
Mining 3,598 2,110 4,155 3,635 5,393 5,202 8,776 8,702 10,647
Manufacturing 31,480 31,080 36,655 39,304 40,763 39,988 41,616 42,281 44,690
Trade 10,174 14,110 19,486 22,036 25,293 26,089 28,104 28,639 30,046
Services 25,676 34,412 43,081 51,824 58,224 59,797 64,531 68,487 74,399
Others - - - - - - - - -
Total 365,410 437,942 553,548 689,670 787,136 794,714 854,986 907,260 995,111
Agriculture 22,332 24,307 32,376 36,678 45,003 43,018 46,449 49,080 55,906
Mining 6,095 5,061 7,730 7,874 13,896 15,169 18,927 16,316 25,340
Manufacturing 121,035 123,125 143,603 169,678 182,433 182,133 184,827 57,045 203,808
Trade 65,978 84,257 111,035 134,108 162,396 166,421 181,518 45,403 215,669
Services 60,983 89,130 107,858 134,944 157,638 157,213 174,648 190,500 212,440
Others 88,987 112,062 150,947 206,388 225,770 230,760 248,617 548,916 281,9481) Excluding inter-bank loans, loans to the Central Government and non-residents, and aid counterpart funds
254
Table 41
Commercial Banks’ Credits in Rupiah and Foreign Currency by Group of Banks and Economic Sector1)
billions of rupiah
Item 2002 2003 2004 2005 20062007
Mar Jun Sep Dec
1. State Banks 145,984 173,154 217,066 250,319 282,784 282,633 301,186 314,427 348,972
Agriculture 13,632 14,988 20,224 21,908 25,816 24,222 26,805 28,433 30,281
Mining 4,040 2,951 4,383 3,250 4,771 7,414 9,006 6,556 10,647
Manufacturing 48,155 49,923 59,185 65,781 71,165 71,600 69,959 69,450 72,810
Trade 24,144 30,270 44,928 49,809 61,431 63,561 68,172 75,722 85,601
Services 19,835 30,896 31,755 37,448 43,481 39,477 44,868 47,465 55,586
Others 36,178 44,126 56,591 72,124 76,120 76,359 82,376 86,801 94,047
2. Private National Banks 136,981 175,082 224,560 295,014 334,943 335,998 367,168 394,451 432,596
Agriculture 6,383 6,857 8,697 9,541 11,430 11,312 12,053 12,467 15,533
Mining 1,209 1,416 2,268 3,267 6,460 5,409 7,321 7,076 10,678
Manufacturing 34,192 37,433 45,195 55,185 61,525 59,826 63,319 68,670 73,840
Trade 33,869 45,464 55,702 71,098 85,628 86,783 95,549 100,883 108,726
Services 30,541 42,589 53,632 68,660 78,963 80,252 90,497 98,503 110,144
Others 30,787 41,323 59,066 87,262 90,937 92,416 98,429 106,852 113,675
3. Regional Development Banks 21,518 29,198 37,246 44,909 55,959 58,851 65,123 70,937 71,920
Agriculture 969 1,113 1,320 1,640 2,030 2,090 2,130 2,248 2,274
Mining 121 20 33 54 58 58 58 55 43
Manufacturing 325 338 400 421 457 487 520 543 631
Trade 3,693 4,789 6,292 7,532 8,239 8,386 8,762 9,295 9,617
Services 2,562 4,927 5,322 5,632 6,915 6,776 7,747 9,850 8,878
Others 13,848 18,011 23,879 29,629 38,260 41,054 45,906 48,946 50,477
4. Foreign & Joint Banks 60,927 60,508 74,676 99,428 113,450 117,232 121,509 127,445 141,623
Agriculture 1,348 1,350 2,135 3,589 5,727 5,395 5,460 5,933 7,817
Mining 725 674 1,046 1,303 2,607 2,287 2,540 2,629 3,972
Manufacturing 38,363 35,430 38,823 48,291 49,285 50,219 51,029 51,259 56,527
Trade 4,272 3,734 4,113 5,669 7,098 7,691 9,035 10,379 11,726
Services 8,045 10,717 17,149 23,203 28,279 30,709 31,540 34,679 37,831
Others 8,174 8,603 11,410 17,374 20,454 20,931 21,905 22,566 23,749
5. Total (1 through 4) 365,410 437,942 553,548 689,671 787,136 794,714 854,986 907,260 995,111
Agriculture 22,332 24,308 32,376 36,678 45,003 43,019 46,448 49,081 55,905
Mining 6,095 5,061 7,730 7,874 13,896 15,168 18,925 16,316 25,340
Manufacturing 121,035 123,124 143,603 169,678 182,432 182,132 184,827 189,922 203,808
Trade 65,978 84,257 111,035 134,108 162,396 166,421 181,518 196,279 215,670
Services 60,983 89,129 107,858 134,943 157,638 157,214 174,652 190,497 212,439
Others 88,987 112,063 150,947 206,389 225,771 230,760 248,616 265,165 281,948
1) Excluding inter-bank loans, loans to the Central Government and non-residents, and aid counterpart funds
Table 42
Flow of Banknotes in Bank Indonesia Head Office and Regional Officestrillions of rupiah
Office2002 2003 2004 2005 2006 2007
Inflow Outflow Inflow Outflow Inflow Outflow Inflow Outflow Inflow Outflow Inflow Outflow
Jakarta 37.7 62.3 50.4 75.6 58.4 86.6 70.2 100.8 49.9 83.7 33.6 57.7
Bandung 40.6 26.2 43.4 28.9 51.3 33.6 54.5 38.1 63.0 45.3 24.7 19.1
Semarang 27.4 19.1 29.9 22.5 36.0 26.6 40.7 30.0 37.3 29.4 20.2 10.7
Surabaya 40.4 36.8 42.1 39.2 49.2 45.8 54.1 52.8 58.4 58.9 26.4 27.1
Medan 16.7 17.7 15.0 14.7 18.3 17.1 20.7 19.0 29.1 31.8 18.8 23.2
Padang 12.1 16.4 14.2 18.5 17.5 22.3 19.4 24.9 20.7 28.2 9.0 20.3
Makassar 15.1 16.8 15.7 18.1 18.5 20.7 21.8 24.5 29.7 35.9 14.8 21.9
Banjarmasin 11.4 15.4 13.0 17.0 15.5 19.7 17.3 22.6 16.8 24.8 6.7 15.7
Total 201.4 210.7 223.7 234.6 264.7 272.4 298.8 312.7 304.9 337.8 154.2 195.6

255
Table 44
World Economic Growthpercent
Countries 2002 2003 2004 2005 2006 2007*
World 3.1 4.0 5.3 4.8 5.4 5.2 Industrial Countries 1.6 1.9 3.2 2.5 2.9 2.5
United States 1.6 2.5 3.6 3.1 2.9 1.9
Europe 0.9 0.8 2.0 1.5 2.8 2.5
Germany - -0.3 1.1 0.8 2.9 2.4
France 1.0 1.1 2.5 1.7 2.0 1.9
Italy 0.3 - 1.2 0.1 1.9 1.7
Japan 0.3 1.4 2.7 1.9 2.2 2.0
United Kingdom 2.1 2.8 3.3 1.8 2.8 3.1
Canada 2.9 1.9 3.1 3.1 2.8 2.5
NIEs 5.0 3.0 5.5 3.1 3.8 3.8
Developing Countries 5.1 6.7 7.7 7.5 8.1 7.4
Africa 3.6 4.7 5.8 5.6 5.6 5.7
Latin America 0.3 2.4 6.0 4.6 5.5 5.0
Asia 7.0 8.3 8.8 9.2 9.8 9.8
People’s Republic of China 9.1 10.0 10.1 10.4 11.1 11.5
Indonesia 4.5 4.8 5.0 5.7 5.5 6.2
Malaysia 4.4 5.5 7.2 5.2 5.9 5.8
Thailand 5.3 7.1 6.3 4.5 5.0 4.0
Philippines 4.4 4.9 6.4 4.9 5.4 6.3
Vietnam 7.1 7.3 7.8 8.4 8.2 8.3
Central and Eastern Europe 4.5 4.8 6.7 5.6 6.3 5.8
CIS 1) 5.3 7.9 8.4 6.6 7.7 7.8
Russia 4.7 7.3 7.2 6.4 6.7 7.0
Middle East 4.0 6.6 5.6 5.4 5.6 5.9
Source: IMF, World Economic Outlook October 2007 1) Commonwealth of Independent States.* Provisional Figures
Table 43
Flow of Coins in Bank Indonesia Head Office and Regional Officesbillions of rupiah
Office2002 2003 2004 2005 2006 2007
Inflow Outflow Inflow Outflow Inflow Outflow Inflow Outflow Inflow Outflow Inflow Outflow
Jakarta 0.6 187.7 4.2 203.4 33.7 195.6 61.3 254.1 23.1 196.7 15.8 160.9
Bandung 24.9 25.6 69.0 26.4 90.2 43.7 91.6 35.4 78.4 18.7 41.1 7.1
Semarang 20.5 12.9 44.5 11.5 59.2 22.4 72.7 15.0 64.2 6.4 40.3 4.3
Surabaya 2.5 50.0 8.2 60.2 10.4 46.6 19.2 58.2 17.7 36.5 3.4 29.7
Medan 1.0 24.9 2.1 24.0 8.1 29.4 17.7 26.3 13.3 18.9 4.6 6.7
Padang 0.5 24.8 0.4 23.9 0.7 20.2 2.9 17.9 2.0 11.6 1.7 10.7
Makassar 0.8 16.5 2.1 19.0 4.5 20.4 9.9 20.8 6.6 10.8 1.0 6.5
Banjarmasin 0.6 19.6 0.4 23.6 0.7 22.8 2.4 21.1 0.9 14.7 0.3 14.0
Total 51.4 362.0 131.0 391.9 207.5 401.2 277.7 448.8 206.3 314.2 108.1 239.9

256
Table 45
World Inflation Ratepercent
Countries 2002 2003 2004 2005 2006 2007*
World 3.3 3.5 3.6 3.7 3.6 3.9 Industrial Countries 1.6 1.7 2.0 2.0 2.1 1.9
United States 1.7 2.1 2.9 3.2 3.2 2.6
Europe 2.6 2.2 2.0 1.9 1.9 2.0
Germany 1.3 1.0 1.8 2.0 2.0 2.0
France 1.9 2.2 2.3 1.9 1.9 1.6
Italy 2.6 2.8 2.3 2.2 2.2 1.9
Japan -0.9 -0.3 0.0 -0.3 0.3 0.0
United Kingdom 1.3 1.4 1.3 2.0 2.3 2.4
Canada 2.3 2.7 1.8 2.2 2.0 2.2
NIEs 1.0 1.5 2.4 2.3 1.6 2.0
Other Industrial Countries 1.7 1.8 1.7 2.1 2.1 2.1
Developing Countries 5.7 5.7 5.4 5.2 5.1 5.9
Africa 8.0 7.8 5.5 6.6 6.3 6.6
Latin America 8.9 10.6 6.5 6.3 5.4 5.3
Asia 2.0 2.5 4.1 3.6 4.0 5.3
People’s Republic of China -0.8 1.2 3.9 1.8 1.5 4.5
Indonesia 6.8 6.1 10.5 13.1 6.3 13.0
Malaysia 1.8 1.1 1.4 3.0 3.6 2.1
Thailand 0.6 1.8 2.8 4.5 4.6 2.0
Philippines 2.9 3.5 6.0 7.6 6.7 3.0
Vietnam 4.0 3.2 7.7 8.3 7.5 7.3
Central and Eastern Europe 14.9 9.2 6.1 4.9 5.0 5.1
CIS 1) 13.4 11.9 10.3 12.1 9.4 8.9
Russia 15.8 13.7 10.9 12.7 9.7 8.1
Middle East 5.3 6.2 7.2 6.9 7.5 10.8
Source: IMF, World Economic Outlook October 2007 1) Commonwealth of Independent States.* Provisional Figures
Table 46
Interest Rates (%) and Exchange Rates
Description 2002 2003 2004 2005 2006 2007
Government Bond Yield (10 years) United States 3.82 4.25 4.22 4.39 4.70 4.02 Japan 0.91 1.37 1.44 1.48 1.69 1.51 Europe 4.20 4.29 3.68 3.31 3.95 4.33
LIBOR 6 months
$ 1.38 1.22 2.78 4.70 5.37 4.60
Yen 0.07 0.07 0.07 0.08 0.63 0.98
Euro 2.80 2.16 2.21 2.64 3.86 4.71
Exchange Rates
Yen/$ 118.69 106.92 102.48 117.48 118.88 112.02
$/EUR 1.05 1.26 1.37 1.18 1.32 1.47
$/GBP 1.61 1.78 1.93 1.72 1.96 2.01
Source: Bloomberg

257
Table 48
Current Accounts in Industrial and Developing Countriespercent of GDP
Countries 2002 2003 2004 2005 2006 2007*
Industrial Countries -0.8 -0.7 -0.7 -1.3 -1.4 -1.3
United States -4.4 -4.8 -5.5 -6.1 -6.2 -5.7
Europe 0.7 0.5 1.1 0.3 - -0.2
Germany 2.0 1.9 4.3 4.6 5.0 5.4
France 1.4 0.8 0.1 -1.1 -1.2 -1.6
Italy -0.8 -1.3 0.9 -1.5 -2.4 -2.3
Japan 2.9 3.2 3.7 3.6 3.9 4.5
United Kingdom 1.6 -1.3 -1.6 -2.5 -3.2 -3.5
Canada 1.7 1.2 2.3 2.0 1.6 1.8
Developing Countries
Africa -1.4 -0.3 0.1 2.0 3.1 -
Latin America -0.9 0.4 1.0 1.4 1.5 0.6
Asia 2.4 2.8 2.6 4.1 5.9 6.9
People’s Republic of China 2.4 2.8 3.6 7.2 9.4 11.7
Indonesia 4.0 3.5 0.6 0.1 2.7 1.6
Malaysia 8.4 12.7 12.6 15.3 17.2 14.4
Thailand 3.7 3.4 1.7 -4.5 1.6 3.7
Philippines -0.5 0.4 1.9 2.0 4.3 3.8
Vietnam -1.9 -4.9 -3.4 -0.9 -0.3 -3.2
Central and Eastern Europe -3.5 -4.5 -5.9 -5.2 -6.6 -7.3
CIS1) 6.5 6.3 8.2 8.8 7.6 4.8
Russia 8.4 8.2 10.1 11.1 9.7 5.9
Middle East 4.8 8.3 11.7 19.4 19.7 16.7
Source: IMF, World Economic Outlook October 2007 1) Commonwealth of Independent States.* Provisional Figures
Table 47
World Trade Volume and Pricepercent
Description 2002 2003 2004 2005 2006 2007*
Goods Trade Volume 3.7 6.4 10.9 7.4 9.3 6.3 Price
Industrial Goods 2.1 14.3 9.5 3.7 3.8 7.9
Non-Oil/Gas Primary Commodities 1.7 6.9 18.5 10.3 28.4 12.2
Oil 2.5 15.8 30.7 41.3 20.5 6.6
Source: IMF, World Economic Outlook October 2007* Provisional Figures

258
ABCP Asset Backed Commercial Paper
ABR ASEAN Baseline Report
ABS Asset Backed Securities
AC Air Conditioner
ADB Asian Development Bank
AKAP Inter City Inter Province
APBD Regional Budget
APBN State Budget
APBN - P Revised State Budget
API Indonesian Banking Architecture
ARM Adjustable Rate Mortgage
ASDP Water Transportation
ASEAN Association of South-East Asian Nations
ASKI Indonesian Financial System Architecture
ATM Automatic Teller Machine
ATMR Risk Weighted Asset Calculation
BBM Fuel (Oil)
BDSP Business Development Service Provider
BEC Broad Economic Indicators
BEI Indonesia Stock Exchange
BEJ Jakarta Stock Exchange
BES Surabaya Stock Exchange
BG Non-negotiable Payment Order to Account Beneficiary
BI Bank Indonesia
BI - CAC Bank Indonesia - Counterfeit Analysis Center
BI - SSSS Bank Indonesia - Scriptless Security Settlement
System
BIG - eB Bank Indonesia Government - Electronic Banking
BINCS Bank Indonesia National Clearing System
BI-RTGS Bank Indonesia - Real Time Gross Settlement
BIS Bank for International Settlement
BKB Bank with Sound Performance
BKM Scholarship for Gifted Pupils
BKPM Investment Coordinating Board
BM Duty on Imports
BMT Baitul Maal wa Tamwil
BOS School Operational Assistance
BOTASUPAL Coordinating Board for Eradication Counterfeit Money
BPD Regional Development Bank
BPPN Indonesian Banking Restructuring Agency
BPR Rural Bank
BPRS Sharia Rural Bank
BPS Central Bureau of Statistics (Statistics Indonesia)
BSA Bilateral Swap Arrangement
Bulog National Logistics Agency
BUMN State-Owned Enterprises
BUSN National Private Bank
CBPI Card Based Payment Instruments
C&F Carriage and Freight
CAR Capital Adequacy Ratio
CDO Collateralized Debt Obligation
CGI Consultative Group on Indonesia
CIP Covered Interest Rate Parity
CLMV Cambodia, Laos, Myanmar and Vietnam
CMI Chiang Mai Initiative
CP SIPS Core Principal on Systemically Important Payment
System
CPI Consumer Price Index
CPO Crude Palm Oil
CSR Corporate Social Responsibility
DAK Special Allocation Fund
DAU General Allocation Fund
DBH Profit Sharing Fund
DHN National Black List
DIBI Business Information Database
DIRE KIK Property Investment Fund in a form of Collective
Contract Investment
DKI Daerah Khusus Ibukota
DOKP Special Autonomy Funds and Adjustments
DPK Third Party Funds
DSR Debt to Service Ratio
ECB European Central Bank
EMBIG Emerging Market Bond Index Global
EMEAP Executives’ Meeting of East Asia and Pacific Central
Banks
EWS Early Warning System
FASBI O/N Bank Indonesia Deposit Facility Overnight
FDI Foreign Direct Investment
FDR Financing to Deposit Ratio
FED Federal Reserve
FES Sharia Economic Festival
FGD Focus Group Discussion
FKSPN National Payment System Communication Forum
FOMC Federal Open Market Committee
Forex Foreign Exchange
FSAP Financial Sector Assessment Program
Abbreviations

259
FSSK Financial System Stability Forum
FTO Fine Tune Operation
FtS Failure to Settle
FTZ - BBK Free Trade Zone - Batam Bintan Karimun
GCG Good Corporate Governance
GDP Gross Domestic Product
GKG Milled Unhusked Rice
GRA General Resource Account
GWM Minimum Reserve Requirement
HET Highest Retail Price
HJE Retail Selling Price
HMETD Right to Early Bid of Securities
IAS International Accounting Standard
ICAAP Internal Capital Adequacy Assessment Process
ICOR Incremental Capital Output Ratio
ICP Indonesia Crude Price
IHPB Wholesale Price Index
IHSG Indonesia Composite Index
IJ-EPA Indonesia-Japan Economic Partnership Agreement
IMF International Monetary Fund
Inpres Presidential Instruction
IOSCO International Organization of Securities Commission
IPO Initial Public Offering
ITF Inflation Targeting Framework
JCRA Japan Credit Rating Agency
JIBOR Jakarta Interbank Offered Rate
KBI Bank Indonesia Branch Office
KK Consumption Loan
KKBI Bank Indonesia Branch Office Coordinator
KKMBs Bank Partner Financial Consultants
KMK Working Capital Loan
KPEI Securities Insurance and Clearing Agency
KPPN The State Treasury Service Office
KPR Housing Loan
KUR People’s Business Loan
LBT Loans and Building Tax
LDR Loan to Deposit Ratio
LIBOR The London Interbank Offered Rate
LNG Liquefied Natural Gas
LPG Liquefied Petroleum Gas
LPS Depository Guarantee Institution
M0 Base Money
M1 Narrow Money
M2 Broad Money
MDGs Millennium Development Goals
MDRI Multilateral Debt Relief Initiative
MEA ASEAN Economic Community
MFSC Monetary Financial Stability Committee
MICE Meeting, Incentive, Conference, and Exhibition
MOD Major Operational Disruption
MRA Mutual Recognition Arrangement
MSME Micro Small Medium Enterprises
MTS Medium Term Strategy
NAD Nanggroe Aceh Darussalam
NAV Net Asset Value
NBL National Black List
NFA Net Foreign Assets
NGO Non Government Operation
NII Net Interest Income
NNS New Neoclassical Synthesis
NPF Non-Performing Financing
NPI Indonesian Balance of Payments
NPL Non-Performing Loan
NPSCF National Payment System Communication Forum
NPWP Tax Payer Identity Number
NTB West Nusa Tenggara
NTP Farmers Term of Trade
NTT East Nusa Tenggara
OECD Organization for Economic Co-operation and
Development
OMO Open Market Operation
OPEC Organization of Petroleum Exporting Countries
ORI Indonesian Obligation Retail
PAM Drinking Water Corporation
PBI Bank Indonesia’s Regulation
Pemilu General Election
PER Price Earning Ratio
Perda Regional Regulation
Pilkada Regional Head Election
PMA Foreign Direct Investment
PMDN Domestic Investment
PMN National Madany Capital
PMTB Gross Fixed Capital Formation
PNBP Increasing Non-Tax Revenues
PNS Civil Servant
PPA Asset Management Company

260
PPATK Financial Transaction Reporting and Analysis Center
PPh Income Tax
PPnBM Tax on Luxury Goods
PPP Public Private Partnership
PRGF-HIPC Poverty Reduction and Growth Facility-Heavily
Indebted Poor Countries
PSPU Sharia Banking Corporate Social Responsibility
PUAB Interbank Money Market
PVP Payment Versus Payment
PYD Financing Extended
RAPBN Draft State Budget
RAPBN-P Revised Draft State Budget
RBC Real Business Cycle
RCA Revealed Comparative Advantage
RDG Board of Governor’s Meeting
R&I Rating & Investment
ROA Return on Asset
ROE Return on Equity
RPJM Medium Term Development Plan
RPJMN National Medium Term Development Plan
RRH Daily Average
RTGS Real Time Gross Settlement
RTM Poor Household
SBI Bank Indonesia Certificate
SBN Government Securities
SBSN Sharia Government Securities
SD Elementary School
SDA Natural Resources
SDM Human Resources
SIBOR Singapore Interbank Offered Rate
SIPS Systemically Important Payment System
SIPUK Information System on Small Scale Scheme
SITC Standard International Trade Classification
SK Consumer Survey
SKDU Business Survey
SKN National Clearing System
SKNBI Bank Indonesia National Clearing System
SLTA Senior High School
SLTP Junior High School
SOE State Owned Enterprises
SPE Retail Sales Survey
SPN Treasury Bills
SPP Market Perception Survey
SREP Supervisory Review Evaluation and Process
SRO Self Regulatory Organization
SUN Government Bond
SWBI Wadiah Certificate of Bank Indonesia
TDL Electricity Base Tariff
TFP Total Factor Productivity
TKA Foreign Workers
TKI Indonesian Foreign Workers
TKPKD Regional Poverty Alleviation Coordinating Teams
T-Notes Treasury Notes
TPI Inflation Control Team
TPID Regional Inflation Control Team
TPT Open Unemployment
TPT Textile and Textile Products
TSA Treasury Single Account
UIP Uncovered Interest Rate Parity
UK Paper Notes
ULN Foreign Loan
UMP Minimum Salary by Province
US United States
USA United States of America
UU Act
UUPM Capital Market Act
UUS Sharia Business Unit
UYD Circulated Currency
VaR Value at Risk
VAT Value Added Tax
VOA Visa on Arrival
WEO World Economic Outlook
WIB West Indonesia Time
WP Tax Payer
WTI West Texas Intermediate
YoY Year on Year
YtD Year to Date
ZISWaf Zakat, Infaq, Sadaqah, and Waqaf

262

Jl. M.H. Thamrin No. 2, Jakarta 10350 - Indonesia
www.bi.go.id