Embed Size (px)
Citation preview

APP Aircraft Performance Program Training Manual
Using Global Hawk (UAV) as an Example
Lista Studio srl - www.lista.it Prepared by DAR Corporation

2
1. APP Main Graphical User Interface (GUI) The main graphical user interface of the APP is as follows:
Figure 1. APP Main Graphical User Interface (GUI)
There are a total of 8 modules inside the APP • Configuration Module • Aerodynamics Module • Thrust Module • Fuel Module • Store Module • Performance Module • Mission Module The first 5 modules are called the Input modules The last 2 modules are called the Calculation modules.

3
2. Input Modules Input modules include: • Configuration Module Filename Extension: *.apc • Aerodynamics Module Filename Extension: *.apd • Thrust Module Filename Extension: *.apt • Fuel Module Filename Extension: *.apf • Store Module Filename Extension: *.aps The first four modules, i.e. Configuration, Aerodynamic, Thrust, and Fuel modules, NEED to be completed before Calculation modules can generate aircraft performance results. The store module can be left blank, depending on the type of aircraft analyzed. For demonstration purposes, the store module for this Global Hawk example is left blank.
2-1. Configuration Module There are a total of 10 tabs inside the Configuration module • Mass • Engine • Aero • Gear • Limit • Mach Limiter • AOA-G Limiter • Description • <Sheet> • <Chart> The first 8 tabs are input tabs, while the last two tabs are output tabs. Once the first 8 tabs are filled up, summary of the inputs are displayed on the last two output tabs.

4
2-1-1. Mass Tab
Figure 2-1. Mass Tab of Configuration Module
In this tab, the weight data of the Global Hawk is entered. The total takeoff weight of the Global Hawk of 25607.7892 lbf, which is an output, is shown in Figure 2-1.

5
2-1-2. Engine Tab
Figure 2-2. Engine Tab of Configuration Module
In this tab, the basic engine information data of the Global Hawk is entered. Refer to user manual (Page 16) on the thrust Multiplier and the fuel flow multiplier. Normally both of them are zero.

6
2-1-3. Aero Tab
Figure 2-3. Aero Tab of Configuration Module
In this tab, the top level aerodynamic information data of the Global Hawk is entered. Refer to user manual (Page 17) on the above two parameters.

7
2-1-4. Gear Tab
Figure 2-4. Gear Tab of Configuration Module
In this tab, the gear information data of the Global Hawk is entered. If the aircraft has retractable gear system, like the Global Hawk, then inputting zero gear drag area will have negligible impact on the accuracy of the solution. With an input of zero, only in ground operation and takeoff stages when landing gears are down that the drag of the airplane will be underestimated, but by just a short portion of the overall flight segments. Refer to user manual (Page 18) on the above two parameters.

8
2-1-5. Limit Tab
Figure 2-5. Limit Tab of Configuration Module
Refer to user manual (Page 19) on the description of the first four parameters. Back in the Mass Tab, if a non-zero Fixed Op. Equipment weight has been entered, then here in Figure 2-5, make the last input zero.

9
2-1-6. Mach Limiter Tab
Figure 2-6. Mach Limiter Tab of Configuration Module
A maximum diving Mach number of 0.9 is assumed. The aircraft ceiling altitude (max. altitude attainable) is assumed to be 65,000 ft
0.9 0.9

10
2-1-7. AOA-G Limiter Tab
Figure 2-7. AOA-G Limiter Tab of Configuration Module
Refer to user manual (Page 20) on the input values.
-1

11
2-1-8. Description Tab
Figure 2.9. AOA-G Limiter Tab of Configuration Module
This is where user writes down his notes. The entry in the Description tab has no effect on the accuracy of the solution. It can be left blank by the user.

12
2-2. Aerodynamics Module There are a total of 9 tabs inside the Aerodynamics module • Data • CDo • CLo • CDi • CL • CLmax • Description • <Sheet> • <Chart> The first 7 tabs are input tabs, while the last two tabs are output tabs. Once the first 7 tabs are filled up, summary of the inputs are displayed on the last two output tabs.

13
2-2-1. Data Tab
Figure 2-10. Data Tab of Aerodynamics Module
In this tab, the wing aspect ratio and the wing reference area of the Global Hawk is entered.

14
2-2-2. CDo Tab
Figure 2-11. CDo Tab of Aerodynamics Module (@ Alt = 0)
In this tab, the Global Hawk zero lift drag coefficient at three different altitudes, as a function of Mach number, is entered into the program. The remaining input data is summarized in the following table.
Table 2-1. Global Hawk Zero Lift Drag Coefficient as functions of Altitude & Mach # Alt [kft] Mach CDo
30 0.200 0.0226 30 0.300 0.0182 30 0.400 0.0168 30 0.500 0.0165 30 0.598 0.0164 60 0.400 0.0249 60 0.450 0.0231 60 0.500 0.0220 60 0.550 0.0214 60 0.598 0.0211
0.0241 0.0158 0.0145 0.0147 0.0146 0.0142

15
2-2-3. CLo Tab
Figure 2-12. CLo Tab of Aerodynamics Module
This set of data entry can be filled with zeros. Refer to user manual (Page 22) on the input values.
0

16
2-2-4. CDi Tab
Figure 2-13. CDi Tab of Aerodynamics Module (@ Alt = 60 kft)
In this tab, the Global Hawk induced drag coefficient, as functions of lift coefficient and Mach number, at a cruising altitude of 60 kft, is entered into the program. The user is reminded to enter the induced drag coefficient at the DESIGN CRUISING ALTITUDE of the aircraft into the program. If the design cruising altitude of the Global Hawk is at 30 kft, then in the above tab, based on Table 2-1, the Mach number range in the left window should include be (AT LEAST) from Mach 0.200 to Mach 0.598. The user should at least enter the induced drag coefficient of the aircraft at both ends of the Mach number, i.e. at Mach 0.200 and Mach 0.598 (at Alt of 30 kft). On the other hand, to improve the accuracy of the solution, the user can choose to input more induced drag coefficient data at other Mach numbers in within Mach 0.200 & Mach 0.598. For example, the user can have one additional data input at Mach 0.400.
0

17
The complete input data for the CDi tab is summarized in the following table.
Table 2-2. Induced Drag Coefficient as a function of Mach # (@ Alt = 60 kft) Mach 0.400 Mach 0.598 Mach 0.400 Mach 0.598
CL CDi CL CDi CL CDi CL CDi 0.0000 0.0000 0.0000 0.0000 0.7191 0.0078 0.7191 0.0077 0.0225 0.0000 0.0225 0.0000 0.7416 0.0084 0.7416 0.0083 0.0449 0.0000 0.0449 0.0000 0.7640 0.0089 0.7640 0.0088 0.0674 0.0000 0.0674 0.0000 0.7865 0.0094 0.7865 0.0093 0.0899 0.0000 0.0899 0.0001 0.8090 0.0100 0.8090 0.0099 0.1124 0.0001 0.1124 0.0002 0.8315 0.0106 0.8315 0.0104 0.1348 0.0002 0.1348 0.0002 0.8539 0.0112 0.8539 0.0110 0.1573 0.0003 0.1573 0.0003 0.8764 0.0118 0.8764 0.0116 0.1798 0.0004 0.1798 0.0004 0.8989 0.0125 0.8989 0.0123 0.2022 0.0005 0.2022 0.0006 0.9213 0.0131 0.9213 0.0129 0.2247 0.0006 0.2247 0.0007 0.9438 0.0138 0.9438 0.0136 0.2472 0.0008 0.2472 0.0009 0.9663 0.0145 0.9663 0.0142 0.2697 0.0010 0.2697 0.0010 0.9888 0.0152 0.9888 0.0149 0.2921 0.0012 0.2921 0.0012 1.0112 0.0160 1.0112 0.0157 0.3146 0.0014 0.3146 0.0014 1.0337 0.0167 1.0337 0.0164 0.3371 0.0016 0.3371 0.0016 1.0562 0.0175 1.0562 0.0171 0.3596 0.0018 0.3596 0.0019 1.0787 0.0183 1.0787 0.0179 0.3820 0.0021 0.3820 0.0021 1.1011 0.0191 1.1011 0.0187 0.4045 0.0023 0.4045 0.0024 1.1236 0.0199 1.1236 0.0195 0.4270 0.0026 0.4270 0.0027 1.1461 0.0208 1.1461 0.0203 0.4494 0.0029 0.4494 0.0030 1.1685 0.0216 1.1685 0.0211 0.4719 0.0033 0.4719 0.0033 1.1910 0.0225 1.1910 0.0220 0.4944 0.0036 0.4944 0.0036 1.2135 0.0234 1.2135 0.0229 0.5169 0.0039 0.5169 0.0039 1.2360 0.0244 1.2360 0.0238 0.5393 0.0043 0.5393 0.0043 1.2584 0.0253 1.2584 0.0247 0.5618 0.0047 0.5618 0.0047 1.2809 0.0263 1.2809 0.0256 0.5843 0.0051 0.5843 0.0051 1.3034 0.0273 1.3034 0.0265 0.6067 0.0055 0.6067 0.0055 1.3258 0.0283 1.3258 0.0275 0.6292 0.0059 0.6292 0.0059 1.3483 0.0293 1.3483 0.0285 0.6517 0.0064 0.6517 0.0063 1.3708 0.0303 1.3708 0.0295 0.6742 0.0069 0.6742 0.0068 1.3933 0.0314 1.3933 0.0305 0.6966 0.0073 0.6966 0.0073 1.4157 0.0325 1.4157 0.0316

18
2-2-5. CL Tab
Figure 2-14. CL Tab of Aerodynamics Module (@ Alt = 60 kft)
In this tab, the lift coefficient range, corresponding to its aircraft angle-of-attack range, at the design cruising altitude of the Global Hawk, is entered into the program. Refer to user manual (Page 23) on the several important notes on the description of the input. The remaining input data for the CL tab is summarized in the following table. Table 2-3. Global Hawk Lift Coefficient Range as a function of Mach # (@ Alt = 60 kft)
Mach AOA [deg] CL 0.4 0.000 0.4181 0.4 11.946 1.4157
0.2880 1.4157

19
2-2-6. CLmax Tab
Figure 2-15. CLmax Tab of Aerodynamics Module (@ Alt = 60 kft)
In this tab, the aircraft maximum lift coefficient as a function of Mach number, at the aircraft design cruise altitude, is entered into the program. Refer to user manual (Page 24) on the several important notes on the description of the input.
1.4157 1.4157 1.4157 1.4157 1.4157

20
2-3. Thrust Module There are a total of 6 tabs inside the Thrust module • Max. Thrust • Min. Thrust • Fuel File • Description • <Sheet> • <Chart> The first 4 tabs are input tabs, while the last two tabs are output tabs. Once the first 4 tabs are filled up, summary of the inputs are displayed on the last two output tabs. Based on published information, the engine on the Global Hawk is the Rolls-Royce North America AE3007H turbofan engine capable of producing a static thrust of 7,150 lbf. Since the detailed engine performance information is not made public, here for demonstration purposes, the publicly available Williams FJ44 engine performance information is scaled up and used instead. The user is reminded that such changes have drastic impact on the results of the performance analysis.

21
2-3-1. Max Thrust Tab
Figure 2-16. Max. Thrust Tab of Thrust Module
In this tab, the aircraft maximum thrust, as functions of Mach number and altitude, is entered into the program. The complete input data is summarized in the following table.

22
Table 2-1. Global Hawk Engine Maximum Thrust as functions of Altitude & Mach # Alt [kft] Mach CDo
0 0.1 5561 0 0.2 4985 0 0.3 4508 0 0.4 4171 0 0.5 3873 0 0.598 3654
30 0.2 2510 30 0.3 2363 30 0.4 2244 30 0.5 2137 30 0.598 2046 60 0.40 1108 60 0.45 1088 60 0.50 1073 60 0.55 1053 60 0.598 1033

23
2-3-2. Min Thrust Tab
Figure 2-17. Min. Thrust Tab of Thrust Module
In this tab, the aircraft minimum thrust, as functions of Mach number and altitude, is entered into the program. The complete input data is summarized in the following table.
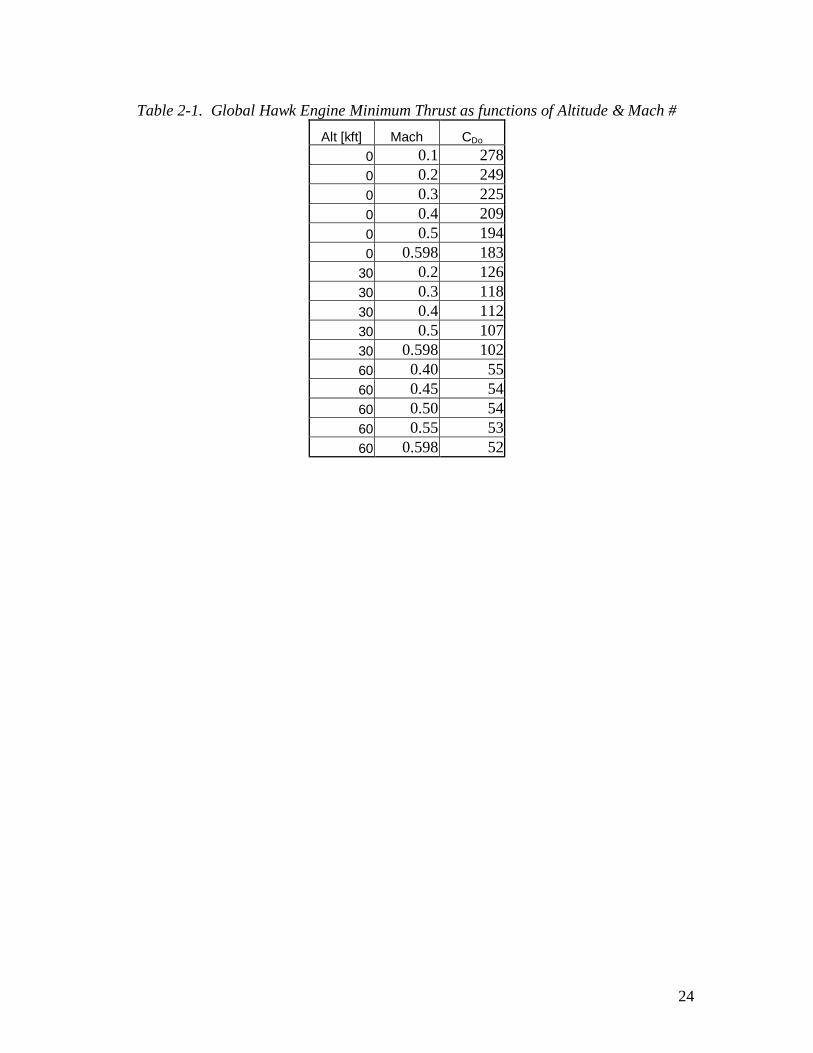
24
Table 2-1. Global Hawk Engine Minimum Thrust as functions of Altitude & Mach # Alt [kft] Mach CDo
0 0.1 278 0 0.2 249 0 0.3 225 0 0.4 209 0 0.5 194 0 0.598 183
30 0.2 126 30 0.3 118 30 0.4 112 30 0.5 107 30 0.598 102 60 0.40 55 60 0.45 54 60 0.50 54 60 0.55 53 60 0.598 52
25
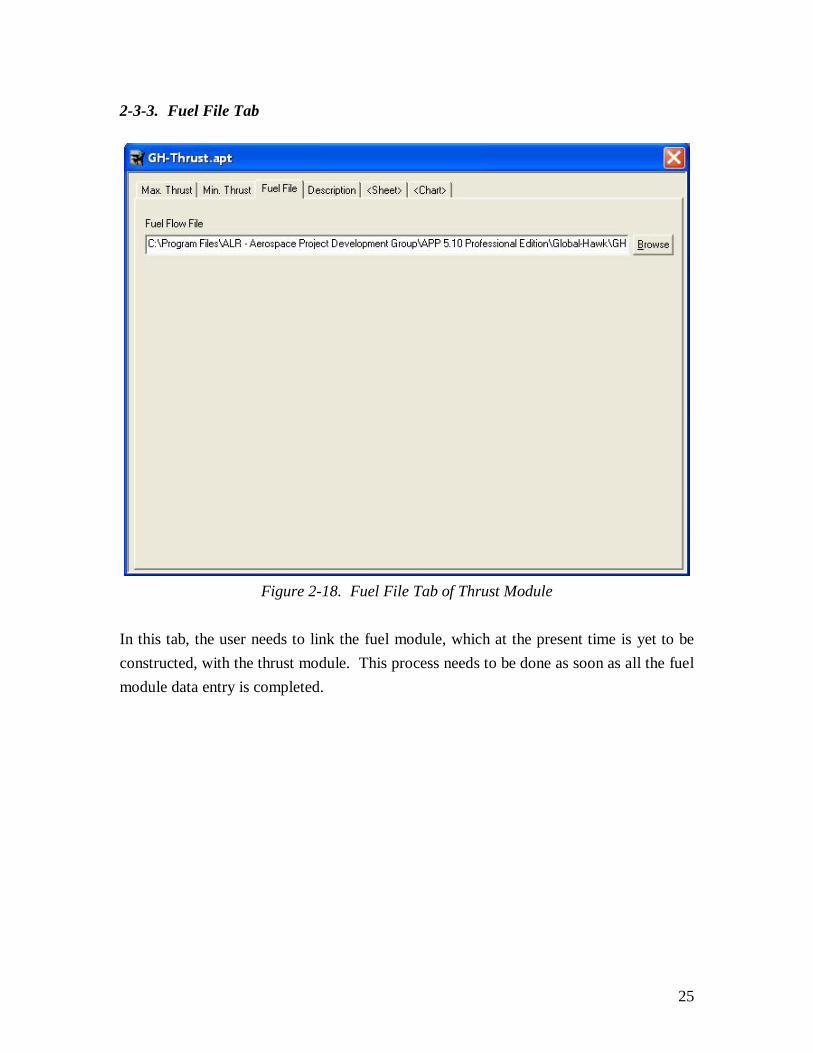
2-3-3. Fuel File Tab
Figure 2-18. Fuel File Tab of Thrust Module
In this tab, the user needs to link the fuel module, which at the present time is yet to be constructed, with the thrust module. This process needs to be done as soon as all the fuel module data entry is completed.

26
2-4. Fuel Module There are a total of 4 tabs inside the Fuel module • Fuel Flow • Description • <Sheet> • <Chart> The first 2 tabs are input tabs, while the last two tabs are output tabs. Once the first 2 tabs are filled up, summary of the inputs are displayed on the last two output tabs.
27
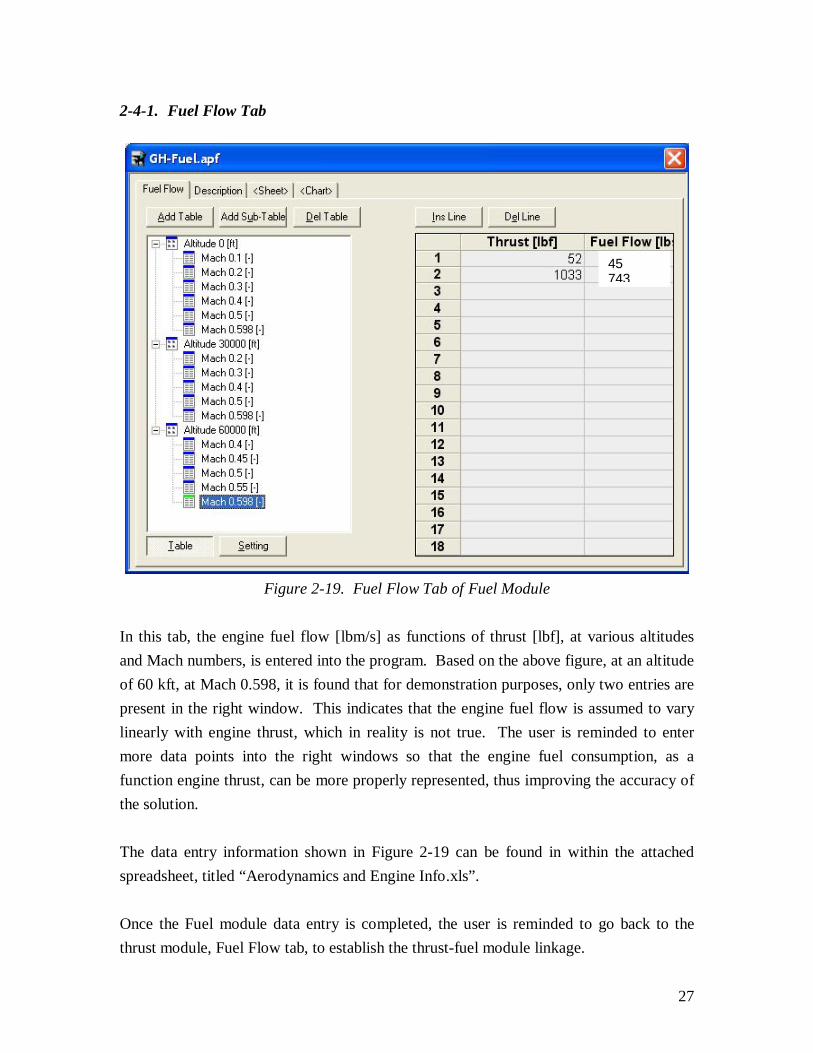
2-4-1. Fuel Flow Tab
Figure 2-19. Fuel Flow Tab of Fuel Module
In this tab, the engine fuel flow [lbm/s] as functions of thrust [lbf], at various altitudes and Mach numbers, is entered into the program. Based on the above figure, at an altitude of 60 kft, at Mach 0.598, it is found that for demonstration purposes, only two entries are present in the right window. This indicates that the engine fuel flow is assumed to vary linearly with engine thrust, which in reality is not true. The user is reminded to enter more data points into the right windows so that the engine fuel consumption, as a function engine thrust, can be more properly represented, thus improving the accuracy of the solution. The data entry information shown in Figure 2-19 can be found in within the attached spreadsheet, titled “Aerodynamics and Engine Info.xls”. Once the Fuel module data entry is completed, the user is reminded to go back to the thrust module, Fuel Flow tab, to establish the thrust-fuel module linkage.
45 743

28
3. Calculation Modules Calculation modules include: • Performance Module Filename Extension: *.app • Mission Module Filename Extension: *.apm
3-1. Performance Module 3-1-1. Computation Tab
Figure 3-1. Types of Calculation Available on Performance Module
According to Figure 3-1, there are 7 different types of computations available on Performance module. Refer to user manual (Page 29 – Page 32) on detailed description of the Performance module.
29
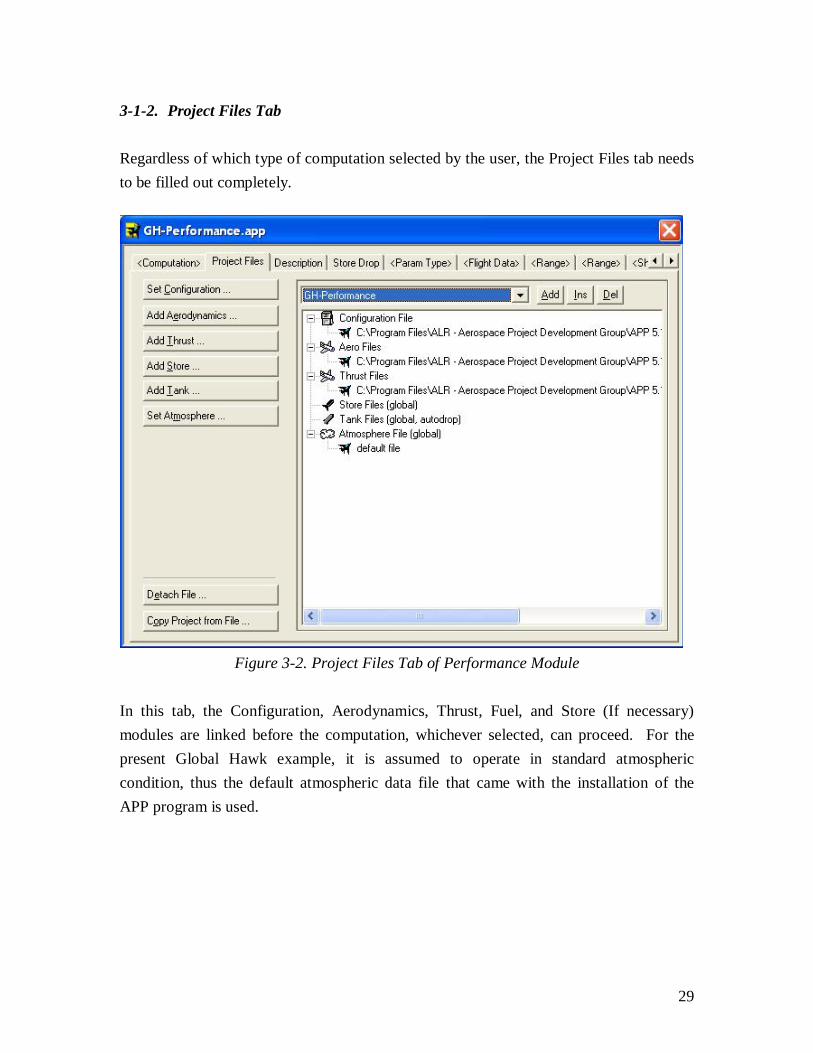
3-1-2. Project Files Tab Regardless of which type of computation selected by the user, the Project Files tab needs to be filled out completely.
Figure 3-2. Project Files Tab of Performance Module
In this tab, the Configuration, Aerodynamics, Thrust, Fuel, and Store (If necessary) modules are linked before the computation, whichever selected, can proceed. For the present Global Hawk example, it is assumed to operate in standard atmospheric condition, thus the default atmospheric data file that came with the installation of the APP program is used.

30
3-1-3. Flight Data Tab Depending on which type of computation selected by the user, the data entry in Flight Data tab might be somewhat different.
Figure 3-3. Flight Data Tab of Performance Module (G-envelope Checked)
In this tab, all the necessary inputs need to be filled up before the computation can proceed.
31
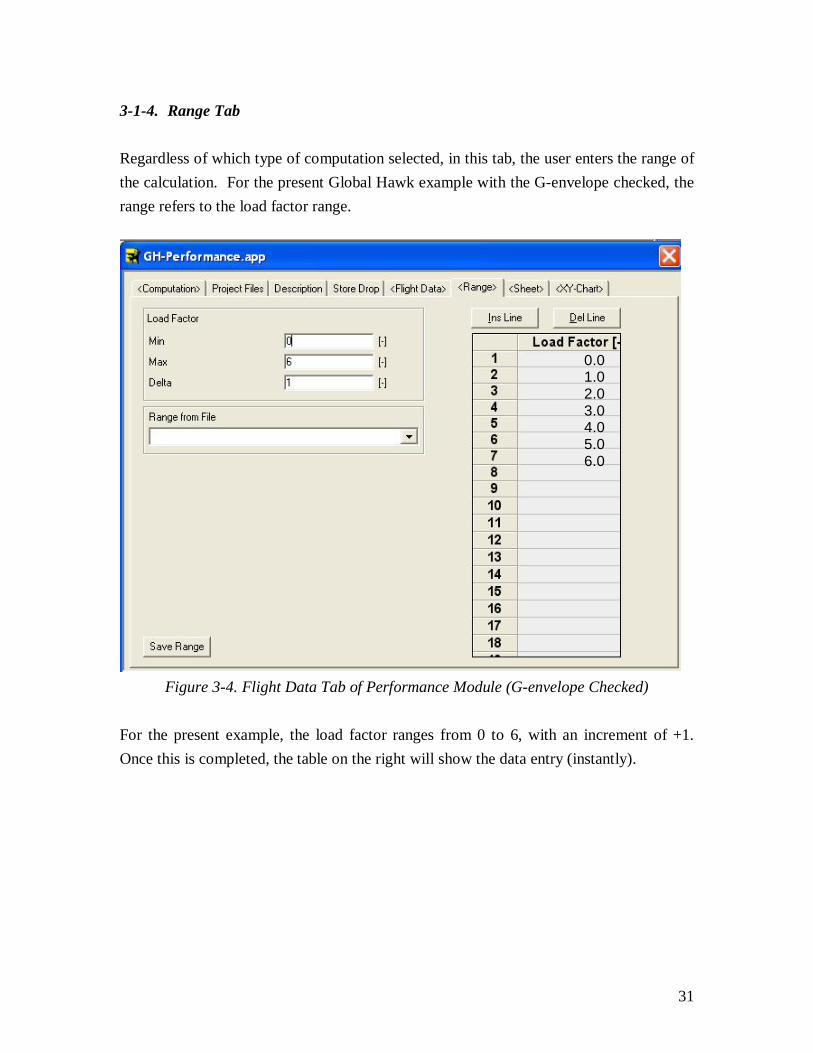
3-1-4. Range Tab Regardless of which type of computation selected, in this tab, the user enters the range of the calculation. For the present Global Hawk example with the G-envelope checked, the range refers to the load factor range.
Figure 3-4. Flight Data Tab of Performance Module (G-envelope Checked)
For the present example, the load factor ranges from 0 to 6, with an increment of +1. Once this is completed, the table on the right will show the data entry (instantly).
0.0 1.0 2.0 3.0 4.0 5.0 6.0

32
3-1-4. Calculation
Figure 3-5. Calculation of Performance Module (G-envelope Checked)
To begin the calculation, the user needs to hit the white button, which is to the right of the “green colored 4”, shown in Figure 3-5.
HIT THIS BUTTON
0.0 1.0 2.0 3.0 4.0 5.0 6.0

33
3-1-5. X-Y Chart
Figure 3-5. Graphical Solution of the Calculation of Performance Module (G-envelope
Checked) In X-Y Chart tab, the user can select various type of output (on both X and Y axes) to be plotted. The results of the calculation are also stored in the Sheet tab. Refer to user manual (Page 59 – Page 69) for more detailed description.

34
3-2. Mission Module 3-2-1. Optimizer Type Tab
Figure 3-6. Types of Optimization Available on Mission Module
According to Figure 3-6, there are 4 different types of optimizations available on Mission module. Refer to user manual (Page 33 – Page 34) on detailed description of the Mission module. The reader is reminded that the Project Files Tab in Mission module is identical to that in Performance module. For the present example, the No Optimization is checked.

35
3-2-2. Start Tab
Figure 3-7. Start tab of Mission Module
For the present example, the starting condition refers to the Global Hawk, sitting on the ground, with full fuel and payload, ready to be deployed.

36
3-2-3. Segment List Tab In this tab, the mission profile of the Global Hawk is defined. After defining all the segments, the user can hit the white colored calculation button, shown in Figure 3-5, to begin the actual calculation. The first segment is ground operation. Details of the first segment are shown in Figure 3-8.
Figure 3-8. Segment List tab of Mission Module (1st Segment)

37
The second segment is take off. Details of the second segment are shown in Figure 3-9.
Figure 3-9. Segment List tab of Mission Module (2nd Segment)

38
The third segment is climb at best rate. Details of the third segment are shown in Figure 3-10.
Figure 3-10. Segment List tab of Mission Module (3rd Segment)

39
The fourth segment is cruise at best specific range (SR). Details of the third segment are shown in Figure 3-11.
Figure 3-11. Segment List tab of Mission Module (4th Segment)

40
The fifth segment is loiter at best fuel flow (FF). Details of the third segment are shown in Figure 3-12.
Figure 3-12. Segment List tab of Mission Module (5th Segment)

41
The sixth segment is cruise at best specific range (SR). Details of the third segment are shown in Figure 3-13.
Figure 3-13. Segment List tab of Mission Module (6th Segment)
42
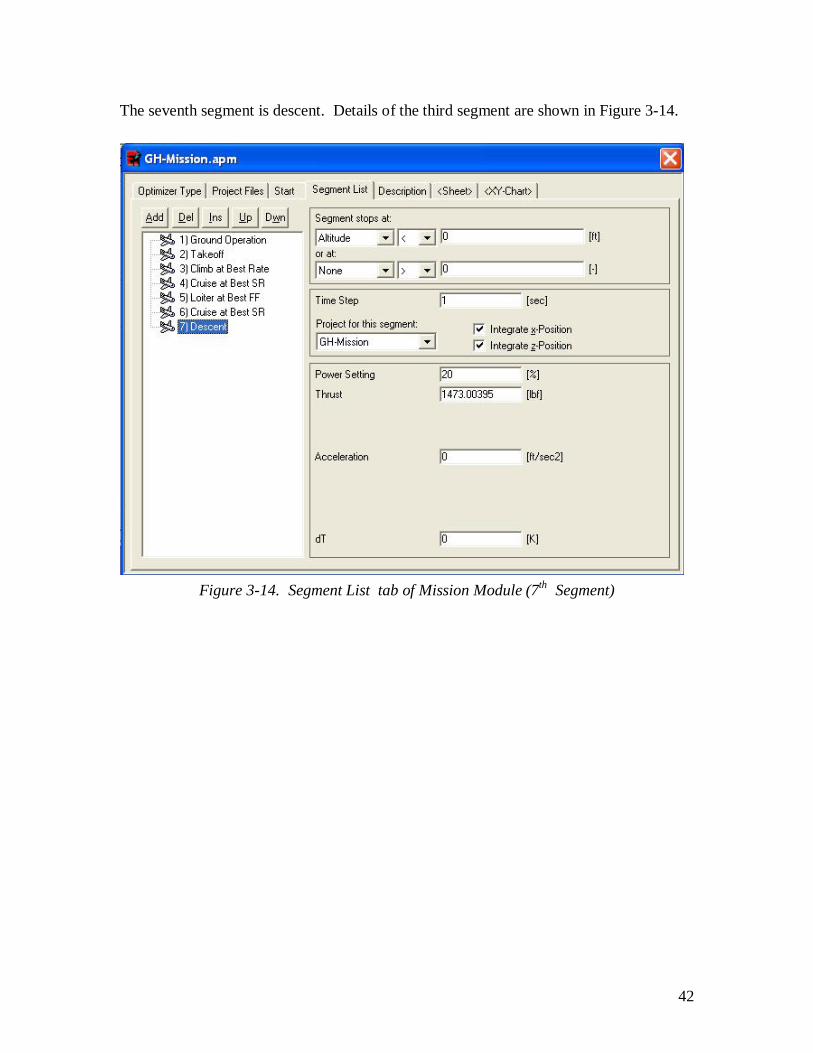
The seventh segment is descent. Details of the third segment are shown in Figure 3-14.
Figure 3-14. Segment List tab of Mission Module (7th Segment)

43
3-2-4. X-Y Chart
Figure 3-15. Graphical Solution of the Calculation of Mission Module (No Optimization
Checked) The mission profile of the Global Hawk, in the present example, is summarized as follows: Take off at full fuel and payload weight. Climb at best rate to an altitude of 60 kft. Cruise at best specific range at 60 kft for 1,500 nm. Loiter over the target area for 5 hours. Cruise at best specific range at 60 kft for 1,500 nm (Return) Descent at 20% power setting What is illustrated in Figure 3-15 is the fuel percentage aboard the Global Hawk, as a function of the distance traveled.

44
In X-Y Chart tab, the user can select various type of output (on both X and Y axes) to be plotted. The results of the calculation are also stored in the Sheet tab. Refer to user manual (Page 70 – Page 73) for more detailed description. Lista Studio srlDAR Corporation Authorized Reseller
Borgo Belvigo 3336016 Thiene VI ITALYwww.lista.ittel. 0445,382056