Embed Size (px)
Citation preview

A P O L L O C O M M E R C I A L R E A L E S T A T E F I N A N C E , I N C .
Information is as of March 31, 2021, except as otherw ise noted.
It should not be assumed that investments made in the future w ill be profitable or w ill equal the performance of the investments in this document.
Investor Presentation
May 2021

Forward Looking Statements and Other Disclosures
2
This presentation may contain forward-looking statements that are within the meaning of Section 27A of the Securities Act of 1933, as amended, and Section 21E of the SecuritiesExchange Act of 1934, as amended, and such statements are intended to be covered by the safe harbor provided by the same. Forward-looking statements are subject to substantial risksand uncertainties, many of which are difficult to predict and are generally beyond management’s control. These forward-looking statements may include information about possible orassumed future results of Apollo Commercial Real Estate Finance, Inc.’s (the “Company,” “ARI,” “we,” “us” and “our”) business, financial condition, liquidity, results of operations, plansand objectives. When used in this presentation, the words “believe,” “expect,” “anticipate,” “estimate,” “plan,” “continue,” “intend,” “should,” “may” or similar expressions, are intendedto identify forward-looking statements. Statements regarding the following subjects, among others, may be forward-looking: the macro- and micro-economic impact of the COVID-19pandemic; the severity and duration of the COVID-19 pandemic; actions taken by governmental authorities to contain the COVID-19 pandemic or treat its impact; the impact of theCOVID-19 pandemic on our financial condition, results of operations, liquidity and capital resources; ARI’s business and investment strategy; ARI’s operating results; ARI’s ability toobtain and maintain financing arrangements; the timing and amounts of expected future fundings of unfunded commitments; and the return on equity, the yield on investments and risksassociated with investingin real estate assets including changes in businessconditions and thegeneral economy.
The forward-looking statements are based on management’s beliefs, assumptions and expectations of future performance, taking into account all information currently available to ARI.Forward-looking statements are not predictions of future events. These beliefs, assumptions and expectations can change as a result of many possible events or factors, not all of which areknown to ARI. Some of these factors are described under “Risk Factors,” and “Management’s Discussion and Analysis of Financial Condition and Results of Operations” included inARI’s Annual Report on Form 10-K for the fiscal year ended December 31, 2020 and other filings with the Securities and Exchange Commission (“SEC”), which are accessible on theSEC’s website at www.sec.gov. If a change occurs, ARI’s business, financial condition, liquidity and results of operations may vary materially from those expressed in ARI’s forward-looking statements. Any forward-looking statement speaks only as of the date on which it is made. New risks and uncertainties arise over time, and it is not possible for management topredict those events or how theymay affect ARI. Except as required by law, ARI is not obligated to, and does not intend to, update or revise any forward-looking statements, whether as aresult of new information, futureevents or otherwise.
This presentation contains information regarding ARI’s financial results that is calculated and presented on the basis of methodologies other than in accordance with accounting principlesgenerally accepted in the United States (“GAAP”), including Distributable Earnings and Distributable Earnings per share. Please refer to page 21 for a definition of “DistributableEarnings” and the reconciliation of theapplicableGAAP financial measures to non-GAAP financial measures set forth on page17.
This presentation may contain statistics and other data that in some cases has been obtained from or compiled from information made available by third-party service providers. ARImakes no representation or warranty, expressed or implied, with respect to theaccuracy, reasonableness or completeness of such information.
Past performance isnot indicative nor a guarantee of future returns.
Index performance and yield data are shown for illustrative purposes only and have limitations when used for comparison or for other purposes due to, among other matters, volatility,credit or other factors (such as number and types of securities). Indices are unmanaged, do not charge any fees or expenses, assume reinvestment of income and do not employ specialinvestmenttechniques such as leveraging or short selling. No such index is indicativeof the future results of any investment byARI.
Unless the context requires otherwise, references in this presentation to “Apollo” refer to Apollo Global Management, Inc., together with its subsidiaries, and references in this presentationto the“Manager” refer to ACREFI Management, LLC, an indirect subsidiaryof ApolloGlobal Management, Inc.

ARI at a Glance
3
See footnotes on page 21
Leading Mortgage REIT Focused on Originating Commercial Mortgage Loans in the U.S. and Europe
$16.0 BillionTotal Capital Deployed
Since 2009
$6.8 BillionGlobal CRE Debt
Portfolio
$2.3 BillionEquity Market Capitalization
84%First Mortgage Loans
1.9xDebt/
Equity Ratio2
9.1%Dividend Yield4
1.0xPrice/
Book Ratio3
63%Weighted Average Portfolio Loan-to-
Value1

4
A History of Success Centered on Four Key FactorsARI has a Reputation as an Innovative, Creative Global CRE Debt Provider
See footnotes on page 21
2 31 4Apollo5
SponsorshipDifferentiated Origination &
Asset Management Platform
Stable and Diverse Portfolio
Prudent Balance Sheet
Management
Leading global alternative investment manager with ~$461B of AUM
Integrated private equity, credit and real assets platform
38 CRE debt investment professionals in 4 global offices
$47B of capital deployed through CRE Debt platform; $16B for ARI
“First-call” relationships in U.S. and Western Europe
Ability to underwrite and structure complex transactions
Capability to partner with other Apollo vehicles to participate in larger loans
Experienced, cycle-testedleadership team
$6.8B portfolio of loans secured by properties in U.S. and European gateway cities
Institutional quality properties
Focus on senior loans Weighted average portfolio
loan-to-value1 of 63%
Conservative leverage at 1.9x debt to equity2
Proven ability to access diversified capital sources
Ample liquidity Staggered debt maturities
5
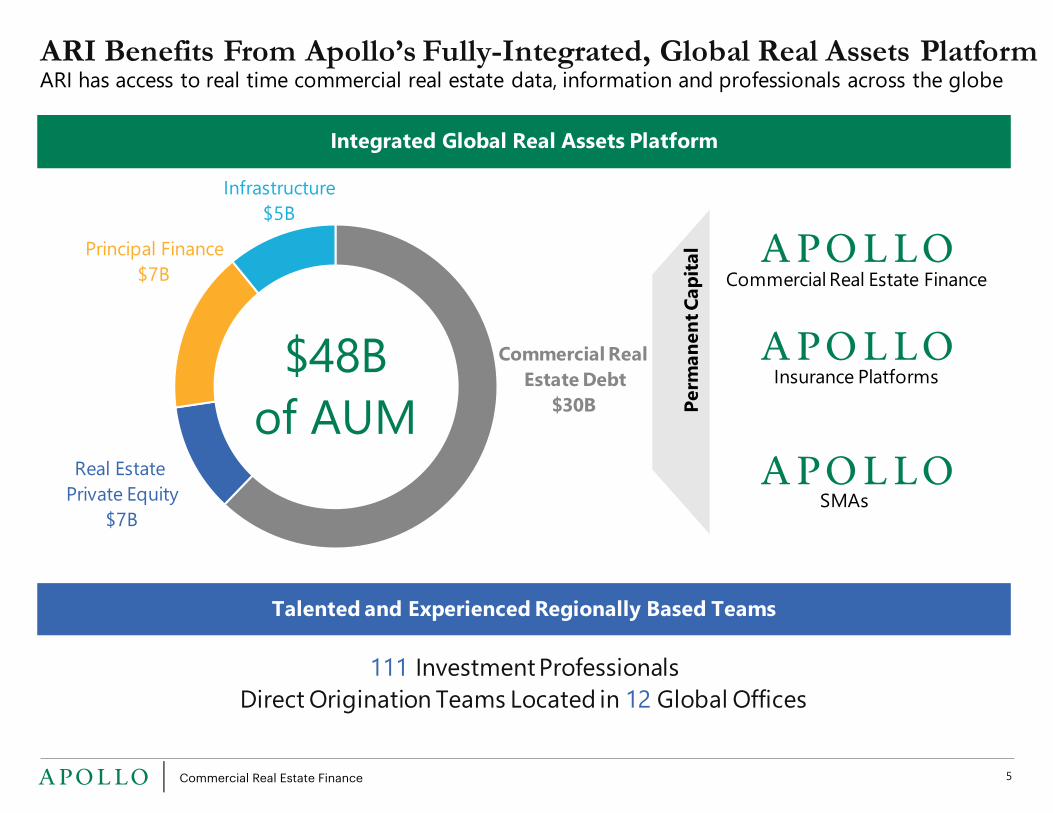
Integrated Global Real Assets Platform
Talented and Experienced Regionally Based Teams
111 Investment ProfessionalsDirect Origination Teams Located in 12 Global Offices
Commercial Real Estate Debt
$30B
Real Estate Private Equity
$7B
Principal Finance$7B
$48B of AUM
Infrastructure$5B
ARI Benefits From Apollo’s Fully-Integrated, Global Real Assets PlatformARI has access to real time commercial real estate data, information and professionals across the globe
Insurance Platforms
SMAs
Perm
anen
t Cap
ital
Commercial Real Estate Finance

Strength of Apollo’s Commercial Real Estate Debt Team
6
38 Investment Professionals in 4 Global Offices with Deep Relationships and Multi-Cycle Experience
Investment Strategy Focused on Finding Attractive Relative Value
Select Borrower Relationships Creative Financing Across the Capital Structure
Fixed-Rate First
Mortgages
Transitional First
Mortgages
Subordinate Loans
For discussion purposes only. The listed companies are a sample of Apollo borrower relationships. The list is not representative of all borrowers generally, and is solely intended to be illustrative of the types of the Apollo CRE Debt team’s borrower relationships. There can be no guarantees that similar relationships will be available or pursued by Apollo in the future, or that such relationships will be profitable. Company namesand logos are trademarks of their respective holders. We do not intend our use or display of these companies' trade names, trademarks or service marks to imply a relationship with, or endorsement or sponsorship of us by, such companies.
Underwriting focused on “credit first” philosophy, defensive basis and capital preservation
Predominantly gateway markets throughout the United States and Western Europe with strong fundamentals
Institutional quality real estate with well underwritten, achievable, value-add business plans
Strong sponsorship with significant borrower equity
Predominately senior positions
Solutions provider for complex transactions, with a focus on creative structuring
Low weighted average Loan-to-Value – 63% LTV(1)
1
2
3
4
5
6
7
See footnotes on page 21

• 84% of ARI’s portfolio consists of senior loans
• The weighted average portfolio LTV1 at origination was 63%
• Average loan size is ~$100 million
• ARI can partner with other Apollo managed vehicles in order to participate in larger transactionswhile diversifying the risk
• ~25% of first mortgages in the portfolio have debt subordinate to ARI’s position
First Mortgage
Loans40%
Subordinate Loans40%
CMBS20%
Portfolio Migration
7
Since 2015, ARI’s Portfolio Has Migrated to More Senior Loans
Portfolio Composition – Amortized Cost
First Mortgage
Loans84%
Subordinate Loans16%
$6.8B03/31/2021
$2.6B12/31/2015
See footnotes on page 10

Loan Portfolio Overview
8
See footnotes on page 21
Diversified Loan Portfolio Secured by Predominately Institutional Properties in Global Gateway Cities
W/A Unlevered All-in Yield on Loan Portfolio6,a
6.2%
W/A Remaining Fully-Extended Term7
2.8 Years
W/A Portfolio Risk Rating7
3.1
Number of Loans
67Carrying Value
~$6.8 billion
W/A Portfolio Loan-to-Value1,7,b
63%
Office26%
Hotel: Leisure15%
Hotel: Urban8%
Other14%
Residential for sale- construction
10%
Residential for sale - inventory
5%
Urban Retail11%
Industrial6%
Healthcare5%
Mortgage84%
Subordinate16%
Collateral Diversification Loan Position
a) Excludes benefit of forw ard points on currency hedges related to loans denominated in currencies other than USDb) Weighted average loan-to-value (“LTV”) reflects the LTV at the time the loan w as originated; excludes risk-rated 5 loansc) Other includes: Mixed Use (3%), Caravan Parks (3%), Multifamily (3%), Multifamily Development (2%), Retail Center (2%), and Urban Predevelopment (1%)
c
8

Loan Portfolio Overview (cont’d)
9
See footnotes on page 21
Property Type New York City United Kingdom Other Europe West Southeast Midwest Other Total
Office $654 / 10% $581 / 8% $207 / 3% $117 / 2% - $244 / 4% - $1,803 / 26%Hotel 294 / 4% - 406 / 6% 272 / 4% 323 / 5% 52 / 1% 198 / 3% 1,544 / 23%
Residential-for-sale: construction 516 / 8% - - 79 / 1% 79 / 1% - - 674 / 10%
Residential-for-sale: inventory 215 / 3% - - - - - 97 / 1% 312 / 5%Urban Retail 317 / 5% 352 / 5% - - 118 / 2% - - 787 / 11%Industrial 197 / 3% - 185 / 3% 13 / 0% 4 / 0% 10 / 0% 5 / 0% 414 / 6%Healthcare - 228 / 3% - 34 / 1% 31 / 0% 26 / 0% 52 / 1% 371 / 5%Other 205 / 3% 371 / 5% - 108 / 2% 15 / 0% 218 / 3% 33 / 0% 950 / 14%
Total $2,399 / 35% $1,532 / 22% $798 / 12% $624 / 9% $569 / 8% $549 / 8% $385 / 6% $6,856 / 100%
General CECL Reserve $36
Carrying value, net $6,820
($ in mm)a
7, 12
New York City35%
West9% Midwest
8%
Southeast8%
Southwest3%
Northeast1%
Geographically Diverse
Note: Map does not show locations w here percentages are 1% or low er
Italy2%
United Kingdom
22%
Spain4%
Germany3%
9
Sweden3%
b
a) Other geographies include Southw est (3%), Northeast (1%), Mid-Atlantic (1%), and Other International (<1%)b) Other property types include: Mixed Use (3%), Caravan Parks (3%), Multifamily (3%), Multifamily Development (2%), Retail Center (2%), and Urban Predevelopment (1%)

a) Weighted average rates: USD L+2.14%; GBP L+2.03%; EUR L+1.46%; SEK L+1.50%b) Reflects book value per share (excluding General CECL Allow ance) of $15.35 multiplied by shares of common stock outstanding
Conservative Capital Structure
10
See footnotes on page 21
Prudent Management of ARI’s Balance Sheet Results in Low Leverage and Diverse Capital Sources
Q1 2021
($ in mm)
Secured Debt Obligationsa
Common Equity Book Valueb
Convertible Notes
Term Loan B
Preferred Stock
$3,430 (48%)
$791 (11%)
$575 (8%)
$169 (3%)
Capital Structure Composition Conservative Capital Management Strategy
6 Secured Debt Obligation Counterparties and 1 Private Securitization
~65% Weighted Average Advance Rate Across Secured Debt Obligations
Borrowings denominated in USD, GBP, EUR, and SEK to reduce currency risk
1.9x Debt to Equity Ratio2
2.4x Fixed Charge Coverage10
$1.5 Billion of Unencumbered Loan Assets11
$2,147 (30%)

$0.38 $0.36 $0.36$0.39
2Q 20 3Q 20 4Q 20 1Q 21
Distributable Earnings Per Share
$14.81 $15.00 $15.08 $15.06
$0.33 $0.30 $0.30 $0.29
Q2 2020 Q3 2020 Q4 2020 Q1 2021
General CECL AllowanceBVPS Post General CECL Allowance
Stable Book Value and Attractive Dividend Yield
11
a. Distributable Earnings per Share prior to realized losses and impairments on real estate ow ned. For a definition of Distributable Earnings, see footnote 17 on page 21; See all other footnotes on page 21 as w ell.
Distributable Earnings per Share13,a and Dividend Yield on Book Value per Share12
Quarterly Book Value per Share12
$15.14 $15.30 $15.38 $15.35
$0.35
Dividend per Share
9.2% 9.2% 9.1% 9.1%
Dividend Yield on Book Value per Share12

Investment Highlights
12
See footnotes on page 21
Twelve Year Track Record as an Innovative, Creative Global CRE Debt Provider
9.1% Dividend Yield4; 1.0x Price/Book Ratio3
Ability to Underwrite & Structure Large, Complex Transactions
Power of Apollo Sponsorship
“First Call Relationships” with Real Estate Sponsors, Brokers and Capital Partners
Fully Integrated Origination and Asset Management Platform
13
Appendix
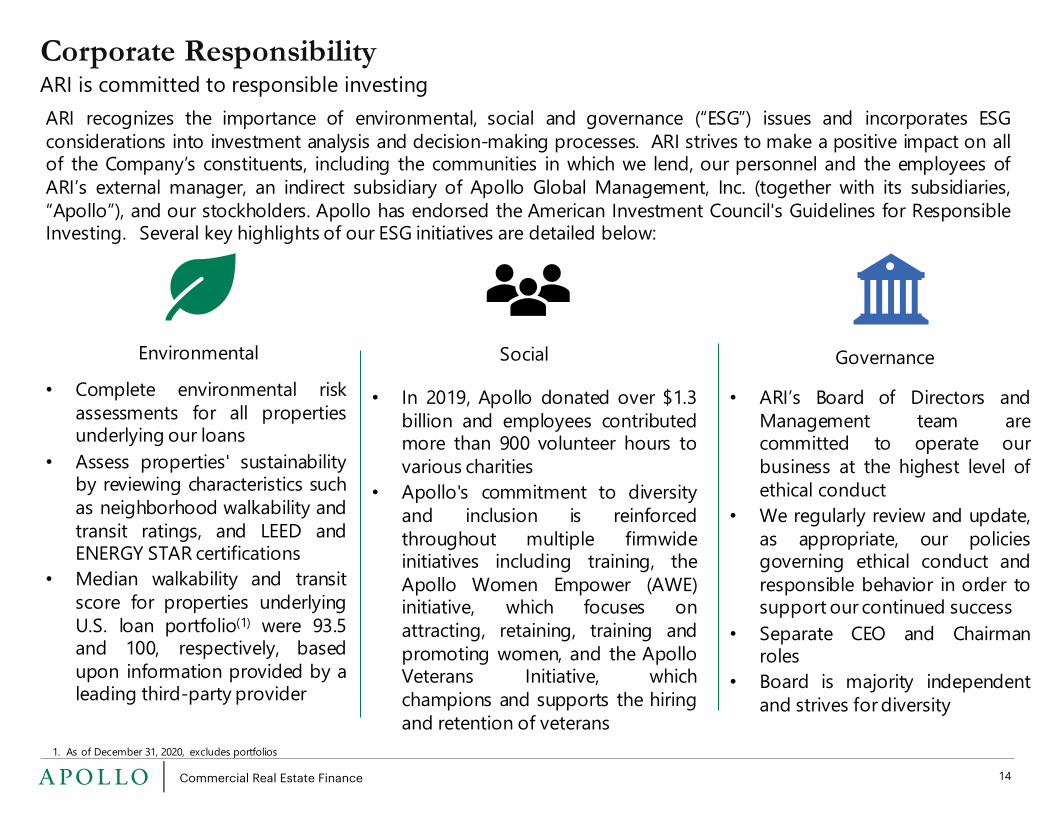
Corporate Responsibility
14
ARI is committed to responsible investingARI recognizes the importance of environmental, social and governance (“ESG”) issues and incorporates ESGconsiderations into investment analysis and decision-making processes. ARI strives to make a positive impact on allof the Company’s constituents, including the communities in which we lend, our personnel and the employees ofARI’s external manager, an indirect subsidiary of Apollo Global Management, Inc. (together with its subsidiaries,“Apollo”), and our stockholders. Apollo has endorsed the American Investment Council's Guidelines for ResponsibleInvesting. Several key highlights of our ESG initiatives are detailed below:
Environmental Social Governance• Complete environmental risk
assessments for all propertiesunderlying our loans
• Assess properties' sustainabilityby reviewing characteristics suchas neighborhood walkability andtransit ratings, and LEED andENERGY STAR certifications
• Median walkability and transitscore for properties underlyingU.S. loan portfolio(1) were 93.5and 100, respectively, basedupon information provided by aleading third-party provider
1. As of December 31, 2020, excludes portfolios
• In 2019, Apollo donated over $1.3billion and employees contributedmore than 900 volunteer hours tovarious charities
• Apollo's commitment to diversityand inclusion is reinforcedthroughout multiple firmwideinitiatives including training, theApollo Women Empower (AWE)initiative, which focuses onattracting, retaining, training andpromoting women, and the ApolloVeterans Initiative, whichchampions and supports the hiringand retention of veterans
• ARI’s Board of Directors andManagement team arecommitted to operate ourbusiness at the highest level ofethical conduct
• We regularly review and update,as appropriate, our policiesgoverning ethical conduct andresponsible behavior in order tosupport our continued success
• Separate CEO and Chairmanroles
• Board is majority independentand strives for diversity

Consolidated Balance Sheets
15
(in thousands - except share data) March 31, 2021 December 31, 2020f
Assets:Cash and cash equivalents $294,060 $325,498Commercial mortgage loans, net a,b 5,754,258 5,451,084Subordinate loans and other lending assets, net b 1,065,816 1,045,893Other assets 68,882 74,640Real estate owned, held for sale 42,355 42,905
Total Assets $7,225,371 $6,940,020Liabilities and Stockholders' EquityLiabilities:
Secured debt arrangements, net (net of deferred financing costs of $11,800 and $12,993 in 2021 and 2020, respectively) $3,418,579 $3,436,672Convertible senior notes, net 566,711 565,654Senior secured term loan, net (net of deferred financing costs of $10,496 and $7,130 in 2021 and 2020, respectively) 775,974 483,465Accounts payable, accrued expenses and other liabilities c 74,899 74,887Participations sold 50,709 34,974Debt related to real estate owned, held for sale 33,000 33,000Derivative liabilities, net 20,382 31,241Payable to related party 9,364 9,598
Total Liabilities $4,949,618 $4,669,491
Stockholders’ Equity:
Preferred stock, $0.01 par value, 50,000,000 shares authorized:
Series B preferred stock, 6,770,393 shares issued and outstanding ($169,260 liquidation preference) $68 $68Common stock, $0.01 par value, 450,000,000 shares authorized, 139,848,875 and 139,295,867 shares issued and outstanding in 2021 and 2020, respectively 1,398 1,393
Additional paid-in-capital 2,707,855 2,707,792Accumulated deficit (433,568) (438,724)
Total Stockholders’ Equity 2,275,753 $2,270,529
Total Liabilities and Stockholders’ Equity $7,225,371 $6,940,020
a) Includes $5,319,621 and $5,418,999 pledged as collateral under secured debt arrangements in 2021 and 2020, respectivelyb) Net of $211,435 and $213,102 CECL Allow ances in 2021 and 2020, respectively, comprised of $175,000 Specific CECL. Allow ance and $36,435 and $38,102 General CECL Allow ance, respectively.c) Includes $3,794 and $3,365 of General CECL Allow ance related to unfunded commitments on commercial mortgage loans, subordinate loans and other lending assets, net in 2021 and 2020, respectively

Consolidated Statements of Operations
16
(in thousands - except share and per share data) Three Months Ended March 31,
2021 2020
Net interest income:
Interest income from commercial mortgage loans $75,356 $81,855
Interest income from subordinate loans and other lending assets 31,459 34,018
Interest expense (35,664) (41,205)
Net interest income $71,151 $74,668
Operating expenses:General and administrative expenses (includes equity-based compensation of $4,387 and $4,263 in 2021 and 2020, respectively) (6,940) (6,531)
Management fees to related party (9,364) (10,268)
Total operating expenses ($16,304) ($16,799)
Other income 92 760
Reversals of (provision for) loan losses and impairments, net a 1,238 (183,465)
Realized losses and impairments on real estate owned (550) -
Foreign currency translation loss (7,449) (37,949)Gain on foreign currency forward contracts (includes unrealized gains of $10,502 and $62,436 in 2021 and 2020, respectively) 9,800 70,491
Gain (loss) on interest rate hedging instruments 357 (35,548)
Net income $58,335 ($127,842)
Preferred dividends (3,385) (3,385)
Net income available to common stockholders $54,950 ($131,227)
Net income (loss) per basic share of common stock $0.39 $(0.86)
Net income (loss) per diluted share of common stock $0.37 $(0.86)
Basic weighted-average shares of common stock outstanding 139,805,863 153,948,191
Diluted weighted-average shares of common stock outstanding 170,792,684 153,948,191
Dividend declared per share of common stock $0.35 $0.40
a) Comprised of $0 and $150,000 of Specific CECL (Reversals) Allow ance, ($1,238) and $33,465 of General CECL Allow ance for 2021 and 2020, respectively

Reconciliation of GAAP Net Income to Distributable Earnings13
17
See footnotes on page 21
(in thousands - except share and per share data) Three Months Ended March 31,Distributable Earnings13: 2021 2020Net income (loss) available to common stockholders: $54,950 ($131,227)Adjustments:
Equity-based compensation expense 4,387 4,263Unrealized loss on interest rate swap — 35,548Gains on foreign currency forwards (9,800) (70,491)Foreign currency loss, net 7,449 37,949Unrealized gain on interest rate cap (357) —Realized gains (losses) relating to interest income on foreign currency hedges, net (620) 256Realized gains relating to forward points on foreign currency hedges, net 6 2,171Amortization of the convertible senior notes related to equity reclassification 800 754Provision for (reversal) of loan losses and impairments (1,238) 183,465
Total adjustments 627 193,915
Distributable Earnings13, prior to realized losses and impairments on real estate owned $55,577 $62,688Realized losses and impairments on real estate owned 550 —
Distributable Earnings13 $56,127 $62,688
Weighted-average diluted shares – Distributable Earnings13
Weighted-average diluted shares – GAAP 170,792,684 153,948,191
Weighted-average unvested RSUs - 2,007,242
Reversal of hypothetical conversion of the Notes (28,533,271) -
Weighted-average diluted shares – Distributable Earnings13 142,259,413 155,955,433
Distributable Earnings13, per share, prior to realized losses and impairments on real estate owned $0.39 $0.40
Distributable Earnings13 per share of common stock $0.39 $0.40
See footnotes on page 21
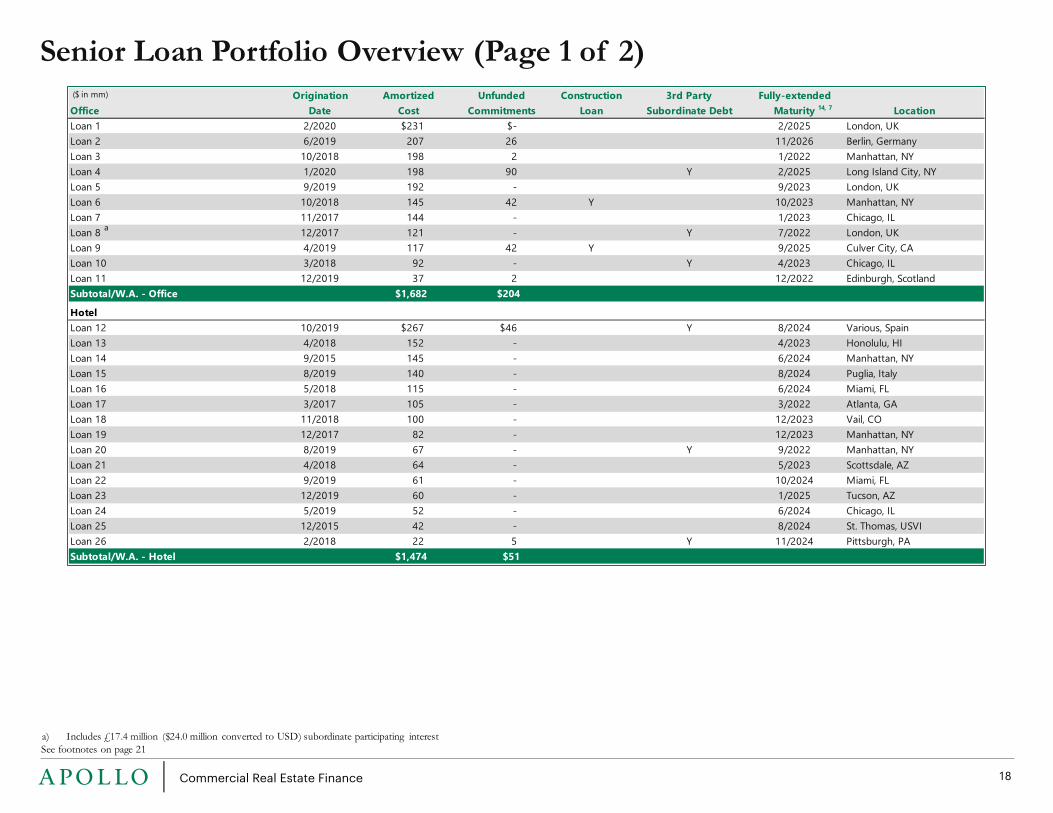
Senior Loan Portfolio Overview (Page 1 of 2)
18
Origination Amortized Unfunded Construction 3rd Party Fully-extendedOffice Date Cost Commitments Loan Subordinate Debt Maturity LocationLoan 1 2/2020 $231 $- 2/2025 London, UKLoan 2 6/2019 207 26 11/2026 Berlin, GermanyLoan 3 10/2018 198 2 1/2022 Manhattan, NYLoan 4 1/2020 198 90 Y 2/2025 Long Island City, NYLoan 5 9/2019 192 - 9/2023 London, UKLoan 6 10/2018 145 42 Y 10/2023 Manhattan, NYLoan 7 11/2017 144 - 1/2023 Chicago, ILLoan 8 12/2017 121 - Y 7/2022 London, UKLoan 9 4/2019 117 42 Y 9/2025 Culver City, CALoan 10 3/2018 92 - Y 4/2023 Chicago, ILLoan 11 12/2019 37 2 12/2022 Edinburgh, ScotlandSubtotal/W.A. - Office $1,682 $204
HotelLoan 12 10/2019 $267 $46 Y 8/2024 Various, SpainLoan 13 4/2018 152 - 4/2023 Honolulu, HILoan 14 9/2015 145 - 6/2024 Manhattan, NYLoan 15 8/2019 140 - 8/2024 Puglia, ItalyLoan 16 5/2018 115 - 6/2024 Miami, FLLoan 17 3/2017 105 - 3/2022 Atlanta, GALoan 18 11/2018 100 - 12/2023 Vail, COLoan 19 12/2017 82 - 12/2023 Manhattan, NYLoan 20 8/2019 67 - Y 9/2022 Manhattan, NYLoan 21 4/2018 64 - 5/2023 Scottsdale, AZLoan 22 9/2019 61 - 10/2024 Miami, FLLoan 23 12/2019 60 - 1/2025 Tucson, AZLoan 24 5/2019 52 - 6/2024 Chicago, ILLoan 25 12/2015 42 - 8/2024 St. Thomas, USVILoan 26 2/2018 22 5 Y 11/2024 Pittsburgh, PASubtotal/W.A. - Hotel $1,474 $51
($ in mm)14, 7
a) Includes £17.4 million ($24.0 million converted to USD) subordinate participating interest
a

See footnotes on page 21
Senior Loan Portfolio Overview (Page 2 of 2)
19
9
Origination Amortized Unfunded Construction 3rd Party Fully-extendedRetail Date Cost Commitments Loan Subordinate Debt Maturity LocationLoan 27 12/2019 $352 $- 12/2023 London, UKLoan 28 8/2019 317 - Y 9/2024 Manhattan, NYLoan 29 1/2016 118 - 9/2021 Miami, FLLoan 30 11/2014 106 - 9/2021 Cincinnati, OHSubtotal/W.A. - Retail $893 -
Residential-for-sale: constructionLoan 31 12/2018 $79 $23 Y 1/2024 Hallandale Beach, FLLoan 32 12/2018 71 107 Y Y 12/2023 Manhattan, NYLoan 33 10/2015 66 - Y Y 8/2021 Manhattan, NYSubtotal/W.A. - Residential-for-sale: construction $216 $130
Residential-for-sale: inventoryLoan 34 12/2019 $97 $3 Y 1/2023 Boston, MALoan 35 1/2018 68 6 Y 1/2023 Manhattan, NYLoan 36 5/2018 18 - Y 5/2021 Manhattan, NYLoan 37 6/2018 13 - Y 7/2021 Manhattan, NYSubtotal/W.A. - Residential-for-sale: inventory $196 $9
IndustrialLoan 38 1/2019 $197 $7 2/2024 Brooklyn, NYLoan 38 3/2021 185 111 5/2026 VariousSubtotal/W.A. - Industrial $382 $118
MultifamilyLoan 40 4/2014 $63 $- 7/2023 VariousLoan 41 11/2014 54 - 11/2021 VariousLoan 42 2/2020 50 1 3/2024 Cleveland, OHSubtotal/W.A. - Multifamily $167 $1
OtherLoan 43 - Healthcare 10/2019 $228 $31 10/2024 Various, UKLoan 44 - Caravan Parks 2/2021 225 - 2/2028 VariousLoan 45 - Multifamily Development 3/2017 152 - 12/2021 Brooklyn, NYLoan 46 - Mixed Use 12/2019 80 1 12/2024 London, UKLoan 47 - Urban Predevelopment 12/2016 52 - 6/2022 Los Angeles, CALoan 48 - Mixed Use 12/2019 25 829 Y Y 6/2025 London, UKSubtotal/W.A. - Other $762 $861
Total/W. A. - First Mortgage $5,772 $1,374 2.9 Years
($ in mm)14, 7
15,a
15
15,a
7
a) Property type w as changed from urban predevelopment during the quarter ended March 31, 2021

Subordinate Loan Portfolio Overview
20
See footnotes on page 21
9, 10
9
Origination Amortized Unfunded Construction 3rd Party Fully-extendedResidential-for-sale: construction Date Cost Commitments Loan Subordinate Debt Maturity LocationLoan 49 6/2015 $226 $- Y Y 6/2021 Manhattan, NYLoan 50 11/2017 153 - Y Y 6/2021 Manhattan, NYLoan 51 12/2017 79 4 Y 4/2023 Los Angeles, CASubtotal/W.A. - Residential-for-sale: construction $458 $4
HealthcareLoan 52 1/2019 $75 $- 1/2024 VariousLoan 53 7/2019 51 - Y 6/2024 VariousLoan 54 2/2019 17 - Y 1/2034 VariousSubtotal/W.A. - Healthcare $143 -
Mixed UseLoan 55 1/2017 $42 $- 2/2027 Cleveland, OHLoan 56 2/2019 40 - Y 12/2022 London, UKLoan 57 12/2018 34 17 Y 12/2023 Brooklyn, NYLoan 58 7/2012 7 - 8/2022 Chapel Hill, NCSubtotal/W.A. - Mixed Use $123 $17OfficeLoan 59 1/2019 $100 $- 12/2025 Manhattan, NYLoan 60 7/2013 14 - 7/2022 Manhattan, NYLoan 61 8/2017 8 - 9/2024 Troy, MISubtotal/W.A. - Office $122 -
HotelLoan 62 6/2015 $28 $- 12/2022 Washington, DCLoan 63 6/2015 24 - 7/2025 Phoenix, AZLoan 64 6/2018 20 - 6/2023 Las Vegas, NVSubtotal/W.A. - Hotel $72 -
OtherLoan 65 - Residential-for-sale: inventory 12/2017 $115 $7 Y 6/2022 Manhattan, NYLoan 66 - Industrial 5/2013 32 - 5/2023 VariousLoan 67 - Multifamily 5/2018 19 - 5/2028 Cleveland, OHSubtotal/W.A. - Other $166 $7
Total/W.A. - Subordinate $1,084 $28 2.1 Years
Total/W.A. - Portfolio $6,856 $1,402 2.8 YearsGeneral CECL Reserve $36Total Carrying value, net $6,820
a) In the form of a single-asset, single-borrow er CMBSb) Includes $26.7 million subordinate participating interest
17, a
b
16
9
a16
16
9, 18
14, 7
($ in mm)

Footnotes
21
1. Weighted average loan-to-value (“LTV”) reflects the LTV at the time the loan was originated. 2. Represents total debt, less cash and loan proceeds held by servicer divided by total stockholders' equity, adjusted to add back the General CECL Allowance in line with our covenants. 3. Represents closing share price on May 7, 2021 to book value per share, excluding General CECL Allowance as of March 31, 2021.4. Reflects closing share price on May 7, 2021.5. Apollo refers to Apollo Global Management, Inc. and its consolidated subsidiaries6. Weighted Average Unlevered All-in Yield on the loan portfolio is based on the applicable benchmark rates as of period end on the floating rate loans and includes accrual of origination,
extension, and exit fees. For non-US deals, yield excludes incremental forward points impact from currency hedging.7. Based on loan amortized cost.8. Includes two subordinate risk retention interests in securitization vehicles classified as Subordinate Loans.9. Amounts and percentages may not foot due to rounding.10. Fixed charge coverage is EBITDA divided by interest expense and preferred stock dividends.11. Represents loan assets with no asset-specific financing. Pursuant to our Term Loan B agreement, we are required to maintain a ratio of total unencumbered assets to total pari-passu
indebtedness of at least 1.25:1. Unencumbered assets are comprised of unencumbered loan assets, cash and other assets.12. Book value per share of common stock is common stockholders’ equity divided by shares of common stock outstanding.13. Distributable Earnings, formerly known as Operating Earnings, is a non-GAAP financial measure that we define as net income available to common stockholders, computed in
accordance with GAAP, adjusted for (i) equity-based compensation expense (a portion of which may become cash-based upon final vesting and settlement of awards should the holder elect net share settlement to satisfy income tax withholding), (ii)any unrealized gains or losses or other non-cash items included in net income available to common stockholders, (iii) unrealized income from unconsolidated joint ventures, (iv) foreign currency gains (losses), other than (a) realized gains/(losses) related to interest income, and (b) forward point gains/(losses) realized on our foreign currency hedges, (v) the non-cash amortization expense related to the reclassification of a portion of our convertible senior notes to stockholders’ equity in accordance with GAAP, and (vi) provision for loan losses and impairments. Please see page 17 for a reconciliation of GAAP net income to Distributable Earnings.
14. Assumes exercise of all extension options.15. Amortized cost for these loans is net of the recorded Specific CECL Allowances and impairments.16. Both loans are secured by the same property.17. Loan and single-asset, single-borrower CMBS are secured by the same properties.18. Gross of $36.4 million of General CECL Allowance.