Embed Size (px)
DESCRIPTION
APOD Applications that Participate in their Own Defense. Franklin Webber (BBN): APOD Overview Doug Reeves (NCSU):SE-RSVP Overview Bill Nelson (BBN):Experimental Results John Clem (Sandia):Attacks and Red Team Observations Fault Tolerant Networks PI Meeting, Newport RI - PowerPoint PPT Presentation
Citation preview

APODApplications that Participate in their Own Defense
Franklin Webber (BBN): APOD OverviewDoug Reeves (NCSU): SE-RSVP Overview
Bill Nelson (BBN): Experimental ResultsJohn Clem (Sandia): Attacks and Red Team Observations
Fault Tolerant Networks PI Meeting, Newport RI 25 July 2002
APOD Overview
Franklin Webber, BBN [email protected]
Fault Tolerant Networks PI Meeting, Newport RI 25 July 2002

04/19/23
Applications That Participate in Their Own DefenseNew Ideas
Impact Schedule
• Involve application software in its own defense• Use quality-of-service (QoS) management to
aid intrusion diagnosis and to resist attacks• Use middleware to coordinate basic intrusion
response mechanisms according to overall defense strategy for application
• Provide tools to help developers configure application defenses
• Use Red Team experiments to measure survival value of adaptive defense
• Systems with more survivability, built with less effort
• Defense of critical applications without need for perfect security in infrastructure; cost-efficient: can use COTS
• A set of example defense-enabled applications
• A collection of validated defense strategies that application developers and/or security specialists can apply Principal Investigator: Franklin Webber
July 1999Start
July 2000 July 2001 July 2002End
Proof ofConceptSW Release
FinalSurvivabilityToolsDelivery
Defense-Enabled AppSW Releases
Initial validation experiments complete
Red Team validationexperiments
Middleware for QoS andResource Management
Crypto
AttackerDistributedApplication
OSs and Networks
Raw Resources
IDSs Firewalls

04/19/23 4
Implementing Defenses in Middleware
APOD defenses are implemented using the QuO (Quality-of-Service for Objects) adaptive middleware developed at BBN:
for simplicity:QoS concerns separated from functionality of application
for practicality:Middleware defenses will augment, not replace, defense mechanisms
available in lower system layers
for uniformity:Advanced middleware such as QuO provides a systematic way to
integrate defense mechanisms
for reusability:Middleware can support a wide variety of applications

04/19/23 5
Security Domains Limit the Damage From A Single Intrusion
hackeddomain
host
router
domain
host
router
domain
host
host
host
host

04/19/23 6
Replication Management Can Replace Killed Processes
hackeddomain
host
router
domain
host
router
domain
host
host
host
host
application component replicas
QuO replica management
04/19/23 7
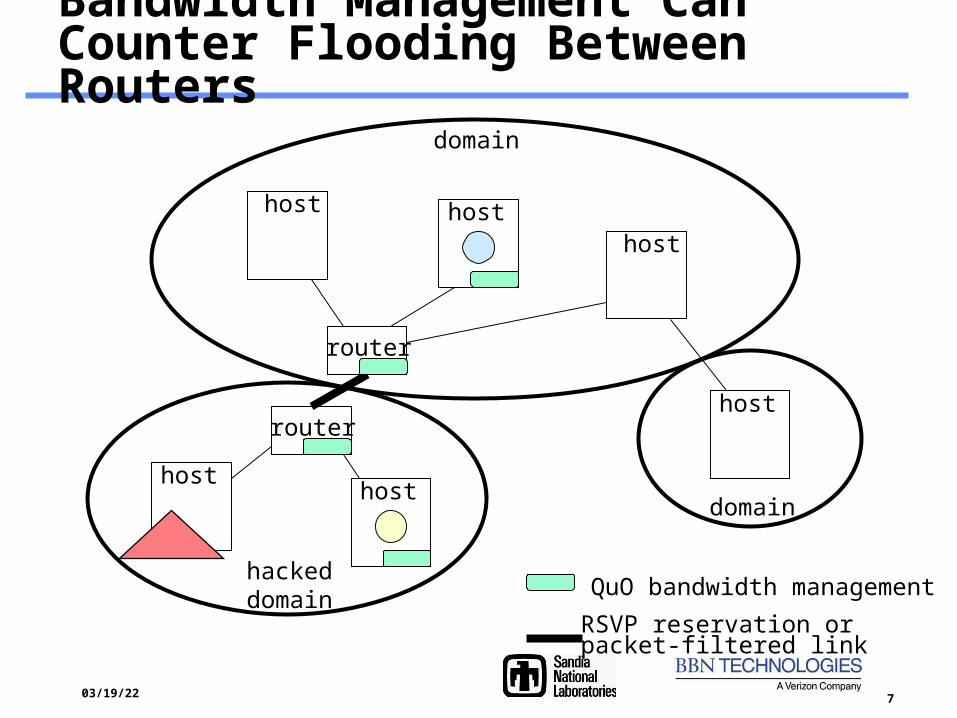
Bandwidth Management Can Counter Flooding Between Routers
hackeddomain
host
router
domain
host
router
domain
host
host
host
host
QuO bandwidth management
RSVP reservation or packet-filtered link

04/19/23 8
Other APOD Defensive Adaptations
Dynamically configure firewalls to block trafficDynamically configure routers to limit trafficDynamically change communication ports
not used in Red Team experimentsDynamically change communication protocols
not used in Red Team experiments
04/19/23 9
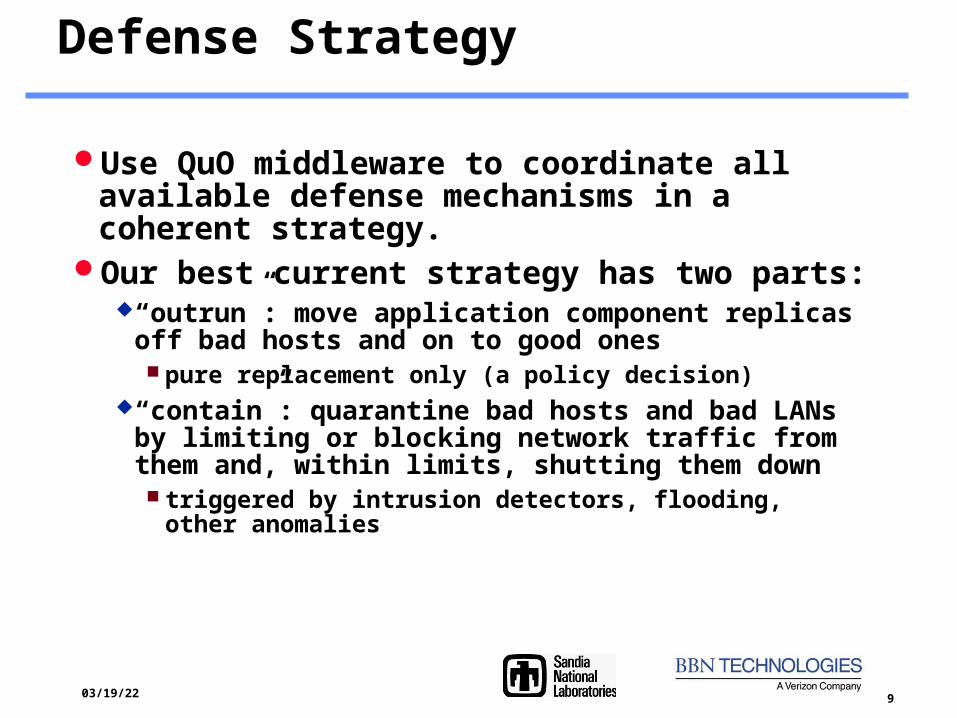
Defense Strategy
Use QuO middleware to coordinate all available defense mechanisms in a coherent strategy.
Our best current strategy has two parts:“outrun”: move application component replicas off bad hosts and on
to good ones pure replacement only (a policy decision)
“contain”: quarantine bad hosts and bad LANs by limiting or blocking network traffic from them and, within limits, shutting them down triggered by intrusion detectors, flooding, other anomalies

04/19/23 10
Red Team Experiments
Two experiments:
First experiment prohibited Red Team from using network flooding.
Second experiment allowed flooding; defense used a security-enhanced RSVP plus an improved ‘containment’ strategy.
Both experiments were preceded by a ‘whiteboard’ session with the Red Team to look for conceptual weakness in defenses.
Both experiments gave the Red Team “root” privilege on a subset of application hosts.

04/19/23 11
Conclusions I
A defense of critical distributed applications can be organized in middleware and should include several complementary defense mechanisms, each of which adapts to changes in a different QoS aspect.
The Red Team experiments were the most valuable part of our validation effort.

04/19/23 12
Conclusions II
Is it worthwhile to defense-enable a critical application?
The attacker may be able to ‘outrun’ the defense if every security domain is vulnerable. We do not know how likely this may be in the real world.
To minimize this possibility, a defense-enabled application must be fielded on a heterogeneous set of platforms.
An attack that infiltrates only a subset of security domains will face substantial resistance from a defense-enabled application.

APOD-1 Experimental Results
William H. Nelson, BBN [email protected]
Fault Tolerant Networks PI Meeting, Newport RI 25 July 2002

04/19/23 14
Overview
Experiment design ( 3 slides )Experiment methodology Hypothesis, flags, & metricsTopology & operational components
Experimental results ( 5 slides )Scope - summary of runs (table)Baseline behavior plotSample attack #1 plotSample attack #2 plotTime to denial (bar graph)
Summary ( 2 slides )ConclusionsLessons learned

04/19/23 15
Schedule People
Mid Oct. 2001Evaluate APOD for experiment
Nov. 2001Define experiment, draft plan
Dec. 2001Hold White Board (12,13th)
Jan. 2002Final plan published Integration & testing
Feb. 2002Begin execution
Mar. 2002Finish executionData reduction & analysisHot Wash (26th)
Final report published (6-4-02)
Blue Team (BBNT)Franklin WebberPartha PalMichael AtighetchiChris JonesPaul Rubel
White team (BBNT)Ken TheriaultBill NelsonWilson FarrellLyle SudinMarla Shepard
Red Team (Sandia)Steve KaufmanDino Dai Zovi

04/19/23 16
Hypothesis, flags, & metrics
HypothesisTop-level: APOD improves immunity to cyber attacks relative to
systems that do not use APOD APOD improves immunity to availability attacks relative to systems that do
not use APOD APOD improves immunity to availability attacks at an acceptable cost to
the defender
Opponent flagsDegrade image service (e.g. increase latency) Deny availability of images to users
Principal metricsImage serving latency across a suite of image clients (delay flag)Fraction of image requests that do not succeed (deny flag)
04/19/23 17
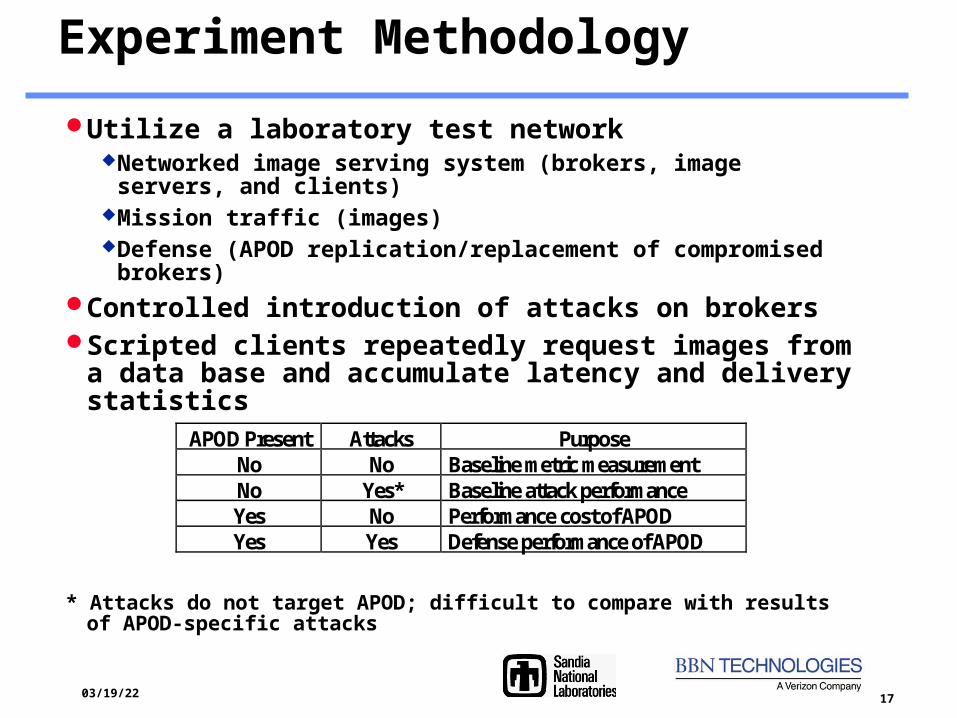
Experiment Methodology
Utilize a laboratory test networkNetworked image serving system (brokers, image servers, and clients)Mission traffic (images)Defense (APOD replication/replacement of compromised brokers)
Controlled introduction of attacks on brokersScripted clients repeatedly request images from a data base
and accumulate latency and delivery statistics
* Attacks do not target APOD; difficult to compare with results of APOD-specific
attacks
APOD Present Attacks Purpose No No Baseline metric measurement No Yes* Baseline attack performance Yes No Performance cost of APOD Yes Yes Defense performance of APOD

04/19/23 18
Topology
VPN/Internet
Experiment Control,external waypoint
.21
.42
autobot
optimus1
192.168.1 (IPNET1)
.2 .3 .4
BB S
broker1_1 broker1_2 server1
192.168.4 (IPNET4)
.2 .3 .4
BB S
broker4_1 broker4_2 server4
192.168.3 (IPNET3)
.2 .3 .4 .5C BB S
broker3_1 broker3_2 server3client3
.1
.1.1
.4
.1
.3
.2
.1
162.168.251
router_ipnet_2
router_ipnet_4
router_ipnet_1
router_ipnet_3
badguy1
.101
192.168.70 (IPNET2)
.2 .3 .4
BC B
broker2_1 broker2_2client2
Attack 1
.10

04/19/23 19
Experiment scope
APOD Attack Used System Configuration Number
of runs Client. Timeout (sec)
Normal Period (sec)
Number of Clients
Flood Protection
Denial
None 1 20 16 2 N/A No No TcpKill 1 20 16 2 N/A Yes
3 20 16 2 N/A No None 1 20 16 8 N/A No
Isolate_Scan 1 20 16 2 N/A No ScanAll 3 20 16 2 N/A No Scan_Isolate_Flood 3 20 16 2 N/A 1 of 3
2 20 16 2 N/A Yes 1 10 16 4 N/A Yes 1 10 16 8 N/A Yes 1 2.5 16 2 N/A No 1 5 16 2 N/A No 3 10 16 2 N/A 1 of 3 1 40 16 2 N/A Yes 1 80 16 2 N/A Yes 1 20 4 2 N/A No 1 20 8 2 N/A Yes 1 20 32 2 N/A No 3 20 64 2 N/A 1 of 3
Scan_Flood_Isolate
1 20 16 2 Yes No 2 TcpKill * 1 20
16 8
Yes Spikes
Yes
Yes
Scan_TcpKill_Isolate * 1 20
16
2 No
Yes

04/19/23 20
Baseline system behavior (no attacks)
client 2, No Apod Base, S3 Total Latency
1
1.2
1.4
1.6
1.8
2
2.2
2.4
0 1000 2000 3000 4000
time (sec)
late
ncy
(se
c)
avg=1.139, sd=0.120125
Client 2, No APOD Base (seconds)
Server
Average Std. Dev. # spikes/tot
3 1.139 0.120 0/175
1 1.126 0.018 0/82
4 1.137 0.127 0/61
Client 2, ApodBase2, S3 Total Latency
1
1.2
1.4
1.6
1.8
2
2.2
2.4
0 1000 2000 3000 4000
time (sec)
late
ncy
(se
c)
avg=1.200, sd=0.141
Client 2, APOD Base (seconds)
Server Average Std. Dev.
# spikes/tot
3 1.200 0.141 0/189
1 1.172 0.064 0/196
4 1.198 0.132 0/211
APOD-1 introduces some overhead. The average latency increases ~5%

04/19/23 21
APOD-1 vs. Scan_Isolate_Flood attackA denial in image service occurred while clients could not access a broker.
Client 2, Scan_Isolate_Flood Attack
Server Average (no spikes) Std. Dev. # spikes/tot
3 1.170 sec 0.081 sec 0/121
1 1.151 0.046 2/112
4 1.294 1.059 0/123
Client 2 ScanIsolateFlood, Server 3 Total Latency
1
1.2
1.4
1.6
1.8
2
2.2
2.4
0 500 1000 1500 2000 2500 3000 3500
time (sec)
late
ncy
(se
c)
S3 Red Milestonesavg=1.170, sd=0.0806
APOD vs. Scan_Isolate_Flood
1.1
1.2
1.3
1.4
1.5
1.6
1.7
1.8
aver
age
late
ncy
(sec
)
c2 APOD base c2 scanisoflood c2 scanisoflood2 c2 scanisoflood3
Server 3 Server 1 Server 4

04/19/23 22
APOD-1 vs. Scan_Flood_Isolate attack
Both clients stopped receiving images. This run went for 3454 seconds.
Client 2 Scan_Flood_Isolate, Server 3 Total Latency
1
1.2
1.4
1.6
1.8
2
2.2
2.4
0 500 1000 1500 2000 2500 3000 3500
time (sec)
late
ncy
(se
c)
avg=1.228, sd=0.177
Client 2, Scan_Flood_Isolate
Server Average (no spikes) Std. Dev # spikes/tot
3 1.228 sec 0.177 sec 0/109
1 1.186 0.117 0/103
4 1.190 0.118 0/105
APOD vs. Scan_Flood_Isolate Average Latencies
1.10
1.15
1.20
1.25
aver
age
late
ncy
(se
c)
c2 APOD base c2 scanfloodiso c3 APOD base c3 scanfloodiso
Server 3 Server 1 Server 4

04/19/23 23
Time to Denial (TTD)
Scripted Attacks decrease the Time to Denial Live Red Team, <TTD> = 19.5 minutes Scripted attacks, <TTD> = 2.56 minutes
Some changes in APOD parameters increase Time to Denial (i.e. attacks 9-10)
Time to Denial by Attack
0
5
10
15
20
25
30
35
40
scan
IsoF
lood
scan
Flood
Iso
SFI-scr
ipt
40se
cNor
m
10se
cCT3
4clie
nts
8clie
nts
80se
cCT
8sec
Norm
64se
cNor
m
tim
e (m
inu
tes)
Client 2 Client 3
From Left to Right: Attacks 1-2: Live Red Team Attacks 3-10: Scripted

04/19/23 24
Conclusions
Broker replication (with a dynamic firewall) provides effective defense against attacks on image brokers
APOD-1 kept the image-serving system up ~ 66% of attacks But, sustained broader attacks still succeeded (deny ~ 33% of attacks)
When the deny flag was achieved, APOD-1 prolonged image serving system’s life ~ 20 minutes (live Red Team) ~ 2.5 minutes (scripted attacks)
Performance (attack dependant) Isolated point latencies – due to temporary broker outages
Low attack rate - no measurable effect High attack rate - noticeable increase in average latency
Image service denial Mildly aggressive attack - outage until APOD recovers Aggressive / persistent attack - outage until manual intervention
Cost Added complexity and implementation effort (extra machines) APOD-1 mechanism had little operational overhead
With APOD-1, no attacks: ~ 5% increase in latency With APOD-1, with attacks: ~ 0.5% additional latency increase

APOD-1 Attacks and Red Team Observations
John F. Clem, Sandia National [email protected]
Fault Tolerant Networks PI Meeting, Newport RI 25 July 2002

04/19/23 26
Defined Flags
DegradeIntroduction of latency to the system
DenyHalting image service for 15 minutes

04/19/23 27
APOD-1 Attack Strategies
Goal Shutdown brokers
Isolate brokers
Flood brokers
Reset connections
Methods Spoofed scans to shutdown brokers
ARP-spoof (ARP Cache Poison)
TCP connection flood
TCPKill
Effects Broker containment rules react to scans
Effectively isolates APOD hosts
Consumes available ports
Adds latency
Resets connections
Notes Attacker can be anywhere in this architecture
Need root on subnet host
Encryption irrelevant
Encryption prevents this

04/19/23 28
Red Team AttacksName ScanAll Scan_Isolate_Flood Scan_Flood_Isolate
Attack Strategy Goal
Shutdown all brokers in one round
Shutdown brokers
Isolate client and brokers on IPnet2
Add additional obstacle to remaining brokers
Shutdown brokers
Interrupt communications between APOD hosts
Isolate remaining
How it works(Method)
NMAP scans using Xmas tree packets and null packets that trigger the IDS.
Multi-stage, sequential attack
Multi-stage, sequential attack
Flag Captured? No Yes(Deny)*
*1 time in 3 attempts
Yes(Deny)*
*11 times in 18 attempts
04/19/23 29
Red Team Observations
APOD-1 makes the attacker’s job harder
Good set of basic mechanisms
Defensive strategies/mechanisms need development
APOD-1 speed of response very good

04/19/23 30
Experiment lessons learned
Experiment was of great value to the APOD technology developers, showing how APOD-1 behaved under actual attack
Capturing attacks in scripts is essential for repeatability, and testing improvements to the defense in a controlled manner
APOD-1 made the attacker’s job harder Three techniques had to be used to pin down APOD-1Order and timing of the attacks was important Had to be tailored to topology, image serving system, and APOD-1
It is difficult to instrument a live Red Team with a computerAutomated attacks can be instrumented, run more quickly, and easily
repeatedClose coordination with the Red Team is required to capture research,
development, and reconnaissance times

04/19/23 31
More Information
APOD Experiment Web Site (on Docushare)
https://archive.ia.isotic.org/
To download copies of:APOD Experimental PlansAPOD Hot Wash's APOD FTN PI Meeting PresentationsAPOD Final Reports
Go to: DARPA IA&S FTN/DC Experiments APOD Experiments