Embed Size (px)
Citation preview

1
APNIC Members and Stakeholders Survey 2014
Peng Hwa ANG

2
Overview
• 8th Biennial survey commissioned by the APNIC EC
• A significant overhaul to the questionnaire from the last iteration
• Inputs used to help guide EC in prioritising strategies and budget

3
Methodology
Questions developed with inputs from consultations in :
Melbourne, Dhaka, Yangon, Vientiane, Colombo, Ulaan Bator, Islamabad, Hong Kong SAR, Beijing, Mumbai, Chennai, Tokyo, Jakarta, Kuala Lumpur, Nouméa, Auckland, Singapore, and Taipei.
Detailed survey report prepared by analysing response data (quantitative and qualitative), and running correlations between relevant questions.

4
Survey Question Areas of APNIC
• General services and service delivery
• External relationships and stakeholder
engagement
• Feedback mechanisms
• Training services
• Policy development process
• Use of member funding
• Process transparency
• Workings of the EC

5
Survey Demographics
• 1,039 valid responses, a decrease of 22.1% over the 1,333 valid responses in the previous survey• 250 fewer from China• 100 fewer from India• 100 fewer from Indonesia
• Response split: Developed economies (24.6%), developing economies (57.9%) and Least Developed Countries (17.4%)
• 64.7% of respondents were APNIC account holders

6
None 1-5 times 6-10 times
11+times Don't know
0%
20%
40%
60%
4.3%
48.6%
21.5% 21.0%
4.6%
A4. Frequency of use of APNIC service or interaction with APNIC
in the past two years

7
A5.2 Assessment on APNIC on Value of services & membership
A5.1 Assessment on APNIC on Quality of services
1 2 3 4 5 6 7
5.91
6.15
A5. Assessment of APNIC’s per-formance in general
Mean

8
Ratings of APNIC’s Service Delivery Quality and Value
Quality of services Value of services & membership0
50
100
150
200
250
300
350
2 25 148 1550 6370 84
182 194
321
264
1 - Poor 2 3 4 - Neutral5 6 7 - Excellent
• Half of respondents gave APNIC 7/7 for service quality while 41.5% gave APNIC 7/7 for service value
• 89.8% rated APNIC positively (5 or above) on service quality, and 85.2% on service value.

9
Don’t know None 1-5 times 6-10 times 11+ times1.00
2.00
3.00
4.00
5.00
6.00
7.00
5.616.00 6.05 6.24 6.41
5.436.00 5.81 5.88
6.25
A5a. Assessment of APNIC performance in general vs number of times respondents have used APNIC services
Quality of services:
Value of services & membership:
Eastern Asia Oceania South-Eastern Asia Southern Asia0
1
2
3
4
5
6
7 6.10 6.24 6.13 6.175.84 5.99 5.84 6.02
A5b. Assessment of APNIC performance in general vs sub-region
Quality of services
Value of ser-vices & membership

10
1-5 times 6-10 times 11+ times1
3
5
7 6.05 6.24 6.415.81 5.88 6.25
A5a. Assessment of APNIC performance in general vs number of times respondents have used APNIC ser-
vices
Quality of services:
Value of ser-vices & membership:
Eastern Asia Oceania South-Eastern Asia Southern Asia0
1
2
3
4
5
6
7 6.10 6.24 6.13 6.175.84 5.99 5.84 6.02
A5b. Assessment of APNIC performance in general vs sub-region
Quality of services
Value of services & membership

11
A6.5 APNIC's service delivery and quality on Resource certification (RPKI) services
A6.8 APNIC's service delivery and quality on Member referral application process
A6.3 APNIC's service delivery and quality on IPv4 address transfers
A6.10 APNIC's service delivery and quality on APNIC Conferences and events
A6.6 APNIC's service delivery and quality on MyAPNIC resource management functionality
A6.7 APNIC's service delivery and quality on MyAPNIC billing and administration functionality
A6.4 APNIC's service delivery and quality on Reverse DNS services
A6.2 APNIC's service delivery and quality on Whois database services
A6.9 APNIC's service delivery and quality on APNIC Helpdesk support
A6.1 APNIC's service delivery and quality on IP address and AS number resource application and allocation
1 2 3 4 5 6 7
5.55
5.73
5.78
5.87
5.89
5.91
5.98
6.09
6.10
6.19
A6. APNIC Service Delivery and Quality Ratings
Mean

12
0%
10%
20%
30%
40%
27.6% 29.4%25.2%
1.2% 0.5%6.7%
9.5%
A7. APNIC’s Service Delivery & Service Quality over the Last Two Years

13
A8.6 Membership statistics
A8.11 Secondary DNS services
A8.3 Resource certification (RPKI)
A8.9 Policy development facilitation
A8.8 Conference coordination & management
A8.12 Working with groups outside APNIC (e.g. Governments, technical organizations, NOGs, etc)
A8.2 Reverse DNS services
A8.13 Research activities – APNIC Labs
A8.4 Internet number resource transfers
A8.5 Internet number resource statistics
A8.10 Root server deployment in the region
A8.7 Training services
A8.1 Resource registration including the Whois database
1 2 3 4 5 6 7
5.14
5.19
5.30
5.41
5.44
5.54
5.55
5.57
5.58
5.59
5.69
5.69
5.71
A8. APNIC’s Future Priorities
Mean

14
A9.8 Civil society groups
A9.10 Law enforcement agencies
A9.2 Governments
A9.3 International government-led organizations (ITU, ASEAN, UN, OECD, APECTEL, APT)
A9.7 Universities and academia
A9.6 Internet business community (external to APNIC membership)
A9.9 Other Regional Internet Registries (AFRINIC, ARIN, LACNIC, RIPE NCC)
A9.4 Asia-Pacific Internet technical organizations (APIX, APIA, APTLD, APCERT, APAN)
A9.5 Global Internet technical organizations (IETF, IAB, Internet Society, ICANN, W3C)
A9.1 Network Operator Groups
1 2 3 4 5 6 7
4.77
4.83
5.21
5.22
5.31
5.34
5.54
5.62
5.63
5.85
A9. APNIC’s External Relationship Focus
Mean

15
A10.7 Providing a better understanding of APNIC’s activities
A10.4 Promoting the registry functions of RIRs and NIRs for Internet resource management
A10.3 Supporting the open, bottom-up Internet policy and coordination system
A10.1Developing networking and technology skills
A10.6 Encouraging Internet infrastructure development
A10.2 Encouraging IPv6 adoption
A10.5 Internet stability and security
1 2 3 4 5 6 7
5.55
5.60
5.68
5.78
5.86
6.10
6.12
A10. APNIC’s Focus Topics for Rela-tionships with Stakeholders
Mean

16
A11.6 Financial information, expenditure and investments
A11.8 Human resources
A11.14 NRO / Inter-RIR activity
A11.13 ISIF Asia support
A11.10 Research activities - APNIC Labs
A11.5 Regional infrastructure development / support
A11.11 APNIC’s outreach activities to other organizations, including participation in regional and global forums
A11.12 Policy development
A11.9 IPv6 development
A11.3 Membership services and development
A11.4 Training
A11.2 Membership statistics
A11.7 APNIC Conferences
A11.1 IP Address and AS Number allocations
1 2 3 4 5 6 7
5.09
5.15
5.19
5.26
5.27
5.29
5.29
5.37
5.39
5.50
5.50
5.56
5.63
5.81
A11. Satisfaction with content of the APNIC Secretariat's reporting in:
Mean

17
Yes No Don't know0%
20%
40%
60%
80% 72.0%
9.9%18.1%
A12. Do you believe Members have enough oppor-tunity to provide feedback and input to APNIC activ-
ities?
Yes No Don't know Never previously provided feedback
to APNIC
0%10%20%30%40%
29.0%
10.4%
34.3%26.3%
A15. If you have provided inputs, do you feel it has in-fluenced decisions, services or strategy?

18
A13.1 Run the APNIC survey more frequently
A13.3 Establish a Special Interest Group with a mandate to discuss APNIC services
A13.7 Run Focus Group discussions with Members more regularly
A13.2 Run smaller surveys on specific topics on a more regular basis
A13.5 Informal sessions at APNIC Meetings to meet and talk to APNIC EC members
A13.4 Establish processes to capture feedback at the point of service delivery
A13.6 Establish a process to make suggestions directly to the APNIC EC
1 2 3 4 5 6 7
4.86
5.24
5.32
5.32
5.33
5.38
5.43
A13. Support for Initiatives that Ensure & Encourage Member’s Contribution
Mean

19
A14.6 Posting to APNIC social media
A14.7 Other
A14.2 Posting to Mailing lists
A14.5 Direct contact with APNIC staff or EC member
A14.1 Making comments at APNIC Conferences
A14.8 I have not previously provided feedback directly to APNIC
A14.3 Responding to a previous APNIC Survey
A14.4 Contacting the Helpdesk
0% 10% 20% 30%
4.3%
5.6%
12.7%
13.8%
13.8%
16.5%
19.2%
24.9%
A14. Methods Used to Provide Feedback to APNIC

20
1
2
3
4
5
6
7
5.635.29 5.20 5.17 5.10 4.94 4.81
A17. Assessment of APNIC's Training Services:
Me
an

21
0
20
40
60
80
100
120
140
5
2012 10 8 4 75
16 18 158 10 127
2716 20
10 616
77
116 113100
111
94106
58
74 6961
7566
60
121
8699 101
80
96109
128
67 63
82 8679
86
1 - Poor 2 3 4 - Neutral5 6 7 - Excellent
62.1% rated training quality 6/7 or 7/7 55.9% rated “training availability” positively, but 15.5% rated it at 3/7 or lower.

22
1
3
5
75.15 5.13 5.18 5.15
A18. Assessment of APNIC’s Policy Development Process for Internet Number Resource Management
Policy
Mean
Ease of understanding Ease of participation Ease of following progress of discussions
Overall effectiveness0
20
40
60
80
100
120
140
160
5 7 5 894
9 5
24 2329
22
129 136 130 135
111 114109 106
111 111 113124
101
87 87 88
1 - Poor 2 3 4 - Neutral5 6 7 - Excellent

23
A19.12 Don’t know
A19.11 Increase APNIC financial investments – fixed assets or other investments
A19.2 Increase fee subsidy for Members from developing economies
A19.3 Invest in improving existing Member services
A19.1 Reduce total Member fee revenue
A19.6 Lower training fees
0% 5% 10% 15% 20% 25% 30%
4.6%
6.4%
7.8%
12.0%
12.3%
14.1%
15.3%
17.5%
18.3%
18.3%
21.8%
24.9%
A19. If APNIC exceeds its financial reserves target, it should use surplus funds on:

24
No difference in priorities between low frequency and high frequency users. Those who used APNIC services 6 times or more placed higher priority on providing grants to community projects and increasing fellowships.
Regional Differences:Promotion of IPv6 top Regional priority in Oceania and Eastern Asia, but “Lower Training Fees” top in Southeast Asia and Southern Asia.
Further Analysis

25
0%
10%
20%
30%
40%
50%46.1%
23.1%
16.6%14.1%
A20. Should services, which are developed by APNIC using Member funding (such as RPKI), be made
available free of charge to:

26
Yes No Don't know0%
10%
20%
30%
40%
50%
60%
70%
25.6%
65.9%
5.5%
A22. Do you think that the use of English language poses a barrier to your ability to
participate in APNIC discussions?

27
A23.7 EC meeting minutes
A23.8 Annual Report document
A23.9 APNIC announcements
A23.5 Internet resource application process
A23.6 APNIC update presentations from APNIC meetings
A23.2 Policy discussions
A23.4 Information on APNIC conferences
A23.3 Information on IPv6
A23.1 Policy proposals
0% 10% 20%
5.9%
6.4%
6.8%
7.1%
7.4%
7.5%
8.8%
11.4%
11.5%
A23. Communications from APNIC would be MOST beneficial to you if they were translated
into your language:

28
1234567
5.06 5.05 4.99 4.97 5.06
A21. Satisfaction with the transparency of EC meetings and decisions in:
Me
an
04080
120
6 6 6 8 99 8 7 9 713 13 16 16 15
114 117 120 112 112
70 68 74 816476 77 65 63 7868 66 64 65 72
1 - Very unsatisfied 2 3 4 - Neutral5 6 7 - Very satisfied

29
1
2
3
4
5
6
7
5.24 5.31 5.25 5.34 5.21
A24. Satisfaction with the APNIC EC Fulfilling Its Roles and Responsibilities
Me
an
0
20
40
60
80
100
120
140
160
180
6 5 4 4 68 13 13 9 1414 9 13 11 13
123
104111 114 111
7284 81
6979
155141 142 148
134
7690
8091
80
1 - Very unsatisfied 2 3 4 - Neutral5 6 7 - Very satisfied

30
1
2
3
4
5
6
7
5.11 5.17 5.11
A25. The composition of the APNIC EC is determined by the rules set out in the APNIC by-laws. How satisfied are you with:
Me
an
0
20
40
60
80
100
120
140
9 7 69 10 813 1223
133 129 126
69 66 69
113 117 112
7783 78
1 - Very unsatisfied 2 3 4 - Neutral5 6 7 - Very satisfied

31
Stakeholders

32
1
4
7 5.56 5.42 5.38 5.23 5.18
B4. Thinking of your interactions with APNIC, you would rate:
Me
an
0
20
40
60
80
100
120
8 10 10 9 106 7 5 5106
137 8 4
51 5156
64 67
24
48
3239
31
53
80
5967
56
9993
81
6167

33
B5.5 Research reports
B5.6 General explanatory information on Internet addressing related issues
B5.4 APNIC Website
B5.3 Statistical information on Internet addressing
B5.2 Reverse DNS service
B5.1 Whois service
1 2 3 4 5 6 7
5.46
5.47
5.61
5.69
5.75
5.81
B5. Assessment of APNIC's Public In-formation Resources and Services
Mean

34
B7.6 Resource certification (RPKI)
B7.12 Advocacy with governments, intergovernmental bodies and other technical organisations
B7.10 Conference management
B7.7 DNSSEC services
B7.11 Policy development
B7.14 Research activities
B7.13 Supporting the AP Internet community
B7.9 Internet infrastructure development
B7.5 Reverse DNS services
B7.8 Technical training services
B7.3 IPv4 address transfers
B7.4 IPv6 advocacy
B7.2 Whois database services
B7.1 IP Address and AS Number provision and management
0% 10% 20% 30%
4.9%
6.4%
7.3%
8.5%
9.0%
9.0%
9.2%
9.5%
12.3%
13.4%
16.5%
17.5%
18.7%
19.5%
B7. From your knowledge of APNIC, activities you would most commonly associate with APNIC:

35
Yes No Don't know0%
10%
20%
30%
40%
50%
25.8%
42.9%
31.3%
B8. APNIC’s policy Development Process is open to anyone, member or not. Does your organisation actively participate in APNIC policy develop-
ment?

36
0%
10%
20%
30%23.4%
19.1%19.0%16.9%13.4%12.3%
B9. If you were to become an APNIC Member in future, services you would
require:
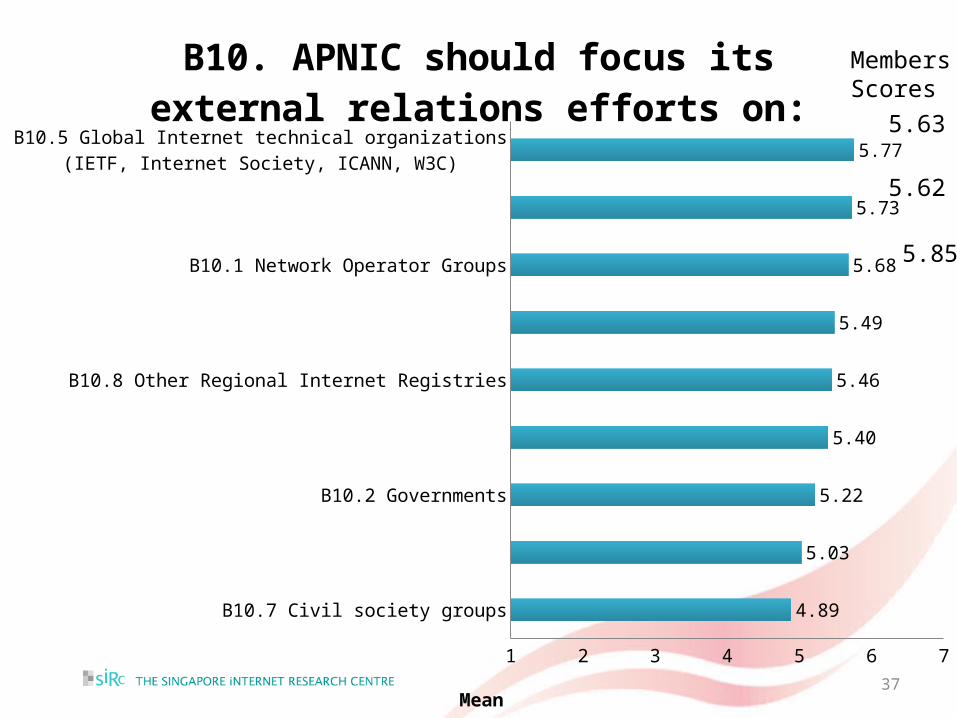
37
B10.7 Civil society groups
B10.9 Law enforcement agencies
B10.2 Governments
B10.3 International government-led organizations (ITU, ASEAN, UN, OECD, APECTEL, APT)
B10.8 Other Regional Internet Registries
B10.6 Universities and academia
B10.1 Network Operator Groups
B10.4 Asia-Pacific Internet technical organizations (APIX, APIA, APTLD, APCERT, APAN)
B10.5 Global Internet technical organizations (IETF, Internet Society, ICANN, W3C)
1 2 3 4 5 6 7
4.89
5.03
5.22
5.40
5.46
5.49
5.68
5.73
5.77
B10. APNIC should focus its external rela-tions efforts on:
Mean
5.85
5.63
5.62
MembersScores

38
B11.4 Promoting the registry functions of RIRs and NIRs for Internet resource management
B11.7 Providing a better understanding of APNIC’s activities
B11.3 Supporting the open, bottom-up Internet policy and coordination system
B11.1 Developing networking and technology skills
B11.6 Encouraging Internet infrastructure development
B11.2 Encouraging IPv6 adoption
B11.5 Internet stability and security
1 2 3 4 5 6 7
5.60
5.66
5.70
5.78
5.81
6.02
6.09
B11. Topics that APNIC should focus its efforts with these various stakeholders:
Mean

39
Yes No0%
50%
100%
34.6%65.4%
B12. Have you contacted APNIC with a query in the
past two years?

40
0%
10%
20%
30%
40%
50%
36.3%42.7%
14.5%
4.8% 1.6%
B13. How would you rate your experience on how your query was handled?

41
Feedback and comments on the Report are much
appreciated.