Embed Size (px)
Citation preview

APL Apollo Tubes Ltd BUY
- 1 - Tuesday, 27th June, 2017
2
This document is for private circulation, and must be read in conjunction with the disclaimer on the last page.
STO
CK
PO
INTE
R
Target Price ₹ 2647.6 CMP ₹ 1525 12xFY20EV/EBIDTA
Index Details APL Apollo is India’s largest player in the ERW structural pipes space. Despite having the largest market share and product basket which is 2x more than its near peer, we expect gains in market share to continue given that:
introduction of new pioneering manufacturing technology would mean faster production process.
introduction of GST to further improve share of organized sector and hence APL Apollo (being the largest player).
Pan India manufacturing facility to help maintain cost
competitiveness, vis a vis the industry.
Strong growth prospects of the steel tubes and pipes industry.
We expect revenues to grow at at CAGR of 19.2 % to Rs 7700.4 crore by FY20 resulting in a CAGR of 19.4% in EBIDTA to Rs 552.7 crore in FY20. This should help earnings grow at a CAGR of 25.9% to Rs 291.2 crore over the same period. Margins are expected to soften in the near term before rallying back up to steady state. We initiate with a BUY for a price target of Rs 2647.6 (12x FY20 EV/EBIDTA) over the CMP of Rs 1525 representing an upside of 73.6% over the next 27 months.
Our optimism stems from the following:
1. Company has undertaken significant expansion to increase its capacity to 2MTPA by FY18. Further, company is introd-
Sensex 31048 Nifty 9528 Industry Steel Pipes
Scrip Details
MktCap (` cr) 3599.00
BVPS (`) 305.34
O/s Shares (Cr) 2.36 AvVol 14979.5 52 Week H/L 1727.5/814.0 Div Yield (%) 1.0
FVPS (`) 10.0
Shareholding Pattern Shareholders % Promoters 37.5 Public 62.5
Total 100.0
APL Apollo vs. Sensex
0
5000
10000
15000
20000
25000
30000
35000
0200400600800
10001200140016001800
APL Apollo Tubes SENSEX
Key Financials (Rs in cr) except EPSEPS EPS
Growth RONW ROCE P/E EV /
EBITDA(%) (%) (%) (x) (x)
2017 4545.0 324.4 145.9 61.8 44.1 22.7 22.5 24.7 12.82018E 5468.3 371.1 161.5 68.5 10.7 20.2 21.7 22.3 11.72019E 6642.3 474.8 229.4 97.2 42.0 23.0 24.6 15.7 8.82020E 7700.4 552.7 291.2 123.4 27.0 23.2 27.3 12.4 7.2
Y/E Mar Net Revenue
EBITDA Adj. PAT

- 2 - Tuesday, 27th June, 2017
This document is for private circulation, and must be read in conjunction with the disclaimer on the last page.
ucing DFT technology and Inline galvanizing in India which will help the company to reduce production time and result in direct savings. 2. The EBIDTA of the company is expected to grow at a CAGR of 19.4% to Rs 552.7 crore in FY20 from Rs 324.4 crore in FY17. The margins are expected to fall initially, due to commissioning costs of new facilities. However, better product mix will aid the company in increasing its EBIDTA per tonne. Overall, we expect EBIDTA margins to stabilize by FY20. 3. The company’s management is actively working with a reputed marketing consultant to launch new brands under ‘APL Apollo’ to cover the company’s unique & innovative product portfolio.
4. APL Apollo has partnered with NEXTracker to source highest quality steel products for solar parks and power plants in India. The tie-up allows APL Apollo to rapidly penetrate the growing renewable energy market in India that seeks to have 100 GW of solar power by 2022.
5. Its strategically located plants enable APL Apollo to have a pan India presence and gain an unfair advantage in logistics costs vis-à-vis its competitors.

- 3 - Tuesday, 27th June, 2017
This document is for private circulation, and must be read in conjunction with the disclaimer on the last page.
Company Background
APL Apollo is the fastest growing steel tube manufacturer in India and has six manufacturing facilities that are located in Sikandrabad (3 units) (Uttar Pradesh), Bangalore (Karnataka), Hosur (Tamil Nadu) and Murbad (Maharashtra). The Company’s vast distribution network is spread across 20 cities. The company’s product basket today boasts of over 400 products which is 2x that of the closest competitor. APL Apollo’s products find widespread use in structural applications in urban infrastructures, housing, irrigation, solar plants, greenhouses and engineering applications. The company is first to introduce pre-galvanized pipes in the domestic markets and also in adopting latest global technologies such as DFT and In-line Galvanizing in India.
Applications of Steel Tubes and Pipes
Source: APL Apollo Tubes Ltd, Ventura Research

- 4 - Tuesday, 27th June, 2017
This document is for private circulation, and must be read in conjunction with the disclaimer on the last page.
Key Investment Highlights
Global steel tubes and Pipes industry set to grow at a CAGR of 6% by 2020
As per Technavio’s market research report, the size of the global steel tubes market is expected to grow at a CAGR of more than 6% by 2020, driven by:
Increasing adoption for horizontal drilling in oil & gas exploration. Increasing usage of galvanized pipes in infrastructure, construction & widespread
industrial usage. Further, Asia Pacific is the largest revenue contributing region in the steel tubes market and is anticipated to account for more than 77% of the overall market revenue by 2020. High demand for steel tubes in the construction, transmission and distribution sectors will also be a major contributing factor in the growth of this market in the coming years. The domestic ERW steel pipes & tubes (to which APL Apollo Tubes Ltd caters) find widespread usage across industries and fields and is expected to grow at a CAGR of 9% through FY19 to Rs 30,000 crore. In addition to various engineering industries, they are used for oil and gas distribution, line pipes, fencing, agricultural purposes, drinking water supply, thermal power, for hand pumps for deep boring wells and also as protection for cables (telecom), among others. Depending on the requirement of the end user industry, ERW steel pipes & tubes are available in various wall thicknesses, diameters, and qualities.

- 5 - Tuesday, 27th June, 2017
This document is for private circulation, and must be read in conjunction with the disclaimer on the last page.
Enhanced capacities & new product innovation to propel revenue growth
Over the period FY14-17, the company’s revenues have grown at a CAGR of 22.1% to Rs 4,545 crore. We expect the net revenues of the company to grow to Rs 7,700.4 crore in FY20 driven by
Capacity expansion to 2MTPA by FY18 New DFT Technology and In line galvanizing to boost productivity and result
in cost savings Change in product mix towards high value added products Recent branding initiatives being taken up by the company Benefits of market share gains from GST
New capacities to be completely commissioned by FY18
APL Apollo has a current production capacity of 1.3 million tonnes per annum. The nearest competitor in the Indian market is nearly half this size. Further, the company is scaling up its capacity to 2 million tonnes per annum by adding 0.5 MTPA capacity with DFT technology. Another 0.2MTPA plant is being added in Raipur to tap eastern markets, which would use conventional technology. The company expects to commission all the production lines of the Raipur facility by Q3FY18. Further, the company has rolled out its VISION2020 plan to become the largest ERW player in the world, with a production of 2.5 million tonnes in 2020. However, we believe that the board plans would fructify only post FY20.
Company’s topline to shoot up
0
1000
2000
3000
4000
5000
6000
7000
8000
9000
FY12 FY13 FY14 FY15 FY16 FY17 FY18E FY19E FY20E
Net Revenues
Rs in cr
Source: APL Apollo Tubes Ltd, Ventura Research

- 6 - Tuesday, 27th June, 2017
This document is for private circulation, and must be read in conjunction with the disclaimer on the last page.
Further, its strategically located plants enable APL Apollo to have a pan India presence and gain an unfair advantage in logistics costs vis-à-vis its competitors.
APL Apollo Tubes Ltd pan India presence
Source: APL Apollo Tubes Ltd, Ventura Research
APL Apollo Tubes Ltd capacity, utilization tend
0102030405060708090
0.0
0.5
1.0
1.5
2.0
2.5
Capacity in MTPA Utilisation in tonnes % Utilisation
(MTPA) (%)
Source: APL Apollo Tubes Ltd, Ventura Research
- 7 - Tuesday, 27th June, 2017
This document is for private circulation, and must be read in conjunction with the disclaimer on the last page.
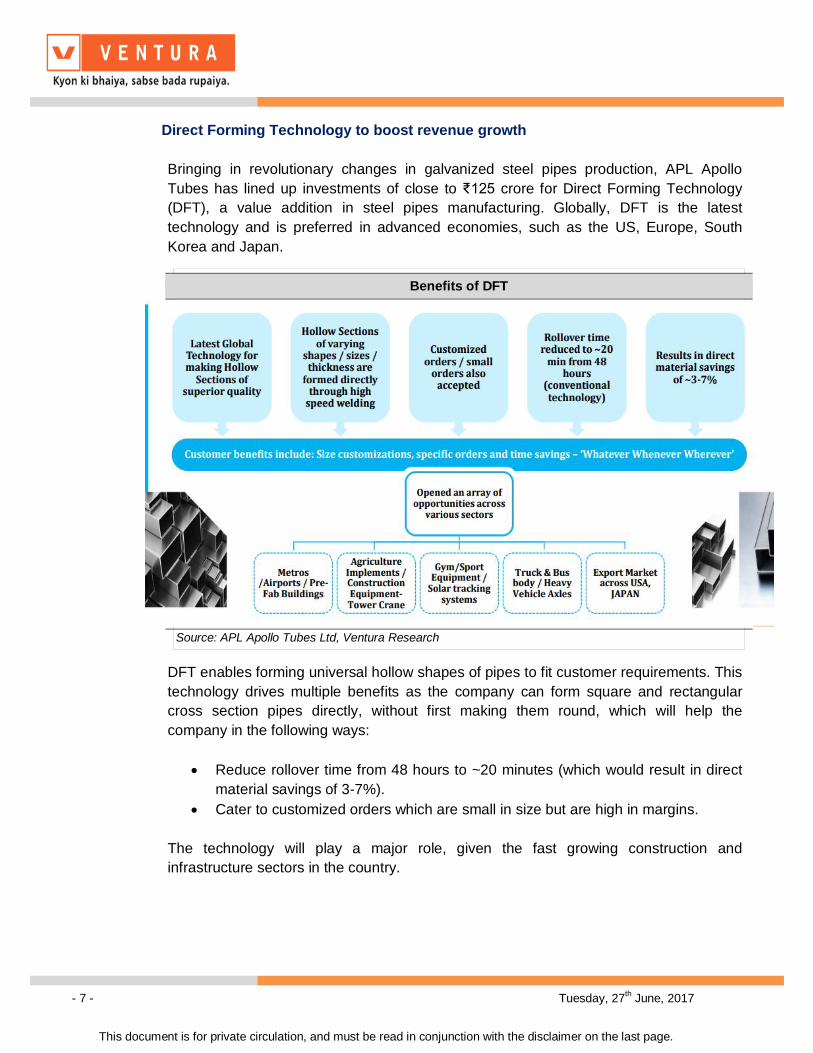
Direct Forming Technology to boost revenue growth Bringing in revolutionary changes in galvanized steel pipes production, APL Apollo Tubes has lined up investments of close to ₹125 crore for Direct Forming Technology (DFT), a value addition in steel pipes manufacturing. Globally, DFT is the latest technology and is preferred in advanced economies, such as the US, Europe, South Korea and Japan.
DFT enables forming universal hollow shapes of pipes to fit customer requirements. This technology drives multiple benefits as the company can form square and rectangular cross section pipes directly, without first making them round, which will help the company in the following ways:
Reduce rollover time from 48 hours to ~20 minutes (which would result in direct material savings of 3-7%).
Cater to customized orders which are small in size but are high in margins. The technology will play a major role, given the fast growing construction and infrastructure sectors in the country.
Benefits of DFT
Source: APL Apollo Tubes Ltd, Ventura Research

- 8 - Tuesday, 27th June, 2017
This document is for private circulation, and must be read in conjunction with the disclaimer on the last page.
EBIDTA to match revenue growth
The EBIDTA of the company is expected to grow at a CAGR of 19.4% to Rs 552.7 crore in FY20 from Rs 324.4 crore in FY17. The margins are expected to fall initially, due to commissioning costs of new facilities, concentration of management to increase volumes and initial reluctance of customers to pay a high price for DFT technology. However, going forward, a better product mix will aid the company in increasing its EBIDTA per tonne. Overall, we expect EBIDTA margins to stabilize by FY20.
We expect EBIDTA margins to decline by 35bps in FY18 as volumes pick up but a
better product mix will stabilize margins by FY20 to 7.2%.
Change in product mix of the company to support EBIDTA margins. The company’s current product margins across various products are in the range of 4-15%. The black round pipes, which constituted 22% of revenues in FY14, enjoyed the lowest gross margin share of ~4-5%. The hollow section pipes, which have a margin of 7-8%, have a revenue contribution of 32% in FY14. However, since then, the company has changed the product mix to increase sales of high margin hollow pipe product to 48% in FY17. In contrast, low margin black pipes contributed only 15% to FY17 revenues. The company has embarked on a strategy to increase the share of value added products to 90% by FY20, which should help it to improve average realizations and support EBIDTA margins. While there is scope for further improvement in margins, we await traction in acceptance of the high margin DFT pipes before raising margin estimates.
EBIDTA and EBIDTA margins
0%
1%
2%
3%
4%
5%
6%
7%
8%
9%
0
100
200
300
400
500
600
FY12 FY13 FY14 FY15 FY16 FY17 FY18E FY19E FY20E
EBIDTA EBIDTA margins
Rs in cr
Source: APL Apollo Tubes Ltd, Ventura Research

- 9 - Tuesday, 27th June, 2017
This document is for private circulation, and must be read in conjunction with the disclaimer on the last page.
Company is undertaking branding activities to build solid visibility for the ‘APL
Apollo’ brand
The company’s management is actively working with a reputed marketing consultant to launch new brands under ‘APL Apollo’ to cover the company’s unique & innovative product portfolio. The company has an expansive distribution network, reaching to 600 direct distributors and 40,000 retailers. Further, the company has also launched ‘Apollo Coastguard’ branded products to tap growing consumption of galvanized steel tubes in the coastal regions. The product is made of special galvanized steel, which will provide excellent corrosion resistance against wind, water and road salts, making the pipes 100% rust proof. The pipes are primarily used for the purpose of roofing structures that provide shelter from rains and sunlight.
Company has announced a strategic tie-up with NEXTracker to manufacture a key structural component of its solar tracking
APL Apollo has partnered with NEXTracker to source highest quality steel products for solar parks and power plants in India. The tie-up allows APL Apollo to rapidly penetrate the growing renewable energy market in India that seeks to have 100 GW of solar power by 2022, which can create demand for more than 1 million tons of premium pre-galvanized hollow section tubes.
APL Apollo Tubes Ltd manufacturing capacity
Source: APL Apollo Tubes Ltd, Ventura Research
0%
5%
10%
15%
20%
25%
30%
Hollow sections (Black)
Hollow sections
(Light gauge)
DFT Products
GP Pipes Round Black pipes
GI Pipes Special products
FY16 FY20E
Lakh tonnes p.a
- 10 - Tuesday, 27th June, 2017
This document is for private circulation, and must be read in conjunction with the disclaimer on the last page.
Company to benefit from the implementation of GST GST will result in a shift of consumer preferences towards branded pipes, which in turn is shifting market shares from unorganized players to organized players. Also, smaller players would face issues like increased working capital, low capacity utilization and old technology, which would make them less competitive. Company first in India to adopt In-line galvanizing technology With the adoption of In-line galvanizing technology, tube making and zinc plating is simultaneously performed because of which secondary operations of hot-dip galvanizing after the tube is formed, is not required. This minimizes human error, leads to time and cost savings for the company.
Key Risks
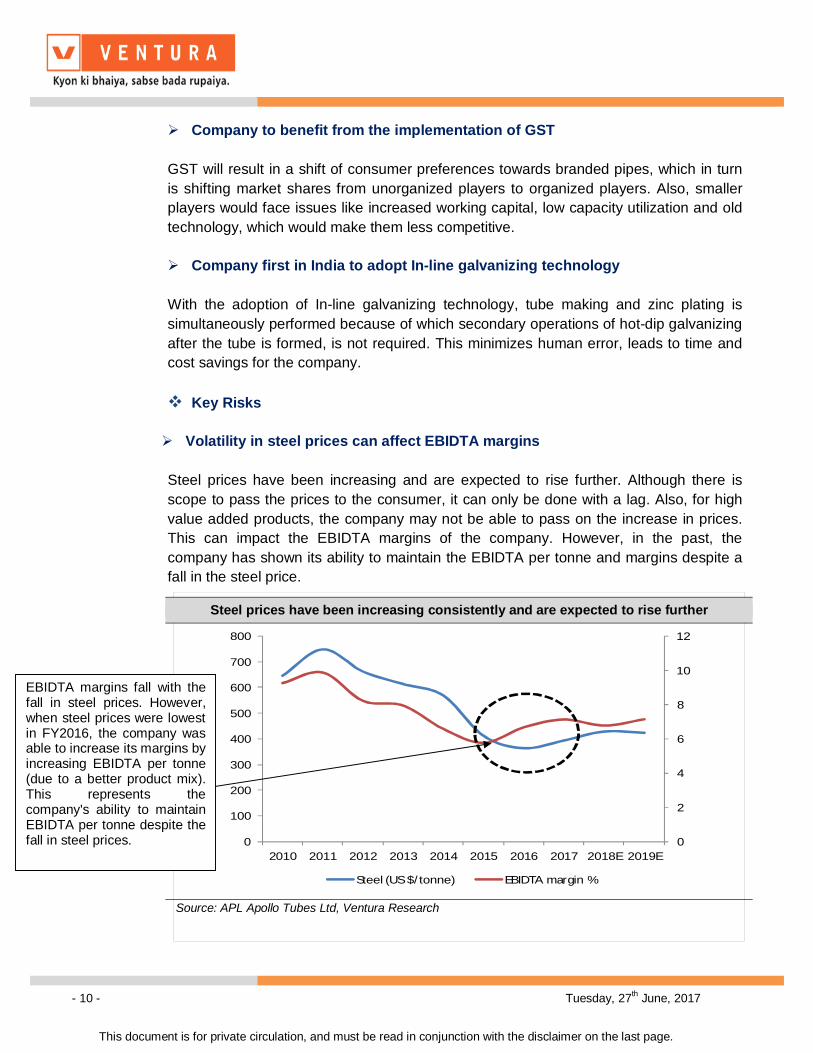
Volatility in steel prices can affect EBIDTA margins Steel prices have been increasing and are expected to rise further. Although there is scope to pass the prices to the consumer, it can only be done with a lag. Also, for high value added products, the company may not be able to pass on the increase in prices. This can impact the EBIDTA margins of the company. However, in the past, the company has shown its ability to maintain the EBIDTA per tonne and margins despite a fall in the steel price.
Steel prices have been increasing consistently and are expected to rise further
Source: APL Apollo Tubes Ltd, Ventura Research
0
2
4
6
8
10
12
0
100
200
300
400
500
600
700
800
2010 2011 2012 2013 2014 2015 2016 2017 2018E 2019E
Steel (US $/tonne) EBIDTA margin %
EBIDTA margins fall with the fall in steel prices. However, when steel prices were lowest in FY2016, the company was able to increase its margins by increasing EBIDTA per tonne (due to a better product mix). This represents the company's ability to maintain EBIDTA per tonne despite the fall in steel prices.

- 11 - Tuesday, 27th June, 2017
This document is for private circulation, and must be read in conjunction with the disclaimer on the last page.
Working capital to remain under pressure and at elevated levels
The working capital cycle of the company will be enhanced as the company adds new capacity due to an increase in debtor and inventory days. However, once the industry starts accepting DFT products, the working capital cycle will start normalizing.
Operating cycle to increase
w
Source: APL Apollo Tubes Ltd, Ventura Research
0
10
20
30
40
50
60
70
80
FY12 FY13 FY14 FY15 FY16 FY17 FY18E FY19E FY20E
Debtor days Inventory days
Trade payable days Opearting cycle
No of days

- 12 - Tuesday, 27th June, 2017
This document is for private circulation, and must be read in conjunction with the disclaimer on the last page.
Financial Performance
APL Apollo’s consolidated gross topline grew by 9.6% to Rs 1,439.3 crore in Q4FY17. However, volume growth (2.6 lakh tones v/s 2.34 lakh tones) was slower than expected owing to external market challenges, including demonetization and volatile steel prices. The EBIDTA stood at Rs 74.6 crore v/s Rs 85.5 crore in the same quarter of the previous year. The EBIDTA margin contracted by 132 bps to 5.2%. The company posted a PAT of Rs 41.2 crore as against Rs 27.5 crore in Q4FY16. Overall the consolidated gross revenue for FY17 stood at Rs 4,996.8 crore as against Rs 4,656.4 crore in FY16. The company registered a 4% increase in volumes in FY17 to 9.31 lakh tones. The EBIDTA of the company stood at Rs 324.4 crore (EBIDTA margin of 6.5%) as against EBIDTA of Rs 281.7 crore (EBIDTA margin of 6.0%) as realizations across product categories witnessed improvement, owing to higher steel prices. The company registered a PAT of Rs 145.9 crore in FY17 as against Rs 100.6 crore in FY16.
Financial Performance (Rs in crores) Description (Rs in cr) Q4FY17 Q4FY16 FY17 FY16Profit & Loss StatementGross Sales 1439.3 1313.4 4996.8 4656.4Growth(%) 9.6% 7.3%Total Expenditure 1364.7 1227.9 4672.4 4374.7% of sales 94.8% 93.5% 93.5% 94.0%EBDITA 74.6 85.5 324.4 281.7EBDITA Margin % 5.2% 6.5% 6.5% 6.0%Other Income 1.7 4.3 3.8 10.3PBDIT 76.3 89.8 328.2 291.9Depreciation 13.2 11.0 51.2 34.1Interest 16.4 18.2 68.3 69.5Exceptional items 0.0 -7.7 0.0 -25.3PBT 46.7 52.8 208.6 163.0Margin % 3.2% 4.0% 4.2% 3.5%Tax Provisions 5.5 25.3 62.7 62.4Reported PAT 41.2 27.5 145.9 100.6Minority Interest 0.0 0.0 0.0 0.0Share of Associate 0.0 0.0 0.0 0.0PAT 41.2 27.5 145.9 100.6Margin % 2.86% 2.09% 2.92% 2.16%
S Source: APL Apollo Tubes Ltd, Ventura Research

- 13 - Tuesday, 27th June, 2017
This document is for private circulation, and must be read in conjunction with the disclaimer on the last page.
Financial Outlook
We expect APL Apollo’s consolidated net revenues to grow from Rs 4,545.0 crore in FY17 to Rs 7,700.4 crore in FY20, at a CAGR of 19.2%, due to capacity expansion of 0.7 MTPA & adoption of DFT Technology and inline galvanizing. The EBIDTA of the company is expected to grow from Rs 324.4 crore in FY17 to Rs 552.7 crore in FY20, registering a CAGR of 19.4%. The margins are expected to contract initially from 7.1% in FY17 to 6.8% in FY18 but will start moving upwards to 7.2% in FY20. The company’s PAT in FY17 stood at Rs 145.9 crore and is expected to grow at a CAGR of 25.9% to Rs 291.2 crore by FY20.
Revenue, EBIDTA margin & PAT margins
Source: APL Apollo Tubes Ltd, Ventura Research
0
1
2
3
4
5
6
7
8
9
0
1000
2000
3000
4000
5000
6000
7000
8000
9000
FY12 FY13 FY14 FY15 FY16 FY17 FY18E FY19E FY20E
Net Revenue EBIDTA margin PAT margin
Rs in cr (%)
EBIDTA per tonne
0
500
1000
1500
2000
2500
3000
3500
4000
4500
FY12 FY13 FY14 FY15 FY16 FY17 FY18E FY19E FY20E
EBIDTA per tonne
Rs in 000's
S Source: APL Apollo Tubes Ltd, Ventura Research
ROE and ROCE margins
Source: APL Apollo Tubes Ltd ,Ventura Research
0
5
10
15
20
25
30
FY12 FY13 FY14 FY15 FY16 FY17 FY18E FY19E FY20E
ROE ROCE
(%)
Debt/Equity and Debt/EBIDTA
S Source: APL Apollo Tubes Ltd ,Ventura Research
0
1
2
3
4
FY12 FY13 FY14 FY15 FY16 FY17E FY18E FY19E FY20E
Debt/Equity Debt/EBIDTA
(x)
- 14 - Tuesday, 27th June, 2017
This document is for private circulation, and must be read in conjunction with the disclaimer on the last page.
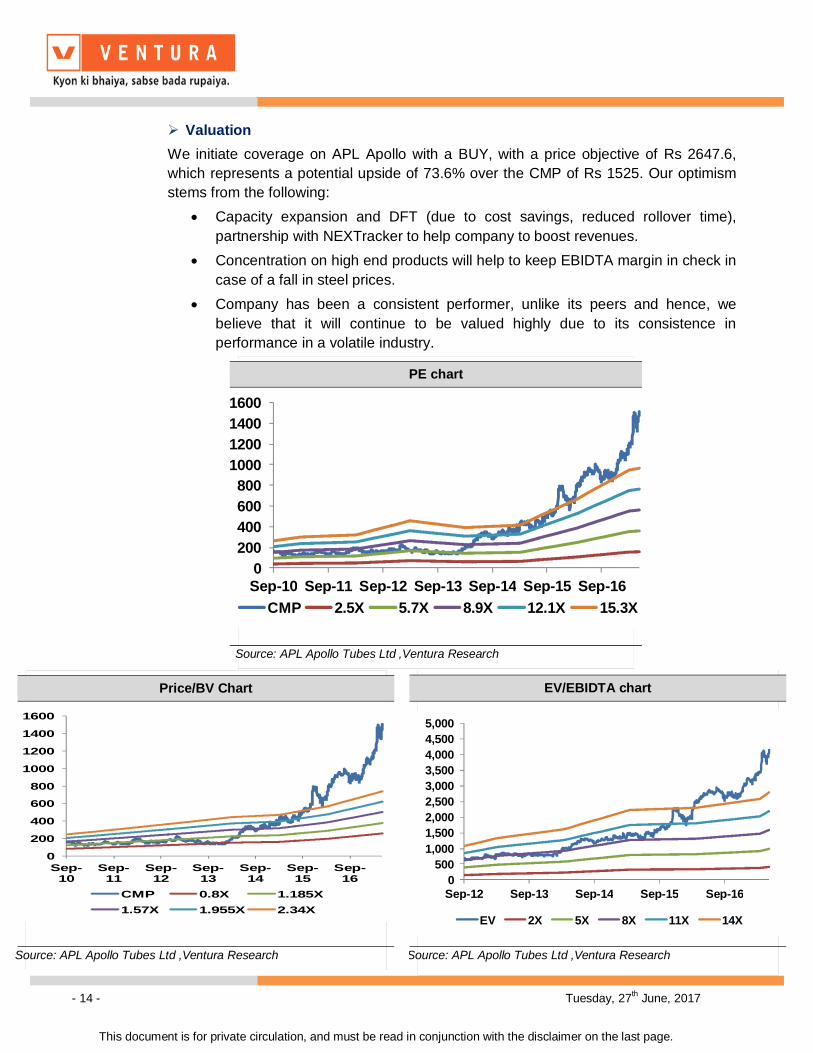
Valuation We initiate coverage on APL Apollo with a BUY, with a price objective of Rs 2647.6, which represents a potential upside of 73.6% over the CMP of Rs 1525. Our optimism stems from the following:
Capacity expansion and DFT (due to cost savings, reduced rollover time), partnership with NEXTracker to help company to boost revenues.
Concentration on high end products will help to keep EBIDTA margin in check in case of a fall in steel prices.
Company has been a consistent performer, unlike its peers and hence, we believe that it will continue to be valued highly due to its consistence in performance in a volatile industry.
PE chart
0200400600800
1000120014001600
Sep-10 Sep-11 Sep-12 Sep-13 Sep-14 Sep-15 Sep-16CMP 2.5X 5.7X 8.9X 12.1X 15.3X
S Source: APL Apollo Tubes Ltd ,Ventura Research
Price/BV Chart
0
200
400
600
800
1000
1200
1400
1600
Sep-10
Sep-11
Sep-12
Sep-13
Sep-14
Sep-15
Sep-16
CMP 0.8X 1.185X1.57X 1.955X 2.34X
Source: APL Apollo Tubes Ltd ,Ventura Research
EV/EBIDTA chart
0500
1,0001,5002,0002,5003,0003,5004,0004,5005,000
Sep-12 Sep-13 Sep-14 Sep-15 Sep-16
EV 2X 5X 8X 11X 14X
S Source: APL Apollo Tubes Ltd ,Ventura Research

- 15 - Tuesday, 27th June, 2017
This document is for private circulation, and must be read in conjunction with the disclaimer on the last page.
Peer comparison
Peer comparison (Rs in crores)
Y/E March Sales EBITDA PATEBITDA
Margin (%)PAT Margin
(%) ROE(%) ROCE(%) P/E P/BVEV/
EBITDAAPL Apollo2015 3138.3 181.6 63.8 5.8 2.0 14.2 17.4 14.7 2.0 7.52016 4213.6 281.7 100.6 6.7 2.4 19.1 21.3 15.5 2.8 7.62017 4545.0 324.4 145.9 7.1 3.2 22.7 22.5 24.7 5.0 12.82018E 5468.3 371.1 161.5 6.8 3.0 20.2 21.7 22.3 4.1 11.7Surya Roshni 2015 2857.1 223.5 54.1 7.8 1.9 7.8 11.1 9.1 0.6 6.32016 3674.1 286.1 75.0 7.8 2.0 9.9 10.9 18.9 1.8 7.42017 4141.0 320.1 99.3 7.7 2.4 10.9 11.5 14.9 1.6 6.62018E 5075.3 390.8 138.3 7.7 2.7 13.3 11.2 11.4 1.4 5.4Ratnamani Metals & Tubes2015 1688.5 300.4 173.5 17.8 10.3 16.9 14.1 18.5 3.5 10.52016 1484.0 259.5 147.1 17.5 9.9 13.0 16.3 23.2 2.9 12.72017 1670.7 311.1 176.1 18.6 10.5 13.8 12.9 19.3 2.6 10.62018E 1952.2 363.2 212.3 18.6 10.9 15.0 14.5 16.0 2.3 9.1Maharashtra Seamless2015 1354.7 121.1 117.6 8.9 8.7 4.1 5.2 11.2 0.5 14.52016 1484.0 259.8 152.1 17.5 10.2 5.7 0.6 15.0 0.9 10.32017 1809.0 318.8 178.1 17.6 9.8 6.4 2.9 12.8 0.8 8.42018E 2119.6 329.5 199.3 15.5 9.4 6.3 2.9 11.5 0.7 8.1Jindal Saw2015 8207.8 1009.1 -73.5 12.3 -0.9 -0.3 -10.0 NA 0.4 8.92016 5827.2 1076.6 296.4 18.5 5.1 5.3 5.0 7.8 0.4 7.02017 6409.9 1183.1 338.4 18.5 5.3 5.7 na 6.9 0.4 6.42018E 6,815.0 1,089.6 187.1 16.4 3.2 3.6 -2.5 7.4 0.4 7.4
Sour Source: APL Apollo Tubes Ltd , Ventura Research
- 16 - Tuesday, 27th June, 2017
This document is for private circulation, and must be read in conjunction with the disclaimer on the last page.
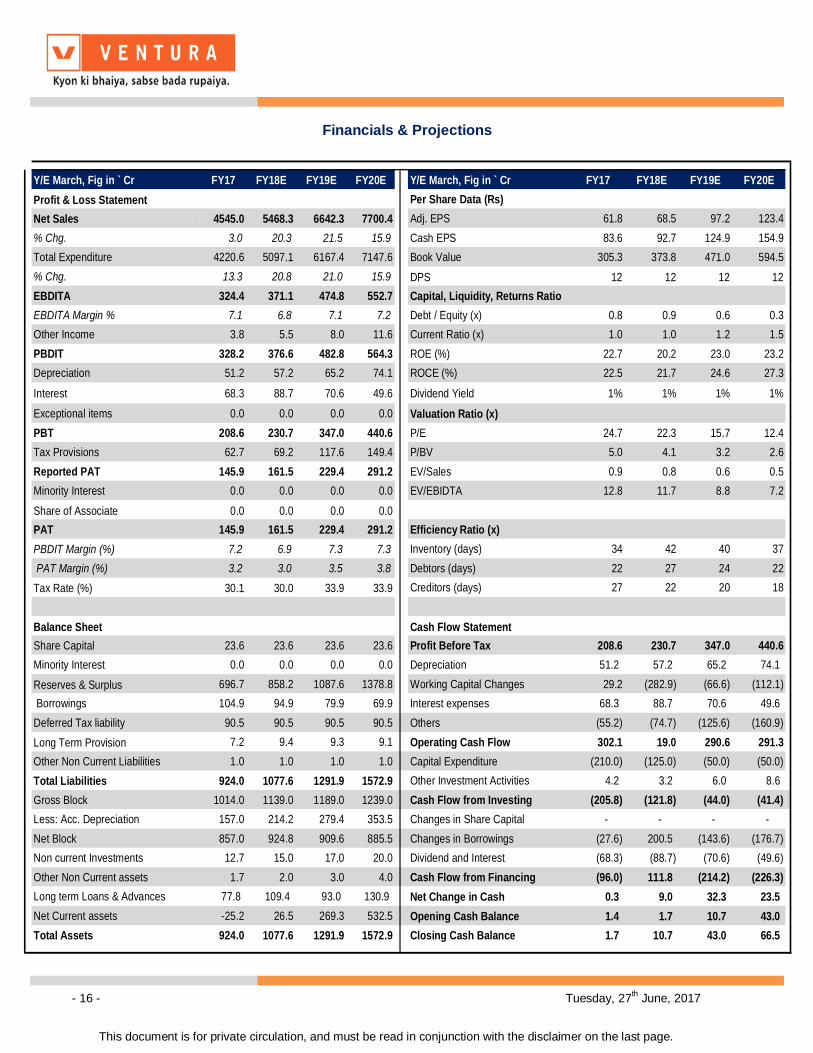
Financials & Projections
Y/E March, Fig in ` Cr FY17 FY18E FY19E FY20E Y/E March, Fig in ` Cr FY17 FY18E FY19E FY20EProfit & Loss Statement Per Share Data (Rs)Net Sales 4545.0 5468.3 6642.3 7700.4 Adj. EPS 61.8 68.5 97.2 123.4% Chg. 3.0 20.3 21.5 15.9 Cash EPS 83.6 92.7 124.9 154.9Total Expenditure 4220.6 5097.1 6167.4 7147.6 Book Value 305.3 373.8 471.0 594.5% Chg. 13.3 20.8 21.0 15.9 DPS 12 12 12 12EBDITA 324.4 371.1 474.8 552.7 Capital, Liquidity, Returns RatioEBDITA Margin % 7.1 6.8 7.1 7.2 Debt / Equity (x) 0.8 0.9 0.6 0.3Other Income 3.8 5.5 8.0 11.6 Current Ratio (x) 1.0 1.0 1.2 1.5PBDIT 328.2 376.6 482.8 564.3 ROE (%) 22.7 20.2 23.0 23.2Depreciation 51.2 57.2 65.2 74.1 ROCE (%) 22.5 21.7 24.6 27.3
Interest 68.3 88.7 70.6 49.6 Dividend Yield 1% 1% 1% 1%
Exceptional items 0.0 0.0 0.0 0.0 Valuation Ratio (x)PBT 208.6 230.7 347.0 440.6 P/E 24.7 22.3 15.7 12.4Tax Provisions 62.7 69.2 117.6 149.4 P/BV 5.0 4.1 3.2 2.6Reported PAT 145.9 161.5 229.4 291.2 EV/Sales 0.9 0.8 0.6 0.5Minority Interest 0.0 0.0 0.0 0.0 EV/EBIDTA 12.8 11.7 8.8 7.2
Share of Associate 0.0 0.0 0.0 0.0PAT 145.9 161.5 229.4 291.2 Efficiency Ratio (x)PBDIT Margin (%) 7.2 6.9 7.3 7.3 Inventory (days) 34 42 40 37 PAT Margin (%) 3.2 3.0 3.5 3.8 Debtors (days) 22 27 24 22Tax Rate (%) 30.1 30.0 33.9 33.9 Creditors (days) 27 22 20 18
Balance Sheet Cash Flow StatementShare Capital 23.6 23.6 23.6 23.6 Profit Before Tax 208.6 230.7 347.0 440.6 Minority Interest 0.0 0.0 0.0 0.0 Depreciation 51.2 57.2 65.2 74.1
Reserves & Surplus 696.7 858.2 1087.6 1378.8 Working Capital Changes 29.2 (282.9) (66.6) (112.1) Borrowings 104.9 94.9 79.9 69.9 Interest expenses 68.3 88.7 70.6 49.6 Deferred Tax liability 90.5 90.5 90.5 90.5 Others (55.2) (74.7) (125.6) (160.9) Long Term Provision 7.2 9.4 9.3 9.1 Operating Cash Flow 302.1 19.0 290.6 291.3 Other Non Current Liabilities 1.0 1.0 1.0 1.0 Capital Expenditure (210.0) (125.0) (50.0) (50.0) Total Liabilities 924.0 1077.6 1291.9 1572.9 Other Investment Activities 4.2 3.2 6.0 8.6 Gross Block 1014.0 1139.0 1189.0 1239.0 Cash Flow from Investing (205.8) (121.8) (44.0) (41.4) Less: Acc. Depreciation 157.0 214.2 279.4 353.5 Changes in Share Capital - - - - Net Block 857.0 924.8 909.6 885.5 Changes in Borrowings (27.6) 200.5 (143.6) (176.7) Non current Investments 12.7 15.0 17.0 20.0 Dividend and Interest (68.3) (88.7) (70.6) (49.6) Other Non Current assets 1.7 2.0 3.0 4.0 Cash Flow from Financing (96.0) 111.8 (214.2) (226.3) Long term Loans & Advances 77.8 109.4 93.0 130.9 Net Change in Cash 0.3 9.0 32.3 23.5 Net Current assets -25.2 26.5 269.3 532.5 Opening Cash Balance 1.4 1.7 10.7 43.0 Total Assets 924.0 1077.6 1291.9 1572.9 Closing Cash Balance 1.7 10.7 43.0 66.5
- 17 - Tuesday, 27th June, 2017
This document is for private circulation, and must be read in conjunction with the disclaimer on the last page.
Disclosures and Disclaimer Ventura Securities Limited (VSL) is a SEBI registered intermediary offering broking, depository and portfolio management services to clients. VSL is member of BSE, NSE and MCX-SX. VSL is a depository participant of NSDL. VSL states that no disciplinary action whatsoever has been taken by SEBI against it in last five years except administrative warning issued in connection with technical and venial lapses observed while inspection of books of accounts and records. Ventura Commodities Limited, Ventura Guaranty Limited, Ventura Insurance Brokers Limited and Ventura Allied Services Private Limited are associates of VSL. Research Analyst (RA) involved in the preparation of this research report and VSL disclose that neither RA nor VSL nor its associates (i) have any financial interest in the company which is the subject matter of this research report (ii) holds ownership of one percent or more in the securities of subject company (iii) have any material conflict of interest at the time of publication of this research report (iv) have received any compensation from the subject company in the past twelve months (v) have managed or co-managed public offering of securities for the subject company in past twelve months (vi) have received any compensation for investment banking merchant banking or brokerage services from the subject company in the past twelve months (vii) have received any compensation for product or services from the subject company in the past twelve months (viii) have received any compensation or other benefits from the subject company or third party in connection with the research report. RA involved in the preparation of this research report discloses that he / she has not served as an officer, director or employee of the subject company. RA involved in the preparation of this research report and VSL discloses that they have not been engaged in the market making activity for the subject company. Our sales people, dealers, traders and other professionals may provide oral or written market commentary or trading strategies to our clients that reflect opinions that are contrary to the opinions expressed herein. We may have earlier issued or may issue in future reports on the companies covered herein with recommendations/ information inconsistent or different those made in this report. In reviewing this document, you should be aware that any or all of the foregoing, among other things, may give rise to or potential conflicts of interest. We may rely on information barriers, such as "Chinese Walls" to control the flow of information contained in one or more areas within us, or other areas, units, groups or affiliates of VSL. This report is for information purposes only and this document/material should not be construed as an offer to sell or the solicitation of an offer to buy, purchase or subscribe to any securities, and neither this document nor anything contained herein shall form the basis of or be relied upon in connection with any contract or commitment whatsoever. This document does not solicit any action based on the material contained herein. It is for the general information of the clients / prospective clients of VSL. VSL will not treat recipients as clients by virtue of their receiving this report. It does not constitute a personal recommendation or take into account the particular investment objectives, financial situations, or needs of clients / prospective clients. Similarly, this document does not have regard to the specific investment objectives, financial situation/circumstances and the particular needs of any specific person who may receive this document. The securities discussed in this report may not be suitable for all investors. The appropriateness of a particular investment or strategy will depend on an investor's individual circumstances and objectives. Persons who may receive this document should consider and independently evaluate whether it is suitable for his/ her/their particular circumstances and, if necessary, seek professional/financial advice. And such person shall be responsible for conducting his/her/their own investigation and analysis of the information contained or referred to in this document and of evaluating the merits and risks involved in the securities forming the subject matter of this document. The projections and forecasts described in this report were based upon a number of estimates and assumptions and are inherently subject to significant uncertainties and contingencies. Projections and forecasts are necessarily speculative in nature, and it can be expected that one or more of the estimates on which the projections and forecasts were based will not materialize or will vary significantly from actual results, and such variances will likely increase over time. All projections and forecasts described in this report have been prepared solely by the authors of this report independently of the Company. These projections and forecasts were not prepared with a view toward compliance with published guidelines or generally accepted accounting principles. No independent accountants have expressed an opinion or any other form of assurance on these projections or forecasts. You should not regard the inclusion of the projections and forecasts described herein as a representation or warranty by VSL, its associates, the authors of this report or any other person that these projections or forecasts or their underlying assumptions will be achieved. For these reasons, you should only consider the projections and forecasts described in this report after carefully evaluating all of the information in this report, including the assumptions underlying such projections and forecasts. The price and value of the investments referred to in this document/material and the income from them may go down as well as up, and investors may realize losses on any investments. Past performance is not a guide for future performance. Future returns are not guaranteed and a loss of original capital may occur. Actual results may differ materially from those set forth in projections. Forward-looking statements are not predictions and may be subject to change without notice. We do not provide tax advice to our clients, and all investors are strongly advised to consult regarding any potential investment. VSL, the RA involved in the preparation of this research report and its associates accept no liabilities for any loss or damage of any kind arising out of the use of this report. This report/document has been prepared by VSL, based upon information available to the public and sources, believed to be reliable. No representation or warranty, express or implied is made that it is accurate or complete. VSL has reviewed the report and, in so far as it includes current or historical information, it is believed to be reliable, although its accuracy and completeness cannot be guaranteed. The opinions expressed in this document/material are subject to change without notice and have no obligation to tell you when opinions or information in this report change. This report or recommendations or information contained herein do/does not constitute or purport to constitute investment advice in publicly accessible media and should not be reproduced, transmitted or published by the recipient. The report is for the use and consumption of the recipient only. This publication may not be distributed to the public used by the public media without the express written consent of VSL. This report or any portion hereof may not be printed, sold or distributed without the written consent of VSL. This document does not constitute an offer or invitation to subscribe for or purchase or deal in any securities and neither this document nor anything contained herein shall form the basis of any contract or commitment whatsoever. This document is strictly confidential and is being furnished to you solely for your information, may not be distributed to the press or other media and may not be reproduced or redistributed to any other person. The opinions and projections expressed herein are entirely those of the author and are given as part of the normal research activity of VSL and are given as of this date and are subject to change without notice. Any opinion estimate or projection herein constitutes a view as of the date of this report and there can be no assurance that future results or events will be consistent with any such opinions, estimate or projection. This document has not been prepared by or in conjunction with or on behalf of or at the instigation of, or by arrangement with the company or any of its directors or any other person. Information in this document must not be relied upon as having been authorized or approved by the company or its directors or any other person. Any opinions and projections contained herein are entirely those of the authors. None of the company or its directors or any other person accepts any liability whatsoever for any loss arising from any use of this document or its contents or otherwise arising in connection therewith. The information contained herein is not intended for publication or distribution or circulation in any manner whatsoever and any unauthorized reading, dissemination, distribution or copying of this communication is prohibited unless otherwise expressly authorized. Please ensure that you have read “Risk Disclosure Document for Capital Market and Derivatives Segments” as prescribed by Securities and Exchange Board of India before investing in Securities Market. Ventura Securities Limited Corporate Office: 8th Floor, ‘B’ Wing, I Think Techno Campus, Pokhran Road no. 02, Off Eastern Express Highway , Thane (West) 400 607.