Embed Size (px)
Citation preview

arX
iv:1
708.
0782
2v2
[as
tro-
ph.S
R]
1 D
ec 2
017
ApJ, in pressPreprint typeset using LATEX style emulateapj v. 12/16/11
WHERE IS THE FLUX GOING? THE LONG-TERM PHOTOMETRIC VARIABILITY OF BOYAJIAN’S STAR
Joshua D. Simon1, Benjamin J. Shappee1,2,3, G. Pojmanski4, Benjamin T. Montet5,6, C. S. Kochanek7,8, Jennifervan Saders1,3, T. W.-S. Holoien7,8,9, and Arne A. Henden10
ApJ, in press
ABSTRACT
We present ∼ 800 days of photometric monitoring of Boyajian’s Star (KIC 8462852) from the All-Sky Automated Survey for Supernovae (ASAS-SN) and ∼ 4000 days of monitoring from the All SkyAutomated Survey (ASAS). We show that from 2015 to the present the brightness of Boyajian’s Starhas steadily decreased at a rate of 6.3± 1.4 mmag yr−1, such that the star is now 1.5% fainter than itwas in February 2015. Moreover, the longer time baseline afforded by ASAS suggests that Boyajian’sStar has also undergone two brightening episodes in the past 11 years, rather than only exhibiting amonotonic decline. We analyze a sample of ∼ 1000 comparison stars of similar brightness located inthe same ASAS-SN field and demonstrate that the recent fading is significant at & 99.4% confidence.The 2015− 2017 dimming rate is consistent with that measured with Kepler data for the time periodfrom 2009 to 2013. This long-term variability is difficult to explain with any of the physical modelsfor the star’s behavior proposed to date.Keywords: stars: activity; stars: individual (Boyajian’s Star); stars: peculiar; stars: variables: general
1. INTRODUCTION
Boyajian’s Star (KIC 8462852) has been a fascinatingmystery since its discovery was made public in late 2015.Boyajian et al. (2016) showed that the star underwent aseries of asymmetric, aperiodic, brief dips in brightnessfrom 2009 to 2013 while it was being monitored by Ke-pler. These dips have typical timescales of a few days andrange in depth from ∼ 0.2% to more than 20%. Boyajianet al. (2016) cataloged ten dip complexes detected duringthe Kepler mission.Such irregular dimming events are not unusual for
young stars (e.g., Alencar et al. 2010; Morales-Calderonet al. 2011; Cody et al. 2014), but Boyajian’s Star ex-hibits no obvious signs of youth (Boyajian et al. 2016).Instead, it appears to be an otherwise unremarkable mainsequence F star (Lisse et al. 2015). The star also lacksan infrared excess that would be expected to accompanysignificant amounts of nearby warm dust (Marengo et al.2015; Thompson et al. 2016).Initial attempts to explain the dips focused on circum-
stellar material, perhaps in the form of debris from a col-lision of planetesimals (Boyajian et al. 2016) or a largefamily of comets (Bodman & Quillen 2016). While thesemodels can potentially account for the dipping activ-
1 Observatories of the Carnegie Institution for Sci-ence, 813 Santa Barbara St., Pasadena, CA 91101; [email protected]
2 Hubble Fellow3 Carnegie-Princeton Fellow4 Warsaw University Observatory, Al. Ujazdowskie 4, 00-478
Warsaw, Poland5 Department of Astronomy and Astrophysics, University of
Chicago, 5640 S. Ellis Avenue, Chicago, IL 606376 NASA Sagan Fellow7 Department of Astronomy, The Ohio State University, 140
West 18th Avenue, Columbus, OH 432108 Center for Cosmology and Astroparticle Physics, The Ohio
State University, 191 W. Woodruff Avenue, Columbus, OH43210
9 US Department of Energy Computational Science GraduateFellow
10 AAVSO, 49 Bay State Road, Cambridge, MA 02138
ity without violating the infrared constraints, they wereseverely challenged by the finding by Schaefer (2016) thatBoyajian’s Star appears to have been monotonically fad-ing since the late 19th century, with a total change inits brightness of 0.16 mag from 1890 to 1989. The in-terpretation of the archival photographic measurementsfor the star has been controversial (Hippke et al. 2016,2017), but Montet & Simon (2016) demonstrated usingKepler full-frame images that the star’s brightness didsteadily decline by a total of ∼ 3% over the four yearsof Kepler ’s main mission. Further complicating the sit-uation, Makarov & Goldin (2016) used astrometry fromKepler to show that the variability detected by Boya-jian et al. (2016) in the Kepler long-cadence light curvemust originate from at least two distinct sources. Whilethe strong dips can only occur on Boyajian’s Star givenits brightness relative to the closest neighboring stars,the Makarov & Goldin results indicate that the longer-term, low-amplitude periodicities (ranging from 0.88 dto ∼ 20 d) are most likely attributable to a nearby staror stars.After the long-term variability of Boyajian’s Star be-
came clear, Wright & Sigurðsson (2016) provided a com-prehensive summary of all possible mechanisms to ac-count for the observed brightness changes, and Metzgeret al. (2017) and Foukal (2017) presented new models forpossible intrinsic variability of the star. In particular,Metzger et al. (2017) show that the ingestion of a planetand the accompanying destruction of its satellite systemcould produce both brief dips and a long-term dimmingwith a rate comparable to that measured by Schaefer(2016) and Montet & Simon (2016), providing the firstsimultaneous explanation for all aspects of the star’s vari-ability. Foukal (2017) argues instead that the convectivestructure of the star may be able to store enough energyto explain the dips and longer-term fading.In this paper, we examine the long-term photomet-
ric behavior of Boyajian’s Star from the ground usingdata from the All-Sky Automated Survey for Supernovae

2 Simon et al.
(ASAS-SN; Shappee et al. 2014) and the All Sky Auto-mated Survey (ASAS; Pojmanski 2002). In §2 we de-scribe the ASAS-SN and ASAS imaging of the Keplerfield. In §3 we analyze the ASAS-SN observations ofBoyajian’s Star and our comparison sample. In §4 we an-alyze the ASAS observations. We discuss the interpreta-tion of these results in light of ideas suggested to explainthe behavior of Boyajian’s Star in §5 and we present ourconclusions in §6.
2. OBSERVATIONS
2.1. ASAS-SN
ASAS-SN is an all-sky survey that monitors the en-tire sky for transients every ∼ 2 days down to a V -bandmagnitude of ∼ 17. The survey currently consists of twofully robotic units, one on Haleakala, Hawaii and one onCerro Tololo, Chile, each with four 14 cm telescopes. Thefield containing Boyajian’s Star was observed a total of377 times from 2015 February 24 (UT) to 2017 May 15by the northern ASAS-SN unit, “Brutus”. This ASAS-SN field is labeled F2006+46 0982, which is centered onR.A.= 20:06:46.5, Decl.= +45:59:27.8 and is observedwith the Brutus camera labeled “bd”. In order to pro-vide a comparison sample of stars with similar brightness,we used the SIMBAD database (Wenger et al. 2000) toselect ∼ 1100 stars located in the same ASAS-SN fieldand within ∼ 0.5 mag of the brightness of Boyajian’sStar (11.5 < V < 12.5).We performed aperture photometry for each of these
stars using automated measurements similar to those de-scribed by Kochanek et al. (2017) except that we align,interpolate, and stack the dithered images (usually 3)acquired during each epoch. Experimentation suggestedthat the most robust results for our purposes could beobtained using a larger photometric aperture of 3 pix-els (∼ 24′′). The median photometric uncertainty forthese choices is 0.010 mag. The photometric calibra-tion for each star is determined from the magnitudes of11.5 < V < 13.5 stars in the AAVSO All-Sky Photomet-ric Survey (APASS; Henden et al. 2012) catalog locatedwithin 0.◦75 that also have photometric uncertainties lessthan 0.1 mag. Using fainter or more distant APASS starsor larger photometric apertures tended to produce poorerresults for this field and brightness range.
2.2. ASAS
ASAS is a long-term variability survey that scans alarge fraction of the sky from two locations, Las Cam-panas, Chile (since 1997) and Haleakala, Hawaii (since2006). From Hawaii, ASAS simultaneously monitors thesky in two filters (V and I) with two 10 cm telescopes.ASAS V -band aperture photometry is calibrated to Ty-cho V magnitudes by determining the median differencebetween ASAS instrumental magnitudes and Tycho in30′ × 30′ regions. The zero point for each 8◦ × 8◦ ASASfield is then calculated by interpolating the results fromthe 16× 16 grid of regions with a spatially smooth func-tion. ASAS has obtained a total of 564 V -band images ofBoyajian’s Star spanning from 2006 May 31 to the begin-ning of the 2017 May dipping activity. A large majorityof these images (517) are in ASAS field 616, centered atR.A.= 20:15:00, Decl.= +48:00:00. As with the ASAS-SN data, we consider only observations in the same field
Table 1ASAS-SN Photometry of Boyajian’s Star
HJD V ∆V FWHM Zero pointa
[mag] [mag] [pix] [mag]
2457078.15792 11.898 0.009 1.56 -2.262457079.15672 11.888 0.010 1.65 -2.272457080.15999 11.903 0.010 1.50 -2.242457081.16257 11.894 0.011 1.69 -2.252457083.16491 11.882 0.012 1.73 -2.252457084.16041 11.924 0.011 2.12 -2.262457103.14733 11.910 0.010 1.51 -2.202457106.11872 11.912 0.010 1.54 -2.222457107.13016 11.899 0.009 1.47 -2.262457114.09387 11.902 0.010 1.66 -2.26
Note. — This table is available in its entirety in theelectronic edition of the journal. A portion is reproducedhere to provide guidance on form and content.a The ASAS-SN zero point (ZP) of each image is definedsuch that a source with a flux of one count has a magnitudeof 25 + ZP.
in order to minimize systematics between Boyajian’s Starand comparison objects. Relative to ASAS-SN, ASAShas the advantage of a much longer time baseline, but thedisadvantage of larger photometric uncertainties, with amedian uncertainty of 0.028 mag per measurement.
3. ANALYSIS OF ASAS-SN DATA
3.1. Boyajian’s Star
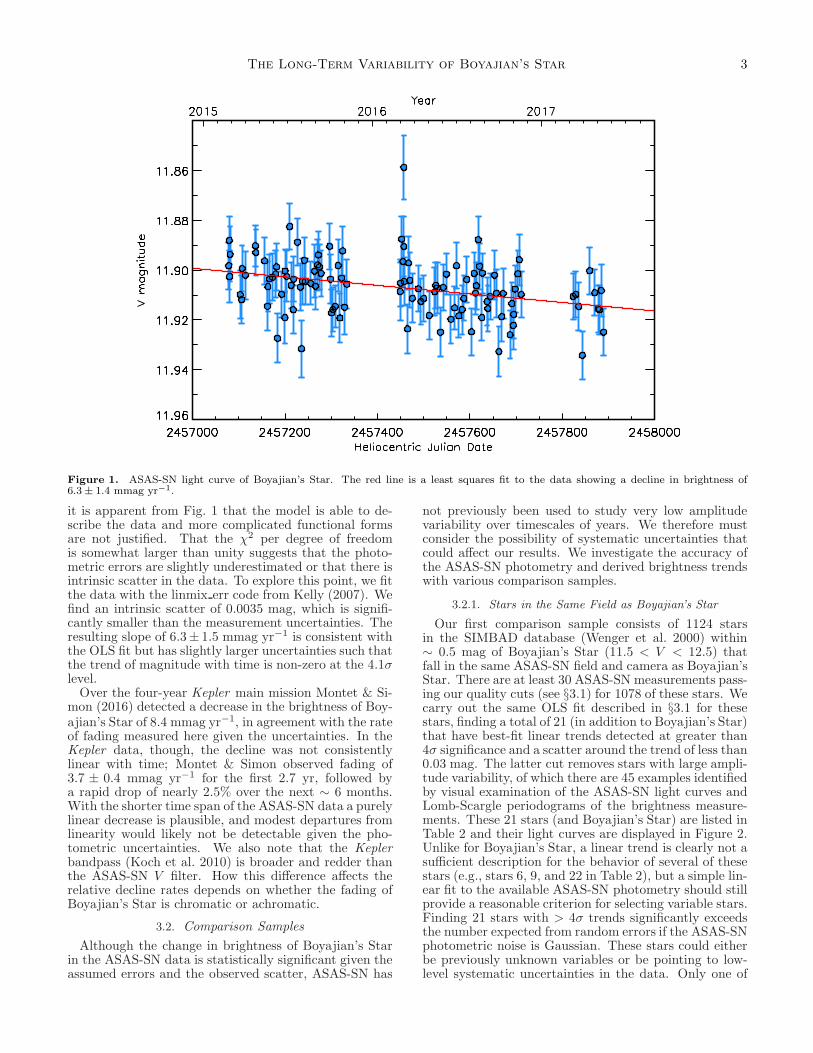
The ASAS-SN light curve of Boyajian’s Star is dis-played in Figure 1, and the data are listed in Table 1. Themeasurements reveal a small but clear decline in bright-ness from V = 11.899 in early 2015 to V = 11.914 in 2017May. While ASAS-SN observations of the star will con-tinue with a few-day cadence until it goes into conjunc-tion with the Sun in 2017 November, we exclude mea-surements after 2017 May 16 to ensure that our resultsare not affected by the “Elsie” dip beginning on that date(Boyajian et al. 2017). We also remove images that wereacquired in adverse conditions such as bright sky, lowtransparency, or poor seeing by rejecting measurementswhen the photometric uncertainty was > 0.03 mag, thetransparency was more than 0.5 mag worse than the me-dian value, the image FWHM was more than 1σ abovethe median value, or the V magnitude was > 0.1 magaway from the median magnitude. We perform an ordi-nary least squares (OLS) fit to the data assuming thatthe magnitude of the star varies linearly with time andfind a best-fit slope of 6.3± 1.4 mmag yr−1. The changein brightness is detected at 4.4σ. The scatter of the datapoints around the fit is 0.011 mag and the χ2 per degreeof freedom is 1.08. If we measure the flux of Boyajian’sStar in apertures with radii of 2, 4, or 5 ASAS-SN pix-els, we find that the best-fit slope changes by less thanits uncertainty, and the significance varies from 5.5σ atr = 2 pixels to 3.5σ at r = 4 pixels.While the assumptions of the OLS method are vio-
lated by many astronomical data sets (e.g., Akritas &Bershady 1996; Kelly 2007; Hogg et al. 2010), this par-ticular case is relatively well-suited for OLS: the times atwhich the magnitudes were measured are known essen-tially perfectly and the uncertainties on the magnitudesare small (and only mildly heteroscedastic). We do notknow a priori whether a linear model is a good fit to thebrightness of Boyajian’s Star over this time interval, but
The Long-Term Variability of Boyajian’s Star 3
Figure 1. ASAS-SN light curve of Boyajian’s Star. The red line is a least squares fit to the data showing a decline in brightness of6.3 ± 1.4 mmag yr−1.
it is apparent from Fig. 1 that the model is able to de-scribe the data and more complicated functional formsare not justified. That the χ2 per degree of freedomis somewhat larger than unity suggests that the photo-metric errors are slightly underestimated or that there isintrinsic scatter in the data. To explore this point, we fitthe data with the linmix err code from Kelly (2007). Wefind an intrinsic scatter of 0.0035 mag, which is signifi-cantly smaller than the measurement uncertainties. Theresulting slope of 6.3± 1.5 mmag yr−1 is consistent withthe OLS fit but has slightly larger uncertainties such thatthe trend of magnitude with time is non-zero at the 4.1σlevel.Over the four-year Kepler main mission Montet & Si-
mon (2016) detected a decrease in the brightness of Boy-ajian’s Star of 8.4 mmag yr−1, in agreement with the rateof fading measured here given the uncertainties. In theKepler data, though, the decline was not consistentlylinear with time; Montet & Simon observed fading of3.7 ± 0.4 mmag yr−1 for the first 2.7 yr, followed bya rapid drop of nearly 2.5% over the next ∼ 6 months.With the shorter time span of the ASAS-SN data a purelylinear decrease is plausible, and modest departures fromlinearity would likely not be detectable given the pho-tometric uncertainties. We also note that the Keplerbandpass (Koch et al. 2010) is broader and redder thanthe ASAS-SN V filter. How this difference affects therelative decline rates depends on whether the fading ofBoyajian’s Star is chromatic or achromatic.
3.2. Comparison Samples
Although the change in brightness of Boyajian’s Starin the ASAS-SN data is statistically significant given theassumed errors and the observed scatter, ASAS-SN has
not previously been used to study very low amplitudevariability over timescales of years. We therefore mustconsider the possibility of systematic uncertainties thatcould affect our results. We investigate the accuracy ofthe ASAS-SN photometry and derived brightness trendswith various comparison samples.
3.2.1. Stars in the Same Field as Boyajian’s Star
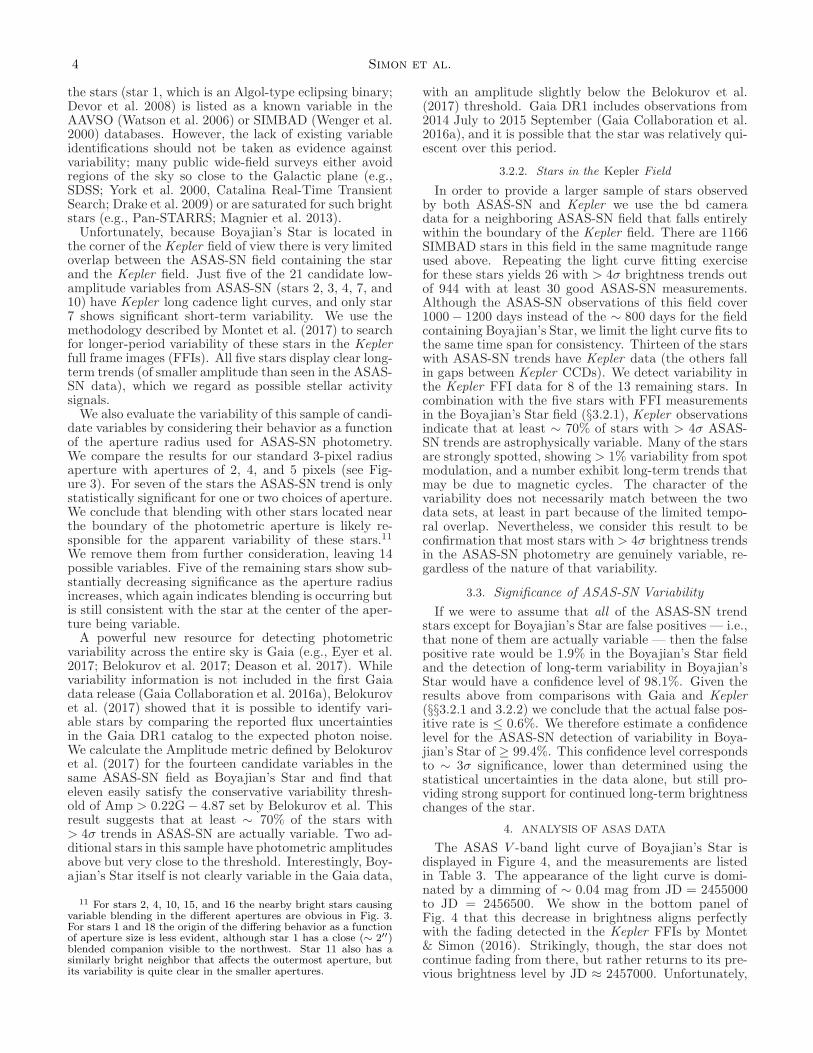
Our first comparison sample consists of 1124 starsin the SIMBAD database (Wenger et al. 2000) within∼ 0.5 mag of Boyajian’s Star (11.5 < V < 12.5) thatfall in the same ASAS-SN field and camera as Boyajian’sStar. There are at least 30 ASAS-SN measurements pass-ing our quality cuts (see §3.1) for 1078 of these stars. Wecarry out the same OLS fit described in §3.1 for thesestars, finding a total of 21 (in addition to Boyajian’s Star)that have best-fit linear trends detected at greater than4σ significance and a scatter around the trend of less than0.03 mag. The latter cut removes stars with large ampli-tude variability, of which there are 45 examples identifiedby visual examination of the ASAS-SN light curves andLomb-Scargle periodograms of the brightness measure-ments. These 21 stars (and Boyajian’s Star) are listed inTable 2 and their light curves are displayed in Figure 2.Unlike for Boyajian’s Star, a linear trend is clearly not asufficient description for the behavior of several of thesestars (e.g., stars 6, 9, and 22 in Table 2), but a simple lin-ear fit to the available ASAS-SN photometry should stillprovide a reasonable criterion for selecting variable stars.Finding 21 stars with > 4σ trends significantly exceedsthe number expected from random errors if the ASAS-SNphotometric noise is Gaussian. These stars could eitherbe previously unknown variables or be pointing to low-level systematic uncertainties in the data. Only one of
4 Simon et al.
the stars (star 1, which is an Algol-type eclipsing binary;Devor et al. 2008) is listed as a known variable in theAAVSO (Watson et al. 2006) or SIMBAD (Wenger et al.2000) databases. However, the lack of existing variableidentifications should not be taken as evidence againstvariability; many public wide-field surveys either avoidregions of the sky so close to the Galactic plane (e.g.,SDSS; York et al. 2000, Catalina Real-Time TransientSearch; Drake et al. 2009) or are saturated for such brightstars (e.g., Pan-STARRS; Magnier et al. 2013).Unfortunately, because Boyajian’s Star is located in
the corner of the Kepler field of view there is very limitedoverlap between the ASAS-SN field containing the starand the Kepler field. Just five of the 21 candidate low-amplitude variables from ASAS-SN (stars 2, 3, 4, 7, and10) have Kepler long cadence light curves, and only star7 shows significant short-term variability. We use themethodology described by Montet et al. (2017) to searchfor longer-period variability of these stars in the Keplerfull frame images (FFIs). All five stars display clear long-term trends (of smaller amplitude than seen in the ASAS-SN data), which we regard as possible stellar activitysignals.We also evaluate the variability of this sample of candi-
date variables by considering their behavior as a functionof the aperture radius used for ASAS-SN photometry.We compare the results for our standard 3-pixel radiusaperture with apertures of 2, 4, and 5 pixels (see Fig-ure 3). For seven of the stars the ASAS-SN trend is onlystatistically significant for one or two choices of aperture.We conclude that blending with other stars located nearthe boundary of the photometric aperture is likely re-sponsible for the apparent variability of these stars.11
We remove them from further consideration, leaving 14possible variables. Five of the remaining stars show sub-stantially decreasing significance as the aperture radiusincreases, which again indicates blending is occurring butis still consistent with the star at the center of the aper-ture being variable.A powerful new resource for detecting photometric
variability across the entire sky is Gaia (e.g., Eyer et al.2017; Belokurov et al. 2017; Deason et al. 2017). Whilevariability information is not included in the first Gaiadata release (Gaia Collaboration et al. 2016a), Belokurovet al. (2017) showed that it is possible to identify vari-able stars by comparing the reported flux uncertaintiesin the Gaia DR1 catalog to the expected photon noise.We calculate the Amplitude metric defined by Belokurovet al. (2017) for the fourteen candidate variables in thesame ASAS-SN field as Boyajian’s Star and find thateleven easily satisfy the conservative variability thresh-old of Amp > 0.22G− 4.87 set by Belokurov et al. Thisresult suggests that at least ∼ 70% of the stars with> 4σ trends in ASAS-SN are actually variable. Two ad-ditional stars in this sample have photometric amplitudesabove but very close to the threshold. Interestingly, Boy-ajian’s Star itself is not clearly variable in the Gaia data,
11 For stars 2, 4, 10, 15, and 16 the nearby bright stars causingvariable blending in the different apertures are obvious in Fig. 3.For stars 1 and 18 the origin of the differing behavior as a functionof aperture size is less evident, although star 1 has a close (∼ 2′′)blended companion visible to the northwest. Star 11 also has asimilarly bright neighbor that affects the outermost aperture, butits variability is quite clear in the smaller apertures.
with an amplitude slightly below the Belokurov et al.(2017) threshold. Gaia DR1 includes observations from2014 July to 2015 September (Gaia Collaboration et al.2016a), and it is possible that the star was relatively qui-escent over this period.
3.2.2. Stars in the Kepler Field
In order to provide a larger sample of stars observedby both ASAS-SN and Kepler we use the bd cameradata for a neighboring ASAS-SN field that falls entirelywithin the boundary of the Kepler field. There are 1166SIMBAD stars in this field in the same magnitude rangeused above. Repeating the light curve fitting exercisefor these stars yields 26 with > 4σ brightness trends outof 944 with at least 30 good ASAS-SN measurements.Although the ASAS-SN observations of this field cover1000− 1200 days instead of the ∼ 800 days for the fieldcontaining Boyajian’s Star, we limit the light curve fits tothe same time span for consistency. Thirteen of the starswith ASAS-SN trends have Kepler data (the others fallin gaps between Kepler CCDs). We detect variability inthe Kepler FFI data for 8 of the 13 remaining stars. Incombination with the five stars with FFI measurementsin the Boyajian’s Star field (§3.2.1), Kepler observationsindicate that at least ∼ 70% of stars with > 4σ ASAS-SN trends are astrophysically variable. Many of the starsare strongly spotted, showing > 1% variability from spotmodulation, and a number exhibit long-term trends thatmay be due to magnetic cycles. The character of thevariability does not necessarily match between the twodata sets, at least in part because of the limited tempo-ral overlap. Nevertheless, we consider this result to beconfirmation that most stars with > 4σ brightness trendsin the ASAS-SN photometry are genuinely variable, re-gardless of the nature of that variability.
3.3. Significance of ASAS-SN Variability
If we were to assume that all of the ASAS-SN trendstars except for Boyajian’s Star are false positives — i.e.,that none of them are actually variable — then the falsepositive rate would be 1.9% in the Boyajian’s Star fieldand the detection of long-term variability in Boyajian’sStar would have a confidence level of 98.1%. Given theresults above from comparisons with Gaia and Kepler(§§3.2.1 and 3.2.2) we conclude that the actual false pos-itive rate is ≤ 0.6%. We therefore estimate a confidencelevel for the ASAS-SN detection of variability in Boya-jian’s Star of ≥ 99.4%. This confidence level correspondsto ∼ 3σ significance, lower than determined using thestatistical uncertainties in the data alone, but still pro-viding strong support for continued long-term brightnesschanges of the star.
4. ANALYSIS OF ASAS DATA
The ASAS V -band light curve of Boyajian’s Star isdisplayed in Figure 4, and the measurements are listedin Table 3. The appearance of the light curve is domi-nated by a dimming of ∼ 0.04 mag from JD = 2455000to JD = 2456500. We show in the bottom panel ofFig. 4 that this decrease in brightness aligns perfectlywith the fading detected in the Kepler FFIs by Montet& Simon (2016). Strikingly, though, the star does notcontinue fading from there, but rather returns to its pre-vious brightness level by JD ≈ 2457000. Unfortunately,

The Long-Term Variability of Boyajian’s Star 5
Table 2ASAS-SN Stars With Significant Trends
Star ID V B − V V −K Brightness Change Scatter χ2red
mag mag mmag yr−1 mag
1 2MASS J19561361+4754336 11.24 0.32 0.41 7.0 ± 1.2 0.020 4.632 2MASS J19565077+4640323 11.89 1.28 2.97 5.8 ± 1.2 0.017 4.173 2MASS J19580634+4451368 11.91 0.79 1.68 7.9 ± 1.9 0.010 0.584 2MASS J19581189+4647467 12.26 0.42 1.61 7.0 ± 1.4 0.023 5.715 2MASS J19593688+4747076 11.55 1.72 3.82 6.9 ± 1.5 0.009 0.656 2MASS J20020960+4746492 12.19 0.83 1.72 16.2 ± 1.8 0.017 1.697 2MASS J20033923+4422217 12.15 0.55 1.39 −7.7 ± 1.6 0.013 1.188 2MASS J20035455+4648364 11.75 0.84 1.97 16.5 ± 1.5 0.009 0.939 2MASS J20040253+4642168 11.93 0.75 1.74 −13.2 ± 1.5 0.013 1.4610 2MASS J20041809+4447011 11.42 0.63 1.59 −5.8 ± 1.3 0.013 2.0211 2MASS J20061007+4401341 11.77 0.98 2.16 −14.9 ± 1.5 0.022 4.0812 2MASS J20061546+4427248 11.85 0.51 1.35 6.3 ± 1.4 0.011 1.0813 2MASS J20064866+4659378 11.82 0.63 1.54 −7.3 ± 1.4 0.009 0.9114 2MASS J20073354+4659506 12.28 0.75 1.79 9.2 ± 1.6 0.011 0.9515 2MASS J20082943+4551232 12.47 0.61 1.32 8.3 ± 1.7 0.021 3.3116 2MASS J20083571+4523531 12.15 0.54 1.05 6.7 ± 1.3 0.022 5.6117 2MASS J20110107+4602306 12.25 0.80 1.71 8.4 ± 1.6 0.013 1.2518 2MASS J20161906+4355334 12.27 1.35 3.29 −8.7 ± 1.7 0.015 1.5419 2MASS J20171235+4452419 12.12 0.68 1.86 −11.9 ± 1.6 0.024 4.5420 2MASS J20174565+4704085 11.83 0.69 1.94 9.7 ± 2.1 0.017 1.4421 2MASS J20180527+4621040 12.00 0.48 1.53 −18.5 ± 2.4 0.020 1.7422 2MASS J20181026+4518164 12.20 0.62 1.57 −35.2 ± 2.1 0.018 1.60
Note. — B and V magnitudes are taken from APASS (Henden & Munari 2014), with the exceptionof star 4, which is not included in the APASS DR9 catalog (presumably because of a nearby brighterstar). For that star we list Tycho-2 magnitudes (Høg et al. 2000). K magnitudes are taken from the2MASS point source catalog (Cutri et al. 2003).
Table 3ASAS Photometry of Boyajian’s
Star
HJD V ∆V[mag] [mag]
2453887.00345 11.928 0.0192453892.97057 11.922 0.0342453897.03348 11.937 0.0352453915.01509 11.923 0.0282453916.95754 11.940 0.0372453920.95091 11.955 0.0352453928.97449 11.941 0.0312453930.97710 11.922 0.0172453932.97819 11.918 0.0272453934.97840 11.932 0.057
Note. — This table is avail-able in its entirety in the elec-tronic edition of the journal. Aportion is reproduced here to pro-vide guidance on form and con-tent.
there are few ASAS measurements available in the in-tervening 1.5 yr to reveal exactly when and how thisbrightening took place, but its duration is constrainedto be . 200 d. From JD ≈ 2457100 (early 2015) to thepresent we measure a dimming rate of 15±6 mmag yr−1,consistent with the dimming seen in the ASAS-SN obser-vations at the ∼ 1.4σ level. The significance of the ASASfading over this time interval is lower than in ASAS-SNbecause of the larger photometric uncertainties and theslower observational cadence.At the beginning of the ASAS time series there is some
evidence of another brightening event, with the star’smagnitude changing from V = 11.93 at JD < 2454000 toV = 11.91 by JD = 2454500. In this case the brighteningappears to extend over∼ 200 d. Thus, rather than mono-
tonically fading as has been inferred from the photometryof Schaefer (2016) and Montet & Simon (2016), the starhas likely both brightened and dimmed measurably overthe last decade. This result does not necessarily contra-dict the century-long dimming seen by Schaefer (2016),which would only amount to 0.018 mag over the ASASbaseline. Variability at the level of a few percent ontimescales of a few years such as we measure in ASAS-SN and ASAS would not be detectable in the DASCHphotometry (Grindlay et al. 2009; Laycock et al. 2010)used by Schaefer (2016) given the much larger uncertain-ties in the photographic data.If we fit the entire ASAS light curve with a simple lin-
ear model as in §3.1, we derive an overall dimming rateof 3.6±0.4 mmag yr−1. This fading rate is nearly identi-cal to that measured by Montet & Simon (2016) over thefirst ∼ 1000 d of the Kepler mission. As discussed above,it is apparent from Fig. 4 that a simple linear model isnot a good description of the data for this longer timespan. However, the fact that the slope of the fit is signif-icantly different from zero provides further evidence forthe long-term photometric variability of Boyajian’s Star.The long-term dimming rate in ASAS over the dura-
tion of the Kepler observations is 15.8± 1.5 mmag yr−1,almost a factor of two larger than in the Montet & Simon(2016) Kepler measurements. Because the Kepler band-pass extends to significantly longer wavelengths than astandard V filter, this difference could be a sign that thedimming is weaker in the red (also see the Appendix). Ei-ther dust or a change in stellar temperature could causethe star to get redder as it dims.We also analyzed the same sample of 1124 stars of sim-
ilar brightness described in §3.2.1 using ASAS data. Ofthese stars, 1117 have at least 30 good ASAS measure-ments, and we find 85 stars with best-fit linear trendsdetected at greater than 4σ significance with a scatter

6 Simon et al.
Figure 2. ASAS-SN light curves of the 22 stars (out of 1124 total with 11.5 < V < 12.5) in the Boyajian’s Star ASAS-SN field observedwith the bd camera for which we detect brightness trends at > 4σ. The median magnitude of each star has been subtracted from allmeasurements for display purposes. Boyajian’s Star (star 12, 2MASS J20061546+4427248) is the fourth panel in the right-hand column.

The Long-Term Variability of Boyajian’s Star 7
Figure 3. Pan-STARRS1 r-band images (Chambers et al. 2016;Waters et al. 2016) of all stars in the Boyajian’s Star field withbrightness trends detected at > 4σ. Each image is 80′′ × 80′′,and the 2, 3, 4, and 5 ASAS-SN pixel photometric apertures aredisplayed as red circles. Note that the cores of most of these starsare saturated in the Pan-STARRS data. Boyajian’s Star (star 12)is shown in the fourth panel in the right-hand column.
around the trend of less than 0.05 mag (to allow for thelarger ASAS uncertainties for each measurement). Boy-ajian’s Star has the tenth most significant trend and theeleventh largest slope among this sample. Stars 2, 3, 5,6, 7, 19, 21, and 22 from Table 2 also exhibit > 4σ trendsin both the ASAS-SN and ASAS data sets, supportingthe identification of these stars as variable.Given that the ASAS data set covers the full time span
of the Kepler light curve of Boyajian’s Star, it is possiblethat there could be ground-based detections of some ofthe dips discovered by Boyajian et al. (2016). Figure 4shows that there are more ASAS outliers to fainter mag-nitudes than brighter ones, consistent with the possibilityof dipping activity. However, none of those data pointsmatch the times of the dips seen with Kepler. Thereis a near coincidence between the deep (16%) D800 dipand an ASAS measurement at HJD = 2455621.16839that is more than 2σ below the mean magnitude, butthe two are separated by more than 4 days and the Ke-pler dip was very short, so this ASAS measurement mustnot be accurate. Nevertheless, there may be genuinedips in the ASAS data at other times; most notablyat HJD ≈ 2454900 (immediately before Kepler obser-vations began) and in mid-2016 (HJD ≈ 2457600).Boyajian’s Star is detected as variable in the ASAS I-
band photometry as well, with a dimming rate of 4.6 ±0.4 mmag yr−1 from 2006 June to 2016 November. Thesequential brightening and fading that is evident in theV -band light curve is not obvious in I; in particular,there is no sign of the brightening between the 2009 −2013 Kepler observations and the 2015− present ASAS-SN measurements that is seen in V (see Figure 5).
5. DISCUSSION
The results of Schaefer (2016) and Montet & Simon(2016) have generally been assumed to indicate that thebrightness of Boyajian’s Star is monotonically decreas-ing with time. While the ASAS-SN measurements areconsistent with that picture, the longer time baseline af-forded by the ASAS data demonstrates that in fact thestar’s variability may be more complicated, with multi-ple slow dimming and brightening episodes over the pastdecade. This finding may have significant implicationsfor models to explain the behavior of the star.Published ideas to account for the unusual changes in
the brightness of Boyajian’s Star generally suffer fromone of two flaws: they are either statistically unlikely(e.g., Metzger et al. 2017) or they explain only one as-pect of the observed flux variations (e.g., Bodman &Quillen 2016; Makarov & Goldin 2016; Sheikh et al.2016; Neslusan & Budaj 2017; Ballesteros et al. 2017;Katz 2017). The hypotheses that can potentially ac-count for both the brief dips and the long-term vari-ability include the consumption of a planet (Metzgeret al. 2017), an internal obstruction of heat flux in thestar (Foukal 2017), or an intervening disk-bearing ob-ject (Wright & Sigurðsson 2016). In the first two cases,the proposed explanation relies on the star’s luminositymonotonically decreasing. If Boyajian’s Star also bright-ens at times then these models as presented may notbe viable. For the planetary merger hypothesis, minorbrightening events interrupting the long-term dimmingcould be the result of the star ingesting additional bodies.The collision of a moon-sized object with the star would

8 Simon et al.
Figure 4. (top) ASAS light curve of Boyajian’s Star from 2006 to present. (bottom) ASAS light curve with Kepler FFI light curve(red diamonds) from Montet & Simon (2016) and ASAS-SN light curve (blue circles) overlaid. The FFI light curve is uncalibrated, sowe applied a zero-point offset of 11.92 mag in order to match the ASAS magnitude at the beginning of the Kepler mission. For displaypurposes we also offset the ASAS-SN magnitudes by +0.01 mag to bring them into agreement with the ASAS magnitude in early 2015(HJD ∼ 2457100). The black tick marks near the top and bottom of the lower panel indicate the times of the strongest dips (> 2% fluxdecrement) seen by Kepler.
cause brightening of approximately the correct magni-tude (K. Shen & B. Metzger 2017, personal communica-tion). However, the Metzger et al. (2017) models indicatethat the brightening from such an event should occurvery quickly, which appears to be in conflict with theobserved duration of the 2006− 2007 brightening (§ 4).The most obvious culprit for long-term dimming and
brightening of Boyajian’s Star is a magnetic activity cy-cle. The two brightening episodes seen in the ASAS pho-tometry occur around JD = 2454000 and JD = 2456800,suggesting an ∼ 8 yr cycle length. If this brightening iscyclical (whether from stellar activity or otherwise) then
the star should brighten again near JD = 2459600 (2022January), with an uncertainty of a few months.The interpretation of the photometric variability as a
stellar cycle must confront the question of whether theamplitude, time scale, and even presence of magnetic ac-tivity in such a star has any precedent. In the compila-tion of stars tracked in Ca H&K activity indicators, Ege-land (2017) lists 28 stars with colors 0.5 < B−V < 0.6; ofthese, only 9 show cycles, ranging from “good” to “poor”quality. The mean (median) cycle period in this hot-starsample is ∼ 11.3 (10.0) years. Of the 19 stars withoutcycles, only 5 of them are “flat”, the rest showing vari-

The Long-Term Variability of Boyajian’s Star 9
Figure 5. (top) ASAS light curve of Boyajian’s Star, spanningfrom 2006 to present. The V -band data from Fig. 4, offset by−0.73 mag to match the median I-band magnitude, are displayedas open black squares and the I-band data are plotted as magentacircles.
ability or long-term trends. Mathur et al. (2014) noted apossible magnetic cycle with P > 1400 days and the sig-nature of differentially rotating spots in the seismicallywell-studied KIC 3733735, which is also a hot (∼ 6700 K)rapidly rotating (P = 2.5 days) early F-type star. Boya-jian’s Star shows similar photometric evolution over thecourse of the Kepler mission (see, e.g., Fig. 3 of Boya-jian et al. 2016). Moreover, the increase in short-termphotometric variability occurs simultaneously with theobserved decrease in the star’s brightness, similar to thecorrelation observed in Kepler observations of rapidlyrotating sun-like stars (Montet et al. 2017).12 AlthoughBoyajian’s Star is close to the boundary where we expectdeep surface convection zones (and thus magnetic activ-ity) to disappear, stellar models for stars of 6500−6700 Kat solar metallicity still have convection zones of order afew to 10% of their radii (van Saders & Pinsonneault2013) and Rossby numbers (as calculated in van Saderset al. 2016) generally less than 2.0 assuming a 0.88 d rota-tion period. It is unknown exactly when dynamo actionin such convection zones would cease (but see Metcalfe& van Saders 2017).Although the presence of magnetic activity and ob-
served cycle lengths do have some precedent, the photo-metric amplitude of the cycle is more puzzling. The lumi-nosity variations are much larger than seen for other sim-ilar stars (e.g., Montet & Simon 2016). In the Lockwoodet al. (2007) compilation of stars with both Ca H&K andphotometric monitoring, stars with B − V < 0.6 havelong-term variability that is typically less than ∼ 0.01mag in the Stromgren b and y filters. Moreover, mag-netic activity offers no explanation for the brief dips Boy-ajian’s Star undergoes.Another plausible, although perhaps less natural, ex-
planation for the ASAS variability is changing line-of-sight absorption by the interstellar medium (Wright &Sigurðsson 2016). The overall reddening inferred for the
12 This simultaneity presumes that the 0.88 d rotation signa-ture is from KIC 8462852, which the astrometric shifts detected byMakarov & Goldin (2016) suggest is not the case.
star is E(B−V) = 0.11±0.03 mag (Boyajian et al. 2016),so variations in the V-band extinction of ∼ 0.03 magare not impossible. However, while measurable changesin the ISM absorbing column on timescales of years areknown (e.g., Hobbs et al. 1982; Price et al. 2000; Welty &Fitzpatrick 2001; Smith et al. 2013; Galazutdinov et al.2013), detectable flux decrements from varying ISM ab-sorption are not, and lines of sight with the necessarysmall-scale structure to cause such changes are rare. Thisidea certainly cannot be ruled out at present, but themore complicated the photometric behavior of Boyajian’sStar becomes, the more contrived the ISM structure mustbe in order to explain it. Requiring large ISM densitycontrasts on spatial scales sufficiently small to accountfor the dips may run afoul of the argument by Lacki(2016) that the cause of the photometric anomalies mustbe surprisingly common in order for Kepler to have beenlikely to detect such a star. High-resolution monitoringof the Na D and K I absorption lines in the spectrum ofBoyajian’s Star over several years can provide a strongtest of this hypothesis.
6. SUMMARY AND CONCLUSIONS
We have used long-term survey observations of theKepler field by ASAS-SN and ASAS to investigate thebrightness of Boyajian’s Star from 2006 to 2017. Overthe past two years, we detect dimming in both surveys.With the higher-precision ASAS-SN photometry we mea-sure a decline rate of 6.3±1.4 mmag yr−1. Fading nearlyidentical to what we measure has been detected indepen-dently using observations from the Hereford Arizona Ob-servatory (B. Gary 2017, personal communication), andsimilar results have also just been reported by Meng et al.(2017). Prior to the beginning of ASAS-SN coverage ofthis location, ASAS shows that the star brightened in2014, faded as previously seen with Kepler from 2009-2013, and may have brightened in 2006. We thereforeconclude that the variability of Boyajian’s Star is likelynot monotonic as has been assumed until now.The existence of periods in which Boyajian’s Star
brightens noticeably and the possibility of cyclic variabil-ity significantly change the long-term photometric signa-ture that models of the star’s behavior have sought toexplain. Most published models aim to account for thebrief dips discovered by Boyajian et al. (2016) withoutaddressing the long-term dimming measured by Schae-fer (2016) and Montet & Simon (2016). The Metzgeret al. (2017) hypothesis that the star has recently con-sumed a planet predicts a strictly declining luminosityafter ∼ 1 yr past the merger, which does not appearto be consistent with the ASAS photometry, althoughmore complicated versions of this idea may not be ruledout. We examine whether the detected brightness varia-tions could be the result of stellar activity, but find thatexplanation to be unsatisfying because of the unusuallylarge amplitude of the variability and the difficulty ofaccounting for the brief dips with the same mechanism.Interstellar absorption could conceivably be responsiblefor both the dips and long-term flux variations, but onlywith unprecedented levels of small-scale ISM structure.Until the recent study by Meng et al. (2017), all detec-
tions of both the long-term dimming of Boyajian’s Starand the brief dips in brightness have relied on photom-etry in a single band (Schaefer 2016; Montet & Simon

10 Simon et al.
2016). Although we find that the ASAS I-band observa-tions indicate fading as well, the larger uncertainties ofthose measurements prevent us from confidently detect-ing any color changes in the star over the past decade.The key question of how all of the brightness changesobserved in Boyajian’s Star vary with wavelength there-fore remains unanswered. We strongly encourage high-precision multi-year monitoring efforts in multiple pho-tometric bands that will be sensitive enough to detectchanges in the star’s brightness of 1 − 2%. Multi-colorimaging obtained over the time interval when Boyajian’sStar will be observed by the TESS mission (Ricker et al.2014) would be particularly valuable. The Zwicky Tran-sient Facility (Bellm & Kulkarni 2017) and the Gaiasatellite (Gaia Collaboration et al. 2016b) offer two pos-sible avenues for pursuing a long-term, well-calibratedmonitoring program covering a range of wavelengths, butthe results presented here demonstrate that smaller-scalesurveys are capable of achieving the required accuracy aswell.
We thank Jason Wright, Ken Shen, Brian Metzger,Tabby Boyajian, Bruce Gary, Ryan Oelkers, Rob Siverd,Johanna Teske, Eddie Schlafly, and Jim Davenport forhelpful conversations, and Huan Meng and collaboratorsfor sharing a draft of their paper prior to publication.This research has made use of NASA’s Astrophysics
Data System Bibliographic Services and the SIMBADdatabase, operated at CDS, Strasbourg, France. Thisresearch also made use of the International Variable StarIndex (VSX) database, operated at AAVSO, Cambridge,Massachusetts, USA.We thank the Las Cumbres Observatory and its staff
for its continuing support of the ASAS-SN project.ASAS-SN is supported by the Gordon and Betty MooreFoundation through grant GBMF5490 to the Ohio StateUniversity and NSF grant AST-1515927. Developmentof ASAS-SN has been supported by NSF grant AST-0908816, the Mt. Cuba Astronomical Foundation, theCenter for Cosmology and AstroParticle Physics at the
Ohio State University, the Chinese Academy of SciencesSouth America Center for Astronomy (CASSACA), theVillum Foundation and George Skestos.BJS is supported by NASA through Hubble Fellowship
grant HST-HF-51348.001 awarded by the Space Tele-scope Science Institute, which is operated by the Associ-ation of Universities for Research in Astronomy, Inc., forNASA, under contract NAS 5-26555. Work by BTM wasperformed under contract with the California Institute ofTechnology/Jet Propulsion Laboratory funded by NASAthrough the Sagan Fellowship Program executed by theNASA Exoplanet Science Institute. CSK is supported byNSF grants AST-1515927 and AST-1515876. TW-SH issupported by the DOE Computational Science GraduateFellowship, grant number DE-FG02-97ER25308.This research was made possible through the use of the
AAVSO Photometric All-Sky Survey (APASS), fundedby the Robert Martin Ayers Sciences Fund. APASS isalso supported by NSF grant AST-1412587. This re-search has made use of data provided by Astrometry.net(Lang et al. 2010).The Pan-STARRS1 Surveys (PS1) and the PS1 public
science archive have been made possible through con-tributions by the Institute for Astronomy, the Univer-sity of Hawaii, the Pan-STARRS Project Office, theMax-Planck Society and its participating institutes, theMax Planck Institute for Astronomy, Heidelberg andthe Max Planck Institute for Extraterrestrial Physics,Garching, The Johns Hopkins University, Durham Uni-versity, the University of Edinburgh, the Queen’s Uni-versity Belfast, the Harvard-Smithsonian Center for As-trophysics, the Las Cumbres Observatory Global Tele-scope Network Incorporated, the National Central Uni-versity of Taiwan, the Space Telescope Science Institute,the National Aeronautics and Space Administration un-der Grant No. NNX08AR22G issued through the Plan-etary Science Division of the NASA Science Mission Di-rectorate, the National Science Foundation Grant No.AST-1238877, the University of Maryland, Eotvos Lo-rand University (ELTE), the Los Alamos National Lab-oratory, and the Gordon and Betty Moore Foundation.Facilities: ASAS-SN, ASAS
APPENDIX
EXISTING MULTICOLOR PHOTOMETRY OF BOYAJIAN’S STAR
The color dependence of the variability of Boyajian’s Star would provide a critical clue to the origin of the dimmingon both short and long timescales. If light from the star is being obscured by dust, it would get redder as it dims,while if the light is being blocked by macroscopic objects such as rocky collisional debris (e.g., Boyajian et al. 2016) orartificial structures (Wright et al. 2016) then the dimming would be independent of wavelength. In order to explorewhether any changes in the color of the star can be detected in existing data, we collect all available optical photometryfrom the literature and public catalogs in Table 4. Unfortunately, there are significant disagreements between differentreferences, especially in B and V , where the total range of the reported magnitudes is more than 0.25 mag. The B−Vcolors, though, are generally consistent. The largest outliers in these bands are the Kepler INT Survey (Greiss et al.2012a,b) and Boyajian et al. (2016). Since the magnitude discrepancies are much larger than the amplitude of theV -band variability presented in §§ 3 and 4, we suspect that they result from inconsistent calibrations or magnitudesystems rather than astrophysical changes.Of the first five data sets listed in Table 4, only APASS offers any time resolution, with four measurements in each
band during 2010 June and a single observation in 2012 October, spanning the rapid decrease in the brightness ofBoyajian’s Star detected by Montet & Simon (2016). Averaging the 2010 measurements together, we find dimmingof 0.35 mag in B, 0.11 mag in V , 0.13 mag in g, 0.06 mag in r, and 0.16 mag in i from 2010 to 2012. Based on theoverall uncertainties for each band listed in Table 4, we assume that each APASS magnitude has an uncertainty of∼ 0.05 mag, so the uncertainties on the magnitude differences should be ∼ 0.07 mag. This V and g dimming is largerthan what we measure with ASAS by ∼ 1σ. Although the decrease in brightness in B seems anomalously large relative

The Long-Term Variability of Boyajian’s Star 11
Table 4Photometry of Boyajian’s Star
Source U B V I g r i ObservationDate
Tycho-2a ... 12.80 ± 0.25b 12.02 ± 0.22b ... ... ... ... 1989-1993APASSc ... 12.36 ± 0.04 11.85 ± 0.05 ... 12.05 ± 0.05 11.70 ± 0.06 11.55 ± 0.04 2010-2012Kepler UBV Surveyd 12.58 ± 0.02 12.49 ± 0.02 11.96 ± 0.02 ... ... ... ... 2011Kepler INT Survey 12.68 ± 0.11e 12.57 ± 0.09e 11.75 ± 0.07e 10.91 ± 0.11e 12.17 ± 0.06f 11.46 ± 0.12f 11.47 ± 0.10f 2012WTFg ... 12.26 ± 0.01 11.71 ± 0.02 11.05 ± 0.10 ... ... ... 2014ASAS-SN ... ... 11.91 ± 0.01 ... ... ... ... 2015-2017ASAS ... ... 11.93 ± 0.03 11.20 ± 0.03 ... ... ... 2006-2017
a Høg et al. (2000).b Converted from BT and VT magnitudes using the transformation equations given at https://heasarc.nasa.gov/W3Browse/all/tycho2.html.c Henden & Munari (2014).d Everett et al. (2012).e Converted from the SDSS magnitudes in this row using the equations derived by Jordi et al. (2006). For U and B Jordi et al. provide two equations,and we take the average result of the two.f Converted from the INT/WFC Vega magnitudes reported by Greiss et al. (2012a,b) to SDSS AB magnitudes by inverting the transformationequations given by Gonzalez-Solares et al. (2011). The uncertainties reported by Greiss et al. (2012b) appear to be unrealistically small (0.001 mag),so we adopt the rms of each magnitude as its uncertainty.g Boyajian et al. (2016).
to the other filters for RV = 3.1 dust, the APASS data provide some evidence that Boyajian’s Star reddened duringthe course of the rapid dimming event in early 2012.
REFERENCES
Akritas, M. G., & Bershady, M. A. 1996, ApJ, 470, 706Alencar, S. H. P., Teixeira, P. S., Guimaraes, M. M., et al. 2010,
A&A, 519, A88Ballesteros, F. J., Arnalte-Mur, P., Fernandez-Soto, A., &
Martinez, V. J. 2017, MNRAS, in press, arXiv:1705.08427Bellm, E., & Kulkarni, S. 2017, Nature Astronomy, 1, 0071Belokurov, V., Erkal, D., Deason, A. J., et al. 2017, MNRAS, 466,
4711Bodman, E. H. L., & Quillen, A. 2016, ApJ, 819, L34Boyajian, T., Croft, S., Wright, J., et al. 2017, The Astronomer’s
Telegram, No. 10405, 405Boyajian, T. S., LaCourse, D. M., Rappaport, S. A., et al. 2016,
MNRAS, 457, 3988Chambers, K. C., Magnier, E. A., Metcalfe, N., et al. 2016, ArXiv
e-prints, arXiv:1612.05560Cody, A. M., Stauffer, J., Baglin, A., et al. 2014, AJ, 147, 82Cutri, R. M., Skrutskie, M. F., van Dyk, S., et al. 2003, 2MASS
All Sky Catalog of point sources.Deason, A. J., Belokurov, V., Erkal, D., Koposov, S. E., &
Mackey, D. 2017, MNRAS, 467, 2636Devor, J., Charbonneau, D., O’Donovan, F. T., Mandushev, G.,
& Torres, G. 2008, AJ, 135, 850Drake, A. J., Djorgovski, S. G., Mahabal, A., et al. 2009, ApJ,
696, 870Egeland, R. 2017, PhD thesis, Montana State University,
Bozeman, Montana, USAEverett, M. E., Howell, S. B., & Kinemuchi, K. 2012, PASP, 124,
316Eyer, L., Mowlavi, N., Evans, D. W., et al. 2017, submitted to
A&A, arXiv:1702.03295Foukal, P. 2017, ApJ, 842, L3Gaia Collaboration, Brown, A. G. A., Vallenari, A., et al. 2016a,
A&A, 595, A2Gaia Collaboration, Prusti, T., de Bruijne, J. H. J., et al. 2016b,
A&A, 595, A1Galazutdinov, G., Kre lowski, J., Beletsky, Y., & Valyavin, G.
2013, PASP, 125, 1329Gonzalez-Solares, E. A., Irwin, M., McMahon, R. G., et al. 2011,
MNRAS, 416, 927Greiss, S., Steeghs, D., Gansicke, B. T., et al. 2012a, AJ, 144, 24Greiss, S., Steeghs, D. T. H., Gansicke, B. T., et al. 2012b, ArXiv
e-prints, arXiv:1212.3613Grindlay, J., Tang, S., Simcoe, R., et al. 2009, in Astronomical
Society of the Pacific Conference Series, Vol. 410, PreservingAstronomy’s Photographic Legacy: Current State and theFuture of North American Astronomical Plates, ed. W. Osborn& L. Robbins, 101
Henden, A., & Munari, U. 2014, Contributions of theAstronomical Observatory Skalnate Pleso, 43, 518
Henden, A. A., Levine, S. E., Terrell, D., Smith, T. C., & Welch,D. 2012, Journal of the American Association of Variable StarObservers (JAAVSO), 40, 430
Hippke, M., Angerhausen, D., Lund, M. B., Pepper, J., &Stassun, K. G. 2016, ApJ, 825, 73
Hippke, M., Kroll, P., Matthai, F., et al. 2017, ApJ, 837, 85Hobbs, L. M., Wallerstein, G., & Hu, E. M. 1982, ApJ, 252, L17Høg, E., Fabricius, C., Makarov, V. V., et al. 2000, A&A, 355, L27Hogg, D. W., Bovy, J., & Lang, D. 2010, ArXiv e-prints,
arXiv:1008.4686Jordi, K., Grebel, E. K., & Ammon, K. 2006, A&A, 460, 339Katz, J. I. 2017, ArXiv e-prints, arXiv:1705.08377Kelly, B. C. 2007, ApJ, 665, 1489Koch, D. G., Borucki, W. J., Basri, G., et al. 2010, ApJ, 713, L79Kochanek, C. S., Shappee, B. J., Stanek, K. Z., et al. 2017,
submitted to PASP, arXiv:1706.07060Lacki, B. C. 2016, ArXiv e-prints, arXiv:1610.03219Lang, D., Hogg, D. W., Mierle, K., Blanton, M., & Roweis, S.
2010, AJ, 139, 1782Laycock, S., Tang, S., Grindlay, J., et al. 2010, AJ, 140, 1062Lisse, C. M., Sitko, M. L., & Marengo, M. 2015, ApJ, 815, L27Lockwood, G. W., Skiff, B. A., Henry, G. W., et al. 2007, ApJS,
171, 260Magnier, E. A., Schlafly, E., Finkbeiner, D., et al. 2013, ApJS,
205, 20Makarov, V. V., & Goldin, A. 2016, ApJ, 833, 78Marengo, M., Hulsebus, A., & Willis, S. 2015, ApJ, 814, L15Mathur, S., Garcıa, R. A., Ballot, J., et al. 2014, A&A, 562, A124Meng, H. Y. A., Rieke, G., Dubois, F., et al. 2017, ApJ, in pressMetcalfe, T. S., & van Saders, J. 2017, Sol. Phys., in press,
arXiv:1705.09668Metzger, B. D., Shen, K. J., & Stone, N. 2017, MNRAS, 468, 4399Montet, B. T., & Simon, J. D. 2016, ApJ, 830, L39Montet, B. T., Tovar, G., & Foreman-Mackey, D. 2017, submitted
to AAS Journals, arXiv:1705.07928Morales-Calderon, M., Stauffer, J. R., Hillenbrand, L. A., et al.
2011, ApJ, 733, 50Neslusan, L., & Budaj, J. 2017, A&A, 600, A86Pojmanski, G. 2002, Acta Astronomica, 52, 397Price, R. J., Crawford, I. A., & Barlow, M. J. 2000, MNRAS, 312,
L43Ricker, G. R., Winn, J. N., Vanderspek, R., et al. 2014, in
Proc. SPIE, Vol. 9143, Space Telescopes and Instrumentation2014: Optical, Infrared, and Millimeter Wave, 914320
Schaefer, B. E. 2016, ApJ, 822, L34Shappee, B. J., Prieto, J. L., Grupe, D., et al. 2014, ApJ, 788, 48

12 Simon et al.
Sheikh, M. A., Weaver, R. L., & Dahmen, K. A. 2016, PhysicalReview Letters, 117, 261101
Smith, K. T., Fossey, S. J., Cordiner, M. A., et al. 2013, MNRAS,429, 939
Thompson, M. A., Scicluna, P., Kemper, F., et al. 2016, MNRAS,458, L39
van Saders, J. L., Ceillier, T., Metcalfe, T. S., et al. 2016, Nature,529, 181
van Saders, J. L., & Pinsonneault, M. H. 2013, ApJ, 776, 67
Waters, C. Z., Magnier, E. A., Price, P. A., et al. 2016, ArXive-prints, arXiv:1612.05245
Watson, C. L., Henden, A. A., & Price, A. 2006, Society forAstronomical Sciences Annual Symposium, 25, 47
Welty, D. E., & Fitzpatrick, E. L. 2001, ApJ, 551, L175Wenger, M., Ochsenbein, F., Egret, D., et al. 2000, A&AS, 143, 9Wright, J. T., Cartier, K. M. S., Zhao, M., Jontof-Hutter, D., &
Ford, E. B. 2016, ApJ, 816, 17Wright, J. T., & Sigurðsson, S. 2016, ApJ, 829, L3York, D. G., Adelman, J., Anderson, Jr., J. E., et al. 2000, AJ,
120, 1579

![SpitzerSpaceTele- arXiv:0910.1614v1 [astro-ph.CO] 8 Oct 2009 · Preprinttypesetusing LATEX style emulateapjv. 08/22/09 THE MID-INFRARED CONTINUA OF SEYFERT GALAXIES Rajesh. P. Deo](https://img.dokumen.tips/doc/110x75/6027d69f15db9a75517b12ec/spitzerspacetele-arxiv09101614v1-astro-phco-8-oct-2009-preprinttypesetusing.jpg)
![arXiv:1009.1856v1 [astro-ph.CO] 9 Sep 2010 · arXiv:1009.1856v1 [astro-ph.CO] 9 Sep 2010 Draftversion April 22,2017 Preprinttypesetusing LATEX style emulateapjv. 5/25/10 THE SOFT](https://img.dokumen.tips/doc/110x75/60637f74d67bc0172f72a3b2/arxiv10091856v1-astro-phco-9-sep-2010-arxiv10091856v1-astro-phco-9-sep.jpg)
![arXiv:1409.0058v1 [astro-ph.GA] 29 Aug 2014 · 2019. 8. 31. · arXiv:1409.0058v1 [astro-ph.GA] 29 Aug 2014 Draft version September 2, 2014 Preprinttypesetusing LATEX style emulateapjv](https://img.dokumen.tips/doc/110x75/611012c0080dd90d160c3bc0/arxiv14090058v1-astro-phga-29-aug-2014-2019-8-31-arxiv14090058v1-astro-phga.jpg)
![ATEX style emulateapjv. 10/09/06 · arXiv:0709.3687v2 [astro-ph] 18 Dec 2007 accepted byThe Astrophysical Journal Preprinttypesetusing LATEX style emulateapjv. 10/09/06 NONLINEAR](https://img.dokumen.tips/doc/110x75/5f6f93811c1bfd092d00f40e/atex-style-emulateapjv-100906-arxiv07093687v2-astro-ph-18-dec-2007-accepted.jpg)

![ATEX style emulateapjv. 11/10/09 · arXiv:1305.6686v1 [astro-ph.IM] 29 May 2013 Draftversion September18,2018 Preprinttypesetusing LATEX style emulateapjv. 11/10/09 HIGH PERFORMANCE](https://img.dokumen.tips/doc/110x75/5fd0a5433434e05f534263dd/atex-style-emulateapjv-111009-arxiv13056686v1-astro-phim-29-may-2013-draftversion.jpg)
![ATEX style emulateapjv. 08/22/09 - arXiv · 2012-06-25 · arXiv:1204.3552v2 [astro-ph.GA] 22 Jun 2012 ToAppear in ARAA, vol. 50 Preprinttypesetusing LATEX style emulateapjv. 08/22/09](https://img.dokumen.tips/doc/110x75/5e8ad2f69bccf9432a5bd201/atex-style-emulateapjv-082209-arxiv-2012-06-25-arxiv12043552v2-astro-phga.jpg)
![Draft version August 15, 2018 arXiv:1301.3805v1 [astro-ph ... · arXiv:1301.3805v1 [astro-ph.GA] 16 Jan 2013 Draft version August 15, 2018 Preprinttypesetusing LATEX style emulateapjv](https://img.dokumen.tips/doc/110x75/5e1e42c1b3907d6d2731967b/draft-version-august-15-2018-arxiv13013805v1-astro-ph-arxiv13013805v1.jpg)


![arXiv:1603.01617v1 [astro-ph.GA] 4 Mar 2016 · 2018. 9. 28. · arXiv:1603.01617v1 [astro-ph.GA] 4 Mar 2016 Draft version April 6, 2018 Preprinttypesetusing LATEX style emulateapjv](https://img.dokumen.tips/doc/110x75/60e9dc87a4487475a344fbd6/arxiv160301617v1-astro-phga-4-mar-2016-2018-9-28-arxiv160301617v1-astro-phga.jpg)

![arXiv:1007.3740v1 [astro-ph.CO] 21 Jul 2010 · 2014-01-01 · arXiv:1007.3740v1 [astro-ph.CO] 21 Jul 2010 Draftversion January1,2014 Preprinttypesetusing LATEX style emulateapjv](https://img.dokumen.tips/doc/110x75/5e461dd8b62871105c58e703/arxiv10073740v1-astro-phco-21-jul-2010-2014-01-01-arxiv10073740v1-astro-phco.jpg)

![ATEX style emulateapjv. 5/2/11 - arXiv · 2018-10-18 · arXiv:1305.1703v1 [astro-ph.IM] 8 May 2013 Draftversion October 16,2018 Preprinttypesetusing LATEX style emulateapjv. 5/2/11](https://img.dokumen.tips/doc/110x75/5f0b2b747e708231d42f310d/atex-style-emulateapjv-5211-arxiv-2018-10-18-arxiv13051703v1-astro-phim.jpg)


![arXiv:0909.2043v1 [astro-ph.EP] 11 Sep 2009 · arXiv:0909.2043v1 [astro-ph.EP] 11 Sep 2009 SubmittedtoApJ Preprinttypesetusing LATEX style emulateapjv. 04/20/08 MODELS OF NEPTUNE-MASS](https://img.dokumen.tips/doc/110x75/5f1d80dc527e564aa570eabd/arxiv09092043v1-astro-phep-11-sep-2009-arxiv09092043v1-astro-phep-11-sep.jpg)