Embed Size (px)
Citation preview

� � �� �APENDIX I – 2014 Cycle 303(d) List
Evaluation and Strategic Planning Area
Puerto Rico Environmental Quality Board

�� � � � �� � � � � � � � � �� � � � � � � � �� � � � � �� � � � � � � �
� � � � �
Table 53: Size of waters Impaired by Causes all cycles (Monitored Miles for Rivers and Streams) Causes of Impairments Size of Waters Impaired (Miles)
Pesticides (0200) 495.5 Surfactants (0400) 979.4 Arsenic (0510) 978.4 Cadmium (0520) 72.3 Copper (0530) 1,177.6 Lead (0550) 827.9 Mercury (0560) 208.5 Selenium (0570) 22.0 Ammonia (0600) 74.6 Cyanide (0720) 3,007.9 Others Inorganic (0800) 22.0 Phosphorus (0910) 195.4 Nitrate + Nitrite (0990) 15.0 pH (1000) 352.9 Low Dissolved Oxygen (1200) 1,518.1 Thermal Modifications (1400) 320.9 Fecal Coliforms (1700) 13.9 Total Coliforms (1700) 1,158.3 Turbidity (2500) 2,564.9 Silver (no code) 14.6

� ! " #$ % &' $ ( ) * + , ) - . / 01 2 3 , ) , . 3 0 4 2 # ! 5 "1 # ! 3 % ! 6 $ " #7 * 89 7
Table 54: 2014 Cycle 303(d) List – List of Rivers and Streams Note: The 2014 303(d) List is comprised of the causes of impairments included in assessment cycles 2014, 2012, 2010, 2008 and 2006.
Basin Waterbody Name Waterbody Size (Miles)
Class
2014 Monitoring
Stations NS = Network SPD = Special
Project Delisting ED = External
Data
Designated Uses and Categories Summary
Notes Potential Pollution Sources
Causes of Impairment (Assessment Cycles)
R1 R2 AL DW 2014 2012 2010 2008
2006 Parameter in italic and color noncompliance in 2004, but compliance
in 2006
RIO GUAJATACA
RIO GUAJATACA PRNR3A1
9.9 SD NS 50011400
5 5 5 1 Confined Animal Feeding Operations (1640) Landfills (6300) Minor Industrial Point Source (0120) Onsite Wastewater Systems (6500)
Fecal Coliforms (1700)
Fecal Coliforms (1700)
Cyanide (0720) Fecal Coliforms (1700)
Cyanide (0720)
RIO GUAJATACA PRNR3A2
22 SD NS 50010500 50010600
ED
PR13059
4a 4a 5 1 H, P Agriculture (1300) Collection System Failure (0500) Confined Animal Feeding Operations (1640) Major Municipal Point Source (0210) Minor Industrial Point Source (0120) Onsite Wastewater Systems (6500) Urban Runoff/Storm Sewers (4000)
Cyanide (0720)
Cyanide (0720)
QUEBRADA LAS SEQUIAS PRNQ3B
3.5 SD SPD - 50011390
4a 4a 5 5 E, H, L, O
Confined Animal Feeding Operations (1640) Onsite Wastewater Systems (6500)
Arsenic (0510) Cyanide (0720) Low Dissolved Oxygen (1200)

� ! " #$ % &' $ ( ) * + , ) - . / 01 2 3 , ) , . 3 0 4 2 # ! 5 "1 # ! 3 % ! 6 $ " #7 * : ) 7
Table 54: 2014 Cycle 303(d) List – List of Rivers and Streams Note: The 2014 303(d) List is comprised of the causes of impairments included in assessment cycles 2014, 2012, 2010, 2008 and 2006.
Basin Waterbody Name Waterbody Size (Miles)
Class
2014 Monitoring
Stations NS = Network SPD = Special
Project Delisting ED = External
Data
Designated Uses and Categories Summary
Notes Potential Pollution Sources
Causes of Impairment (Assessment Cycles)
R1 R2 AL DW 2014 2012 2010 2008
2006 Parameter in italic and color noncompliance in 2004, but compliance
in 2006
RIO GRANDE DE ARECIBO
RIO GRANDE DE ARECIBO PRNR7A1
22.4 SD NS 50027250 50029000
4a 4a 5 5 N Agriculture (1300) Collection System Failure (0500) Confined Animal Feeding Operations (1640) Major Industrial Point Source (0110) Onsite Wastewater Systems (6500) Urban Runoff/Storm Sewers (4000)
Low Dissolved Oxygen (1200) Turbidity (2500)
Copper (0530) Turbidity (2500)
Low Dissolved Oxygen (1200) Turbidity (2500)
Cyanide (0720) Low Dissolved Oxygen (1200)
Cyanide (0720) Low Dissolved Oxygen (1200) Turbidity (2500)
RIO GRANDE DE ARECIBO PRNR7A2
122.8 SD NS 50025000
ED
PR13020 PR13020R PR13020D
5 5 5 5 N, P Agriculture (1300) Collection System Failure (0500) Confined Animal Feeding Operations (1640) Landfills (6300) Minor Industrial Point Source (0120) Onsite Wastewater Systems (6500) Urban Runoff/Storm Sewers (4000)
Copper (0530) Lead (0550) Total Coliforms (1700) Turbidity (2500)
Turbidity (2500)
Cyanide (0720) Pesticides (0200) Turbidity (2500)
Cyanide (0720)

� ! " #$ % &' $ ( ) * + , ) - . / 01 2 3 , ) , . 3 0 4 2 # ! 5 "1 # ! 3 % ! 6 $ " #7 * : * 7
Table 54: 2014 Cycle 303(d) List – List of Rivers and Streams Note: The 2014 303(d) List is comprised of the causes of impairments included in assessment cycles 2014, 2012, 2010, 2008 and 2006.
Basin Waterbody Name Waterbody Size (Miles)
Class
2014 Monitoring
Stations NS = Network SPD = Special
Project Delisting ED = External
Data
Designated Uses and Categories Summary
Notes Potential Pollution Sources
Causes of Impairment (Assessment Cycles)
R1 R2 AL DW 2014 2012 2010 2008
2006 Parameter in italic and color noncompliance in 2004, but compliance
in 2006
TUNEL PRNR7A3
28.9 SD NS 50020500
ED
PR13074 PR13094
4a 4a 5 1
N, P Agriculture (1300) Collection System Failure (0500) Confined Animal Feeding Operations (1640) Minor Industrial Point Source (0120) Minor Municipal Point Source (0220) Onsite Wastewater Systems (6500) Urban Runoff/Storm Sewers (4000)
Cyanide (0720) Cyanide (0720)
RIO CAONILLAS PRNR7C1
87 SD NS 50026000
ED
PR13012
4a 4a 5 5 N, P Agriculture (1300) Collection System Failure (0500) Confined Animal Feeding Operations (1640) Landfills (6300) Minor Industrial Point Source (0120) Onsite Wastewater Systems (6500) Surface Mining (5100) Urban Runoff/Storm Sewers (4000)
Arsenic (0510) Cyanide (0720) Arsenic (0510) Cyanide (0720)

� ! " #$ % &' $ ( ) * + , ) - . / 01 2 3 , ) , . 3 0 4 2 # ! 5 "1 # ! 3 % ! 6 $ " #7 * : ( 7
Table 54: 2014 Cycle 303(d) List – List of Rivers and Streams Note: The 2014 303(d) List is comprised of the causes of impairments included in assessment cycles 2014, 2012, 2010, 2008 and 2006.
Basin Waterbody Name Waterbody Size (Miles)
Class
2014 Monitoring
Stations NS = Network SPD = Special
Project Delisting ED = External
Data
Designated Uses and Categories Summary
Notes Potential Pollution Sources
Causes of Impairment (Assessment Cycles)
R1 R2 AL DW 2014 2012 2010 2008
2006 Parameter in italic and color noncompliance in 2004, but compliance
in 2006
RIO TANAMA PRNR7B2
43.5 SD NS 50028000
4a 4a 5 5 N Agriculture (1300) Minor Industrial Point Source (0120) Onsite Wastewater Systems (6500)
Turbidity (2500)
Turbidity (2500)
Cyanide (0720) Turbidity (2500)
Cyanide (0720)
RIO GRANDE DE MANATÍ
RIO GRANDE DE MANATÍ PRNR8A1
31 SD NS 50038100
4a 4a 5 5 N Collection System Failure (0500) Confined Animal Feeding Operations (1640) Landfills (6300) Major Municipal Point Source (0210) Onsite Wastewater Systems (6500) Urban Runoff/Storm Sewers (4000)
Turbidity (2500)
Copper (0530) Turbidity (2500)
Turbidity (2500)
Copper (0530) Turbidity (2500) Cyanide (0720)
Turbidity (2500) Cyanide (0720)
RIO GRANDE DE MANATÍ PRNR8A2
38.1 SD NS 50031200 50035500
ED
PR13014
4a 4a 5 5 N, P Collection System Failure (0500) Confined Animal Feeding Operations (1640) Landfills (6300) Onsite Wastewater Systems (6500) Urban Runoff/Storm Sewers (4000)
Turbidity (2500)
Turbidity (2500)
Turbidity (2500)
Cyanide (0720) Turbidity (2500)
Cyanide (0720) Turbidity (2500)

� ! " #$ % &' $ ( ) * + , ) - . / 01 2 3 , ) , . 3 0 4 2 # ! 5 "1 # ! 3 % ! 6 $ " #7 * : , 7
Table 54: 2014 Cycle 303(d) List – List of Rivers and Streams Note: The 2014 303(d) List is comprised of the causes of impairments included in assessment cycles 2014, 2012, 2010, 2008 and 2006.
Basin Waterbody Name Waterbody Size (Miles)
Class
2014 Monitoring
Stations NS = Network SPD = Special
Project Delisting ED = External
Data
Designated Uses and Categories Summary
Notes Potential Pollution Sources
Causes of Impairment (Assessment Cycles)
R1 R2 AL DW 2014 2012 2010 2008
2006 Parameter in italic and color noncompliance in 2004, but compliance
in 2006
RIO GRANDE DE MANATÍ PRNR8A3
27 SD SPD – 50030130
ED
PR13062
4a 4a 5 5 D, N, P
Confined Animal Feeding Operations (1640) Landfills (6300) Minor Industrial Point Source (0120) Onsite Wastewater Systems (6500)
Arsenic (0510) Turbidity (2500)
Arsenic (0510) Copper (0530) Cyanide (0720) Surfactants (0400) Turbidity (2500)
RIO CIALITO PRNR8B
25.8 SD NS 50035950
5 5 5 5 N Agriculture (1300) Collection System Failure (0500) Confined Animal Feeding Operations (1640) Minor Industrial Point Source (0120) Onsite Wastewater Systems (6500) Urban Runoff/Storm Sewers (4000)
Total Coliforms (1700) Turbidity (2500)
Turbidity (2500)
Turbidity (2500)
Cyanide (0720) Cyanide (0720)

� ! " #$ % &' $ ( ) * + , ) - . / 01 2 3 , ) , . 3 0 4 2 # ! 5 "1 # ! 3 % ! 6 $ " #7 * : + 7
Table 54: 2014 Cycle 303(d) List – List of Rivers and Streams Note: The 2014 303(d) List is comprised of the causes of impairments included in assessment cycles 2014, 2012, 2010, 2008 and 2006.
Basin Waterbody Name Waterbody Size (Miles)
Class
2014 Monitoring
Stations NS = Network SPD = Special
Project Delisting ED = External
Data
Designated Uses and Categories Summary
Notes Potential Pollution Sources
Causes of Impairment (Assessment Cycles)
R1 R2 AL DW 2014 2012 2010 2008
2006 Parameter in italic and color noncompliance in 2004, but compliance
in 2006
RIO TORO NEGRO PRNR8C1
41.5 SD SPD - 50033200
4a 4a 5 5 D, N Agriculture (1300) Confined Animal Feeding Operations (1640) Minor Industrial Point Source (0120) Onsite Wastewater Systems (6500) Package Plant (Small Flows) (0230)
Arsenic (0510) Copper (0530)
Arsenic (0510) Cyanide (0720) Turbidity (2500)
RIO BAUTA PRNR8C2
27.6 SD SPD - 50034500
4a 4a 5 5 D, N Agriculture (1300) Confined Animal Feeding Operations (1640) Onsite Wastewater Systems (6500)
Arsenic (0510) Copper (0530)
RIO SANA MUERTOS PRNR8D
16 SD SPD - 50031500
4a 4a 5 5 D, N Agriculture (1300) Onsite Wastewater Systems (6500)
Arsenic (0510) Copper (0530) Turbidity (2500)

� ! " #$ % &' $ ( ) * + , ) - . / 01 2 3 , ) , . 3 0 4 2 # ! 5 "1 # ! 3 % ! 6 $ " #7 * : - 7
Table 54: 2014 Cycle 303(d) List – List of Rivers and Streams Note: The 2014 303(d) List is comprised of the causes of impairments included in assessment cycles 2014, 2012, 2010, 2008 and 2006.
Basin Waterbody Name Waterbody Size (Miles)
Class
2014 Monitoring
Stations NS = Network SPD = Special
Project Delisting ED = External
Data
Designated Uses and Categories Summary
Notes Potential Pollution Sources
Causes of Impairment (Assessment Cycles)
R1 R2 AL DW 2014 2012 2010 2008
2006 Parameter in italic and color noncompliance in 2004, but compliance
in 2006
RIO OROCOVIS PRNR8E1
19.8 SD NS 50030700
ED
PR13003 PR13080
4a 4a 5 5 N, P Collection System Failure (0500) Landfills (6300) Major Municipal Point Source (0210) Minor Industrial Point Source (0120) Onsite Wastewater Systems (6500) Urban Runoff/Storm Sewers (4000)
Turbidity (2500)
Turbidity (2500)
Turbidity (2500)
Cyanide (0720) Turbidity (2500)
Cyanide (0720) Turbidity (2500)
RIO BOTIJAS PRNR8E2
19.1 SD SPD - 50030300
4a 4a 5 5 D, N Confined Animal Feeding Operations (1640) Minor Municipal Point Source (0220) Onsite Wastewater Systems (6500)
Arsenic (0510) Turbidity (2500)

� ! " #$ % &' $ ( ) * + , ) - . / 01 2 3 , ) , . 3 0 4 2 # ! 5 "1 # ! 3 % ! 6 $ " #7 * : 8 7
Table 54: 2014 Cycle 303(d) List – List of Rivers and Streams Note: The 2014 303(d) List is comprised of the causes of impairments included in assessment cycles 2014, 2012, 2010, 2008 and 2006.
Basin Waterbody Name Waterbody Size (Miles)
Class
2014 Monitoring
Stations NS = Network SPD = Special
Project Delisting ED = External
Data
Designated Uses and Categories Summary
Notes Potential Pollution Sources
Causes of Impairment (Assessment Cycles)
R1 R2 AL DW 2014 2012 2010 2008
2006 Parameter in italic and color noncompliance in 2004, but compliance
in 2006
RIO CIBUCO RIO CIBUCO PRNR9A
31.1 SD NS 50038320 50039500
5 5 5 5 A Agriculture (1300) Collection System Failure (0500) Confined Animal Feeding Operations (1640) Landfills (6300) Major Municipal Point Source (0210) Major Industrial Point Sources (0110) Onsite Wastewater Systems (6500)
Total Coliforms (1700) Turbidity (2500)
Total Coliforms (1700) Turbidity (2500)
Turbidity (2500)
Cyanide (0720) Turbidity (2500)
Cyanide (0720) Turbidity (2500)
RIO INDIO PRNR9B1
12.5 SD SPD -50039000
4a 4a 5 5 A, L Collection System Failure (0500) Confined Animal Feeding Operations (1640) Landfills (6300) Minor Industrial Point Source (0120) Onsite Wastewater Systems (6500) Urban Runoff/Storm Sewers (4000)
Arsenic (0510) Copper (0530) Cyanide (0720) Low Dissolved Oxygen (1200) Surfactants (0400) Turbidity (2500)

� ! " #$ % &' $ ( ) * + , ) - . / 01 2 3 , ) , . 3 0 4 2 # ! 5 "1 # ! 3 % ! 6 $ " #7 * : : 7
Table 54: 2014 Cycle 303(d) List – List of Rivers and Streams Note: The 2014 303(d) List is comprised of the causes of impairments included in assessment cycles 2014, 2012, 2010, 2008 and 2006.
Basin Waterbody Name Waterbody Size (Miles)
Class
2014 Monitoring
Stations NS = Network SPD = Special
Project Delisting ED = External
Data
Designated Uses and Categories Summary
Notes Potential Pollution Sources
Causes of Impairment (Assessment Cycles)
R1 R2 AL DW 2014 2012 2010 2008
2006 Parameter in italic and color noncompliance in 2004, but compliance
in 2006
RIO MOROVIS PRNR9B2
25.5 SD ED PR13001
PR13001D PR13001R
PR13017 PR13017R PR13017D
4a 4a 5 1 A, P Collection System Failure (0500) Confined Animal Feeding Operations (1640) Landfills (6300) Minor Industrial Point Source (0120) Minor Municipal Point Source (0220) Onsite Wastewater Systems (6500) Urban Runoff/Storm Sewers (4000)
Low Dissolved Oxygen (1200) pH (1000)
RIO DE LOS NEGROS PRNR9D
24.1 SD SPD - 50038302
4a 4a 5 5 A, L Agriculture (1300) Collection System Failure (0500) Confined Animal Feeding Operations (1640) Major Municipal Point Source (0210) Minor Industrial Point Source (0120) Onsite Wastewater Systems (6500) Urban Runoff/Storm Sewers (4000)
Arsenic (0510) Cyanide (0720) Surfactants (0400)

� ! " #$ % &' $ ( ) * + , ) - . / 01 2 3 , ) , . 3 0 4 2 # ! 5 "1 # ! 3 % ! 6 $ " #7 * : ; 7
Table 54: 2014 Cycle 303(d) List – List of Rivers and Streams Note: The 2014 303(d) List is comprised of the causes of impairments included in assessment cycles 2014, 2012, 2010, 2008 and 2006.
Basin Waterbody Name Waterbody Size (Miles)
Class
2014 Monitoring
Stations NS = Network SPD = Special
Project Delisting ED = External
Data
Designated Uses and Categories Summary
Notes Potential Pollution Sources
Causes of Impairment (Assessment Cycles)
R1 R2 AL DW 2014 2012 2010 2008
2006 Parameter in italic and color noncompliance in 2004, but compliance
in 2006
RIO DE LA PLATA
RIO DE LA PLATA PRER10A1
21 SD NS 50046000
4a 4a 5 5 B Collection System Failure (0500) Confined Animal Feeding Operations (1640) Major Industrial Point Source (0110) Major Municipal Point Source (0210) Minor Municipal Point Source (0220) Onsite Wastewater Systems (6500) Surfaces Mining (5100)
Turbidity (2500)
Cyanide (0720) Turbidity (2500)
Turbidity (2500)
Cyanide (0720)
RIO DE LA PLATA PRER10A3
55.7 SD NS 50044000
4a 4a 5 5 B Agriculture (1300) Confined Animal Feeding Operations (1640) Landfills (6300) Major Municipal Point Source (0210) Onsite Wastewater Systems (6500)
Turbidity (2500)
Low Dissolved Oxygen (1200) Turbidity (2500)
Low Dissolved Oxygen (1200) Turbidity (2500)
Cyanide (0720) Low Dissolved Oxygen (1200)
Cyanide (0720)

� ! " #$ % &' $ ( ) * + , ) - . / 01 2 3 , ) , . 3 0 4 2 # ! 5 "1 # ! 3 % ! 6 $ " #7 * :9 7
Table 54: 2014 Cycle 303(d) List – List of Rivers and Streams Note: The 2014 303(d) List is comprised of the causes of impairments included in assessment cycles 2014, 2012, 2010, 2008 and 2006.
Basin Waterbody Name Waterbody Size (Miles)
Class
2014 Monitoring
Stations NS = Network SPD = Special
Project Delisting ED = External
Data
Designated Uses and Categories Summary
Notes Potential Pollution Sources
Causes of Impairment (Assessment Cycles)
R1 R2 AL DW 2014 2012 2010 2008
2006 Parameter in italic and color noncompliance in 2004, but compliance
in 2006
RIO DE LA PLATA PRER10A4
10.2 SD NS 50043000
4a 4a 5 5 B Agriculture (1300) Confined Animal Feeding Operations (1640) Landfills (6300) Minor Industrial Point Source (0120) Onsite Wastewater Systems (6500)
Turbidity (2500)
Turbidity (2500)
Cyanide (0720) Turbidity (2500)
Cyanide
RIO DE LA PLATA PRER10A5
92.7 SD NS 50042500
ED
PR13085 6
4a 4a 5 5 B, L, P Collection System Failure (0500) Confined Animal Feeding Operations (1640) Major Municipal Point Source (0210) Minor Industrial Point Source (0120) Onsite Wastewater Systems (6500) Urban/Runoff/Storm Sewers (4000)
Copper (0530) Lead (0550) Mercury (0560) Turbidity (2500)
Arsenic (0510) Cyanide (0720) Surfactants (0400) Turbidity (2500) Copper (0530)

� ! " #$ % &' $ ( ) * + , ) - . / 01 2 3 , ) , . 3 0 4 2 # ! 5 "1 # ! 3 % ! 6 $ " #7 * ; ) 7
Table 54: 2014 Cycle 303(d) List – List of Rivers and Streams Note: The 2014 303(d) List is comprised of the causes of impairments included in assessment cycles 2014, 2012, 2010, 2008 and 2006.
Basin Waterbody Name Waterbody Size (Miles)
Class
2014 Monitoring
Stations NS = Network SPD = Special
Project Delisting ED = External
Data
Designated Uses and Categories Summary
Notes Potential Pollution Sources
Causes of Impairment (Assessment Cycles)
R1 R2 AL DW 2014 2012 2010 2008
2006 Parameter in italic and color noncompliance in 2004, but compliance
in 2006
RIO LAJAS PRER10B
16.6 SD SPD - 50045800
4a 4a 5 5 B, L Collection System Failure (0500) Confined Animal Feeding Operations (1640) Minor Industrial Point Source (0120) Onsite Wastewater Systems (6500) Surface Mining (5100)
Arsenic (0510) Cyanide (0720) Low Dissolved Oxygen (1200) Surfactants (0400)
RIO BUCARABONES PRER10C
19.2 SD SPD - 50045500
4a 4a 5 5 B, L Collection System Failure (0500) Confined Animal Feeding Operations (1640) Onsite Wastewater Systems (6500)
Arsenic (0510) Cyanide (0720) Low Dissolved Oxygen (1200) Surfactants (0400)
RIO GUADIANA PRER10E
21.8 SD NS 50044850
ED
PR13083
5
5
5 5 B, P Collection System Failure (0500) Confined Animal Feeding Operations (1640) Minor Municipal Point Source (0220) Onsite Wastewater Systems (6500)
Total Coliforms (1700) Turbidity (2500)
Total Coliforms (1700) Turbidity (2500)
Turbidity (2500)
Cyanide (0720) Turbidity (2500)
Cyanide (0720)
� ! " #$ % &' $ ( ) * + , ) - . / 01 2 3 , ) , . 3 0 4 2 # ! 5 "1 # ! 3 % ! 6 $ " #7 * ; * 7
Table 54: 2014 Cycle 303(d) List – List of Rivers and Streams Note: The 2014 303(d) List is comprised of the causes of impairments included in assessment cycles 2014, 2012, 2010, 2008 and 2006.
Basin Waterbody Name Waterbody Size (Miles)
Class
2014 Monitoring
Stations NS = Network SPD = Special
Project Delisting ED = External
Data
Designated Uses and Categories Summary
Notes Potential Pollution Sources
Causes of Impairment (Assessment Cycles)
R1 R2 AL DW 2014 2012 2010 2008
2006 Parameter in italic and color noncompliance in 2004, but compliance
in 2006
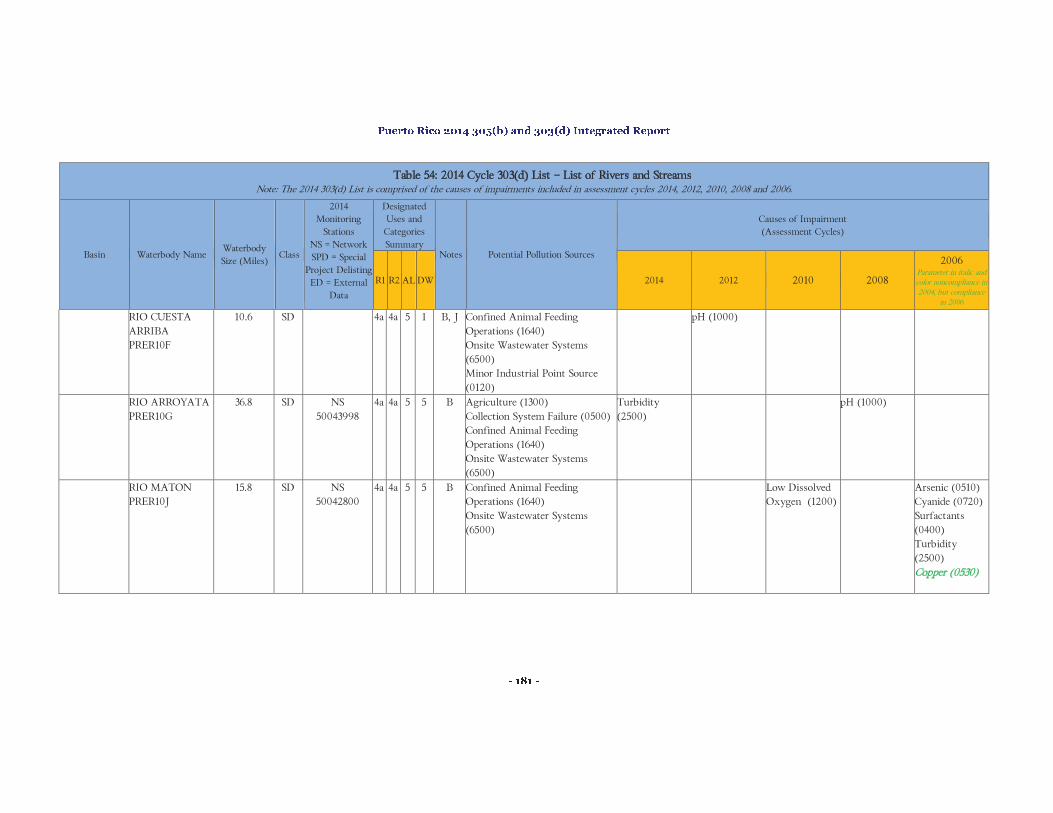
RIO CUESTA ARRIBA PRER10F
10.6 SD 4a 4a 5 1 B, J Confined Animal Feeding Operations (1640) Onsite Wastewater Systems (6500) Minor Industrial Point Source (0120)
pH (1000)
RIO ARROYATA PRER10G
36.8 SD NS 50043998
4a 4a 5 5
B Agriculture (1300) Collection System Failure (0500) Confined Animal Feeding Operations (1640) Onsite Wastewater Systems (6500)
Turbidity (2500)
pH (1000)
RIO MATON PRER10J
15.8 SD NS 50042800
4a 4a 5 5
B Confined Animal Feeding Operations (1640) Onsite Wastewater Systems (6500)
Low Dissolved Oxygen (1200)
Arsenic (0510) Cyanide (0720) Surfactants (0400) Turbidity (2500) Copper (0530)

� ! " #$ % &' $ ( ) * + , ) - . / 01 2 3 , ) , . 3 0 4 2 # ! 5 "1 # ! 3 % ! 6 $ " #7 * ; ( 7
Table 54: 2014 Cycle 303(d) List – List of Rivers and Streams Note: The 2014 303(d) List is comprised of the causes of impairments included in assessment cycles 2014, 2012, 2010, 2008 and 2006.
Basin Waterbody Name Waterbody Size (Miles)
Class
2014 Monitoring
Stations NS = Network SPD = Special
Project Delisting ED = External
Data
Designated Uses and Categories Summary
Notes Potential Pollution Sources
Causes of Impairment (Assessment Cycles)
R1 R2 AL DW 2014 2012 2010 2008
2006 Parameter in italic and color noncompliance in 2004, but compliance
in 2006
RIO GUAVATE PRER10K
19.8 4a 4a 5 1 B, J Onsite Wastewater Systems (6500) Urban Runoff/Storm Sewers (4000) Confined Animal Feeding Operations (1640)
pH (1000)
RIO HONDO RIO HONDO PRER11A
22 SD SPD - 50047530
5 5 5 5 H Collection System Failure (0500) Urban Runoff/Storm Sewers (4000)
Low Dissolved Oxygen (1200) Total Coliforms (1700)
Arsenic (0510) Low Dissolved Oxygen (1200) Surfactants (0400) Turbidity (2500)
Arsenic (0510) Low Dissolved Oxygen (1200) Other Inorganic (0800) Selenium (0570) Surfactants (0400)
RIO BAYAMÓN
RIO BAYAMÓN PRER12A1
33.6 SD NS 50048510
5 5 5 5 H Collection System Failure (0500) Confined Animal Feeding Operations (1640) Minor Industrial Point Sources (0120) Onsite Wastewater Systems (6500) Urban Runoff/Storm Sewers (4000)
Copper (0530) Total Coliforms (1700) Turbidity (2500)
Total Coliforms (1700)
Copper (0530) Cyanide (0720) Turbidity (2500)
Cyanide (0720)

� ! " #$ % &' $ ( ) * + , ) - . / 01 2 3 , ) , . 3 0 4 2 # ! 5 "1 # ! 3 % ! 6 $ " #7 * ; , 7
Table 54: 2014 Cycle 303(d) List – List of Rivers and Streams Note: The 2014 303(d) List is comprised of the causes of impairments included in assessment cycles 2014, 2012, 2010, 2008 and 2006.
Basin Waterbody Name Waterbody Size (Miles)
Class
2014 Monitoring
Stations NS = Network SPD = Special
Project Delisting ED = External
Data
Designated Uses and Categories Summary
Notes Potential Pollution Sources
Causes of Impairment (Assessment Cycles)
R1 R2 AL DW 2014 2012 2010 2008
2006 Parameter in italic and color noncompliance in 2004, but compliance
in 2006
RIO BAYAMÓN PRER12A2
83.7 SD NS 50047600 50047820
ED
PR13005
4a 4a 5 5 H, P Confined Animal Feeding Operations (1640) Landfills (6300) Onsite Wastewater Systems (6500) Urban Runoff/Storm Sewers (4000)
Turbidity (2500)
Turbidity (2500)
Cyanide (0720) Turbidity (2500)
Turbidity (2500)
Cyanide (0720) Turbidity (2500)
RIO GUAYNABO PRER12B
50.7 SD NS 50047990
5 5 5 5 H Collection System Failure (0500) Confined Animal Feeding Operations (1640) Landfills (6300) Major Industrial Point Sources (0110) Onsite Wastewater Systems (6500) Urban Runoff/Storm Sewers (4000)
Total Coliforms (1700) Turbidity (2500)
Total Coliforms (1700) Turbidity (2500)
Cyanide (0720) Turbidity (2500)
Turbidity (2500)
Cyanide (0720) Turbidity (2500)

� ! " #$ % &' $ ( ) * + , ) - . / 01 2 3 , ) , . 3 0 4 2 # ! 5 "1 # ! 3 % ! 6 $ " #7 * ; + 7
Table 54: 2014 Cycle 303(d) List – List of Rivers and Streams Note: The 2014 303(d) List is comprised of the causes of impairments included in assessment cycles 2014, 2012, 2010, 2008 and 2006.
Basin Waterbody Name Waterbody Size (Miles)
Class
2014 Monitoring
Stations NS = Network SPD = Special
Project Delisting ED = External
Data
Designated Uses and Categories Summary
Notes Potential Pollution Sources
Causes of Impairment (Assessment Cycles)
R1 R2 AL DW 2014 2012 2010 2008
2006 Parameter in italic and color noncompliance in 2004, but compliance
in 2006
RIO GRANDE DE LOIZA
RIO GRANDE DE LOIZA PRER14A1
31 SD NS 50059100
4a 4a 5 5 H Collection System Failure (0500) Confined Animal Feeding Operations (1640) Major Industrial Point Source (0110) Onsite Wastewater Systems (6500) Surfaces Mining (5100) Urban Runoff/Storm Sewers (4000)
Turbidity (2500)
Copper (0530) Low Dissolved Oxygen (1200)
Copper (0530) Low Dissolved Oxygen (1200) Turbidity (2500)
Cyanide (0720) Turbidity (2500)
Cyanide (0720) Low Dissolved Oxygen (1200) Turbidity (2500)
RIO GRANDE DE LOIZA PRER14A2
86.6 SD NS 50051800 50055000
ED
PR13076
5 5 5 5 C, G, I, P
Agriculture (1300) Collection System Failure (0500) Confined Animal Feeding Operations (1640) Landfills (6300) Major Municipal Point Source (0210) Minor Industrial Point Source (0120) Onsite Wastewater Systems (6500) Surfaces Mining (5100) Urban Runoff/Storm Sewers (4000)
Total Coliforms (1700) Turbidity (2500)
Cyanide (0720) Pesticides (0200) Turbidity (2500)
Cyanide (0720) Turbidity (2500)

� ! " #$ % &' $ ( ) * + , ) - . / 01 2 3 , ) , . 3 0 4 2 # ! 5 "1 # ! 3 % ! 6 $ " #7 * ; - 7
Table 54: 2014 Cycle 303(d) List – List of Rivers and Streams Note: The 2014 303(d) List is comprised of the causes of impairments included in assessment cycles 2014, 2012, 2010, 2008 and 2006.
Basin Waterbody Name Waterbody Size (Miles)
Class
2014 Monitoring
Stations NS = Network SPD = Special
Project Delisting ED = External
Data
Designated Uses and Categories Summary
Notes Potential Pollution Sources
Causes of Impairment (Assessment Cycles)
R1 R2 AL DW 2014 2012 2010 2008
2006 Parameter in italic and color noncompliance in 2004, but compliance
in 2006
RIO CANOVANAS PRER14B
32.6 SD SPD - 50061910
5 5 5
5 F, H Confined Animal Feeding Operations (1640) Minor Industrial Point Source (0120) Onsite Wastewater Systems (6500) Urban Runoff/Storm Sewers (4000)
Total Coliforms (1700)
Arsenic (0510) Cyanide (0720)
RIO CANOVANILLAS PRER14C
27.9 SD SPD – 50061510
ED
PR13097
5 5 5 5 F, H, P
Collection System Failure (0500) Confined Animal Feeding Operations (1640) Minor Municipal Point Source (0220) Onsite Wastewater Systems (6500) Urban Runoff/Storm Sewers (4000)
Low Dissolved Oxygen (1200) Total Coliforms (1700)
Arsenic (0510) Cyanide (0720)
QUEBRADA MARACUTO PREQ14D
22.9 SD SPD - 50060200
4a
4a
5
5 F, H Confined Animal Feeding Operations (1640) Onsite Wastewater Systems (6500)
Arsenic (0510) Cyanide (0720)

� ! " #$ % &' $ ( ) * + , ) - . / 01 2 3 , ) , . 3 0 4 2 # ! 5 "1 # ! 3 % ! 6 $ " #7 * ; 8 7
Table 54: 2014 Cycle 303(d) List – List of Rivers and Streams Note: The 2014 303(d) List is comprised of the causes of impairments included in assessment cycles 2014, 2012, 2010, 2008 and 2006.
Basin Waterbody Name Waterbody Size (Miles)
Class
2014 Monitoring
Stations NS = Network SPD = Special
Project Delisting ED = External
Data
Designated Uses and Categories Summary
Notes Potential Pollution Sources
Causes of Impairment (Assessment Cycles)
R1 R2 AL DW 2014 2012 2010 2008
2006 Parameter in italic and color noncompliance in 2004, but compliance
in 2006
QUEBRADA GRANDE PREQ14E
17.7 SD SPD - 50059210
4a
4a
5 5 F, H Confined Animal Feeding Operations (1640) Onsite Wastewater Systems (6500) Urban Runoff/Storm Sewers (4000)
Low Dissolved Oxygen (1200)
Arsenic (0510) Cyanide (0720) Surfactants (0400)
RIO CAÑAS PRER14F
9.4 SD SPD - 50058350
4a 4a 5
5 C, F Collection System Failure (0500) Confined Animal Feeding Operations (1640) Onsite Wastewater Systems (6500)
Low Dissolved Oxygen (1200)
Arsenic (0510) Cyanide (0720)
RIO GURABO PRER14G1
124.3 SD NS 50057025
ED
PR13025
5 5 5 5 C, G, P
Collection System Failure (0500) Confined Animal Feeding Operations (1640) Landfills (6300) Minor Industrial Point Source (0120) Onsite Wastewater Systems (6500) Surfaces Mining (5100)
Copper (0530) Total Coliforms (1700) Turbidity (2500)
Total Coliforms (1700) Turbidity (2500)
Copper (0530) Turbidity (2500)
Cyanide (0720) Turbidity (2500)
Copper (0530) Cyanide (0720) Turbidity (2500)

� ! " #$ % &' $ ( ) * + , ) - . / 01 2 3 , ) , . 3 0 4 2 # ! 5 "1 # ! 3 % ! 6 $ " #7 * ; : 7
Table 54: 2014 Cycle 303(d) List – List of Rivers and Streams Note: The 2014 303(d) List is comprised of the causes of impairments included in assessment cycles 2014, 2012, 2010, 2008 and 2006.
Basin Waterbody Name Waterbody Size (Miles)
Class
2014 Monitoring
Stations NS = Network SPD = Special
Project Delisting ED = External
Data
Designated Uses and Categories Summary
Notes Potential Pollution Sources
Causes of Impairment (Assessment Cycles)
R1 R2 AL DW 2014 2012 2010 2008
2006 Parameter in italic and color noncompliance in 2004, but compliance
in 2006
RIO VALENCIANO PRER14G2
42.8 SD NS 50056500
ED
PR13018 PR13061
4a 4a 5 5 C, P Agriculture (1300) Collection System Failure (0500) Confined Animal Feeding Operations (1640) Landfills (6300) Minor Industrial Point Source (0120) Onsite Wastewater Systems (6500) Package Plant (Small Flow) (0230) Urban Runoff/Storm Sewers (4000)
Turbidity (2500)
Copper (0530) Arsenic (0510) Cyanide (0720) Surfactants (0400) Turbidity (2500)
RIO BAIROA PRER14H
16.3 SD NS 50055410
5 5 5 5 C, G, I, K
Collection System Failure (0500) Major Municipal Point Source (0210) Onsite Wastewater Systems (6500) Urban Runoff/Storm Sewers (4000)
Phosphorous (0910) Total Coliforms (1700) Turbidity (2500)
Phosphorus (0910)
Phosphorus (0910)
Phosphorus (0910) Cyanide (0720)
Cyanide (0720)

� ! " #$ % &' $ ( ) * + , ) - . / 01 2 3 , ) , . 3 0 4 2 # ! 5 "1 # ! 3 % ! 6 $ " #7 * ; ; 7
Table 54: 2014 Cycle 303(d) List – List of Rivers and Streams Note: The 2014 303(d) List is comprised of the causes of impairments included in assessment cycles 2014, 2012, 2010, 2008 and 2006.
Basin Waterbody Name Waterbody Size (Miles)
Class
2014 Monitoring
Stations NS = Network SPD = Special
Project Delisting ED = External
Data
Designated Uses and Categories Summary
Notes Potential Pollution Sources
Causes of Impairment (Assessment Cycles)
R1 R2 AL DW 2014 2012 2010 2008
2006 Parameter in italic and color noncompliance in 2004, but compliance
in 2006
RIO CAGÜITAS PRER14I
33.9 SD NS 50055250
5 5 5 5 C, G, I, K
Collection System Failure (0500) Confined Animal Feeding Operations (1640) Onsite Wastewater Systems (6500) Surfaces Mining (5100) Urban Runoff/Storm Sewers (4000)
Surfactants (0400) Thermal Modifications (1400) Total Coliforms (1700) Turbidity (2500)
Total Coliforms (1700)
Surfactants (0400) Thermal Modifications (1400) Turbidity (2500)
Cyanide (0720) Surfactants (0400) Thermal Modifications (1400) Turbidity (2500)
Cyanide (0720) Surfactants (0400)
RIO TURABO PRER14J
54.7 SD NS 50054500
ED
PR13093
4a 4a 5 5 C, P Agriculture (1300) Collection System Failure (0500) Confined Animal Feeding Operations (1640) Minor Industrial Point Source (0120) Minor Municipal Point Source (0220) Onsite Wastewater Systems (6500) Urban Runoff/Storm Sewers (4000)
Copper (0530) pH (1000) Turbidity (2500)
Arsenic (0510) Cyanide (0720) Surfactants (0400) Turbidity (2500)

� ! " #$ % &' $ ( ) * + , ) - . / 01 2 3 , ) , . 3 0 4 2 # ! 5 "1 # ! 3 % ! 6 $ " #7 * ;9 7
Table 54: 2014 Cycle 303(d) List – List of Rivers and Streams Note: The 2014 303(d) List is comprised of the causes of impairments included in assessment cycles 2014, 2012, 2010, 2008 and 2006.
Basin Waterbody Name Waterbody Size (Miles)
Class
2014 Monitoring
Stations NS = Network SPD = Special
Project Delisting ED = External
Data
Designated Uses and Categories Summary
Notes Potential Pollution Sources
Causes of Impairment (Assessment Cycles)
R1 R2 AL DW 2014 2012 2010 2008
2006 Parameter in italic and color noncompliance in 2004, but compliance
in 2006
RIO CAYAGUAS PRER14K
38.5 SD NS 50051500
ED
PR13002, PR13002R, PR13002D
4a 4a 5 5 C, P Agriculture (1300) Confined Animal Feeding Operations (1640) Onsite Wastewater Systems (6500)
Arsenic (0510) Copper (0530) Cyanide (0720) Lead (0550) Surfactants (0400) Turbidity (2500)
RIO EMAJAGUA PRER14L
8.5 SD SPD - 50051000
4a 4a 5 5 C, F Onsite Wastewater Systems (6500) Minor Industrial Point Sources (0120) Package Plants (Small Flow) (0230)
Arsenic (0510) Cyanide (0720) Surfactants (0400)
RIO HERRERA
RIO HERRERA PRER15A
17 SD SPD – 50063065
ED
PR13087
5 5 5 5 F, H, P
Confined Animal Feeding Operations (1640) Onsite Wastewater Systems (6500) Urban Runoff/Storm Sewers (4000)
Turbidity (2500) Total Coliforms (1700)
Surfactants (0400) Turbidity (2500)
Low Dissolved Oxygen (1200)

� ! " #$ % &' $ ( ) * + , ) - . / 01 2 3 , ) , . 3 0 4 2 # ! 5 "1 # ! 3 % ! 6 $ " #7 *9 ) 7
Table 54: 2014 Cycle 303(d) List – List of Rivers and Streams Note: The 2014 303(d) List is comprised of the causes of impairments included in assessment cycles 2014, 2012, 2010, 2008 and 2006.
Basin Waterbody Name Waterbody Size (Miles)
Class
2014 Monitoring
Stations NS = Network SPD = Special
Project Delisting ED = External
Data
Designated Uses and Categories Summary
Notes Potential Pollution Sources
Causes of Impairment (Assessment Cycles)
R1 R2 AL DW 2014 2012 2010 2008
2006 Parameter in italic and color noncompliance in 2004, but compliance
in 2006
RIO ESPIRITU SANTO
RIO ESPIRITU SANTO PRER16A
53.9 SD NS 50063800
ED
PR1152
4a 4a 5 5 H, P Collection System Failure (0500) Confined Animal Feeding Operations (1640) Landfills (6300) Onsite Wastewater Systems (6500)
Copper (0530) Lead (0550) Low Dissolved Oxygen (1200) pH (1000) Surfactants (0400) Turbidity (2500)
Copper (0530) Turbidity (2500)
Cyanide (0720) Surfactants (0400) Turbidity (2500)
Copper (0530) Cyanide (0720)
RIO MAMEYES
RIO MAMEYES PRER17A
35.6 SD SPD – 50065650
ED
PR13079
4a 4a 5 1 F, H, P
Confined Animal Feeding Operations (1640) Landfills (6300) Onsite Wastewater Systems (6500)
Low Dissolved Oxygen (1200) pH (1000)
Low Dissolved Oxygen (1200)
QUEBRADA MATA DE PLATANO
QUEBRADA MATA DE PLATANO PREQ18A
4.0 SD SPD – 50066500
5 5 5 1 F Confined Animal Feeding Operations (1640) Onsite Wastewater Systems (6500) Urban Runoff/Storm Sewers (4000)
Fecal Coliforms (1700) Low Dissolved Oxygen (1200)
Fecal Coliforms (1700) Low Dissolved Oxygen (1200) Surfactants (0400)
Fecal Coliforms (1700) Low Dissolved Oxygen (1200)

� ! " #$ % &' $ ( ) * + , ) - . / 01 2 3 , ) , . 3 0 4 2 # ! 5 "1 # ! 3 % ! 6 $ " #7 *9 * 7
Table 54: 2014 Cycle 303(d) List – List of Rivers and Streams Note: The 2014 303(d) List is comprised of the causes of impairments included in assessment cycles 2014, 2012, 2010, 2008 and 2006.
Basin Waterbody Name Waterbody Size (Miles)
Class
2014 Monitoring
Stations NS = Network SPD = Special
Project Delisting ED = External
Data
Designated Uses and Categories Summary
Notes Potential Pollution Sources
Causes of Impairment (Assessment Cycles)
R1 R2 AL DW 2014 2012 2010 2008
2006 Parameter in italic and color noncompliance in 2004, but compliance
in 2006
RIO SABANA RIO SABANA PRER19A
15.1 SD 4a 4a 5 1 F, J, M Confined Animal Feeding Operations (1640) Minor Industrial Point Sources (0120) Onsite Wastewater Systems (6500) Surfaces Mining (5100)
Low Dissolved Oxygen (1200)
QUEBRADA FAJARDO
QUEBRADA FAJARDO PREQ21A
10.0 SD 4a 4a 5 2
F, J, M Collection System Failure (0500) Confined Animal Feeding Operations (1640) Onsite Wastewater Systems (6500)
Low Dissolved Oxygen (1200)
RIO FAJARDO
RIO FAJARDO PRER22A
59.0 SD NS 50071000 50072500
ED 1
PR13013
4a
4a
5 5 M, P Confined Animal Feeding Operations (1640) Landfills (6300) Major Municipal Point Sources (0210) Onsite Wastewater Systems (6500) Urban Runoff/Storm Sewers (4000)
Low Dissolved Oxygen (1200) Surfactants (0400)
Cadmium (0520) Copper (0530) Lead (0550) Low Dissolved Oxygen (1200) Mercury (0560) Surfactants (0400) Turbidity (2500)
Copper (0530) Turbidity (2500)
Copper (0530) Cyanide (0720) Turbidity (2500)
Copper (0530) Cyanide (0720) Turbidity (2500)

� ! " #$ % &' $ ( ) * + , ) - . / 01 2 3 , ) , . 3 0 4 2 # ! 5 "1 # ! 3 % ! 6 $ " #7 *9 ( 7
Table 54: 2014 Cycle 303(d) List – List of Rivers and Streams Note: The 2014 303(d) List is comprised of the causes of impairments included in assessment cycles 2014, 2012, 2010, 2008 and 2006.
Basin Waterbody Name Waterbody Size (Miles)
Class
2014 Monitoring
Stations NS = Network SPD = Special
Project Delisting ED = External
Data
Designated Uses and Categories Summary
Notes Potential Pollution Sources
Causes of Impairment (Assessment Cycles)
R1 R2 AL DW 2014 2012 2010 2008
2006 Parameter in italic and color noncompliance in 2004, but compliance
in 2006
RIO DEMAJAGUA
RIO DEMAJAGUA PRER23A
2.8 SD SPD -50072700
4a 4a 5 1
M, Q Onsite Wastewater Systems (6500)
Low Dissolved Oxygen (1200) Surfactants (0400)
QUEBRADA CEIBA
QUEBRADA CEIBA PREQ24A
5.0 SD SPD - 50072810
4a 4a 5 1 F, M Onsite Wastewater Systems (6500)
Low Dissolved Oxygen (1200) Surfactants (0400)
Low Dissolved Oxygen (1200) Surfactants (0400)
Low Dissolved Oxygen (1200)
QUEBRADA AGUAS CLARAS
QUEBRADA AGUAS CLARAS PREQ25A
4.8 SD 4a 4a 5 1 F, J, M Onsite Wastewater Systems (6500) Urban Runoff/Storm Sewers (4000)
Low Dissolved Oxygen (1200) Thermal Modifications (1400)
Low Dissolved Oxygen (1200) Thermal Modifications (1400)
RIO DAGUAO RIO DAGUAO PRER26A
13.8 SD SPD – 50073225
4a 4a 5 1 F, M Confined Animal Feeding Operations (1640) Onsite Wastewater Systems (6500)
Low Dissolved Oxygen (1200) Surfactants (0400)
Low Dissolved Oxygen (1200)
QUEBRADA BOTIJAS
QUEBRADA BOTIJAS PREQ28A
7.4 SD 4a 4a 5 1 F, J, M Onsite Wastewater Systems (6500)
Low Dissolved Oxygen (1200)
Low Dissolved Oxygen (1200)

� ! " #$ % &' $ ( ) * + , ) - . / 01 2 3 , ) , . 3 0 4 2 # ! 5 "1 # ! 3 % ! 6 $ " #7 *9 , 7
Table 54: 2014 Cycle 303(d) List – List of Rivers and Streams Note: The 2014 303(d) List is comprised of the causes of impairments included in assessment cycles 2014, 2012, 2010, 2008 and 2006.
Basin Waterbody Name Waterbody Size (Miles)
Class
2014 Monitoring
Stations NS = Network SPD = Special
Project Delisting ED = External
Data
Designated Uses and Categories Summary
Notes Potential Pollution Sources
Causes of Impairment (Assessment Cycles)
R1 R2 AL DW 2014 2012 2010 2008
2006 Parameter in italic and color noncompliance in 2004, but compliance
in 2006
RIO BLANCO RIO BLANCO PRER30A
45.0 SD 4a 4a 5 5 F, J, M Confined Animal Feeding Operations (1640) Minor Industrial Point Sources (0120) Onsite Wastewater Systems (6500) Urban Runoff/Storm Sewers (4000)
Low Dissolved Oxygen (1200) Turbidity (2500)
Low Dissolved Oxygen (1200)
QUEBRADA PEÑA POBRE PREQ30B
13.4 SD 4a 4a 5 1 F, J, M Confined Animal Feeding Operations (1640) Onsite Wastewater Systems (6500)
Low Dissolved Oxygen (1200)
RIO ANTON RUIZ
RIO ANTON RUIZ PRER31A
16.9 SD SPD - 50078510
4a 4a 5 1 M, Q Confined Animal Feeding Operations (1640) Onsite Wastewater Systems (6500)
Low Dissolved Oxygen (1200) Surfactants (0400)
QUEBRADA FRONTERA
QUEBRADA FRONTERA PREQ32A
8.5 SD 4a
4a 5 1 F, J, M Collection System Failure (0500) Confined Animal Feeding Operations (1640) Onsite Wastewater Systems (6500) Major Municipal Point Sources (0210)
Low Dissolved Oxygen (1200)
Low Dissolved Oxygen (1200)

� ! " #$ % &' $ ( ) * + , ) - . / 01 2 3 , ) , . 3 0 4 2 # ! 5 "1 # ! 3 % ! 6 $ " #7 *9 + 7
Table 54: 2014 Cycle 303(d) List – List of Rivers and Streams Note: The 2014 303(d) List is comprised of the causes of impairments included in assessment cycles 2014, 2012, 2010, 2008 and 2006.
Basin Waterbody Name Waterbody Size (Miles)
Class
2014 Monitoring
Stations NS = Network SPD = Special
Project Delisting ED = External
Data
Designated Uses and Categories Summary
Notes Potential Pollution Sources
Causes of Impairment (Assessment Cycles)
R1 R2 AL DW 2014 2012 2010 2008
2006 Parameter in italic and color noncompliance in 2004, but compliance
in 2006
RIO HUMACAO
RIO HUMACAO PRER33A
55.8 SD NS 50082000
ED
PR13073
5 5 5 5 H, P Collection System Failure (0500) Confined Animal Feeding Operations (1640) Landfills (6300) Minor Industrial Point Source (0120) Onsite Wastewater Systems (6500) Urban Runoff/Storm Sewers (4000)
Copper (0530) Lead (0550) Surfactants (0400) Total Coliforms (1700) Turbidity (2500)
Total Coliforms (1700) Turbidity (2500)
Surfactants (0400)
Cyanide (0720) Surfactants (0400) Turbidity (2500)
Cyanide (0720) Turbidity (2500)
RIO CANDELERO
RIO CANDELERO PRER34A
10.4 SD 4a 4a 5 1 H, J, Q
Onsite Wastewater Systems (6500)
Low Dissolved Oxygen (1200)
RIO GUAYANES
RIO GUAYANES PRER35A
62.0 SD NS 50083500 50085000
ED
PR13007 PR13023
5 5 5 5 H, P Agriculture (1300) Landfills (6300) Minor Industrial Point Sources (0120) Onsite Wastewater Systems (6500)
Copper (0530) Lead (0550) Low Dissolved Oxygen (1200) pH (1000) Total Coliforms (1700) Turbidity (2500)
Copper (0530) Low Dissolved Oxygen (1200) Surfactants (0400) Thermal Modifications (1400) Turbidity (2500)
Copper (0530) Cyanide (0720) Lead (0550) Low Dissolved Oxygen (1200) Surfactants (0400) Turbidity (2500)

� ! " #$ % &' $ ( ) * + , ) - . / 01 2 3 , ) , . 3 0 4 2 # ! 5 "1 # ! 3 % ! 6 $ " #7 *9 - 7
Table 54: 2014 Cycle 303(d) List – List of Rivers and Streams Note: The 2014 303(d) List is comprised of the causes of impairments included in assessment cycles 2014, 2012, 2010, 2008 and 2006.
Basin Waterbody Name Waterbody Size (Miles)
Class
2014 Monitoring
Stations NS = Network SPD = Special
Project Delisting ED = External
Data
Designated Uses and Categories Summary
Notes Potential Pollution Sources
Causes of Impairment (Assessment Cycles)
R1 R2 AL DW 2014 2012 2010 2008
2006 Parameter in italic and color noncompliance in 2004, but compliance
in 2006
RIO MAUNABO
RIO MAUNABO PRER37A
36.0 SD NS 50091000
4a 4a 5 1
H Agriculture (1300) Collection System Failure (0500) Landfills (6300) Minor Industrial Point Source (0120) Minor Municipal Point Source (0220) Onsite Wastewater Systems (6500) Urban Runoff/Storm Sewers (4000)
Thermal Modifications (1400)
Thermal Modifications (1400)
Cyanide (0720) Thermal Modifications (1400)
Cyanide (0720)
Cyanide (0720)
QUEBRADA PALENQUE
QUEBRADA PALENQUE PRSQ41A
1.0 SD 4a 4a 5 1 J, M, O, Q
Onsite Wastewater Systems (6500)
Low Dissolved Oxygen (1200)

� ! " #$ % &' $ ( ) * + , ) - . / 01 2 3 , ) , . 3 0 4 2 # ! 5 "1 # ! 3 % ! 6 $ " #7 *9 8 7
Table 54: 2014 Cycle 303(d) List – List of Rivers and Streams Note: The 2014 303(d) List is comprised of the causes of impairments included in assessment cycles 2014, 2012, 2010, 2008 and 2006.
Basin Waterbody Name Waterbody Size (Miles)
Class
2014 Monitoring
Stations NS = Network SPD = Special
Project Delisting ED = External
Data
Designated Uses and Categories Summary
Notes Potential Pollution Sources
Causes of Impairment (Assessment Cycles)
R1 R2 AL DW 2014 2012 2010 2008
2006 Parameter in italic and color noncompliance in 2004, but compliance
in 2006
RIO CHICO RIO CHICO PRSR42A
14.6 SD SPD – 50091800
4a 4a 5 5 M, O Agriculture (1300) Confined Animal Feeding Operations (1640) Onsite Wastewater Systems (6500) Urban Runoff/Storm Sewers (4000)
Ammonia (0600)
Ammonia (0600) Low Dissolved Oxygen (1200)
Ammonia (0600) Arsenic (0510) Copper (0530) Low Dissolved Oxygen (1200) Phosphorus (0910) Surfactants (0400) Lead (0550) Mercury (0560) Silver (no code)
RIO GRANDE DE PATILLAS
RIO GRANDE DE PATILLAS PRSR43A2
35.9 SD NS 50092000
ED
PR13006
4a 4a 5 1 M, P Onsite Wastewater Systems (6500)
Cyanide (0720) Cyanide (0720)

� ! " #$ % &' $ ( ) * + , ) - . / 01 2 3 , ) , . 3 0 4 2 # ! 5 "1 # ! 3 % ! 6 $ " #7 *9 : 7
Table 54: 2014 Cycle 303(d) List – List of Rivers and Streams Note: The 2014 303(d) List is comprised of the causes of impairments included in assessment cycles 2014, 2012, 2010, 2008 and 2006.
Basin Waterbody Name Waterbody Size (Miles)
Class
2014 Monitoring
Stations NS = Network SPD = Special
Project Delisting ED = External
Data
Designated Uses and Categories Summary
Notes Potential Pollution Sources
Causes of Impairment (Assessment Cycles)
R1 R2 AL DW 2014 2012 2010 2008
2006 Parameter in italic and color noncompliance in 2004, but compliance
in 2006
RIO NIGUAS DE ARROYO
RIO NIGUAS DE ARROYO PRSR45A
21.0 SD 5 5 1 1 J, M, Q
Confined Animal Feeding Operations (1640) Onsite Wastewater Systems (6500) Package Plant (Small Flows) (0230) Urban Runoff/Storm Sewers (4000)
Total Coliforms (1700)
RIO GUAMANI
RIO GUAMANI PRSR49A
22.0 SD 4a 4a 5 4c J, M, O, Q
Minor Industrial Point Sources (0120) Onsite Wastewater Systems (6500) Urban Runoff/Storm Sewers (4000) Confined Animal Feeding Operations (1640)
Thermal Modifications (1400)
QUEBRADA MELANIA
QUEBRADA MELANIA PRSQ50A
7.0 SD SPD - 50096010
4a 4a 5 4c D, M, O
Landfills (6300) Onsite Wastewater Systems (6500) Urban Runoff/Storm Sewers (4000)
Low Dissolved Oxygen (1200)
Low Dissolved Oxygen (1200) Surfactants (0400)
Low Dissolved Oxygen (1200)
RIO SECO RIO SECO PRSR51A
24.7 SD 4a
4a
5 4c J, M, O, Q
Agriculture (1300) Onsite Wastewater Systems (6500)
Low Dissolved Oxygen (1200)

� ! " #$ % &' $ ( ) * + , ) - . / 01 2 3 , ) , . 3 0 4 2 # ! 5 "1 # ! 3 % ! 6 $ " #7 *9 ; 7
Table 54: 2014 Cycle 303(d) List – List of Rivers and Streams Note: The 2014 303(d) List is comprised of the causes of impairments included in assessment cycles 2014, 2012, 2010, 2008 and 2006.
Basin Waterbody Name Waterbody Size (Miles)
Class
2014 Monitoring
Stations NS = Network SPD = Special
Project Delisting ED = External
Data
Designated Uses and Categories Summary
Notes Potential Pollution Sources
Causes of Impairment (Assessment Cycles)
R1 R2 AL DW 2014 2012 2010 2008
2006 Parameter in italic and color noncompliance in 2004, but compliance
in 2006
QUEBRADA AMOROS
QUEBRADA AMOROS PRSQ52A
0.7 SD 4a 4a 5 4c D, J, M, O,
Q
Onsite Wastewater Systems (6500)
Low Dissolved Oxygen (1200)
Low Dissolved Oxygen (1200)
QUEBRADA AGUAS VERDES
QUEBRADA AGUAS VERDES PRSQ53A
15.0 SD SPD - 50099400
5 5 5 5 H, O, Q
Confined Animal Feeding Operations (1640) Onsite Wastewater Systems (6500)
Low Dissolved Oxygen (1200)
Low Dissolved Oxygen (1200) Nitrate+Nitrite (0990) Total Coliforms (1700)
RIO NIGUAS DE SALINAS
RIO NIGUAS DE SALINAS PRSR54A
102.5 SD NS 50102010
SPD –
50101600
ED PR13022
4a 4a 5 1 D, H, P
Confined Animal Feeding Operations (1640) Onsite Wastewater Systems (6500) Surfaces Mining (5100) Urban Runoff/Storm Sewers (4000)
Low Dissolved Oxygen (1200)
RIO CAYURES
RIO CAYURES PRSR56A
5.0 SD SPD - 50103100
4a 4a 5 2 M, O, Q
Agriculture (1300) Onsite Wastewater Systems (6500)
Low Dissolved Oxygen (1200) Surfactants (0400)
Low Dissolved Oxygen (1200) Surfactants (0400)

� ! " #$ % &' $ ( ) * + , ) - . / 01 2 3 , ) , . 3 0 4 2 # ! 5 "1 # ! 3 % ! 6 $ " #7 *9 9 7
Table 54: 2014 Cycle 303(d) List – List of Rivers and Streams Note: The 2014 303(d) List is comprised of the causes of impairments included in assessment cycles 2014, 2012, 2010, 2008 and 2006.
Basin Waterbody Name Waterbody Size (Miles)
Class
2014 Monitoring
Stations NS = Network SPD = Special
Project Delisting ED = External
Data
Designated Uses and Categories Summary
Notes Potential Pollution Sources
Causes of Impairment (Assessment Cycles)
R1 R2 AL DW 2014 2012 2010 2008
2006 Parameter in italic and color noncompliance in 2004, but compliance
in 2006
RIO COAMO RIO COAMO PRSR57A2
59.0 SD NS 50106500
4a 4a 5 1
M Agriculture (1300) Confined Animal Feeding Operations (1640) Landfills (6300) Onsite Wastewater Systems (6500) Urban Runoff/Storm Sewers (4000) Collection System Failure (0500) Minor Industrial Point Sources (0120)
Cyanide (0720) Thermal Modifications (1400)
Cyanide (0720) Cyanide (0720) Thermal Modifications (1400)
RIO CUYON PRSR57B
49.2 SD SPD – 50106000
ED
PR13084
4a 4a 5 5 L, M, P
Agriculture (1300) Collection System Failure (0500) Confined Animal Feeding Operations (1640) Onsite Wastewater Systems (6500) Package Plans Small Flow (0230) Urban Runoff/Storm Sewers (4000)
Low Dissolved Oxygen (1200)
Arsenic (0510) Cyanide (0720) Thermal Modifications (1400) Turbidity (2500)

� ! " #$ % &' $ ( ) * + , ) - . / 01 2 3 , ) , . 3 0 4 2 # ! 5 "1 # ! 3 % ! 6 $ " #7 ( ) ) 7
Table 54: 2014 Cycle 303(d) List – List of Rivers and Streams Note: The 2014 303(d) List is comprised of the causes of impairments included in assessment cycles 2014, 2012, 2010, 2008 and 2006.
Basin Waterbody Name Waterbody Size (Miles)
Class
2014 Monitoring
Stations NS = Network SPD = Special
Project Delisting ED = External
Data
Designated Uses and Categories Summary
Notes Potential Pollution Sources
Causes of Impairment (Assessment Cycles)
R1 R2 AL DW 2014 2012 2010 2008
2006 Parameter in italic and color noncompliance in 2004, but compliance
in 2006
RIO BUCANA-CERRILLOS
RIO BUCANA-CERRILLOS PRSR62A1
27.8 SD NS 50114000 50114400
4a 4a 5
1
M Onsite Wastewater Systems (6500) Surfaces Mining (5100) Urban Runoff/Storm Sewers (4000)
Cyanide (0720) Cyanide (0720) Cyanide (0720)
RIO PORTUGUES
RIO PORTUGUES PRSR63A
54.0 SD NS 50114900 50115000 50116200
5
5
5 5 M Minor Industrial Point Source (0120) Onsite Wastewater Systems (6500) Urban Runoff/Storm Sewers (4000)
pH (1000) Thermal Modifications (1400) Turbidity (2500)
Thermal Modifications (1400) Total Coliforms (1700) Turbidity (2500)
Cyanide (0720) Turbidity (2500)
Turbidity (2500)
Cyanide (0720) Turbidity (2500)

� ! " #$ % &' $ ( ) * + , ) - . / 01 2 3 , ) , . 3 0 4 2 # ! 5 "1 # ! 3 % ! 6 $ " #7 ( ) * 7
Table 54: 2014 Cycle 303(d) List – List of Rivers and Streams Note: The 2014 303(d) List is comprised of the causes of impairments included in assessment cycles 2014, 2012, 2010, 2008 and 2006.
Basin Waterbody Name Waterbody Size (Miles)
Class
2014 Monitoring
Stations NS = Network SPD = Special
Project Delisting ED = External
Data
Designated Uses and Categories Summary
Notes Potential Pollution Sources
Causes of Impairment (Assessment Cycles)
R1 R2 AL DW 2014 2012 2010 2008
2006 Parameter in italic and color noncompliance in 2004, but compliance
in 2006
RIO MATILDE – PASTILLO
RIO MATILDE – PASTILLO PRSR64A
43.2 SD 4a 4a 5 4c J, M, O, Q
Agriculture (1300) Collection System Failure (0500) Confined Animal Feeding Operations (1640) Landfills (6300) Major Industrial Point Sources (0110) Minor Industrial Point Source (0120) Onsite Wastewater Systems (6500) Package Plant (small flow) (0230) Urban Runoff/Storm Sewers (4000)
Low Dissolved Oxygen (1200)
RIO TALLABOA
RIO TALLABOA PRSR65A
59.6 SD 4a 4a 5 5 J, M, O, Q
Agriculture (1300) Minor Industrial Point Source (0120) Onsite Wastewater Systems (6500) Urban Runoff/Storm Sewers (4000) Minor Municipal Point Sources (0220)
Turbidity (2500)

� ! " #$ % &' $ ( ) * + , ) - . / 01 2 3 , ) , . 3 0 4 2 # ! 5 "1 # ! 3 % ! 6 $ " #7 ( ) ( 7
Table 54: 2014 Cycle 303(d) List – List of Rivers and Streams Note: The 2014 303(d) List is comprised of the causes of impairments included in assessment cycles 2014, 2012, 2010, 2008 and 2006.
Basin Waterbody Name Waterbody Size (Miles)
Class
2014 Monitoring
Stations NS = Network SPD = Special
Project Delisting ED = External
Data
Designated Uses and Categories Summary
Notes Potential Pollution Sources
Causes of Impairment (Assessment Cycles)
R1 R2 AL DW 2014 2012 2010 2008
2006 Parameter in italic and color noncompliance in 2004, but compliance
in 2006
RIO GUAYANILLA
RIO GUAYANILLA PRSR67A
60.0 SD NS 50124700
ED
PR13016
4a 4a 5 5 H, P Agriculture (1300) Landfills (6300) Minor Industrial Point Source (0120) Minor Municipal Point Source (0220) Onsite Wastewater Systems (6500) Urban Runoff/Storm Sewers (4000)
Ammonia (0600) Low Dissolved Oxygen (1200)
Low Dissolved Oxygen (1200) Phosphorus (0910)
Phosphorus (0910)
Cyanide (0720) Low Dissolved Oxygen (1200) Phosphorus (0910)
Cyanide (0720)
RIO YAUCO RIO YAUCO PRSR68A1
61.4 SD SPD - 50128110
4a 4a 5 5 H, O, Q
Agriculture (1300) Collection System Failure (0500) Landfills (6300) Major Municipal Point Sources (0210) Minor Industrial Point Source (0120) Onsite Wastewater Systems (6500) Urban Runoff/Storm Sewers (4000)
Low Dissolved Oxygen (1200)
Phosphorus (0910) Turbidity (2500)

� ! " #$ % &' $ ( ) * + , ) - . / 01 2 3 , ) , . 3 0 4 2 # ! 5 "1 # ! 3 % ! 6 $ " #7 ( ) , 7
Table 54: 2014 Cycle 303(d) List – List of Rivers and Streams Note: The 2014 303(d) List is comprised of the causes of impairments included in assessment cycles 2014, 2012, 2010, 2008 and 2006.
Basin Waterbody Name Waterbody Size (Miles)
Class
2014 Monitoring
Stations NS = Network SPD = Special
Project Delisting ED = External
Data
Designated Uses and Categories Summary
Notes Potential Pollution Sources
Causes of Impairment (Assessment Cycles)
R1 R2 AL DW 2014 2012 2010 2008
2006 Parameter in italic and color noncompliance in 2004, but compliance
in 2006
RIO LOCO RIO LOCO PRSR69A1
92.4 SD SPD – 50129600
ED- NOAA (N-30, N-33,
N-34)
4a 4a 5 5 H, P Agriculture (1300) Collection System Failure (0500) Landfills (6300) Major Municipal Point Source (0210) Minor Industrial Point Source (0120) Onsite Wastewater Systems (6500) Urban Runoff/Storm Sewers (4000)
Low Dissolved Oxygen (1200) Turbidity (2500)
Low Dissolved Oxygen (1200)
Arsenic (0510) Cyanide (0720) Low Dissolved Oxygen (1200) Turbidity (2500) Lead (0550)
QUEBRADA ZUMBON
QUEBRADA ZUMBON PRWQ72A
1.7 SD SPD - 50030050
4a 4a 5 4c M, O, Q
Collection System Failure (0500) Onsite Wastewater Systems (6500)
Low Dissolved Oxygen (1200)
Surfactants (0400)
QUEBRADA GONZALEZ
QUEBRADA GONZALEZ PRWQ73A
1.8 SD 4a 4a 5 4c J, M, O, Q
Onsite Wastewater Systems (6500)
Low Dissolved Oxygen (1200)
QUEBRADA LOS PAJARITOS
QUEBRADA LOS PAJARITOS PRWQ74A
2.7 SD 4a 4a 5 4c J, M, O, Q
Onsite Wastewater Systems (6500)
Low Dissolved Oxygen (1200)

� ! " #$ % &' $ ( ) * + , ) - . / 01 2 3 , ) , . 3 0 4 2 # ! 5 "1 # ! 3 % ! 6 $ " #7 ( ) + 7
Table 54: 2014 Cycle 303(d) List – List of Rivers and Streams Note: The 2014 303(d) List is comprised of the causes of impairments included in assessment cycles 2014, 2012, 2010, 2008 and 2006.
Basin Waterbody Name Waterbody Size (Miles)
Class
2014 Monitoring
Stations NS = Network SPD = Special
Project Delisting ED = External
Data
Designated Uses and Categories Summary
Notes Potential Pollution Sources
Causes of Impairment (Assessment Cycles)
R1 R2 AL DW 2014 2012 2010 2008
2006 Parameter in italic and color noncompliance in 2004, but compliance
in 2006
RIO GUANAJIBO
RIO GUANAJIBO PRWR77A
119.3 SD NS 50133600 50138000
5 5 5 5 H Collection System Failure (0500) Landfills (6300) Major Municipal Point Source (0210) Minor Industrial Point Source (0120) Onsite Wastewater Systems (6500) Urban Runoff/Storm Sewers (4000)
Total Coliforms (1700) Turbidity (2500)
Low Dissolved Oxygen (1200) Turbidity (2500)
Low Dissolved Oxygen (1200) Turbidity (2500)
Cyanide (0720) Low Dissolved Oxygen (1200) Turbidity (2500)
Cyanide (0720) Turbidity (2500)
RIO ROSARIO PRWR77C
58.3 SD NS 50136400 50136700
4a 4a 5 5 H Agriculture (1300) Collection System Failure (0500) Confined Animal Feeding Operations (1640) Landfills (6300) Minor Industrial Point Source (0120) Minor Municipal Point Source (0220) Onsite Wastewater Systems (6500) Urban Runoff/Storm Sewers (4000)
Turbidity (2500)
Turbidity (2500) Pesticides (0200)
Cyanide (0720) Turbidity (2500)
Cyanide (0720) Turbidity (2500)

� ! " #$ % &' $ ( ) * + , ) - . / 01 2 3 , ) , . 3 0 4 2 # ! 5 "1 # ! 3 % ! 6 $ " #7 ( ) - 7
Table 54: 2014 Cycle 303(d) List – List of Rivers and Streams Note: The 2014 303(d) List is comprised of the causes of impairments included in assessment cycles 2014, 2012, 2010, 2008 and 2006.
Basin Waterbody Name Waterbody Size (Miles)
Class
2014 Monitoring
Stations NS = Network SPD = Special
Project Delisting ED = External
Data
Designated Uses and Categories Summary
Notes Potential Pollution Sources
Causes of Impairment (Assessment Cycles)
R1 R2 AL DW 2014 2012 2010 2008
2006 Parameter in italic and color noncompliance in 2004, but compliance
in 2006
RIO VIEJO PRWR77D
21.1 SD NS 50135625
4a 4a 5 1 H Collection System Failure (0500) Onsite Wastewater Systems (6500) Urban Runoff/Storm Sewers (4000)
Low Dissolved Oxygen (1200)
Low Dissolved Oxygen (1200)
RIO DUEY Y RIO HOCONUCO PRWR77E
39.9 SD SPD - 50135000
4a 4a 5 1 H, L Agriculture (1300) Onsite Wastewater Systems (6500)
Cyanide (0720)
RIO CUPEYES PRWR77G
8.0 SD ED PR13072
4a 4a 5 1 H, P Agriculture (1300) Onsite Wastewater Systems (6500) Urban Runoff/Storm Sewers (4000)
Pesticides (0200)
CAÑO MERLE
CAÑO MERLE PRWK78A
1.6 SD 5 5 5 4c M, O, Q
Collection System Failure (0500) Surfaces Mining (5100) Urban Runoff/Storm Sewers (4000)
Low Dissolved Oxygen (1200) Surfactants (0400)

� ! " #$ % &' $ ( ) * + , ) - . / 01 2 3 , ) , . 3 0 4 2 # ! 5 "1 # ! 3 % ! 6 $ " #7 ( ) 8 7
Table 54: 2014 Cycle 303(d) List – List of Rivers and Streams Note: The 2014 303(d) List is comprised of the causes of impairments included in assessment cycles 2014, 2012, 2010, 2008 and 2006.
Basin Waterbody Name Waterbody Size (Miles)
Class
2014 Monitoring
Stations NS = Network SPD = Special
Project Delisting ED = External
Data
Designated Uses and Categories Summary
Notes Potential Pollution Sources
Causes of Impairment (Assessment Cycles)
R1 R2 AL DW 2014 2012 2010 2008
2006 Parameter in italic and color noncompliance in 2004, but compliance
in 2006
RIO YAGÜEZ RIO YAGÜEZ PRWR79A
42.2 SD NS 50138800 50139000
5 5 5 5 M Agriculture (1300) Minor Industrial Point Source (0120) Onsite Wastewater Systems (6500) Urban Runoff/Storm Sewers (4000)
Total Coliforms (1700) Turbidity (2500)
Copper (0530) Lead (0550) Mercury (0560) Turbidity (2500)
Cyanide (0720) Turbidity (2500)
Cyanide (0720)
RIO GRANDE DE AÑASCO
RIO GRANDE DE AÑASCO PRWR83A
126.0 SD NS 50143000 50144000 50146000
4a 4a 5 5 N Agriculture (1300) Confined Animal Feeding Operations (1640) Major Municipal Point Source (0210) Minor Industrial Point Source (0120) Onsite Wastewater Systems (6500) Urban Runoff/Storm Sewers (4000)
Turbidity (2500)
Low Dissolved Oxygen (1200) Turbidity (2500)
Turbidity (2500)
Cyanide (0720) Cyanide (0720) Turbidity (2500)

� ! " #$ % &' $ ( ) * + , ) - . / 01 2 3 , ) , . 3 0 4 2 # ! 5 "1 # ! 3 % ! 6 $ " #7 ( ) : 7
Table 54: 2014 Cycle 303(d) List – List of Rivers and Streams Note: The 2014 303(d) List is comprised of the causes of impairments included in assessment cycles 2014, 2012, 2010, 2008 and 2006.
Basin Waterbody Name Waterbody Size (Miles)
Class
2014 Monitoring
Stations NS = Network SPD = Special
Project Delisting ED = External
Data
Designated Uses and Categories Summary
Notes Potential Pollution Sources
Causes of Impairment (Assessment Cycles)
R1 R2 AL DW 2014 2012 2010 2008
2006 Parameter in italic and color noncompliance in 2004, but compliance
in 2006
RIO CASEY PRWR83C
38.1 SD SPD - 50145600
4a 4a 5 5 L, N Agriculture (1300) Confined Animal Feeding Operations (1640) Onsite Wastewater Systems (6500)
Cyanide (0720) Lead (0550) Low Dissolved Oxygen (1200) Surfactants (0400) Turbidity (2500)
RIO HUMATA PRWR83D
13.3 SD SPD – 50144900
ED
PR13011
4a 4a 5 5 L, N, P
Agriculture (1300) Onsite Wastewater Systems (6500)
Turbidity (2500)
Cyanide (0720) Turbidity (2500) Lead (0550) Low Dissolved Oxygen (1200) Cadmium (0520) Copper (0530)

� ! " #$ % &' $ ( ) * + , ) - . / 01 2 3 , ) , . 3 0 4 2 # ! 5 "1 # ! 3 % ! 6 $ " #7 ( ) ; 7
Table 54: 2014 Cycle 303(d) List – List of Rivers and Streams Note: The 2014 303(d) List is comprised of the causes of impairments included in assessment cycles 2014, 2012, 2010, 2008 and 2006.
Basin Waterbody Name Waterbody Size (Miles)
Class
2014 Monitoring
Stations NS = Network SPD = Special
Project Delisting ED = External
Data
Designated Uses and Categories Summary
Notes Potential Pollution Sources
Causes of Impairment (Assessment Cycles)
R1 R2 AL DW 2014 2012 2010 2008
2006 Parameter in italic and color noncompliance in 2004, but compliance
in 2006
RIO BLANCO PRWR83H
79.9 SD SPD – 50142250
ED
PR13015 PR13015R PR13015D
47
4a 4a 5 1 L, N, P
Agriculture (1300) Onsite Wastewater Systems (6500)
Cyanide (0720)
RIO PRIETO PRWR83I
59.8 SD SPD - 50142900
4a 4a 5 5 N Agriculture (1300) Confined Animal Feeding Operations (1640) Minor Industrial Point Source (0120) Onsite Wastewater Systems (6500)
Pesticides (0200)
Turbidity (2500)
Cyanide (0720)
QUEBRADA LOS RAMOS
QUEBRADA LOS RAMOS PRWQ89A
6.9 SD 2 2 5 4c D, J, O
Landfills (6300) Onsite Wastewater Systems (6500)
Low Dissolved Oxygen (1200)
Low Dissolved Oxygen (1200)
QUEBRADA PILETAS
QUEBRADA PILETAS PRWQ91A
2.0 SD 2 2 5 4c J, O, Q
Onsite Wastewater Systems (6500)
Low Dissolved Oxygen (1200)

� ! " #$ % &' $ ( ) * + , ) - . / 01 2 3 , ) , . 3 0 4 2 # ! 5 "1 # ! 3 % ! 6 $ " #7 ( )9 7
Table 54: 2014 Cycle 303(d) List – List of Rivers and Streams Note: The 2014 303(d) List is comprised of the causes of impairments included in assessment cycles 2014, 2012, 2010, 2008 and 2006.
Basin Waterbody Name Waterbody Size (Miles)
Class
2014 Monitoring
Stations NS = Network SPD = Special
Project Delisting ED = External
Data
Designated Uses and Categories Summary
Notes Potential Pollution Sources
Causes of Impairment (Assessment Cycles)
R1 R2 AL DW 2014 2012 2010 2008
2006 Parameter in italic and color noncompliance in 2004, but compliance
in 2006
RIO GUAYABO
RIO GUAYABO PRWR94A
43.1 SD SPD – 50146400 50146550
4a 4a 5 5 D, M Onsite Wastewater Systems (6500) Package Plant Small Flows (0230) Urban Runoff/Storm Sewers (4000)
Low Dissolved Oxygen (1200) Phosphorus (0910) Surfactants (0400)
Low Dissolved Oxygen (1200)
RIO CULEBRINAS
RIO CULEBRINAS PRWR95A
142.6 SD NS 50147600 50149100
ED
PR13063 PR13081
5 5 5 5 N, P Agriculture (1300) Collection System Failure (0500) Confined Animal Feeding Operations (1640) Landfills (6300) Major Municipal Point Source (0210) Minor Industrial Point Source (0120) Minor Municipal Point Source (0220) Onsite Wastewater Systems (6500) Urban Runoff/Storm Sewers (4000)
Arsenic (0510) Copper (0530) Turbidity (2500)
Copper (0530) Lead (0550) Pesticides (0200) Surfactants (0400) Total Coliforms (1700) Turbidity (2500)
Arsenic (0510) Copper (0530) Lead (0550) Surfactants (0400) Turbidity (2500)
Arsenic (0510) Cyanide (0720) Surfactants (0400) Turbidity (2500)
Arsenic (0510) Cyanide (0720) Lead (0550) Surfactants (0400) Turbidity (2500)

� ! " #$ % &' $ ( ) * + , ) - . / 01 2 3 , ) , . 3 0 4 2 # ! 5 "1 # ! 3 % ! 6 $ " #7 ( * ) 7
Table 54: 2014 Cycle 303(d) List – List of Rivers and Streams Note: The 2014 303(d) List is comprised of the causes of impairments included in assessment cycles 2014, 2012, 2010, 2008 and 2006.
Basin Waterbody Name Waterbody Size (Miles)
Class
2014 Monitoring
Stations NS = Network SPD = Special
Project Delisting ED = External
Data
Designated Uses and Categories Summary
Notes Potential Pollution Sources
Causes of Impairment (Assessment Cycles)
R1 R2 AL DW 2014 2012 2010 2008
2006 Parameter in italic and color noncompliance in 2004, but compliance
in 2006
RIO CAÑO (RIO CAÑAS) PRWR95B
33.3 SD SPD - 50148700
4a 4a 5 5 L, N Onsite Wastewater Systems (6500) Urban Runoff/Storm Sewers (4000)
Cyanide (0720) Turbidity (2500)
QUEBRADA LA SALLE PRWQ95F
11.8 SD SPD - 50147675
4a 4a 5 5 N, Q Agriculture (1300) Confined Animal Feeding Operations (1640) Onsite Wastewater Systems (6500)
Pesticides (0200)
QUEBRADA GRANDE DE LA MAJAGUA PRWQ95H
5.6 SD SPD - 50147595
4a 4a 5 5 L, N Agriculture (1300) Onsite Wastewater Systems (6500)
Pesticides (0200)
Cyanide (0720)
QUEBRADA SALADA PRWQ95I
7.9 SD SPD - 50147475
4a 4a 5
1 L, N Confined Animal Feeding Operations (1640) Onsite Wastewater Systems (6500)
Cyanide (0720)
RIO SONADOR PRWR95J
37.7 SD SPD - 50147450
4a 4a 5
1 L, N Agriculture (1300) Confined Animal Feeding Operations (1640) Onsite Wastewater Systems (6500)
Cyanide (0720)

� ! " #$ % &' $ ( ) * + , ) - . / 01 2 3 , ) , . 3 0 4 2 # ! 5 "1 # ! 3 % ! 6 $ " #7 ( * * 7
<= >? @ A BC DE FG H I J G K F J E F J E I E L E M M H N OG K P Q R S T N H U V N W X YZ [ N\ F J G P Q R S] E I E M M H N OG K N L ^ G M FG _ Y G H a a \ F J G M N b bZ FE L F] E I c G [ E b W N b X T N H _ Id C DE FG H I JG K F J E F J E I E L E M M H N OG K P Q R S T N H U V N KG b E e bE FE \ F JG P Q R S ] E I E M M H N OG K N L ^ G M FG _ Y G H a a f \ F J G M N b bZ FE L F] E I c G [ E b W N b X T N H _ Ig C DE FG H I J G K F J E F J E I E L E M M H N OG K P Q R S T N H U V N h HE L KG K G S N Vi E \ F J G P Q R S ] E I E M M H N OG K N L ^ G M FG _ Y G H a a j \ F JG M N b bZ FE L F] E I c G [ E b W N b X T N H _ Ik C DE FG H I J G K E L K IZ Y ] E FG H I J G K F J E F ] G HG _ N L X F N HG K Yl E Il L N M F X [ I FZ Kl E L K ] G HG X L [ bZ K G K X L F J G a a mC f a f n K o b X I Fpq C P J X I ] E FG H I J G K ] E I E b] E l I K Hl X L F J X I [l [ bGr C DE FG H I J G K E L K IZ Y ] E FG H I JG K F JE F] G HG X L [ bZ K G K X L F J G a a sC f a f n K o b X I F Y l E Il L N M F X [ I FZ Kl E L K K N L N F J E OG M G H _E L G L F _ N L X F N H X L t I FE F X N L puC DE FG H I JG K F J E F J E I E L E M M H N OG K P Q R S T N H U V N h HE L KG KG S N Vi E E P Q R S ] E I E M M H N OG K N L vZ tZ I F a a j\ F JG M N b bZ FE L F ] E I R X I I N b OG K wx l t G LyC DE FG H I JG K I F JE F JE OG E M M H N OG K P Q R S N L ^ G M FG _ Y G H a z \ F J G M N b bZ FE L F ] G HG c G [ E b W N b X T N H _ I{C DE FG H I JG K F JE F JE I E L E M M H N OG K P Q R S U V N h HE L K G K G S N Vi E \ F J G P Q R S ] E I E M M H N OG K N L vZ tZ I F a a j\ F JG M N b bZ FE L F] E I W N M M G H|} ~ T F J G Q N L X F N H X L t FE F X N L [ N bZ _ L X I bG T F Y bE L �\ F J G v I I G I I _G L F � L X F] E I L N F _ N L X F N HG K T N H a z � [l [ bG� C DE FG H I JG K F J E F J E I E M M H N OG K P Q R S T H N _ U V N h HE L KG KG S N Vi E \ E P Q R S ] E I E M M H N OG K N L vZ tZ I F a a j \ F J G M N b bZ FE L F] E I v _ _ N L X E� C UG _E X L I X L a z � f a f n K o b X I F KZ G F N N b K I G t _G L FE F X N L G OE bZ E F X N L p�C DE FG H I JG K I F J E F JE OG E M M H N OG K P Q R S N L ^ G M FG _ Y G H a z z \ F J G M N b bZ FE L F] G HG c G [ E b W N b X T N H _�C DE FG H I J G K I F J E F J E OG E L E M M H N OG K P Q R S N L ^ G M FG _ Y G H a z a\ F JG M N b bZ FE L F] G H G c G [ E b W N b X T N H _ I p P JG ] E FG H I J G K I E HG U V N h HE L K G KG v HG [ X Y N\ U V N h HE L K G K G Q E L E F V\ U V N h HE L K G K G v �E I [ NU V N WZ bG Y H X LE I�� �� �� � � � � � �
� � � � � �� � �� � � � � � � � � �� � �� � � � � �� � � � � � � �� � � � �� �� � � ��
,
� �� � � �� � � � � � � � � �� � �� � � � � � � �� �� �� �¡ � � �� � �¢ £ � � �� � �� ¢ � � � �� �� � � � �� �� � � � � �. ¤¥ ¦§ �� � � � � � ��©ª �� �� � � �� � � � � � � � � � �� � � � � � � �� � � � �� ¢ � � � �� �� � � � � � � �� £ � �� � � � � � � � � � � �� � �� � � �� � � � � � � « ¬ «® ¬ ° � ± � � � �²³ ® µ � �¢ � � � � � � �� � � ¶� � �� � � � � �³ ·® ¸ � � � � �� � � � � � �� � � ¶� � �� � � � � �¹ º® » � � � � �� ¼ � �½ ¾® ¶� � ¸ � � �� � � � ¨ � � � � � � � �� �� �

¿À Á  ÃÄ Å ÆÇ Ä È É Ê Ë Ì É Í Î Ï ÐÑ Ò Ó Ì É Ì Î Ó Ð Ô Ò Ã Á Õ ÂÑ Ã Á Ó Å Á Ö Ä Â Ã× È Ê È ×
Table 55: Size of waters Impaired by Causes (Monitored acres for Estuaries) Causes of Impairments Size of Waters Impaired (Acres/Miles)
Surfactants (0400) 648.3 acres, 11.9 miles Arsenic (0510) 23.29 acres Cyanide (0720) 23.29 acres Low Dissolved Oxygen (1200) 652.7 acres, 11.9 miles Thermal Modifications (1400) 49.9 acres Fecal Coliforms (1700) 49.1 acres Total Coliforms (1700) 101.1 acres Turbidity (2500) 187.6 acres, 11.9 miles

ØÙ Ú Û ÜÝ Þ ßà Ý á â ã ä å â æ ç è éê ë ì å â å ç ì é í ë Ü Ú î Ûê Ü Ú ì Þ Ú ï Ý Û Üð á ã å ð
Table 56: 2014 Cycle 303(d) List – List of Estuaries Note: The 2014 303(d) List is comprised of the causes of impairments included in assessments cycles 2014, 2012, 2010, 2008 and 2006.
Basin Waterbody Name
Assessment Unit-ID Waterbody Size (Acres/Miles)
Class
2014 Monitoring
Stations SPD = Special
Project Delisting ED = External
Data
Designated Uses and Categories Summary
Notes Potential Pollution
Sources
Causes of Impairment (Assessments Cycles)
R1 R2 AL DW 2014 2012 2010 2008
2006 Parameter in italic and color noncompliance
in 2004, but compliance in 2006
RIO HERRERA PRER15A
RIO HERRERA PREE15A
65.28 SB 4a 4a 5 N/A H, J, Q Landfills (6300) Onsite Wastewater Systems (6500)
Surfactants (0400)
RIO ESPIRITU SANTO PRER16A
RIO ESPIRITU SANTO PREE16A
368.51 SB 4a 4a 5 N/A F, H, J Major Municipal Point Sources (0210) Onsite Wastewater Systems (6500)
Low Dissolved Oxygen (1200) Surfactants (0400)
Low Dissolved Oxygen (1200)
RIO DEMAJAGUA PRER23A
RIO DEMAJAGUA PREE23A
1.79 SB 4a 4a 5 N/A F, J, M Collection System Failure (0500)
Turbidity (2500)
RIO CANDELERO PRER34A
RIO CANDELERO PREE34A
49.92 SB 4a 4a 5 N/A F, H, J Collection System Failure (0500)
Thermal Modifications (1400)
Low Dissolved Oxygen (1200)
RIO GUAYANES PRER35A
RIO GUAYANES PREE35A
23.29 SB 4a 4a 5 N/A H, J Agriculture (1300) Collection System Failure (0500) Onsite Wastewater Systems (6500)
Arsenic (0510) Turbidity (2500)
Arsenic (0510)
Arsenic (0510) Cyanide (0720)

ØÙ Ú Û ÜÝ Þ ßà Ý á â ã ä å â æ ç è éê ë ì å â å ç ì é í ë Ü Ú î Ûê Ü Ú ì Þ Ú ï Ý Û Üð á ã ä ð
Table 56: 2014 Cycle 303(d) List – List of Estuaries Note: The 2014 303(d) List is comprised of the causes of impairments included in assessments cycles 2014, 2012, 2010, 2008 and 2006.
Basin Waterbody Name
Assessment Unit-ID Waterbody Size (Acres/Miles)
Class
2014 Monitoring
Stations SPD = Special
Project Delisting ED = External
Data
Designated Uses and Categories Summary
Notes Potential Pollution
Sources
Causes of Impairment (Assessments Cycles)
R1 R2 AL DW 2014 2012 2010 2008
2006 Parameter in italic and color noncompliance
in 2004, but compliance in 2006
CAÑO SANTIAGO PREK35.1
CAÑO SANTIAGO PREE35.1
73.72 11.9 miles
SB 4a 4a 5 N/A F, H, J Agriculture (1300) Landfills (6300) Major Municipal Point Sources (0210) Minor Industrial point Source (0120) Onsite Wastewater Systems (6500) Urban Runoff/Storm Sewers (4000)
Low Dissolved Oxygen (1200) Surfactants (0400) Turbidity (2500)
Low Dissolved Oxygen (1200)
RIO MATILDE-PASTILLO PRSR64A
RIO MATILDE-PASTILLO PRSE64A
27.64 SB 4a 4a 5 N/A D, J, M, O
Onsite Wastewater Systems (6500) Urban Runoff/Storm Sewers (4000)
Turbidity (2500) Fecal Coliforms (1700)
RIO TALLABOA PRSR65A
RIO TALLABOA PRSE65A
21.50 SB 2 2 5 N/A J, M, Q Confined Animal Feeding Operations (1640) Onsite Wastewater Systems (6500) Urban Runoff/Storm Sewers (4000)
Turbidity (2500)
CAÑO MERLE CAÑO MERLE PRWE78A
101.12 SB SPD 50138265
5 5 5 N/A M, O, Q
Collection System Failure (0500)
Surfactants (0400) Total Coliforms (1700)
Low Dissolved Oxygen (1200) Total Coliforms (1700)

ØÙ Ú Û ÜÝ Þ ßà Ý á â ã ä å â æ ç è éê ë ì å â å ç ì é í ë Ü Ú î Ûê Ü Ú ì Þ Ú ï Ý Û Üð á ã æ ð
Table 56: 2014 Cycle 303(d) List – List of Estuaries Note: The 2014 303(d) List is comprised of the causes of impairments included in assessments cycles 2014, 2012, 2010, 2008 and 2006.
Basin Waterbody Name
Assessment Unit-ID Waterbody Size (Acres/Miles)
Class
2014 Monitoring
Stations SPD = Special
Project Delisting ED = External
Data
Designated Uses and Categories Summary
Notes Potential Pollution
Sources
Causes of Impairment (Assessments Cycles)
R1 R2 AL DW 2014 2012 2010 2008
2006 Parameter in italic and color noncompliance
in 2004, but compliance in 2006
CAÑO BOQUILLA PRWK82
CAÑO BOQUILLAS PRWE82A
39.68 SB 2 2 5 N/A J, O, Q Onsite Wastewater Systems (6500)
Low Dissolved Oxygen (1200) Surfactants (0400) Turbidity (2500)
QUEBRADA GRANDE CALVACHE PRWQ88A
QUEBRADA GRANDE CALVACHE PRWE88A
1.28 SB SPD 50146150
5 5 5 N/A D, O Urban Runoff/Storm Sewers (4000)
Fecal Coliforms (1700)
Low Dissolved Oxygen (1200)
Fecal Coliforms (1700) Low Dissolved Oxygen (1200)
RIO GUAYABO PRWR94A
RIO GUAYABO PRWE94A
18.43 SB 5 5 5 N/A D, J, M Confined Animal Feeding Operations (1640) Onsite Wastewater Systems (6500) Urban Runoff/Storm Sewers (4000)
Low Dissolved Oxygen (1200)
Fecal Coliforms (1700) Low Dissolved Oxygen (1200)
Notes: D - Watershed and sub watershed that were monitored by a synoptic study and were included in the 2008-303(d) list. F - Watershed and sub watershed that were included in the 2006-303(d) list by a synoptic study and do not have permanent monitoring station. H - Watersheds that have approved TMDL on September 2012, the pollutant were Fecal Coliforms J - If the Monitoring Station column is left blank, the Assessment Unit was not monitored for 2014 cycle ñ® �� �� � � � � � � � � � � � � �� � £ £ �� �� � ò ó ¼ � � ¸ � £ �� ¢ � � � « ¬ ¡ � � � £ � � � � �� � � � � �� ô � � � � � � � � � �¢ O – Watershed and sub watershed who are or have been under Category 4c, are water bodies that lack adequate flow, which impaired some of the designated uses. Q - Watershed and sub watershed that were monitored by a synoptic study and were included in the 2012 -303(d) list. R1 - Primary Contact Recreation R2 - Secondary Contact Recreation AL - Aquatic Life DW - Raw Source for Drinking Water

¿À Á  ÃÄ Å ÆÇ Ä È É Ê Ë Ì É Í Î Ï ÐÑ Ò Ó Ì É Ì Î Ó Ð Ô Ò Ã Á Õ ÂÑ Ã Á Ó Å Á Ö Ä Â Ã× È Ê õ ×
Table 57: Size of waters Impaired by Causes San Juan Bay Estuary System Causes of Impairments Size of Waters Impaired (Miles)
Surfactants (0400) 64.6 acres, 74.7 miles Arsenic (0510) 18.8 miles Cadmium (0520) 2,389.2 acres, 47.9 miles Copper (0530) 2,453.8 acres, 122.6 miles Lead (0550) 2,453.8 acres, 122.6 miles Mercury (0560) 2,389.2 acres, 66.7 miles Selenium (0570) 18.8 miles Ammonia (0600) 64.6 acres, 55.9 miles Cyanide (0720) 2,453.8 acres, 122.6 miles Nitrate + Nitrite (0990) 64.6 acres, 55.9 miles pH (1000) 2,453.8 acres, 122.6 miles Low Dissolved Oxygen (1200) 2,453.8 acres, 122.6 miles Thermal Modifications (1400) 2,453.8 acres, 122.6 miles Fecal Coliforms (1700) 2,389.2 acres, 47.9 miles Enterococcus Bacteria (1700) 2,389.2 acres, 66.7 miles Total Coliforms (1700) 2,453.8 acres, 103.8 miles Oil and Grease (1900) 2,453.8 acres, 122.6 miles Turbidity (2500) 2,389.2 acres, 66.7 miles

ØÙ Ú Û ÜÝ Þ ßà Ý á â ã ä å â æ ç è éê ë ì å â å ç ì é í ë Ü Ú î Ûê Ü Ú ì Þ Ú ï Ý Û Üð á ã ö ð
Table 58: 2014 Cycle 303(d) List – List of San Juan Bay Estuary System Note: The 2014 303(d) List is comprised of the causes of impairments included in assessment cycles 2014, 2012, 2010, 2008 and 2006.
Basin Waterbody Name Waterbody Size (Acres/Miles)
2014 Monitoring Station
NS =Network ED = External Data
Designated Uses and Categories Summary
Notes Potential Pollution
Sources
Causes of Impairment (Assessments Cycles)
R1 R2 AL DW 2014 2012 2010 2008
2006 Parameter in italic and color noncompliance in 2004, but compliance in
2006 ESTUARY SYSTEM
PREE13A1 Caño Control de La Malaria Bahía de San Juan Caño San Antonio Laguna Del Condado Península La Esperanza
18.8 mi
NS 070 071 072
ED-BSJ 1, 2, 3 LC 1, 2 CSA
La Malaria PLE
50048580
5 5 5 N/A H, P Major Industrial Point Sources (0110) Major Municipal Point Sources (0210) Marinas and Recreational Boating (7900) Minor Industrial Point Sources (0120) Onsite Wastewater System (6500) Urban Runoff/Storm Sewers (4000)
Enterococcus Bacteria (1700) Low Dissolved Oxygen (1200) Oil & Grease (1900) pH (1000) Thermal Modifications (1400) Turbidity (2500)
Enterococcus Bacteria (1700) Low Dissolved Oxygen (1200) Oil & Grease (1900) pH (1000) Turbidity (2500)
Low Dissolved Oxygen (1200) Oil &Grease (1900) Turbidity (2500)
Arsenic (0510) Copper (0530) Cyanide (0720) Lead (0550) Low Dissolved Oxygen (1200) Mercury (0560) pH (1000) Selenium (0570) Surfactants (0400) Thermal Modifications (1400)
ESTUARY SYSTEM
PREE13A2 Río Piedras Lago Las Curías
55.9 mi 64.6 acres
NS 89027 89028
50049100 50048800
ED-RP 01, 02, 03, RPN, Lago Las
Curias ULTRA Project 2, 3, 4, 5,6, 9, 10 and
CC
5 5 5 5 H, P Collection System Failure (0500) Confined Animal Feeding Operations (1640) Landfills (6300) Major Industrial Point Sources (0110) Urban Runoff/Storm Sewers (4000)
Ammonia (0600) Low Dissolved Oxygen (1200) Oil & Grease (1900) pH (1000) Thermal Modifications (1400) Total Coliforms (1700) Turbidity (2500)
Ammonia (0600) Low Dissolved Oxygen (1200) Nitrate + Nitrite (0990) Oil & Grease (1900) pH (1000) Surfactants (0400) Lead (0550) Total Coliforms (1700) Turbidity (2500)
Ammonia (0600) Copper (0530) Cyanide (0720) Low Dissolved Oxygen (1200) Oil &Grease (1900) Surfactants (0400) Turbidity (2500)
Ammonia (0600) Copper (0530) Lead (0550) Low Dissolved Oxygen (1200) Surfactants (0400) Turbidity (2500)
Ammonia (0600) Copper (0530) Cyanide (0720) Low Dissolved Oxygen (1200) Surfactants (0400) Turbidity (2500)

ØÙ Ú Û ÜÝ Þ ßà Ý á â ã ä å â æ ç è éê ë ì å â å ç ì é í ë Ü Ú î Ûê Ü Ú ì Þ Ú ï Ý Û Üð á ã ÷ ð
Table 58: 2014 Cycle 303(d) List – List of San Juan Bay Estuary System Note: The 2014 303(d) List is comprised of the causes of impairments included in assessment cycles 2014, 2012, 2010, 2008 and 2006.
Basin Waterbody Name Waterbody Size (Acres/Miles)
2014 Monitoring Station
NS =Network ED = External Data
Designated Uses and Categories Summary
Notes Potential Pollution
Sources
Causes of Impairment (Assessments Cycles)
R1 R2 AL DW 2014 2012 2010 2008
2006 Parameter in italic and color noncompliance in 2004, but compliance in
2006
ESTUARY SYSTEM
PREE13A3 Caño Martín Peña Quebrada Juan Méndez Quebrada San Antón Quebrada Blasina Canal Machicote Canal Suárez Laguna San José Laguna Torrecillas Laguna de Piñones Laguna Los Corozos
2,389.2 acres 47.9 mi
NS 50050300 50049820
ED - CS 1, 2 CMP
LSJ 1, 2 Blasina
San Antón Laguna Los Corozos Laguna Torrecillas
1, 2, 3 Juan Méndez
Laguna Piñones
5 5 5 N/A P Collection System Failure (0500) Confined Animal Feeding Operations (1640) Onsite Wastewater System (6500) Urban Runoff/Storm Sewers (4000)
Fecal Coliforms (1700) Enterococcus Bacteria (1700) Low Dissolved Oxygen (1200) Oil & Grease (1900) pH (1000) Thermal Modifications (1400) Total Coliforms (1700) Turbidity (2500)
Cadmium (0520) Copper (0550) Fecal Coliforms (1700) Enterococcus Bacteria (1700) Lead (0550) Low Dissolved Oxygen (1200) Mercury (0560) Oil & Grease (1900) pH (1000) Thermal Modifications (1400) Total Coliforms (1700) Turbidity (2500)
Cyanide (0720) Fecal Coliforms (1700) Low Dissolved Oxygen (1200) Oil &Grease (1900) pH (1000) Turbidity (2500)
Fecal Coliforms (1700) Low Dissolved Oxygen (1200)
Cyanide (0720) Fecal Coliforms (1700) Low Dissolved Oxygen (1200) pH (1000) Turbidity (2500)
Notes:
H - Watersheds that have approved TMDL on September 2012, the pollutant were Fecal Coliforms P - External Data R1 - Primary Contact Recreation R2 - Secondary Contact Recreation AL - Aquatic Life DW - Raw Sources for Drinking Water N/A - Not applicable

¿À Á  ÃÄ Å ÆÇ Ä È É Ê Ë Ì É Í Î Ï ÐÑ Ò Ó Ì É Ì Î Ó Ð Ô Ò Ã Á Õ ÂÑ Ã Á Ó Å Á Ö Ä Â Ã× È Ê ø ×
Table 59: Size of waters Impaired by Causes (Monitored acres for Lagoons) Causes of Impairments Size of Waters Impaired (Acres)
Copper (0530) 1,675 Cyanide (0720) 554
pH (1000) 813 Low Dissolved Oxygen (1200) 2,482 Enterococcus Bacteria (1700) 636 Thermal Modification (1400) 257 Turbidity (2500) 918

ØÙ Ú Û ÜÝ Þ ßà Ý á â ã ä å â æ ç è éê ë ì å â å ç ì é í ë Ü Ú î Ûê Ü Ú ì Þ Ú ï Ý Û Üð á á â ð
Table 60: 2014 Cycle 303(d) List – List of Lagoons
Note: The 2014 303(d) List is comprised of the impairments included in assessment cycles 2014, 2012, 2010, and 2008.
Municipality Waterbody Name Assessment Unit
(AU-ID) Class
2014 Monitoring Stations
NS = Network SS = Synoptic Studies ED = External Data
WB Size (Acres)
Designated Uses and Categories Summary Notes
Potential Pollution Sources
Causes of Impairment (Assessment Cycles)
R1 R2 AL 2014 2012 2010 2008
MAYAGÜEZ Laguna Joyudas PRWN0005 SB SS 50130305 50130035
339 4a 4a 5 M Onsite Wastewater Systems (6500) Urban Runoff/Storm Sewers (4000) Natural Sources (8600)
Copper (0530) Low Dissolved Oxygen (1200)
VEGA BAJA MANATÍ
Laguna Tortuguero PRNN0006 SE NS 50038200
SS 50038191 50038194
554 1 1 5 Onsite Wastewater Systems (6500) Urban Runoff/Storm Sewers (4000)
Low Dissolved Oxygen (1200)
Low Dissolved Oxygen (1200)
Cyanide (0720)
DORADO Laguna Mata Redonda
PRNN0007 SB SS 50039850 50039840
15 1 1 5 Unknown Sources (9000)
Low Dissolved Oxygen (1200) pH (1000)
FAJARDO Laguna Aguas Prietas
PREN0011 SB SS
50069550 50069500
128 1 1 5
Natural Sources (8600) Unknown Sources (9000)
Copper (0530) Low Dissolved Oxygen (1200) Turbidity (2500)

ØÙ Ú Û ÜÝ Þ ßà Ý á â ã ä å â æ ç è éê ë ì å â å ç ì é í ë Ü Ú î Ûê Ü Ú ì Þ Ú ï Ý Û Üð á á ã ð
Table 60: 2014 Cycle 303(d) List – List of Lagoons Note: The 2014 303(d) List is comprised of the impairments included in assessment cycles 2014, 2012, 2010, and 2008.
Municipality Waterbody Name Assessment Unit
(AU-ID) Class
2014 Monitoring Stations
NS = Network SS = Synoptic Studies ED = External Data
WB Size (Acres)
Designated Uses and Categories Summary Notes
Potential Pollution Sources
Causes of Impairment (Assessment Cycles)
R1 R2 AL 2014 2012 2010 2008
FAJARDO Laguna Grande PREN0012 SB SS 50069620 50069600
216 5 5 5 Marinas and Recreational Boating (7900) Onsite Wastewater Systems (6500) Urban Runoff/Storm Sewers (4000)
Enterococcus Bacteria (1700) Low Dissolved Oxygen (1200)
Low Dissolved Oxygen (1200) pH (1000)
CEIBA Laguna Ceiba PREN0013 SB SS 50072940 50072950
120 5 5 5 Natural Sources (8600) Unknown Sources (9000)
Copper (0530) Fecal Enterococcus Bacteria (1700) Low Dissolved Oxygen (1200) pH (1000)
GUAYAMA Laguna Pozuelo PRSN0014 SB SS 50098560 50098550
35 1 1 5 Urban Runoff/Storm Sewers (4000) Natural Sources (8600) Unknown Sources (9000)
Low Dissolved Oxygen (1200) pH (1000) Copper (0530) Thermal Modification (1400)
SALINAS Laguna Mar Negro PRSN0015 SB SS 50099800 50099830
208 1 1 5 Urban Runoff/Storm Sewers (4000) Natural Sources (8600)
Copper (0530) Low Dissolved Oxygen (1200) pH (1000)

ØÙ Ú Û ÜÝ Þ ßà Ý á â ã ä å â æ ç è éê ë ì å â å ç ì é í ë Ü Ú î Ûê Ü Ú ì Þ Ú ï Ý Û Üð á á á ð
Table 60: 2014 Cycle 303(d) List – List of Lagoons Note: The 2014 303(d) List is comprised of the impairments included in assessment cycles 2014, 2012, 2010, and 2008.
Municipality Waterbody Name Assessment Unit
(AU-ID) Class
2014 Monitoring Stations
NS = Network SS = Synoptic Studies ED = External Data
WB Size (Acres)
Designated Uses and Categories Summary Notes
Potential Pollution Sources
Causes of Impairment (Assessment Cycles)
R1 R2 AL 2014 2012 2010 2008
SALINAS Laguna Punta Arenas
PRSN0016 SB SS 50099920 500099900
18 1 1 5 Natural Sources (8600) Unknown Sources (9000)
Copper (0530) Low Dissolved Oxygen (1200) Thermal Modification (1400) Turbidity (2500)
SALINAS Laguna Tiburones PRSN0017 SB SS 50099960 50099975
14 1 1 5 Landfills (6300) Natural Sources (8600) Unknown Sources (9000)
Copper (0530) Low Dissolved Oxygen (1200) pH (1000) Thermal Modification (1400) Turbidity (2500)
PONCE Laguna Salinas PRSN0018 SB SS 50119310 50119360
77 1 1 5 Inappropriate Waste Disposal (6350) Onsite Wastewater Systems (6500) Unknown Sources (9000)
Copper (0530) Low Dissolved Oxygen (1200)
CABO ROJO Laguna Salinas I (Fraternidad)
PRSN0019 SB SS 50129855 50129860
294 1 1 5 Onsite Wastewater Systems (6500) Natural Sources (8600)
Copper (0530) Low Dissolved Oxygen (1200) Turbidity (2500)

ØÙ Ú Û ÜÝ Þ ßà Ý á â ã ä å â æ ç è éê ë ì å â å ç ì é í ë Ü Ú î Ûê Ü Ú ì Þ Ú ï Ý Û Üð á á å ð
Table 60: 2014 Cycle 303(d) List – List of Lagoons Note: The 2014 303(d) List is comprised of the impairments included in assessment cycles 2014, 2012, 2010, and 2008.
Municipality Waterbody Name Assessment Unit
(AU-ID) Class
2014 Monitoring Stations
NS = Network SS = Synoptic Studies ED = External Data
WB Size (Acres)
Designated Uses and Categories Summary Notes
Potential Pollution Sources
Causes of Impairment (Assessment Cycles)
R1 R2 AL 2014 2012 2010 2008
CABO ROJO Laguna Cabo Rojo 2 (Candelaria)
PRSN0020 SB SS 50129866 50129870
190 1 1 5 Natural Sources (8600) Unknown Sources (9000)
Copper (0530) Low Dissolved Oxygen (1200) Thermal Modification (1400) Turbidity (2500)
CABO ROJO Laguna Cabo Rojo 3 (El Faro)
PRSN0021 SB SS 50129863 50129865
69 1 1 5 Natural Sources (8600) Unknown Sources (9000)
Copper (0530) Low Dissolved Oxygen (1200) Turbidity (2500)
RINCÓN – CABO ROJO
Caño Boquerón PRSN0022 SB SS 50129950 50129945
183 1 1 5 Marinas and Recreational Boating (7900) Natural Sources (8600)
Copper (0530) Low Dissolved Oxygen (1200) pH (1000) Turbidity (2500)
CABO ROJO Laguna Guaniquilla PRSN0023 SB SS 50130025 50130020
22 1 1 5 Unknown Sources (9000)
Low Dissolved Oxygen (1200) pH (1000) Turbidity (2500)
Notes:
M - Watersheds that have approved TMDL on September 2011, the pollutant were Fecal Coliforms. R1 - Primary Contact Recreation R2 - Secondary Contact Recreation AL - Aquatic Life

¿À Á  ÃÄ Å ÆÇ Ä È É Ê Ë Ì É Í Î Ï ÐÑ Ò Ó Ì É Ì Î Ó Ð Ô Ò Ã Á Õ ÂÑ Ã Á Ó Å Á Ö Ä Â Ã× È È Ë ×
Table 61: Size of waters Impaired by Causes (Monitored acres/miles for Lakes) Causes of Impairments Size of Waters Impaired (Acres/Miles)
Pesticides (0200) 2,133.0 acres, 48.8 miles Surfactants (0400) 634.0 acres, 6.9 miles Arsenic (0510) 1,194.0 acres, 21.9 miles Copper (0530) 2,047.0 acres, 25.9 miles Lead (0550) 713.0 acres, 7.2 miles Cyanide (0720) 1,194.0 acres, 21.9 miles Phosphorus (0910) 560.0 acres, 15.0 miles pH (1000) 1,310.0 acres, 35.2 miles Low Dissolved Oxygen (1200) 7,323.0 acres, 136.1 miles Turbidity (2500) 1,413.0 acres, 19.0 miles

ØÙ Ú Û ÜÝ Þ ßà Ý á â ã ä å â æ ç è éê ë ì å â å ç ì é í ë Ü Ú î Ûê Ü Ú ì Þ Ú ï Ý Û Üð á á æ ð
Table 62: 2014 Cycle 303(d) List – List of Lakes Note: The 2014 303(d) List is comprised of the impairments included in assessments cycles 2014, 2012, 2010, 2008 and 2006.
Basin Waterbody Name WB Size
(Acres/Miles) Class
2014 Monitoring
Station NS = Network SPD = Special
Project Delisting
ED = External Data
Designated Uses and Categories
Summary
Notes Potential Pollution Sources
Causes of Impairment (Assessment Cycles)
R1 R2 AL DW 2014 2012 2010 2008
2006 Parameter in italic and color noncompliance in 2004, but compliance in
2006
RIO GUAJATACA
LAGO GUAJATACA PRNL3A1
1000 ac. 2.6 mi
SD NS 50010720 50010790 50011000
4a 4a 5 2 H Confined Animal Feeding Operations (1640) Minor Industrial Point Sources (0120) Onsite Wastewater Systems (6500)
Low Dissolved Oxygen (1200)
Low Dissolved Oxygen (1200)
Low Dissolved Oxygen (1200)
Low Dissolved Oxygen (1200)
Low Dissolved Oxygen (1200)
RIO GRANDE DE ARECIBO
LAGO DOS BOCAS PRNL17A1
634 ac. 6.9 mi
SD NS 50025110 50027090 50025000
ED
PR13086
4a 4a 5 5 N, P Agriculture (1300) Confined Animal Feeding Operations (1640) Minor Industrial Point Sources (0120) Onsite Wastewater Systems (6500)
Low Dissolved Oxygen (1200)
Low Dissolved Oxygen (1200) pH (1000)
Low Dissolved Oxygen (1200)
Low Dissolved Oxygen (1200)
Arsenic (0510) Copper (0530) Cyanide (0720) Low Dissolved Oxygen (1200) Surfactants (0400)
RIO GRANDE DE ARECIBO
LAGO CAONILLAS PRNL27C1
700 ac. 11.8 mi
SD NS 89001 89002 89003
50026050
4a 4a 5 5 N Agriculture (1300) Onsite Wastewater Systems (6500) Upstream Impoundment (7350)
Low Dissolved Oxygen (1200) Turbidity (2500)
Copper (0530) Low Dissolved Oxygen (1200)
Low Dissolved Oxygen (1200)
Low Dissolved Oxygen (1200) Pesticides (0200)
Low Dissolved Oxygen (1200)
RIO GRANDE DE ARECIBO
LAGO GARZAS PRNL37A3
108 ac. 2.7 mi
SD NS 50020050
4a 4a 5 5 N Agriculture (1300) Onsite Wastewater Systems (6500)
Low Dissolved Oxygen (1200)
Low Dissolved Oxygen (1200)
Low Dissolved Oxygen (1200)
Pesticides (0200) Low Dissolved Oxygen (1200)
RIO GRANDE DE MANATÍ
LAGO GUINEO PRNL18C1
54 ac. 1.7 mi
SD NS 89007 89008
4a 4a 5 5 N Agriculture (1300) Onsite Wastewater Systems (6500)
Low Dissolved Oxygen (1200)
Low Dissolved Oxygen (1200)
Pesticides (0200) Low Dissolved Oxygen (1200)

ØÙ Ú Û ÜÝ Þ ßà Ý á â ã ä å â æ ç è éê ë ì å â å ç ì é í ë Ü Ú î Ûê Ü Ú ì Þ Ú ï Ý Û Üð á á ù ð
Table 62: 2014 Cycle 303(d) List – List of Lakes Note: The 2014 303(d) List is comprised of the impairments included in assessments cycles 2014, 2012, 2010, 2008 and 2006.
Basin Waterbody Name WB Size
(Acres/Miles) Class
2014 Monitoring
Station NS = Network SPD = Special
Project Delisting
ED = External Data
Designated Uses and Categories
Summary
Notes Potential Pollution Sources
Causes of Impairment (Assessment Cycles)
R1 R2 AL DW 2014 2012 2010 2008
2006 Parameter in italic and color noncompliance in 2004, but compliance in
2006
RIO GRANDE DE MANATÍ
LAGO MATRULLAS PRNL28C1
77 ac. 3.0 mi
SD NS 89009 89010
4a 4a 5 2 N Agriculture (1300) Confined Animal Feeding Operations (1640)
pH (1000) Low Dissolved Oxygen (1200)
Low Dissolved Oxygen (1200) pH (1000)
Low Dissolved Oxygen (1200) pH (1000)
pH (1000)
RIO DE LA PLATA
LAGO DE LA PLATA PREL110A1
560 ac. 15.0 mi
SD NS
50044400 50044950 50044850
ED
PR13021
4a 4a 5 5 B, P Confined Animal Feeding Operations (1640) Landfills (6300) Onsite Wastewater Systems (6500)
Low Dissolved Oxygen (1200)
Low Dissolved Oxygen (1200)
Low Dissolved Oxygen (1200)
Low Dissolved Oxygen (1200)
Arsenic (0510) Cyanide (0720) Low Dissolved Oxygen (1200) Phosphorus (0910)
RIO DE LA PLATA
LAGO CARITE PREL210A5
333 ac. 11.3 mi
SD NS 50039900 50039950
ED 7
4a 4a 5 2 B, P Confined Animal Feeding Operations (1640) Onsite Wastewater Systems (6500)
Low Dissolved Oxygen (1200)
Low Dissolved Oxygen (1200) pH (1000)
Low Dissolved Oxygen (1200)
Low Dissolved Oxygen (1200)
RIO BAYAMON
LAGO CIDRA PREL12A2
268 ac. 8.3 mi
SD NS 89029 89030 89031
ED
PR13010
4a 4a 5 2 H, P Confined Animal Feeding Operations (1640) Minor Industrial Point Sources (0120) Onsite Wastewater Systems (6500)
Low Dissolved Oxygen (1200)
Low Dissolved Oxygen (1200)
Low Dissolved Oxygen (1200)
Low Dissolved Oxygen (1200)
Low Dissolved Oxygen (1200)

ØÙ Ú Û ÜÝ Þ ßà Ý á â ã ä å â æ ç è éê ë ì å â å ç ì é í ë Ü Ú î Ûê Ü Ú ì Þ Ú ï Ý Û Üð á á ö ð
Table 62: 2014 Cycle 303(d) List – List of Lakes Note: The 2014 303(d) List is comprised of the impairments included in assessments cycles 2014, 2012, 2010, 2008 and 2006.
Basin Waterbody Name WB Size
(Acres/Miles) Class
2014 Monitoring
Station NS = Network SPD = Special
Project Delisting
ED = External Data
Designated Uses and Categories
Summary
Notes Potential Pollution Sources
Causes of Impairment (Assessment Cycles)
R1 R2 AL DW 2014 2012 2010 2008
2006 Parameter in italic and color noncompliance in 2004, but compliance in
2006
RIO GRANDE DE LOIZA
LAGO LOIZA PREL14A1
713 ac. 7.2 mi
SD NS 50057500 50058800 50059000
4a 4a 5 5 C Collection System Failure (0500) Confined Animal Feeding Operations (1640) Onsite Wastewater Systems (6500) Urban Runoff/Storm Sewers (4000)
Copper (0530) Low Dissolved Oxygen (1200) Turbidity (2500)
Copper (0530) Lead (0550) Low Dissolved Oxygen (1200) Turbidity (2500)
Low Dissolved Oxygen (1200) Turbidity (2500)
Low Dissolved Oxygen (1200) Turbidity (2500)
RIO GRANDE DE PATILLAS
LAGO PATILLAS PRSL43A1
312ac. SD NS 89022 89023 89024 89025
4a 4a 5 5 M Agriculture (1300) Onsite Wastewater Systems (6500)
Low Dissolved Oxygen (1200)
Low Dissolved Oxygen (1200)
Low Dissolved Oxygen (1200)
Low Dissolved Oxygen (1200) Pesticides (0200)
Low Dissolved Oxygen (1200)
QUEBRADA MELANIA
LAGO MELANIA PRSL50A
35ac. SD NS 89026
4a 4a 5 5 M Agriculture (1300) Onsite Wastewater Systems (6500)
Low Dissolved Oxygen (1200)
Low Dissolved Oxygen (1200)
Pesticides (0200)
RIO JACAGUAS
LAGO GUAYABAL PRSL160A1
373 ac. 5.9 mi
SD NS 89011 89012 89013
4a 4a 5 5 H Agriculture (1300) Collection System Failure (0500) Onsite Wastewater Systems (6500)
Low Dissolved Oxygen (1200)
Low Dissolved Oxygen (1200)
Low Dissolved Oxygen (1200)
Low Dissolved Oxygen (1200) Pesticides (0200)
Low Dissolved Oxygen (1200)

ØÙ Ú Û ÜÝ Þ ßà Ý á â ã ä å â æ ç è éê ë ì å â å ç ì é í ë Ü Ú î Ûê Ü Ú ì Þ Ú ï Ý Û Üð á á ÷ ð
Table 62: 2014 Cycle 303(d) List – List of Lakes Note: The 2014 303(d) List is comprised of the impairments included in assessments cycles 2014, 2012, 2010, 2008 and 2006.
Basin Waterbody Name WB Size
(Acres/Miles) Class
2014 Monitoring
Station NS = Network SPD = Special
Project Delisting
ED = External Data
Designated Uses and Categories
Summary
Notes Potential Pollution Sources
Causes of Impairment (Assessment Cycles)
R1 R2 AL DW 2014 2012 2010 2008
2006 Parameter in italic and color noncompliance in 2004, but compliance in
2006
RIO JACAGUAS
LAGO TOA VACA PRSL260A1
836 ac. 31.5 mi
SD NS 89014 89015 89016
ED
PR13077
4a 4a 5 2 H, P Agriculture (1300) Onsite Wastewater Systems (6500)
Low Dissolved Oxygen (1200)
Low Dissolved Oxygen (1200)
Low Dissolved Oxygen (1200)
Low Dissolved Oxygen (1200)
RIO BUCANA-CERRILLOS
LAGO CERRILLOS PRSL62A1
700ac. SD NS 89032 89033 89034
4a 4a 5 2 M Urban Runoff/Storm Sewers (4000)
Low Dissolved Oxygen (1200)
Low Dissolved Oxygen (1200)
Low Dissolved Oxygen (1200)
Low Dissolved Oxygen (1200)
Low Dissolved Oxygen (1200)
RIO YAUCO LAGO LUCHETTI PRSL68A1
266 ac. 14.0 mi
SD NS 89017 89018 89019
ED
PR13064
4a 4a 5 5 H, P Agriculture (1300) Onsite Wastewater Systems (6500)
Low Dissolved Oxygen (1200)
Low Dissolved Oxygen (1200)
Low Dissolved Oxygen (1200) pH (1000)
Low Dissolved Oxygen (1200) Pesticides (0200)
Low Dissolved Oxygen (1200)
RIO LOCO LAGO LOCO PRSL69A
69 ac. 1.5 mi
SD NS 89020 89021
4a 4a 5 2 H Onsite Wastewater Systems (6500)
Low Dissolved Oxygen (1200)
Low Dissolved Oxygen (1200)
Low Dissolved Oxygen (1200)
Low Dissolved Oxygen (1200)

ØÙ Ú Û ÜÝ Þ ßà Ý á â ã ä å â æ ç è éê ë ì å â å ç ì é í ë Ü Ú î Ûê Ü Ú ì Þ Ú ï Ý Û Üð á á ú ð
Table 62: 2014 Cycle 303(d) List – List of Lakes Note: The 2014 303(d) List is comprised of the impairments included in assessments cycles 2014, 2012, 2010, 2008 and 2006.
Basin Waterbody Name WB Size
(Acres/Miles) Class
2014 Monitoring
Station NS = Network SPD = Special
Project Delisting
ED = External Data
Designated Uses and Categories
Summary
Notes Potential Pollution Sources
Causes of Impairment (Assessment Cycles)
R1 R2 AL DW 2014 2012 2010 2008
2006 Parameter in italic and color noncompliance in 2004, but compliance in
2006
RIO GRANDE DE AÑASCO
LAGO GUAYO PRWL83H
285 ac. 12.7 mi
SD NS 89004 89005 89006
4a 4a 5 5 N Agriculture (1300) Major Industrial Point Sources (0110) Minor Industrial Point Sources (0120) Onsite Wastewater Systems (6500)
Low Dissolved Oxygen (1200)
Low Dissolved Oxygen (1200)
Low Dissolved Oxygen (1200)
Low Dissolved Oxygen (1200) Pesticides (0200)
Low Dissolved Oxygen (1200)
Notes:
B - Watershed that has an approved TMDL for Río de la Plata, the TMDL was approved on September 2003, the pollutant was Fecal Coliforms C - Watershed that has an approved TMDL for Río Grande de Loíza, the TMDL was approved on September 2007, the pollutant was Fecal Coliforms H - Watersheds that have approved TMDL on September 2012, the pollutant were Fecal Coliforms M - Watersheds that have approved TMDL on September 2011, the pollutant were Fecal Coliform N - Watersheds that have an approved TMDL on September 2010, the pollutant were Fecal Coliforms. The watersheds are Río Grande de Arecibo, Río Grande de Manatí, Río Grande de Añasco Río Culebrinas. P – External Data R1 - Primary Contact Recreation R2 - Secondary Contact Re AL - Aquatic Life DW - Raw Source for Drinking Water

¿À Á  ÃÄ Å ÆÇ Ä È É Ê Ë Ì É Í Î Ï ÐÑ Ò Ó Ì É Ì Î Ó Ð Ô Ò Ã Á Õ ÂÑ Ã Á Ó Å Á Ö Ä Â Ã× È Ì É ×
Table 63: Size of Waters Impaired by Causes Coastal Shoreline
Causes of Impairment Coastal Waters Impaired
(Size in Miles) Arsenic (0510) 7.79 Copper (0530) 7.79 pH (1000) 142.60 Low Dissolved Oxygen (1200) 191.50 Thermal Modifications (1400) 96.26 Enterococcus (1700) 97.40 Fecal Coliforms (1700) 15.62 Turbidity (2500) 233.41 Oil and Grease 82.42

ØÙ Ú Û ÜÝ Þ ßà Ý á â ã ä å â æ ç è éê ë ì å â å ç ì é í ë Ü Ú î Ûê Ü Ú ì Þ Ú ï Ý Û Üð á å ã ð
Table 64: 2014 Cycle 303(d) List – List of Coastal Shoreline Note: The 2014 303(d) List is comprised of the causes of impairments included in assessment cycles 2014, 2012, 2010, 2008 and 2006.
Assessment Unit ID (AU)
Size of AU
(miles) Class
Monitoring Station EQB Network and ED=External Data
Designated Uses and Categories
Summary
Notes Potential Sources of
Pollution
Causes of Impairment (assessment cycles)
R1 R2 AL 2014 2012 2010 2008
2006 Parameter in italic
and color noncompliance in
2004, but compliance in 2006
PRNC02 (Punta Sardina to Punta Manglillo)
14.10 SB MAC-086, SBZ-006, MAC-047
5 5 5 Major Industrial Point Sources (0110) Onsite Wastewater Systems (6500) Urban Runoff/Storm Sewers (4000)
Enterococcus Bacteria (1700) Low Dissolved Oxygen (1200) Turbidity (2500)
Low Dissolved Oxygen (1200) Turbidity (2500)
Low Dissolved Oxygen (1200)
Enterococcus Bacteria (1700)
PRNC04 (Punta Morrillos to Punta Manatí)
13.66 SB MAC-049, SBZ-008,SBZ-009, MAC-055
1 1 5 Collection System Failure (0500) Onsite Wastewater Systems (6500) Urban Runoff/Storm Sewers (4000) Upstream Impoundment (7350)
Turbidity (2500) Turbidity (2500)
PRNC08 (Punta Cerro Gordo to Punta Boca Juana)
7.32 SB SBZ-013, SBZ-014, RW-18, MAC-061
1 1 5 Onsite Wastewater Systems (6500) Urban Runoff/Storm Sewers (4000)
pH (1000)
PREC09 (Punta Boca Juana to Punta Salinas)
5.78 SB MAC-077, RW-19 1 1 5 Onsite Wastewater Systems (6500) Urban Runoff/Storm Sewers (4000)
pH (1000) Low Dissolved Oxygen (1200)
pH (1000)

ØÙ Ú Û ÜÝ Þ ßà Ý á â ã ä å â æ ç è éê ë ì å â å ç ì é í ë Ü Ú î Ûê Ü Ú ì Þ Ú ï Ý Û Üð á å á ð
Table 64: 2014 Cycle 303(d) List – List of Coastal Shoreline Note: The 2014 303(d) List is comprised of the causes of impairments included in assessment cycles 2014, 2012, 2010, 2008 and 2006.
Assessment Unit ID (AU)
Size of AU
(miles) Class
Monitoring Station EQB Network and ED=External Data
Designated Uses and Categories
Summary
Notes Potential Sources of
Pollution
Causes of Impairment (assessment cycles)
R1 R2 AL 2014 2012 2010 2008
2006 Parameter in italic
and color noncompliance in
2004, but compliance in 2006
PREC10B (Punta Salinas to Rio Bayamón Mouth)
2.91 SB SBZ-016, MAC-063 5 5 5 Major Industrial Point Sources (0110) Onsite Wastewater Systems (6500) Urban Runoff/Storm Sewers (4000)
Enterococcus Bacteria (1700) Turbidity (2500)
Low Dissolved Oxygen (1200)
Turbidity (2500)
PREC10C (Rio Bayamón Mouth to Isla de Cabras)
6.63 SB 3 3 5 B Major Industrial Point Sources (0110) Onsite Wastewater Systems (6500) Urban Runoff/Storm Sewers (4000)
Turbidity (2500)
PREC11 (Isla de Cabras to Punta del Morro)
7.79 SC
5 5 5 B Major Industrial Point Sources (0110) Major Municipal Point Sources (0210) Marinas and Recreational Boating (7900) Minor Municipal Point Sources (0220) Onsite Wastewater Systems (6500) Urban Runoff/Storm Sewers (4000)
Arsenic (0510) Copper (0530) Fecal Coliforms (1700) Low Dissolved Oxygen (1200)

ØÙ Ú Û ÜÝ Þ ßà Ý á â ã ä å â æ ç è éê ë ì å â å ç ì é í ë Ü Ú î Ûê Ü Ú ì Þ Ú ï Ý Û Üð á å å ð
Table 64: 2014 Cycle 303(d) List – List of Coastal Shoreline Note: The 2014 303(d) List is comprised of the causes of impairments included in assessment cycles 2014, 2012, 2010, 2008 and 2006.
Assessment Unit ID (AU)
Size of AU
(miles) Class
Monitoring Station EQB Network and ED=External Data
Designated Uses and Categories
Summary
Notes Potential Sources of
Pollution
Causes of Impairment (assessment cycles)
R1 R2 AL 2014 2012 2010 2008
2006 Parameter in italic
and color noncompliance in
2004, but compliance in 2006
PREC12 (Punta del Morro to West side of Condado Bridge)
3.50 SB SBZ-018, SBZ-019, RW-20B, RW-20A ED CariCoos Buoy
B-
1 1 5 C Urban Runoff/Storm Sewers (4000)
pH (1000)
PREC14 (Punta Las Marías to Punta Cangrejos)
4.19 SB EB-40, EB-41, EB-42, 004C, B-3, RW-
21, RW-21C
1 1 5 Marinas and Recreational Boating (7900) Urban Runoff/Storm Sewers (4000)
Turbidity (2500) pH (1000)
PREC17 (Punta Miquillo to Punta La Bandera)
8.41 SB MAC-009, RW-1A, RW-1C
1 1 5 Onsite Wastewater Systems (6500) Urban Runoff/Storm Sewers (4000)
Low Dissolved Oxygen (1200) pH (1000)
PREC18 (Punta La Bandera to Cabezas de San Juan)
10.46 SB SBZ-030, MAC-010, RW-2
1 1 5 Unknown Source (9000)
Low Dissolved Oxygen (1200) Turbidity (2500)
Low Dissolved Oxygen (1200) Turbidity (2500)
PREC19 (Cabezas de San Juan to Punta Barrancas)
7.08 SB MAC-078 1 1 5 Marinas and Recreational Boating (7900) Onsite Wastewater Systems (6500) Urban Runoff/Storm Sewers (4000)
Low Dissolved Oxygen (1200) Oil & Grease (1900) Turbidity (2500)
Low Dissolved Oxygen (1200)
Low Dissolved Oxygen (1200)

ØÙ Ú Û ÜÝ Þ ßà Ý á â ã ä å â æ ç è éê ë ì å â å ç ì é í ë Ü Ú î Ûê Ü Ú ì Þ Ú ï Ý Û Üð á å ä ð
Table 64: 2014 Cycle 303(d) List – List of Coastal Shoreline Note: The 2014 303(d) List is comprised of the causes of impairments included in assessment cycles 2014, 2012, 2010, 2008 and 2006.
Assessment Unit ID (AU)
Size of AU
(miles) Class
Monitoring Station EQB Network and ED=External Data
Designated Uses and Categories
Summary
Notes Potential Sources of
Pollution
Causes of Impairment (assessment cycles)
R1 R2 AL 2014 2012 2010 2008
2006 Parameter in italic
and color noncompliance in
2004, but compliance in 2006
PREC25 (Punta Lima to Morro de Humacao)
9.83 SB MAC-079, MAC-080, SBZ-033, SBZ-034, MAC-081, RW-4,MAC-011
1 1 5 Major Municipal Point Source (0210) Onsite Wastewater Systems (6500) Urban Runoff/Storm Sewers (4000)
Low Dissolved Oxygen (1200) Turbidity (2500)
Low Dissolved Oxygen (1200) pH (1000) Turbidity (2500)
Low Dissolved Oxygen (1200)
PREC27 (Punta Candelero to Punta Guayanés)
3.74 SB 5 5 5 B Onsite Wastewater Systems (6500) Urban Runoff/Storm Sewers (4000)
Enterococcus Bacteria (1700) Fecal Coliforms (1700)
Turbidity (2500)
PREC28C (Punta Guayanés to Punta Quebrada Honda)
4.68 SC MAC-012, MAC-013, SBZ-037
1 1 5 Major Industrial Point Source (0110) Onsite Wastewater Systems (6500) Urban Runoff/Storm Sewers (4000)
Low Dissolved Oxygen (1200) Oil & Grease (1900) pH (1000) Turbidity (2500)
Low Dissolved Oxygen (1200) Turbidity (2500)
Low Dissolved Oxygen (1200)
Turbidity (2500)
PREC30 (Punta Tuna to Cabo Mala Pascua)
2.65 SB MAC-082 1 1 5 Unknown Source (9000)
Low Dissolved Oxygen (1200) Turbidity (2500)
Low Dissolved Oxygen (1200) pH(1000) Turbidity (2500)
PRSC31 (Cabo Mala Pascua to Punta Viento)
4.06 SB 5 5 3 B Onsite Wastewater Systems (6500) Urban Runoff/Storm Sewers (4000) Upstream Impoundment (7350)
Enterococcus Bacteria (1700) Fecal Coliforms (1700)
Enterococcus Bacteria (1700)

ØÙ Ú Û ÜÝ Þ ßà Ý á â ã ä å â æ ç è éê ë ì å â å ç ì é í ë Ü Ú î Ûê Ü Ú ì Þ Ú ï Ý Û Üð á å æ ð
Table 64: 2014 Cycle 303(d) List – List of Coastal Shoreline Note: The 2014 303(d) List is comprised of the causes of impairments included in assessment cycles 2014, 2012, 2010, 2008 and 2006.
Assessment Unit ID (AU)
Size of AU
(miles) Class
Monitoring Station EQB Network and ED=External Data
Designated Uses and Categories
Summary
Notes Potential Sources of
Pollution
Causes of Impairment (assessment cycles)
R1 R2 AL 2014 2012 2010 2008
2006 Parameter in italic
and color noncompliance in
2004, but compliance in 2006
PRSC32 (Punta Viento to Punta Figuras)
6.16 SB SBZ-040, RW-6, MAC-083, RW-7
5 5 5 Onsite Wastewater Systems (6500) Urban Runoff/Storm Sewers (4000) Upstream Impoundment (7350)
Enterococcus Bacteria (1700) Turbidity (2500)
Enterococcus Bacteria (1700)
Enterococcus Bacteria (1700)
Enterococcus Bacteria (1700)
PRSC33 (Punta Figuras to Punta Ola Grande)
8.10 SB MAC-017 1 1 5 Major Industrial Point Source (0110) Onsite Wastewater Systems (6500) Urban Runoff/Storm Sewers (4000)
Low Dissolved Oxygen (1200) Turbidity (2500)
Low Dissolved Oxygen (1200)
Low Dissolved Oxygen (1200)
Turbidity (2500)
PRSC34 (Punta Ola Grande to Punta Petrona)
40.96 SB MAC-016, MAC-018, MAC-019,
SBZ-042 ED - Stations 09,
10, 19 and 20 from Natural Reserve of
Jobos Bay
5 5 5 A Agriculture (1050) Major Industrial Point Sources (0110) Onsite Wastewater Systems (6500) Urban Runoff/Storms sewers (4000) Upstream Impoundment (7350)
Low Dissolved Oxygen (1200) Oil & Grease (1900) pH (1000) Thermal Modifications (1400) Turbidity (2500)
Enterococcus Bacteria (1700) Low Dissolved Oxygen (1200) pH (1000) Turbidity (2500)
Enterococcus Bacteria (1700) Low Dissolved Oxygen (1200) pH (1000) Turbidity (2500)
Turbidity (2500)

ØÙ Ú Û ÜÝ Þ ßà Ý á â ã ä å â æ ç è éê ë ì å â å ç ì é í ë Ü Ú î Ûê Ü Ú ì Þ Ú ï Ý Û Üð á å ù ð
Table 64: 2014 Cycle 303(d) List – List of Coastal Shoreline Note: The 2014 303(d) List is comprised of the causes of impairments included in assessment cycles 2014, 2012, 2010, 2008 and 2006.
Assessment Unit ID (AU)
Size of AU
(miles) Class
Monitoring Station EQB Network and ED=External Data
Designated Uses and Categories
Summary
Notes Potential Sources of
Pollution
Causes of Impairment (assessment cycles)
R1 R2 AL 2014 2012 2010 2008
2006 Parameter in italic
and color noncompliance in
2004, but compliance in 2006
PRSC35 (Punta Petrona to Punta Cabullones)
16.19 SB MAC-020 ED - CariCoos
Buoy A
1 1 5 C Major Municipal Point Source (0210) Onsite Wastewater Systems (6500) Upstream Impoundment (7350) Urban Runoff/Storm Sewers (4000)
Low Dissolved Oxygen (1200) Turbidity (2500)
Low Dissolved Oxygen (1200)
Low Dissolved Oxygen (1200)
PRSC36C (Punta Carenero to Punta Cuchara)
6.70 SC MAC-022, MAC-023
5 5 5 Major Municipal Point Source (0210) Marinas and Recreational Boating (7900) Onsite Wastewater Systems (6500) Urban Runoff/Storm Sewers (4000)
Enterococcus Bacteria (1700) Oil & Grease (1900) pH (1000) Turbidity (2500)
Low Dissolved Oxygen (1200) pH (1000) Thermal Modifications (1400)

ØÙ Ú Û ÜÝ Þ ßà Ý á â ã ä å â æ ç è éê ë ì å â å ç ì é í ë Ü Ú î Ûê Ü Ú ì Þ Ú ï Ý Û Üð á å ö ð
Table 64: 2014 Cycle 303(d) List – List of Coastal Shoreline Note: The 2014 303(d) List is comprised of the causes of impairments included in assessment cycles 2014, 2012, 2010, 2008 and 2006.
Assessment Unit ID (AU)
Size of AU
(miles) Class
Monitoring Station EQB Network and ED=External Data
Designated Uses and Categories
Summary
Notes Potential Sources of
Pollution
Causes of Impairment (assessment cycles)
R1 R2 AL 2014 2012 2010 2008
2006 Parameter in italic
and color noncompliance in
2004, but compliance in 2006
PRSC37C(Cayo Parguera to Punta Guayanilla)
4.20 SC MAC-24 MAC-25
2 2 5 Major Municipal Point Sources (0210) Highway/Road/Bridge Construction (3100) Major Industrial Point Sources (0110) Surface Mining (5100) Onsite Wastewater Systems (6500) Upstream Impoundment (7350) Marinas and Recreational Boating (7900) Urban Runoff/Storm Sewers (4000)
Oil & Grease (1900) Turbidity (2500)
PRSC38 (Punta Guayanilla to Punta Verraco)
13.20 SC MAC-027, MAC-089, MAC-028
ED - Station PLSP4 from NOAA and
PR Seismic Network
5 5 5 C Major Municipal Point Sources (0210) Marinas and Recreational Boating (7900) Onsite Wastewater Systems (6500) Upstream Impoundment (7350) Urban Runoff/Storm Sewers (4000)
Enterococcus Bacteria (1700) Oil & Grease (1900) Thermal Modifications (1400) Turbidity (2500)
Low Dissolved Oxygen (1200) pH (1000) Turbidity (2500)
Low Dissolved Oxygen (1200)
Thermal Modifications (1400)

ØÙ Ú Û ÜÝ Þ ßà Ý á â ã ä å â æ ç è éê ë ì å â å ç ì é í ë Ü Ú î Ûê Ü Ú ì Þ Ú ï Ý Û Üð á å ÷ ð
Table 64: 2014 Cycle 303(d) List – List of Coastal Shoreline Note: The 2014 303(d) List is comprised of the causes of impairments included in assessment cycles 2014, 2012, 2010, 2008 and 2006.
Assessment Unit ID (AU)
Size of AU
(miles) Class
Monitoring Station EQB Network and ED=External Data
Designated Uses and Categories
Summary
Notes Potential Sources of
Pollution
Causes of Impairment (assessment cycles)
R1 R2 AL 2014 2012 2010 2008
2006 Parameter in italic
and color noncompliance in
2004, but compliance in 2006
PRSC39 (Punta Verraco to Punta Ballena)
6.41 SB MAC-030, G1 2 2 5 Unknown Source (9000)
Turbidity (2500)
PRSC40 (Punta Ballena to Punta Brea)
13.26 SB MAC-085, RW-9, MAC-034
1 1 5 Marinas and Recreational Boating (7900) Minor Municipal Point Source (0220) Onsite Wastewater Systems (6500) Urban Runoff/Storm Sewers (4000)
Turbidity (2500) Low Dissolved Oxygen (1200) pH (1000) Thermal Modifications (1400) Turbidity (2500)
PRSC41B2 (Bahía Fosforescente La Parguera to Punta Cueva de Ayala)
7.00 SB SBZ-046 ED - Station MGIP4 from NOAA, & CariCoos
1 1 5 C Landfill (6300) Marinas and Recreational Boating (7900) Onsite Wastewater Systems (6500) Urban Runoff/Storm Sewers (4000)
Thermal Modifications (1400)

ØÙ Ú Û ÜÝ Þ ßà Ý á â ã ä å â æ ç è éê ë ì å â å ç ì é í ë Ü Ú î Ûê Ü Ú ì Þ Ú ï Ý Û Üð á å ú ð
Table 64: 2014 Cycle 303(d) List – List of Coastal Shoreline Note: The 2014 303(d) List is comprised of the causes of impairments included in assessment cycles 2014, 2012, 2010, 2008 and 2006.
Assessment Unit ID (AU)
Size of AU
(miles) Class
Monitoring Station EQB Network and ED=External Data
Designated Uses and Categories
Summary
Notes Potential Sources of
Pollution
Causes of Impairment (assessment cycles)
R1 R2 AL 2014 2012 2010 2008
2006 Parameter in italic
and color noncompliance in
2004, but compliance in 2006
PRWC43 (Punta Águila to Punta Guaniquilla)
9.54 SB SBZ-047, RW-12A, RW-12B, SBZ-048, RW-14A, MAC-
037, RW-13
1 1 5 Collection System Failure (0500) Marinas and Recreational Boating (7900) Minor Municipal Point Source (0220) Onsite Wastewater Systems (6500)
Thermal Modifications (1400) pH (1000)
PRWC48 (Punta Guanajibo to Punta Algarrobo)
5.60 SC MAC-038, MAC-040
ED - NOAAand PR Seismic
Network Station MGZP4
5 5 5 C Onsite Wastewater Systems (6500) Upstream Impoundment (7350) Urban Runoff/Storm Sewers (4000)
Enterococcus Bacteria (1700) Oil & Grease (1900) Thermal Modifications (1400) Turbidity (2500)
Low Dissolved Oxygen (1200)
Enterococcus Bacteria (1700) pH (1000)
Enterococcus Bacteria (1700)
PRWC49 (Punta Algarrobo to Punta Cadena)
6.98 SB MAC-041, RW-15 1 1 5 Major Municipal Point Sources (0210) Upstream Impoundment (7350) Urban Runoff/Storm Sewers (4000) Onsite Wastewater Systems (6500)
Low Dissolved Oxygen (1200) pH (1000)

ØÙ Ú Û ÜÝ Þ ßà Ý á â ã ä å â æ ç è éê ë ì å â å ç ì é í ë Ü Ú î Ûê Ü Ú ì Þ Ú ï Ý Û Üð á ä â ð
Table 64: 2014 Cycle 303(d) List – List of Coastal Shoreline Note: The 2014 303(d) List is comprised of the causes of impairments included in assessment cycles 2014, 2012, 2010, 2008 and 2006.
Assessment Unit ID (AU)
Size of AU
(miles) Class
Monitoring Station EQB Network and ED=External Data
Designated Uses and Categories
Summary
Notes Potential Sources of
Pollution
Causes of Impairment (assessment cycles)
R1 R2 AL 2014 2012 2010 2008
2006 Parameter in italic
and color noncompliance in
2004, but compliance in 2006
PRWC52 (Punta del Boquerón to Punta Borinquén)
6.80 SB MAC-043,SBZ-002, RW-16, RW-
16A
1 1 5 Major Municipal Point Source (0210) Onsite Wastewater Systems (6500) Urban Runoff/Storm Sewers (4000)
Low Dissolved Oxygen (1200)
PRCC53(Culebra Island)
32.70 SB RW-3 ED
2 2 5 D Onsite Wastewater Systems (6500) Marinas and Recreational Boating (7900) Debris and Bottom Deposits (8520) Hazardous Waste (6600)
Turbidity (2500)
Note: R1 - Primary Contact Recreation R2 - Secondary Contact Recreation AL - Aquatic Life A - The Monitoring Stations 09, 10, 19 and 20 provided water quality data from the National Reserve of Jobos Bay. B- If the AU with Monitoring Stations and External Data 2014 column is blank, the AU was not monitored for 2014 Cycle. C- Monitoring Station of NOAA, PR Seismic Network and CariCoos (Caribbean Costal Ocean Observing System) D – External data. This AU PRCC53 has been included for the first time in the list in 2014. The information was submitted by Edwin Hernández-Delgado, University of Puerto Rico, Center for Applied Tropical Ecology and Conservation in October 2013. The data is part of the following study: Biological Characterization of Shallow-Water Coral Reef Communities Across a Water Quality Gradient with the Luis Peña Channel Natural Reserve, Culebra Island, Puerto Rico published in the year 2009. This AU was included in the 303(d) list under the column of the year 2010 due to that the data included correspond to the assessment cycle 2010