Embed Size (px)
Citation preview

AP32 Section:
Background Chapter Reference:
Title:
12.5.1
3 37
Source Evaluation Report, Oregon Steel Mills, Portland, OR, Electric Arc Furnace Baghouse. December 27,2000. Prepared for Oregon Steel Mills, Portland, OR by Michele R. Kinney & David R. Rossman, P.E. Project No. 1536.

13585 N.E . Whitaker Way Portland. OR 97230 Phone (503)255-5050 Fax (503)255-0505 [email protected]
Project No. 1536
SOURCE EVALUATION REPORT
Oregon Steel Mills Portland, Oregon
Electric Arc Furnace Baghouse Total Suspended Particulate (TSP), CO, NO,, SOz, VOC, Lead and Opacity
December 27.2000
Prepared for Oregon Steel Mills
14400 N. Rivergate Blvd. Portland, Oregon 97203
by Michele R. Kinney & David R. Rossrnan, P:E.
Expires 12/31/02
Air Pollution Emission Testing Infrared Inspections . Mechanical Engineering
Oregon Steel Mills, Portland, Oregon, Electric Arc Furnace Baghouse, 2 December 27,2000
TABLE OF CONTENTS
I. Certification
2. Introduction
3. Summary of Results
4. Source Description and Operation
5. Sampling and Analytical Procedures
6. Discussion
NORTHWEST REGION
Paae Number 4
5
6
9
11
14
.**.... HORIZON ENGINEERING *******

Oregon Steel Mills, Portland, Oregon, Electric Arc Furnace Baghouse, 3 December 27, 2000
APPENDIX
Nomenclature 8 Drift Correction Documentation Particulate and Lead Calculation Sheets
Emission Calculation Worksheets Field Data Sheets Blank Correction and Filter Rinse Allocation Laboratory Results and Worksheets Baghouse Sampling Diagram
Flow Rate Determinations and Field Data Traverse Point Location - Inlet 8 Outlet
Volume Flow Rate Determination
Visible Emission Data Gaseous Emissions
Gaseous Emissions Molecular Weight Determinations Analyzer Calibration Data and Bias Checks Data Logger Gas Charts Strip Charts
ProductionlProcess Data Furnace Heat Logs Baghouse Pressure Drop Field Data
High-Volume Sampler Calibrations Pitots Thermocouples and Indicators Shortridge Micro manometer Magnehelic Barometer Filter Tare Weights NOx Converter Efficiency Test Calibration Gas Certificates Audit Sample Results, reporting forms and instructions
Calibration Information
QAlQC Documentation 111 Correspondence 114
Source Test Plan and Correspondence Permit (Selected Pages)
Paae Number 15 11
46
59 60
72
80
HORIZON ENGINEERING ******* *.*****

Oregon Steel Mills, Portland, Oregon, Electric Arc Furnace Baghouse, 4 December 27,2000
1. CERTIFICATIONS
1 .I Test Team Leader I hereby certify that the test detailed in this report, to the best of my knowledge, was accomplished in conformance with applicable rules and good practices. The results submitted herein are accurate and true to the best of my knowledge.
Name: C. David Bagwell
Signature c. cJ Date " / ; /C , /
1.2 Report Reviewer I hereby certify that I have reviewed this report and find it to be true and accurate, and in conformance with applicable rules and good practices, to the best of my knowledge.
Name: David R. Rossrnan, P.E.
Signature
HORIZON ENGINEERING **'**** t*ttttt
Oregon Steel Mills, Portland, Oregon, Electric Arc Furnace Baghouse, 5 December 27,2000
2. INTRODUCTION
2.1 Client: Oregon Steel Mills
2.2 Physical Location: 14400 N. Rivergate Blvd., Portland, OR 97208
2.3 Mailing Location: P. 0. Box 2760, Portland, OR 97208
2.4 Test Log
Test Date Source Name Pollutants December 27, 2000 Electric Arc Furnace
Baghouse Lead and Opacity Particulate, CO, NO,, SO,, VOC,
2.5 Test Purpose: Emission factor verification as required by Title V Permit No. 26-1865 issued by the Oregon Department of Environmental Quality (ODEQ).
2.6 Background Information: None.
2.7 Participants Horizon Personnel:
C. David Bagwell, Team Leader Brian T. Fallon, Field Technician Michael J. Eisele, Field Technician Tim J. Hertel, Field Technician Michael E. Wallace, QNQC Officer David R. Rossman, P.E., Report Review Michele R. Kinney, Technical Writer
Test Arranged by: Debbie Deetz Silva, Oregon Steel Mills Test Plan Sent to: Jack Herbert, ODEQ.
HORIZON ENGINEERING ******* *t.tt.*

Oregon Steel Mills, Portland, Oregon, Electric Arc Furnace Baghouse, December 27, 2000
6
3. SUMMARY OF RESULTS
3.1 Table@) of Results Table 1
Particulate and Lead Test Results Test Date: December 27,2000
Units Run1 Start Time 11:39 End Time 13:16
Sampling Results Particulate Conc.(Actual) grlscfd 0.00038 Particulate Rate lblhr 1.5
Sampling Time min 80
Based on Cold Charge Iblton 0.0093 Sample Volume dscf 2,276
Percent lsokinetic % 98 Lead Rate Iblhr 0.026
Sample Weight, Total mg 55.3
Based on Cold Charge Iblton 0.00015 % of Total Particulate % 1.67
Opacity % 0 Source Parameters Inlet Flow Rate dscflmin Outlet Flow Rate dscflrnin 477,000 Inlet Velocity Wmin Outlet Velocity Wmin 656 Temperature, Outlet "F 160 Process Data Cold Charge Production tonslhr 166 Baghouse Press. Drop, Avg. in H,O 5.2
Run 2 13:18 14:52 82
0.00054 2.0 0.0161 2,082 73.4 99 0.046 0.00037 2.33 0
426,000
599 171
124 5.1
Run 3 14:55 16:29 80
0.00031 1.2 0.0089 2,247 44.5 99 0.024 0.00017 1.91 0
473,000
668 180
139 5.5
Average
81
0.0004 1 1.6 0.01 14 2,202 57.8 99 0.032 0.00023 1.97 0
410,000 459,000 5,650 64 1 170
141 5.3
HORIZON ENGINEERING ******* .**.t*t

Oregon Steel Mills, Portland, Oregon, Electric Arc Furnace Baghouse, December 27,2000
Table 2 Gaseous Emissions Test Results
Test Date: December 27,2000
Start Time End Time Sampling Time min Sampling Results
Units
0, YO CO, %
CO Concentration PPmv Rate Ib/hr Based on Cold Charge Ib/ton
Rate lblhr Based on Cold Charge Ib/ton
SO, Concentration PPmv Rate Ib/hr Based on Cold Charge Ib/ton
Rate Ib/hr Based on Cold Charge Ib/ton
TGNMOC Concentration ppmv Rate Ib/hr Based on Cold Charge Ib/ton
NO, Concentration PPm"
TGOC Concentration PPmv
Run 1 11:39 13:16 80
20.5 0.4 126 225 1.36 8 22.3 0.14 4 16.8 0.10 16 12.4 0.08
Run 2 13:18 14:52 82
20.4 0.5 76 136 1.09 9 25.0 0.20 3 11.1 0.09 10 7.8 0.06
Run 3 14:55 16:29 80
20.4 0.5 97 174 1.25 11 33.0 0.24 3 11.4 0.08 8 5.8 0.04
7
Average
81
20.4 0.5 100 178 1.23 9 26.8 0.19 3 13.1 0.09 11 8.7 0.06 27' 1.7' 0.01'
3.2 Description of Collected Samples: See Blank Correction and Rinse Allocation in Appendix
1 Total Gaseous Non-Methane Organic Compounds (TGNMOC) numbers were figured using the VOC Methane component of 80.2% from the October 20, 1998 testing.
HORIZON ENGINEERING ******* ... ttt.

Oregon Steel Mills, Portland, Oregon, Electric Arc Furnace Baghouse. December 27. 2000
8
3.3 Discussion of Errors and Quality Assurance Procedures This table is taken from a paper entitled “Significance of Errors in Stack Sampling Measurements”, by R.T. Shigahara, W.F. Todd and W.S. Smith. It summarizes the maximum error expressed in percent, which may be introduced into the Method 5 particulate test procedures by equipment or instrument limitations
Measurement
Stack Temperature Ts
Meter Temperature Tm
Stack Gauge Pressure Ps
Meter Gauge Pressure Pm
Atmospheric Pressure Patm
Dry Molecular Weight Md
Moisture Content Bws (Absolute)
Differential Pressure Head AP
Orifice Pressure Differential AH
Pitot Tube Coefficient Cp
Orifice Meter Coefficient Km
Diameter of Probe Nozzle Dn
% Max Error
1.4
1.0
0.42
0.42
0.21
0.42
1.1
10.0
5.0
2.4
1.5
0.80
QA procedures outlined in the test methods are followed, including procedures, equipment specifications, calibrations, sample recovery and handling, calculations and performance tolerances. Many of the checks performed have been noted on the Field Data Sheets.
Three audit samples (two liquid samples and one filter sample), prepared by EPA in accordance with Method 12 and provided to Jack Herbert of ODEQ, were submitted to the particulate analysis laboratory (Antech) along with the filter and acetone samples collected during the source test. The particulate analysis laboratory is responsible for drying and weighing of the samples prior to Environmental Services Laboratory (ESL) performing the lead analysis. Following the instructions from ODEQ, the two sealed liquid audit samples were also opened and dried along with the source test and audit filter samples. It should be noted that EPA
HORIZON ENGINEERING ******* t*.*t.*
Oregon Steel Mills, Portland, Oregon, Electric Arc Furnace Baghouse, 9 December 27, 2000
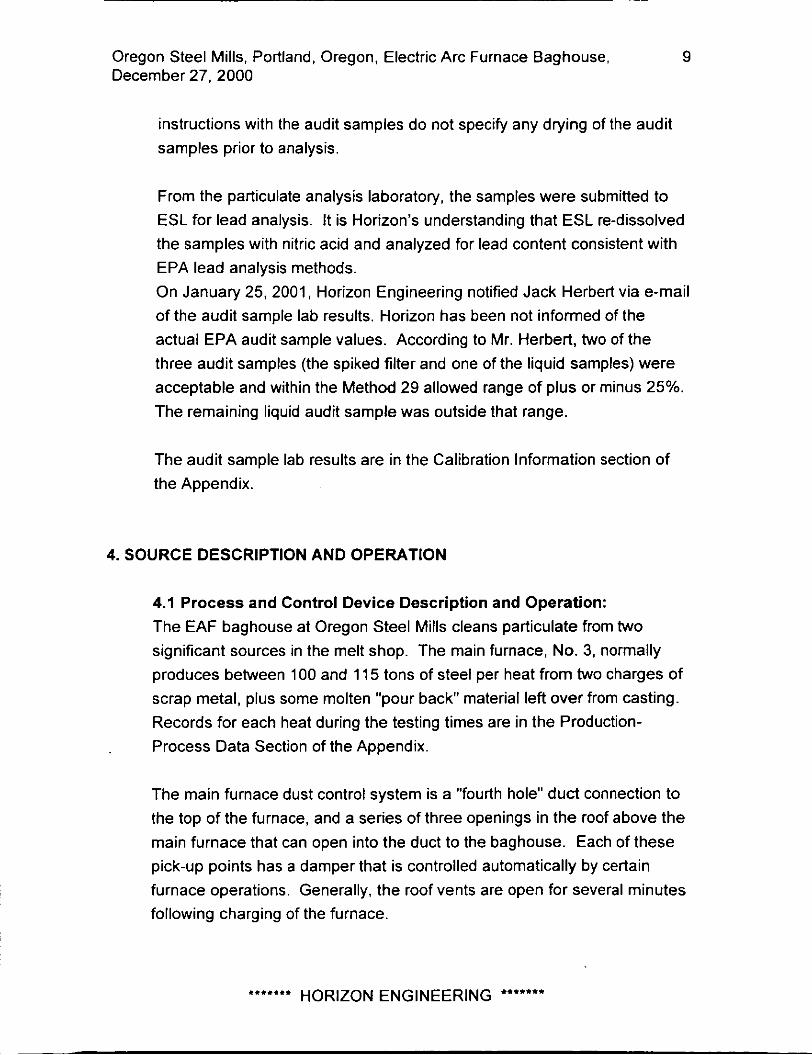
instructions with the audit samples do not specify any drying of the audit samples prior to analysis.
From the particulate analysis laboratory, the samples were submitted to ESL for lead analysis. It is Horizon's understanding that ESL re-dissolved the samples with nitric acid and analyzed for lead content consistent with EPA lead analysis methods. On January 25, 2001, Horizon Engineering notified Jack Herbert via e-mail of the audit sample lab results. Horizon has been not informed of the actual EPA audit sample values. According to Mr. Herbert, two of the three audit samples (the spiked filter and one of the liquid samples) were acceptable and within the Method 29 allowed range of plus or minus 25%. The remaining liquid audit sample was outside that range.
The audit sample lab results are in the Calibration Information section of the Appendix.
4. SOURCE DESCRIPTION AND OPERATION
4.1 Process and Control Device Description and Operation: The EAF baghouse at Oregon Steel Mills cleans particulate from two significant sources in the melt shop. The main furnace, No. 3, normally produces between 100 and 11 5 tons of steel per heat from two charges of scrap metal, plus some molten "pour back" material left over from casting. Records for each heat during the testing times are in the Production- Process Data Section of the Appendix.
The main furnace dust control system is a "fourth hole" duct connection to the top of the furnace, and a series of three openings in the roof above the main furnace that can open into the duct to the baghouse. Each of these pick-up points has a damper that is controlled automatically by certain furnace operations. Generally, the roof vents are open for several minutes following charging of the furnace.
HORIZON ENGINEERING ******* **tt**.

Oregon Steel Mills, Portland, Oregon, Electric Arc Furnace Baghouse, l o December 27, 2000
The ladle metallurgy furnace is between the main furnace and the casting area and is used to fine-tune the content and temperature of the molten steel before being cast. Charging is only of molten steel and alloying material and is the minor contributor to the baghouse system. The exhaust from this furnace enters the duct system downstream from the main furnace and roof vents.
All of the pick-up points are evacuated into an 11 foot-diameter duct by two 1250-Hp fans. The fans have automatically controlled dampers on the inlets.
Particulate control is by a 16-compartment, (21 ft. by 14 ft. each) Industrial Clean Air, reverse-air type, baghouse with seamless tube polyester bags. Magnehelic gauges on each of the compartments showed pressure drops averaging 5.3 inches of water.
4.2 Test Ports: Ports and traverse points are described and diagrammed on the Field Data sheets.
4.3 Test Duct Characteristics: Cyclonic Flow: No Cyclonic flow expected. Meets EPA M-1 Criteria: No.
4.4 Process 8 Control Equipment Flow Diagram: See Process- Sampling Equipment Flow Diagram in Appendix
4.5 Operating Parameters: See ProductionlProcess Data section of Appendix
4.6 Process StartupslShutdowns or Other Operational Changes During Tests: The process was continuous during testing.
HORIZON ENGINEERING ******* tt**.tt

Oregon Steel Mills, Portland, Oregon, Electric Arc Furnace Baghouse, 11 December 27, 2000
5. SAMPLING AND ANALYTICAL PROCEDURES
5.1 Sampling Procedures
5.1.1 SamDlinq and Analvtical Methods
Flow Rate: EPA Methods 1 and 2 (S-type pitot flow traverses) CO, and 0,: EPA Method 3A (NDIR and paramagnetic analyzers) Moisture: ODEQ Method 4 (psychrometry - wet bulb I dry bulb) Particulate: ODEQ Method 8 (High Volume sampler) Lead: Analysis of the filters and sampler residue for lead.
Residue allocated to the runs according to Method 8 procedure 11.2.1. Analysis by EPA6010 (ICP).
so,: EPA Method 6C (non-dispersive ultraviolet analyzer) NO,: EPA Method 7E (chemiluminescent analyzer) co: EPA Method 10 (gas filter correlation analyzer) VOC as total gaseous organic compounds (TGOC) by EPA Method 25A,
(heated flame ionization analyzer and sample line) Opacity: EPA Method 9 (six minutes per run)
5.1.2 SarnDle Analvsis
Analvte Laboratoy Particulate and Audit Sample- Antech volume determination Lead and Audit Samples Environmental Services
Laboratory

A Filter
I I
Continuous 4 Gas Conditioner
,(Moisture Removal)
Figure 2 EPA Method 25A VOC Analyzer Sample System Diagram

Oregon Steel Mills, Portland, Oregon, Electric Arc Furnace Baghouse, December 27,2000
13
5.3 Horizon Test Equipment
5.3.1 Manual Methods
Eauipment Name Hi Volume Orifice Manometer Pitots and Thermocouples Magnehelic Gauge Barometer
Eauipment Identification Horizon No. 1192 Shortridge Manometers No. 1 & 2
0-1 F (orifice AH) Test Van 111
11-S, 14-SI
5.3.2 Continuous Analyzers and Methods )
Gas Brand Model Range Measurement Method Method 0, Servomex 1400 0-25% Paramagnetic 3A CO, Servomex 1400 0-25% Chopperless NDlR 3A co ThermoEnv 48 0-1 000 ppm Gas Filter Correlation 10 TGOC J.U.M. VE-7 0-1 00 ppm Flame Ionization 25A NO, ThermoEnv 42C 0-250 ppm Chemiluminescent 7E SO, West. Resch 721M 0-30 ppm Non Disp. Ultra-violet 6C
5.3.3 Continuous Emissions Monitors Samplina Setup
Sampling: Probe: Sample Line(s): Teflon (heated) Conditioning: Data Logger: Keithley
Above listed gases except TGOC Stainless Steel with sintered stainless and polyester filters
Refrigerated M & C Cooler
Sampling: TGOC. Probe: Stainless Conditioning:- none Sample Line(s): Teflon (heated) Pump: heated, internal to analyzer Data Logger: Keithley
HORIZON ENGINEERING ******* ****ttt

Oregon Steel Mills, Portland, Oregon, Electric Arc Furnace Baghouse, December 27, 2000
14
6. DISCUSSION
The results of the testing should be valid in all respects. All quality assurance checks including leak checks, instrument checks and calibrations, were within method-allowable tolerances.
As mentioned in Section 3.3, two of the three EPA audit samples were acceptable and with-in the Method 29 allowed range of plus or minus 25%. The third audit sample that was not in the acceptable range, was rechecked by the laboratory for all dilution and QA procedures. Prior to Environmental Services Laboratory receiving the audit samples, per Jack Herbert of ODEQ's request, the two liquid audit samples were evaporated to dryness along with the particulate samples. Antech reported the audit-solution volume upon submitting the samples to ESL for lead analysis.
The VOC values reported in this work are total gaseous organic compounds (TGOC) and include methane, which is not a VOC, in the value. It is likely that a high fraction of the total is methane because it is used for heat in the furnace.
HORIZON ENGINEERING ******* *e.*.**
~

APPENDIX

NOMENCLATURE & DRIFT CORRECTION DOCUMENTATION

Tild R M W a m MWc M Wco M W w 2 M W 0 MWno2 MWo2 MWra2 MWn2+a C I c 2
52167 I545 I1 28 965 12011 28 010 44010 18015 46 006 II 999 64 061 28 154 185 121 I 8165455
CB grldrf cg @ X Y L 0 2 g r l d r f cg @ X Y a 2 grldrf C W ppmv. % Cgal@ X Y L 0 2 ppmv Cgas@X%O2 ppmv co CO Ci c 0 2 CP C l dH Dn dp"X
E Fd I Md
m
mfe M W mn M S
Mw NO2 NOx 0 2 OPC Pbar pg PO . PS
Qa Qd Rf so2 I TGCC Tm Tm(abr) T I Tgabrl V l C
Vm Vm(rtd)
Vv(s1d) Y
"S
IMU 8" H20 I"
I"
Ib I MMBN drf / MMBN % Ibm I lbmolc
lbrmhr
Ibm I lbmolc Ibm I lbmolc ppmv-NO2 ppmv-NO2 Y. Y. in Hg m H2O m Hg in Hg acflmin dwflmm M M B N ~ ppmv-SO2
ppmv-C SF 'R *F 'R ml dcf dxf fpm u f
mg
I"
E q 5-1
Eq. 5-6
Eq 5-1 Eq. 2.9. Eq. 5-2 Fig. 5.6 LEi
Horizon Engineering 07i28i2000 14:49
~ _ _ _ _ _ ~ ~~ ~~

13585 NE WiktOkw WOY * Pomond. OR V7230 Raw ( Y u ) 2 5 5 a y 1 Fox (503)255.0505 harlzanemtele~an cam DRIFT CORRECTION DOCUMENTATION
EPA Drift Equations: Method 3A: Oxygen and Carbon Dioxide
(Eq. 3A-1) .. .
Method 6C: Sulfur Dioxide
Method 7E: .Nitrogen Oxides, Section 8 of Method 7E states: “Follow Section 8 of Method 6C (Eq. 6C-I)” Method IO: Carbon Monoxide, the EPA does not currently address Gas Filter Correlation instruments, therefore there are no current standards. Method 25A: Total Gaseous Organic Concenhation (TGOC), this method does not mention correcting for drift although there are established limits.
Horizon Engineering Drift Correction Eauations:
EPA Definition c, cm. cc. C.
Emuent gas concentration, dry basis Actual upscale calibration gas concenbation Actual zerollow calibration gas concenhation Average of initial and final system upscale calibration bias responses Initial system upscale calibration bias response Final system upscale calibration bias response Average of initial and fmal system zeroflow calibration bias responses Initial system zerollow calibration bias response Final system zerollow calibration bias response Average gas concentration indicated by gas analyzer, dry basis Starting test time Ending test time Initial system bias calibration response time Final system bias calibration response time Mid-point of test time or gas sampling interval to be analyzed Approximate upscale response at mid-point test time Approximate zerollow response at mid-point test time
c,
C
Noles ur exceptions: TGOC is lirst recorded on D wet basis. then corrected lo a dry basis The TGOC instruments used by Horizon have some historic data on instrumcnl response to different hydrocarbons. I:or propanc thc rcsponsc is I to I molccule while methane is 1.037 to I molccuk. We correct for the instrument’s (‘over rcsponsc” to methane.
:. i G Air Pollution Emission Testing Infrared Inspections Mechanical Engineering

PARTICULATE AND LEAD CALCULATION SHEETS
Emission Calculation Worksheets Field Data Sheets
Blank Correction and Filter Rinse Allocation Laboratory Results and Worksheets
Baghouse Sampling Diagram

0 0 I .I I I 0 2 I I 0 2 0 2 I 3 I
Particulate and Lead Ernlssons
I=, thegun Siccl Milk File usml516 Ourcs ICA Baghouw-EAF Tcilcr MJWBTFflJHCDB IhIC 27.k~-ZOO0 AnAyridQA M m E W ""d I Wt(mg) i : : ' i S!& Arc. A- .),... , vn M ~ I wt. m Md- :>.Ut molw Dint, Lead (mg) 0 . 9 3 Slack Temp. Td& I55 'F Mol WI. W e MS- I' , h i m01w
Stack Temp. Tu& 91 'F BUOmctm. p& 30.19 in tu0 ivol m SNn I It)? Mairrurc b w - 2.88 % Static h i . PmI= 0.01 in H20
onnmtr El= 0.4023 N o d e Arca An- 1.59 rqin Pitot C p 0.7802 nfice A* 47.9956 N o d e Dia. Dn- 3.109 8" Stuk Res. PS- 29.60 in Hg
Velocity Vclacity Onfirc h s w m Temp Temp TilM RAM Volume Volume
TIME w m dP "I duo W o Onfirc Slack Standard Standard Onfie Compamnsnl ReSW'e in H 2 0 in H20 (F) (0 min shn suR E&
U PI inH2O fpm CAS A n Tor Tra t Q@87 (ia68-F @TO, 11.10
10.94 154.1 172.0 . ) ' 5 3 0.0481 751 2 0.5209 0.5000 1210 102.0 5.0 11.25 166.2 181.9
11 , ' b 1 003?5 622.1 0.1269 0.1200 1?0.0 172.0 5.0 27.14 135.7 149.1 , .
12.:; 9 10
11.1: II I 2 1 ' ) 13 1'5,. I 4 I.::,: I5 I?,,,, 16
. . .. I...'
~~
l i i , . I
3 0.0410 109.0 1 0,0111 392.1 1 0,0197 686.1 1 0.0452 715.0 1 0.0269 554.1 1 0.0182 644.1 1 0.0195 6806 3 0.0116 624.7 3 0.0257 547.6 1 0.0499 169.2
0.4627 0.4400 l .X0 160.0 0.1281 O.IZ00 122.0 155.0 0.3953 0.3900 102.0 169.0 0.4542 0.4500 106.0 174.0 0.2750 0.2MX) 112.0 146.0 0.3947 0 . 3 W 112.0 156.0 0.4022 0.1800 108.0 162.0 0.3412 0.4wO 108.0 156.0 0.2516 0.33W 116.0 159.0 0.5188 0.2500 116.0 169.0
5.0 5.0 5.0 5.0 5.0 5.0 5.0 5.0 5.0 5.0
31.10 17.22 10.11 32.13 24.81 28.84 29.61 10.18 21.61 24.29
155.5 86.1
150.9 160.7 124.1 144.2 148.1 151.9 138.1 121.4
114.9 94.9
160.6 111.2 134.4 156.2 159.6 163.4 150.6 112.5
ne weighting uwd in averaging. => 655 6 0.3861 0.3661 113.8 159.6 80.M 28.74 2.299.5 L491.6
g Slack I m p g N o d s Vclocity isomnc
0,01543 WWd
0.W857 Cg QI
O.OI541 m d
0.W851 Cg Qr
V@Tm I t "I=QYAl
dwf dwVmin
grldvf ugiml lbmihr
Ibm/lon
grldSSf ugim3 lbmihr
Ibdlon
arUmin fpm
$m
'R 'R
RvnU I 2
Vd 2275.8 2.082.0 Qrd 476,150 426,494
cg O.WO38 O.wO54 859 1245
CI 1.5335 1.9897 0 . W 3 0.0161
C8 0.0-3 0 . m 1 2 1 143 29.0
Ct 0.0256 0.0464 0.WOIS 0.0037
Qm 3 1 2 28.81 "I 61536 598.13
T". 513.42 584 71 ~~ ~ . .. ~~. T, 61911 631.04 "n 63951 589.71 %I 97.6 98.5
3
2.246.7 412.546
0.MolI 7 w
1.2384 0.0089
O.OwWS8 13.1
0.0216 O.OWl7
31.75 661.51 580.67 639.61 663.40
99.4
A W S
2201.5 458.630
0 . m 1 935
1.5872 0.0114
O.wWo83 18.9
0.0319 0.00023
30.19 640.60 579.64 629.96 630.89
98.5
1.67 2.31 1.91 1.91 aciw . sdb 4 1 9 0.0 0.0 0.0 re baghourc has Ib compmmcnlr. h c is always cyclin&. ach C o m p m r n t is 52'x119'.
1636.WB1
17 Horlzon Englneerlng 0113112001 1618

Particulate and Lead Emissons
<unU Wt(mg1 -.: 8-12 Slack Area AS= wi i l sqn MOI wt. DV Md= 21.!11 molwt 'aim 10 Lcadlmgl 1.713 Stack Temp. Tdb= 164 "F Mal Wt. Wct MS= ., . mdwt ; <
Stack Temp. Twb= 101 OF Barameteric Pb= :I) l u in H2O Moistwt bws= 4.25 % Static Pres. Prtat= (l.tii, in H 2 0 i ivo l ID SNU ;:..:
~ ~~~~
l r i f icc A= ,- .,., i., N o d e Dia. Dn= ' . I,,<; i" Stack Pres. Pi= 30.49 in Hg :onstam B= I, .;,>:.: Noulc Area An= 7.59 sqin Pitot cp= <.,.7SIl?
Vclocity Orifice Pressure Temo Tcmo Time Rate Volume Volumi Compartment Prcsrurc correct in HZO ~ H Z O (F)' (F)' mm C h l cun
TIME POINT dP fpm dH0 dHo Orifice Slack Standard Standard Orifice # pt inH2O Vr ca lc Act Tor TS 1 Q@68"F @68"F @Tor
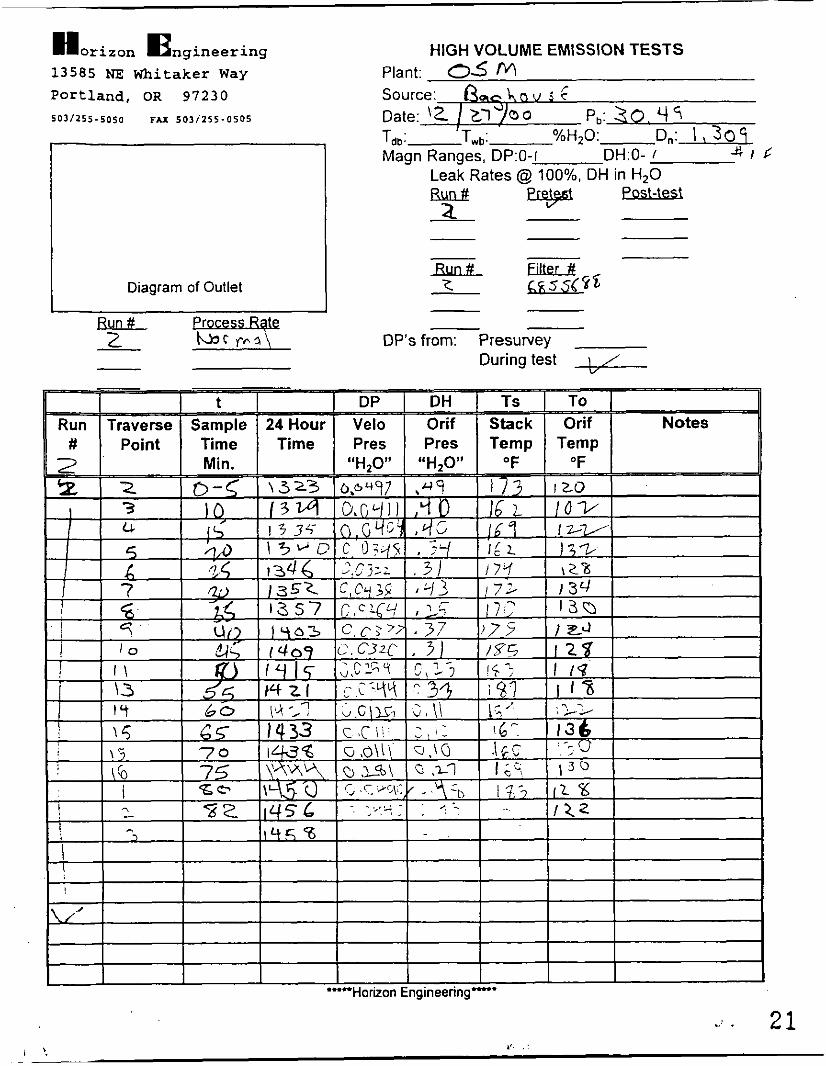
13 18 13:23 2 3 I3:29 3 3 1335 ' I 3 13:40 5 3 13:46 6 3 1352 7 3 1357 8 3 Id:03 9 3 14:OY 10 3 I4:15 II 3 14:21 13 3 14:27 I 4 3 14:33 15 3 I4:38 15 3 I4:J.l 16 3 14:50 I 3 14:52 2 3
0.0497 0.041 I O.OJo.4 0.0348 0.0322 0.0438 0.0264 0.0377 0.0320 0.0254 0.0344 O.Ol25 0.0111 0.01 I I 0.0281 0.0497 0.0440
760.61 0.5029 685.64 0.4043 683.59 0.4061 630.90 0.3558 612.71 0.3 183 713.47 0.4500 553.03 0.2594 663.50 0.3742 616.08 0.3103 548.03 0.2384 639.76 0.3287 375.68 0.1172 355.74 0.1044 355.74 0.1034 570.1 I 0.2780 766.59 0.5012 720. I 7 0.4363
0.4900 0.4000 O.dOO0 0.3400 0.3100 0.4300 0.2500 0.3700 0.3 100 0.2300 0.3300 0.1100 0.1000 0. 1000 0.2700 0.4800 0.1300
120.0 102.0 122.0 132.0 128.0 134.0 130.0 124.0 128.0 118.0 118.0 122.0 136.0 130.0 130.0 128.0 122.0
173.0 162.0 169.0 162.0 174.0 172.0 170.0 175.0 185.0 183.0 187.0 154.0 160.0 160.0 169.0 183.0 181.0
5.0 5.0 5.0 5.0 5.0 5.0 5.0 5.0 5.0 5.0 5.0 5.0 5.0 5.0 5.0 5.0 2.0
33.05 30.53 30.04 27.65 26.57 30.77 24.02 28.93 26.57 23.33 27.57 16.54 15.65 15.73 24.89 32.52 31.06
165.2 152.6 150.2 138.2 132.9 153.8 120.1 1446 132.9 116.7 137.8 82.7 78.3 78.6
124.4 162.6 62. I
181. 162. 165.8 155.1 148.1 173. 134.: 160.1 148.1 127.' ISO.! 91.: 88.: 87.5
139.1 181.1 68.!
,me weighting u K d in averaging. => 598.73 0.3187 0.3105 125.05 171.37 82.00 26.02 2,133.9 2,362.4
mplc Volume ,tal Flowrate
&ulats .ain loading nissions
CAD ain loading nissions
Run# . >
VQ68 (PbR9.92MI-bwrllM)) dscf Vd 2.082.0 Oultet Flow d s c f h i n Qs 4 ~ ! ~ . 4 U 1
0,01543 W t N d 0.00857 Cg Qs
0,01543 LcadNd 0.00857 Cg Qs
rg Sample Ratc ,g Velocity @I Sample Point 'g Orificc temp 'e Stack umo
VQTor / t vr=QdAs
gddrcf Cg 0.00054 I b h Ct 1,9896940658
gddscf Cg 1.27E-05 l b h Ct 0.04640656693
a c t h i n Qan 28.81 fpm "S 598.73
"R Tor 584.72 QR T S 63 I .M
,; Nozzle V&I& Qan-Ts I An'Tor fpm Y" 589 77 ISOKMETIC IO0 vdvs %I 98 50
1536.WBl Horizon Engineering - . 18
01/31/2001 16:20

Particulate and Lead Emissons
_ . )ate .]I,, .I,
:UnU Wl(mg) 1.1 i? 1 Stack Area As= w, ,, qfl Mol Wl. Dry Md= :', 'I1 m d u i oins I I Lead(mg) 0 848 Stack Temp. Tdb= 180 O F Mol Wl. We1 M F IS -I mduZ
livol ID SN.4 ; I , , : Moisture lrilice A= !- .11/,> Noule Dia. D"= : : . I , 1" Stack Res. Pr= 30.49 in H g 'OnaWnU B=
104 OF Baromclcric Pb= : , I :I# in HZO Slack Temp. Twb- bws= 4.41 % static Res. prtat= i l , , j i"H20
12,,2: Naule Area An= 7 59 rqin Pilot cp= I :s,r Velocity Orifice Pressure Temperature Time Rate Volume
Campamcni Pressure Conccl in H 2 0 i n H 2 0 (F) (F) mi" efm euft Standard Swdard Orifice
n pl inH2O VS Cak Act Tor TS t Q(ti68-F @ 688F @Tor dHo dHo Orifice Stack TIME POINT dP fpm
14:55 I 5 00 2 15 07 3 15.14 4 l 5 : l Y 4 I5:?4 6 1529 7 I& 8 15:42 9 15.47 10 I 5 : S I I 1558 I3
0 0440 0 0341 00318 0 0497 0 0624 00397 0 0246 0 0382 0 0309 00145 0 0466
1604 I 4 3 00461 16 II I 5 3 00461 16 16 16 1 0 0266 16 23 I 3 0 0162 I6 29 2 3 0 0184
720.46 0.4262 648.24 0.3464 617.25 0.3012 845.71 0.5974 858.66 0.6471 683 28 0 3988 531 63 0 2393 668 6 7 0 3780 605 64 0 2960 41455 0 1281 728 60 0 4793 728 18 0 4753 ~
726 43 0 4745 561 92 0 2465 658 57 03418 680.36 0.3720
0 4100 0 3400 0 3000 0 5800
0 3800 0 2100 0 3700 0 2900 0 1300 0 4700 0 4700 0 4700 0 2500 0 3400 0 3700
0 6 2 ~ )
1080 128.0 l20.0 1220 I300 132.0 126.0 lZ2.0 122.0 1100 118.0 1260 122.0 I10.0 IIZ.0 1280
181 0 5 0 31 41 I85 0 5 0 27 73 191 0 5 0 26 1 4 191 0 5 0 1 5 67 181 0 5 0 36 55 1790 50 2 9 10 1690 5 0 23 18 1760 5 0 28.97 1850 5 0 2 5 89 1840 5 0 18 04 1590 5 0 32 47 1650 5 0 1 2 26 1620 5 0 32 36 I840 5 0 2 4 4 1 191 0 5 0 28 09 I 9 5 0 5 0 28 84
157.1 169.0 138.7 154.4 131.7 144.7 178.3 196.6 182.8 2 0 4 2 145.5 163.2 115.9 128.7 1 4 4 9 159.7 129.4 142.7 90.2 97.4
162.3 177.7 161.3 179.0 161.8 178.4 122.0 131.7 140.4 152.2 1442 160.6
0 3 8 4 2 0 3 7 7 5 121W 17994 8000 2 8 8 3 2,3066 2.540 I me weighting uwd in avenging => 667 5 I
Mplc Volume mal Flowratc
VtiC"I.tC
rain loading "iSi0"S
Run# 3
d r f Vd 2,246.7 ,.' - V@68 (PbLZ9.92XI-bwdlW) Oullel Flaw drffmin Qr <-.?4A
0.01543 W l N d 0.00857 Cg Qr
gr/drf Cg 0.00011 lblhr C I 1.23844339583
?AD la," loading 001543LcadNd g d d r f Cg 5 82E-06
0 00857 Cg Qs lbihr Ct 002355294513
"8 Sample Ralc V@Tor I I acUmm Q m 31 75 Yg Veloclry @ Sample POW1 VFQalAS fpm "I 66751 vg Ortficc temp OR Tor 580 67 vg Stack lemp "R TS 63961 wg Noule Velocity Qan-Ts IAn-Tor fpm Y" 663 40
"1sS51O"S
ISOKlNETlC IW v r d w %I 9 9 3 8
1536.WBl Horizon Engineering 0113112001 16:lS

H o r i z o n n n g i n e e r ing
I I I I I I
1 3 5 8 5 NE Whitaker Way Portland, OR 9 7 2 3 0 5 0 3 / 2 5 5 - 5 0 5 0 FAX 5 0 3 i 2 5 5 - 0 5 0 5
I
Diagram of Outlet
w l?ues&& I
L N - ,
HIGH VOLUME EMISSION TESTS Plant: a P Source: 09 q~ o u sc
Magn Ranges, DP:O- I DH:O- I Leak Rates @ loo%, DH in H,O w
\
\ .LLfu%% 3
T+ DP’s from: Presurvey
During test
I I I I I I I I I I ““Horizon Engineering-’ \
. . \
H o r i z o n E n g i n e e r i n g 13585 NE Whitaker Way Portland, OR 9 7 2 3 0 5 0 3 / 2 5 5 - 5 0 5 0 FAX 5 0 3 i 1 5 5 - 0 5 0 5
Diagram of Outlet
HIGH VOLUME EMISSION TESTS Plant: CIS M Source: Q a c k \ n v i F Date: '2 / Z.7 ?a 0
Magn Ranges, DP:O-I DH:O- $ 1 6
P,: 30 4 5 'db' %HzO: D,: 1 \ 3 0 ?
Leak Rates @ loo%, DH in H20 w %@ Post-test
- DP's from: Presutvey
During test L/
'""Horizon Engineering-'
..: . 2 i'. . ' , '.
1
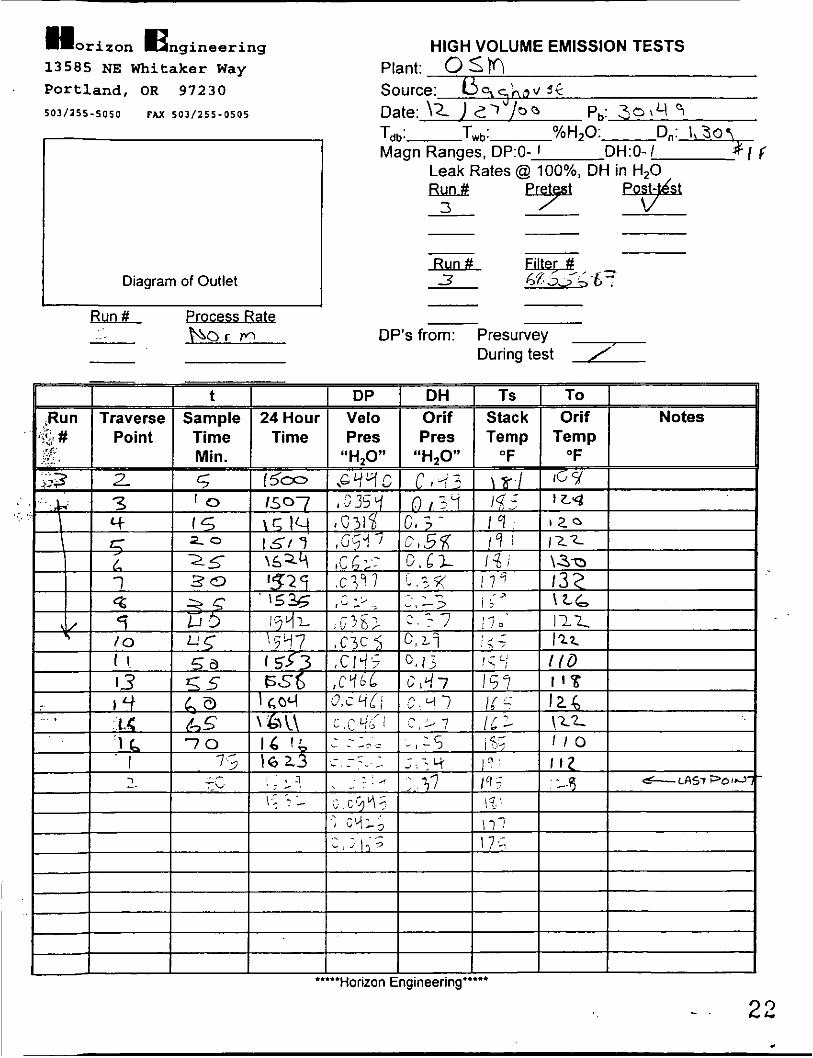
H o r i z o n ngineering HIGH VOLUME EMISSION TESTS 1 3 5 8 5 NE Whitaker Way Portland, OR 97230 Source: C\.q'nav 3 c
Plant: 0 S M E
5 0 3 / 1 5 5 - 5 0 5 0 FAX 5 0 3 / 2 5 5 - 0 5 0 5 Date: 1-L ) < > ' / O O Pb: 3 3 , Y 9
Dn:* c Tdb: Twb: %HzO: Magn Ranges, DP:O- 1 DH:O- I
I I -
Diagram of Outlet
- Nor IT.^
-
- m 3
DP's from: Presuwey During test ,'
""'Horizon Engineering""'
- . 22

Blank Correction and Filter Rinse Allocation
' orc:oI1 S I ~ ~ I \ ! i l l s Plant osm1536 0.00' IC.'.\ I h g I i o i i w - I ~ : T I ~ Source Tester 0.00'
2 7 - 1)c.c -7 111 10 Date
PARTICULATE Filter Wt less Fraction Rinse Residue Filter Residue TOTAi FILTER # Sample Wt Filter Blank of total Contribution Contribution
mg mg mg mg mg RUN I.D.
I 6555863 46.9 48.6 31.93% 6.195 0.543 55.33 2 6855688 62.8 64.5 42.38% 8.221 0.720 73.44
0.437 44.52 '3 6855689 37.4 39.1 25.69% 4.984
Sampler rinse residue 238 ml 19.40 mg Blank Acetone 191 ml -0.5 mg Blank correct residue 19.40 mg Sampler filter residue 999 0.0000 mg System Blank Blank correct residue 1.7000 mg Blank Filter 6855687173 -1.70 mg Lab Blank
*LEAD Filter Wt less Fraction Rinse Residue Filter Residue TOTAL FILTER # Sample Wt Filter Blank of total Contribution Contribution
mg mg mg mg mg RUN I.D. (Corrected)
1 6j j j863 0.9260 0.9037 26.49% 0.0 190 0.0000 0.922 2 (is55688 1.7000 1.6777 49.17% 0.0352 0.0000 1.712
0.8530 0.8307 24.35% 0.0174 0.0000 0.848 3 685 5 68 0
TOTALS 3.4790 3.4121 100.00% 0.0716 0.0000 3.483' Runs I , 2, & 3 Sampler rinse residue 238 ml 0.0725 mg Blank Acetone 191 ml 0.0007 mg
0.0716 mg Blank correct residue Sampler filter residue 999 0.0000 mg System Blank Blank correct residue 0.0000 mg Blank Filter hXijhS7 7 : 0.0223 mg Lab Blank
- TOTALS 147.10 152.20 100.00% 19.400 1.700 173.30'
Runs 1,2, & 3
23 1536.WB1 Horizon Engineering 02/01/2001 11:16

ANTECH Analysis/Technology
Mr. David Rossman HORIZON ENGINEERING 13585 NE Whltaker Portland OR 97220
January 23,2001 JON 0026402-03
0 1 - 2 5 - 0 1
Identification: OSM (Horizon # 1536) Received: 12/30/00
Samvle # 36400 3640 1 Identification OSM OSM
Rinse blanks (Runs 1-3)
Front acetone rinse: Volume (mls) 238 191 Residue (g) 0.0194 -0.0005
~~
Samvle # 36400 36400 36400 3640 1 3640 1 Identification Run 1 Run 2 Run 3 blank blank Filters: numbers 6555863 6855688 6855689 6855687 6855673 Residue (g) 0.0469 0.0628 0.0374 -0.0007 -0.0027
Respectfhlly submitted: ANTECH
d
Diana Tracy president
501 N.E. THOMPSON MILL ROAD CORBETT. OREGON 97019 5OW695-2135 FAX 503/695-2139 - . 24

Ah rECH SAXPLE DATA: EPA RESJDUES An;.lyst: 4 reviewer:- Job'l 3bq Identificati a: (55 M I53 (D
FRONT ACETOh 2:
-______- --
Saniple#, SarripleID LI
vol mark Datdtiine I-(F - Int ) dcssicator

ANTECH SAMPLE DATA: EPA RESIDUES
Analyst: 4 reviewer: Job# <3 f.99 Identification: 05 W 15.3 co BLANKS:
ACETONE: IMPINGER WATER: DCM: Sample# ,36c(o Sample vol mark J Dateitime 1-1 JP Into dessicator
Vol(mls) / 9 [ datehime datehime datehime
GWti(g) 130. 301d J - a q f i . GWt2(g) J30,300? 1-3 GWWg) GWt4(g) GW%) GWt6(g) Average 130.30 I D
Tare(g) 130-30/5 \&3\ 16‘
Net (g) - I D O05
weighed weighed weighed
. . . . . . . . . . . . . . . . . . . . . . . . . . . . . . . . . . . . . . . . . . . . . . . . . . . . . . . . . . . . . . . . . . . . . . . . . . . . . . . . . . . . . . . . . . .
FILTER: FILTER:
SampIeD m m 625 j.ba.7 bsn? G t ~ 3 - 6 ~ 3 vol mark Datehime 1 a- 39 f l q Id-a? SW Into dessicator
Sample # 3 ~ V O t 3b40 (
. . Vol(m1s) datehime datehime datehime .. .
GWtl(g) q , A \ O I 1-2 olvt y . I-a =I+ GWt2(g) 3.aIDa 1-3 ? P ‘ / , 2 f 7 f l 1-3 91t
GWt4(g) GWt5(d G W t W
weighed weighed weighed
>%,.., .;,.. ’: .L . .. GW%) 1 J....
,-.
< Average ‘f. 3 I 0 2 1‘. ~ 7 5 ~

...........................................................................................
Datehime Datdtime
........................................................................................... OC DATA:
I - L-/ 1-5- 1-7 /-y W L/ J
r / 7- v 4
r/
. Datdtime I - a I - 3 ’ Balance calibrated r / J
Y QTlTS cert wts) Datehime
* Temphemp Relative humidity (%)
,,:, ’ ,
L 27

ANTEC1-I SAMPLE DATA: SPA .CESICL'ES
revi, +m: --- Andyst: - - Iden ifica:ion:-- _0_54L----- _/.53L& -- J o b f l ~ X . c J _ __ -
H O S E BLANKS.
ACETONE: Sample ,# .-
Sample D -
Datehime -_ -
Vel( rnls) -
GWil(g) - G W W ) - GWt3(g; - GW:l(g) -
.GC"/tS(g) - GWt6(g) - Average -
Tar:: (g) -
Ne:(d .- -
vol :Liar::
Into dessicztor
.............................. FILTER: Sample# .- Sample ID. IC -~ L.$&L vol mark Datdtirne Into dess. ,..tor
Voi(mls) .- - date, .le weig d
L B S 5 b 3-7
........................................................... FIL .'ER
_ -
datehin. ,xi ghec.

0 z n 0 7 C 0 N
I
.- b
01
i r\;
- c
- . 29

A Ewironmental Services Laboratory, Inc. E s L
I7400 SW Upper hones Ferry Road Suite 270 * Portland, OR 97221 * (S03) 670-8520 Januarv 25.2001 ~.
Mike Wallace Horizon Engineering 13585 NE Whitaker Way Portland, OR 97230 TEL: (503) 255-5050 FAX (503) 255-0505
RE: OSM-1536
Dear Mike Wallace,
0 1 - 3 0 -0 I
Order No.: 0 10 1063
Environmental Services Laboratory received 13 samples on 1/12/01 for the analyses presented in the following report.
The Samples were analyzed for the following tests: ICP Metals (EPA 6010B)
There were no problems with the analyses and all data for associated QC met EPA or laboratory specifications except where noted in the Case,Narrative. Results apply only to the samples analyzed. Reproduction of this report is permitted only in its entirety, without the written approval from the Laboratory.
If you have any questions regarding these test results, please feel free to call.
Sincerely,
Nichole Karl Project Manager
Technical Review
ANALYTICAL SERVICES FOR THE E N Y I R 0 " T
30

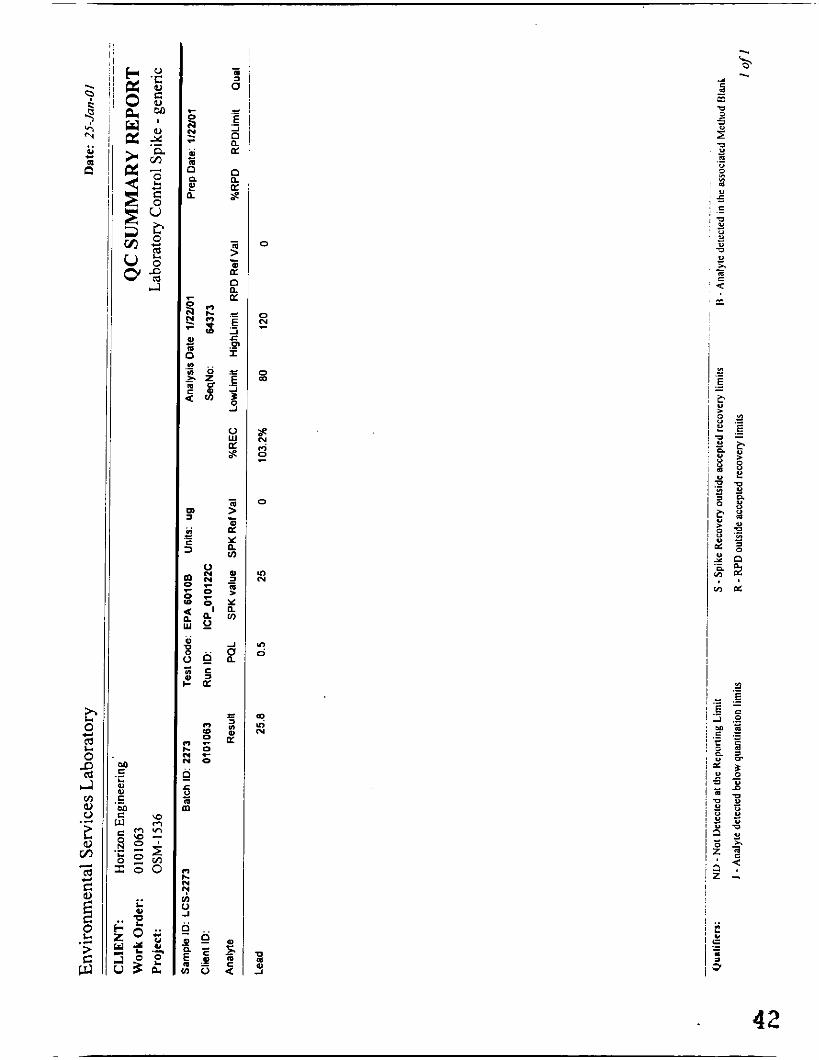
Environmental Services Laboratory Date: 2s-Jan-Ol __ -
CLIENT: Horizon Engineering Client Sample ID: Filter Run l(68.55683) Lab Order: 0101063 Project: OSM-1536 Lab ID: 0101063-OI A
Tag Number: Collection Date: 111 1/01
Matrix: SOLID
Analyses Result Limit Qual Units DF Date Analyzed
ICP METALS EPA 60108 Analyst: Imc Lead 926 1 .oo ug 1 In201
QuJifirn: ND - Not Dtleclcd P I the Rcpaning Limit
J - Analytc detccled below quaniitation limiu
B - Analyte delcclcd in the associated Method Blank
' ~Valuc cxcccdr Maximum Contaminant Level
S -Spike Rccovcry oulsids acceplcd recovery h i s
R - RPD oulride accepted recovery limiu
E - Value above quanlilation range
I of I I
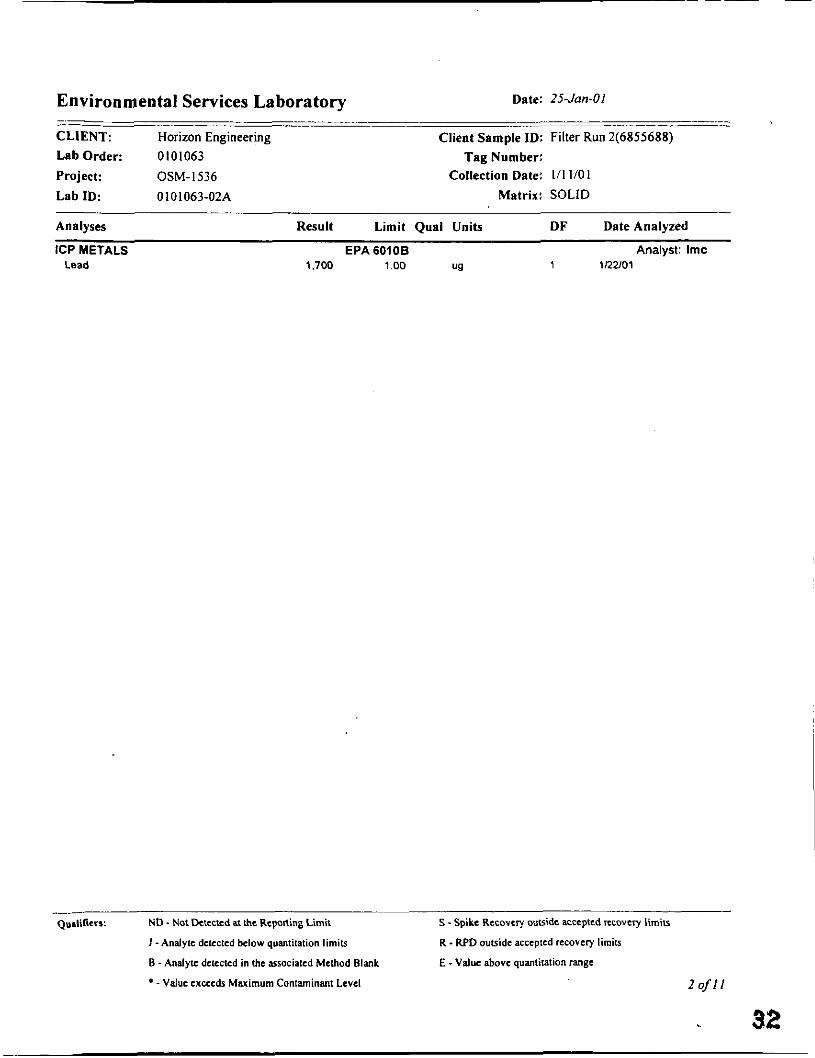
Environmental Services Laboratory Date: 25-Jan-Ol
.- _ _ ~ ~ ~~- - - CLIENT: Horizon Engineering Client Sample ID: Filter Run 2(6855688) Lab Order: 0 IO1063 Tag Number: Project: OSM- I536
Lab ID: 0 10 1063-02A
Analyses Result Limit Qual Units DF Date Analyzed
ICP METALS EPA 60108 Analyst: Imc
Collection Date: 111 110 I Matrix: SOLID
-
Lead 1.700 100 ug 1 1122/01
Quslificrs: ND - Not Dctcctcd at h e Reponing Limit
I - Analytc dcvctcd below quantilation limits
B - Analytc dcleclcd in lhc arsocialcd Method Blank
- Valuc cxcecds Maximum Contaminant Lcvcl
S -Spike Recovcry outside accepted recovery limits
R . RPD outside acccptcd recovery limits
E ~ Valw abovc quantiration range
2 o f l I
32
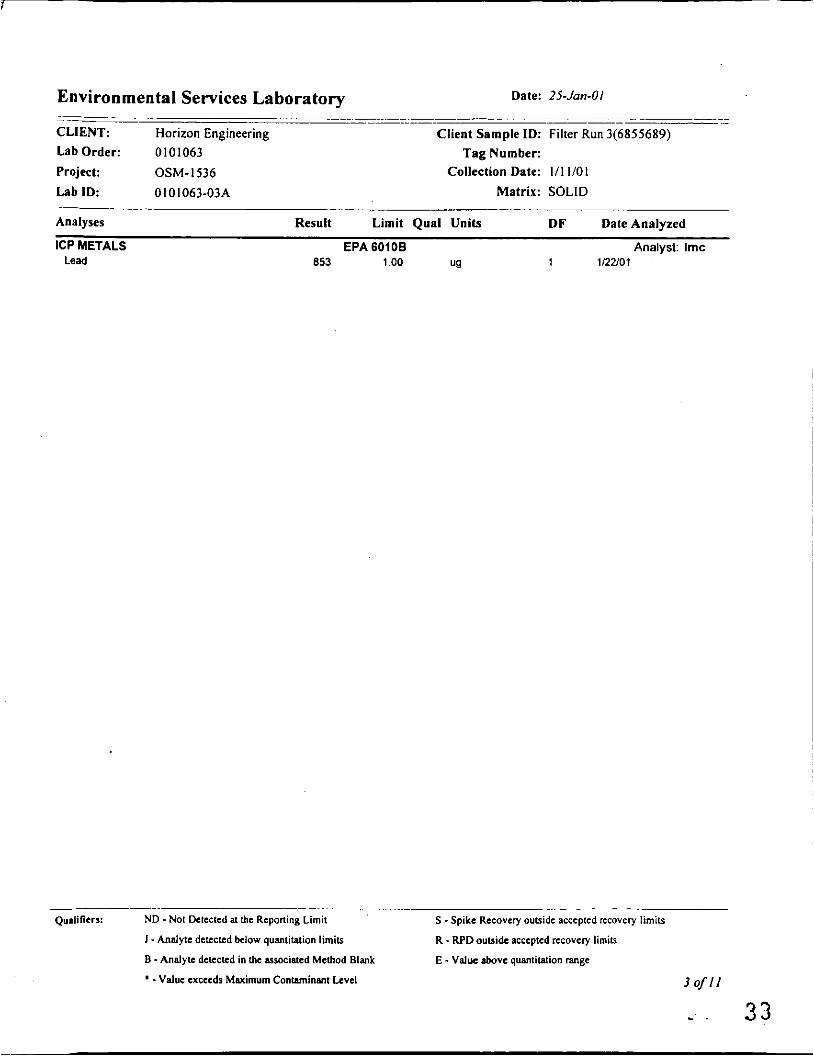
Environmental Services Laboratory Date: 25-Jan-01
CLIENT: Horizon Engineering Client Sample ID: Filter Run 3(6855689)
Lab Order: 0 IO IO63 Tag Number: Project: OSM-1536 Collection Date: 111 1/01
Lab ID: 0101063-03A Matrix: SOLID
- - - ___ -.
Analyses Result Limit Qual Units DF Date Analyzed
ICP METALS EPA 6010B Analyst: Imc Lead 853 1.00 ug 1 1/22/01
Qudilicn: ND -Not DCteclcd al the Reponing Limit
I - Analytc detected below quantitation limits
B . Analyte detected in the acrociatcd Method Blank
S -Spike Recovery ouuidc accepted recovcry limits
R - RPD outside accepted recovery h i &
E. Value above quantitarion range
' .Value exceeds Maximum Contaminant Level 3 o f l l
- . 33
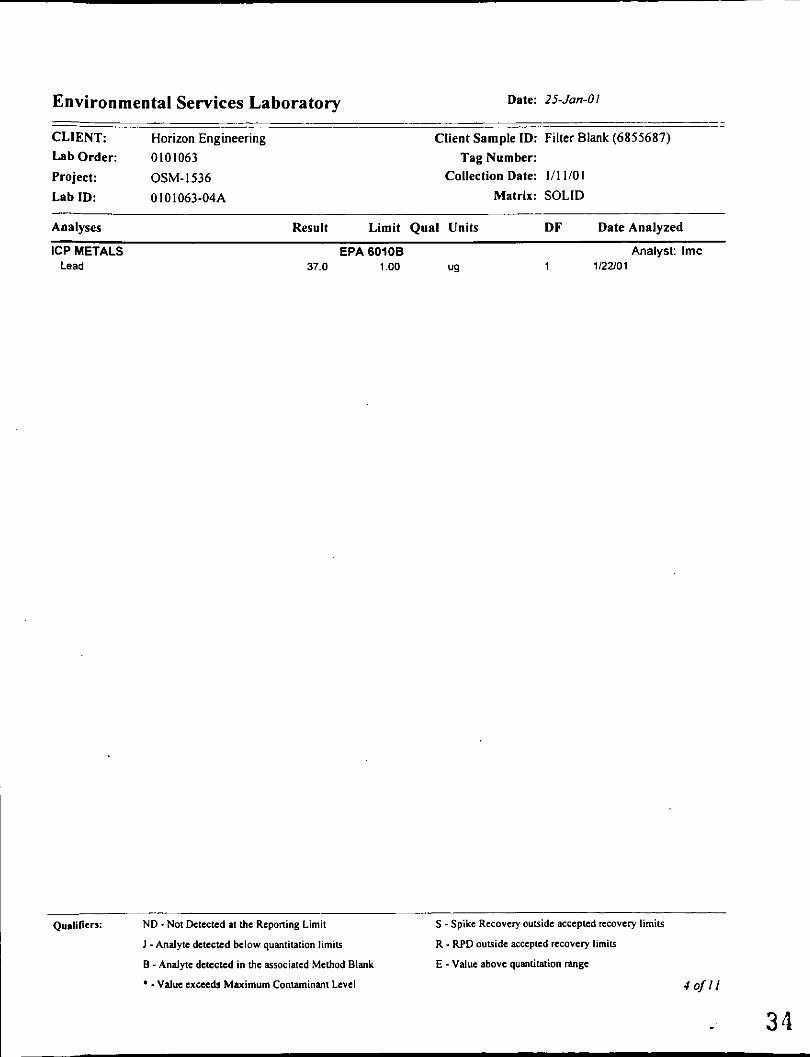
Environmental Services Laboratory Date: 25-Jan-01 . __ . -. . -- -. . .. .- -. - . -. ._ . ~ . _ _ - - . _ - -. .. -- - - ~ ..
CLIENT: Horizon Engineering Client Sample ID: Filter Blank (6855687)
Laborder: 0101063 Tag Number:
Project: O W - 1 5 3 6 Collection Date: l i l I 01
Lab ID: 0 IO 1063-04A Matrix: SOLID
Analyses Result Limit Qual Units DF Date Analyzed
ICP METALS EPA 60108 Analyst: Imc
.. . - - ~
Lead 37 0 100 ug 1 1.2ao1
Qudillrrs: N D . Not Defected st the Reponing Limit
J - Analyte detected M o w quanlitafion limiu
B - Analyte detected in the associafed Method Blank
'.Value cxcceds Maximum Contaminant Level
S -Spike Rccovcry outside accepted rccovery limiu
R . RPD ouuide acccpled recovery limiu
E -Value above quanfilation range
J o f l l

Environmental Services Laboratory Date: 25-Jon-01 .. . - ........... - ... . -. . . . . ...... - ..... .- - ... ~ . . . . . . . . . . . . . . . . . -
CLIENT: Horizon Engineering Client Sample ID: Filter End Blank(6855673) Lab Order: 0 I O IO63 Project: OSM- I536 Lab ID: 0101063-05A
Tag Number: Collection Date: 111 1/01
Matrix: SOLID
Analyses Result Limit Qual Units DF Date Analyzed
ICP METALS EPA 60108 Analyst: Imc Lead 7.60 1.00 u9 1 1/22/01
- Qualifiers: ND. Not Dctcctcd at Ihc Rcpaning Limit
J - Analytc delected below quantilation l imiu
B - Analylc detected in thc mrocialed Mcthod Blank
- Value exceeds Maximum Contaminant Level
S -Spike Recovery ouuide accepted recovery l imiu
R - RPD oulside accepted recovery lirniu
E -Value above quantilation range .
5 of11
... 35

Environmental Services Laboratory Date: 25-Jan-01
CLIENT: Horizon Engineering Client Sample ID: 36400 Acetone Lab Order: 0 101063 Tag Number: Project: OSM-1536 Collection Date: 111 1/01 Lab ID: 0 101063-06A Matrix: SOLID
Analyses Result Limit Qual Units DF Date Analyzed
ICP METALS €PA 60108 Analyst: Imc
__.~___ __ _ _ _ _ _ ~ _- ---__-_.___- ~~
Lead 72.5 0.500 ug 1 1/22/01
Qudiflrn: ND - No1 Dctcctcd at lhc Reponing Limit
J . Analylc dctectcd M o w quanlitatian limits
B . Analylc detected in thc astocialed Method Blank
S -Spike Recovery outside accepted recovery limits
R - RPD ovtridc accepted recovery limits
E -Value abovc quanlitalion range
Valuc sxcccds Maximum Contaminant Lcvcl 6 o f l l
31

Environmental Services Laboratory Date: ZS-Jan-Ol
CLIENT: Horizon Engineering Client Sample I D 36401 Acetone Lab Order: 0101063 Tag Number:
Collection Date: 111 1/01 Project: OSM-1536 Lab ID: 0 I O 1063-07A Matrix: SOLID
~ - ____ - .- -___ -. -__- -
Analyses - ~~ ~
Result Limit Qual Units DF Date Analyzed
EPA 60108 Analyst: Imc ICP. METALS lead 0.700 0.500 ug 1 1/22/01
Qudificrs: ND. Not Detected at thc Reponing Limit
I - Analytc detected k l a w quantitation limits
B. Andytc dctcckd in the arrocialcd Method Blank
S .Spike Rccovcry outside acccpkd recovery limits
R ~ RPD outside acccptcd recovery limits
E -Value above qu~li larion rMgC
7of11 -Value creeds Maximum Contaminant l eve l
37

Environmental Services Laboratory Date: 25-fan-01 ......... .......... . - .. - ............... ........ - .... - . . . . . . . . . . . . . . . . . . . . - ....... ................ ............ - - -- -. -. - .
CLIENT: Horizon Engineering Client Sample ID: 364 Lab Blank Lab Order: 0101063 Tag Number: Project: OSM-I536 Collection Date: 1 1 1 1 0 I
Lab ID: 0 101063-IOA Matrix: SOLID
Analyses Result Limit Qual Units DF Date Analyzed
ICP METALS EPA 60108 Analyst. Imc
. .- - .. ..-.- -
Lead ND 0 500 u9 1 1R2/01
Qudi Acrr: ND. Not Dclcctcd at the Reponing Limit
1 - Analylc detected k l o w quanlitation limits
B. Analyic deleclcd in the associated Method Blank
S -Spike Recovcry outside acccplcd recovery limits
R . RPD outside rccptcd recovery limits
E - Value above quantilalion range
' - Value excecds Maximum Contaminant Level l O O f I 1
- . 38

- . 39

i !
1 1

0 N
s m -
m u) N
?
m
Y E .- .- -
0
0 N
42


d * 0 c-c cn 3 u
n
: 8 -
7- --
1 y Y
F 0
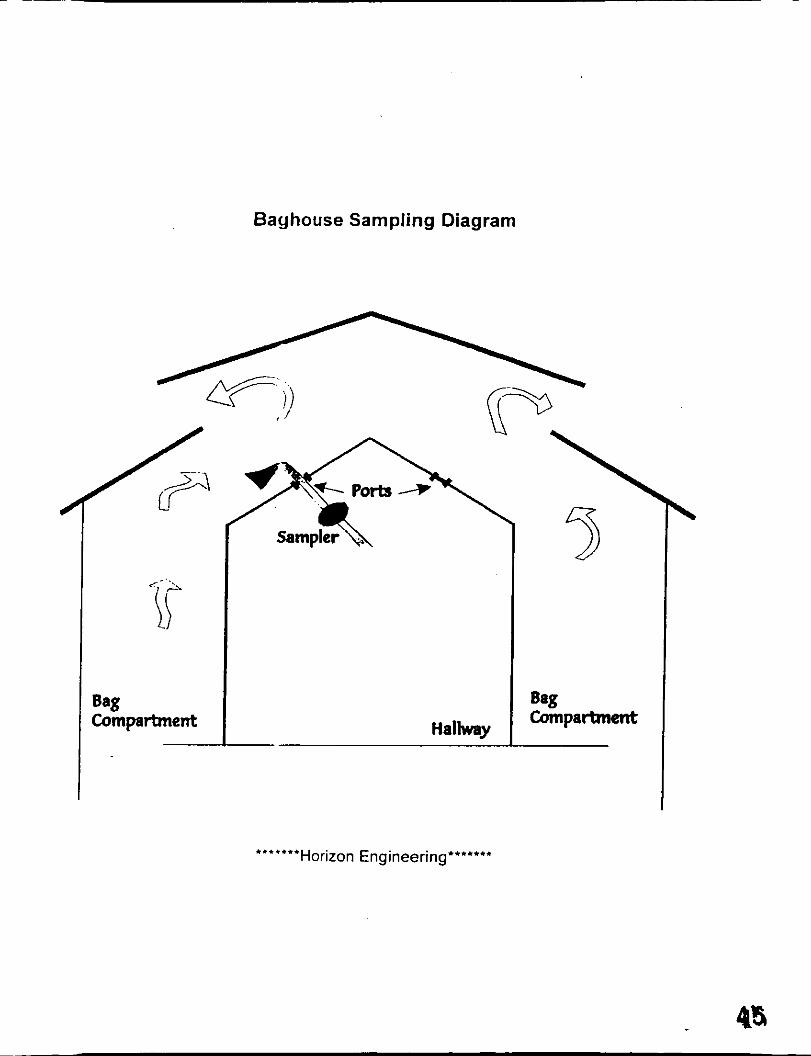
Bayhouse Sampling Diagram
*..*... Horizon Engineering"""'"

VOLUME FLOW RATE DETERMINATION Flow Rate Determinations and Field Data Traverse Point Location - Inlet & Outlet


c :: 'C 0 X

OD F! r r r 0 a N c - h c

Inlet Flow Rata Determination
22 23 2 1
dP(inH201 2.1240 1.9740 2.3680 2.4180 2.1980 2.4560 2.2dbO 2.2150 2.0960 2.2890 I .Wl0 1.9650 2.0150 1.b710 1.8190 1.0070 2 2 1 9 0 2.11m 2.3890 2 0880 22360 2.4180 2.1160 1.8980
Ts I OF I 1800 1920 202 0 1890 185 0 1860 1860 186 0 1810 192 0 I9JO 201 0 201 0 2180 220 0 2180 230 0 244 0 244 0 247 0 243 0 244 0 252 0 2 5 0 0
dP (inH2O) 1,2690 1.1830 1l110 1.1210 I2500 I IOSO 1.7410
2.1160 2 4170 2.1280 2.6550 2 6480 2.4IW 2.6160 2.SJ?O 2.3190 2.6180
2,2290 2.3630 2.3110 2.4150 2.2090
1.8930
1.9890
:I;.:
T3I-F 221.0 228 0 213 0 216 I1 229.0 239 0 231 0 215.0 224.0 211.0 201.0 201.0 200.0 199.0
205.0 205 0 191.0 200.0 199 0 201.0 209 0 211.0
205.0
208.0
1.' , Prr-lr>t
11:oo I '.bR> o 8242
612.9 30.49 -7.12 29 95
I . I1.11
:,9u1 28 69
5.40J 113.635 391.513
dP(inH20) 2.086U 2.1400 2,9400 l.1500 2.7400 2.5200 2.3500 18100 I8910 2.woo 2.2000 1.4200 3.J400 J.SlO0 1.8100 1.1300
1,6100 1.6100 3 3800 1.5200 1.5100 3.3800 14600
3 . m o
T> ( 'F 1 I ,J'J 0 113 0 162.0 156.0 IJ l .0
I46 0 146.0 145.0 144 0 142.0 140.0 130,O 124.0 121.0 120.0
111.0 111.0 115.0 114.0 114.0 11d.O 114.0
m o
I i8,n
dP(inH20) 1.6300 i.wn 2. I zoo 2.3100 2.7600 2.9400 2,8800 2.9900 1.2100 2.8700 2,9600 2.5300
1.1500 1.S300 1.7900 I1600 ' 2.1900 l.5100 2.1000 2.0600 2 0300 2.1800 1.9000
i.7000
?<I I .;
TI ( O F )
257.0 268 0
281 0 281.0 285.0
282.0 282.0 280 0 210 0 261.0 251.0 249.0 249.0 254 0
261.0 269.0 262.0 258 0 258.0 269.0
2dz.o
2780
282.0
258 n
'I: I
,:o I,, -1.22 29.96
I . i S l 6
2 1 U I 28.52
5.891 559,813 427.801
3.64
5.648 536.114 409.688 458.630
I
, 1536.WB1 Horizon Engineering 01/31/2001 1621

. , Md Molecular weight of dry gas Gas analysis ;.”,:
M s Molecular wl of acl. gas Ms = rndMd + 18 (1-nid) .., . .
vs Velocity. fpm Vs = 5125s (1IPsMs)lTL (Cp) . .
’ I ,. , . I
I ,
. I d ,.
I b,i . “ *’ ‘ I : I, rla Actual flowrale. aclrn qa = VsAs/144
qs Flowrate @ std cond. scfrn qs = 0.123 VsAs rnd Ps / Ts -

Pllol I D . ( j - 5 IliG, # I / 1
..;; j:. - :
n , ; , . L , L - , : .
- Post Test Leak Check -.: 4 r
E Avo JAP
I I I I I I I
----- I- 1 - 7 I
t 4 4
- - I
- . 51

VOLUME FLOWRATE MEASUREMENT . .. . . .: 13585 N.E. Wliiloker Way plant c.. i":
Phone (503)255-5050 Porlland. Of? 97230 ..
Fox (503)255-0505 , .
. . I I . . -
- 8 , , Sampling Location e.: -i '2 In, c '4 9 I ,
I Test Conditions b2 i-' 1
Date. > ' - T L X Time - Duct Diinenslons Cyclonic Flow 7 Yes- No\ Avy Null Angle 1.
I I I I I I I I I I I Avg dAP
PAS
VS
qa
(IS
Molecular wl of acl. gas Velocily, fpm
Actual flowrate. acfm
Flowrale @ sld cond. scfrn
MS = mdMd + 18 (1-md)
Vs = 5125s (11PsMs)lQ (Cp)
qa = VsAs1144
cis = 0.123 'IsAs md Ps I Ts

VOLUME FLOWRATE MEASUREMENT -. . . '<.
13585 N.E. Wlillciker Wuy Plant a . ' 7 . . I ,
Saiiipllng Location x < . ~l,,~'. ', - '- .' 11
Test Condilioiis I$ / 3~ '
Date 1:; 2 .' ~ - Titrie . Duct Dlniensioiis
Polfland. OR 97230 , Phone (503)%55-5050 Fax (503)255-0505 - : -. .
Cyclonic Flow 7 Yes- No: Avy Null Angle __ P o = Baronletric Pressure >. ~ ' in Hy Duct Area
PilotI.D. 1 1 - 5 Post Test Leak Check L, .- ' 4
d L Z O 6 p..-, ~ . , - .~ - :-:..: - , . Cp = Pitot Coeflicient ~ . - . Gauge I.D. ~ - -
I-- I I .. , - . I I I I
I I I I
Dud press., in ti
;
- 5 3

TS Duct temp.. OR
P S I Duct press., in H,
S m v % 1-120 in gas slreain md Mole fraction dry gas
Md M S
vs Velocily. Ipm
ria Aclual flowrate. aclni
qs ,
Molecular weight 01 dry gas Molecular wt of act. gas
Flowrale @ sld cond. scfm
. . -. ___ .- - .. . .. - . -- .- -. MetliodlEqualioii 1- Run 2 Run3 Averago
Gas analysis

md tole fractiri:i dr
55 ..

VOLUME FLOWRATE MEASUREMENT
13585,N.E. Wtillaker Wciy plant c5,y >d*
Sampling Locatloti E,> j 2 : , c ' r
Date /L::- Z - "
Porlbnd. OR 97230 Phone (503)25&505u Fax (503)255-0505 Test Coiidltions ?, I.'. -. .1
Tiine - Cyclonic Flow 7 Yes- No- Avy Null Aiigle - PO = Baronretrlc Pressure -:. -" .' In Hg DuctArea - i i i l
Pllot I.D. !L. -.< ' Post Test Leak Check .-,.=i Ruii # I I
Duct Dlinenslons
_ - . , ;. Cp = Pitot Coefficient - : : Gauge 1.0. ,- H - ! in 1120 B v ? . ,
~ -
. .

Traverse Point Location - Outlet
Client 1)rcyoti S t c d Lli l ls Ponlmd, O R D x c Location P * I ~ ~ : I I I ~ , O R \IJT..'RTT.T.IH C R! EPA Method U I Outlet os111 I 5 .X Filc
52.0 Number of PORTS P # INSlDEof FAR WALL F in lo OUTSIDE of Nipple INSIDE ofNEAR WALL N 0.00 to OUTSIDE of Nipple
StackiDuct WIDTH DOWNstream Disturb Upstream Disturb Stack/Duct DEPTH Equivalent Diameter Area DOWNstream Ratio Wstream Ratio
Traverse (Particulate) Recommended # W o r t
Traverse WON-Particulate) Recommended UPtsPort
Dw A B
Dh De As
AlDe B/De
in 179.0 in in in 52.0 in 80.6
sqin 9308.0 0.00 0.00
25 5 5
16 3 4
Actual Points used per Port 5 Actual Number of Points 25
Trav Fract Stack Actual Nearest Adjusted Traverse Traverse Pt Depth Depth Points 8ths Points Points Points
#No (0 PP) . (DpxO (TP) (TP) (TP+N) (TP+N)
10.00% 52.0 5.2 5.250 5.250 5.250 5 I I 4 30.00% 52.0 15.6 15.625 15.625 15.625 15 5 I 8 50.00% 52.0 26.0 26.000 26.000 26.000 26
90.00% 52.0 46.8 46.750 46.750 46.750 46 3 I 4 70.00% 52.0 36.4 36.375 36.375 36.375 36 3 I a
1536.WB1 Horizon Engineering - . 5s
01/31/2001 16:23
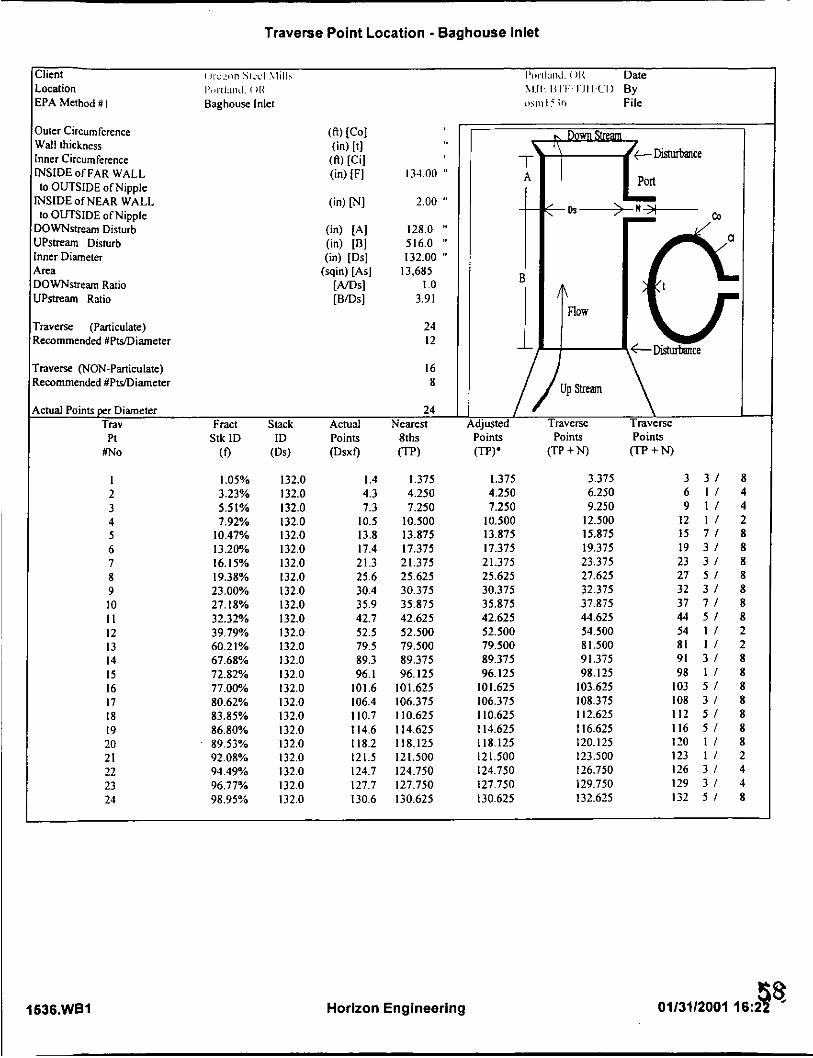
Traverse Point Location - Baghouse Inlet
Client Dare Location EPA Method !4 I
Outer Circumference Wall lhickness Inner Circumference INSIDE of FAR WALL to OUTSIDE ofNipple
INSIDE of NEAR WALL 10 OUTSIDE ofNipple
DOWNrtream Disturb X'stream Disturb :mer Diameter 4rea >OWNstream Ratio JPstream Ratio
rraverse (Paniculate) tecommended UPWDiameter
rraverw WON-Paniculate) kcommended UPWDiameter
134.00 'I
2.00 "
128.0 'I
516.0 "
132.00 '' 13,685
I .o 3.91
24 12
16 8
Wual Points per Diameter 24 Trav Fract Stack Actual Nearest
Pt Stk ID U N O (0
I 1.05% 2 3.23% 3 5.51% 4 5
7.92% 10.47%
6 l3.2Ph 7 16.15% 8 19.38% 9 23.00% 10 27.18% I I 32.32% 12 39.79% 13 60.21% 14 67.68% I5 72.82% 16 77.0Ph 17 80.62% 18 83.85% 19 86.80% 20 89.53% 21 92.08% 22 94.49% 23 96.77% 24 98.95%
ID (Ds)
132.0 132.0 132.0 132.0 132.0 132.0 132.0 132.0 132.0 132.0 132.0 132.0 132.0 132.0 132.0 132.0 132.0 132.0 132.0 132.0 132.0 132.0 132.0 132.0
Points (Dsx0
I .4 4.3 7.3 10.5 13.8 17.4 21.3 25.6 30.4 35.9 42.7 52.5 79.5 89.3 96. I 101.6 106.4 110.7 114.6 118.2 121.5 124.7 127.7 130.6
8ths (W
1.375 4.250 7.250 10.500 13.875 17.375 21.375 25.625 30.375 35.875 42.625 52.500 79.500 89.375 96.125 101.625 106.375 110.623 114.625 118.125 I2 1.500 124.750 127.750 130.625
1
i 1
_i liusted
Points (TP)*
1.375 4.250 7.250 10.500 13.875 17.375 21.375 25.625 30.375 35.875 42.625 52.500 79.500 89.375 96.125 101.625 106.375 110.623 114.625 118.125 12 1.500 124.750 127.750 130.625
'raverse Traverse Points
(TP + N)
3.375 6.250 9.250 12.500 15.875 19.375 23.375 27.625 32.375 37.875 44.625 54.500 81.500 91.375 98.125 103.625 108.375 112.625 116.623 120.125 123.500 126.750 129.750 132.625
Points m+N)
3 3 1 8 6 I / 4 9 I / 4 12 I / 2 I5 7 1 8 19 3 1 8 23 3 1 8 27 5 1 8 32 3 1 8 37 7 1 8 44 5 1 8 54 I / 2 81 I / 2 91 3 / 8 98 1 1 8 103 5 I 8 108 3 I 8 112 5 I 8 116 5 I 8 I20 I / 8 123 I I 2 126 3 / 4 129 3 I 4 I32 5 / 8
1636.WBl Horizon Englneering
~~~
01/31/2001 16:2 98

VISIBLE EMISSION DATA

SOURCE INFORMATION
Address
Phone U 1
Plume Color
Anached Plume? Detached Plume?
Poinl In the Plume at Which ' I ' Opacify was Observed Desdpllon of Background 7 L . c . l pr- + (--A
Color of Background &!.- A'- Condillon of Sky t l d .f /'
Wind Speed ( e - 3 ) - I Ambient Temperature ('F) GTF f
T h ---*
Wind Diredlon (from) /v /-
iourw Lavoul Sketch Draw North Arrow
0 Emission Point I
I ObssNers POSitlon
A Sun Locallon Line
VISIBLE EMISSION OBSERVATION FORM OBSERVATION RECORD
DATE /Z/27/7 TIME: Start '2 c : End /re I I
~~
I Seconds himn / cornmenfa . .. . ._ . - - . . .. . ._ . . ._ MIN I 0 I 15 [ 30 I 45 1 / 2 c 3
I
Csdi!calion No. I ! 7 7 ,;
ObseNe(s *-. Name (prlnl) .;/ t . . b _ ' - - / /><..<.--
Organizalion: Horizon Englneerlng. Portland, Oregon (503) 255-5050
I Cedifled ey: 1
.. 53

GASEOUS EMISSIONS Emissions Determination
Molecular Weight Determinations Analyzer Calibration Data and Bias Checks
Data Logger Gas Charts Strip Charts

Gaseous Emissions
Combined
! !:I11 ;::Ill!
: , , : I : ~ >:4; , I . > (
409.688 141.0
20.46
Clicnt Oregon Steel Mills MJEIBTFKJHICDB Testers Source ICA Baehouse-EAF Inlet osm I536 Fils
Run I Run2 Run3 Averagi
l l : l o i l : l l l 1 1 : 1 0 I 1:111 I I.::?.: I57,O I .:, 11- 14 .5 i1 l,>::~l 1t,:4.: I A: -i .; l 6 > : 1 . : 12:.:s lJ:lII) I .5:4.l
409.688 409.688 409,688 165.6 123.8 138.8 I d
20.52 20.39 20.40
- Location Portland, OR Date 27-Dec-2000 Number ofCompleted Runs Date Tested System Calibration Time - Initial Tci Test Time-Staning TtS Test Time-Ending Tte System Calibration Time - Final Tcf Test Mid-point Time Tx Volumetric Flowrate, Dry Standard dscf/min Qsd Production T o n f i r Oxygen % 0 2
Indicated average - Dry ppmv Cid Cylinder Value - High Range calibration gas ppmv Cma Cylinder Value - Low Range (Zero) calibration gas ppmv Coa System Calibration Response ~ High Range gas - lnilia ppmv Cmi System Calibration Response - Low Range gas ~ Initial ppmv Coi System Calibration Response - Low Range gas ~ Final ppmv Cof System Calibration Response ~ High Range g&s ~ Final ppmv Cmf Actual average - Dry (Corrected for Drift) ppmvCO Cgas Mass Emissions Ibm I hr Mgas Mass Emissions on Production Basis I b m r o n Nitrogen Oxides NOx Span Indicated average-Dry ppmv Cid Cylinder Value - High Range calibration gas ppmv Cma Cylinder Value - Low Range (Zero) calibration gas ppmv Coa System Calibration Response - High Range gas - lnitia ppmv Cmi System Calibration Response ~ Low Range gas - Initial ppmv Coi System Calibration Response - Low Range gas - Final ppmv Cof System Calibration Response - High Range g&s - Final ppmv Crnf A C I U ~ average ~ Dry (Corrected for Drift) ppmv-NO2 Cgas Mass Emissions Ibm-NO2 I hr Mgas Mass Emissions on Production Basis Ibmiron
Indicated average-Dry ppmv Cid Cylinder Value - High Range calibration gas ppmv Sc Cylinder Value ~ Low Range (Zero) calibration gas ppmv Coa System Calibration Response - High Range gas - lnitia ppmv Sbs System Calibration Response - Low Range gas - Initial ppmv Zbs System Calibration Response ~ Low Range gas ~ Final ppmv Zbe System Calibration Response - High Range gas - Final ppmv Sbe Actual average. Dry (Corrected for Drift) Mars Emissions Mass Emissions on Production Basis
Sulfur Dioxide so2 span
ppmv-SO2 Cgas Ibm-SO2 / hr Mgas
lbmiron
Carbon Dioxide Yo c 0 2 Carbon Monoxide co Span
91.7 898.0
898.0 -0.3 -0.3
887.1 92.6
165.5 1.174 250 8.77
90.30 0.00
87.50 0.30 0.10
87.50 8.88
26.06 0.185
30 4.3 i
26.40 0.00
29.32 0.56 1.34
29.85 3.05
12.45 0.088
0.0
125.0 75. I 96. I s S98.0 8W.O Wi.ll
8W.O ".I1 x9)l.o -0.3 -0.3 -0.3 -0.3 -0.3 4 . 3
sx7. I Si. I YY7.I 125.6 75.8 97.3 9 224.5 135.5 173.9 17 1.355 1.094 1.253 I .: 150 250 2 j 0
7.59 8.43 11.01 9 90.30 YI). j lJ 90.31) 0.00 n.oo 0.00
87.50 x7.50 87.50 0 . i O o.;o 0.;0 II.IO 0. IO 0. IO
S7.50 Yi.511 57.51) 7.60 8.52 11.24 9
22.30 25.01 32.99 26 0.135 0.202 0.238 0. I
20 ;I1 j l l
5.24 3.92 4.23 4 26.40 20.40 2b.4ll 0.OO 11.00 0.llll
2!).32 2tl.32 2'1.3: 0.56 0.M 0. j 6 I ..:A I .'1 1 3 4
?V.S5 ?'I.:{> ?').SI. 4.12 2.71 2.80 3,
16.82 11.08 11.44 13, 0.102 0.089 0.082 0.0
l l .0 0.0 n.o
0.4; I 0.43 0.37 0.49 1.000 I ' I .ooo I .01)0 I .ooo
I
1536.WBl Horizon Engineering o113~12aa1 i 6 : a

TGOC Emissions
I'.lI,, I (> :A? I ;~:A.; 14:21
409,688 141.0
20.46 0.43
Client Oregon Steel Mills MJEIBTF/nH/CDB Testers Source ICA Baghouse-EAF Inlet osm1536 File
I ?:I I1 I
I .: : I 11 i <,:l~; 12:38
409.688 165.6
20.52 0.27
I Location Portland, OR
I .oo 3
27.19 0.00 2.93
27.79 0.00
28.18 -0.31 -0.67 26.55 3.47 3.60
10.81 8.28
0.059
Date 27-Dec-2000 Number of Completed Runs
I.110 I .011 I .SI0
27.19 27.1'1 17.1') 0.01) U.IIl1 I I . l l0
4.83 2.74 I .79 3. I 27.70 27.1') 27.1')
11.01) 0.1~1) 0.00 28.1s 2 . 1 s 2 S . I S -11.37 - 1 l . i l -11.37 -0.67 -0.67 -11.67 26.55 26.55 26.55 5.20 3.21 2.44 3.6 5.40 3.39 2.53 3.7
16.20 10.17 7.59 11.3 12.41 7.79 5.81 8.6 0.075 0.063 0.042 0.06
Date Tested System Calibration Time - Initial Tc i
Test Time-Ending Tte System Calibration Time. Final Tcf Test Mid-point Time Tx Volumetric Flowrate, Dry Standard dscUmin Qsd Production Tonvhr Oxygen % 0 2 Carbon Dioxide % c 0 2
Test Time-Starting TlS
Moisture, Mole Fraction dry Gas Total Gaseous Organic Concentration
mfg (TGOC) Span
Span Gar- Instrument Response Factor JUM Factor C3H8 Span Gas- Carbon Count Equivalent Cylinder Value - High Range calibration gas
K ppmv
Cylinder Value ~ Low Range (Zero) calibration gas ppmv Coa Indicated average- Wet ppmv-C3H8 Ciw Span Gas Concentration- Equivalent ppmv Sc Zero Gas Concentration- Equivalent ppmv Zc System Calibration Response - High Range gas - Initial ppmv Ss
System Calibration Response - Low Range gas. Final ppmv Ze System Calibration Response - High Range gas - Final ppmv Se Actual average - Wet (Corrected for Drift & Response) ppmv-C3H8 Actual avenge - Dry (Corrected for Drift & Response) ppmv-C3HS Actual average - Dry ppmv-C Cgas Mass Emissions Ibm I hr Mass Emissions on Production Basis Ibmnon
System Calibration Response - Low Range gas - Initial ppmv a
1536.WB1 Horizon Engineering
MJEIMEW AnalysidQA
Combined Run I Run2 Run3 Avera I
I l : l i l l I I:I11 I LIII I.;::,: L : 5 6 i.,..i,: 14:09
409.688 123.8
20.39 0.49
96.36%1 96.36% 06.36% 96.36% LOO I IO0 Ill0 I1)O
6 1 01131/2001 16:24

Molecular Weight Determination
:ombined
Client Oregon Steel Mills MI WBTF!TJH/CDB Testers Source ICA Baghouse-EAF lnle osm I536 File
Run I Run? R u n 3 Avg
Location Po-rtland, OR Date 27-Dec-2000
System Calibration Time - Initial Tci Test Time-Staning (Hivol Interval) TIS Test Time-Ending (Hivol Interval) Tte System Calibration Time - Final Tcf Test Mid-point Time Tx Volumefric Flowrate, Dry Standard - Inlet Average dscflmin Qsd Production Rate Tonihr
1 1 : I O 1200 16:42 I6:43 1421
409,688 141.04 29.01
25 20.62 11.61 0.00
11.70 0.02 0.04
11.73 20.46
25
Molecular weight, Dry Stack Ibdlb-mole Md Oxygen-Inlet 0 2 span
I 1 : l O I 1 : l O 1 1 : l O 12:oo 13:23 15:oo 13:16 1436 16:29 16:43 I6:43 16:43 12:38 14:09 15:44
409.688 409,688 409,688 165.65 123.82 138.82 29.00 29.02 29.01
25 3 25 20.67 20.55 20.57 20.61 11.61 11.61 11.61 0.00 0.00 0.00
11.70 11.70 11.70 0.02 0.02 0.02 0.04 0.04 0.04
11.73 11.73 11.73 20.52 20.39 20.40 20.4:
25 25 25
Indicated average - Dry Cylinder Value - High Range calibration gas Cylinder Value - Low Range (Zero) calibration gas System Calibration Response - High Range gas - lnitia System Calibration Response - Low Range gas - lnitia System Calibration Response - Low Range gas - Final System Calibrafion Response - High Range gas - Final Actual average - Dry (Corrected for Drift) Carbon Dioxide-Inlet Indicared average ~ Dry Cylinder Value - High Range calibration gas Cylinder Value - Low Range (Zero) calibration gas System Calibration Response - High Range gas - lnitia System Calibration Response - Low Range gas - lnitia System Calibration Response - Low Range gas - Final System Calibration Response - High Range gas -Final Actual average - Dry (Corrected for Drift)
Cid Cma Coa Cmi Coi Cof Cmf cgas span Cid
Cma Coa Cmi Coi c o r Cmf cgar
MJEIMEW Analysis/QA
12.52
12.52
-0.05 -0.05 12.42 12.42 0.430 0.374
0.46 0.43 0.4: 12.52 12.52 0.00 0.00
12.52 12.52 0.00 0.00
-0.05 -0.05 12.42 12.42 0.488 0.473 0.44:
62 1536.WB1 Horizon Engineering 0113112001 16:24
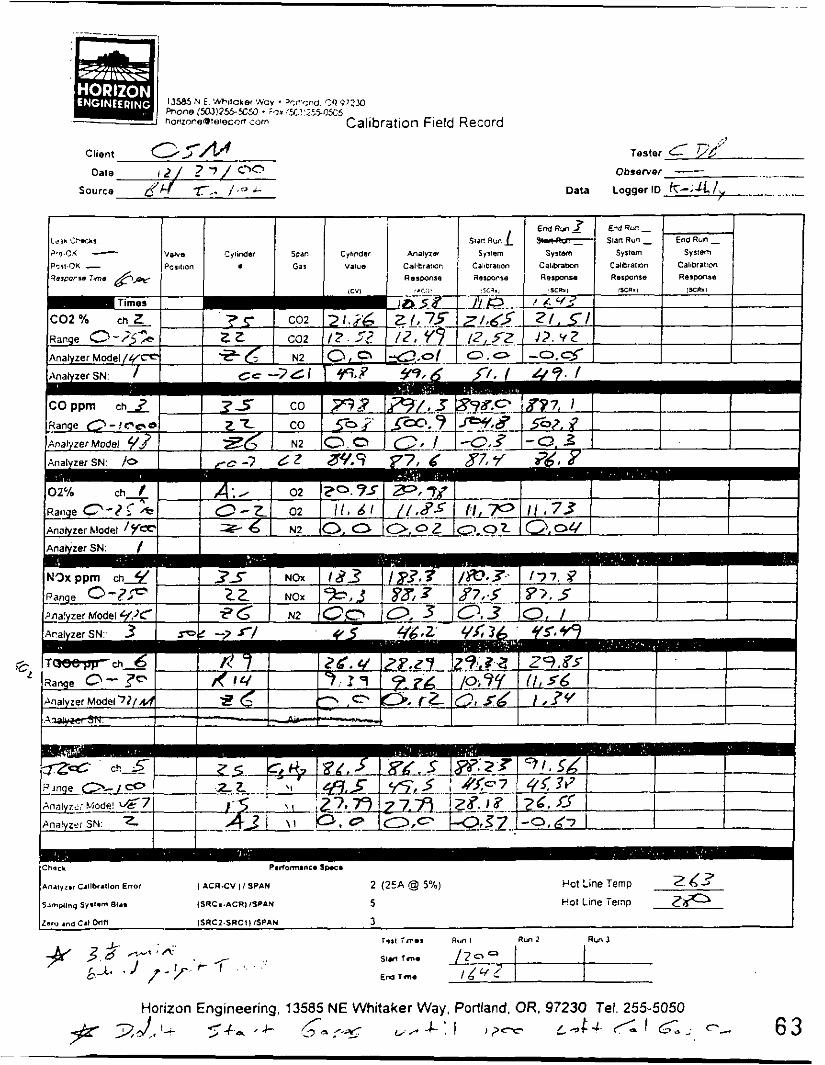
rester C Vd" - - Observer -
Data Logger IO k-.Ji 1, . _ _
Horizon Engineering, 13585 NE Whitaker Way, Portland. OR, 97230 Tel. 255-5050 b,. L.: I ,??e L e k " . (D I c; c, 63

Bias Check
cv ACR SCRi SCRf span < 2 % < 5% < 5 % < 3 %
Run 1-3 High Range 25 20.95 20.98 84% 0% 0% Mid-Range _. ' 5 11.61 11.85 11.70 11.73 46% I % I Yo 0% 0% Zero ? < .. 0.00 0.02 0.02 0.04 0% 0% 0% 0% 0%
OXYGEN
CARBON DIOXIDE Run 1-3 High Range 25 21.86 2 I .75 2 I .65 21.51 87% 0%
Mid-Range 23 49.80 49.60 51.10 49.10 199% I % 6% 2% 8% Mid-Range 25 12.52 12.49 12.52 12.42 50% 0% 0% 0% 0% Zero -. ' 5 0.00 -0.01 0.00 -0.05 0% 0% 0% 0% 0% -
CARBON MONOXIDE Run 1-3 High Range 1000 898.00 89 I .30 898.00 887.10 90% I %
Mid-Range 1001) 508.00 500.90 504.80 502.80 51% I % 0% 0% 0% Mid-Range 1000 84.90 87.60 87.40 86.80 8% 0% 0% 0% 0% Zero inoo 0.00 0.10 -0.30 -0.30 0% 0% 0% 0% 0%
Run I HighRange 250 183.00 183.30 I80.30 177.80 73 % 0% 1% 2% 1% Mid-Range 250 90.30 88.30 87.50 87.50 36% 1 Yo 0% 0% 0% Mid-Range 3 0 45.00 46.20 45.36 45.49 18% 0% 0% 0% 0% Zero 250 0.00 0.30 0.30 0.10 0% 0% 0% 0% 0%
Run 1 HighRange 30 26.40 28.29 29.22 29.85 88% 6% 3 7 0 5% 2%
Zero 3n 0.00 0.12 0.56 1.34 0% 0% 1 Yo 4% 3%
Run I High Range C3H8 100 86.50 88.23 91.56 87% 3 Yo
Mid-#I CH4 100 49.50 45.07 45.38 50% 0% Mid-#2 CH4 IO0 27.79 28. I8 26.55 28% 2%
NITROGEN OXIDES
SULFUR DIOXIDE
Mid-Range .3 0 9.39 9.86 10.94 11.56 31% 2% 4% 6% 2%
TOTAL GASEOUS ORGANIC CONCENTRATION
I Zero N2 IO0 0.00 -0.37 -0.67 0% 0% I Part 60, Appendix A, Method 6C, Figures 6C-3 to 6C-5
Horizon Engineering 01/31/2001 1 1536.WB1

0
r- 0 3
0
W ?? - 0
\o ................... F?
3
0
m ...................... ??
0
m 0 4
0 '?. *o - 0
0 c1 0
p. p- Z N
u g 6 .. W
0 0 m . . 3
0 '?. 2
0 0
N 4
0 9. 4 d
0 0

0
r- o 3
0
W c?. 3
0
\o 0 d
0
m CT! c
0
m 0 6
0 c?. - 0 - 0
0 t-4 0
0 r-- st-4
u
$ m 4
0
m 9. 3
0
N c?. - 0
c1 9. *
0 0 0 - 0
0 0 m - 0 m
0 0
0 0
0
\o
0 0 0 r. o\ 00 0 O m d
0 0
66

............
...............
.........
.............
...............
.................
.................
...........
...............
...........
*
.............
................
.............
...........
..... ~~~ .........
__
................
..........
..............
..........
............
............
............
........ ~ ..
........... __
............
...............
*
...~ .........................
.~ ....................
-
~. ...........
...............
..............................
..~
..............................
..................................
e4
0 \9 r'l
111 .................
8 II II 111 - - .
..cI( ,.j ....................... : ....... ................ .- ......
: u I l o ! i b i O i m i
0
P 0 3
0
W cf! 3
0
v) 0 3
0
m cf! 3
0
m 0 - 0 '?. - 0 - 0
0 N 0
0 r-̂ Z H
u $ 6 .. W - 0
m 0 3
0
PI cf! - 0
PI 0
0 T. 3 3
0 0

@ON) AMdd 0 3
0 0 N m 0
d 0 0
0 oo O W t- 10
.................
0
W CT!
0
UI 0 3
0
10 CT! 3
0
vl 0 3
0 CT! a 0 - 0
0 N 0
0. e” Z N
0 Q)
Z Q . . VI 3
0
m 0 3
0
N CT!
.................. i I ! --;=--, 7: ~ ................................. ~ i - ................. - 0
N 3
4 i
I I a 0 ................ ~ ....................... i~ .................... ~ ................... x ........ !!.- ??
0 0 z v !
0 0 0 - 0
0 0 0 0
d m d 0 N
0
vl O O
0 0 0 0 0 0 m oo P
0 W

Oregon Steel Mills Particulate Emissions
O.0OM 8.0
7.0
0.0030 6.0
L i o . o m :
2 kQ 2
v 0.0020 3 a 4.0
? z 0.0015 c; c; 3.0
0
2 j . O - - .- I
L i .- -
0.0010 2.0
o.noos 1.0
n.oonn 0.0 I . r S l h-9, I S P I i m 9 7 ,.rw l .r*Wl 1m-81 , .n-Pl l.rS
Year
-:- G n i n Lordinggridwr - G n i n Loading Avp. -e Psllirvlrtc lbmihr - Particulate Avelbmhr
Oregon Steel Mills Lead Emissions
OSMHISTY.WB1 Horizon Engineering 02/12/2001 14:11

Oregon Steel Mills Flow Rate
Oregon Steel Mills Carbon Monoxide Emissions
-:.- CO ppmv - CO ppmv Avg. -=- CO l b d h r - CO Avg lbdhr
OSiVlHISTY.WB1 Horizon Engineering 02112/2001 1 4 1 s .,. 743

- ...................
..................
....................
.................
............
..................
................
.................
..................
~
-tm
*
................
T .............
.............
.................
................
.................
..............
/- / -
. :
......................................
\ ............... ........................ ~
I.
......................
\- .........
......... 1 ........
i .........
i ...........
- ...................
n ...I I., L!
...............
............
..........
..................
..................
........ ~~ ......
..................
.....
.................
................... I
.................
................
.:: .................
.......
.......
-
i
...
m 0:
- 2 k
kl 1 1 . . .

4r . . . . . .
. .. >. , . . _ : I . " , I . . , . . . . . . /
n . I . .
: . . . : I i . . : . . . j / 1
. . .
~. .. .
. .
. .
!
:.,
_. _.
1
i'
. , . ,
. , . . . . .I : 1::: . ...
! I

PRODUCTION/PROCESS DATA Furnace Heat Logs
Baghouse Pressure Drop Field Data

' > Xelt E f f i c i e n c y 2 a t i n g : 0.00 T o t a l ,';L;.i : 39 .2
: 43 Avg. ZG : 6 ; . 2 , .,... Tap to Tap T i n e : $7 XUWTon : 280.0 7 o t a i D e i a y Tine : 9.6 Avg. ?wr. ,-acto(.- : 0 . 8 5 ; .:,";..:'.
. . Charge t o :a!> T i m . . . _ : .
' . .,&.'. .',',>, ., $;:'.~ : '.
LADLE A D D I T I O N S :

LADLE ADDITIOhS:

::
. . . ,


i , ...
i I
, . , ., . . . , .. ;. ,

0 F u r n a i e ;iae LSS :
$;at. Gas B a t c n : 236 3xygen Ba:c,i 0
Tao Te6.1 0

?!E:; Eff ic iency Rating : 0.90 T o t a l > , # ' , ,UT. : 37.9 Charge t o Tal3 Tine : 45 Avg. 72 : 60 .5
Totai Deiry Time : ;0.5 Avg. Pwr. ;ac:ol' : 0.85 Tap t o Tao T i n e : $7 K W / T o n : 270.7

m E W W E m E W
.- L
.-

__. ......... --.. ....... .... . -

CALIBRATION INFORMATION High -Volume Sampler Calibrations
Pitots Thermocouples and Indicators Shortridge Micro manometer
Barometer Filter Tare Weights
Nox Converter Efficiency Data Calibration Gas Certificates
Audit Sample Results, reporting forms and instructions

HVCALWBI
(cfm) Difkcrcn
1869 -1.7% 19.97 -1.1% 20.57 -0.2% 21.11 -04% >J,EJ V I % 24.31 1.7% 32.14 2.0% 32.14 1.0% 32.14 10% 39.33 -0.1% 39.88 0.7% 39.88 0.1% 43.79 -1.0% 4476 4 3 % 45.00 0.3% 48.W -1.0% 48.00 -1.W. 48.00 4 2 %
Cdculatd $4
Hlgh Volume Oriflee CdlbnHoo Data
Average Nal W w z w 2
I -2.04 4,1625 2.9447 -6.0075 2 -1.90 3.5991 3.0054 -5.7016 1 -1.83 13584 1.0259 -5.5453 4 -1.56 2.4356 1.1539 4.9222 5 -1.51 2 2926 1.1671 -4.7953 6 -1.47 2,1599 3.1745 -4.6655
8 -0.87 0.7526 3.4604 -1.0019 9 -0.87 07526 1.4606 -1.0021
10 -0.43 0.1856 1.6726 .US21 II -0.40 0,1604 1.6785 -1.4732 I 2 .0.40 0,1604 3.6848 -1.4757 I1 .0.20 0.0394 1.7897 -0.7521 14 -0. I 5 00227 38044 -0.5738 I 5 -0.14 0.0194 3.8040 -0.5298 16 0.00 O m 1.8817 O.oo00 17 0.00 o.oo00 1.8815 0 . m 18 0.00 0,ooOo 18731 0 . m
7 4 . 8 7 0.7526 1.4502 .2.9930
N O H W w Z wz 18 -14,64 20.8516 62.9132
I 8 -14.64 CI 6291 .l4.64 20.85 CZ -47.02
I -0.111 CI CI= 387111 0 8 . 9 5 1 ~ 2 I c2- 0.46230
In(QPln(Aj+B'ln(dHo)
Cl-ln(A)
I -081 CI A- 47,99561 l l C Z ( 8- 0462101
I C2-B
9 -0.87 0.7526 3.4016 - 2 . 9 m I O 4 .48 0.2285 3.5885 -1.71% I I -0.46 02135 3.S945 -1.6608 12 -0.45 0.1992 3.Mx12 -1.6067 13 -0.20 0.0394 3.7166 -0.7376 14 -0.20 0.0394 3.7214 4 .7389 I 5 -0.19 0.0347 1.7236 -0.6938 16 0.00 O.Do00 3.8178 O.oo00 17 0.W 0 . m 1.8099 0 . m I 8 0.00 , 0 . m 1.8097 O.oo00
I ] Z=ClrC2(w) P0i"l dHo 0 0
I 0 C I 387 0 l a 0 46
I 2 3 4 1 6 7 8 9 10 II 12 13 I 4 I 5 16 17 I8
Ol.00 48.00 80.10 16.55
(in H20)
0. I30 0.150 0.160 0.210 V 2-w 0 230 0.420 0.420 0.420 0.650 0.670 0.670 0.820 0 860
1.ooO 1.W 1.m
0.870
1717 0 C I 380 a87 I C 1 0.45
(elm) @To=68F
1901 20 19 2061 23 41 I l t l 23 91 31 51 11 81 31 84 19 36 19 59
44 24 14 90 44 88 48 50 4n 50 48 10
39 a4
Q1.W 44.90 *.IO 15.77
Point dHo 0 Q
2 3 4 1 6 7 8 9 10 II 12 11 I 4 I 5 16 17 18
(I" H20)
0 090 0 OW 0 220 0210 0210 0 420 0 420 0 420 0 620 0 630 0 640 0 820 0 820 0 830 loo0 IWI IWO
(cfm) (chn) D i l l e m @ T o d 8 F Calculated %
IS20 l5.03 -f.IH 1542 I 5 0 1 - 2 S H 2223 a s 7 1 %
2182 2209 I 2% > t u ) uw P ~ M
29.73 30.27 1.8% 29.87 30.27 ' 1.3% 30.01 30.27 0.9% 36.18 36.13 -0.1% 36.40 36.40 -0.0% 36.61 36.66 0.1% 41.13 41.03 -0.2% 41.41 41.03 -0.9% 41.41 41.25 4 .4% 4551 44.90 -1.3% 45.15 44.90 4.6% 45.14 4490 4.5% ,.
. . . i ., . . . . , . ..
21.7726 58.3029 -41.4577
.. ., . .... 58.30
i. .:;:;;! . . .: < , ,
CI- 3.80440 4.64 C2- 0,45418
1.43 A- 4489831 8- 0.45438 0.45

> z z 0 0 cn 0
3
a J
2 a z I-
$ F 8 z
2 a 6 Y
t
a a n
W I u)
I-
U W
U U W u. u)
U I-
8 n
3
4 4
Y
Y B
II L T
+
I- T I /

dpp dps Cp ds AvgCp S U l 4 1.290 1.970 o.mo11i o.00171 o.rn41 o w l a 2 Pu. 1.200 1.860 0,79119 0.WlU
9 N m 0.m 1.250 0.l9lW OWJ41 TIH 0 1 m 0580 om0111 omm
I.3W 1.200
0.180
I280 1.190 0.m 0.364
1.250 1.200 0.810 0.170
1.210 1.220 0.761 0.170
1.260 1.180 0.78J 0.375
I 2JO 1.160
0.370
I.ZW 0 690 0 581 0 170
1.250 1.160 0815 0 370
1.3W I IW 0 810 0.370
0.775
o a i o
dpp dpI CQ ds AVgCQ s 6-1 1.W 1.W 0.81890 0.W629 O.SUl9 0.W71J P.n 1.210 1.710 0.82991 OW419 m119m o.aio 1.190 o.m.78 O.WUI
DLR 0.170 0.120 o.aism o.oow0
u7.J Pu.
91ltMI DL.R
Ul-5 Pu.
9111,QI TIH
nl0-1 Pq.
9lMa TIH
U10-2 Pu.
91IMa DLR
UI0.I PIU
9 N m TJH
I* I PIU
9111m TJH
31-1 P.4
MIOMS wr
J3.I P...
911 Im TIH
5 4 Pu.
1 0 3 m kd,
Nola Nol calibrniid. w11 c.lobr.!r w h m nrrdcd WC 1.J I180 I 8 2 0 083024 OW912 082071 P u . I 2 w I 720 0 8 3 n a 001106 09/19100 onm I 2 5 0 0 8 1 6 1 1 O W 1 4
DLR 0346 0 5 M 082941 000 l7 l 1
1.920 1.750 1.1JO 0.J4J
2 . m I.8JO I.2M 0 590
1.930
1.200 0.560
1.W 1.850 1.180 0.JU)
t.9M 1.780 1.210 0.550
1.780 1.W 1.180 0.510
1.650 0 980 0 810 0.510
1.740 1.650 l.IJ0 0.JW
1.850 LJW 1.2W 0 520
1.120
079200 o m 1 7 a 7 n 8 3 o m m
04100 OW417 079403 OW617
077132 0014J1
H T ~
m m P...
TIH
079261 001101 UQW OWJJl 0803u O m D L l 081317 o m OW72 OW107
SR-I8 P... 09111m
TM
07w91 OWJM 0.W2I 0006JJ 0 8 W O m 8 J
011747 001226 0 79740 OW711
SR-M P m miiim
TM
082962 O m J J O.uO17 O m J 4 081751 OW259
084124 001307 082021 O W 9 9 4
10.. Pul m m 7 m
T M
1.240 1.110 0.770 0.160
1.240 1 . I JO
0.160
1.lM 1.110
o.no
o.aio O.IM
I.2M 1.140
0.160
l.220 1.120
0 160
1.3W 1.210
0 380
1.lW 1.240 0.8JO 0.390
I.3W 1.240 0 810 0 390
1.m 1.230 0.820 0.M
o.aio
o.aio
a.sw
0 84428 0 W694 0.U114 OW642 081071 O w 6 6 1 081114 O W 2 0 084324 OW590
I770 082861 IMO o n 4 0 1 I 140 oa1161 0510 013177
11-1 / PUS w119m
DLR
1.m 0.82169 1.710 o . a i i n 1.210 0.71975 0.540 0.80811
081910 o m 1 4 o m % o w 6 8 1 083W8 OW848
OIJ161 001M7 0 8 1 Y l OW514
1.m 0.81817
1.2JO 0.79694 0.550 0.SOWJ
1 . 7 ~ o.ai071
1 4 . ~ / Pu. miwm
DLR
1.750 0.826M 1.610 0.82572 1.210 o . a i m 0.540 o.80~11
081989 OW414 0.U401 OW741 0 84119 0 01376 082315 ooiwa 013JO9 OW106
I 850 os29a9 I750 0829911 I I80 OSMIO 0 540 083M8
( C I S P.U WII9IW
DLR
2 IW 077891 ZOO0 077951 I 3 8 0 077697 0610 0785l8
1850 082989 I820 081717 1200 08233J OJ60 081618
2 . W 079816 I 8 8 0 08Wl7
om 0 79177 I n o o w w
0.W412 0.mj0
O.OIOa8 0 . ~ 7 ~ 6
0.01378 O.Wl%
O.wo12
0.W1J9 O.Wl50 O.Oo(62 0 00547
0,01161 O.Wl97 0 w11 0.W579
O.WS94 0.wm5 0.W766 0.M931
O.OW7.7 0,m18 0w011 o.wo12
0.w122 0 -1 0w318 OWJOI
0wj75 0.W698 O . o w 8 0 0 00201
0 MI76 0.W115 0.01106 0.00816
o.oia16
HORIZON ENGINEERING

Pmbs
Pmbs Pmbs b b s Pmbs Pmba Pmba Pmbs Pmbs Pmbs Pmbs FS Pilot FS P b l
6 9 7-1 7-2 7-3 7 4 7-5 7-8 10.1 10.2 10.3 1 0 4 1 1 4 1 C S
@325 F 11.8 AIlaaMe oa. Ambhnl Bolllng. w.1.r Bolllng. 011 AWRg.
andsrd. F Measured. F Dficrcnca F SIandPrd. F MeasurW, F Oinarsncs F Standard. F Mssrulsd. F . Oiersnce F 0ifferO"W F I I I I I I
59 2 59 6 59 2 59 8 59 6 59,4 59.6 60 ,2 59.4 59,6 59 6
0.0 53.8 59.8 80.2 60.8 60.8
0.0 60 4 54.2 80 2 60 4 60,O 54.2 60.8 61.4 54.2 60.2 61.8 60.8 61.4 61 0 60 6
0.0 61 0 58 4 60.2
58.2 58.0 58.0 0.0
57.6 58.0 58.2 57.8 58.6 58.6 58.2 58.2 59.4 58.4 58.4 59.0 58.8 58.8 59.0 59.0 59.0 59.0 58.8 59.2 59.2 59.4 59.2 59.2 59.8 59.4 59.8 0.0
Y.0 59.6 80.0 60.2 61.2
0.0 60.2 54.0 60.0 60.4 60.0 54.2 60.0 60.8 54.0 80.0 81.0 60.6 81.2 60.8 60.4
0.0 60.2 58.2 60.0 80.2 60.2
-0.2 -0.6 -0.4 -0.6 4 4
0.0 -0.1 .1.0 0.2
-0.2 0.0 0.0 0.2
4 . 2 .0.2 4 4 0.4 0.0
.0.2 a 2 .0.2 0.0 0.0 0.0 -0.8 -0.6 .0.2 .0.2 -0.8 4 . 2 . a 2 -0.4 a 2 0.0
.0.8 -0.2
204.8 213.2 212.4 208.2 212.6 213.6
213 212.6 212.4 213 2
213 0
212.8 2134 212.6 2108 212.6
0 210.8 213.4 212.6 212.8 212.4 210.4 207.4 213.6
214 213.2 212.8
212 212.4 213 2
212 0
211.6 212.2 212.6
:::I -0.6
.1.0 -2.0 -1.4 -0.6 2 0 -3.0 .2.0 .2.0 -1.8 2 0 -2.0 0.0
-2.0 -2.6 .1.8 .t.o .1.8 0.0
-1.4 .2.6 .1.8 -2.0 -2.0 -0.8 2.0
.2.6 -5.0 -2.8 .2.0 .1.6 .1.6 -2.2 -1.2 0.0
-0.8 -1.6 .2.0 343.61 a 2 1 .1.0 3.4 I
177.6 210 2 207.4
0 208
210.6 179.4 209.6
203 205.6 203.6 203.6 203 8 206.4 201.4
211 204.2 211.2 208.8 201.8 203.6 211.2
211 207.6 210.6 210.8
21 1 210.6 210.6 211.2
211 0
210.8 210.8 210.8 209.8 210.8
0 209.4 210.8 210.8 210.8 210.4 209.8 209.4
21 1 209
210.4 210.8 210.4 210.8
211 210.8
0 210.8 210.8 210.8 210.4 210.6
340 1 337.8 336,4
0 , o 336.2 322.8 340 6 335.0 337.6 351.2 340.6 329.4 340.2 339.0 338.6 326.8 341.0 335.0 365.4 337.0 329.2 337.0 342.0 328,O 343 8 331.4 335,2 341.0 338.4 145,8 346.0
0.0 344.0 346.0 346.4 345 2 344.2
0.0 345.2 341.2 341.0 346 8 346.2 343.6 343.8 347.2 340.2 345.2 347.8 148.0 347.8 340.0 332.0
0.0 346 6 335.4 342.8 344.0
340.2 338.8 338.8
0.0 336.4 323.0 341.8 336.0 336.6 351.8 340.8 330.4 341.0 335.2 338.8 328.9 344.0 334.6 365.0 336.0 329.2 338.4 340.8 326.4 342.0 333.8 336.4 342.2 339.4 348.8 347.2
0.0 344.0 346.0 349.9 345.8 345.2
0.0 348.0 347.4 334.8 346 6 346.8 343.4 344.1 359.0 355.2 345.0 348.6 347.6 347.8 342.2 332.4
0.0 344.8 332.0
.0.1
.1.0 4 . 4 0.0
.0.2
.0.2 -1.2 .1.0 1 .O
-0.6 -0.2 .1.0 4 . 8 3.8
4 . 2 -2.1 4 .0 0.4 0.4 1.0 0.0
.i.4 1.2 1.6 1.6
-2.4 .1.2 -1.2 -1.0 -1.0 4 . 2 0.0
-0.8 0.0 4 . 2 4 .6 -1.0 0.0
4 .8 4.2 8.2 0.0
-0.6 0.2 4.1
-11.8 .15.0
0.2 -0.8 0.4 0.0
-2.2 -0.4 0.0 1.8
4.17 4.80 4.71 0.00
-4.00 4.20 4.80 4.80 4.20 4 .61 4.80 -1.11 -1.00 ::::I 4.07
.1j7
4.31 4.00 4.07 4.40 4.31 4.20 0.11
4.27 4.80 4 . 2 0 4.40 4.87 -1.07 -1.07 0.00
4.87 4 .91 -1.71 4.67 4.80 0.00
4.80 -1.00 1 . a
4.87 4.87 4.10 0.10
4.00 -9.71 4.0j -1.20 4 . 4 7 4.80 -1.60 9.60 0.00 0.07 0.61
I 0.01 211.2 208 I I 0.01 1
S u n d m Usad Fluke 5895570 1

4 5
7 a
a 10 9
1 2 3 4 5
1 2 1 1 3 4 5 1 2 3 4 5 1 1 3 4 5 1 1 3 4 5 1 1 3 4 5 1 1 3 4 5 1 2 3 4 5
1 2 3 4 5
1 2 3 4
a
a
122 0 1 1 7 , O 117.0 117.0 117,O 117.0 110.0 1190 1190 119.0 119.0 1190 119.0 119.0 1880 9a.o 101.0 102.0 990 90.0 97.0 97 0 an o 85.0 95.0 910
104.0 97.0
102.0 990 980
102.0 102.0 98.0 97.0 98.0 98.0 96.0
101.0 101.0 101.0 101.0 1 W.0 100.0 101.0 101.0 l00,O 1 w , o lM.O 106.0 105 0 102.0 103.0 99.0 97.0 960 97 0
97.0 96.0 95.0 93 0 37 0 37.0
an o
98 o
1m.o 1150 115.0 115.0 1150 115.0
1170 117.0 1170 116,O 1160 116.0 116.0 1160 990
102.0 100.2 1W 2 00.0 98.0 97.0
ioa.0
86.0 85.0 97 0 95.0
1M.O 98.0 90.0
103.0 98.0 98.0
101.0 102.0 97.0 980 97.0 97.0 97.0
101.0 lW.O 100.0 1W.O 1W.O 101.0 102.0 103 0 102.0 102.0 103.0 105.0 lM.0 1WO 102.0 99.0 99 0 96.0 96.0
1WO 940
940 92.0 35 0 Y.0
98 o
0.3
0.3 0.1
0.1 0.1 0.1 0.4
0.1
0.5 0.5 0.5 0.5
0.3
0.3
0.1 4.1 0.4
4.1 0.0 4.1 0.0 0.0 0.0 4.4 4.1 0.0
4.2 4.4 0.1 0.2 0.0 0 2 0.0 0.1 0.2 0.1 0.1 0.1 0.0 0.1 0.1 0.1 0.0 0.2 0.2 4.4 4.4 0.4 0.1 0.1 0.1 0.4 0.1 0.0 4.4 4.4 9.2 4.4 0 3 0.4 0.1 0.1 0.4 0.8
0.3
5100 5100 5100 510.0 510.0 5100 510.0 511 0 511 0 5110 510.0 5100 5100 510.0 5100 492 0 y)90 501.0 498.4 505.0 512.0 512.0 503 0 502.0 502.0 MB.0 522.0 516.0 505 0 502.0 501.0 498.0 498.0 502.0 497.0 496.0 497.0 497.0 497.0 501.0 sW.0 501.0 501.0 sW.0 510.0 511 0 511.0 511.0 511.0 505.0
505.0 507 0 497.0 497.0 497 0 497 0 497.0 498.0 497.0 499.0 491.0 490 0 256 0 255.0
51a.o
5100 5100 510.0 M 9 0 510.0 5100 510.0 511 0 510,O 511.0 510.0 5100 510.0 510,O 510.0 493.0 506.0 498.6 498.6 MB.0 513.0 5130 503 0 502.0 503.0 5080 522.0 517.0 y)90 M2,O 501.0 499.0 499.0 502.0 497.0 4% 0 497.0 497.0 497.0 sW.0 m . 0 ,m.o 501.0 5 w . O 512.0 513.0 513.0 513.0 513.0 507.0 520.0 5W.O 510.0 499 0 5W.O 502.0 5Q2.0 501.0 503.0 501 0 503 0 498 0 496 0 259.0 256.0
0.0 0.0 0.0 0.1 0.0 0.0 0.0 0.0 0.1 0.0 0.0 0.0 0.0 0.0 0.0
4.1 0.1
4.0 4.1 4.1 4.1 0.0 0.0
9.1 0.0 0.0
4.1 4.4 0.0 0.0 4.1 4.1 0.0 0.0 0.0 0.0 0.0 0.0 0.1 0.0 0.1 0.0 0.0 4.1 4.1 9.1 4 .2 4.2 4.1
0.3
4.1 4 . 4
4.1 4 . 3 4 . 5 0.5 4 . 4 4 .5 4 . 4 4.4 4.5 4.8 0.1 4.4
4 . 3
IOMO 1030 0 1030.0 1030.0 10300 1030.0 1040.0 103L.o 10290 1030.0
1026.0 1026.0 1026.0 1026.0 1012.0 1025.0 1009.0 1006.4 1003.0 1w3.0 1012.0 10110 1005.0 1006.0 986.0
1 m . o 1019.0 1010.0 1011.0 1011.0 1 m . o 1008.0 1010.0 1019.0
1019.0 1019.0 1019.0 1009.0 1 m . o 1m.o 1009.0 1 m . o 1 m . o lW1.0 1W1.0 lW1.0 lWl.0 997.0
1012.0 1W7.0 lW5.0 997 0
1003.0 986.0
966.0 966.0
io2a.o
ioia.0
986.0
986 o 985.0
io1a.o
3 a . o 10200
-9.0
10290 1029.0 1029.0 1029.0 1029.0 10290 1MO 0 1029.0 1029.0 1029.0 1026.0 1026.0 1026.0 1026.0 10260 10130 1024.0
1W7.8 1WJ.O 1W3.0 1012.0 1011.0 1W5.0 lW5.0 986.0
l m . o 1016.0 1010.0 1011.0 1011.0 1009.0 1009.0 1011.0
,
iw7.a
1o1a.o 1018.0 1oia.o ioia.0 1018.0 1008.0 1008.0 1 m . o 1009.0 1009.0 lwo.0 1 m . o lwo.0 1CCQ.O 1 m o 992.0
1007.0 1W3.0 lWl .0 993.0 999.0 990.0 989.0 969.0 988.0 987.0 988 o
10906 1021.0 546.0 549.0
0.1 0.1 0.1 0.1 0.1 0.1 0.0 0.1 0.0 0.1 0.0 0.0 0.0 0.0 0.0 4.1 0.1 0.1 4.1 0.0 0.0 0.0 0.0 0.0 0.1 0.0 0.0 0.1 0.0 0.0 0.0
-0.1 4.1 4.1 0.1 0.0 0.1 0.1 0.1 0.1 0.0 0.0 0.0 0.0 0.0 0.1 0.1 0.1 0.1 0.3 0.3 0.3
0.3 0.1
0.1
9.1 9 . 2 4 .2 4.1 4.1 4.1 4 . 7 4.1 0.0 0.0
0.14 0.14 0.14 0.17 0.14 0.14 0.12 0.14 0.15 0.14 0.17 0.17 0.17 0.17 0.12
4.12 0.10 0.11 4.11
4.09 0.03 0.w 0.w
4.M 0.00
4.07 0.16 0.03 0.W 4.03 0.00
4.02 0.M
0.08 0.08 0.W 0.03 0.00 0.09 0.06 0.w 4.13 4.10 0.16 4.16 0.16 0.11 0.10 0.01 0.11 0.011
4.01 4.34
0.17 4.24 0.01 0.31
0.14 0.00 0.M 0.00 o m
+.pa
4.13
0.06
4.16
.i.aa
84

13585 N.E. Whitaker Way Portlond. OR 97230 Phone (503)255-5050 Fax (503)255-0505 [email protected]
(5e.rihC f i ~ , M W O H ) On June 20, 2000, the Shortridge SR1 digital manometer was calibrated against a zero to three-inch incline manometer. The table below shows the results.
Incline Manometer 0.00 0.05 0.10 0.15 0.20 0.30 0.40 0.50 0.70 0.90 1.10 1.50 2.00 2.50 2.90
TJH
Shortridge 1 0.0000 0.0504 01075 0.1515 0.2030 0.3037 0.4030 0.5060 0.7040 0.9030 1.1010 1.500 1.948 2.501 2.895
Air Pollution Emission Testing Infrared Inspections Mechanical Engineering 85 - ~~ ~

13585 N.E. Whitaker Way Portland. OR 97230 Phone (503)255-5050 Fax (503)255-0505 [email protected]
IGvIGI do. M9bI01O On June 20, 2000, the Shortridge SR2 digital manometer was calibrated against a zero to three-inch incline manometer. The table below shows the results.
Incline Manometer 0.00 0.05 0.10 0.15 0.20 0.30 0.40 0.50 0.70 0.90 1.10 1 S O 2.00 3.00
Shortridge 2 0.0000 0.0450 01 047 0.1495 0.2049 0.3085 0.4145 0.5177 0.7107 0.9162 1.090 1.51 1 2.010 2.911
TJH
86 Air Pollution Emission Testing Infrared Inspections Mechanical Engineering

Magnehellc Calibrations
OK
"la
ok
OK
ou
OK
ou
ou
OK
ou
OK
ou
OK
OK
ou
OK
OK
Na
ok
OK
OK
OK
OK
OK
OK
OK
OK
OK
ou
OK
ou
OK
1
1
1
1
1
1
1
1
1
2
2
2
2
2
3
a
O w 0 0.m 0.m 0.8.0
O m O M 0 O w 0 O w 0
O W 0.130 0.440 0 820
0.W 0 2 2 0 O W 0.740
0.m 0.190 0.480 0 . W
0.W 0.600 0.W 1 .m 0.mO 0~9m 0.670 0.300
0 .m 0210 0.m 0.m
0.W 0.120 0.510 0.910
0.m 0.W 0 450 !.em 0.m OSOD 0.870 1 . a
O W o..w 0.720 1x0 0 .W 0.450 1.050 t.7c.3
0.m 0.350 0 750 1750
O W 0 550 I . % 2980
0.oM OX.2 1 % 2.m
O w 0 O W 0 590 0 9 c
O W O m O w 0 O w 0
O w 0 0 140 0 440 0 e40
O w 0 0 240 0470 0 7 W
O w 0 0 190 0 460 0 790
O w 0 0 590 0 8 W 1 020
O w 0 0 950 0 870 0290
O W 0 220 0 YO 0 780
O O W 0 120 0510 0 980
O w 0 0 850 0 450 16W
O W O W 0 810 1 4w
0 ow 0 4C0 0 720 IMO
O w 0 0 470 IW 16M1
O w 0 0 350 0 740 I 800
0 ow 0 550 1 500 1wO
O w 0 Oyxl I 5 3 0 2 510
0 . m 0.m
4.010 0 . m
0 , m 0 . m 0.W 0 . m
0 . m 0.010 0 . W 0.020
0.020
0.010 0.om
0.m 0 . w
4.0%
0.m 4.010 0 .W
0.020
o.om
o.om 0.m 0 . m 0 . w
n.oto
0 . m 0.010 O.OI0 n.om
0 . m O m 0 0,mO 0.010
0.W 0 . W 0 . m O m
0.W 0 020 O W 0 . W
O M 0 O w 0 O M 0 0 . w
O W 0.020
-0.010
O m O m 0
.O.OIO 0.050
O w 0 O M 0 O W 0 020
o w 0.W 0030 0.010
-0.050
0 O'b 0 0% I 7% 00% Q.4X
0 0% ERR EPR ERR ERR
-4.3%
0 0% -1.7% 0 0%
0.0%
0.0%
.I 5% 2.9%
0 09 0 0%
0 3":s 0.0nb 0.0% 0.0% 0.0%
0 O!b .d 2"A %$'b 93:$ -1,OU
Horlzon Englnaerlng 603/255-6050 Fax S03/2664606
13585 N.E. Whitoker Way Portland. OR 97230 Phone (503)2555050 Fox (503)255-0505 [email protected]
October 27, 2000 Horizon Engineering shop Barometer Calibration
The Barometric pressure reported at Portland Troutdale airport was 29.83" Hg and was corrected to the altitude of the Horizon Engineering shop. The barometer reading in Nlll was 29.89"Hg. The barometer reading in TVll was 29.61" Hg. The barometer reading in TVI was 29.92" Hg. All pressures are absolute read at the horizon engineering shop.
DLR


NOx Converter Efficiency Data
60.7 1457 60.7 1458 60.7 1459 60.7 15:OO 60.7 1501 60.7 1502 60.7 15:03 60.7 15:04 60.7 1505 60.7 15:06 60.7 15:07 60.7 15:08 60.7 1509 60.7 1530
60.67 1511 60.67 15:12 60.64 15:13 60.66 15:14 60.5 1515
60.54 15:16 60.5 1517 60.5 15:18 60.5 15:19 60.5 15:20 60.5 1521 60.5 15:22 60.5 15:23 60.5 15:24 60.5 1525 60.5 15:26
__....____....-..___.-.-.----- I i ' 1 - NOx Converter Efficiency Test]
Percent Loss= 0.329
PASS
cy1 # €PA Value Conc.
32 182.5 ppm 25 91.3 PPm R4 0 ppm
Horlzon Engineering (503) 255-5050 90
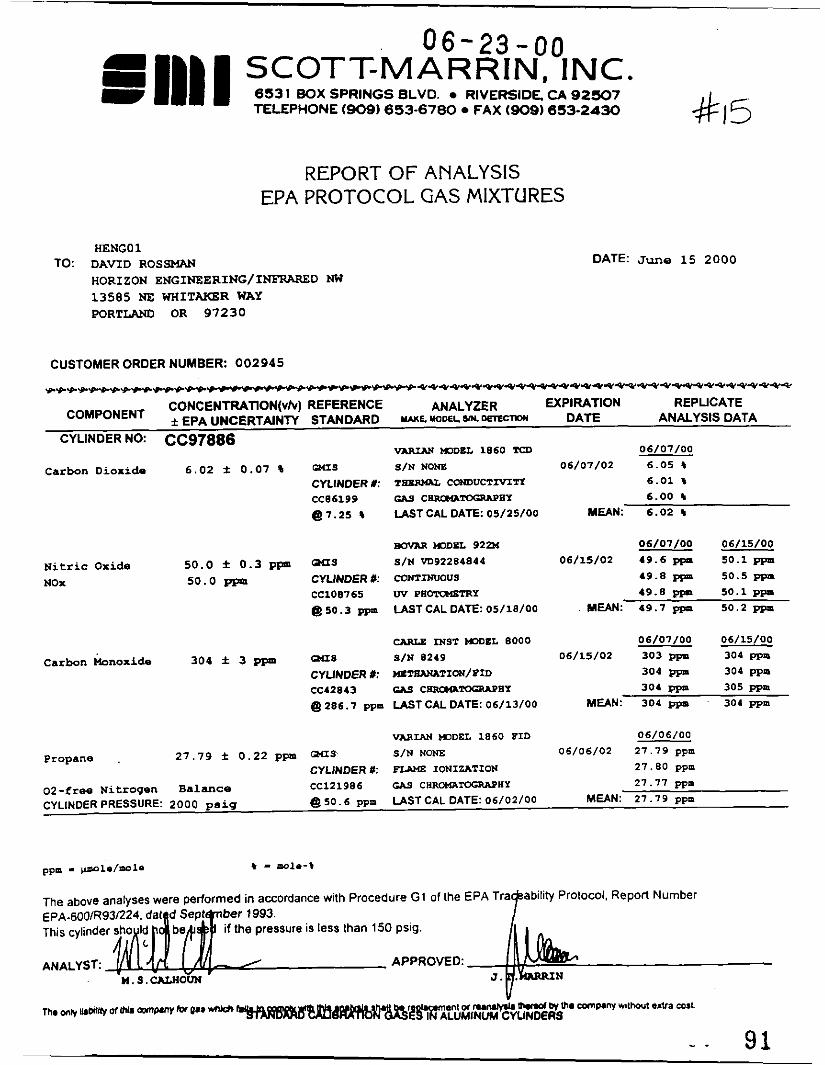
06-23 -00 SCOTT-M A R RIN, INC . 653 1 BOX SPRINGS BLVD. RIVERSIDE CA 92507 TELEPHONE (909) 653-6780 FAX (909) 653-2430
I 1)1 I REPORT OF ANALYSIS
EPA PROTOCOL GAS MIXTURES
HENGOl TO: DAVID ROSSMAN
HORIZON ENGINEERING/INFRARED NW 13585 NE WHITAKER WAY WRTLAND OR 97230
DATE: June 15 2000
CUSTOMER ORDER NUMBER 002945
p . p p I p * p p 9 . 9 - y p p - ~ ~ - ~ ~ ~ 4 ~ 4 ~ ~ 4 ~ ~ ~ ~ ~ 4 ~ ~ ~ ~ ~ ~ ~ ~ ~ 4 4 ~ ~ ~ ~ ~
CONCENTRATlON(vIV) REFERENCE ANALYZER EXPIRATION REPLICATE
f EPA UNCERTAINTY STANDARD W C Y O o E L Y I 1 . w ANALYSIS DATA DATE CYLINDER N O CC97886
06/01/00 VARIAN KlDEL 1860 TCU S / N NONE 06/01/02 6.05 4
CYLINDER N: TaErUsaL C O N D U C T M T X 6 .01 4
CC06199 c19 c-TcGRAPBT 6 . 0 0 4
Q 1.25 8 LAST CAL DATE: 05/25/00 MEAN: 6.02 4
Carbon Dioxide 6 . 0 2 f 0 . 0 1 % QlIs
N i t r i c Oxide NOX
BOVAR HDDDL 92211 06/01/00 06/15/00 S / N M92204844 06/15/02 49.6 pp 50.1 ppm 5 0 . 0 f 0.3 p p W s
5 0 . 0 p€a CYLINDER #: c o N T n a ~ 0 U S 49.8 pp 50.5 ppm CC108165 W PE-TRY 49.8 pB 50.1 ppm @ 50.3 ppm LAST CAL DATE 05/18/00 MEAN: 69 .1 p p 50.2 ppm
CARLE MST -EL 8000 06/01/00 06/15/00 S I N 0249 06/15/02 303 ppp 304 ppm
CYLINDER #: UZTIUNATION/PID 304 ppm 304 ppm CC42843 c19 CBRQQTO(;RIpBY 304 ppm 305 ppm @286.7 ppm LASTCALDATE:06/13/00 MEAN: 304 p p 304 ppe
Carbon k n o x i d s 304 f 3 ppm
VARIAN KlDEL 1860 BID 0 6 / 0 6 / 0 0
06/06/02 21.19 ppm 21 .79 f 0 . 2 2 ppm QlIS S I N NONE Propane . CYLINDER 1): F U M E I O N I ~ T I O N 21.80 DDm _. CC121986 G U CHROX%ToGRRpHP 21.11 ppm 02-free Nitrogen Balance
CYLINDER PRESSURE Z O O 0 p s i g 50.6 ppm LAST CAL DATE: 06/02/00 MEAN: 21.19 ppm
The above analyses were performed in accordance with Procedure G1 of Ihe EPA Tr
if the pressure is less than 150 psig
APPROVED: n. s . C N J i O v N
ma IWW ol mnpm~ 9- snt o( nmUW m*.oc Q UIa m p . n y mvloul e N a as1 I ALUMrNUM CWNDERS

SCOTT- M A RR I N, INC. y&32 653 I BOX SPRINGS BLVD. RIVERSIDE. CA 92507 w a 111 I TELEPHONE (909) 653-6780 FAX (909) 653-2430
REPORT OF ANALYSIS EPA PROTOCOL GAS MIXTURES
HENGOl TO: DAVID ROSSMAN
HORIZON ENGINEERING/INFRARED NW 13585 NE WHITAKER WAY PORTLAM), OR 97230
DATE: September 5 2000
CONCENTRATION(vhr) REFERENCE ANALYZER EXPIRATION REPLICATE f EPA UNCERTAINTY STANDARD w+ YODEL.^. o m c m N DATE ANALYSIS DATA
CYLINDER NO: CC185Q VARIAN m n E L 1860 TCD 0 8 / 2 3 / 0 0
- -
Carbon Dioxide 12.52 f 0.05 % M S S/N NONE 08/23/02 1 2 . 5 1 %
CYLINDER I: TasRHU CONDUCTMTY 1 2 . 5 3 %
CC122859 W CHRcERx*;IwW 1 2 . 5 1 t @ 17 .93% LAST CAL DATE: 08/21/00 MEAN: 1 2 . 5 2
eovAR -5 922U 08/16/00 08/23/00 Nitric Oxide 90.3 f 1.1 ppm mus S / N M 9 2 2 8 4 8 4 4 08/23/02 9 0 . 5 ppm 8 9 . 7 ppm NOx 9 0 . 3 m a n CYLINDER #: CONTINUOUS 9 0 . 1 p p m 90 .8 ppm
CA01327 w m-mr 90 .0 p p m 90 .6 ppm
@ 9 8 . 6 ppm LAST CAL DATE: 08/16/00 MEAN: 90 .2 ppm 90.4 p p m
CNlLE INST KKlgl 8000 08/17/00 08/30/00
Carbon Monoxide 508 f 5 ppm QLIS S / N 8249 0 8 / 3 0 / 0 2 507 ppm 506 p p m
CYLINDER #: UET"ATION/FID 507 ppm 508 ppm
@ 539 ppm LAST CAL DATE: 08/15/00 MEAN: 507 p p m 508 ppm
VARIAN m 0 E L 1860 FID 09/05/00
Propane 49.5 f 0.5 ppm C M I S S/N NONE 09/05/02 4 9 . 2 ppm
CYLINDER X: - I O N I W T I O N 4 9 . 7 ppm
Nltrogen.OZ-free Balance CC121986 W CHROERTOCPAPH'I 4 9 . 6 ppm @ 5 0 . 6 ppm LAST CAL DATE: 09/05/00 MEAN: 4 9 . 5 ppm CYLINDER PRESSURE: 2000 psig
CC278 CAS C H R Q R M C R I P H Y 508 ppm 509 ppm
ppm - pols/mde * - mole-*
The above analyses were performed in accordance with Procedure G1 of the E
sure is less than 150 psig.
\ " J.T.bfARRIN H . S . & d
92

SCOTT-MARRIN, INC. 653 1 BOX SPRINGS BLVD. RIVERSIDE. CA 92507 TELEPHONE ( 9 0 9 ) 653-6700 FAX (909) 653-2430
c = 111 I 2 >-- r t ' J i.'?
+ / d </. REPORT OF ANALYSIS
EPA PROTOCOL GAS MIXTURES
HENGOl TO:. DAVID ROSSMAN
HORIZON ENG'G/INFRARED NW 13585 NE WHITAKER WAY PORTLAM) OR 97230
DATE: September 21 2000
CUSTOMER ORDER NUMBER: 003073
I p ~ ~ ~ P ~ P I p ' p ' p I p I ~ ' p ~ ' p ~ ~ ~ ~ I ~ ~ ~ I ~ ~ ~ ~ ~ ~ ~ ~ ~ ~ ~ ~ ~ ~ ~ ~ ~ ~ ~ ~ ~ ~ ~ ~ ~ ~ ~ ~ ~ ~ ~ ~ ~ ~
ANALYZER EXPIRATION REPLICATE CONCENTRATION(vIv) REFERENCE DATE ANALYSIS DATA f EPA UNCERTAINTY STANDARD WE. YODELSW. DETECTION
CYLINDER N O CC53889 VIWH -EL 1860 TCD 09/21/00
Carbon Dioxide 21.86 f 0 . 0 6 % Q I I S S/N NONE 09/21/02 21.84 * CYLINDER X: TH- C O M l U C T I V I T I 21.84 CC122859 C U CBR[MTOCIWHY 21.89 @ 17.93 t LAST CAL DATE: 09/21/00 MEAN: 21.86 4
BdvAR HODEL 9224 09/13/00 09/20/00
Nitric Oxide 183.0 i 1.1 ppm M S S/N VD92284844 09/20/02 183.1 p p m 182.7 ppp NOx 183.0 ppm CYLINDER Y: CONTXMJOUS 183.4 p p m 182.9 p p m
CC72078 W PHOTOHETRY 182.7 p p m 183.2 ppm @ 258.5 p p m LAST CAL DATE: 09/13/00 MEAN: 183.1 p p m 182.9 ppm
CARLg INST HODEL 8000 09/06/00 09/21/00
Carbon Monoxide 898 f 9 ppm Q U S S/N 8249 09/21/02 897 p p m 900 ppp
CYLINDER Y: HgT"ATION/FID 899 ppm 899 Ppn
@ 1106 p p m LASTCAL DATE: 09/20/00 MEAN: 897 ppm 899 p p m CC108729 CAS CHRa&4mRLPHI 896 ppm 899 p p m
VAiUAN MODEL 1860 F I D 09/01/00
Propane 86 .5 f 0 . 9 p p m Q a S S/N NONE 09/07/02 86.9 ppm
CYLINDER #: FLmz IONIZATION 86.6 ppm
02-free Nitrogen Balance C C 5 1 2 6 1 GAS CHROPUTOCRAPHY 86.1 ppm
CYLINDER PRESSURE: 2000 psig @ 104.1 ppm LAST CAL DATE: 09/05/00 MEAN: 8 6 . 5 ppm
ppm - pmole/molo t - mole-) The above analyses were performed in accordance with Procedure G1 of the €PA Traceability PrOtOCOl. Report Number EPA-600/R93/224, daled Seplember 1993.

TO:
SCOTT-MARRIN, INC. 653 1 B O X SPRINGS ELVD. RIVERSIDE, CA 92507 TELEPHONE (909) 653-6780 FAX (909) 653-2430 - - = 111 I
- 7 - - 7
-' p __ 40 2
-PORT OF ANALYSIS EPA PROTOCOL GAS M I X T U R E S
AENG0l D A V I D ROSSUAN HORIZON ENGINEERING/
13585 NE WHITAKER WAY PORTLAND, OR 97230-
INFRARED NW
DATE : 09/28/00
p p = umole/mole 0 = mole-% The a b o v e a n a l y s e s w e r e pe r fo rmed i n a c c o r d a n c e w i t h P r o c e d u r e G1 o f t h e EPA T r a c e a b i l i t y P r o t o c o l , R e p o r t N u m b e r EPA-600/R97/121, d a t e d S e p t
p r e s s u r e i s han 150 p a i g .
Approved :
J .T. Harrln
Analyst : ------- H.S. Calhoun

E#&/52 dZ%!GJ.
/a3 7 Wy/: 64. JF&3Pi/3 1
f iU*E Certificate of Analvsis: E.P.A. Protocol Gas Mixture Customer: Airgas W e d Cylinder No : cc44545 Cylinder Pressure. 2000 Certification Date 1111199
Reference Standard Information:
rn Component GMlS Sulfur Dioxide
Instrumentation:
lnstrurnenVModellSerial No. SeimendUltramat 5E
P.O. 700794lBYRNE Order No. 538395-00 Expiration Date: 511100 Laboratory: LOS ANGELES
Cvl. Number CC38281
Analvtical Princiole NDlR
Concent ra t ion 51.1 PPM
Analytical Methodology does not require correction for analytical interferences.
Certified Concentrations:
Analytical Results:
. . .. . . 1st Component:
1s1 Analysis Dale 10/25199 R gama s sa aoo 2 OOM) Corn 26 489 PPM S ~ o a o o z 0 wo R 9aW Canc 26 489 PPM
26 489 PPM z occa R 98 000 S M 8W conc m 489 PPM
AVG
2nd Analysis Dale. 11/1/99 R 98.500 s 5 o . a ~ ~ Z 0.000 canc 26.354 PPM
26.354 PPM s 50.300 2 a.mo R 9a.Mo Canc Z 0.COO R 98,500 s %.am Canc 26.354 PPM
26.354 PPM AVG:
Certification performed in accordance with “€PA Traceabilrty Protocol (Sept. 1997)” using the assay procedures listed.
Do not use cylinder below 150 psig.
. Approved for Release\

Aimas. ~ S p a s l a l t y Gases RI4 t l n l s ~-9,- L O 1 hWle¶ CI 90059 21m I1231 3.57 6891 FAX (323) 5 6 7 . u
Certificate of Analvsis: E.P.A. Protocol Gas Mixture Customer Airaas Pacific P O 94987 - Cylinder No : CC66028 Order No. 895310-00 Cylinder Pressure: 1900 Expiration Date: 1/22/01 Certification Date 7/22/00 Laboratory: LOS ANGELES
Reference Standard Information:
WE Component Cvl. Number Concentration GMlS Sulfur Dioxide CC49561 50.6 PPM
Instrumentation:
Instrument/ ModeVSerial No. SiemendUltramat 5E
Analvtical PrinciDle NDlR
Analytical Methodology does not require correction for analytical interferences
Certified Concentrations:
Analvtical Results:
1st Component: ... .
1st Analysis Date: 711 5100 R 97.500 s 18.100 z 0.wO COm 9.393 PPM S 18.100 z O.Oo0 R 9 7 . w Canc 9.393 PPM z 0.WC R 97.500 s 18.100 COm 9.393 PPM
AVC: '3.393 PPM
- -
2nd Analysis Dale 7122100 R 97500 S 18 100 z OOOO Conc 9 393 PPM S 18100 z 0 000 R 97 500 Conc 9 393 PPM z 0000 R 97 500 s 18 1w Canc 9 393 PPM
AVG 9 393 PPM
Ceriification performed in accordance with "€PA Traceability Protocol (Sept 1997)" using the assay procedures listed.
Do not use cylinder below 150 psig Approved for Release
Page 1

i i
kolar Cryogenics! Inc,
I
I I
I
1 Specialty Gas W Cryogenics Bulk Gases Liquid Helium 1
L # 31 ccc Date
Shipping Address 2734 SE Raymond m Portland Oregon 97202 97 PO Box 82039 rn Portland, Oregon 97282 1503) 239-5252 (800) 426-0689 a Fax (5031 236-0486
Cerrijicate of Analysk A3
Customer: Horizon Engineering Product: Air Grade: Ultra Zero Cylinder Number: cc101218 Lot Number: E3101302
5-3 1-2000
Purity Analysis
Actual ComDonent Soecification Concentration Analvtical Method
Air Ultra Zero grade Ultra Zero grade
H20 < 2.0 ppm 1 6 PPm Meeko Aquamatic THC < O 1 ppm 001 ppm Varian GUMS co < 1.0 ppm 0 2 3 ppm Varian GCMS c 0 2 < 1 0 p p m 0 12 ppm Varian GC&@ NO < O 1 pprn <O 1 ppm Varian GUMS
Oxygen <21% 20 7% GC-TCD
I certify the above referenced cylinder was analyzed and found to contain the listed concentrations,
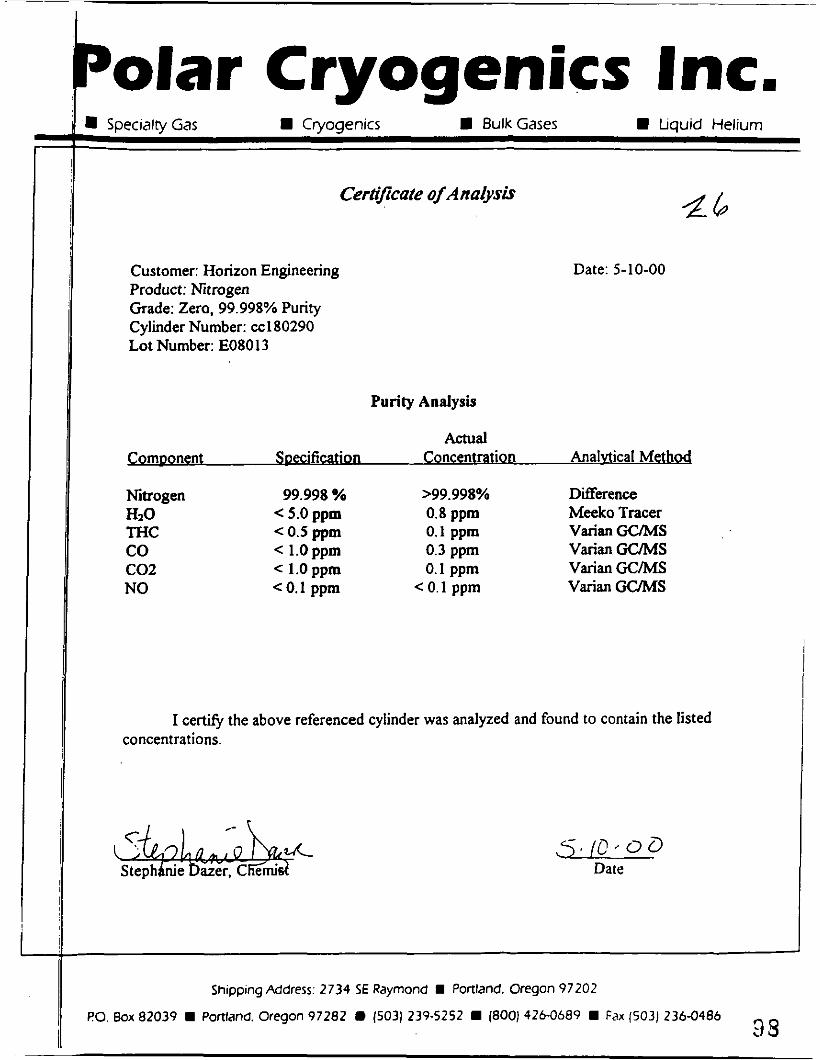
Polar Cryogenics Inc. Specialty Gas W Cryogenics Bulk Gases W Lquid Helium
Customer: Horizon Engineering Product: Nitrogen Grade: Zero, 99.998% Purity Cylinder Number: cc180290 Lot Number: E08013
Date: 5-10-00
Purity Analysis
Actual Cornoonent Soecification Concentrat ion Analvtical Method
Nitrogen 99.998 yo >99.998% Difference HzO 5.0 ppm 0.8 ppm Meek0 Tracer THC < 0.5 ppm 0.1 ppm varian GUMS co < 1.0 pprn 0.3 ppm varian GUMS c02 < 1.0 ppm 0.1 ppm varian GCMS NO < 0.1 ppm < 0.1 ppm varian m s
I certifi the above referenced cylinder was analyzed and found to contain the listed concentrations.
Shipping Address: 2734 SE Raymond m Portland. Oregon 97202
PO. Box 82039 Portland. Oregon 97282 (503) 239-5252 (800) 426-0689 Fax (503) 2364486 08 L

0 1 - 2 2 - 0 1 ANTECH Analysis/Technology
Mr David Rossman HORIZON ENGINEERING 13585 NE Whitaker Portland OR 97220
Jaunuary 15, 2001 Job# 0036402-04
Identification: OR-DEQ Received: 12/30/00 (Horizon # ?)
Samde # 36402 36403 36404 Identification AMMI-1 13 AML2-124 FMH1-101
Aaueous nitric Acid solution: Volume (mls) 1 1 .O 10.9 Residue (9) 0.0023 0.0002
Filters:
Number: Residue (8)
FMHI-1 O I 0.6087* *avg-no tare
Weight available
Respectfully submitted: ANTECH &+ Diana Tracy, preside
501 N.E. THOMPSON MILL ROAD COREElT OREGON 97019 503/695-2135 FAX 503695.21 39 99

. . . . . . . . . . . . . . . . . . . . . . . . . . . . . . . . . . . . . . ....., .................. ...........................
iate/tiine ,weighed

ANTECH SAMPLE DATA: EPA RESIDUES (page 3)
FLTERS: Sample # 3 b 4 0 ' I Samp1eIDWI- I 1 - 1 0 1 Dateltime I +a9 9 14 In dessicator
GWtl(g) .b106 1-a q @ GWt2(g) . LO93 1-3 9 A GWt3(g) b D t V I-'f 81e GWt4(g) , mr. 1-5 7 w
Datehime Datehime Datehime
Average - LO 8 7 Tare (g) =it Net (g) ........................................................................................... FLTERS Sample # Sample lD Datdtime In dessicator
Datehime Datekime Datejtime G W t W GWQ(g) GWfl(g) GWt4(g)
Average
Tare (g) Net (9) ........................................................................................... QC DATA: Datehime Balance calibrated ("1s cert wts)
Date/t I me * % Templternp
Relative humidity (YO)
I - 3 v
1-3- 1-7 I- cF= L-
L
rl? 7 o/s 7 47
101

ESLJob: 0101063 RunBatch: lCP-010122C Prep Batch: 2273
Case Narrative
January 25,2001
The two Lead Spiked Aqueous Solution samples numbered 0036402 and 0036403 were brought in two 400ml beakers. The aqueous samples were evaporated off and only the residue was left in the beakers, The Audit directions for these samples requested 1 :2 and 1 :5 time dilutions rcspectively. Since the samples had gone dry, I brought them up to a volume of IO ml of dilute Nitric Acid (as per the approximate initial volume) and then proceeded to perform the requested dilutions prior to running.
Please do not hesitatc LO call if there are any questions, or if we can be of funher assistance in this projsct. Thank you.
Leslie Crow, Chemist

Environmental Services Laboratory Date: Zli-Jan-Ot ~- ~.
~~ ~ ~- ~~~~~~ ~ _ _ _ _ __
CLIENT: Horizon Engineering Client Sample ID: FMHI-101 (Filter) Lab Order: 010 IO63 Tag Number:
Project: OSM- I536 Collection Date: 111 1/01
Lab ID: 010 1063- I I A Matrix: SOLID
Analyses Result Limit Qual Units DF Date Analyzed
ICP METALS EPA 60108 Analyst: Imc Lead 947 1 .oo ug 1 1R2/01
- .- - Qudincrs: ND - Not Detected at the Reponing Limil
J - Analytc dctectcd below quantilalion h i l l
B - Analytc dctcctcd in the associated Method Blank
-Value exceeds Maximum Contaminant Level
S -Spike Rccovcry outside accepted rccovcly limits
R - RPD outrlde acccptcd recovery h i l l
E -Value above quanrilalion rangc
11 O j l l
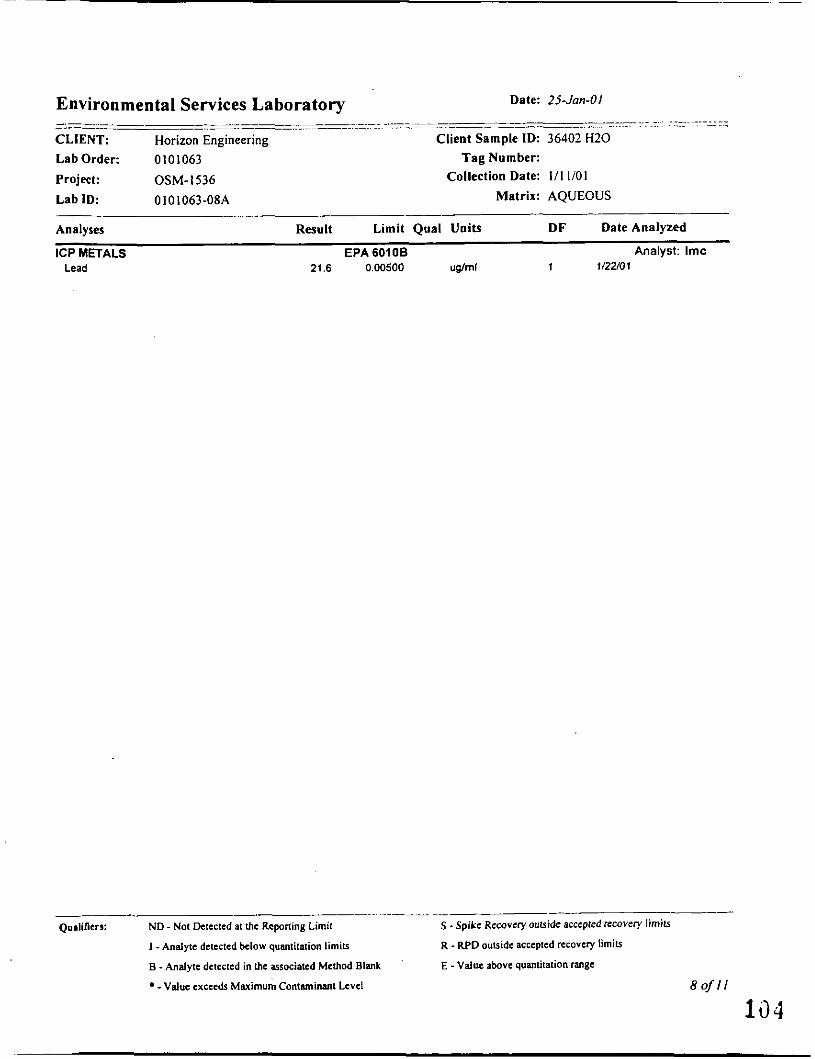
Environmental Services Laboratory Date: 25-Jan-01
CLIENT: Horizon Engineering Client Sample ID: 36402 H20 Lab Order: 0101063 T a g Number:
Project: OSM-1536 Lab ID: 0 IO 1063-08A Matrix: AQUEOUS
~~ . . -- ~ ~ .... ~~
Collection Date: 111 1/01
Analyses Result Limit Qual Units DF Date Analyzed
ICP METALS EPA 60108 Analyst: Imc Lead 21.6 0.00500 uglml 1 1/22/01
-__- ~ _ _ ~
Qurlifiers: ND - Not Detected 81 lhc Reponing Limit
I - Analytc detected below quantilation limits
B - Analyte dctcctcd in lhc associated Method Blank
~ Value cxcccds Maximum C o n t m i m t Level
s .Spike Recovery outside accepted recovery limits
R . RPD outside accepted recovery limits
E - Valuc above quantilation range
S o f l l

Environmental Services Laboratory Date: 2s-Jan-01 __ -. -.__ - -~
CLIENT Horizon Engineering Client Sample ID: 36403 H 2 0 Lab Order: 0101063 Tag Number:
Project: OSM-1536 Lab ID: 0101063-09A Matrix: AQUEOUS
Analyses Result Limit Qual Units DF Date Analyzed
ICP METALS EPA 60106 Analyst: Irnc
Collection Date: 111 1/01
Lead 0.290 0.00500 uglml 1 1/22/01
Qualifiers: ND -Not Dcicctcd at the Reponing Limit S -Spike Recovery ouuidc accepted recovery limits
J - Analyte dctccted below quanrilation limits
B . Analytc detectcd in h e associated Method Blank
-Value excccd?l Maximum Conlaminant Level
R - RPD outside accepted tccovcry limits
E - Value above quanlilation range

c 1.13
!
~
i ! !
I 1
I
!
I !
I i 1

Method 12 Compliance Audit Material (Lead Spiked Aqueous Solution)
REPORTING FORM; To be completed by laboratory
Request Number/Sample Number: M12 ~ 0020 - 01 / AMMl - 113
Concentration Level: Medium
Date Issued: 12/06/00
Auditee:
Company:
Address:
Attention of:
Requestor:
Agency:
Address:
Attention of:
Project Name:
Horizon Engineering, LLC
13585 NE Whitaker Way, Portland, OR, 97230
Michelle Kinney Phone: (503) 255-5050
OR - DEQ
2020 SW 4th Street, Suite 400, Portland, OR, 97201
Jack Herbert Phone: (503) 229-5579
OR Steel Mills
Audit Results (Results In )rg/rnL)
Compound Result
Lead
107

Method 12 Compliance Audit Material (Lead Spiked Aqueous Solution)
REPORTING FOR&. To be completed by laboratory
Request Number/Sample Number: M I 2 - 0020 - 02 / AML2 - 124
Concentration Level: Low
Auditee:
Company: Horizon Engineering, LLC
Address:
Attention of:
Date Issued: 12/06/00
13585 NE Whitaker Way, Portland. OR. 97230
Michelle Kinney Phone: (503) 255-5050
Requestor:
Agency: OR - DEQ
Address: 2020 SW 4th Street, Suite 400. Portland, OR, 97201
Attention of: Jack Herbert Phone: (503) 229-5579
Project Name: OR Steel Mills
Audit Results (Results in pglmL)
Compound Result
Lead

Method 12 Compliance Audit Material (Lead Spiked Filter)
Request Number/Sample Number: M12 - 0017 - 01 / FMHl - 101 Date Issued: 12/06/00
Concentration Level: High1
Auditee:
Company: Horizon Engineering, LLC
Address:
Attention of: Michelle Kinney Phone: (503) 255-5050
13585 NE Whitaker Way, Portland, OR, 97230
Requestor:
Agency: OR - DEQ
Address:
Attention of: Jack Herbert Phone: (503) 229-5579
Project Name: OR Steel Mllls
2020 SW 4th Street. Suite 400, Portland. OR, 97201
Audit Results (Results in pg)
Compound
Lead
Result
447

3. The EPA Emission Measurement Center has sent lead audit samples to Horizon Engineering. Send the lead audit samples with the field samples to your two laboratories for side-by-side processing. The laboratory thal measures particulate samples must accurately report each audit-solution vdume. The audit is of the lead concentration. The volumes are about 10 mL -- about five 9'
I. I /-
percent of field-rinse volumes. Total lead may also be much smaller.
JHH
c: Greg Grunow:NWR
,...:jack Herbert ,,-' Source Testing Coordinator
13.0 ~

QUALITY ASSURANCE AND QUALITY CONTROL DOCUMENTATION

Quality Assurance/Quality Control Page 1
Introduction Protection Agency (EPA) test methods are followed, including procedures, equipment specifications, calibrations, sample extraction and handling, calculations, and performance tolerances. Many of the checks performed have been cited in the Sampling section of the report text. The results of those checks are on the applicable field data sheets in the Appendix.
The QA procedures outlined in the U. S. Environmental
Continuous Analyzer Methods analyzers according to the test method requirements, and Horizon's additional specifications. On site quality control procedures include:
calibrations with EPA Protocol 1 gases or NlST traceable gases pre-test zero and span checks and linearity test bias checks (introducing calibration gas as near to the probe tip as
calibration error (linearity) checks if any analyzer adjustments are made leak checks on the gas sampling system correction of problems that show up as the results of checks strip chart recordings for backup to the electronic data acquisition
Field crews operate the continuous
possible)
system
Manual Equipment QC Procedures include pre- and post-test leak checks on trains and pitot systems. If pre-test checks indicate problems, the system is fixed and rechecked before starting testing. If post-test leak checks are not acceptable, the test run is voided and the run is repeated. Thermocouples and readouts are verified in the field to read ambient prior to the start of any heating or cooling devices. Nozzles are checked for nicks or dents and are measured on three diameters twice each year.
On site quality control procedures
Sample Handling Samples taken during testing are handled to prevent contamination from other runs and ambient conditions. Sample containers are glass, TeflonTM, or polystyrene (filter petri dishes) and are pre-cleaned by the laboratory and in the Horizon Engineering shop. Sample levels are marked on containers and are verified by the laboratory. All particulate sample containers are kept upright and are delivered to the laboratory by Horizon personnel.
HORIZON ENGINEERING ******* **.e.*.

Quality Assurance/Quality Control Page 2
Data Processing data entry and calculations are correct, Results include corrections for field blanks and analyzer drift. Any abnormal values are verified with testing personnel and the laboratory, if necessary.
Personnel performing data processing double-check that
After results are obtained, the data processing supervisor validates the data with the following actions:
verify data entry check for variability within replicate runs account for variability that is not within performance goals (check the
verify field quality checks method, testing, and operation of the plant)
Equipment Calibrations Periodic calibrations are performed on each piece of measurement equipment according to manufacturers’ specifications and applicable test method requirements. The Oregon Department of Environmental Quality (ODEQ) Source Testina Calibration Reauirements sheet is used as a guideline. Calibrations are performed using primary standard references and calibration curves where applicable.
Thermocouples traceable thermocouple and indicator system every six months at three points. Thermocouple indicators and temperature controllers are checked using a NIST traceable signal generator. Readouts are checked over their usable range and are adjusted if necessary (which is very unusual).
Thermocouples are calibration checked against an NIST
Pitots angles, lengths, and proximity to thermocouples, They are then calibrated in a wind tunnel at four points against a standard pitot using inclined manometers. They are examined for dents or distortion before each test. Pitots are protected with covers during storage and handling until they are ready to be inserted in the sample ports.
Every six months, S-type pitots are checked for misalignment,
HORl ZO N EN G I N EERl NG ******* ....*.. 112

Quality AssurancelQuality Control Page 3
Dry Gas Meters calibrated at five rates using a standard dry gas meter that is never taken into the field. The standard meter is calibration verified by the Northwest Natural Gas meter shop once every year. Dry gas meters are post-test calibrated with documentation provided in test reports.
Dry gas meters used in the manual sampling trains are
High Volume Sampler Orifice The orifice for the High Volume sampler is calibrated annually against a positive displacement (Roots type) flow meter, two or more trials at six flow rates. The Roots meter came with a manufacturer’s calibration curve and has been calibration checked by the Northwest Natural Gas meter shop.
HORIZON ENGINEERING ******* 113 .......

CORRESPONDENCE Source Test Plan and Correspondence
Permit (Selected Pages)

13585 N.E. Whitaker Way * Portland, OR 97230 Phone (503)255-5050 Fax (503)255-0505 [email protected]
December 13. 2000
Mr. Jack Herbert Oregon Degartment of Environmental Quality 2020 SW 4 , Suite MOO Portland. OR 97201-4987
Re: Source Testing:
This correspondence is notice that Horizon Engineering is to do source testing for the above-referenced facility, scheduled for December 27, 2000. This will serve as the Source Test Plan unless changes are requested prior to the start of testing.
1. Source(s) to be Tested: Electric Arc Furnace (EAF) Baghouse.
2. Purpose of the Testing: Emission factor verification as required by Title V Permit No. 26-1865.
3. Source Description: 16-compartment baghouse controlling particulate emissions from the EAF.
4. Pollutants to be Tested: Total Suspended Particulate (TSP), CO, NO,, SO,, Lead, VOC and Opacity.
5. Test Methods to be Used: Testing will be conducted in accordance with EPA Methods in Title 40 Code of Federal Reaulations Part 60 (40 CFR 601, Appendix A, July 1, 1999; and Oregon Department of Environmental Quality (ODEQ) methods in Source Samplina Manual Volume 1, January 1992.
. Flow Rate: CO, and 0,: Moisture: so,: NO,: Particulate: Opacity: co: Lead:
VOC (TGOC):
Oregon Steel Mills Portland, OR
EPA Methods 1 and 2 (S-type pitot flow traverses) EPA Method 3A (NDIR and paramagnetic analyzers) ODEQ Method 4 (psychrometry - wet bulb I dry bulb) EPA Method 6C (non-dispersive ultraviolet analyzer) EPA Method 7E (chemiluminescent analyzer) ODEQ Method 8 (High Volume sampler) EPA Method 9 (six minutes per run) EPA Method 10 (gas filter correlation analyzer) Analysis of the filters and sampler residue for lead. Residue allocated to the runs according to Method 8 procedure 11.2.1. Analysis by EPA 6010 (ICP). VOC as total gaseous organic compounds (TGOC) by EPA Method 25A, (heated flame ionization analyzer and sample line)
114 Air Pollution Emission Testing Infrared Inspections 0 Mechanical Engineering
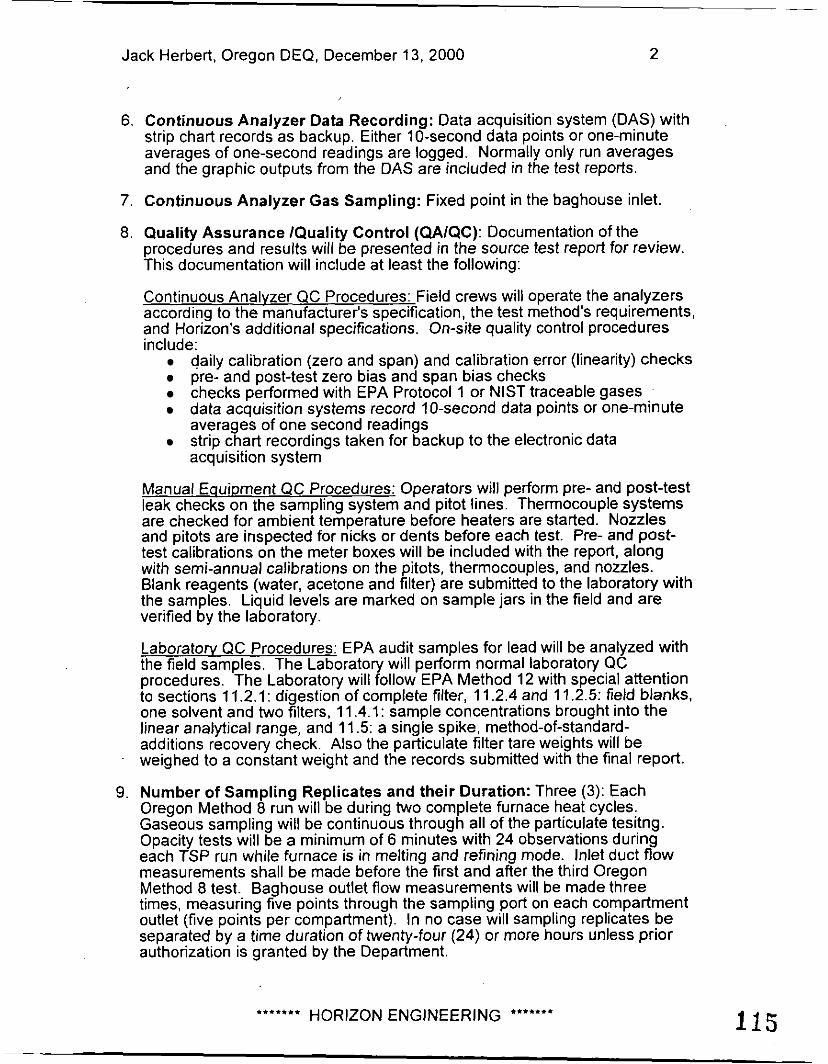
Jack Herbert, Oregon DEQ, December 13, 2000 2
6. Continuous Analyzer Data Recording: Data acquisition system (DAS) with strip chart records as backup. Either 10-second data points or one-minute averages of one-second readings are logged. Normally only run averages and the graphic outputs from the DAS are included in the test reports.
7. Continuous Analyzer Gas Sampling: Fixed point in the baghouse inlet
8. Quality Assurance /Quality Control (QAIQC): Documentation of the procedures and results will be presented in the source test report for review. This documentation will include at least the following:
Continuous Analvzer QC Procedures: Field crews will operate the analyzers according to the manufacturer's specification, the test method's requirements, and Horizon's additional specifications. On-site quality control procedures include:
daily calibration (zero and span) and calibration error (linearity) checks pre- and post-test zero bias and span bias checks checks performed with EPA Protocol 1 or NlST traceable gases data acquisition systems record IO-second data points or one-minute averages of one second readings strip chart recordings taken for backup to the electronic data acquisition system
Manual Eauimnent QC Procedures: Operators will perform pre- and post-test leak checks on the sampling system and pitot lines. Thermocouple systems are checked for ambient temperature before heaters are started. Nozzles and pitots are inspected for nicks or dents before each test. Pre- and post- test calibrations on the meter boxes will be included with the report, along with semi-annual calibrations on the pitots, thermocouples, and nozzles. Blank reagents (water, acetone and filter) are submitted to the laboratory with the samples. Liquid levels are marked on sample jars in the field and are verified by the laboratory.
Laboratow QC Procedures: EPA audit samples for lead will be analyzed with the field samdes. The Laboratorv will Derform normal laboratory QC procedures. 'The Laboratory will iollow' EPA Method 12 with special attention to sections 11.2.1: digestion of complete filter, 11.2.4 and 11.2.5: field blanks, one solvent and two filters, 11.4.1: sample concentrations brought into the linear analytical range, and 11.5: a single spike, method-of-standard- additions recovery check. Also the particulate filter tare weights will be
' weighed to a constant weight and the records submitted with the final report.
9. Number of Sampling Replicates and their Duration: Three (3): Each Oregon Method 8 run will be during two complete furnace heat cycles. Gaseous sampling will be continuous through all of the particulate tesitng. Opacity tests will be a minimum of 6 minutes with 24 observations during each TSP run while furnace is in melting and refining mode. Inlet duct flow measurements shall be made before the first and after the third Oregon Method 8 test. Baghouse outlet flow measurements will be made three times, measuring five points through the sampling port on each compartment outlet (five points per compartment). In no case will sampling replicates be separated by a time duration of twenty-four (24) or more hours unless prior authorization is granted by the Department.
HORIZON ENGINEERING ******* (I***,**

Jack Herbert, Oregon DEQ, December 13,2000 3
10. Reporting Units for Results: Particulate - grldscf, Iblhr, and Ib/ton cold
11. Horizon Engrg. Contacts:
charge. Gases - ppmv, Iblhr, and Ib/ton cold charge.
David Rossman or David Bagwell (503) 255-5050
Fax (503) 255-0505
12.Source Site Personnel: Debbie Deetz Silva (503) 978-6044
Fax (503) 240-5775
13. Regulatory Contacts: Jack Herbert (503) 229-5579
Fax (503) 229-5265
14. Applicable ProcesslProduction Information: Process operating data and production information that characterizes the source operation is considered to be: Heat charge weights and materials, tap weights and materials, heat times. Process information is normally gathered by the Source-site personnel and provided to Horizon for inclusion in the report.
The source must operate at a normal maximum rate during testing. Rates not in agreement with those stipulated in the Permit can result in test rejection for application to determine emission factor verification. Imposed process limitations could also result from atypical rates.
15. Control Device Operating Parameters: Baghouse pressure drops.
16. Opacity Readings to be Taken By:
17.Certified Plume Evaluator: Yes(x) N o ( ) N /A( )
18. Other Process Considerations, including sampling site configurations.
Horizon Engineering
equipment limitations, special methods, etc.:
Particulate: Each Oregon Method 8 test shall encompass two complete heat cycles with samples collected for 5 minutes from as many as possible of the 16 compartments. The next test shall begin in the next compartment after the final compartment sampled in the previous test. Particulate is to be sampled in the gas stream above the bags in the slot shaped are where gas flows up and toward the center of the baghouse. This allows the sampler nozzle to be inserted through ports in the ceiling of the breezeway at the top of the baghouse. As in the past, sampling will be isokinetic at a single point at the outlet of each compartment.
Flow Rate Measurements: Velocities will be measured at five points through each port, giving 5 velocities per compartment, 80 points for the baghouse. Velocity pressure determinations will be by use of an S-type pitot and a micro-manometer. Past testing has shown that traversing this single port adequately characterizes the outlet flow rate.
HORIZON ENGINEERING ******* l i 6 **.*.**

Jack Herbert, Oregon DEQ, December 13,2000 4
Gaseous Pollutant Measurements: Gas analyzer readings at the baghouse' inlet will be continuous through all of the M-8 tests.
Timing: The testers will synchronize their watches to record times in sync with the OSM heat log in the arc furnace control pulpit.
19,Administrative: Unless notified prior to the start of testing, this test plan is considered approved for compliance testing of this source. A letter acknowledging receipt of this plan and agreement on the content (or changes as necessary) would be appreciated.
The Department will be notified of any changes in source test plans prior to testing. It is recognized that significant changes not acknowledged, which could affect accuracy and reliability of the results, could result in test report rejection.
Source test reports will be prepared by Horizon Engineering and will include all results and example calculations, field sampling and data reduction procedures, laboratory analysis reports, and QNQC documentation. Source test reports will be submitted to you within 75 days of the completion of the field work, unless another deadline has been stipulated. Oregon Steel Mills will send two (2) copies of the completed Source Test Report to you at the address above.
Any questions or comments relating to this test plan should be directed to me.
Sincerely,
Emily U.Magwell, Project Coordinator
cc: Debbie Deetz Silva, Oregon Steel Mills
HORIZON ENGINEERING ******* t**t**t 117

Department of Environmental Quality Northwest Region
2020 SW Fourth Avenue -Oregon Iohn A. Kitzhhakr. M.D.. Governor December 22, 2000
Oregon Steel Mills, Inc Attn: Debbie Deetz Silva PO Box 2760 Portland, Oregon 97208
Horizon Engineering Attn: David R Rossman and David Bagwell 13585 NE Whitaker Way Portland, Oregon 97230
Re:
Suite 400 Portland, OR 97201-4987
(503) 229-5263 Voice TPI (503) 229-5471
AQ Multnomah County Title V Permit No 26-1865 Oregon Steel Mills Source-test plan for electric-arc and ladle-metallurgy furnaces' annual baghouse tests for emission-factor verification and PM and SO;! concentrations' compliance
Dear Ms Silva and Messrs Rossman and Bagwell:
On December 13, 2000, I received your test plan for Oregon Steel Mills' ICA baghouse's emissions. The test will measure particulate, lead, and visible emissions from the baghouse and carbon-monoxide, nitrogen-oxide, sulfur-dioxide, volatile- organic-compounds emissions in the baghouse inlet. You will calculate emission factors based on cold charges to the electric-arc furnace. You will test compliance of filterable- particulate and sulfur-dioxide concentrations. You plan to test on December 27, 2000.
Oregon Steel Mills' Title V Operating Permit' Conditions require annual emissions tests:
37. Verify emission factors for filterable particulate matter, lead, carbon monoxide,
38. Measure filterable particulate grain loading.
39. Measure sulfur-dioxide concentrations, at least during the permit's first two years.
nitrogen oxides, and volatile organic compounds.
I approve your test plan with these conditions:
1. Use analyzer ranges corresponding closely to expected measurements.
2. Use non-zero calibration concentrations bracketing measurements as much as possible. As we discussed, these may deviate from published methods' instructions. To address your concern in this matter, I contacted Paul Boys of EPA's Region-10 office. He agreed that this was within the Department's authority and that we (the Department) may require and approve such modifications to published test methods.
l i 8 DEQI

Debbie Deetz Silva, David R Rossman, and C David Bagwell December 22,2000 Page 2
The three tests earlier this year found 10 to 700 ppm carbon monoxide, 19.8 to 20.6 percent oxygen, and 0.1 to 1.8 percent carbon dioxide.
For carbon monoxide, accurate calibrations from about 20 to about 300 or 500 ppmv have been important to obtain accurate total emissions. Horizon's analyzer with two ranges seems capable of giving more reliable calibrations over this entire range of significant emissions than a single upscale calibration would. You would need to measure the analyzer linearity and the system bias of each range.
With one carbon-monoxide range, corrected low readings should be similar with low or high upscale calgases. Please check upscale system biases with a low level (20 to 50 ppmv) and a high level (probably 200 to 500 ppmv, or as high as necessary). Check linearity with three suitable non-zero calgases.
3. The EPA Emission Measurement Center has sent lead audit samples to Horizon Engineering. Send the lead audit samples with the field samples to your two laboratories for side-by-side processing. The laboratory that measures particulate samples must accurately report each audit-solution volume. The audit is of the lead concentration. The volumes are about 10 mL -- about five percent of field-rinse volumes. Total lead may also be much smaller.
4. The laboratory performing lead analyses should record how they treat samples and perform quality control. Section 8 in your plan identifies essential quality control.
5. Leak checks and system bias checks are before and after each run. See Section 6.
6. Reports include field charts of analyzer readings. Please change Section 6.
7. Oregon Steel Mills is to document any significant furnace production delays.
8. Oregon Steel Mills is to send me one (1) test report within seventy-five (75) days after testing.
Please call me at 503-229-5579 if you have questions or change the test schedule or plan. My fax number is 229-5265. [email protected] is my email address.
Sincerely,
I & . . J ckHerbert
JHH bource Testing Coordinator
c: Greg Grunow:NWR
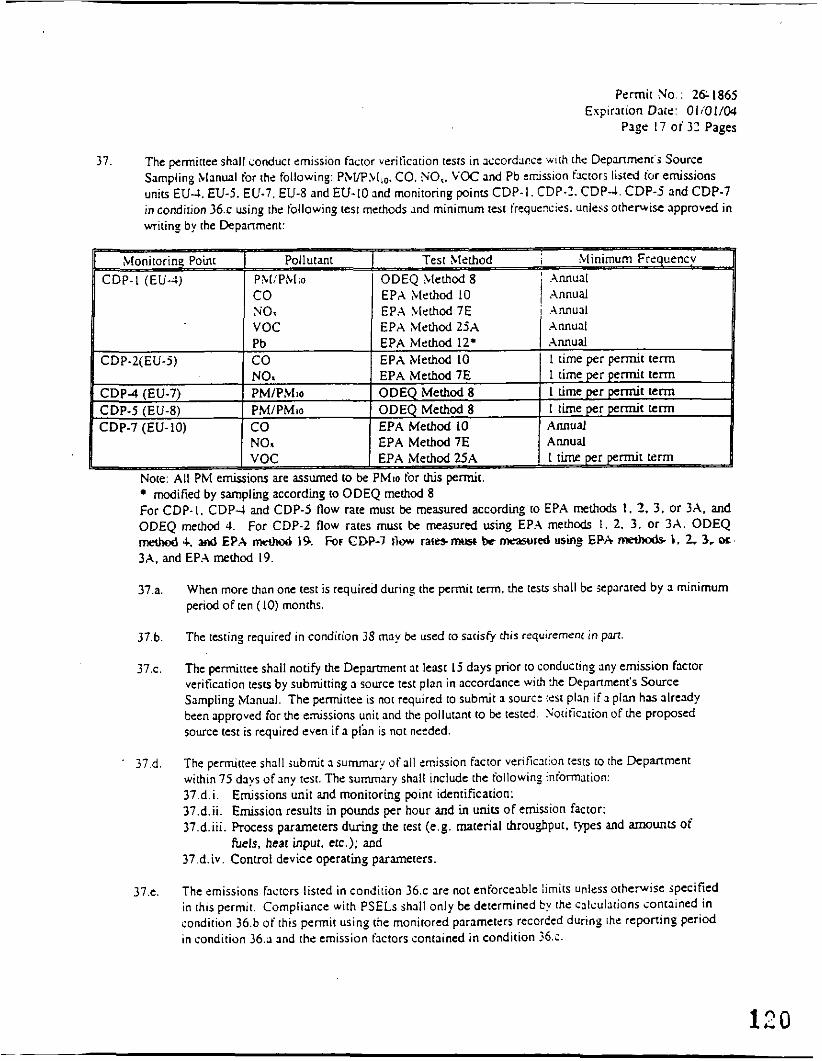
Permit No.: 26r1865 Expirarion Date: OI;OI/@I
Plgc I7 of 33 Pages
11. The permittee shall conduct emission factor verification tests in accordapce wi th [he Depmmcnr's Source Sampling M a n u 1 for the following: PM/F.Ll,o. CO. SOx. V W and Pb errision factors listed lor emissions units EUJ. EU-5. EU-7. EU-8 and EU-IO and monitoring points CDP-I. CDP.2. CDP-1. CDP-5 and CDP-7 in condition 36.c using rhc following test mcthods ind minimum test irequcxies. unless otherwise approved in writing by rhe Depanment:
EPA Mcthod 10 EP.4 4lt.lhod 7E EPA Mcthod 25A
Note: All Pbl emissions are assumed to be PMlo for lhis permit. modified by sampling accordm,o to ODEQ method 8
For CDP-I. C D P J and CDP-5 How rate must be measured according to EPA methods I. 2. 3 , or 3A. and ODEQ method 4. For CDP-2 flow rates must be measured using EP.4 methods I . 2. 3. or 3A. ODEQ mrchod 4. and EPA m e h d 19. For CDP-7 tkm rates nn\w be measured using €PA medhxb b. 2.3, OL
3A. and EPA method 19.
37.a. When more than one test is required during the permit term. the tests shall be separated by a minimum period of ten ( IO) months.
The testing required in condition 3S may be used to satisfy this requirement in pan
The permittee shall notify the Department at l e s t 15 days prior to conducting any emission factor verification tests by submitting J source test plan in accordance with the Department's Source Sampling Manual. The permittee is nor required to submit J SOUIC: itst plan if a plan h a s already been approved for the emissions uni t and the pollutant to be tested. Yotificarion of the proposed source test is required even if a pian is not needed.
The permittee shall submit a summqi of all emission factor verificxion tests to the Depanment within 75 days of any rest. The summary shall include the following iniomation: 37.d.i. 3 7 . d . i Emission results in pounds per hour and in units of emission factor: 37.d.iii. Process parameters during rhe [est (e.g. material Ihrou@pul. Wes and amouncS Of
fuels, heat input. erc.): and 3 7 . d . i ~ . Conuol device operating parameters.
The emissions factors listed in condition 36.c are not enforceable limits unlcss otherwise specified in this permit. Compliance with PSELs shall only be determined by the calculations contained in condition 36.b of this permit using the monitored parameters recorded during [he reponing period in condition 36.a and the emission factors contained in condition Xi-
37.b.
37.c.
. 37.d.
Emissions unit and monitoring point identification:
37.e.

Permit No.: 26-1865 Expiration Date: 01/01/04
Page 18 o f 32 Pages
TEST MJTHODS AVD PROCEDL~RES r0.a 3~o-zis-ooso~i~1
38. The following procedures and test methods shall be used to conduct monitoring pertaining to condition 13 limiting particulate g a i n loading for E U - I From compliance demonstration point CDP4.1. for EU-7 from compliance demonstration point CDP-7. I . and for EU-8 From compliance demonstration point CDP 8.1;
38.2.
38.b.
38.c.
38.d.
38.e.
38.f.
38.g.
All source testing shall be performed in accordance with the Department's Source Sampling Manual 3nd the source test plan submitted to the Department prior to the scheduled test.
Unless otherwise approved by the Department, ODEQ Method 8 shall be used to measure PM emissions. EPA Methods 1.2. 3 or 3 A and ODEQ method 4 shall be used to determine the volumetric f low rate during each ODEQ Method 8 test run.
During each test for EU-4. the permittee shall record the following information: 38.c.i. date and time of each furnace Cap; 38.c.i. total tom of scrap charged in each heat; 38.c. iii. baghouse operating parameters; and 38.c . i~ . any significant furnace production delays.
During each test for EU-7 and 8. the permittee shall record the following information: 38.d.i. Process parameters; and 38.d.ii. baghouse operating parameters; and
The arithmetic average of at least 3 test runs shall be used
Source testing shall be performed at compliance demonstration point CDP-4.1 (EM) annually. Source testing shall be performed at compliance demonstration points CDP-7. I (EU-7) and CDP- 8. I (EU-8) once per permit term.
The Department shall be notified. in writing. at least 15 days prior (0 any source test. The written notification shall include an identification o f the testing company performing the tests. i f other than the permittee and the testing protocol if not on file with the Department or changed since the last source test.
39. The following procedures and test methods shall be used to conduct monitoring pertaining to condition 15 limiting the SO1 concentration For E U - I from compliance demonsvation point CDP- I ; This condition i s State-only enforceable.
39.a. iUI source testing shall be performed in accordance with the Department's Source Sampling Manual and the source test plan submitted to the De'panment prior to the scheduled test.
Unless otherwise approved by the Department, EPA Method 6C shall be used to measure the S& concentration. EPA Methods I and 1 shall be used to determine the volumetric flow rate. and ODEQ method 4 to determine moisture, during each EPA Method 6C test run.
During each test. the permittee shall record the following information: 39.c.i. date and time of each furnace tap; 39.c.ii. total tons ofscrap charged in each heat;
39.b.
39.c.

Permit No.: 26-1865 E.xpiration Date: OIIO1/04
P35e 19 o f 32 Pages
39.d
j9.c.
39.f.
39.c.iii. baghouse operating parameters: and 3 9 . c . i ~ . any significant furnace production delays
The arithmetic average of at least 3 test runs shall be used.
Source testing shall be performed at compliance demonstration point CDP- I (ELI-4) annually. I f two :onsecutive source test results indicate emissions a x below 75'% oi the specified limit. no further testins is required for that emissions unidpollutant combination for the remaining duration o f this permit. The permitree may use the last source tesu conducted on each of the emission points as one o f the required consecutive tests. if they were conducted during the 199s calendar year or after and are considerid val id tesu by [h i Department. to comply with this condirion.
The Department shall be notified. in writing. at least I5 days prior to any source test. The wi t ten notification shall include an identification of the testing company performing the tests. i f other than the permittee and the testing protocol if not on file with the Department or changed since the last source test.
40. Although source testing is not rqu i rcd by h i s permit for the pem't conditions listed below. if testing is conducted in addition to the monitoring specified in this permit. the permittee shall use the following test methods and averaging times to measure the polluwnt emissions:
Test Method - 19. 20 I Modified EPA
accordance with
- Averaging Time
aggregate of three minutes in any 60 minute period for condition 19; aggregate o f thirty seconds in any 60 minute period for condition 20 average of three one-hour test rwls
- Special Conditionr
Each Method 9 observation sbdl represcm a pericrd o f 15 seconds for the purpose ofdetermining the aggregate amount o f time in a 60 minute period that the visible emissions are greater than the opaciry limit. The test duration may be less than 60 minutes if a violation of the standard is documented before rhe Full 60 minute observation period is completed.
ODEQ Method 8 is for sources wirh exhaust gases at essentially ambient conditions (e.g. material handling cyclones); ODEQ Method 7 i s for direct contact combustion sources (e.g. panicle and veneer dryers): ODEQ Method j is for indirect contact he1 bum& equipment (e.g. boilers) and any other source.
Al l resting shall be conducted in accordance with the Department's Source Sampling Manual unless otherwise specified in the special conditions column of the table above.
RECORDKEEPLVG REQbTREICIEWTS [OAR 340-218-050(3)(B)]
11. The pernittee shall mainwin the following general records of required monitoring information:
1 I . a . 1l .b . 1 l .c . 4 l .d.
the date. place as defined in the permit. and time o f sampling or measurements: the date(s) analyses wire performed; the company or entity that performed the xnalyses: [he analytical techniques or methods used:
1 22


![Connecting Cisco Unified Communication Manager [12.5.1] to](https://img.dokumen.tips/doc/110x75/624ec81c903efc45fd325275/connecting-cisco-unified-communication-manager-1251-to-.jpg)
