Embed Size (px)
Citation preview

AP StatisticsScoring Guidelines
© 2018 The College Board. College Board, Advanced Placement Program, AP, AP Central, and the acorn logo are registered trademarks of the College Board. Visit the College Board on the Web: www.collegeboard.org.
AP Central is the official online home for the AP Program: apcentral.collegeboard.org
2018

AP® STATISTICS 2018 SCORING GUIDELINES
© 2018 The College Board. Visit the College Board on the Web: www.collegeboard.org.
Question 1 Intent of Question The primary goals of this question were to assess a student’s ability to (1) identify various values in regression computer output; (2) interpret the intercept of a regression line in context; (3) interpret the coefficient of
determination 2( )r in context; and (4) identify an outlier from a scatterplot.
Solution Part (a):
The estimate of the intercept is 72.95. It is estimated that the average time to finish checkout if there are no other customers in line is 72.95 seconds.
Part (b):
The coefficient of determination is 2 73.33%.r This value indicates that 73.33% of the variability in the times it takes customers to finish checkout, including time waiting in line, can be explained by knowing how many customers are in line in front of the selected customer.
Part (c):
The outlier is the point with 3x and y close to 0. This point is considered an outlier because the combination of x and y values differs from the pattern of the rest of the data. Specifically, the value of y (time to finish checkout) is much lower than would be expected when there are 3x customers in line in front of the selected customer, given the remaining data.
Scoring Parts (a), (b), and (c) are scored as essentially correct (E), partially correct (P), or incorrect (I). Part (a) is scored as follows:
Essentially correct (E) if the response satisfies the following three components: 1. Correctly identifies 72.95 as the intercept. 2. Communicates the concept of a y -intercept in a context that includes both time and zero customers. 3. Indicates that the value of the intercept is a prediction by using language such as “predicted,”
“estimated,” or “average” value of y.
Partially correct (P) if the response includes only two of the three components. Incorrect (I) if the response includes at most one of the three components.

AP® STATISTICS 2018 SCORING GUIDELINES
© 2018 The College Board. Visit the College Board on the Web: www.collegeboard.org.
Question 1 (continued)
Notes: Regression equations (such as ˆ 72.95 174.40 y x ) cannot be used to satisfy identification of the
intercept in component 1, unless the intercept is explicitly labeled as such. A regression equation cannot be used to satisfy component 3. Incorrect regression equations are treated as extraneous and do not affect the scoring of any component. A response that interprets 72.95 as a slope does not satisfy components 1 or 2.
Part (b) is scored as follows:
Essentially correct (E) if the response satisfies the following three components: 1. Correctly identifies 73.33% as the coefficient of determination.
2. Provides a correct (possibly generic) interpretation of 2.r 3. Interpretation includes context.
Partially correct (P) if the response satisfies only two of the three components; OR if the response satisfies the three components, but reverses the roles of number of customers in line and time to finish checkout in the interpretation. Incorrect (I) if the response satisfies at most one of the three components.
Notes:
In component 2 the correct interpretation of the coefficient of determination can take any of several equivalent forms, such as:
o The percent variability in y that is attributed to the linear relationship between y and x or between x and y.
o The proportion of the total variability in the dependent variable y that is explained by the independent variable x.
o The proportion of variation in y that is accounted for by the linear model. o The proportionate reduction of total variation of the y values that is associated with the use of the
independent variable x. o The proportionate reduction in the sum of the squares of vertical deviations obtained by using the
least-squares line instead of the naïve prediction of y .
In component 2 common incorrect interpretations of the coefficient of determination include: o The percent variability in the predicted y values that is explained by the linear relationship
between y and x. o The percent variability in the data that is explained by the linear relationship between y and x. o The percent variability that is explained by the linear relationship between y and x. o The percent variability in y that is on average explained by the linear relationship between y
and x. For component 3 context must include mention of time or customers.

AP® STATISTICS 2018 SCORING GUIDELINES
© 2018 The College Board. Visit the College Board on the Web: www.collegeboard.org.
Question 1 (continued) Part (c) is scored as follows:
Essentially correct (E) if the response satisfies the following two components:
1. Correctly identifies the outlier. 2. Describes an unusual feature of the identified scatter plot point, relative to the remaining data points,
that is sufficient to identify it as the outlier. Examples include: The combination of x and y values is unusual compared to the other points. The value of y is much lower than would be expected (or predicted), given the remaining
data. The residual for the point is unusually large relative to the other residuals.
Partially correct (P) if the response satisfies component 1 but does not satisfy component 2.
Incorrect (I) if the response does not meet the criteria for E or P.
Notes:
In the absence of any point being circled on the graph, component 1 can still be satisfied by explicitly referring to the coordinates of the outlier. Valid coordinates for outlier identification must specify an x value of 3 and a y value that is strictly between 0 and 250.
A response that does not make a comparison to the remaining data points, such as stating the outlier has a large residual or is nowhere near the regression line, does not satisfy component 2.
A response that makes a comparison to the remaining data points based upon an unusual feature that is insufficient for outlier identification, such as stating the point is the only point with that particular y value, does not satisfy component 2.
In the absence of explicit numerical calculation, a response that appeals to the influence that the outlier has on the regression coefficient estimates or on the sample correlation coefficient does not satisfy component 2.

AP® STATISTICS 2018 SCORING GUIDELINES
© 2018 The College Board. Visit the College Board on the Web: www.collegeboard.org.
Question 1 (continued) 4 Complete Response
Three parts essentially correct 3 Substantial Response Two parts essentially correct and one part partially correct 2 Developing Response Two parts essentially correct and no parts partially correct OR One part essentially correct and one or two parts partially correct OR Three parts partially correct 1 Minimal Response One part essentially correct OR No parts essentially correct and two parts partially correct
AP® STATISTICS 2018 SCORING GUIDELINES
© 2018 The College Board. Visit the College Board on the Web: www.collegeboard.org.
Question 2 Intent of Question The primary goals of this question were to assess a student’s ability to (1) calculate the sample size when given the endpoints of a confidence interval for a proportion; (2) explain how bias could be present in a particular survey method; and (3) estimate a proportion from sample data collected using a method designed to decrease bias. Solution Part (a):
Using the standard formula for a confidence interval for one proportion, the interval (0.584 to 0.816) is found
as follows. ˆ ˆ(1 )
ˆ
p pp z
n where 0.584 0.816ˆ 0.7,
2 p the margin of error is 0.816 0.7 0.116, and
* 1.96.z
Solving 0.7(1 0.7)
1.96 0.116
n
yields 2
2(1.96) (0.7)(1 0.7)59.95.
(0.116)
n The sample size was 60.
Part (b):
Bias might have been introduced because students responded directly to the environmental science teacher. Because the students would know that an environmental science teacher cares about the environment, they might say yes when they actually don’t recycle. This would result in a point estimate that is greater than the proportion of all students who would respond yes to the question.
Part (c):
(i) The expected number is 1(300) 150.2
(ii) The point estimate is based on expecting 150 students to be required to say no and 150 students to
truthfully answer the question. Of the 213 answers of no, we expect that 213 150 63 were from students who truthfully answered the question. That means we expect that the remaining 150 63 87 students truthfully answered the question and responded yes. So the point estimate for the proportion of
all students at the high school who would respond yes to the question is 87 0.58.150

AP® STATISTICS 2018 SCORING GUIDELINES
© 2018 The College Board. Visit the College Board on the Web: www.collegeboard.org.
Question 2 (continued) Scoring Parts (a), (b), and (c) are scored as essentially correct (E), partially correct (P), or incorrect (I). Part (a) is scored as follows: Essentially correct (E) if the response satisfies the following five components:
1. Uses a standard error in the form ˆ ˆ1 p p
n where p̂ is between 0 and 1.
2. Shows evidence that ˆ 0.7p was correctly used in the standard error. 3. Shows evidence that 0.116 was correctly used as the margin of error in the calculation. 4. Shows evidence that * 1.96z was correctly used as the critical value in the calculation. 5. Includes a single, positive whole-number answer.
Partially correct (P) if the response satisfies only three or four of the five components. Incorrect (I) if the response satisfies at most two of the five components. Notes:
Using an equation in the form 2
2
ˆ ˆ1
MOE
z p pn
satisfies component 1.
A value of 0.21 in the numerator of the standard error implies that ˆ 0.7p was correctly used in the standard error and satisfies component 2.
An equation such as 0.816 0.7 MOE implies that 0.116 was correctly used for the margin of error and satisfies component 3.
Statements that suggest a whole-number answer is approximate (such as, “about 60” or “ 60”) satisfy component 5.
Algebraic work between the set-up and final answer does not need to be shown to satisfy component 5. When calculating the values 0.7, 0.116, or 1.96, ignore minor arithmetic errors or transcription errors if
they can be identified by the work shown.
AP® STATISTICS 2018 SCORING GUIDELINES
© 2018 The College Board. Visit the College Board on the Web: www.collegeboard.org.
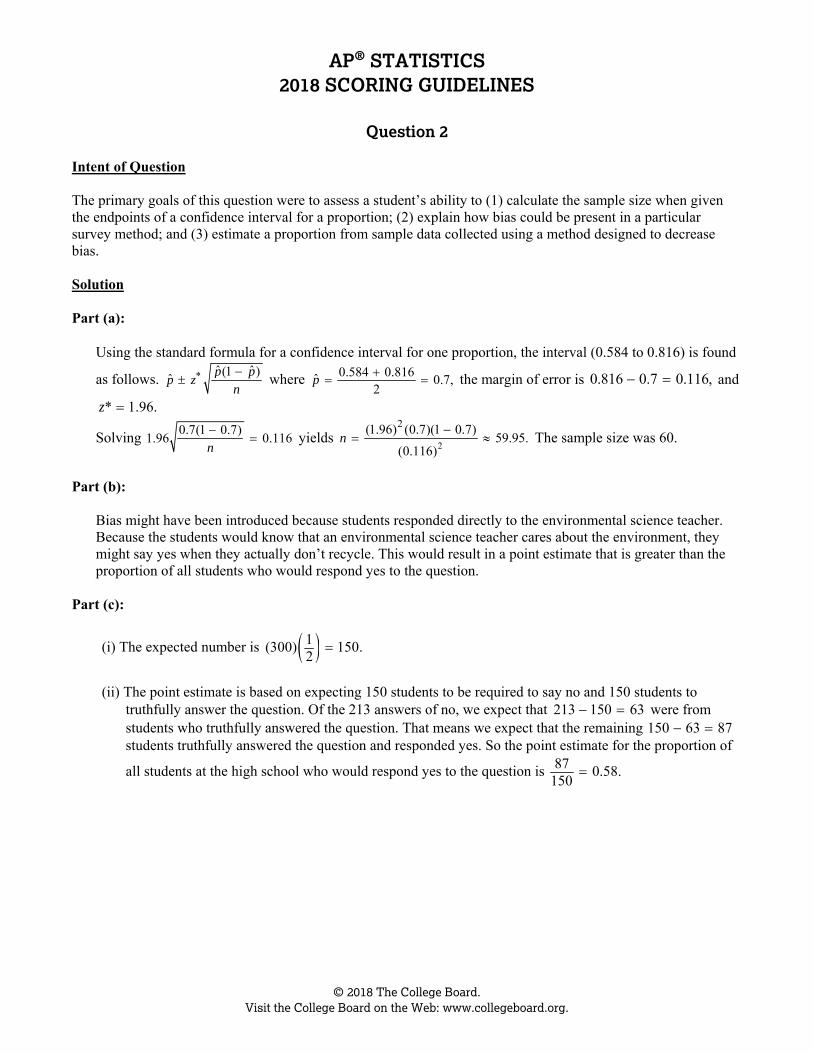
Question 2 (continued) Part (b) is scored as follows: Essentially correct (E) if the response satisfies the following three components:
1. Explains why the responses to the survey might differ from the truth about student recycling in this context (for example, the survey was not anonymous, the question was asked by an authority figure).
2. Explains how the responses to the survey might differ from the truth about student recycling (for example, “students might say yes when they actually don’t recycle,” “students lie and say yes,” “students don’t recycle but lie to the teacher”).
3. Describes the effect of the bias on the point estimate (or the proportion, percentage, number of yes responses in the sample) and doesn’t contradict the bias described.
Partially correct (P) if the response satisfies only two of the three components. Incorrect (I) if the response satisfies at most one of the three components. Notes:
To satisfy component 1 the response must provide a reason that is based on a bias created by the teacher asking students in person. For example, a response that addresses the wording of the question, voluntary response, or sampling variability does not satisfy component 1.
To satisfy component 2 the response needs to explicitly contrast what the students say with what they do. Evidence used to address component 3 cannot also be used to address component 2. For example, a
response that says “Students might lie, producing an estimate that is too high” addresses the effect of the bias on the point estimate but should not be combined with the statement about students lying to infer that students do not actually recycle. However, a response that says “Students may lie and say yes, producing an estimate that is too high” satisfies both components 2 and 3.
If the response is clearly about the population proportion and not about the point estimate, component 3 cannot be satisfied.
Statements such as “the interval will be too high” do not satisfy component 3 because they don’t specifically address the point estimate.

AP® STATISTICS 2018 SCORING GUIDELINES
© 2018 The College Board. Visit the College Board on the Web: www.collegeboard.org.
Question 2 (continued) Part (c) is scored as follows: Essentially correct (E) if the response gives an answer of 150 in (c-i) and gives an answer of 0.58 (or equivalent) in (c-ii). Partially correct (P) if the response gives an answer of 150 in (c-i) and gives an answer of 0.42 (or equivalent) in (c-ii);
OR if the response does not give an answer of 150 in (c-i) but gives an answer of 0.58 (or equivalent) with supporting work in (c-ii). Incorrect (I) if the response does not meet the criteria for E or P. Notes:
In part (c-i) the answer must be a single number. Responses such as “at least 150” or “147–153” are incorrect. However, responses such as “about 150” or “ 150” are acceptable.
In part (c-ii) the proportion can be described verbally (e.g., “87 out of 150”). In part (c-ii) if the response clearly indicates that 0.58 (or 0.42) is the population proportion, lower the
overall score in part (c) by one level (that is, from E to P, or from P to I). Using probability notation such as P(yes) does not clearly indicate a population proportion.
In part (c-ii) if the response includes a point estimate of 0.58 or 0.42 but uses a confidence interval as the final answer, lower the overall score in part (c) by one level (that is, from E to P, or from P to I).
If the answer is incorrect in part (c-i) and the answer in part (c-ii) uses numerator = 87 and denominator = 300 – answer to (c-i), the response should be scored P.

AP® STATISTICS 2018 SCORING GUIDELINES
© 2018 The College Board. Visit the College Board on the Web: www.collegeboard.org.
Question 2 (continued)
4 Complete Response Three parts essentially correct 3 Substantial Response Two parts essentially correct and one part partially correct 2 Developing Response Two parts essentially correct and no parts partially correct OR
One part essentially correct and one or two parts partially correct OR
Three parts partially correct 1 Minimal Response One part essentially correct OR
No parts essentially correct and one or two parts partially correct

AP® STATISTICS 2018 SCORING GUIDELINES
© 2018 The College Board. Visit the College Board on the Web: www.collegeboard.org.
Question 3 Intent of Question The primary goals of this question were to assess a student’s ability to (1) compute a probability based on a weighted mixture of two populations; (2) compute a conditional probability; and (3) recognize a binomial random variable and compute the probability associated with it. Solution Part (a):
Let L denote left-handed, M denote multiple birth, and S denote single birth. The probability that a randomly selected child born in the region is left-handed is:
( ) ( ) ( | ) ( ) ( | ) (0.035)(0.22) (0.965)(0.11) 0.0077 0.10615 0.11385. P L P M P L M P S P L S
Part (b): From part (a), ( ) 0.11385.P L Therefore,
( and ) (0.035)(0.22) 0.0077( | ) 0.0676.( ) 0.11385 0.11385
P L MP M L
P L
Part (c):
Let X represent the number of children who are left-handed in a random sample of 20 children from the region. X has a binomial distribution with 20n and 0.11385p (found in part (a)). Using the binomial distribution,
0 20 1 19 2 18
( 3) 1 ( 2)
20 20 201 (0.11385) (0.88615) (0.11385) (0.88615) (0.11385) (0.88615)
0 1 2
1 0.598 0.402.
P X P X

AP® STATISTICS 2018 SCORING GUIDELINES
© 2018 The College Board. Visit the College Board on the Web: www.collegeboard.org.
Question 3 (continued)
Scoring Parts (a), (b), and (c) each scored as essentially correct (E), partially correct (P), or incorrect (I). Part (a) is scored as follows:
Essentially correct (E) if the probability is computed correctly, AND work is shown that includes correct numerical values using a formula, end results from a tree diagram, or some other appropriate strategy. Partially correct (P) if the response provides a reasonable strategy for finding the probability, such as a formula or tree diagram, but uses one or more inappropriate values;
OR if the response gives the correct probability but not enough work is shown to determine how that probability was found. Incorrect (I) if the response does not meet the criteria for E or P. Note: A reasonable strategy needs to include summing the results of two multiplications.
Part (b) is scored as follows:
Essentially correct (E) if the probability is computed correctly, with work shown that includes appropriate numerical values for both the numerator and denominator. Partially correct (P) if the response includes a numerator and denominator in calculating the conditional probability, with one appropriate term (numerator or denominator) and the other inappropriate. Incorrect (I) if the response does not meet the criteria for E or P. Note: Appropriate values include incorrectly calculated values from part (a).

AP® STATISTICS 2018 SCORING GUIDELINES
© 2018 The College Board. Visit the College Board on the Web: www.collegeboard.org.
Question 3 (continued)
Part (c) is scored as follows:
Essentially correct (E) if the response satisfies the following five components: 1. Uses a calculation based on the binomial distribution to find the probability of the number of children
in the sample who are left-handed. 2. Specifies appropriate values for n and p. 3. Uses correct endpoint value for the probability. 4. Uses correct direction to calculate the probability of at least three left-handed children. 5. Correctly calculates a binomial probability consistent with the previous work.
Partially correct (P) if the response satisfies component 1 and only two or three of the other four components;
OR if components 2, 3, 4, and 5 are met, and the response does not explicitly indicate the binomial distribution is used by name or formula. Incorrect (I) if the response does not meet the criteria for E or P.
Notes:
“Appropriate” values include incorrectly calculated values from part (a) or a recalculated probability from part (b).
An unlabeled numerical value in a calculator statement cannot be used to satisfy a component. A response which calculates ( 3)P X satisfies component 3 but does not satisfy component 4.
A normal approximation to the binomial is not appropriate because 20 0.11385 2.277 5. np A response using the normal approximation can score at most P. To earn a score of P, the response must include all of the following:
o a correct mean and standard deviation based on the binomial parameters o clear indication of boundary and direction with a z-score or diagram o the probability computed correctly
Notes for all parts:
If the resulting probability or part of the calculation of the probability uses a value that is not between 0 and 1, inclusive, the score for that part is lowered by one level (that is, from E to P, or from P to I).
An arithmetic or transcription error in a response can be ignored if correct work is shown. For example, 0.0077 0.10615 0.1385.

AP® STATISTICS 2018 SCORING GUIDELINES
© 2018 The College Board. Visit the College Board on the Web: www.collegeboard.org.
Question 3 (continued)
4 Complete Response
Three parts essentially correct 3 Substantial Response Two parts essentially correct and one part partially correct 2 Developing Response Two parts essentially correct and no parts partially correct OR One part essentially correct and one or two parts partially correct OR Three parts partially correct 1 Minimal Response One part essentially correct OR No parts essentially correct and two parts partially correct

AP® STATISTICS 2018 SCORING GUIDELINES
© 2018 The College Board. Visit the College Board on the Web: www.collegeboard.org.
Question 4 Intent of Question The primary goals of this question were to assess a student’s ability to (1) determine whether a cause-and-effect conclusion can be made based on how a study was conducted and (2) set up, perform, and interpret the results of a hypothesis test, in the context of the problem. Solution Part (a):
Yes, it would be reasonable to conclude that the new procedure causes a reduction in recovery time, for patients similar to those in the study. The patients in the study were randomly assigned to the two procedures, which reduces the chance that confounding variables will affect the results. Therefore the statistically significant reduction in mean recovery time can be attributed to the new procedure being superior to the standard procedure.
Part (b): Step 1: State a correct pair of hypotheses.
Let S represent the mean recovery time among all patients similar to those in the study if they were to receive the standard treatment. Let N represent the mean recovery time among all patients similar to those in the study if they were to receive the new treatment. The hypotheses to be tested are 0H : S N versus aH : . S N
Step 2: Identify a correct test procedure (by name or by formula) and check appropriate conditions. The appropriate procedure is a two-sample t-test for a difference between means. Because this is an experiment, the first condition is that subjects were randomly assigned to one treatment group or the other. In this case the condition is satisfied because we were told that the subjects were randomly assigned to either the standard or new procedure. The second condition is that the recovery times of the two populations are normally distributed or the sample sizes are sufficiently large to presume that the distribution of the difference in the sample means is approximately normal. In this case the condition is met because the sample sizes of 110 and 100 are both sufficiently large.

AP® STATISTICS 2018 SCORING GUIDELINES
© 2018 The College Board. Visit the College Board on the Web: www.collegeboard.org.
Question 4 (continued) Step 3: Correct mechanics, including the value of the test statistic, degrees of freedom, and p-value (or rejection region).
The test statistic is 2 2 2 2
217 186 7.1334 29110 100
S N
S N
S N
x xt
s sn n
.
The p-value is the area greater than 7.13 for a t-distribution with 207.18,df which is essentially 0
128.36 10 .
Step 4: State a correct conclusion in the context of the problem, using the result of the statistical test.
Because the p-value is very small, we have sufficient evidence to conclude that for patients similar to the ones in the study, those receiving the new procedure would have less recovery time, on average, than those receiving the standard procedure.
Scoring This question is scored in three sections. Section 1 consists of part (a); section 2 consists of step 1, step 2, and the test statistic in step 3 in part (b); and section 3 consists of the p-value in step 3 and step 4 in part (b). Sections 1, 2, and 3 are each scored essentially correct (E), partially correct (P), or incorrect (I). Section 1 is scored as follows:
Essentially correct (E) if the response satisfies the following three components: 1. Correctly states that it is reasonable to make a causal conclusion. 2. Justifies the causal conclusion based on random assignment of patients to procedures (or procedures
to patients); OR justifies the causal conclusion by stating that a randomized experiment was conducted.
3. Includes the context of the situation. Partially correct (P) if the response satisfies component 1 AND provides WEAK justification of the causal conclusion by stating that there was random assignment or a randomized experiment was conducted, but with no context; OR by stating that an experiment was conducted or there was assignment (without the word “randomized”) AND the response includes context of the situation; OR by stating that the study design reduces the chance of confounding variables or balances the effects of uncontrolled variables across both groups in context without explicitly referring to the random assignment.
Incorrect (I) if the response does not meet the criteria for E or P.

AP® STATISTICS 2018 SCORING GUIDELINES
© 2018 The College Board. Visit the College Board on the Web: www.collegeboard.org.
Question 4 (continued)
Notes: If the response states that it is not reasonable to make a causal conclusion because the result could
have been due to random chance AND explains that there is evidence for a causal conclusion based on random assignment of patients to procedures or by stating that a randomized experiment was conducted, then the response is scored E.
If the response discusses aspects of an experiment other than random assignment (such as, control, replication, or large samples), then those aspects are considered extraneous and the response can be scored E unless those aspects are incorrect for this study (such as, blocking is a requirement, or the study used blocking, or the study used a placebo) in which case the score should be lowered one level (that is, from E to P, or from P to I).
If the response correctly states in context that it is reasonable to make a causal conclusion but includes incorrect or contradictory justification (such as, random selection of patients), then the response is scored I.
Section 2 is scored as follows:
Essentially correct (E) if the response satisfies the following four components: 1. Parameters are defined correctly. 2. Hypotheses imply equality in the null and correct direction in the alternative. 3. Correct test is identified by name or formula. 4. Correct test statistic for a difference in means is calculated.
Partially correct (P) if the response satisfies only two or three of the four components. Incorrect (I) if the response satisfies at most one of the four components.
Notes:
If standard symbols are used for the parameters with appropriate group labels (such as, , S N ), component 1 is satisfied.
If the correct test is identified, but the response states an incorrect formula or uses incorrect notation in the formula, component 3 is not satisfied.
A pooled two-sample t-test is acceptable for component 3, but the student must also state and comment on the plausibility of the equal population variances assumption.
If the response identifies a z-test for equal means as the correct test identification, component 3 is not satisfied but component 4 could be satisfied.
Confidence Interval approach: If a single two-sample t-interval for the difference in means is used, components 3 and 4 can be
satisfied. Component 3 is satisfied if the t-interval is correctly identified by name or formula. Component 4 is satisfied if the correct interval is calculated. If an alpha level is stated, then an appropriate adjustment to the confidence level must be made because the appropriate test is one-sided.
If two one-sample t-intervals are used, while not a recommended approach, component 3 is not satisfied but component 4 could be satisfied. Component 4 is satisfied if both intervals are calculated correctly.

AP® STATISTICS 2018 SCORING GUIDELINES
© 2018 The College Board. Visit the College Board on the Web: www.collegeboard.org.
Question 4 (continued)
Section 3 is scored as follows:
Essentially correct (E) if the response satisfies the following three components: 1. Makes reference to an approximately correct p-value that is consistent with the test statistic and
alternative hypothesis for a difference in means. 2. Correctly justifies the conclusion based on the size of the p-value or the test statistic. 3. Correctly states the conclusion in context.
Partially correct (P) if the response satisfies only two of the three components.
Incorrect (I) if the response does not meet the criteria for E or P or includes a justification not based on the inferential results. Notes: Component 1:
Is satisfied if the response makes reference to a large test statistic without referring to a p-value. Component 2:
No alpha level is needed to provide justification of the conclusion based on the size of the p-value. Is satisfied if the response states the p-value without reference to size, but it is contiguous to the
conclusion and clearly indicates a continuous train of thought. A correct interpretation of the p-value with a complete explanation that obtaining a test statistic at
least this extreme is unlikely due to chance alone is considered justification based on the size of the p-value.
If an incorrect interpretation of the p-value is given, the score is lowered one level (that is, from E to P, or from P to I).
A decision about the null hypothesis (reject H0 or fail to reject H0) is not required, but if an incorrect decision is stated based on the given p-value then component 2 is not satisfied.
If a rejection region approach is used, a reasonable critical value replaces the p-value. Component 3:
A correct conclusion must be related to the alternative hypothesis in order to satisfy component 3. The following responses do not satisfy component 3:
o States or implies that the null hypothesis is accepted o States or implies that the alternative hypothesis has been proven o States the conclusion in past tense (unless the response did not satisfy a component of
section 2 for the use of past tense)

AP® STATISTICS 2018 SCORING GUIDELINES
© 2018 The College Board. Visit the College Board on the Web: www.collegeboard.org.
Question 4 (continued) Confidence Interval approach:
If a single two-sample t-interval for the difference in means is used: o Component 1 is satisfied if the response indicates that zero is either included or not included in
the calculated interval. o Component 2 is satisfied if the response indicates that the bounds are either both above or both
below zero (consistent with alternative hypothesis) and uses that as justification for the conclusion.
o Component 3 is satisfied if the conclusion is stated in context. If two one-sample t-intervals are used (which is not recommended) the response is scored at most P if
all three components are satisfied, otherwise scored I: o Component 1 is satisfied if the response states that the intervals do not overlap. o Component 2 is satisfied if the conclusion indicates that the confidence interval for the new
procedure lies below the confidence interval for the standard procedure. o Component 3 is satisfied if the conclusion is stated in context.
Note: If the three sections of the response are scored as E, to earn a score of 4 as a complete response, both conditions in step 2 must be correctly stated and justified. Additional condition(s) inappropriate for a two-sample t-test must not be stated. Otherwise, the response earns a score of 3 a substantial response.

AP® STATISTICS 2018 SCORING GUIDELINES
© 2018 The College Board. Visit the College Board on the Web: www.collegeboard.org.
Question 4 (continued) 4 Complete Response
Three sections essentially correct with conditions for inference 3 Substantial Response Three sections essentially correct without conditions for inference
OR Two sections essentially correct and one section partially correct
2 Developing Response Two sections essentially correct and no sections partially correct OR One section essentially correct and one or two sections partially correct OR Three sections partially correct 1 Minimal Response One section essentially correct OR No sections essentially correct and one or two sections partially correct

AP® STATISTICS 2018 SCORING GUIDELINES
© 2018 The College Board. Visit the College Board on the Web: www.collegeboard.org.
Question 5 Intent of Question The primary goals of this question were to assess a student’s ability to (1) determine which of two histograms represents data with a larger median; (2) calculate the mean of a combined data set when the separate means and sample sizes are known; and (3) calculate the probability that an individual randomly chosen from a finite population will have a value within one standard deviation of the mean, when provided with values for the mean, standard deviation, and all members of the population. Solution Part (a):
The median teaching year for High School A is any value with 100 data values at or below it and 100 data values at or above it. The median teaching year for High School B is the 111th value in the ordered list of values. For High School A the median is in the interval that starts at 7 and ends just before 10, because there are only 94 data values below 7 and 106 data values of at least 7. Therefore the median cannot be less than 7. For High School B the median is in the interval that starts at 4 and ends just before 7 because there are more than half (113) of the data values less than 7. Therefore the median must be less than 7. So High School A must be the one with a median of 7, and High School B must be the one with a median of 6. Another way to determine which school has the median of 7 is to notice that the distribution for High School B is highly skewed to the right, whereas the distribution for High School A is bimodal with a few possible outliers on the right. A distribution that is highly right-skewed is likely to have a substantially larger mean than median. The mean of both distributions is given as 8.2 years, so it makes sense that the highly right-skewed distribution (High School B) is the one with the bigger gap between the mean and median and, therefore, the one with the lower median of 6.
Part (b):
The mean for the original 200 teachers was given as 8.2 years, and the mean for the additional 18 teachers is 2.5 years. Therefore the mean for the combined data set is:
(200)(8.2) (18)(2.5) 1,640 457.73
200 18 218
years.
Part (c):
The interval mean plus or minus 1 standard deviation on either side of the mean is 8.2 7.2, or from 1.0 year to 15.4 years. Because teaching year is recorded as an integer, the interval includes teaching years 1 to 15. The number of teachers in that interval can be found by adding the heights of the five bars in the histogram for the intervals from 1 to 16, which includes 79 34 28 29 19 189. Therefore the
probability is 189 0.8552.221

AP® STATISTICS 2018 SCORING GUIDELINES
© 2018 The College Board. Visit the College Board on the Web: www.collegeboard.org.
Question 5 (continued) Scoring Parts (a), (b), and (c) are scored as essentially correct (E), partially correct (P), or incorrect (I). Part (a) is scored as follows:
Essentially correct (E) if the response satisfies the following three components: 1. States that the median is 6 for High School B and the median is 7 for High School A. 2. Provides a reasonable explanation of how the decision was made. 3. Provides the definition of the median or explicitly applies the definition of a median as a criterion in
reaching their decision.
OR Essentially correct (E) if the response satisfies the following three components:
1. States that the median is 6 for High School B and the median is 7 for High School A. 2. States that High School B shows a skewed distribution (or High School A shows a less skewed
distribution). 3. Provides a reasonable explanation of how the more skewed distribution (High School B) would be the
one with a larger separation between the mean and median. Partially correct (P) if the response satisfies the first component and only one of the other two components required for E. Incorrect (I) if the response does not meet the criteria for E or P.
Note: An incorrect statistical statement in the response will result in E being lowered to P, but not P being lowered to I. For example,
If either distribution is described as left skewed, normal, or approximately normal; If the discussion would indicate a median different than 7 for High School A or a median different
than 6 for High School B. Part (b) is scored as follows:
Essentially correct (E) if the response satisfies the following two components:
1. The correct answer that the mean is 7.73. 2. Enough work to show that the answer was obtained as a weighted average of the two individual
means. Partially correct (P) if the response satisfies only one of the two components. Incorrect (I) if the response does not satisfy the requirements for E or P.

AP® STATISTICS 2018 SCORING GUIDELINES
© 2018 The College Board. Visit the College Board on the Web: www.collegeboard.org.
Question 5 (continued) Part (c) is scored as follows:
Essentially correct (E) if the response satisfies the following three components: 1. Calculates that the appropriate interval is 1 to 15.4 or 1 to 15 teaching years. 2. Correctly sums the counts of data values in the numerator based on the intervals provided. 3. Computes the probability using 221 as the denominator.
Partially correct (P) if the response satisfies only two of the three components; OR if the response reports the correct probability (0.8552) without supporting work. Incorrect (I) if the response satisfies at most one of the three components. Notes:
If the response attempts to use the Empirical Rule or normal distribution to provide the desired probability, the response is scored I.
If an incorrect count is shown in component 2, for instance by including the interval from 16 to 19, then component 3 is satisfied if that incorrect count is divided by 221 to find the reported probability.
It is acceptable if the count is slightly off because of difficulty reading the exact heights of the bars in the histogram.
If only one of component 2 or component 3 is missing, but the correct probability (0.8552) is reported, the response can be scored E.
If the response recognizes that all values in the histogram bins up to 16 fall within one standard deviation of the mean and reports the interval as 1 to 16, component 1 is satisfied.

AP® STATISTICS 2018 SCORING GUIDELINES
© 2018 The College Board. Visit the College Board on the Web: www.collegeboard.org.
Question 5 (continued)
4 Complete Response Three parts essentially correct 3 Substantial Response Two parts essentially correct and one part partially correct OR Part (a) essentially correct and two parts partially correct 2 Developing Response Two parts essentially correct and no parts partially correct OR Part (b) or part (c) essentially correct and one or two parts partially correct OR Three parts partially correct 1 Minimal Response One part essentially correct OR No parts essentially correct and one or two parts partially correct

AP® STATISTICS 2018 SCORING GUIDELINES
© 2018 The College Board. Visit the College Board on the Web: www.collegeboard.org.
Question 6 Intent of Question The primary goals of this question were to assess a student’s ability to (1) describe what constitutes a Type II error for a specific hypothesis test; (2) specify a rejection region in terms of values of the sample mean; (3) compute the power of a test for a specific value in the alternative hypothesis; (4) recognize the definition of power; and (5) understand the impact of increasing the sample size on the power of a test. Solution Part (a):
A Type II error occurs when the alternative hypothesis is true, but the null hypothesis is not rejected. In this situation a Type II error would happen if the mean systolic blood pressure of the population of employees is greater than 122 mmHg, but the null hypothesis that it is 122 mmHg is not rejected. In other words a Type II error would happen if the mean blood pressure for the population of employees is higher than the national average, but the test does not conclude that it is higher.
Part (b):
The test is one-sided and the standard deviation is known, so the null hypothesis will be rejected if the test
statistic 0 1.645.
x
z
n
With 122, 15, and 100,n we get 122 1.645.1.5 x Therefore,
124.4675.x Part (c):
If the actual population mean is 125, with 15 and 100,n then the sampling distribution of x is
approximately normal with mean of 125 and standard deviation 15 1.5.100
Therefore,
124.4675 125( 124.4675) ( 0.355) 0.64.1.5
x
x
xP x P P z
Part (d):
The probability found in part (c) is called the power of the test.
Part (e):
If the sample size is increased from 100 to something larger, the probability of rejecting the null hypothesis when the population mean is 125 will be higher than it is for a sample of size 100. Intuitively, more data provide a higher probability of a correct conclusion. The technical explanation is that the rejection region will still be 1.645,z but the sampling distributions of the sample mean will have a smaller standard deviation; therefore, the minimum value of x for which we would reject the null hypothesis would be lower and, in return, the probability the null hypothesis is rejected will increase.

AP® STATISTICS 2018 SCORING GUIDELINES
© 2018 The College Board. Visit the College Board on the Web: www.collegeboard.org.
Question 6 (continued) Scoring This question is scored in three sections. Section 1 consists of part (a) and part (b), section 2 consists of part (c), and section 3 consists of part (d) and part (e). Sections 1, 2, and 3 are scored as essentially correct (E), partially correct (P), or incorrect (I). Section 1 is scored as follows:
Essentially correct (E) if the response satisfies the following four components: 1. Part (a) includes in the description of a Type II error the fact that the alternative hypothesis is true,
either generically or in context of the situation. 2. Part (a) includes in the description of a Type II error the fact that the null hypothesis is not rejected,
either generically or in context of the situation. 3. Part (b) includes a correct z-score for the upper 5 percent tail and indicates the correct direction for
the rejection region. 4. Part (b) includes 122 x , 1.5, x and the resulting x value.
Partially correct (P) if the response satisfies only two or three of the four components. Incorrect (I) if the response does not meet the criteria for E or P. Notes:
If the response in part (a) does not include context, the number of components satisfied is reduced by one (that is, from four to three, or from three to two, and so on). Context includes a reference to units, to blood pressure, to employees, etc.
If a response in part (a) is clearly referring to an individual’s blood pressure as opposed to the mean blood pressure of all employees, neither components 1 nor 2 are satisfied.
Section 2 is scored as follows:
Essentially correct (E) if the response satisfies the following three components: 1. Recognizes that the null hypothesis will be rejected when 124.4675,x as found in part (b). 2. Provides the correct sampling distribution for the sample mean when the true mean is 125, including
correct values for the mean and standard deviation, either explicitly or by plugging them into the test statistic formula.
3. Provides evidence of using the normal curve and finds the correct probability value. Partially correct (P) if the response satisfies only two of the three components. Incorrect (I) if the response does not meet the criteria for E or P. Notes:
Components 1 and 3 can still be satisfied if errors made in finding the rejection region in part (b) are carried into part (c).
A calculator statement that does not include labels for input values does not satisfy component 2 but may still satisfy components 1 and 3.

AP® STATISTICS 2018 SCORING GUIDELINES
© 2018 The College Board. Visit the College Board on the Web: www.collegeboard.org.
Question 6 (continued) Section 3 is scored as follows:
Essentially correct (E) if the response satisfies the following four components:
1. Part (d) specifies power as the name of the probability. 2. Part (e) correctly states that the probability would be greater. 3. Part (e) correctly implies that the standard deviation of the sampling distribution decreases, either
explicitly or by substituting values into a formula. 4. Part (e) indicates the minimum value of x for which the null hypothesis is rejected decreases, either
explicitly or by substituting values into a formula.
Note: Component 4 can still be satisfied if a response indicates that a maximum value of x for which the null hypothesis is rejected increases if this direction is consistent with answers in parts (b) and (c).
Partially correct (P) if the response satisfies only two or three of the four components. Incorrect (I) if the response does not meet the criteria for E or P.

AP® STATISTICS 2018 SCORING GUIDELINES
© 2018 The College Board. Visit the College Board on the Web: www.collegeboard.org.
Question 6 (continued)
4 Complete Response Three sections essentially correct 3 Substantial Response Two sections essentially correct and one section partially correct 2 Developing Response Two sections essentially correct and no sections partially correct OR One section essentially correct and one or two sections partially correct OR Three sections partially correct 1 Minimal Response One section essentially correct OR No sections essentially correct and two sections partially correct OR
Sections 1 and 2 incorrect, and section 3 partially correct with exactly three of the four components satisfied
OR Section 1 partially correct with exactly three of the four components satisfied, and sections 2 and 3 incorrect