Embed Size (px)
Citation preview

AP PHYSICS 1 - SUMMER ASSIGNMENT FOR 2016-2017
Dear Student:
The AP physics course you have signed up for is designed to prepare you for a superior performance on the AP test. To complete material in the textbook and still have fun, exciting and educational labs and associated lab reports we must pass quickly through dimensional analysis other basic topics.
I have included copies of chapters 1 and 2 of your textbook, a website to use and some basic Math questions, to warm you up for the beginning of fall semester with the following summer assignment.
No textbook is needed to complete the assignment but you are expected to have a text book on the first day of class. This summer assignment is due on 8-10-2016 at the beginning of class. The summer assignment is worth 100 homework points, written on a separate paper, with clear headings and your name. I will not accept summer assignment after the beginning of the lesson. Have it ready to hand in.
There will be a quiz on that first day of class. The text book has answers to the problems; if you have the book you can check your answers and do corrections.
Note if insufficient work is shown because it was all done on your calculator, your calculator will be credited with half the points for the summer assignment.
I will be available during the summer holidays at the following times June 17th till July 1st and from August 7th; you may contact me by e-mail to make arrangements to meet if you are having problems with the assignment. You should aim to start the assignment as soon as possible and to complete it before July 1st.
Sincerely
Mr D. Darling
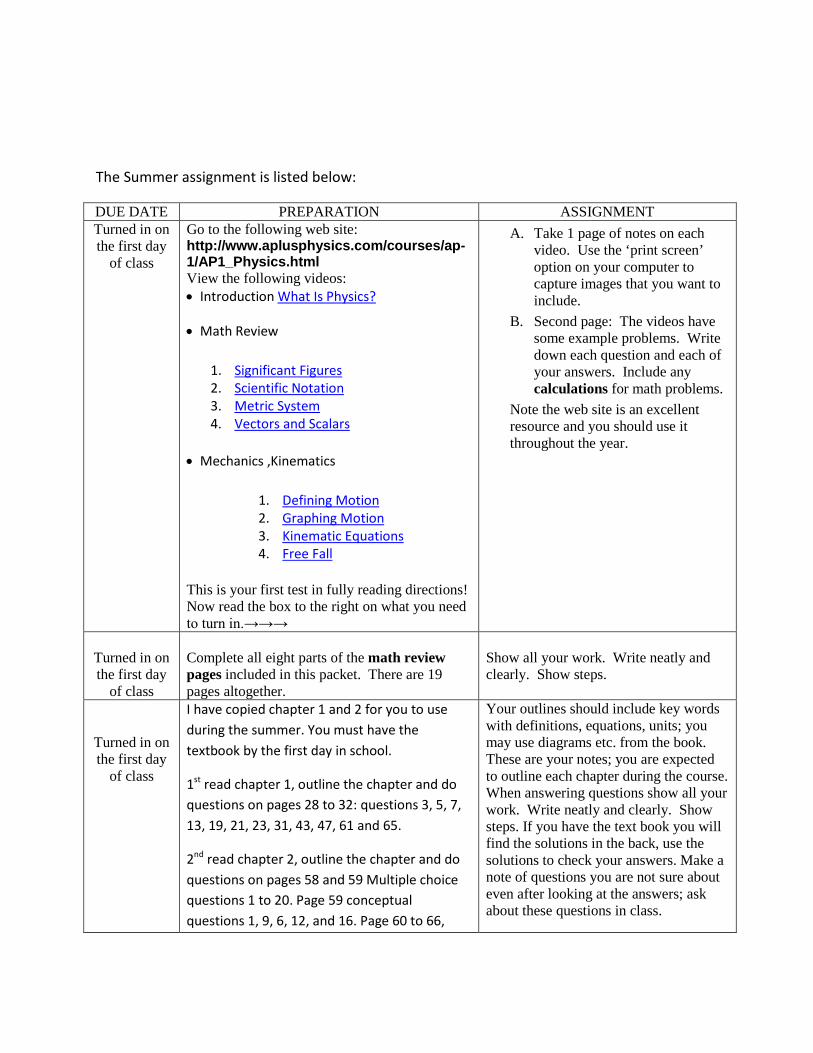
The Summer assignment is listed below:
DUE DATE PREPARATION ASSIGNMENT Turned in on the first day
of class
Go to the following web site: http://www.aplusphysics.com/courses/ap-1/AP1_Physics.html View the following videos: • Introduction What Is Physics?
• Math Review
1. Significant Figures 2. Scientific Notation 3. Metric System 4. Vectors and Scalars
• Mechanics ,Kinematics
1. Defining Motion 2. Graphing Motion 3. Kinematic Equations 4. Free Fall
This is your first test in fully reading directions! Now read the box to the right on what you need to turn in.→→→
A. Take 1 page of notes on each video. Use the ‘print screen’ option on your computer to capture images that you want to include.
B. Second page: The videos have some example problems. Write down each question and each of your answers. Include any calculations for math problems.
Note the web site is an excellent resource and you should use it throughout the year.
Turned in on the first day
of class
Complete all eight parts of the math review pages included in this packet. There are 19 pages altogether.
Show all your work. Write neatly and clearly. Show steps.
Turned in on the first day
of class
I have copied chapter 1 and 2 for you to use during the summer. You must have the textbook by the first day in school.
1st read chapter 1, outline the chapter and do questions on pages 28 to 32: questions 3, 5, 7, 13, 19, 21, 23, 31, 43, 47, 61 and 65.
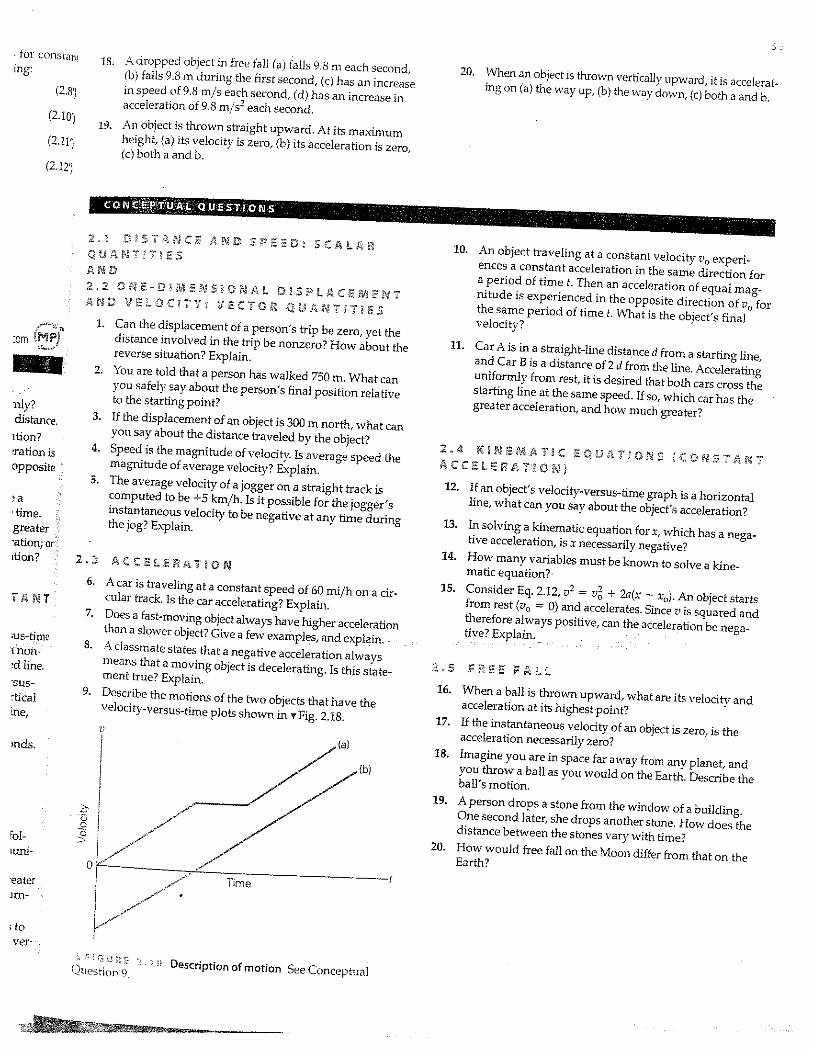
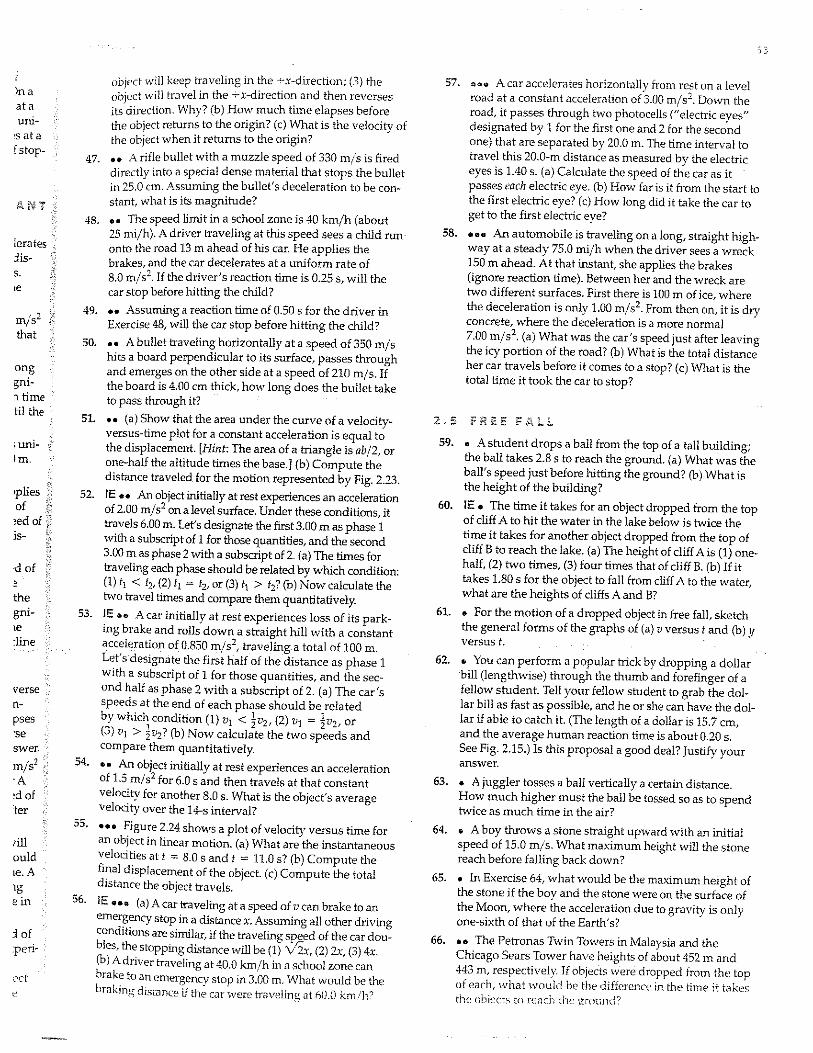
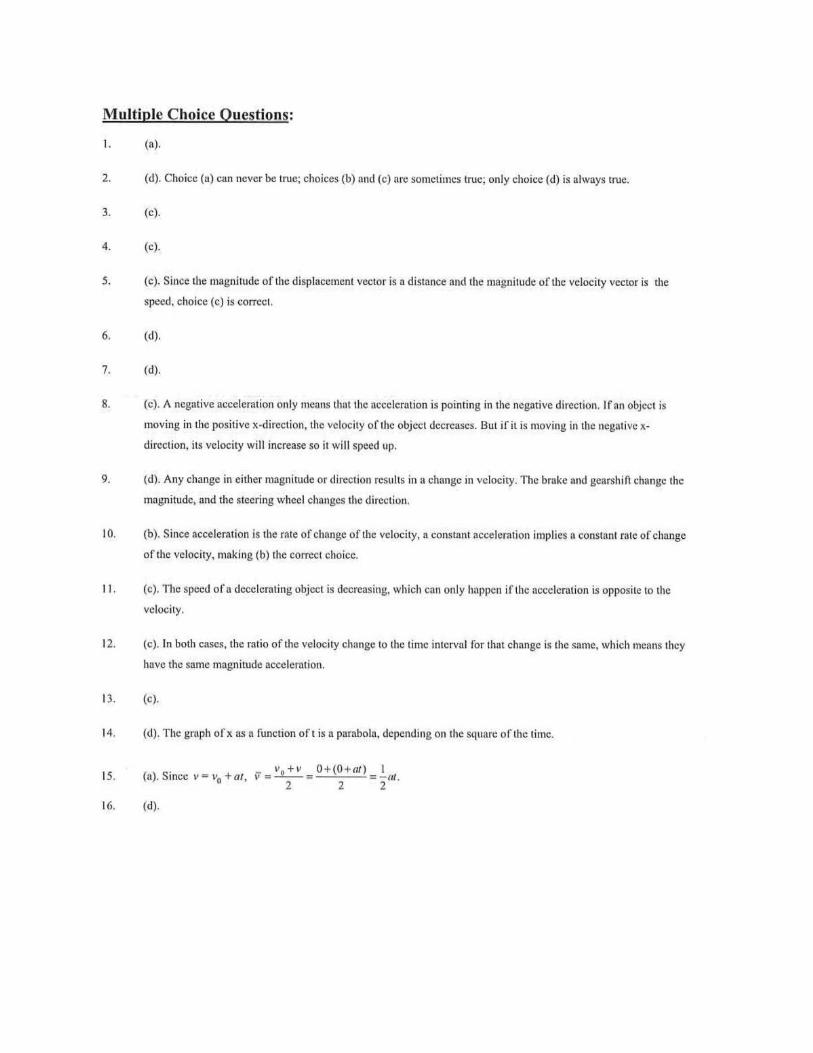
2nd read chapter 2, outline the chapter and do questions on pages 58 and 59 Multiple choice questions 1 to 20. Page 59 conceptual questions 1, 9, 6, 12, and 16. Page 60 to 66,
Your outlines should include key words with definitions, equations, units; you may use diagrams etc. from the book. These are your notes; you are expected to outline each chapter during the course. When answering questions show all your work. Write neatly and clearly. Show steps. If you have the text book you will find the solutions in the back, use the solutions to check your answers. Make a note of questions you are not sure about even after looking at the answers; ask about these questions in class.

questions:1,3,5,7,11,13,23,33,43,59.

Name
1
1. AP Physics – math review
PART I. SOLVING EQUATIONS
Solve the following equations for the quantity indicated.
1. y at=1
2
2 Solve for t
2. x v t ato= +1
2
2 Solve for vo
3. v ax= 2 Solve for x
4. av v
t
f o=
− Solve for t
5. av v
t
f o=
− Solve for vf

Name
2
6. F km m
r= 1 2
2 Solve for r
7. F km m
r= 1 2
2 Solve for m2
8. TL
g= 2π Solve for L
9. TL
g= 2π Solve for g
10. 1 1 1
f d do i
= + Solve for di
11. 21
2qV mv= Solve for v (not V and v are not the same quantity)

Name
3
12
PART II. SCIENTIFIC NOTATION
The following are ordinary physics problems. Write the answer in scientific notation and
simplify the units.
1. -2
3 2
4.5×10 kg2
2.0×10 kg ssT π= =
2. ( ) ( )2
2 416.6×10 kg 2.11×10 m s
2K = =
3. 2 9 9
9
2 2
N m (3.2 10 C)(9.6 10 C)9 10
C (0.32 m)
x xF x
− −− ⋅
= =
4. 2 2
1 1 1
4.5 10 9.4 10 pR= +
× Ω × Ω Rp =
5. ( ) ( )
( )
3 2
3
1.7×10 J - 3.3×10 J
1.7×10 Je = =

Name
4
6. ( ) ( )1.33 sin 25.0 1.50 sinθ=o θ =
7. -34 14 -1 -19
max (6.63 10 J s)(7.09 10 s ) - (2.17 10 J)=K = × ⋅ × ×
8. 8
8
1
2.25 10 m s1
3.00 10 m s
γ = =×
−×
PART III. FACTOR-LABEL METHOD FOR CONVERTING UNITS
A very useful method of converting one unit to an equivalent unit is called the factor-label
method of unit conversion. You may be given the speed of an object as 25 km/h and wish to
express it in m/s. To make this conversion, you must change km to m and h to s by multiplying
by a series of factors so that the units you do not want will cancel out and the units you want will
remain. Conversion: 1000 m = 1 km and 3600 s = 1 h,
25 km 1000 m 1 h
h 1 km 3600 s
=
What is the conversion factor to convert km/h to m/s?
What is the conversion factor to convert m/s to km/h?
Carry out the following conversions using the factor-label method. Show all your work!
1. How many seconds are in a year?

Name
5
2. Convert 28 km to cm.
3. Convert 45 kg to mg.
4. Convert 85 cm/min to m/s.
5. Convert the speed of light, 3x10⁸ m/s, to km/day.
6. Convert 823 nm to m
7. 8.8x10⁻⁸
m to mm
8. 1.5x10¹¹
m to µm
9. 7.6 m2 to cm
2
Name
6
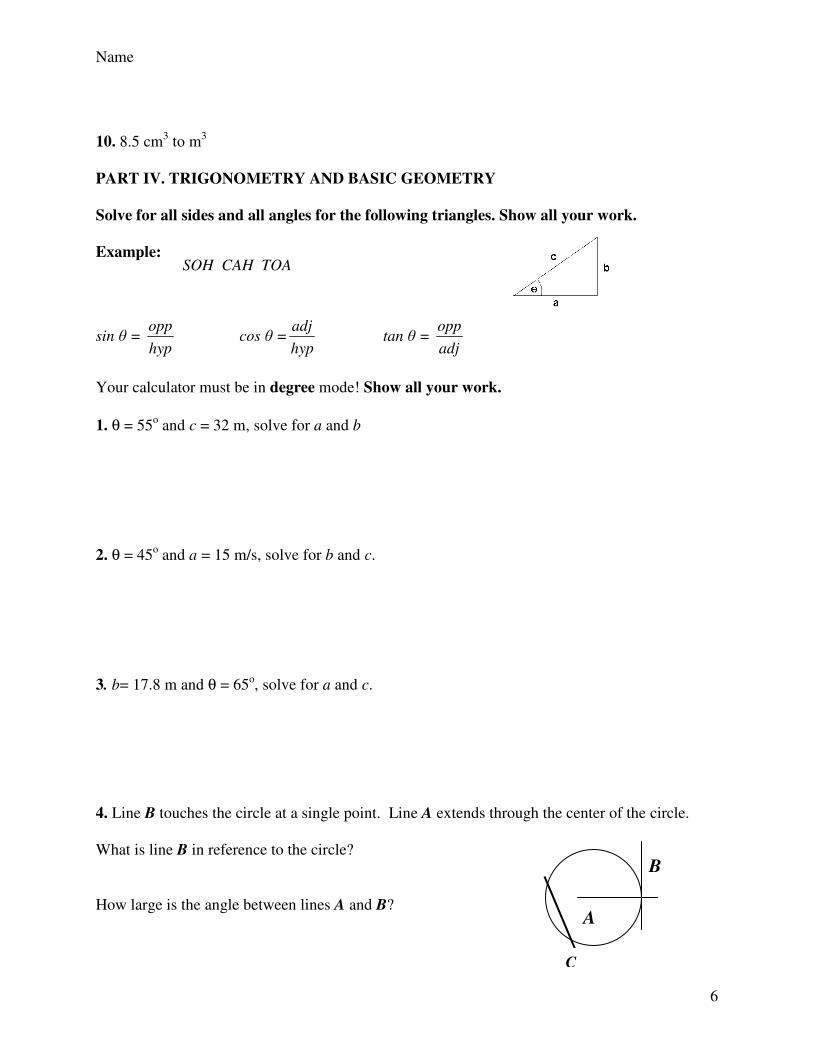
10. 8.5 cm3 to m
3
PART IV. TRIGONOMETRY AND BASIC GEOMETRY
Solve for all sides and all angles for the following triangles. Show all your work.
Example:
sin θ = opp
hyp cos θ =
adj
hyp tan θ =
opp
adj
Your calculator must be in degree mode! Show all your work.
1. θ = 55o and c = 32 m, solve for a and b
2. θ = 45o and a = 15 m/s, solve for b and c.
3. b= 17.8 m and θ = 65o, solve for a and c.
4. Line B touches the circle at a single point. Line A extends through the center of the circle.
What is line B in reference to the circle?
How large is the angle between lines A and B?
SOH CAH TOA
B
A
C

Name
7
What is line C?
5. Write down the magnitude of θθθθ
6. The radius of a circle is 5.5 cm,
a. What is the circumference in meters?
b. What is its area in square meters?
7. What is the area under the curve below? Show your work and include the appropriate units.
v (m/s)
t (s)
30º
θθθθ
4
20 12

Name
8
PART V. GRAPHING TECHNIQUES
Graph the following sets of data using proper graphing techniques.
The first column refers to the y-axis and the second column to the x-axis
1. Plot a graph for the following data recorded for an object falling from rest:
a. What kind of curve did you obtain?
b. What is the relationship between the variables?
c. What do you expect the velocity to be after 4.5 s?
Velocity
(ft/s) Time
(s)
32 1
63 2
97 3
129 4
159 5
192 6
225 7

Name
9
d. How much time is required for the object to attain a speed of 100 ft/s?
2. Plot a graph showing the relationship between frequency and wavelength of electromagnetic
waves:
a. What kind of curve did you obtain?
b. What is the relationship between the variables?
c. What is the wavelength of an electromagnetic wave of frequency 350 Hz?
d. What is the frequency of an electromagnetic wave of wavelength 375 m?
Frequency
(kHz) Wavelength
(m)
150 2000
200 1500
300 1000
500 600
600 500
900 333

Name
10
3. In an experiment with electric circuits the following data was recorded. Plot a graph with the
data:
a. What kind of curve did you obtain?
b. What is the relationship between the variables?
c. What is the power when the current is 3.2 A?
d. What is the current when the power is 64.8 W?
Current
(A) Power
(W)
1.0 1.0
2.5 6.5
4.0 16.2
5.0 25.8
7.0 50.2
8.5 72.0
Name
11
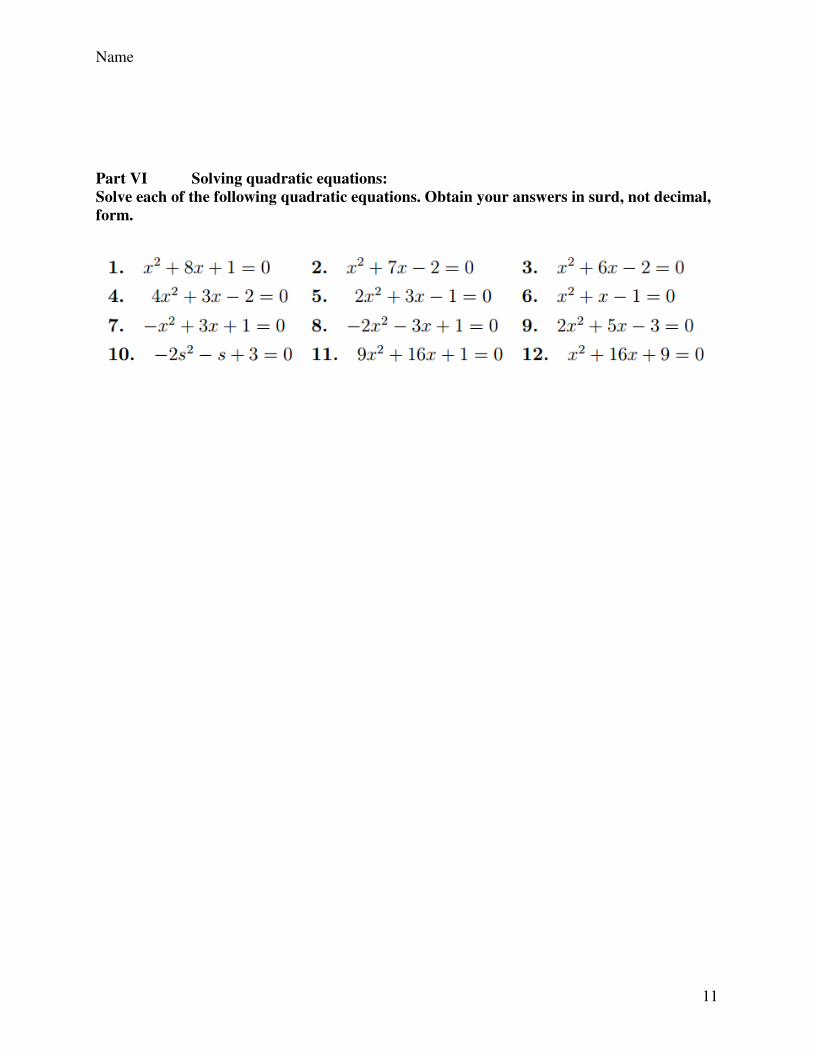
Part VI Solving quadratic equations:
Solve each of the following quadratic equations. Obtain your answers in surd, not decimal,
form.

Name
12

Name
13
Part VIIPart VIIPart VIIPart VII GraphsGraphsGraphsGraphs
Types of graphsTypes of graphsTypes of graphsTypes of graphs Graphs are VERY important in physics because they show patterns between variables. A straight line graph that starts from the (0,0) point is the best proof that two variables are directly proportional. Straight line graph You should know from your math that the general equation for a straight line is
baxy +=, where a is the gradient of the graph and b is the point that the line
cuts the y-axis.
You must also know from your maths the equation for a hyperbola, a parabola, an ellipse etc. Make your own table including all the graph shapes you know and their functions. Make sure you include the logarithmic and exponential functions. Search on line to find examples in Physics.
Function Graph Example in physics
baxy +=
x
y
a b

Name
14
Name
15
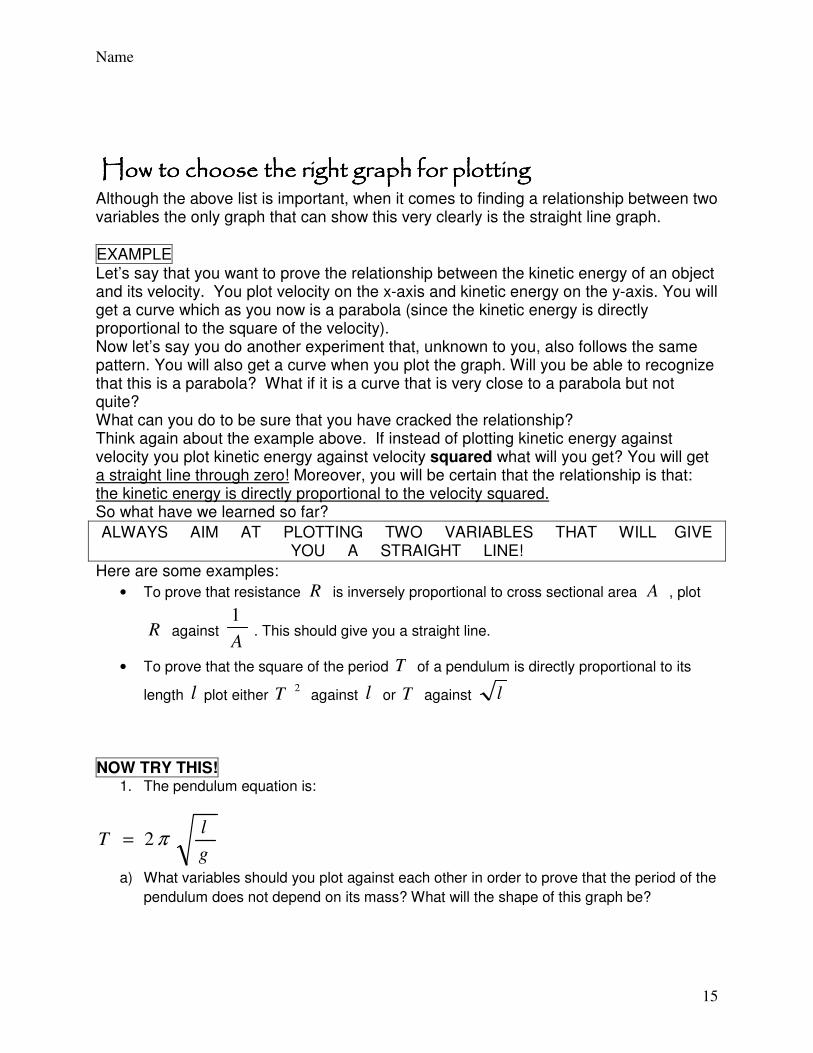
How to choose the right graph for plottingHow to choose the right graph for plottingHow to choose the right graph for plottingHow to choose the right graph for plotting Although the above list is important, when it comes to finding a relationship between two variables the only graph that can show this very clearly is the straight line graph.
EXAMPLE Let’s say that you want to prove the relationship between the kinetic energy of an object and its velocity. You plot velocity on the x-axis and kinetic energy on the y-axis. You will get a curve which as you now is a parabola (since the kinetic energy is directly proportional to the square of the velocity). Now let’s say you do another experiment that, unknown to you, also follows the same pattern. You will also get a curve when you plot the graph. Will you be able to recognize that this is a parabola? What if it is a curve that is very close to a parabola but not quite? What can you do to be sure that you have cracked the relationship? Think again about the example above. If instead of plotting kinetic energy against velocity you plot kinetic energy against velocity squared what will you get? You will get a straight line through zero! Moreover, you will be certain that the relationship is that: the kinetic energy is directly proportional to the velocity squared. So what have we learned so far?
ALWAYS AIM AT PLOTTING TWO VARIABLES THAT WILL GIVE YOU A STRAIGHT LINE!
Here are some examples:
• To prove that resistance R is inversely proportional to cross sectional area A , plot
R against A
1. This should give you a straight line.
• To prove that the square of the period T of a pendulum is directly proportional to its
length l plot either 2
T against l or T against l
NOW TRY THIS! 1. The pendulum equation is:
g
lT π2=
a) What variables should you plot against each other in order to prove that the period of the
pendulum does not depend on its mass? What will the shape of this graph be?
Name
16
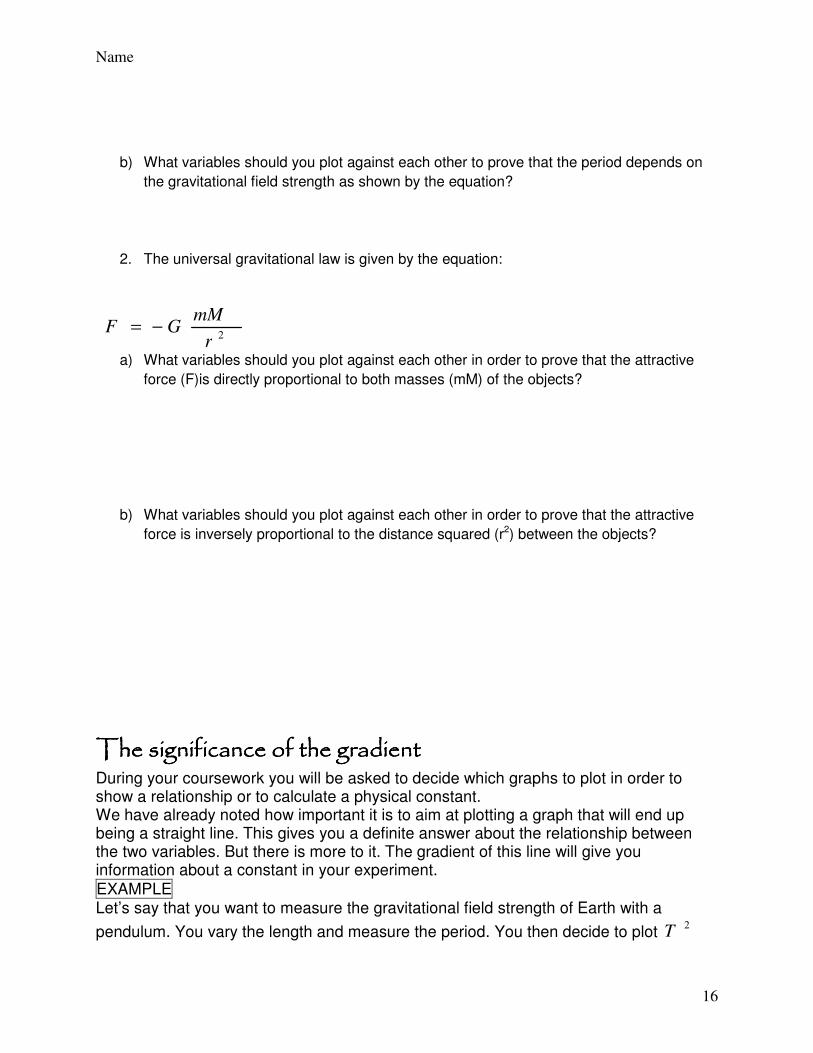
b) What variables should you plot against each other to prove that the period depends on
the gravitational field strength as shown by the equation?
2. The universal gravitational law is given by the equation:
2r
mMGF −=
a) What variables should you plot against each other in order to prove that the attractive
force (F)is directly proportional to both masses (mM) of the objects?
b) What variables should you plot against each other in order to prove that the attractive
force is inversely proportional to the distance squared (r2) between the objects?
The significance of the gradientThe significance of the gradientThe significance of the gradientThe significance of the gradient During your coursework you will be asked to decide which graphs to plot in order to show a relationship or to calculate a physical constant. We have already noted how important it is to aim at plotting a graph that will end up being a straight line. This gives you a definite answer about the relationship between the two variables. But there is more to it. The gradient of this line will give you information about a constant in your experiment.
EXAMPLE Let’s say that you want to measure the gravitational field strength of Earth with a
pendulum. You vary the length and measure the period. You then decide to plot 2
T

Name
17
against l . The graph will be a straight line. What will its gradient be? To find this, compare the pendulum equation with the straight line equation as shown below:
g
lT
22 4 π=
baxy +=
I hope you can see that y corresponds to2
T , x corresponds to l , b
corresponds to zero, and a corresponds to g
24 π
. This tells you that once you
measure the gradient from your graph you will know the value of g
24 π
and you will
then be able to calculate g from this as:
gradientg
ggradient
2244 ππ
=⇒=
NOW TRY THIS! Try to find the gradient in all the situations listed below. The first three have been done for you.
Equation Plot y against x gradient Constant
I
VR =
voltageaxisy
currentaxisx
:
:
−
−
Rgradient = (for a fixed
resistor)R
I
VR =
currentaxisy
voltageaxisx
:
:
−
−
Rgradient
1=
(for a fixed
resistor)R
l
xA
F
E =
extensionaxisy
forceaxisx
:
:
−
−
EA
lgradient =
gradientA
lE
×=
(Young’s modulus)
A
LR
ρ=
Raxisy
Laxisx
:
:
−
−
=gradient
=ρ
(resistivity)
A
LR
ρ=
Raxisy
Aaxisx
:
1:
−
−
=gradient =ρ
(resistivity)
Fsmv =2
2
1
(stopping distance-
velocity relationship)
saxisy
vaxisx
:
: 2
−
−
=gradient =F
(fricition)

Name
18
Lxd λ= (double slit
interference) xaxisy
daxisx
:
1:
−
−
=gradient =λ
(wavelength)
Lxd λ= (double slit
interference) xaxisy
Laxisx
:
:
−
−
=gradient =λ
(wavelength)
Apart from its use as explained above, the gradient in all lines (curved or straight) corresponds to the derivative of the function you plot. This is why if you plot time on the x-axis and displacement on the y-axis the gradient corresponds to the velocity of the object. If the line is curved the gradient does not stay the same, which means that it is equal to the instantaneous velocity of the object. For the same reason if you plot time on the x-axis and velocity on the y-axis the gradient corresponds to the acceleration of the object. If the line is curved the gradient does not stay the same, which means that it is equal to the instantaneous acceleration of the object.
The significance of the area under a graphThe significance of the area under a graphThe significance of the area under a graphThe significance of the area under a graph The area between a graph of y = f(x) and the x-axis is equal to the definite integral of the function. This formula gives a positive result for a graph above the x-axis, and a negative result for a graph below the x-axis. [9] This is why the area under a velocity-time graph is equal to the distance covered by the object. If the graph is a straight line then the area under can be calculated very precisely as the area of a triangle or trapezium etc. If the line is a curve, the area is often estimated to a good precision before it can give you some useful information.
Name
19
Part VIII Word problems Have a look at these word problems and try to solve them. Problem 1 Anna has 800 apples in baskets. Each basket holds 16 apples. How many baskets does she have?
Problem 2 John has 147 pears in 21 baskets. How many baskets does he need for 14 pears?
Problem 3 The weight of a 50.0 kg person on the moon is 80.0N. How much would a 72.0 kg person weigh on the moon?
Problem 4 When stereo sound information is transmitted through a cable, 32 bits are sent every 22.7µs. Calculate how many bits you can send during 2 seconds (2 s = 2 x 10⁶ µs)