Embed Size (px)
Citation preview

Volume 5 • Issue 1 • 1000215
Mod
ern
Chemistry & Applications
ISSN: 2329-6798
Modern Chemistry & ApplicationsLutsyk and Vorobeva, Mod Chem Appl 2017, 5:1
DOI: 10.4172/2329-6798.1000215
Research Article Open Access
Mod Chem Appl, an open access journalISSN: 2329-6798
Verification of Phase Diagrams by Three-Dimension Computer ModelsLutsyk VI1,2* and Vorob’eva1
1Institute of Physical Materials Science, Siberian Branch of Russian Academy of Sciences, Russia2Buryat State University Ulan-Ude, Russia
AbstractPresent paper is the survey of the works, dedicated to the elimination of contradictions in the publications, which
describe the calculated and/or experimental results of investigations of the three-component systems phase diagrams. Special approach to the construction of phase diagrams in the form of their assembling from the surfaces and the phase regions into the three-dimensional (3D) computer model as the effective tool of the detection of the incorrect interpretation of the obtained experiment or of errors in the thermodynamic calculations of the phase diagrams fragments, caused by a deficiency in the initial information, is proposed. 3D computer models of Au-Ge-Sn, Au-Ge-Sb, Ag-Au-Bi, Ag-Sb-Sn, Au-Bi-Sb T-x-y diagram are considered.
*Corresponding author: Lutsyk VI, Institute of Physical Materials Science,Siberian Branch of Russian Academy of Sciences, Russia, Tel: +79247514406;E-mail: [email protected]
Received February 28, 2017; Accepted March 10, 2017; Published March 15, 2017
Citation: Lutsyk VI, Vorob’eva (2017) Verification of Phase Diagrams by Three-Dimension Computer Models. Mod Chem Appl 5: 215. doi: 10.4172/2329-6798.1000215
Copyright: © 2017 Lutsyk VI, et al. This is an open-access article distributed under the terms of the Creative Commons Attribution License, which permits unrestricted use, distribution, and reproduction in any medium, provided the original author and source are credited.
Keywords: Phasediagrams; Computer simulation; Three-dimensional Visualization
IntroductionSuch known programs as Lukas Program, ThermoCalc, ChemSage,
FACTSage, MTDATA, PanEngine, PANDAT are created for the calculations of phase equilibria. Thanks to them it became possible the use of more realistic models of the thermodynamic properties of phases, the calculation of phase diagrams in the complex two-component systems and the systems with the large number of components. The CALPHAD-method, which makes possible to generalize and to refine within the framework information about the phase equilibria and the thermodynamics of phases for one model, is most claimed today. It is effective means for decreasing the volumes of the experiments, necessary for understanding of phase transformations in the alloys and the ceramics. The CALPHAD ideology became the powerful means of theoretical studies and obtaining of adequate information about the phase equilibria. Thermodynamic properties and phase diagrams for the technologically important multi-component materials can be predicted with its use. The reliable thermodynamic descriptions of two-component systems are the basis of the data bases with such characteristics. However, the CALPHAD application is limited by a deficiency in reliable thermodynamic data and the weak possibilities of the visualization of three-dimensional objects. In addition to this, using of thermodynamic methods of the states diagram calculating is hindered by the need of evaluating the thermodynamic properties of phases (in the absence of experimental data) and the agreement of experimental data of phase equilibria with the thermodynamic models. The innovation technology of assembling the space models of multidimensional phase diagrams from the entire totality of the geometric images corresponding to them is proposed: “To decode the diagrams topology the schemes of uni- and invariant states had been elaborated. This sort of schemes with phase’s routes designations makes possible to calculate the number of phase regions, surfaces and to know a type of every surface (plane, ruled or unruled surface). Detailed analysis of T-x-y diagrams geometrical constructions had been carried out with their aid, and their computer models had been designed” [1].
3D models of T-x-y diagrams: Approaches, the principles of the construction
Basic principle of the design of the three-dimensional (3D) computer model of the ternary system T-x-y diagram is the assembling of three-dimensional objects of its surfaces and phase regions [2]. The 3D model constructing is fulfilled in several stages: 1) the two-dimensional (2D) table and then the 3D scheme of uni- and invariant states (planes of invariant reactions and ruled surfaces), 2) the prototype
(unruled surfaces), 3) transformation of the prototype into the real system model. It should be noted that, as many geometrically simple diagrams are already described in the known monographs (for instance, [3,4], therefore the Reference book of 3D and 4D models of virtual T-x-y and T-x-y-z diagrams of basic topological types is created (look about it, for instance, in [5]. And to construct the real system T-x-y diagram of a simple topology it suffices to take from the Reference book the finished model (or the combination of two-three simple models). The 3D model is obtained after the input of the concrete coordinates of base points (corresponding to invariant transformations in the binary and ternary system) and correction of the curvature of T-x-y diagram lines and surfaces. For instance, the liquidus of the Au-Ge-Sn=A-B-C phase diagram with six binary compounds (incongruently melting R1, R2 of the variable and R4=AuSn2, R5=AuSn4 of the constant concentration (R5 is decomposed below 49.8°C), R3=AuSn is the stoicheometry congruently melting compound, R6=Au5Sn exists below 179.3°C) is the result of triangulation by the quasi-binary Ge-AuSn section, and each subsystem (Au-Ge-AuSn and AuSn-Ge-Sn) is the double combination of the classical topological type of the T-x-y diagram with a incongruently melting binary compound. But both subsystems are formed by two incongruently compounds (Figure 1). And the sub-solidus is complicated by the allotropy of tin (transformation of 2 modifications at low, ∼13°C, temperatures). First step of the 3D model design is the analysis of the T-x-y diagram geometric structure using the uni- and invariant states scheme. This is the usual Sheil’ phase reactions scheme [6], the trajectories of a change in the concentrations of the interacting phases in which are written below each three-phase reaction [2] (Tables 1 and 2). The first (with highest temperature) and second (with lowest one) points are accepted as the base points for each trajectory. They obtain designations (for instance, Table 1 and Figure 1): binary eutectic “e” and peritectic “p” with the subscripts eAB, eBC, pAR1, etc; concentrations of appropriate solid phases “AB” and “BA” as participants of, for instance, the eutectic reaction L→A+B; liquid concentrations in ternary eutectic “E”, quasi-

Volume 5 • Issue 1 • 1000215Mod Chem Appl, an open access journalISSN: 2329-6798
Citation: Lutsyk VI, Vorobeva VP (2017) Verification of Phase Diagrams by Three-Dimension Computer Models. Mod Chem Appl 5: 215. doi: 10.4172/2329-6798.1000215
Page 2 of 10
phase transformation, then, it is possible to construct, for instance, for the Au-Ge-Sn system the quadrangle AQ1BQ1Q1R1Q1 and other 8 complexes of different types for reactions Q2-Q5, E1-E4 (Table 1). Then it makes possible to draw three lines eABQ1, ABAQ1, BABQ1 as the directing ones and to obtain the prototype of the three-phase region L+A+B. The preliminary contours of other three-phase regions are depicted analogously. The 3D uni- and invariant states scheme is so constructed. Next step is to obtain the prototype of the T-x-y diagram by designing of the liquidus, solidus, solvus, transus surfaces. And last step includes the refinement of the curvature of the directing curves of ruled surfaces, closing the contours of unruled surfaces by curves of binary systems and correcting their isothermal lines. In this stage the 3D model of the real system T-x-y diagram is formed. Finished T-x-y diagram 3D model allows to construct any arbitrarily assigned sections and to calculate mass balances of the coexisting phases in all stages of the crystallization for any arbitrarily assigned concentration [8]. Furthermore, the option of the determination of conditions for changing the type of three-phase reaction in any three-phase region is provided in 3D models [9]. Moreover 3D computer models of phase diagrams are an effective tool for the verification of those experimentally constructed isothermal sections and isopleths for checking the correctness of the interpretation of data, obtained from the experiment and the thermodynamic calculation [10,11]. The quality of each model depends on completeness and authenticity of initial data. But, independent of the initial information, even primitive initial model is capable to carry out such very important function as searching of contradictions in the description of phase diagrams geometric structures or data, obtained from the different publications. Such possibilities of 3D models can be seen on the examples of the using of the metal systems T-x-y diagrams - the bases of the creation of the materials, promising as the lead-free solders. Initial data for these 3D models are taken from the special atlases of phase diagrams for Pb-free solders [7,12]. Their authors carried out for each system thorough selection and agreement of experimental data, which was being accompanied by the necessary thermodynamic calculations in the CALPHAD-technology. The additional experiment was fulfilled in the absence or the doubtfulness of data. Final result for each phase diagram of ternary system was represented in the form of the table of invariant reactions, x-y projection of liquidus and two-three isothermal sections and isopleths. Nevertheless, in spite of so scrupulous selection of represented data, they are not always deprived of contradictions. It should be noted that the 3D computer models construction is accompanied by the re-designation of components and compounds. For instance, Au, Ge, Sn, low-temperature modification of tin, six binary compounds are denoted in the Au-Ge-Sn T-x-y diagram 3D model, correspondingly, as A, B, C, C1, R1, R2, etc. This makes it possible to avoid confusion in the designations, accepted in the CALPHAD, where it is taken into consideration for the designation of phases their crystal structure. For instance, compounds AuSn4 and AuSn are denoted in atlases of phase diagrams for lead-free solders in the volume, devoted to binary systems as AUSN4 и AU1SN, correspondingly, but in other volume of the same series as PTSN4_TYPE and NIAS_TYPE. Both germanium and low-temperature modification of tin are designated by the same symbol DIAMOND_A4 (of their structure prototype).
Au-Ge-Sb: “Template” for the Au-Ge-Sb T-x-y diagram can be taken from the Reference book and, after input the coordinates (concentration-temperature) of base points, after the correction of the curvature of lines and surfaces, to obtain the 3D model of the real Au-Ge-Sb T-x-y diagram with the compound AuSb2 (Figure 2). In this case the comparison of the 3D model isopleths 17 at % Ge (Figure 3b) with that published (Figure 3a) makes it possible to reveal immediately the
peritectic “Q”, peritectic “P”, etc invariant reactions; concentrations of appropriate solid phases “AQ1”, “BQ1”, “R1Q1” (corresponding, for instance, to the reaction Q1: L+A→B+R1). Superscript “0” is assigned to based points of the temperature scale (on the lower face of the trigonal prism of the T-x-y diagram). These trajectories together with the appropriate lines of binary systems form the contours of the diagram surfaces [1]: curves eABQ1, pAR1Q1, corresponding to the liquid L, belong to inner contours of the liquidus surfaces (liquidus – qA, qB, qR1, etc), and appropriate them curves ABAQ1 and AR1AQ1 belong to the solidus surfaces (solidus - sA, sB, sR1, etc). The binary combinations of such lines are the directing curves for three ruled surfaces (ruled - superscript “r”) on the boundaries of the three-phase region. Since these curves belong to the contours of liquidus (q) or solidus (s), than ruled surfaces on the boundaries of the region L+A+B are designated as qr
AB, qrBA, sr
AB. If both the directing curves of a ruled surface are located on the contour of solidus surface, such ruled surface of “solidus type” is designated by the letter “s”. For instance, the solidus type ruled surface sr
AB has directing curves ABAQ1 and AR1AQ1, which belong to contours of solidus surfaces sA and sB. But if one of the directing curve (eABQ1) belongs to the liquidus surface (qA), then the ruled surface is named as “the liquidus type” (qr
AB). As a result, according to the uni- and invariant states schema of the Au-Ge-Sn system (Table 1), one should expect besides six invariant four-phase transformations (two – eutectic E1, E2 and four quasi-peritectic Q1, Q2, Q3, Q4), indicated in the quasi-peritectictoid Q5: R2+R3→B+R6 and the eutectoid E3: R5→B+C+R4 interactions, and also the polymorphous transformation E4: C→C1+B+R4 in the sub-solidus. These “derived” from the uni- and invariant states scheme solid-phase invariant transformations Q5, E3, E4 are confirmed by the isopleths [7]. Thus, according to the uni- and invariant states scheme, the Au-Ge-Sn=A-B-C T-x-y diagram consists of 173 surfaces (8 - liquidus and 8 - solidus, 38 - solvus, 2 - transus, 81 ruled surfaces and 9 horizontal (isothermal) planes-complexes, corresponding to invariant reactions in the ternary system, and each of them is divided into 4 simplexes. Surfaces are borders of 65 phase regions (8 two-phase L+I with liquid (I=A, B, C, R1-R5), 10 one-phase (I=A, B, C, C1, R1-R6), 20 two-phase I+J without liquid, 13 three-phase L+I+J with liquid, 14 three-phase I+J+K without liquid). Further the tabular (2D) scheme is transferred into the graphic 3D form. Since the horizontal (isothermal) plane or the complex, which consists of four simplexes, corresponds to each four-
Figure 1: X-Y projection of the Au-Ge-Sn=A-B-C T-x-y diagram 3D computer model.

Volume 5 • Issue 1 • 1000215Mod Chem Appl, an open access journalISSN: 2329-6798
Citation: Lutsyk VI, Vorobeva VP (2017) Verification of Phase Diagrams by Three-Dimension Computer Models. Mod Chem Appl 5: 215. doi: 10.4172/2329-6798.1000215
Page 3 of 10
error of the latter: the intersection of the liquidus curve and the ruled surface section on the border of the regions L+Ge and L+Ge+Sb. It is worthwhile to note that the analogous section, parallel to side Au-Sb, but at other distance from Ge (not 17 at %, but 15 at %), in other paper, devoted to this system [13], is also constructed. The sections of liquidus and ruled surface are passed closely, but they do not intersect each other in this section.
Ag-Au-Bi: Despite the fact that the information, placed into the atlas, was thoroughly checked (according to its authors), the description of the Ag-Au-Bi system is contradictory: in the binary system Au-Bi, cited according to the data [14-19], the compound Au2Bi decomposes at the temperature 110°C, whereas the solid solution on its basis in the ternary system isopleths exists also at 0°C (Figures 4c and 4d). To understand these contradictions, it is necessary to discuss the papers [14-18], the information from which in the form of an isothermal section and four isopleths were included into the atlas. The Ag-Au-Bi=A-B-C T-x-y diagram has a simple geometric construction. It is formed by binary systems: with continuous series of solid solutions (Ag-Au=A-B), an eutectic (Ag-Bi=A-C), and an eutectic-peritectic (Au-
Bi=B-C) with the binary incongruently melting compound Au2Bi=R. Liquidus consists of three fields of primary crystallization of: bismuth, solid solution based on the binary compound Au2Bi=R and the solid solution Ag(Au)=A(B). Liquidus surfaces intersect in the curves, connecting the binary eutectics eAC and eCR and the peritectic pBR (Figure 4) with the point Q, corresponding to the invariant quasi-peritectic reaction L+Ag(Au)→Bi+Au2Bi or L+A(B)→C+R. The compound Au2Bi exists up to 50°C according to the 2005 year paper [14] (Figure 5a). This compound decomposes at 110°C (Figure 5b) according to the 2006 year work [16], and these data, as the most reliable, were chosen for the atlas [12]. However, the solid solution based on Au2Bi occurs in isopleths of below by temperatures from 450K [17] and to 0°C [12], in the phase regions with the lowest temperatures. But if this compound decomposes in the binary system Au-Bi at 110°C, then the solid solution on its basis must indeed decompose, also, in the Ag-Au-Bi ternary system. This problem may be resolved by means of the 3D model too. In order to demonstrate this contradiction graphically, two versions of the 3D computer model of the T-x-y diagram were constructed: in one version the compound Au2Bi decomposes in the
Table 1: Uni- and invariant states scheme of the Au-Ge-Sn=A-B-C system. A>B>pAR1>pR1R2>eBR3>R3 >eAB>Q1>Q2>pR3R4>Q3>eR2R3>E1>pR4R5> >Q4>C>eBC>eCR5>>E2>pR6
R2R3>Q5>eR5CR4>E3>C1>eC
C1R4>eCBC1>E4

Volume 5 • Issue 1 • 1000215Mod Chem Appl, an open access journalISSN: 2329-6798
Citation: Lutsyk VI, Vorobeva VP (2017) Verification of Phase Diagrams by Three-Dimension Computer Models. Mod Chem Appl 5: 215. doi: 10.4172/2329-6798.1000215
Page 4 of 10
Y Y Y Y Y
L+A→R1 pAR1Q, AR1AQ, R1AR1Q
L→B+R1 eBR1E, BR1B(C)E, R1BR1E
R1→A+B R1R1Y, ABAY, BAB(C)Y
Q: L+A→R1+R2
L→R1+R2 QE, R1QR1E, R2QR2E
E: L→B(C)+R1+R2
B(C)+R1+R2 B(C)EB(C)Y, R1ER1Y, R2ER2Y
Y: R1→A+B(C)+R2
A+B(C)+R2 AYA0 , B(C) B(C)0 , R2 R20
L+C→R2 pCR2E, CR2CE, R2CR2E
L→A+R2
eAR2Q, AR2AQ, R2AR2Q
A+R1+R2
AQAY, R1QR1Y, R2QR2Y
A-B A-B-C A-C B-C
Table 2: Uni- and invariant states scheme of the Au-Bi-Sb=A-B-C system. A>C>pCR2>pAR1>eAR2>Q>B>eBR1>E>Y
Figure 2: The Au-Ge-Sb=A-B-C T-x-y diagram 3D computer model (a), its x-y projection (b).
Figure 3: Isopleth 17 at% Ge of the Au-Ge-Sb system
Volume 5 • Issue 1 • 1000215Mod Chem Appl, an open access journalISSN: 2329-6798
Citation: Lutsyk VI, Vorobeva VP (2017) Verification of Phase Diagrams by Three-Dimension Computer Models. Mod Chem Appl 5: 215. doi: 10.4172/2329-6798.1000215
Page 5 of 10
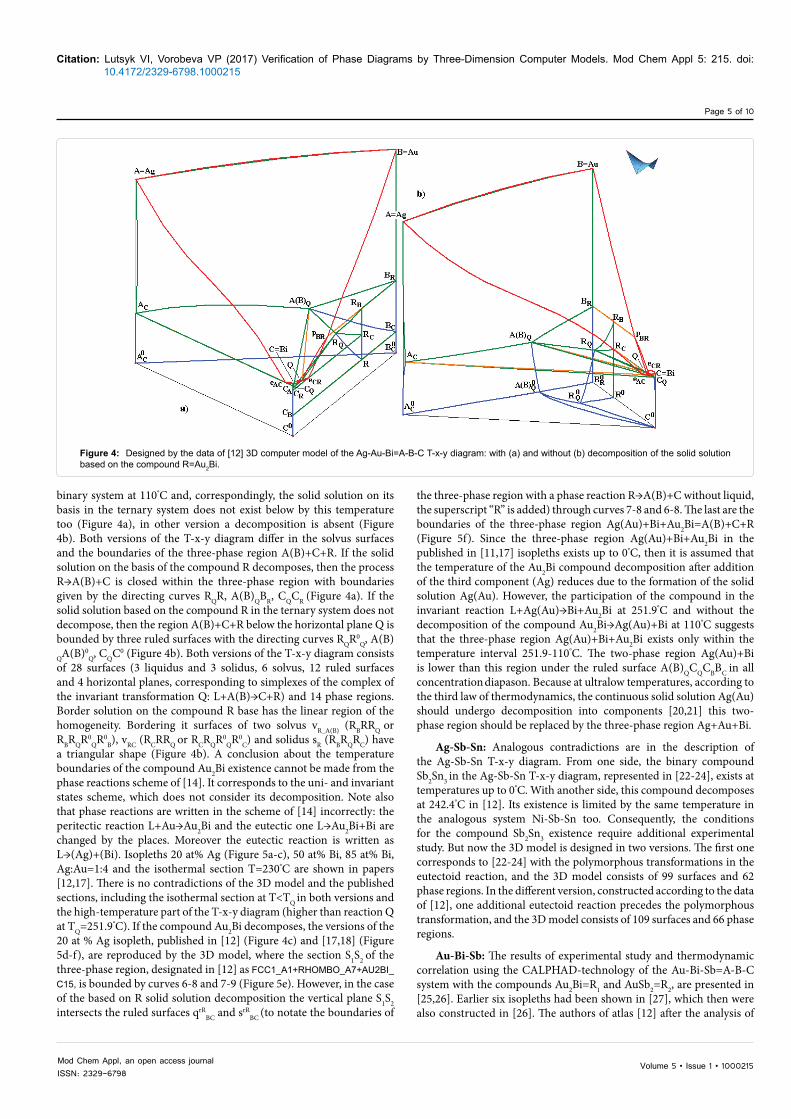
binary system at 110°C and, correspondingly, the solid solution on its basis in the ternary system does not exist below by this temperature too (Figure 4a), in other version a decomposition is absent (Figure 4b). Both versions of the T-x-y diagram differ in the solvus surfaces and the boundaries of the three-phase region A(B)+C+R. If the solid solution on the basis of the compound R decomposes, then the process R→A(B)+C is closed within the three-phase region with boundaries given by the directing curves RQR, A(B)QBR, CQCR (Figure 4a). If the solid solution based on the compound R in the ternary system does not decompose, then the region A(B)+C+R below the horizontal plane Q is bounded by three ruled surfaces with the directing curves RQR0
Q, A(B)QA(B)0
Q, CQC0 (Figure 4b). Both versions of the T-x-y diagram consists of 28 surfaces (3 liquidus and 3 solidus, 6 solvus, 12 ruled surfaces and 4 horizontal planes, corresponding to simplexes of the complex of the invariant transformation Q: L+A(B)→C+R) and 14 phase regions. Border solution on the compound R base has the linear region of the homogeneity. Bordering it surfaces of two solvus vR_A(B) (RBRRQ or RBRQR0
QR0B), vRC (RCRRQ or RCRQR0
QR0C) and solidus sR (RBRQRC) have
a triangular shape (Figure 4b). A conclusion about the temperature boundaries of the compound Au2Bi existence cannot be made from the phase reactions scheme of [14]. It corresponds to the uni- and invariant states scheme, which does not consider its decomposition. Note also that phase reactions are written in the scheme of [14] incorrectly: the peritectic reaction L+Au→Au2Bi and the eutectic one L→Au2Bi+Bi are changed by the places. Moreover the eutectic reaction is written as L→(Ag)+(Bi). Isopleths 20 at% Ag (Figure 5a-c), 50 at% Bi, 85 at% Bi, Ag:Au=1:4 and the isothermal section T=230°C are shown in papers [12,17]. There is no contradictions of the 3D model and the published sections, including the isothermal section at T<TQ in both versions and the high-temperature part of the T-x-y diagram (higher than reaction Q at TQ=251.9°C). If the compound Au2Bi decomposes, the versions of the 20 at % Ag isopleth, published in [12] (Figure 4c) and [17,18] (Figure 5d-f), are reproduced by the 3D model, where the section S1S2 of the three-phase region, designated in [12] as FCC1_A1+RHOMBO_A7+AU2BI_C15, is bounded by curves 6-8 and 7-9 (Figure 5e). However, in the case of the based on R solid solution decomposition the vertical plane S1S2 intersects the ruled surfaces qrR
BC and srRBC (to notate the boundaries of
the three-phase region with a phase reaction R→A(B)+C without liquid, the superscript “R” is added) through curves 7-8 and 6-8. The last are the boundaries of the three-phase region Ag(Au)+Bi+Au2Bi=A(B)+C+R (Figure 5f). Since the three-phase region Ag(Au)+Bi+Au2Bi in the published in [11,17] isopleths exists up to 0°C, then it is assumed that the temperature of the Au2Bi compound decomposition after addition of the third component (Ag) reduces due to the formation of the solid solution Ag(Au). However, the participation of the compound in the invariant reaction L+Ag(Au)→Bi+Au2Bi at 251.9°C and without the decomposition of the compound Au2Bi→Ag(Au)+Bi at 110°C suggests that the three-phase region Ag(Au)+Bi+Au2Bi exists only within the temperature interval 251.9-110°C. The two-phase region Ag(Au)+Bi is lower than this region under the ruled surface A(B)QCQCBBC in all concentration diapason. Because at ultralow temperatures, according to the third law of thermodynamics, the continuous solid solution Ag(Au) should undergo decomposition into components [20,21] this two-phase region should be replaced by the three-phase region Ag+Au+Bi.
Ag-Sb-Sn: Analogous contradictions are in the description of the Ag-Sb-Sn T-x-y diagram. From one side, the binary compound Sb2Sn3 in the Ag-Sb-Sn T-x-y diagram, represented in [22-24], exists at temperatures up to 0°C. With another side, this compound decomposes at 242.4°C in [12]. Its existence is limited by the same temperature in the analogous system Ni-Sb-Sn too. Consequently, the conditions for the compound Sb2Sn3 existence require additional experimental study. But now the 3D model is designed in two versions. The first one corresponds to [22-24] with the polymorphous transformations in the eutectoid reaction, and the 3D model consists of 99 surfaces and 62 phase regions. In the different version, constructed according to the data of [12], one additional eutectoid reaction precedes the polymorphous transformation, and the 3D model consists of 109 surfaces and 66 phase regions.
Au-Bi-Sb: The results of experimental study and thermodynamic correlation using the CALPHAD-technology of the Au-Bi-Sb=A-B-C system with the compounds Au2Bi=R1 and AuSb2=R2, are presented in [25,26]. Earlier six isopleths had been shown in [27], which then were also constructed in [26]. The authors of atlas [12] after the analysis of
Figure 4: Designed by the data of [12] 3D computer model of the Ag-Au-Bi=A-B-C T-x-y diagram: with (a) and without (b) decomposition of the solid solution based on the compound R=Au2Bi.

Volume 5 • Issue 1 • 1000215Mod Chem Appl, an open access journalISSN: 2329-6798
Citation: Lutsyk VI, Vorobeva VP (2017) Verification of Phase Diagrams by Three-Dimension Computer Models. Mod Chem Appl 5: 215. doi: 10.4172/2329-6798.1000215
Page 6 of 10
Figure 5: Binary system Au-Bi according to the data of [12] (a) and [17] (b): isopleth S1(0.2, 0.8, 0)-S2(0.2, 0, 0.8) of the Ag-Au-Bi; [12] (c): [17] (d): 3D model, designed according to the data of [12] with (e) and without (f) decomposition of the solid solution based on the compound R=Au2Bi.

Volume 5 • Issue 1 • 1000215Mod Chem Appl, an open access journalISSN: 2329-6798
Citation: Lutsyk VI, Vorobeva VP (2017) Verification of Phase Diagrams by Three-Dimension Computer Models. Mod Chem Appl 5: 215. doi: 10.4172/2329-6798.1000215
Page 7 of 10
these publications preferred the results of the data of [26], but correcting and obtaining “the better agreement in comparison with the experimental results”. The region of the homogeneity of the solid solution Bi(Sb)=B(C) is shown in [26] in the isothermal section 300°C. Analogous section is used for the illustration of the phase diagrams calculation results by the method of the convex hulls [28]. However, the binary system Bi-Sb adjoins not with the solid solution B(C) region, but with the two-phase region Bi(Sb)+AuSb2=B(C)+R2, containing the compound with the third component (gold), in the same section, published in the atlas and in [25]. So, versions of the Au-Bi-Sb T-x-y diagram 3D computer model were also used for explaining this contradiction in iso- and the polythermal sections, constructed by the different authors. Each version is designed according to the data of concrete publication and reproduces all given there sections and projections. This makes it possible to compare the sections of diagrams, obtained from different works. According to the atlas data, two invariant reactions – quasi-peritectic Q: L+A→R1+R2 at 296°C and eutectic E: L→B(C)+R1+R2 at 239.2°C with participation of the solid solution of bismuth with antimony B(C) takes a place in the Au-Bi-Sb system. However, the Au2Bi=R1 compound decomposes in the binary system at 110°C and it is absent in the atlas sections at temperatures lower than 110°C. Consequently, it is necessary to add into the phase reactions scheme the invariant decomposition Y: R1→A+B(C)+R2 (Table 2). Formal enumeration of surfaces and phase regions gives according to the uni- and invariant states scheme (Table 2) 4 liquidus and 4 solidus surfaces, 12 surfaces of solvus, the cupola of the disintegration of the solid solution B(C), 3 complexes of the invariant reactions (Q at 296°C, E at 239.2°C, Y at ∼110°C), divided each into 4 horizontal triangular simplexes, 15 ruled surfaces or borders of 5 three-phase regions with liquid and 12 ruled surfaces as borders of 4 three-phase regions without liquid. Concentration coordinates (0, 0.948, 0.052) of the vertex B(C)E of the complex, which corresponds to the eutectic reaction in the ternary system, are indicated in the atlas [12], as if this point belongs to the Bi-Sb=B-C binary system. Since this is impossible, the point B(C)E was displaced in the computer model inside the prism to position (0.010, 0.948, 0.042). Because of this the solidus sB(C) surface ceased to belong to edge B-C. Surfaces of solidus (sR1) and solvus (vR1A, vR1_B(C), vR1R2), corresponding to the stoichiometric compound R1, which does not exist below 110°C, practically coincide with the vertical line R1 within the temperature interval 377.5-110°C, where 377.5°C is the temperature of the peritectic pAR1. Border solution based on the compound R2 has the linear homogeneity region. The part of the solidus sR2 (R2AR2QR2ER2C) corresponding to it takes the triangular shape R2CR2AR2Q, and the line R2QR2E coincides with the line R2CR2E (Figure 6a). Analogously the surfaces of solvus vR2A (R2AR2QR2YR2
0), vR2_B(C) (R2CR2ER2YR2
0), vR2R1 (R2QR2ER2Y) have in the same plane the configurations with the triangular fragments vR2A (R2AR2QR2Y), vR2_B(C) (R2CR2ER2Y), vR2R1 (R2QR2ER2Y), corresponding to the solidus sR2. But since in the Au-Sb=A-C system the compound R2 is stoichiometric, and points R2
°A and R2
°C, practically coincide with the vertical line in the
point R2, they are supplemented in the ternary system by the point, denoted in the uni- and invariant states scheme (Table 2) as R2
0Y, they all
obtains the same designation R2°, corresponding to the prism base
(Figure 6a). So, the Au-Bi-Sb T-x-y diagram consists of 60 surfaces and 24 phase regions, including six surfaces (sR1, vAB(C), vAR1, vR1A, vR1_B(C), vR1R2), which practically degenerated in the vertical lines A and R1 and four surfaces (sr
AR1, qrR1
A_B(C), vrAR1_(Q), v
rAR2_(Y)) practically coincided with
the A-B and A-C edges of the prism. Since this 3D model corresponds to the basic principles of geometric thermodynamics (the phase rule and the law of adjoining phase regions), then it makes it possible to explain the reasons for contradictions in the publications of different authors. The curve of the solid solution Bi(Sb) disintegration on Bi and
Sb is depicted at temperatures lower than 200°C in the published in [12] the Bi-Sb binary system phase diagram (Figure 7). This curve obviously assigns the solid solution disintegration cupola in the Au-Bi-Sb ternary system. Track of a section can be seen in the atlas [12] in the 20 at % Bi isopleth (Figure 8a). However the two-phase region Bi+Sb is denoted in this section as the three-phase : Bi+Sb+AuSb2=B+C+R2 (or RHOMBO_A7+RHOMBO_A7+AUSB2 in the designations of [12]). The two-phase region Bi(Sb)+AuSb2=B(C)+R2 (RHOMBO_A7+AUSB2) is denoted above it. Thus, the phase regions, which contain the compound with gold, adjoin with the binary system, formed by bismuth and antimony. Perhaps, the authors [12] were mistaken in the designations of these phase regions, and the compound AuSb2=R2 should be removed, after renaming the two-phase region to the single-phase (the solid solution of bismuth with antimony), and the three-phase to the two-phase (disintegration of this solid solution). But the single-phase region RHOMBO_A7 would then be adjacent to three-phase regions Bi(Sb)+Au 2Bi+AuSb 2=B(C)+R1+R2(RHOMBO_A7+AU2BI_C15+AUSB2) and L+Bi(Sb)+AuSb2=L+B(C)+R2 (L+RHOMBO_A7+AUSB2is not designed in [12], violating the law of adjoining phase regions. As was mentioned above, authors of [12] preferred the results of the work [26]. It is necessary to note that the binary system Bi-Sb is examined in [26] at temperatures above 500 K – above the binodal curve and the temperature 400 K is the minimum in all isopleths. The disintegration cupola of the solid solution Bi(Sb) is absent in the sections, published in [26], and it is possible only to assume that it would appear at temperatures below 400 К. However, there is no contradiction in the designations of phase regions, because the single-phase region of the solid solution Bi(Sb) adjoins directly to the Bi-Sb system as, for instance, in the 20 at % Bi isopleth (Figure 8c). On the other hand, the binodal curve assigns the region of the disintegration of the solid solution in the Bi-Sb binary system, and it can be seen the track of its section not only in isopleths in the atlas [12] (Figure 8a), but also in the paper [25], moreover with the same contradictory designations of phase regions near the Bi-Sb system. To explain the reasons of the contradiction in determining phase regions and to understand, whether the authors considered the decomposition of the solid solution Bi(Sb)=B(C) in the binary system Bi-Sb, on the one hand in the publications [12,25], and in [26,27] on the other hand, three versions of the Au-Bi-Sb T-x-y diagram 3D model were designed according to the data of [12] (Figure 6), [25] and [26]. In contrast to [12], the compounds Au2Bi=R1 and AuSb2=R2 are treated as stoichiometric in [25], and there is no disintegration of the solid solution Bi(Sb) in [26]. If “no”, then isopleths in [26] (Figure 8c) and [27] are accurate. And they, like the corresponding 3D model isopleth (Figure 8d), depicts the boundaries of the solid solution Bi(Sb)=B(C) region as traces of sections of the surfaces of solidus and solvus (curves 5-6 and 6-18). They are very close to the temperature axis and are hard to see, but they are present in the sections. If “yes”, and the solid solution decomposes in the system Bi-Sb, then a curve corresponds to it in the T-x diagram (Figure 7). It generates the disintegration cupola in the ternary system, which is present in the isopleths of [12] (Figure 8a) and [25]. In that case errors in the designations of phase regions in these papers are connected with the fact that the sections of the solidus sB(C) and solvus vB(C)_R2 surfaces - curves 5-6, 6-20 (Figure 8b) are lost in the appropriate sections of the 3D models. At the same time, it should be noted that the curve of solvus (the curve 6-18 in Figure 8d) of the model section cannot be very close to the temperature axis, when the disintegration cupola is present, which in this case must be assumed, also, in the section, constructed in [26] Figure 8c. They should move away from the axis in order “to give a place” for the trace of the section of the disintegration cupola, as in Figure 8b. Thus, the final version of the T-x-y diagram 3D computer model consists of 60 surfaces and 24

Volume 5 • Issue 1 • 1000215Mod Chem Appl, an open access journalISSN: 2329-6798
Citation: Lutsyk VI, Vorobeva VP (2017) Verification of Phase Diagrams by Three-Dimension Computer Models. Mod Chem Appl 5: 215. doi: 10.4172/2329-6798.1000215
Page 8 of 10
Figure 6: 3D computer model of the Au-Bi-Sb=A-B-C T-x-y diagram, designed according to data [12], but with the added surfaces of solidus sB(C) and solvus vB(C)_R2. (a); x-y projection (b).
Figure 7: Binary system Bi-Sb [12] (the axis of temperature is marked in °C).
phase regions and reproduced the data of [12], but with the added surfaces of solidus sB(C) and solvus vB(C)_R2. Traces of these surfaces are shown by dashed lines on the 20 at% Bi isopleth (Figure 8b).
ConclusionIt is convenient to use the 3D computer models of T-x-y diagrams,
designed according to the data of the different authors, for the agreement of the sections and for searching of contradictions in calculations or incorrect interpretation of experiment. Despite the fact that the binary system Au-Bi is well studied [14,16,19] and it shown in the publications
[16,19] that the solid solution on basis of the compound Au2Bi does not exist in the ternary system at temperatures below 110°C, the analysis of isopleths, carried out with the aid of two versions of the Au-Ag-Bi T-x-y diagram 3D computer model, constructed according to the data [12,17], showed that the decomposition this solid solution was not considered in [12] and [17]. Therefore the low-temperature part of these sections must be corrected. The correct form of section is shown in the Figure 5f. In order to be confident in the correctness of the Au-Sb-Sn system description in [22-24], it is necessary to explain, actually the compound Sb2Sn3 is decomposed at 242.2°C as in [12], or the

Volume 5 • Issue 1 • 1000215Mod Chem Appl, an open access journalISSN: 2329-6798
Citation: Lutsyk VI, Vorobeva VP (2017) Verification of Phase Diagrams by Three-Dimension Computer Models. Mod Chem Appl 5: 215. doi: 10.4172/2329-6798.1000215
Page 9 of 10
Figure 8: Isopleth S1(0, 0.2, 0.8)-S2(0.8, 0.2, 0) of the Au-Bi-Sb: [12] (a): [26] (c): and 3D models according to data [12] (b): (the axis of temperature is marked in °C)
and [26] (d): (sections of the added surfaces of solidus sB(C) and solvus vB(C)_R2. are drawn with dashed lines).
temperature boundaries of its existence are stretched to 0°C as it shown in [22] Fragment of the 17 at % Ge isopleth is not correctly in Figure 8 The analysis, carried out with the aid of three versions of the Au-Bi-Sb T-x-y diagram 3D computer model for publications [12,25,26], showed that: a) sections of the solidus sB(C) and solvus vB(C)_R2 surfaces in isopleths of the 3D computer models by curves 5-6 and 6-20 (Figure 8b), 5-6 and 6-18 (Figure 5d), are missed in sections of the diagram in [12] (Figure 8a) and in [25] b) phase regions Bi(Sb) and Bi+Sb are missed in the same sections in [12] (Figure 8a) and in [25];c) the cupola of the solid solution Bi(Sb) disintegration to bismuth and antimony (Figure 8c), which is assigned by the binodal of the Bi-Sb binary system [12], is lost in [26] (Figure 6). Most preferable is the version of the T-x-y diagram 3D model, which is reconstructed according to the data of [12], but with the added surfaces of solidus sB(C) and solvus
vB(C)_R2 (Figure 6). At the same time, it is possible only to speak, that the structure of the ternary system phase regions near the binary system Bi-Sb at temperatures below 150°C is contradictory and requires an additional experimental study.
Acknowledgements
This work was been performed under the program of fundamental research SB RAS (Project 0336-2016-0006), it was partially supported by the RFBR (Projects 15-43-04304, 17-08-00875) and the RSF (Project 17-19-01171).
References
1. Lutsyk V, Vorob’eva (2009) From topology to computer model: ternary systems with polymorphism. Abstracts of the international conference on phase diagram calculations and computational thermochemistry (CALPHAD XXXVIII), Prague, Czech Republic, p: 66.

Volume 5 • Issue 1 • 1000215Mod Chem Appl, an open access journalISSN: 2329-6798
Citation: Lutsyk VI, Vorobeva VP (2017) Verification of Phase Diagrams by Three-Dimension Computer Models. Mod Chem Appl 5: 215. doi: 10.4172/2329-6798.1000215
Page 10 of 10
2. Lutsyk VI, Vorob’eva (2010) Computer models of eutectic-type T-x-y diagramswith allotropy. Two inner liquidus fields of two low-temperature modifications of the same component. J Therm Anal Calorim 101: 25-31.
3. Rhines FN (1956) Phase Diagrams in Metallurgy: Their development andapplication. McGraw-Hill Book Company, MC. New York-Toronto-London.
4. Prince A (1966) Alloy Phase Equilibria. Elsevier Publ Comp Amsterdam-London, New York.
5. Lutsyk VI, Vorob’eva, Zelenaya AE (2015) 3D reference book on the oxidesystems space diagrams as a tool for data mining. Solid State Phenomena230: 51-54.
6. Lukas HL, Henig ET, Petzow G (1986) 50 Years Reaction Scheme after Erich Scheil. Z Metallkd 76: 360-367.
7. Dinsdale A, Kroupa A, Watson A (2012) COST Action MP0602 - Handbook ofhigh-temperature lead-free solders - Atlas of phase diagrams 1: 218.
8. Lutsyk VI, Vorob’eva (2016) 3D model of the T-x-y diagram of the Bi-In-Snsystem for designing microstructure of alloys. Rus J Inorg Chem 61: 188-207.
9. Lutsyk VI, Vorob’eva, Shodorova SY (2015) Determining the conditions forchanges of the three-phase rreaction type in a V-Zr-Cr systems. Rus J PhysChem A 89: 2331-2338.
10. Lutsyk VI, Vorob’eva, Shodorova SY (2016) Verification of the T-x-y diagram of the Ag-Au-Bi system using a 3D computer model. Rus J Inorg Chem 61: 858-866.
11. Lutsyk VI, Vorob’eva (2015) Three-dimensional model of phase diagram of Au-Bi-Sb system for clarification of thermodynamic calculations. Rus J Phys Chem A 89: 1715-1722.
12. Dinsdale A, Watson A, Kroupa A (2008) Atlas of phase diagrams for lead-freesoldering compiled by COST 531 1: 277.
13. Wang J, Leinenbach C, Roth M (2009) Thermodynamic description of the Au-Ge-Sb ternary system. J Alloys Compd 485: 577-582.
14. Zoro E, Dichi E, Servant C, Legendre B (2005) Phase equilibria in the Ag-Au-Bi ternary system. J Alloys Compd 400: 209-215.
15. Zoro E, Boa D, Servant C, Legendre B (2005) Enthalpies of mixing of the liquid phase in the ternary system Ag-Au-Bi. J Alloys Compd 398: 106-112.
16. Servant C, Zoro E, Legendre B (2006) Thermodynamic reassessment of theAu-Bi system. CALPHAD 30: 443-448.
17. Zoro E, Servant C, Legendre B (2007) Thermodynamic assessment of the Ag-Au-Bi system. CALPHAD 31: 89-94.
18. Zoro E, Servant C, Legendre B (2007) Thermodynamic assessment of the Ag-Au-Bi and Ag-Au-Sb systems. J Therm Anal Calorim 90: 347-353.
19. Chevalier PY (1988) Thermodynamic evaluation of the Au-Bi system.Thermochim Acta 130: 15-24.
20. Zakharov AM (1990) State diagrams of binary and ternary systems.
21. Fedorov PP (2010) Third law of thermodynamics as applied to phase diagrams. Rus J Inorgan Chem 55: 1722-1739.
22. Chen SW, Chen PY, Wu HJ, Chiu CN, Huang YC, et al. (2008) Phase equilibria of Sn-Sb-Ag ternary system (I): experimental. Metall Mater Trans A 39: 3191-3198.
23. Gierlotka W, Huang YC, Chen SW (2008) Phase equilibria of Sn-Sb-Ag ternary system (II): calculation. Metall Mater Trans 39: 3199-3209.
24. Chen SW, Chen CC, Gierlotka W, Zi AR, Chen PY, et al. (2008) Phase equilibria in the Sn-Sb binary system. J Electron Mater 37: 992-1002.
25. Manasijevic D, Minic D, Zivkovic D, Zivkovic Z (2008) Experimental study andthermodynamic calculation of Au-Bi-Sb system phase equilibria. J Phys ChemSolids 69: 847-851.
26. Wang J, Meng FG, Liu HS, Liu LB, Jin ZP (2007) Thermodynamic modeling of the Au-Bi-Sb ternary system. J Electron Mater 36: 568-577.
27. Prince A, Raynor GV, Evans DS (1990) Phase diagrams of ternary gold alloys, London: the Institute of Metals.
28. Voskov AL, Dzuban AV, Maksimov AI (2015) TernAPI program for the calculation of ternary phase diagrams with isolated miscibility gaps by the convex hullmethod. Fluid Phase Equilibria 388: 50-58.


![Mod Chem appl 2017, 5:2 Ap d e r n licatModern Chemistry & … · 2019-06-24 · processes, borax is reacted with aqueous hydrochloric acid or nitric acid [7,8]. The production cost](https://img.dokumen.tips/doc/110x75/5e7428c3e7bf600c19103604/mod-chem-appl-2017-52-ap-d-e-r-n-licatmodern-chemistry-2019-06-24-processes.jpg)


