Embed Size (px)
Citation preview
AP Biology Ecology Name _________________________
Block_____
AP Biology Summer Assignment
Ecology is a broad subject that can be used to connect many topics in AP biology. You will find
in many of the essay questions that one part of the questions relates to ecology so we will start
with that so we can refer to it throughout the school year. This will also be one of the first grades
you have in the grade book for this class.
In this packet you will find reading guides, virtual labs, a formal lab rubric, and a chart to fill out
to help with the vocabulary associated with ecology.
This packet will be turned in for a grade you should answer all the questions with complete
sentences, a big part of this class is being about to write about science. The Population biology
lab will be done in the packet just perform the lab fill out the data table and answer the questions
in complete sentences. The “Sex and the Single Guppy Lab” will be a separate lab grade. The
single guppy lab will be typed and completed using the lab rubric, you will not have to do all the
parts just the ones listed in the lab, please read carefully so that you do not miss any of the
points. While we may not have a summative assessment you will see these topics throughout the
course and the completion and understanding of this material is important.
Because we have not handed out books yet you will use this link to get to a free text book that
will help you complete the reading guides.
Openstaxcollege.org/textbooks/biology/resources
The Single Guppy Lab will be typed handed in for a separate grade on September 11 or 12.
This packet is due on September 17 and 18.
If you have questions as you work through this please email Mrs Crumbliss or Mrs Hertema
[email protected] or [email protected]
Please remember it is summer and we may not check emails every day.
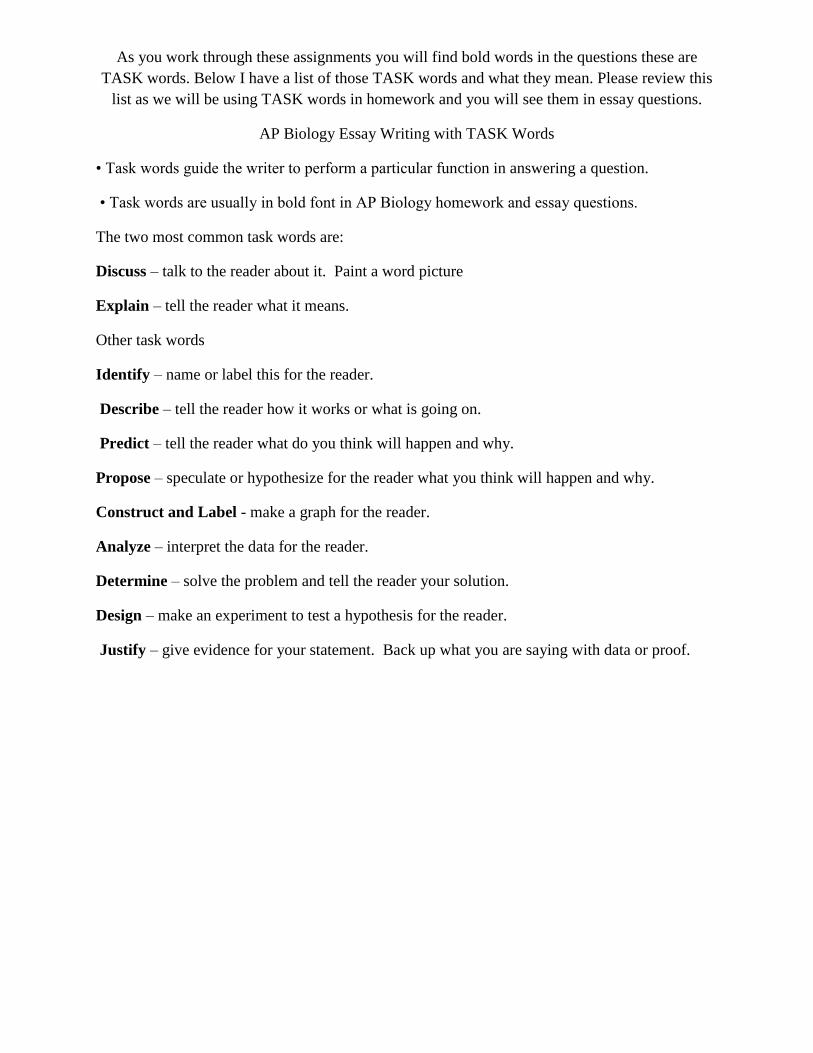
As you work through these assignments you will find bold words in the questions these are
TASK words. Below I have a list of those TASK words and what they mean. Please review this
list as we will be using TASK words in homework and you will see them in essay questions.
AP Biology Essay Writing with TASK Words
• Task words guide the writer to perform a particular function in answering a question.
• Task words are usually in bold font in AP Biology homework and essay questions.
The two most common task words are:
Discuss – talk to the reader about it. Paint a word picture
Explain – tell the reader what it means.
Other task words
Identify – name or label this for the reader.
Describe – tell the reader how it works or what is going on.
Predict – tell the reader what do you think will happen and why.
Propose – speculate or hypothesize for the reader what you think will happen and why.
Construct and Label - make a graph for the reader.
Analyze – interpret the data for the reader.
Determine – solve the problem and tell the reader your solution.
Design – make an experiment to test a hypothesis for the reader.
Justify – give evidence for your statement. Back up what you are saying with data or proof.
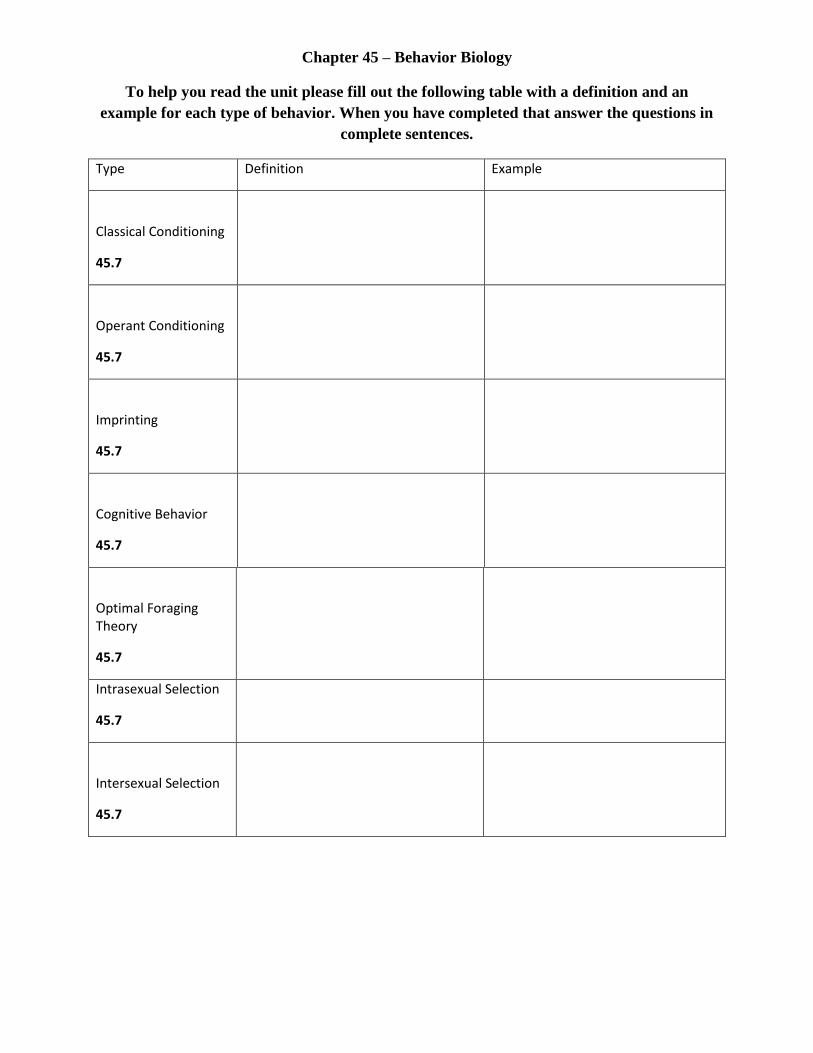
Chapter 45 – Behavior Biology
To help you read the unit please fill out the following table with a definition and an
example for each type of behavior. When you have completed that answer the questions in
complete sentences.
Type Definition Example
Classical Conditioning
45.7
Operant Conditioning
45.7
Imprinting
45.7
Cognitive Behavior
45.7
Optimal Foraging Theory
45.7
Intrasexual Selection
45.7
Intersexual Selection
45.7
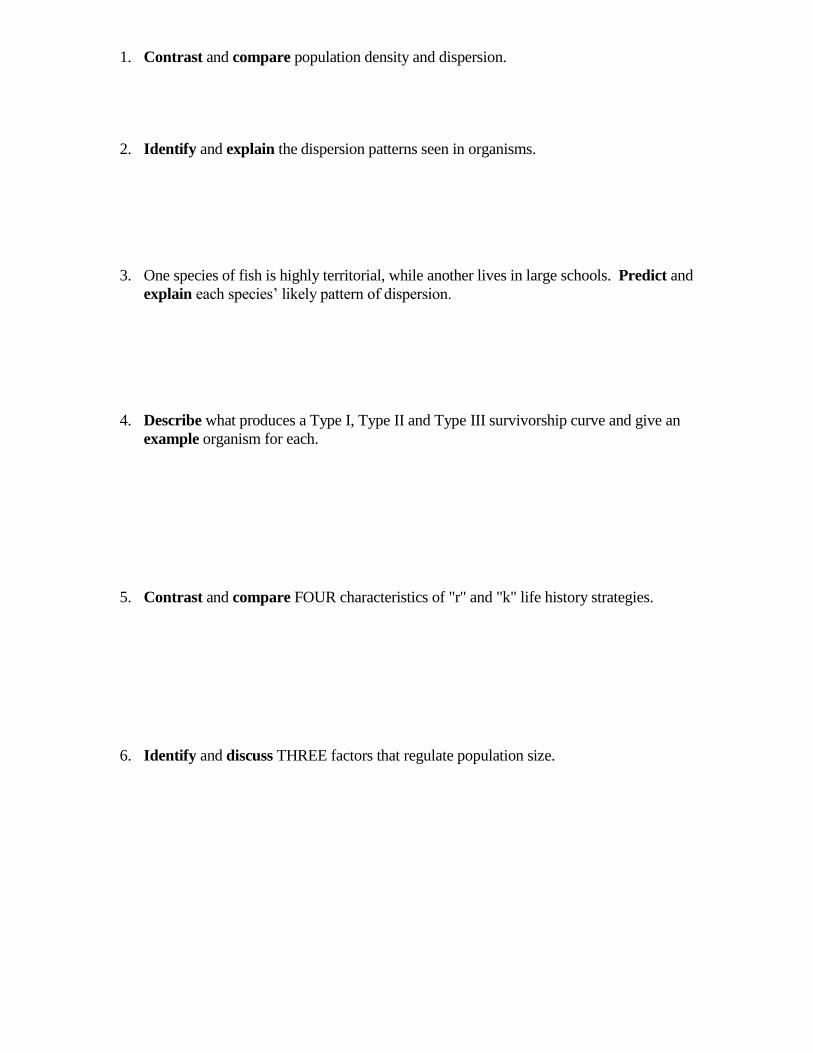
1. Contrast and compare population density and dispersion.
2. Identify and explain the dispersion patterns seen in organisms.
3. One species of fish is highly territorial, while another lives in large schools. Predict and
explain each species’ likely pattern of dispersion.
4. Describe what produces a Type I, Type II and Type III survivorship curve and give an
example organism for each.
5. Contrast and compare FOUR characteristics of "r" and "k" life history strategies.
6. Identify and discuss THREE factors that regulate population size.
7. In some species of fish, females disperse some of their eggs widely and lay other eggs in a
nest. Only the latter receive parental care. Explain the trade-offs in reproduction that this
behavior illustrates.
8. Endangered organisms usually have which life history strategy? Discuss why their life
history strategy may contribute to their being endangered.
9. Most pests have which life history strategy? Discuss why their life history strategy
contributes to their success as pests.
10. As an ecologist that manages a wildlife preserve, you want to increase the preserve’s
carrying capacity for a particular endangered species. Discuss how you might go about
accomplishing this plan.
11. Discuss how humans differ from other species in their ability to “choose” a carrying
capacity for their environment.
12. Ethology studies four questions that can be grouped into “how” and “why” a behavior
occurs.
13. Contrast and compare the questions addressed by proximate causation to the questions
addressed by ultimate causation.
14. Discuss the differences between classical conditioning and operant conditioning.
15. Male competition for breeding access to females often uses ritualized behaviors rather
than fighting to the death. Explain the adaptive advantage of using ritualized fights.
16. Describe the role of mutation in the change over time or evolution of fixed action
patterns.
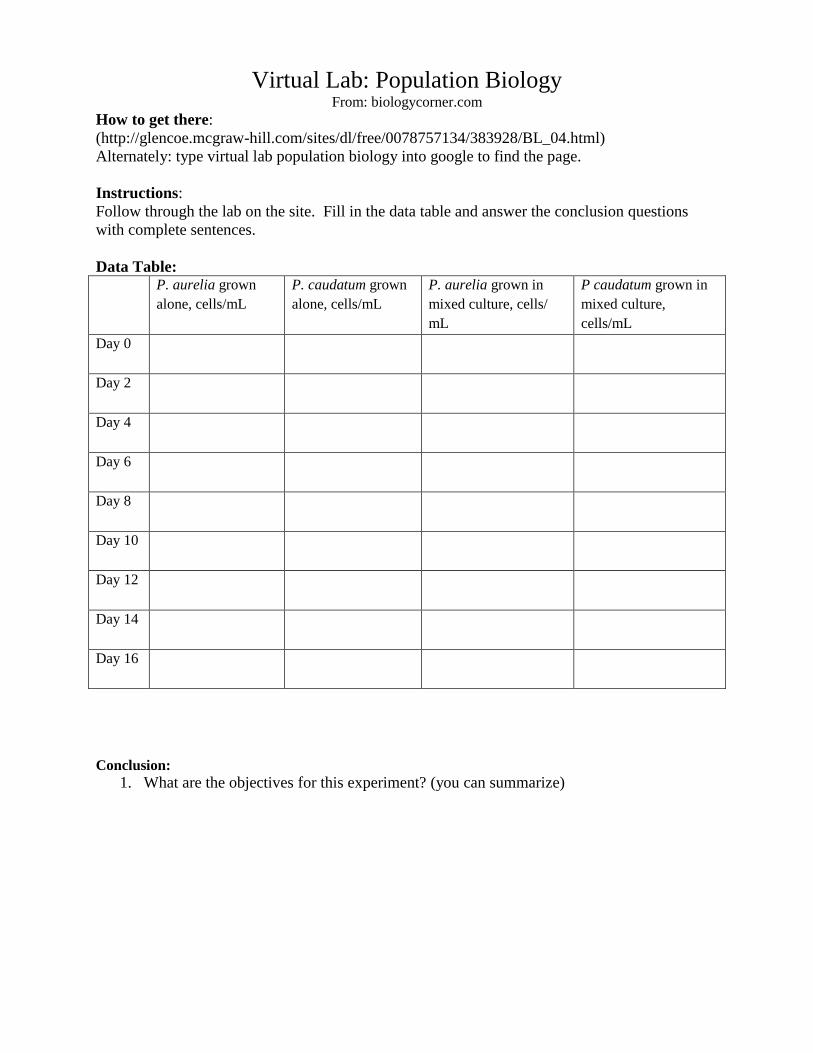
Virtual Lab: Population Biology From: biologycorner.com
How to get there:
(http://glencoe.mcgraw-hill.com/sites/dl/free/0078757134/383928/BL_04.html)
Alternately: type virtual lab population biology into google to find the page.
Instructions:
Follow through the lab on the site. Fill in the data table and answer the conclusion questions
with complete sentences.
Data Table: P. aurelia grown
alone, cells/mL
P. caudatum grown
alone, cells/mL
P. aurelia grown in
mixed culture, cells/
mL
P caudatum grown in
mixed culture,
cells/mL
Day 0
Day 2
Day 4
Day 6
Day 8
Day 10
Day 12
Day 14
Day 16
Conclusion:
1. What are the objectives for this experiment? (you can summarize)
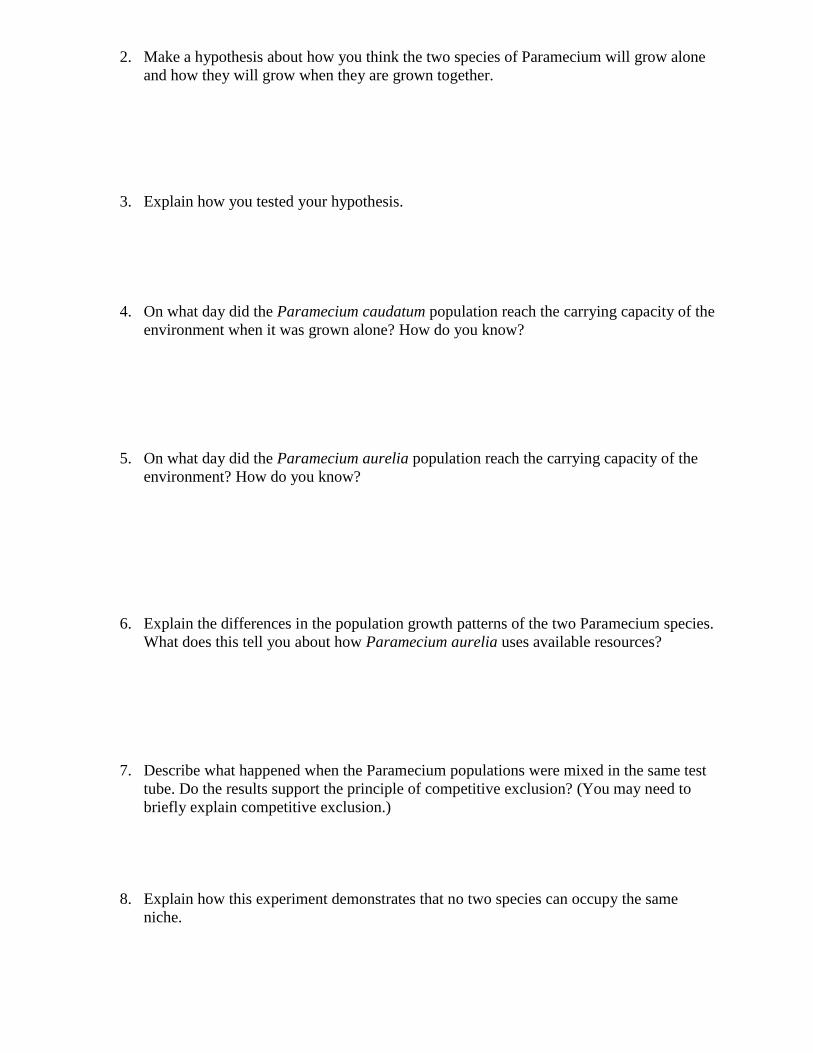
2. Make a hypothesis about how you think the two species of Paramecium will grow alone
and how they will grow when they are grown together.
3. Explain how you tested your hypothesis.
4. On what day did the Paramecium caudatum population reach the carrying capacity of the
environment when it was grown alone? How do you know?
5. On what day did the Paramecium aurelia population reach the carrying capacity of the
environment? How do you know?
6. Explain the differences in the population growth patterns of the two Paramecium species.
What does this tell you about how Paramecium aurelia uses available resources?
7. Describe what happened when the Paramecium populations were mixed in the same test
tube. Do the results support the principle of competitive exclusion? (You may need to
briefly explain competitive exclusion.)
8. Explain how this experiment demonstrates that no two species can occupy the same
niche.
Chapter 45 - Community Ecology
1. Explain the differences between competition, predation, parasitism, mutualism, and
commensalism and given an example of a pair of species that illustrates each.
2. Describe the differences between Batesian and Müllerian mimicry.
3. Search for information on the internet on the relationship between Monarch and Viceroy
butterflies. Is this a case of Batesian or Müllerian mimicry? Explain your reasoning and
give the citation of your web resources.
4. Explain the Competitive Exclusion Principle and how it relates to the concept of the
ecological niche.
5. Discuss if the Competitive Exclusion Principle explain the spacing of fast food restaurants
on the “strip” in most towns.
6. Describe what is meant by a “foundation” species and identify one example.
7. Describe what can happen when a keystone species is removed from a community.
Identify an example of a situation where this has happened.
8. Discuss the differences between Primary and Secondary Succession.
9. Choose an example of primary succession and describe the changes in the plant
communities and soil from the beginning community to the climax community.
10. Discuss the most plausible hypothesis for why species richness is higher in tropical forests
than in temperate forests.
AP Biology: Formal Lab Reports
We will use this report format throughout the school year. This and the rubric are what you need to use to write up the report for the Sex and the Single Guppy lab that follows.
Please follow all directions as listed below. If you have questions, please see me a FEW DAYS BEFORE
the lab report is due. All lab reports must be typed, no larger than 12 font and preferably in Times New
Roman, Arial, or Tahoma style font, with 1 inch margins on all sides. Penalties will be applied if these
formatting requirements are not met. All students are required to turn in a lab report. The data from
your group will be the same, but the rest of the lab report should be your own work. If cheating
(copying of any kind from any person or source) occurs, a zero will be given to anyone involved.
Citations must be a part of your lab report for it to be graded.
I. Cover Sheet a. AP Lab # and/or Title of the lab with a visual prompt to help you remember the lab b. Your Name, Date, Class Block
II. Background a. 2/3 to 3/4 of a page discussing topic of the lab and relating it to at least TWO of the Big
Ideas and/or Science Practices (you will need to look on the AP website to find these). b. 2 sources other than your lab sheets and text must be cited in APA format. (Use the
citation buttons on your computer software or the internet to create an APA citation. A web address alone is not sufficient).
III. Objectives/Hypothesis a. List the objectives (things you were hoping to find out or the goals of your
investigation). b. List the experimental hypothesis (the one you developed) as well as the null and
alternative (opposite of null and experimental) hypothesis. State whether these hypothesis were supported or not supported based on the data that was collected during your investigation.
IV. Procedure a. Written in paragraph form, a brief description of the general procedure. This should not
be longer then two paragraphs.
V. Data a. A data table that provides data from experiment/investigation. Please be sure that your
data table indicates the means/modes (averages) of your raw data. Do not forget appropriate units and indication of IV, DV, and control.
VI. Graph a. Use an appropriate graph to analyze data. Only graph means/modes (averages) of your
data, NOT raw data. b. Must have correct title, axes labeled, and a key. Appropriate units and IV, DV, and
control indicated correctly and clearly. VII. Analysis/Conclusion
a. In paragraph form, described the trends in your data/observations. Give a scientific explanation of your results based on your findings, and the background information and Big Idea/Science Skills that you cited earlier in your report. Discuss any errors that may have occurred and discuss additional questions that may have been raised as a result of your findings.
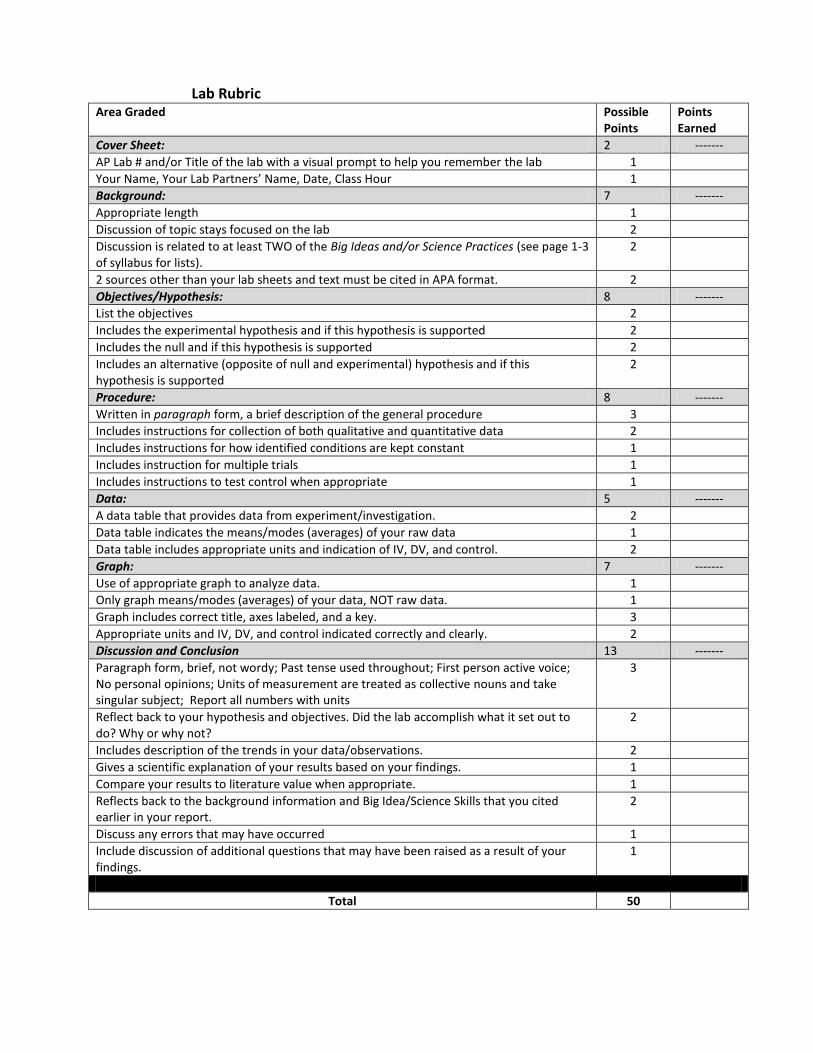
Lab Rubric Area Graded Possible
Points Points Earned
Cover Sheet: 2 -------
AP Lab # and/or Title of the lab with a visual prompt to help you remember the lab 1
Your Name, Your Lab Partners’ Name, Date, Class Hour 1
Background: 7 -------
Appropriate length 1
Discussion of topic stays focused on the lab 2
Discussion is related to at least TWO of the Big Ideas and/or Science Practices (see page 1-3 of syllabus for lists).
2
2 sources other than your lab sheets and text must be cited in APA format. 2
Objectives/Hypothesis: 8 -------
List the objectives 2
Includes the experimental hypothesis and if this hypothesis is supported 2
Includes the null and if this hypothesis is supported 2
Includes an alternative (opposite of null and experimental) hypothesis and if this hypothesis is supported
2
Procedure: 8 -------
Written in paragraph form, a brief description of the general procedure 3
Includes instructions for collection of both qualitative and quantitative data 2
Includes instructions for how identified conditions are kept constant 1
Includes instruction for multiple trials 1
Includes instructions to test control when appropriate 1
Data: 5 -------
A data table that provides data from experiment/investigation. 2
Data table indicates the means/modes (averages) of your raw data 1
Data table includes appropriate units and indication of IV, DV, and control. 2
Graph: 7 -------
Use of appropriate graph to analyze data. 1
Only graph means/modes (averages) of your data, NOT raw data. 1
Graph includes correct title, axes labeled, and a key. 3
Appropriate units and IV, DV, and control indicated correctly and clearly. 2
Discussion and Conclusion 13 -------
Paragraph form, brief, not wordy; Past tense used throughout; First person active voice; No personal opinions; Units of measurement are treated as collective nouns and take singular subject; Report all numbers with units
3
Reflect back to your hypothesis and objectives. Did the lab accomplish what it set out to do? Why or why not?
2
Includes description of the trends in your data/observations. 2
Gives a scientific explanation of your results based on your findings. 1
Compare your results to literature value when appropriate. 1
Reflects back to the background information and Big Idea/Science Skills that you cited earlier in your report.
2
Discuss any errors that may have occurred 1
Include discussion of additional questions that may have been raised as a result of your findings.
1
Total 50
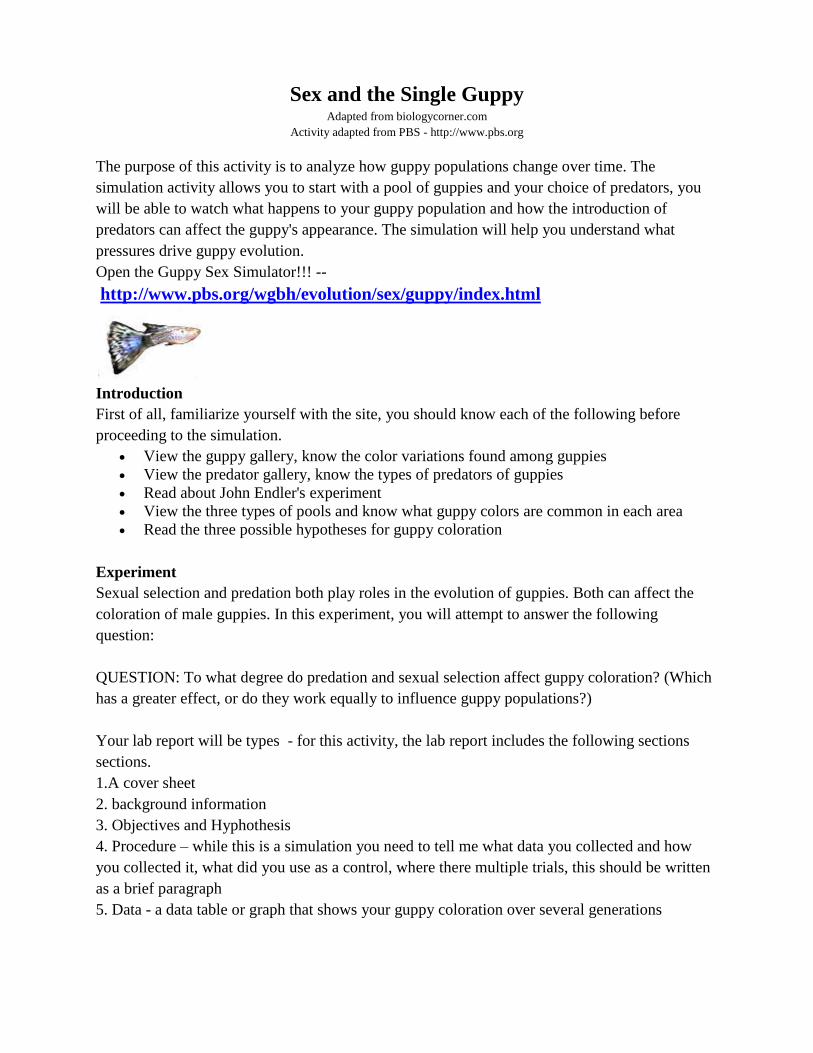
Sex and the Single Guppy Adapted from biologycorner.com
Activity adapted from PBS - http://www.pbs.org
The purpose of this activity is to analyze how guppy populations change over time. The
simulation activity allows you to start with a pool of guppies and your choice of predators, you
will be able to watch what happens to your guppy population and how the introduction of
predators can affect the guppy's appearance. The simulation will help you understand what
pressures drive guppy evolution.
Open the Guppy Sex Simulator!!! --
http://www.pbs.org/wgbh/evolution/sex/guppy/index.html
Introduction
First of all, familiarize yourself with the site, you should know each of the following before
proceeding to the simulation.
View the guppy gallery, know the color variations found among guppies
View the predator gallery, know the types of predators of guppies
Read about John Endler's experiment
View the three types of pools and know what guppy colors are common in each area
Read the three possible hypotheses for guppy coloration
Experiment
Sexual selection and predation both play roles in the evolution of guppies. Both can affect the
coloration of male guppies. In this experiment, you will attempt to answer the following
question:
QUESTION: To what degree do predation and sexual selection affect guppy coloration? (Which
has a greater effect, or do they work equally to influence guppy populations?)
Your lab report will be types - for this activity, the lab report includes the following sections
sections.
1.A cover sheet
2. background information
3. Objectives and Hyphothesis
4. Procedure – while this is a simulation you need to tell me what data you collected and how
you collected it, what did you use as a control, where there multiple trials, this should be written
as a brief paragraph
5. Data - a data table or graph that shows your guppy coloration over several generations
6. Graphs – The graph for this lab should be a bar graph, we will work in class on what type of
graph is good for what type of data. You can make a graph with microsoft exel, or you can go to
an online graph-maker athttp://nces.ed.gov/nceskids/graphing
**Make sure your data is defined - include beginning populations, number of generations,
colorations and other pertinent labels
7. Discussions and Conclusions - answer the experimental question. The conclusion can be
written in about a paragraph. Be sure to include general information about the trends in the data
to support your conclusion.
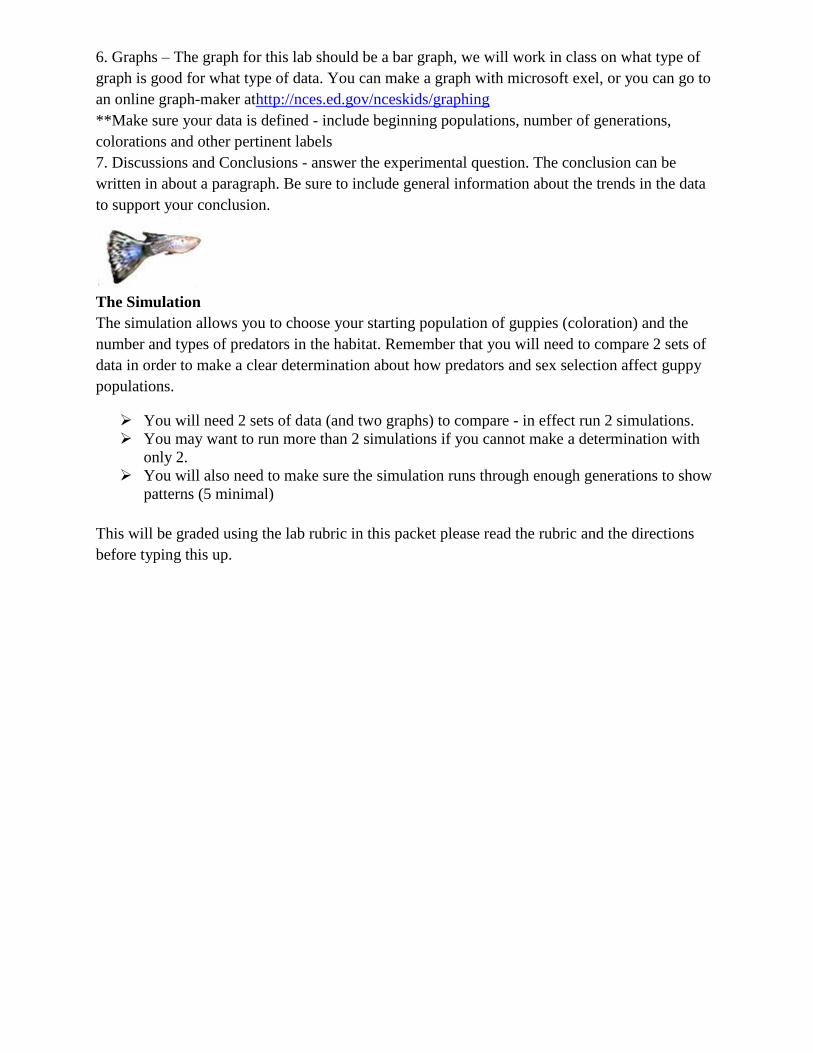
The Simulation
The simulation allows you to choose your starting population of guppies (coloration) and the
number and types of predators in the habitat. Remember that you will need to compare 2 sets of
data in order to make a clear determination about how predators and sex selection affect guppy
populations.
You will need 2 sets of data (and two graphs) to compare - in effect run 2 simulations.
You may want to run more than 2 simulations if you cannot make a determination with
only 2.
You will also need to make sure the simulation runs through enough generations to show
patterns (5 minimal)
This will be graded using the lab rubric in this packet please read the rubric and the directions
before typing this up.
Chapter 46
1. Identify four common tropic levels in ecosystems.
2. Explain the difference between grazing food webs and a detrial food web.
3. Contrast and compare the movement of energy and matter in food chains and food webs.
4. Explain the difference between net productivity and gross productivity.
5. Based on the second law of thermodynamics, would you expect the typical biomass of
primary producers in an ecosystem to be greater than or less than the biomass of secondary
producers in the same ecosystem? Explain your reasoning.
6. The top carnivore of many ecosystems is often endangered species. Speculate on why this
relationship is often correlated together.
7. Discuss why is the transfer of energy in an ecosystem referred to as energy “flow” not
energy “cycling”.
8. Identify THREE reasons why only a small portion of the solar energy that strikes Earth’s
atmosphere stored by primary producers.
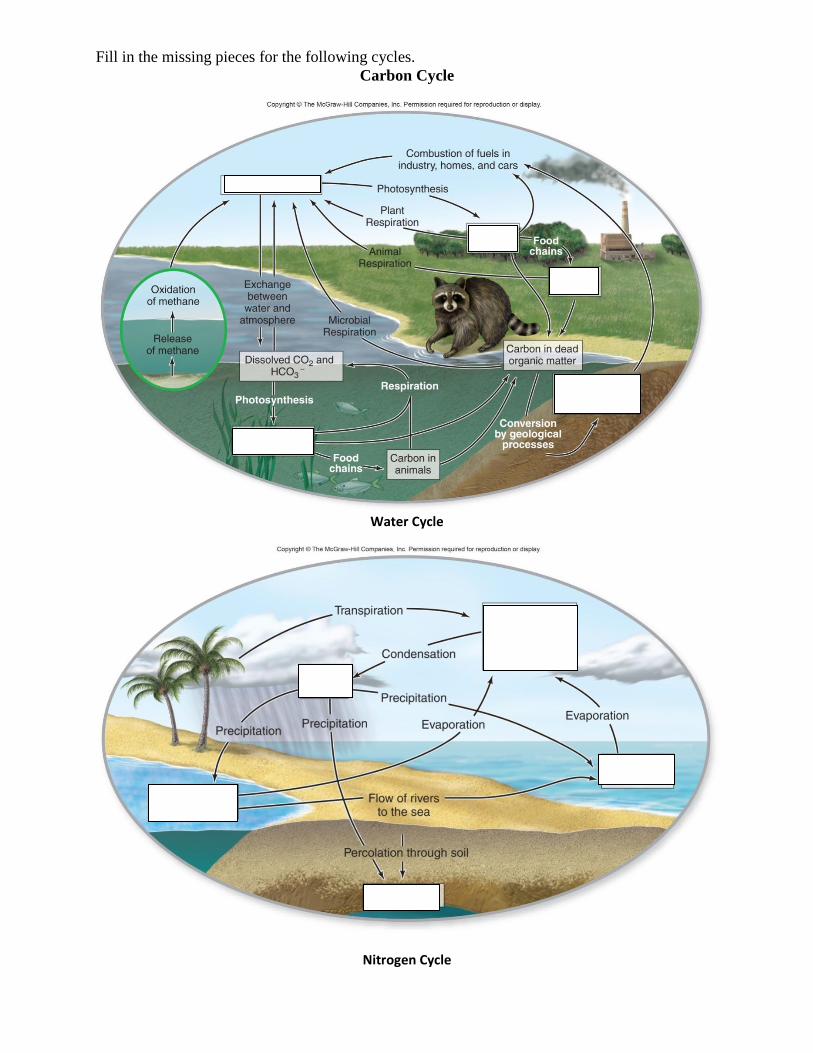
Fill in the missing pieces for the following cycles.
Carbon Cycle
Water Cycle
Nitrogen Cycle
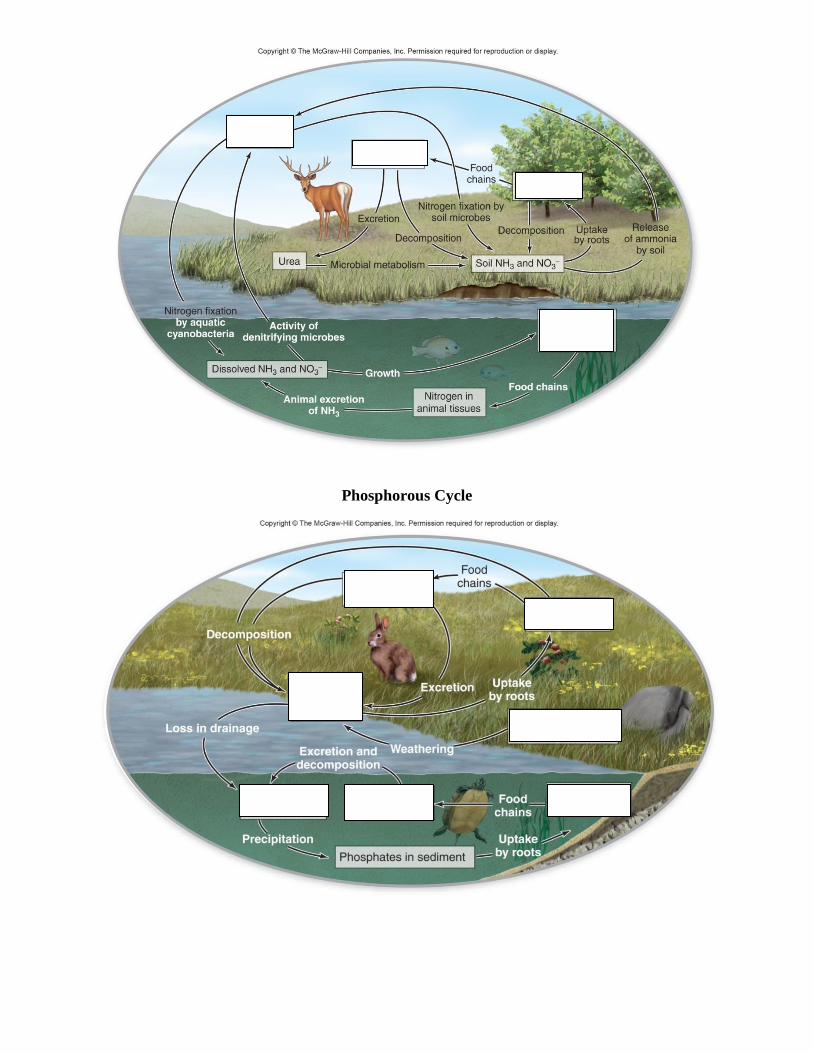
Phosphorous Cycle
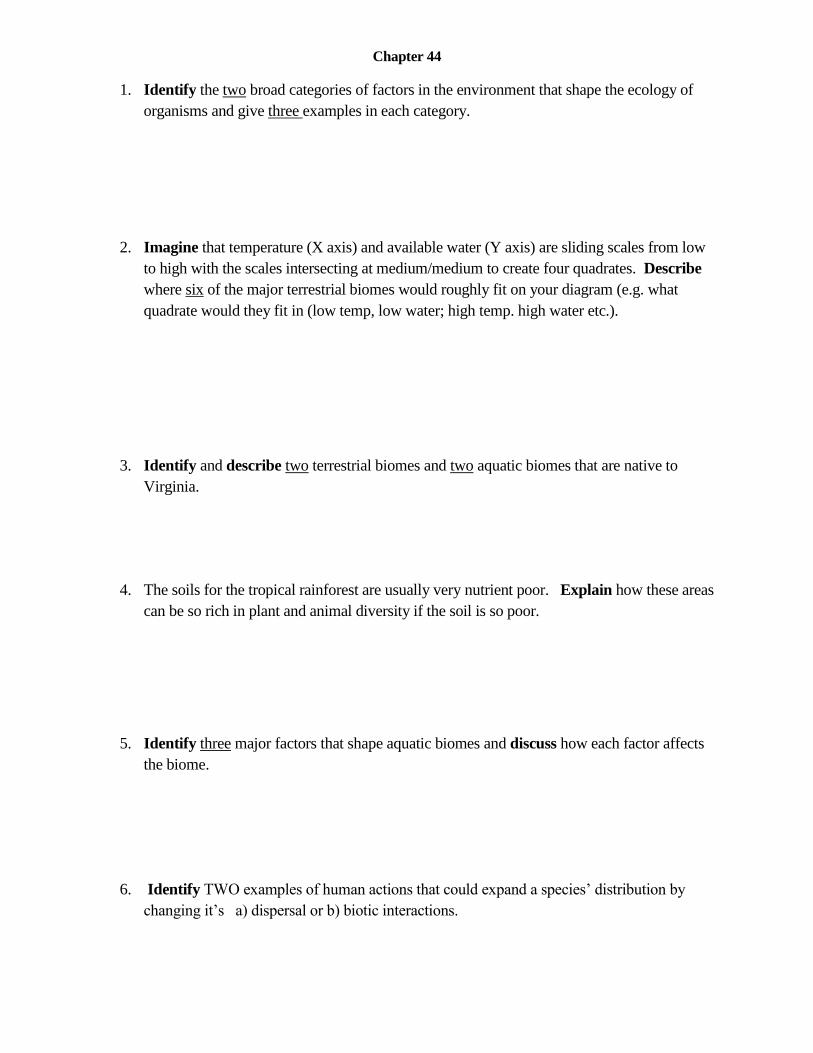
Chapter 44
1. Identify the two broad categories of factors in the environment that shape the ecology of
organisms and give three examples in each category.
2. Imagine that temperature (X axis) and available water (Y axis) are sliding scales from low
to high with the scales intersecting at medium/medium to create four quadrates. Describe
where six of the major terrestrial biomes would roughly fit on your diagram (e.g. what
quadrate would they fit in (low temp, low water; high temp. high water etc.).
3. Identify and describe two terrestrial biomes and two aquatic biomes that are native to
Virginia.
4. The soils for the tropical rainforest are usually very nutrient poor. Explain how these areas
can be so rich in plant and animal diversity if the soil is so poor.
5. Identify three major factors that shape aquatic biomes and discuss how each factor affects
the biome.
6. Identify TWO examples of human actions that could expand a species’ distribution by
changing it’s a) dispersal or b) biotic interactions.

![AP* Biology: Ecology Practice MC [Version Map] Biology Ecology... · AP* Biology: Ecology Practice MC [Version Map] 1 ABCD MC 1 8 9 7 ... AP* Biology: Ecology Practice MC ... which](https://img.dokumen.tips/doc/110x75/5b449d207f8b9ae0668bd35b/ap-biology-ecology-practice-mc-version-map-biology-ecology-ap-biology.jpg)