Embed Size (px)
DESCRIPTION
This will help with the new format.This will help with future jobs and it will help save your butt.
Citation preview

AP BiologyStudent Handbook
Jill Baker2005-2006
Class website: www.terralinda.srcs.org>Programs>JBaker>AP Biology

2
Table of Contents
About the Class A. Course Overview 3 B. Prerequisites 3 C. Topic Outline and Tentative Schedule 3 D. Major Themes 4 E. Textbook and Suggested Supplement Books 4 F. The AP Biology Exam 5 G. Practice Exams\inations and Final Exam 5 H. Grading Policies 5 I. Honesty is the Best Policy 6
AP Biology Laboratories Writing AP Biology Laboratory Reports 8 Good Graphs 10 Lab 1 Osmosis and Dialysis 12 Lab 2 Enzyme Catalysis 31 Lab 3 Mitosis and Meiosis 41 Lab 4 Plant Pigments and photosynthesis 58 Lab 5 Cellular Respiration 66 Lab 6 Molecular Biology 73 Lab 7 Genetics of Organisms 86 Lab 8 Population Genetics and Evolution 96 Lab 9 Transpiration 103 Lab 10 Physiology of the Circulatory System 113 Lab 11: Animal Behavior 127 Lab 12 Dissolved Oxygen and Aquatic Primary Productivity 135
The Exam Past AP Biology Laboratory Questions 144 Overview of AP Labs for Take Home Exam 145 Points of Emphasis for AP Biology Experimental Design Essay 150 Tips for writing AP Biology Essays 151 Past AP Biology Essay Questions 154 AP Biology Review Section 195

3
About the ClassA. Course OverviewB. PrerequisitesC. Topic OutlineD. Major ThemesE. TextbookF. AP Biology ExaminationG. Practice ExaminationsH. Grading Policies
A. Course OverviewThis course is a college level biology course. It is designed to be an equivalent to an introductory biologycourse for science majors at the freshman university level. It prepares the students for the AP Biology Exam.Topics covered include biochemistry, cells. photosynthesis, respiration, heredity, molecular genetics,evolution, diversity of life, plant and animal form and function and ecology. This course follows the CollegeBoard Advanced Placement syllabus and students are expected to take the national college board exam inMay. A.P. Biology has a tremendous amount of information that must be covered during the school year.
B. PrerequisitesBiology and chemistry are recommended. District internet access, access to a computer and printer arerequired.
C. Topic Outline and Tentative Time ScheduleI. Molecules and Cells (August 22 – October 17)
A. Chemistry of Life 1. Water
2. Organic molecules in organisms 3. Free energy changes 4. Enzymes 5. Labs: AP Lab 1: Osmosis and Diffusion
AP Lab 2: Enzyme Catalysis B. Cells
1. Prokaryotic and eukaryotic cells2. Membranes3. Subcellular organization4. Cell cycle and its regulation
C. Cellular Energetics1. Coupled reactions2. Fermentation and cellular respiration3. Photosynthesis
II. Heredity and Evolution (October 24 – March 3)A. Heredity
1. Meiosis and gametogenesis 2. Eukaryotic chromosomes 3. Inheritance patterns
B. Molecular Genetics1. RNA and DNA structure and function2. Gene regulation3. Mutation4. Viral structure and replication5. Nucleic acid technology and applications

4
C. Evolutionary Biology1. Early evolution of life2. Evidence for evolution3. Mechanisms of evolution
III. Organisms and Populations ( March 7 – April 28)A. Diversity of Organisms
1. Evolutionary patterns 2. Survey of the diversity of life 3. Phylogenetic classification 4. Evolutionary relationships
B. Structure and Function of Plants and Animals1. Reproduction, growth and development2. Structural, physiological and behavioral adaptations3. Response to the environment
C. Ecology (summer assignment)1. Population dynamics2. Communities and ecosystems3. Global issues4. Labs: AP Lab 11: Animal Behavior
AP Lab 12: Dissolved Oxygen and Aquatic Primary Productivity Initial Observation laboratory
IV. Exam Review (May 1 – May 5)
D. Major ThemesIn an attempt to develop unifying concepts in biology, the AP Biology Development Committee hasidentified eight major themes that recur throughout the course.
I. Sciences as a Process II. Evolution III. Energy Transfer IV. Continuity and Change V. Relationship of Structure to Function VI. Regulation VII. Interdependence in Nature VIII. Science, Technology and Society
E. TextbookBiology, 7th editionNeil A. Campbell, Jane B. ReeceCopyright 2005, Benjamin/Cummings
Lab Manual: Advanced Placement Biology Laboratory Manual,2001,
RecommendedCliff’s AP Biology. 2nd Edition
Learn More

5
AP* Test Prep workbook for Campbell, Biology 7th EditionCampbell, 2006, Prentice Hall $14.96
F. AP Biology ExaminationThe AP Biology Examination is three hours in length and is designed to measure a student'sknowledge and understanding of modern biology. The examination consists of a 80-minute,100-item multiple-choice section, and a 10 minute reading period before the 90-minute free-response section, consisting of four mandatory questions. The number of multiple-choice itemstaken from each major subset of biology reflects the percentage of the course as designated inthe Topic Outline. In the free-response portion, usually one essay question is take from theMolecules and Cells section, one question is taken from the Heredity and Evolution section, andtwo questions focus on the Organisms and Populations section. The multiple-choice sectioncounts for 60 percent of the student's examination grade, and the free-response section countsfor 40 percent.
In order to provide the maximum information about differences in students' achievements inbiology, the examinations are intended to have average scores of about 50 percent of themaximum possible score for the multiple-choice section and for the free-response section. Thus, students will find these exams to be more difficult that most classroom exams.
ALL students in the class are expected to take the exam. The fee is $82.00. The 2006 AP
Biology Exam is scheduled for Monday, May 8th during the morning.
G. Practice Examinations and Final ExamIn December, students take a practice exam covering 50% of the material in AP Biology. Thisfirst practice exam counts as the first semester exam grade. During the first part of May,students take a practice exam covering all the material in AP Biology. The second practiceexam counts as a quarter exam and as the second semester exam. Students that do nottake the AP exam will be required to take a comprehensive AP Biology exam duringfinals week.
H. Grading PoliciesEach student’s semester grade will be based on the total number of points that they have accumulatedrelative to the total possible points that could have been earned. In general:
Graded Items Percentage of SemesterGrade
Major Tests 25Lab Reports and Lab Quizzes 30
Daily Work 25Semester Exam 20

6
If a student misses points on a major test, they will be given the opportunity to do test corrections and 0.3points will be given for each correction answered in depth. It cannot be stressed how important it is for eachstudent to master the material presented.
The AP test scores are not received until July and are therefore not used as a part of the student’s average inthe course.
I. HONESTY IS THE BEST POLICYCheating and copying will not be tolerated. The school policy on cheating will be strictly adhered to.It is to be understood, that copying and letting your work be copied are both considered cheating andwill be dealt with in the same manner.
1st Offence. The work in question will be given a zero. Your parents will be called and anotice will be sent to the office, other faculty and the counselors with the nature of thecheating offence, the number of points and the date. You will not be allowed to make up theassignment. I will write no letters of recommendation for college or scholarships.
2nd Offence. A zero will be given on the assignment. You will be sent to the office with therecommendation that you be removed from the class.

7
The AP Biology Laboratories

8
Writing AP Biology Laboratory ReportsAll laboratories will be written in a lab composition book. The first page will be reserved for the table ofcontents.
PRE-LAB ASSIGNMENT• the pre-lab assignment will count 20% of the laboratory grade.• before coming to lab, you should identify the experimental characteristics below for the specified lab.• the lab write-up must be in the lab composition book.• use ink, blue or black. Be neat. Errors may be crossed out and the correction written immediately
after. You will not be penalized for cross-outs. You may type any section of the laboratory and paste itin your notebook.
• date each entry
• you may work together, but copying another person’s pre-lab is cheating. A grade of zero will beassigned for the lab if you are caught copying another person’s pre-lab OR if you give your pre-lab tobe copied.
• no points will be given for late assignments. No exceptions!!
I. TITLE: This should indicate what the lab was all about. Please do not exceed 25 words.
II. HYPOTHESES: Identify it as the hypothesis, tell what you predict will happen. You may use“If/Then” statements.
III. METHODS:a. Using as few words as possible draw a flow chart of the materials and methods.b. Identify clearly the control group that will be u sed for comparison. It does not contain the variablebeing tested.
c. Identify the dependent variable, the variable that will change, the experimental group.d. Identify the independent variable, the variable you have control over and will change, frequently itis time.
e. Identify all factors that will be held constant in the lab. For instance, each set-up my be measuredat the same time, at the same temperature, the same amount of solution in each beaker.
f. Identify what is being measured and the units being used.Example: CO2 or H2O consumption in mL/min, growth in cm, production of an acid in gm.
g. What method or time frame will be used for measurement?Example: I will take reading of H2O consumption every 5 minutes for 30 minutes.
h. What is the rate of calculation and/or statistical application.Example: average number of trials, slope of the curve.
i. How will experimental results be presented? (graphs, charts)j. What are the expected results? Why?. This will be your best guess based on the introduction tothe labs, which you are expected to read and your hypothesis.
9
POST-LAB ASSIGNMENT
IV. RESULTS/DATA/OBSERVATIONS. Display YOUR data that you collected. It should be neatly andclearly presented. If the lab is "observational" in nature, you would include diagrams and/ordescriptions of structures, chemical reactions, behaviors, etc.. DO NOT FUDGE YOUR DATA!! Putonly the data that you, or your lab group, or the class collected, not what you think that you shouldhave seen. For almost every lab, you should graph both your lab group's data and the class data—onthe same set of axes if possible. This raw data is the only part of your lab write-up that will be sharedwith your partner(s).
V. DISCUSSION:How do you explain what you saw.Here you present a summary of the data generated by the lab. Put into your own words what thenumbers or observations tell you. How do you interpret the data or observations in light of yourhypothesis or your own expectations? Nature does not lie, but she is often frustratingly difficult tofigure out. In this section you must discuss YOUR results. If you come up with results that do notmake sense, examine your methods and materials for sources of experimental error, and describethem here.
VI. ANSWERS TO QUESTIONS: In this section, put the answers to printed questions askedthroughout the lab protocol and at the end of the lab. Unless you are told otherwise, use the classmean data to answer the questions. The quality and depth of your answers to these questions will bevery important to the quality of your grade. You must use complete sentences.

10
Good GraphsOne of the most common things students have problems with is making good graphs for their experimentaldata. 1. Always give your graph a title in the following form: "The dependence of (your dependent variable)on (your independent variable). Cute titles are no longer cute. Make them descriptive. 2. The x-axis of a graph is always your independent variable and the y-axis is the dependent variable.The independent variable is the one you or the experimenter have control over in the experiment, time,temperature. This would be on the x-axis (the one on the bottom of the graph).The dependent variable is what your are measuring and will depend on what you set. For example, growthdepends on the time of measurement and the would be on the y-axis (the one on the side of the graph) 3. Always label the x and y axes and give units.Putting numbers on the x and y-axes is something that everybody always remembers to do (after all, howcould you graph without showing the numbers?). However, people frequently forget to put a label on the axisthat describes what those numbers are, and even more frequently forget to say what those units are. Forexample, if you're going to do a chart which uses temperature as the independent variable, you should writethe word "temperature (degrees Celsius)" on that axis so people know what those numbers stand for.Otherwise, people won't know that you're talking about temperature, and even if they do, they might thinkyou're talking about degrees Fahrenheit.
Always indicate where the numbers are on the graph, use line tics. The graph does have squares, but thereader won’t know which number and line correspond unless you put a number and a line where the numbergoes. 4. Always make a line graph (unless instructed otherwise)Never, ever make a bar graph when doing science stuff. Bar graphs are good for subjects where you're tryingto break down a topic (such as gross national product) into it's parts. When you're doing graphs in science,line graphs are way more handy, because they tell you how one thing changes under the influence of someother variable. 5. Never, EVER, connect the dots on your graph!Why? When you do an experiment, you always screw something up. Yeah, you. It's probably not a bigmistake, and is frequently not something you have a lot of control over. However, when you do an experiment,many little things go wrong, and these little things add up. As a result, experimental data never makes a nicestraight line. Instead, it makes a bunch of dots which kind of wiggle around a graph. This is normal, and willnot affect your grade unless your teacher is a Nobel prize winner. However, you can't just pretend that yourdata is perfect, because it's not. Whenever you have the dots moving around a lot, we say that the data isnoisy, because the thing you're looking for has a little bit of interference caused by normal experimental error.
To show that you're a clever young scientist, your best bet is to show that you KNOW your data is sometimeslousy. You do this by making a line (or curve) which seems to follow the data as well as possible, withoutactually connecting the dots. Doing this shows the trend that the data suggests, without depending too muchon the noise. As long as your line (or curve) does a pretty good job of following the data, this is called Line ofBest Fit.

11
6. Make sure your data is graphed as large as possible in the space you've been given.Let's face it, you don't like looking at little tiny graphs. Your teacher doesn't either. If you make large graphs,you'll find it's easier to see what you're doing, and your teacher will be lots happier.
7. Use a ruler, be neat, be EXACT.
Examples of Good and Bad GraphsAll those rules I gave you above are true and are handy to know, but it's usually a bad idea to give ruleswithout showing you what they mean. Below are two examples of graphs. One is a bad graph (which youmay be guilty of making) and the other is a good graph (which is what I always make).
A bad graph! Let's see what's wrong with this graph:
*There's no title. What's it a graph of? Who knows?*There are no labels on the x or y axis. What arethose numbers? Who knows?*There are no units on the x or y axis. Is this a graphof speed in miles per hour or a graph of temperaturein Kelvins? Who can tell?*Somebody played "connect the dots". This shouldbe a nice straight line which goes through the pointsor a curve that tends to follow them.• There are no line “ticks” to align the numberswith an exact spacing on the graph.
A good graph!

12
Date: _________________________ Name and Period: ________________________________________
AP Biology Laboratory 1
DIFFUSION AND OSMOSISOVERVIEWIn this lab you will:
1. investigate the processes of diffusion and osmosis in a model membrane system, and2. investigate the effect of solute concentration on water potential as it relates to living plant tissues.
OBJECTIVESBefore doing this lab you should understand: • the mechanisms of diffusion and osmosis and their importance to cells; • the effects of solute size and concentration gradients on diffusion across selectively permeable
membranes; • the effects of a selectively permeable membrane on diffusion and osmosis between two solutions
separated by the membrane; • the concept of water potential; • the relationship between solute concentration and pressure potential and the water potential of a
solution; and • the concept of molarity and its relationship to osmotic concentration.
After doing this lab you should be able to: • measure the water potential of a solution in a controlled experiment; • determine the osmotic concentration of living tissue or an unknown solution from experimental data; • describe the effects of water gain or loss in animal and plant cells; and • relate osmotic potential to solute concentration and water potential.
INTRODUCTIONMany aspects of the life of a cell depend on the fact that atoms and molecules have kinetic energy and areconstantly in motion. This kinetic energy causes molecules to bump into each other and move in newdirections. One result of this molecular motion is the process of diffusion.
Diffusion is the random movement of molecules from an area of higher concentration of those molecules toan area of lower concentration. For example, if one were to open a bottle of hydrogen sulfide (H2S has theodor of rotten eggs) in one comer of a room, it would not be long before someone in the opposite comerwould perceive the smell of rotten eggs. The bottle contains a higher concentration of H2S molecules than theroom does and therefore the H2S gas diffuses from the area of higher concentration to the area of lowerconcentration. Eventually, a dynamic equilibrium will be reached; the concentration of H2S will beapproximately equal throughout the room and no net movement of H2S will occur from one area to the other.
Osmosis is a special case of diffusion. Osmosis is the diffusion of water through a selectively permeablemembrane (a membrane that allows for diffusion of certain solutes and water) from a region of higher waterpotential to a region of lower water potential. Water potential is the measure of free energy of water in asolution.
Diffusion and osmosis do not entirely explain the movement of ions or molecules into and out of cells. Oneproperty of a living system is active transport. This process uses energy from ATP to move substancesthrough the cell membrane. Active transport usually moves substances against a concentration gradient, fromregions of low concentration of that substance into regions of higher concentration.

13
EXERCISE 1A: DiffusionIn this experiment you will measure diffusion of small molecules through dialysis tubing, an example of aselectively permeable membrane. Small solute molecules and water molecules can move freely through aselectively permeable membrane, but larger molecules will pass through more slowly, or perhaps not at all.The movement of a solute through a selectively permeable membrane is called dialysis. The size of theminute pores in the dialysis tubing determines which substances can pass through the membrane.
A solution of glucose and starch will be placed inside a bag of dialysis tubing. Distilled water will be placed ina beaker, outside the dialysis bag. After 30 minutes have passed, the solution inside the dialysis tubing andthe solution in the beaker will be tested for glucose and starch. The presence of glucose will be tested withBenedict's solution, Testape(r), or Clinistix(r). The presence of starch will be tested with Lugol's solution(Iodine Potassium-Iodide, or IKI).
Procedure1. Obtain a 30-cm piece of 2.5-cm dialysis tubing that has been soaking in water. Tie off one end of the tubingto form a bag. To open the other end of the bag, rub the end between your fingers until the edges separate.
2. Test the 15% glucose/l% starch solution for the presence of glucose. Your teacher may have you do a Benedict's test or use glucose Testape(r) or Clinistix(r). Record the results in Table 1.1.
3. Place 15 mL of the 15% glucose/l% starch solution in the bag. Tie off the other end of the bag, leavingsufficient space for the expansion of the contents in the bag. Record the color of the solution in Table 1.1.
4. Fill a 250-mL beaker or cup two-thirds fall with distilled water. Add approximately 4 mL of Lugol's solution tothe distilled water and record the color of the solution in Table 1.1. Test this solution for glucose and recordthe results in Table 1.1.
5. Immerse the bag in the beaker of solution.
6. Allow your setup to stand for approximately 30 minutes or until you see a distinct color change in the bag orin the beaker. Record the final color of the solution in the bag, and of the solution in the beaker, in Table 1.1.
7. Test the liquid in the beaker and in the bag for the presence of glucose. Record the results in Table 1.1.
Table 1.1Solution Color Presence of GlucoseInitial
Contents Initial Final Initial Final
Bag15% glucose &1% starch
Beaker H20 & IKI
Analysis of Results1. Which substance(s) are entering the bag and which are leaving the bag? What experimental evidence
supports your answer?

14
2. Explain the results you obtained. Include the concentration differences and membrane pore size in yourdiscussion.
3. Quantitative data uses numbers to measure observed changes. How could this experiment be modified sothat quantitative data could be collected to show that water diffused into the dialysis bag?
4. Based on your observations, rank the following by relative size, beginning with the smallest: glucosemolecules, water molecules, IKI molecules, membrane pores, starch molecules.
5. What results would you expect if the experiment started with a glucose and IKI solution inside the bag andonly starch and water outside? Why?

15
EXERCISE 1B: OsmosisIn this experiment you will use dialysis tubing to investigate the relationship between solute concentration andthe movement of water through a selectively permeable membrane by the process of osmosis.
When two solutions have the same concentration of solutes, they are said to be isotonic to each other (iso-means same, -ton means condition, -ic means pertaining to). If the two solutions are separated by aselectively permeable membrane, water will move between the two solutions, but there will be no net changein the amount of water in either solution.
If two solutions differ in the concentration of solutes that each has, the one with more solute is hypertonic tothe one with less solute {hyper- means over, or more than). The solution that has less solute is hypotonic tothe one with more solute (hypo- means under, or less than). These words can only be used to comparesolutions.
Now consider two solutions separated by a selectively permeable membrane. The solution that is hypertonicto the other must have more solute and therefore less water. At standard atmospheric pressure, the waterpotential of the hypertonic solution is less than the water potential of the hypotonic solution, so the netmovement of water will be from the hypotonic solution into the hypertonic solution.
Label the sketch in Figure 1.1 to indicate which solution is hypertonic and which is hypotonic, and use arrowsto show the initial net movement of water.
Figure 1.1
Procedure1. Obtain six 30-cm strips of presoaked dialysis tubing.
2. Tie a knot in one end of each piece of dialysis tubing to form 6 bags. Pour approximately 15-25 mL of eachof the following solutions into separate bags: a) distilled water b) 0.2 M sucrose c) 0.4 M sucrose d) 0.6 M sucrose e) 0.8 M sucrose f) l.0 M sucrose
Remove most of the air from each bag by drawing the dialysis bag between two fingers. Tie off the other endof the bag. Leave sufficient space for the expansion of the contents in the bag. (The solution should fill onlyabout one-third to one-half of the piece of tubing.)
3. Rinse each bag gently with distilled water to remove any sucrose spilled during the filling.

16
4. Carefully blot the outside of each bag and record in Table 1.2 the initial mass of each bag, expressed ingrams.
5. Place each bag in an empty 250-mL beaker or cup and label the beaker to indicate the molarity of thesolution in the dialysis bag.
6. Now fill each beaker two-thirds full with distilled water. Be sure to completely submerge each bag.
7. Let them stand for 30 minutes.8. At the end of 30 minutes remove the bags from the water. Carefully blot and determine the mass of eachbag.
9. Record your group's data in Table 1.2. Obtain data from the other lab groups in your class to completeTable 1.3.
Table 1.2: Dialysis Bag Results - Group DataContents InDialysis Bag
Initial Mass Final Mass Mass Difference Percent ChangeIn Mass*
a) 0.0 M Distilled Water
b) 0.2 M Sucrose
c) 0.4 M Sucrose
d) 0.6 M Sucrose
e) 0.8 M Sucrose
f) 1.0 M Sucrose
* To calculate:Percent Change in Mass = Final Mass - Initial Mass X 100
Initial Mass

17
Table 1.3: Dialysis Bag Results-Class DataPercent Change in Mass of Dialysis BagsContents In
Dialysis Bag Group1
Group2`
Group3
Group4
Group5
Group6
Group7
Group8
Total
ClassAverage
a) 0.0 M Distilled Water
b) 0.2 M Sucrose
c) 0.4 M Sucrose
d) 0.6 M Sucrose
e) 0.8 M Sucrose
f) 1.0 M Sucrose

18
10. Graph the results for both your individual data and the class average on Graph 1.1.*
For this graph you will need to determine the following:
a. The independent variable: _____________________.Use this to label the horizontal (x) axis.
b. The dependent variable: ________ Use this to label the vertical (y) axis
Graph 1.1 Title: __________________________________________________________

19
Analysis of Results1. Explain the relationship between the change in mass and the molarity of sucrose within the dialysis bags.
2. Predict what would happen to the mass of each bag in this experiment if all the bags were placed in a 0.4M sucrose solution instead of distilled water. Explain your response.
3. Why did you calculate the percent change in mass rather than simply using the change in mass?
4. A dialysis bag is filled with distilled water and then placed in a sucrose solution. The bag's initial mass is20 g and its final mass is 18 g. Calculate the percent change of mass, showing your calculations here.
5. The sucrose solution in the beaker would have been ________ to the distilled water in the bag. (Circle theword that best completes the sentence.) isotonic hypertonic hypotonic

20
EXERCISE 1C: Water PotentialIn this part of the exercise you will use potato cores placed in different molar concentrations of sucrose inorder to determine the water potential of potato cells. First, however, we will explore what is meant by theterm "water potential."
Botanists use the term water potential when predicting the movement of water into or out of plant cells. Waterpotential is abbreviated by the Greek letter psi (Ψ) and it has two components: a physical pressure component(pressure potential Ψp) and the effects of solutes (solute potential Ψs).
Ψ = Ψp + Ψs
Water = Pressure + Solute potential potential potential
Water will always move from an area of higher water potential (higher free energy; more watermolecules) to an area of lower water potential (lower free energy; fewer water molecules). Water potential,then, measures the tendency of water to leave one place in favor of another place. You can picture the waterdiffusing "down" a water potential gradient.
Water potential is affected by two physical factors. One factor is the addition of solute which lowers the waterpotential. The other factor is pressure potential (physical pressure). An increase in pressure raises the waterpotential. By convention, the water potential of pure water at atmospheric pressure is defined as being zero(Ψ = 0). For instance, it can be calculated that a 0.1-M solution of sucrose at atmospheric pressure (Ψp = 0)has a water potential of -2.3 bars due to the solute (Ψs = - 2.3).**Note: A bar is a metric measure of pressure, measured with a barometer, that is about the same as 1 atmosphere. Another measureof pressure is the megapascal (MPa). [1 MPa = 10 bars.]
Movement of H2O into and out of a cell is influenced by the solute potential (relative concentration of solute)on either side of the cell membrane. If water moves out of the cell, the cell will shrink. If water moves into ananimal cell, it will swell and may even burst. In' plant cells, the presence of a cell wall prevents cells frombursting as water enters the cells, but pressure eventually builds up inside the cell and affects the netmovement of water. As water enters a dialysis bag or a cell with a cell wall, pressure will develop inside thebag or cell as water pushes against the bag or cell wall. The pressure would cause, for example, the water torise in an osmometer tube or increase the pressure on a cell wall. It is important to realize that water potentialand solute concentration are inversely related. The addition of solutes lowers the water potential of thesystem. In summary, solute potential is the effect that solutes have on a solution's overall water potential.
Movement of H2O into and out of a cell is also influenced by the pressure potential (physical pressure) oneither side of the cell membrane. Water movement is directly proportional to the pressure on a system. Forexample, pressing on the plunger of a water-filled syringe causes the water to exit via any opening. In plantcells this physical pressure can be exerted by the cell pressing against the partially elastic cell wall. Pressurepotential is usually positive in living cells; in dead xylem elements it is often negative.
It is important for you to be clear about the numerical relationships between water potential and itscomponents, pressure potential and solute potential. The water potential value can be positive, zero, ornegative. Remember that water will move across a membrane in the direction of the lower water potential. Anincrease in pressure potential results in a more positive value, and a decrease in pressure potential (tensionor pulling) results in a more negative value. In contrast to pressure potential, solute potential is alwaysnegative; since pure water has a water potential of zero, any solutes will make the solution have a lower(more negative) water potential. Generally, an increase in solute potential makes the water potential valuemore negative and an increase in pressure potential makes the water potential more positive.
To illustrate the concepts discussed above, we will look at a sample system using Figure 1.2. When asolution, such as that inside a potato cell, is separated from pure water by a selectively permeable cellmembrane, water will move (by osmosis) from the surrounding water where water potential is higher, into the

21
cell where water potential is lower (more negative) due to the solute potential (Ψs). In Figure 1.2a the purewater potential (Ψ) is 0 and the solute potential (Ψs) is -3. We will assume, for purposes of explanation, thatthe solute is not diffusing out of the cell. By the end of the observation, the movement of water into the cellcauses the cell to swell and the cell contents to push against the cell wall to produce an increase in pressurepotential (turgor) (Ψp =3). Eventually, enough turgor pressure builds up to balance the negative solutepotential of the* cell. When the water potential of the cell equals the water potential of the pure water outsidethe cell (Ψ of cell = Ψ of pure water = 0), a dynamic equilibrium is reached and there will be no net watermovement (Figure 1.2b).
Figure 1.2
If you were to add solute to the water outside the potato cells, the water potential of the solution surroundingthe cells would decrease. It is possible to add just enough solute to the water so that the water potentialoutside the cell is the same as the water potential inside the cell. In this case, there will be no net movementof water. This does not mean, however, that the solute concentrations inside and outside the cell are equal,because water potential inside the cell results from the combination of both pressure potential and solutepotential (Figure 1.3)
Figure 1.3
If enough solute is added to the water outside the cells, water will leave the cells, moving from an area ofhigher water potential to an area of lower water potential. The loss of water from the cells will cause the cellsto lose turgor. A continued loss of water will eventually cause the cell membrane to shrink away from the cellwall (plasmolysis).

22
ProcedureWork in groups. You will be assigned one or more of the beaker contents listed in Table 1.4.For each of these, do the following:
1. Pour 100 mL of the assigned solution into a labeled 250-mL beaker. Slice a potato into discs that areapproximately 3 cm thick (see Figure 1.4).
Figure 1.4
2. Use a cork borer (approximately 5 mm in inner diameter) to cut four potato cylinders. Do not include anyskin on the cylinders. You need four potato cylinders for each beaker.
3. Keep your potato cylinders in a covered beaker until it is your mm to use the balance.
4. Determine the mass of the four cylinders together and record the mass in Table 1.4. Put the four cylindersinto the beaker of sucrose solution.
5. Cover the beaker with plastic wrap to prevent evaporation.
6. Let it stand overnight.
7. Remove the cores from the beakers, blot them gently on a paper towel, and determine their total mass.
8. Record the final mass in Table 1.4 and record class data in Table 1.5. Calculate the percentage change asyou did in Exercise IB. Do this for both your individual results and the class average.
9. Graph both your individual data and the class average for the percentage change in mass in Table 1.4.

23
Table 1.4: Potato Core - Individual DataContents In
BeakerInitial Mass Final Mass Mass Difference Percent Change
In MassClass Average
Percent Changein Mass
a) 0.0 M DistilledWater
b) 0.2 M Sucrose
c) 0.4 M Sucrose
d) 0.6 M Sucrose
e) 0.8 M Sucrose
f) 1.0 M Sucrose
Table 1.5: Potato Core Results - Class Data
Percent Change in Mass of Potato CoresContents InBeaker Group
1Group
2`Group
3Group
4Group
5Group
6Group
7Group
8Total
ClassAverage
a) 0.0 M Distilled Water
b) 0.2 M Sucrose
c) 0.4 M Sucrose
d) 0.6 M Sucrose
e) 0.8 M Sucrose
f) 1.0 M Sucrose

24
Graph 1.2 Percent Change in Mass of Potato cores at Different Molarities of Sucrose
10. Determine the molar concentration of the potato core. This would be the sucrose molarity in which themass of the potato core does not change. To find this, follow your teacher's directions to draw the straightline on Graph 1.2 that best fits your data. The point at which this line crosses the x-axis represents themolar concentration of sucrose with a water potential that is equal to the potato tissue water potential. Atthis concentration there is no net gain or loss of water from the tissue. Indicate this concentration ofsucrose in the space provided below.
Molar concentration of sucrose = __________________________ M
25
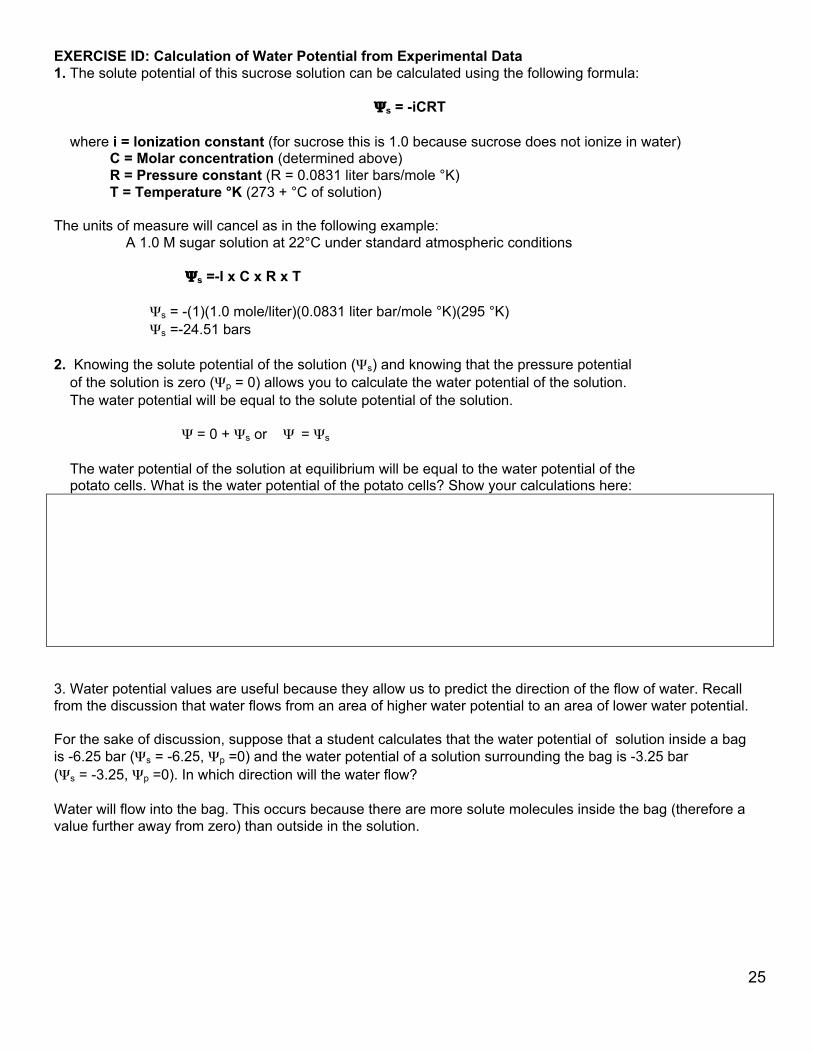
EXERCISE ID: Calculation of Water Potential from Experimental Data1. The solute potential of this sucrose solution can be calculated using the following formula:
Ψs = -iCRT
where i = lonization constant (for sucrose this is 1.0 because sucrose does not ionize in water) C = Molar concentration (determined above) R = Pressure constant (R = 0.0831 liter bars/mole °K) T = Temperature °K (273 + °C of solution)
The units of measure will cancel as in the following example: A 1.0 M sugar solution at 22°C under standard atmospheric conditions
Ψs =-I x C x R x T
Ψs = -(1)(1.0 mole/liter)(0.0831 liter bar/mole °K)(295 °K) Ψs =-24.51 bars
2. Knowing the solute potential of the solution (Ψs) and knowing that the pressure potential of the solution is zero (Ψp = 0) allows you to calculate the water potential of the solution. The water potential will be equal to the solute potential of the solution.
Ψ = 0 + Ψs or Ψ = Ψs
The water potential of the solution at equilibrium will be equal to the water potential of the potato cells. What is the water potential of the potato cells? Show your calculations here:
3. Water potential values are useful because they allow us to predict the direction of the flow of water. Recallfrom the discussion that water flows from an area of higher water potential to an area of lower water potential.
For the sake of discussion, suppose that a student calculates that the water potential of solution inside a bagis -6.25 bar (Ψs = -6.25, Ψp =0) and the water potential of a solution surrounding the bag is -3.25 bar(Ψs = -3.25, Ψp =0). In which direction will the water flow?
Water will flow into the bag. This occurs because there are more solute molecules inside the bag (therefore avalue further away from zero) than outside in the solution.

26
Questions1. If a potato core is allowed to dehydrate by sitting in the open air, would the water potential of the potatocells decrease or increase? Why?
2. If a plant cell has a lower water potential than its surrounding environment and if pressure is equal to zero,is the cell hypertonic (in terms of solute concentration) or hypotonic to its environment? Will the cell gain wateror lose water? Explain your response.
Figure 1.5
3. In Figure 1.5 the beaker is open to the atmosphere. What is the pressure potential (Ψp) of the system?
4. In Figure 1.5 where is the greatest water potential? (Circle one.)
beaker dialysis bag
5. Water will diffuse _______________ (circle one) the bag. Why?
into out of

27
6. Zucchini cores placed in sucrose solutions at 27°C resulted in the following percent changes after 24 hours:
% Change in Mass20%10%-3%
-17%-25%-30%
Sucrose MolarityDistilled Water
0.2 M0.4 M0.6M0.8 M1.0 M
7. a. Graph the results on Graph 1.3
Graph 1.3 Title: _______________________________________________________________

28
b. What is the molar concentration of solutes within the zucchini cells? _____________________
8. Refer to the procedure for calculating water potential from experimental data.
a. Calculate solute potential (Ψs) of the sucrose solution in which the mass of the zucchini cores does notchange. Show your work here:
b. Calculate the water potential (Ψ) of the solutes within the zucchini cores. Show your work here:
9. What effect does adding solute have on the solute potential component (Ψs) of that solution? Why?
10. Consider what would happen to a red blood cell (RBC) placed in distilled water:
a. Which would have the higher concentration of water molecules? (Circle one.)
Distilled H20 RBC
b. Which would have the higher water potential? (Circle one.)
Distilled H20 RBC
c. What would happen to the red blood cell? Why?

29
EXERCISE IE: Onion Cell PlasmolysisPlasmolysis is the shrinking of the cytoplasm of a plant cell in response to diffusion of water out of the cell andinto a hypertonic solution (high solute concentration) surrounding the cell as shown in Figure 1.6. Duringplasmolysis the cellular membrane pulls away from the cell wall. In the next lab exercise you will examine thedetails of the effects of highly concentrated solutions on diffusion and cellular contents.
Figure 1.6
Procedure1. Prepare a wet mount of a small piece of the epidermis of an onion. Observe under 100X magnification.Sketch and describe the appearance of the onion cells.
2. Add 2 or 3 drops of 15% NaCI to one edge of the cover slip. Draw this salt solution across the slide bytouching a piece of paper towel to the fluid under the opposite edge of the cover slip. Sketch and describe theonion cells. Explain what has happened.
3. Remove the cover slip and flood the onion epidermis with fresh water. Observe under 100X. Describe andexplain what happened.

30
Analysis of Results1. What is plasmolysis?
2. Why did the onion cells plasmolyze?
3. In the winter, grass often dies near roads that have been salted to remove ice. What causes this tohappen?

31
AP Biology LaboratoryDate: ___________________ Name and Period: ______________________________________________
AP Biology Lab 2ENZYME CATALYSIS
OVERVIEWIn this lab you will:
1. observe the conversion of hydrogen peroxide (H2O2) to water and oxygen gas by the enzyme catalase,and
2. measure the amount of oxygen generated and calculate the rate of the enzyme-catalyzed reaction.
OBJECTIVESBefore doing this lab you should understand:
• the general functions and activities of enzymes;• the relationship between the structure and function of enzymes;• the concept of initial reaction rates of enzymes;• how the concept of free energy relates to enzyme activity;• that changes in temperature, pH, enzyme concentration, and substrate concentration can affect the
initial reaction rates of enzyme-catalyzed reactions; and• catalyst, catalysis, and catalase.
After doing this lab you should be able to:• measure the effects of changes in temperature, pH, enzyme concentration, and substrate
concentration on reaction rates of enzyme-catalyzed reaction in a controlled experiment; and• explain how environmental factors affect the rate of enzyme-catalyzed reactions.
INTRODUCTIONIn general, enzymes are proteins produced by living cells; the act as catalysts in biochemical reactions. Acatalyst affects the rate of a chemical reaction. One consequence of enzyme activity is that cells can carryout complex chemical activities at relatively low temperatures.
In an enzyme-catalyzed reaction, the substance to be acted upon, the substrate (S), binds reversibly to theactive site of the enzyme (E). One result of this temporary union is a reduction in the energy required toactivate the reaction of the substrate molecule so that the products (P) of the reaction are formed. Insummary:
E + S -> ES -> E + P
Note that the enzyme is not changed in the reaction and can be recycled to break down additional substratemolecules. Each enzyme is specific for a particular reaction because its amino acid sequence is unique andcauses it to have a unique three-dimensional structure. The active site is the portion of the enzyme thatinteracts with the substrate, so that any substance that blocks or changes the shape of the active site affectsthe activity of the enzyme. A description of several ways enzyme action may be affected follows:
1. Salt Concentration. If the salt concentration is close to zero, the charged amino acid side chains ofthe enzyme molecules will attract each other. The enzyme will denature and form an inactiveprecipitate. If, on the other hand, the salt concentration is very high, normal interaction of chargedgroups will be blocked, new interactions will occur, and again the enzyme will precipitate. Anintermediate salt concentration, such as that of human blood (0.9%) or cytoplasm, is the optimum formany enzymes.

32
2. pH. pH is a logarithmic scale that measures the acidity, or H+ concentration, in a solution. The scaleruns from 0 to 14 with 0 being highest in acidity and 14 lowest. When the pH is in the range of 0-7, asolution is said to be acidic; if the pH is around 7, the solution is neutral; and if the pH is in the range of7-14, the solution is basic. Amino acid side chains contain groups, such as –COOH and -NH2, thatreadily gain or lose H+ ions. As the pH is lowered an enzyme will tend to gain H+ ions, and eventuallyenough side chains will be affected so that the enzyme’s shape is disrupted. Likewise, as the pH israised, the enzyme will lose H+ ions and eventually lose its active shape. Many enzymes performoptimally in the neutral pH range and are denatured at either an extremely high or low pH. Someenzymes, such as pepsin, which acts in the human stomach where the pH is very low, have a low pHoptimum.
3. Temperature. Generally, chemical reactions speed up as the temperature is raised. As thetemperature increases, more of the reacting molecules have enough kinetic energy to undergo thereaction. Since enzymes are catalysts for chemical reactions, enzyme reactions also tend to go fasterwith increasing temperature. However, if the temperature of an enzyme-catalyzed reaction is raisedstill further, a temperature optimum is reached; above this value the kinetic energy of the enzymeand water molecules is so great that the conformation of the enzyme molecules is disrupted. Thepositive effect of speeding up the reaction is now more than offset by the negative effect of changingthe conformation of more and more enzyme molecules. Many proteins are denatured by temperaturesaround 40-50oC, but some are still active at 70-80oC, and a few even withstand boiling.
4. Activations and Inhibitors. Many molecules other than the substrate may interact with an enzyme.If such a molecule increases the rate of the reaction it is an activator, and if it decreases the reactionit is an inhibitor. These molecules can regulate how fast the enzyme acts. Any substance that tendsto unfold the enzyme, such as an organic solvent or detergent, will act as an inhibitor. Some inhibitorsact by reducing the –S-S- bridges that stabilize the enzyme’s structure. Many inhibitors act by reactingwith side chains in or near the active site to change its shape or block it. Many well-known poisons,such as potassium cyanide and curare, are enzyme inhibitors that interfere with the active site ofcritical enzymes.
The enzyme used in this lab, catalase, has four polypeptide chains, each composed of more than500 amino acids. This enzyme is ubiquitous in aerobic organisms. One function of catalasewithin cells is to prevent the accumulation of toxic levels of hydrogen peroxide formed as abyproduct of metabolic processes. Catalase might also take part in some of the many oxidationreactions that occur in all cells.
The primary reaction catalyzed by catalase is the decomposition of H2O2 to form water and oxygen:
2 H2O2 2H2O2 + H2O2 (gas)
In the absence of catalase, this reaction occurs spontaneously but very slowly. Catalase speeds up thereaction considerably. In this experiment, a rate for this reaction will be determined.
Much can be learned about enzymes by studying the kinetics (particularly the changes in rate) of enzyme-catalyzed reactions. For example, it is possible to measure the amount of product formed, or the amountof substrate used, from the moment the reactants are brought together until the reaction has stopped.
If the amount of product formed is measured at regular intervals and this quantity is plotted on a graph, acurve like the one in Figure 2.1 is obtained.

33
Figure 2.1
Study the solid line on the graph of this reaction. At time 0 there is no product. After 20 seconds, 5micromoles (µmoles) have been formed; after 1 minute, 10 µmoles; after 2 minutes, 20 µmoles. The rateof this reaction could be given at 10 µmoles of product per minute for this initial period. Note, however,that by the third and fourth minutes, only about 5 additional µmoles of product have been formed. Duringthe first three minutes, the rate is constant. From the third minute through the eighth minute, the rate ischanging; it is slowing down. For each successive minute after the first three minutes, the amount ofproduct formed in that interval is less than in the preceding minute. From the seventh minute onward, thereaction rate is very slow.
In the comparison of the kinetics of pf one reaction with another, a common reference point is needed.For example, suppose you wanted to compare the effectiveness of catalase obtained from potato with thatof catalase obtained from liver. It is best to compare the reactions when the rates are constant. In the firstfew minutes of an enzymatic reaction such as this, the number of substrate molecules is usually so largecompared with the number of enzyme molecules that changing the substrate concentration dies not (for ashort period at least) affect the number of successful collisions between substrate and enzyme. Duringthis early period, the enzyme is acting on substrate molecules at a nearly constant rate. The slope of thegraph line during this early period is called the initial rate of the reaction. The initial rate of any enzyme-catalyzed reaction is determined by the characteristics of the enzyme molecule. It is always the same forany enzyme and its substrate at a given temperature and pH. This also assumes that the substrate ispresent in excess.
The rate of the reaction is the slope of the linear portion of the curve. To determine a rate, pick any twopoints on the straight-line portion of the curve. Divide the difference in the amount of product formedbetween these two points by the difference in time between them. The result will be the rate of thereaction, which if properly calculated, can be expressed as µmoles product/sec. The rate, then, is:
µmoles2 - µmoles1
t2 – t1
or from the graph,ΔyΔx
In the illustration of Figure 2.1, the rate between two and three minutes is calculated:
30 – 20 = 10 = 0.17 µmoles/sec 180 – 120 60
The rate of the chemical reaction may be studied in a number of ways, including the following:
1. measuring the rate of disappearance of substrate (in this example H2O2);

34
2. measuring the rate of appearance of product (in this case, O2, which is given off as a gas);3. measuring the heat released or absorbed in the reaction.
General ProcedureIn this experiment the disappearance of the substrate, H2O2 , is measured as follows (see Figure 2.2):
1. A purified catalase extract is mixed with substrate (H2O2) in a beaker. The enzyme catalyzes theconversion of H2O2 to H2O and O2 (gas).
2. Before all the H2O2 is converted to H2O and O2, the reaction is stopped by adding sulfuric acid (H2SO4).The H2SO4 lowers the pH, denatures the enzyme, and thereby stops the enzyme’s catalytic activity.
3. After the reaction is stopped, the amount of substrate (H2O2) remaining in the beaker is measured. Toassay (measure) this quantity, potassium permanganate is used. Potassium permanganate (KMnO4) inthe presence of H2O2 and H2SO4 reacts as follows.
5H2O2 + 2KMnO4 + 3H2SO4 K2SO4 + 2MnSO4 + 8H2O + 5O2
Note that H2O2 is a reactant for this reaction. Once all the H2O2 has reacted, any more KMnO4 added willbe in excess and will not be decomposed. The addition of excess KMnO4 causes the solution to have apermanent pink or brown color. Therefore, the amount of H2O2 remaining is determined by adding KMnO4
until the whole mixture stays a faint pink or brown, permanently. Add no more KMnO4 after this point. Theamount of KMnO4 added is a proportional measure of the amount of H2O2 remaining (2 molecules KMnO4
of reacts with 5 molecules H2O2 of as shown in the equation).
Figure 2.2: The General Procedure
Figure 2.3: The Apparatus and Materials
35
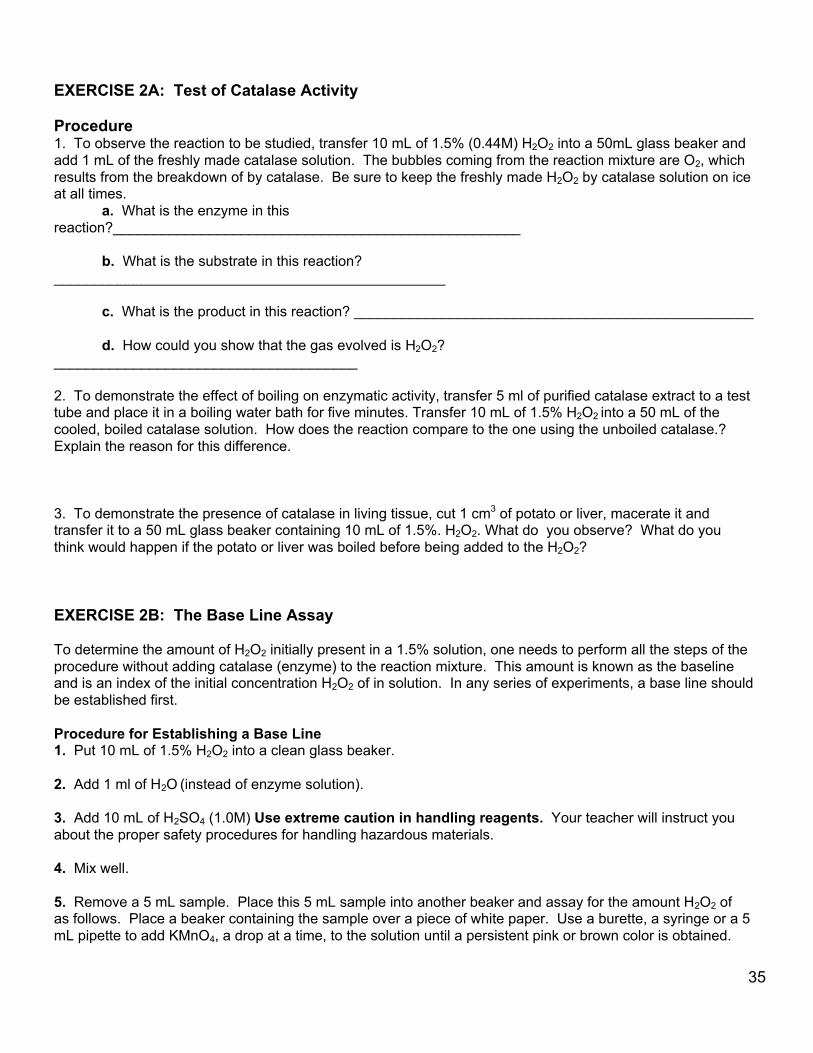
EXERCISE 2A: Test of Catalase Activity
Procedure1. To observe the reaction to be studied, transfer 10 mL of 1.5% (0.44M) H2O2 into a 50mL glass beaker andadd 1 mL of the freshly made catalase solution. The bubbles coming from the reaction mixture are O2, whichresults from the breakdown of by catalase. Be sure to keep the freshly made H2O2 by catalase solution on iceat all times.
a. What is the enzyme in thisreaction?___________________________________________________
b. What is the substrate in this reaction?_________________________________________________
c. What is the product in this reaction? __________________________________________________
d. How could you show that the gas evolved is H2O2?______________________________________
2. To demonstrate the effect of boiling on enzymatic activity, transfer 5 ml of purified catalase extract to a testtube and place it in a boiling water bath for five minutes. Transfer 10 mL of 1.5% H2O2 into a 50 mL of thecooled, boiled catalase solution. How does the reaction compare to the one using the unboiled catalase.?Explain the reason for this difference.
3. To demonstrate the presence of catalase in living tissue, cut 1 cm3 of potato or liver, macerate it andtransfer it to a 50 mL glass beaker containing 10 mL of 1.5%. H2O2. What do you observe? What do youthink would happen if the potato or liver was boiled before being added to the H2O2?
EXERCISE 2B: The Base Line Assay
To determine the amount of H2O2 initially present in a 1.5% solution, one needs to perform all the steps of theprocedure without adding catalase (enzyme) to the reaction mixture. This amount is known as the baselineand is an index of the initial concentration H2O2 of in solution. In any series of experiments, a base line shouldbe established first.
Procedure for Establishing a Base Line1. Put 10 mL of 1.5% H2O2 into a clean glass beaker.
2. Add 1 ml of H2O (instead of enzyme solution).
3. Add 10 mL of H2SO4 (1.0M) Use extreme caution in handling reagents. Your teacher will instruct youabout the proper safety procedures for handling hazardous materials.
4. Mix well.
5. Remove a 5 mL sample. Place this 5 mL sample into another beaker and assay for the amount H2O2 ofas follows. Place a beaker containing the sample over a piece of white paper. Use a burette, a syringe or a 5mL pipette to add KMnO4, a drop at a time, to the solution until a persistent pink or brown color is obtained.

36
Remember to gently swirl the solution after adding each drop. Check to be sure that you understand thecalibrations on the burette or syringe (See Figure 2.4). Record your reading in the box below.
Base line calculation Final reading of burette ________ mL
Initial reading of burette ________ mL
Base line (Final-Initial) ___________mL KMnO4
Figure 2.4: Proper Reading of a Burette
The base line assay value should be nearly the same for all groups. Compare your results toanother team’s before proceeding.
Remember the amount of KMnO4 used is proportions to the amount of H2O2 that was in solution.
Note: Handle with KMnO4 care. Avoid contact with skin and eyes.

37
EXERCISE 2C: The Uncatalyzed H2O2 Rate of Decomposition
To determine the rate of spontaneous conversion of H2O2 to H2O and O2 in an uncatalyzed reaction,put a small quantity of 1.5% H2O2 (about 15 ml) in a beaker. Store it uncovered at room temperaturefor approximately 24 hours. Repeat Steps 2-5 from Exercise 2B to determine the proportionalamount of H2O2 remaining (for ease of calculation assume the 1 mL of KMnO4 used in the titrationrepresents the presence of 1 mL of H2O2 in the solution). Record your readings in the box below.
Uncatalyzed H2O2 decomposition
Final reading of burette ________________ mL
Initial reading of burette ________________ mL
Amount of KMnO4 titrant ________________mL
Amount of spontaneously decomposed (mL baseline – mL KMnO4) _____________ mL
What percent of the spontaneouslydecomposes in 24 hours? [ (mL baseline – mL24 hours)/ mL baseline] X 100 ____________%
EXERCISE 2D: The Enzyme-Catalyzed H2O2 Rate of Decomposition
In this experiment you will determine the rate at which 1.5% H2O2solution decomposes whencatalyzed by purified catalase extract. To do this, you should determine how much H2O2 has beenconsumed after 10, 30, 60, 90, 120, 180 and 360 seconds.
If a day or so has passed since you did Exercise 2B, you must reestablish the base line bydetermining the amount of present in your 1.5% H2O2 solution. Repeat the assay procedure (Steps1-5) and record your results in the box below. The base line assay should be approximately thesame value for all groups. Check with another team before proceeding.
Base line calculation Final reading of burette ________ mL
Initial reading of burette ________ mL
Base line (Final-Initial) ___________mL KMnO4

38
Procedure for a Time-Course DeterminationTo determine the course of an enzymatic reaction, you will need to measure how much substrate isdisappearing over times. You will measure the amount of substrate decomposed after 10, 30, 60,90, 120, 180 and 360 seconds. To use lab time more efficiently, set up all of these at the same timeand do them together. Stop each reaction at the proper time.
1. 10 secondsa. Put 10 mL of 1.5 % H2O2 in a clean 50 ml glass beaker.b. Add 1 mL of catalase extract.c. Swirl gently for 10 seconds.d. At 10 seconds, add 10 mL of H2SO4 (1.0 M).
2. 30, 60, 90, 120, 180 and 360 secondsEach time, repeat steps 1 a-d as described above, except for allowing the reaction toproceed for 30, 60, 90, 120, 180 and 360 seconds, respectively, while swirling gently.
Note: Each time, remove a 5 mL sample and assay for the amount of H2O2 in the sample.Use a burette to add KMnO4, one drop at a time, to the solution until a persistent pink orbrown color is obtained. Should the end point be overshot, remove another 5 mL sample andrepeat the titration. Do not discard any solutions until the entire lab is completed. Recordyour results in Table 2.1 and Graph 2.1.
Table 2.1
Time (seconds)KMnO4
(ml) 10 30 60 90 120 180 360
a) Base line*
b) Final reading
c) Initial reading
d) Amount of KMnO4 Consumed (B minusC)
e) Amount of H2O2 Used (A minus D)
3. Record the base line value, obtained in Exercise 2D, in all of the boxes on line A in Table2.1.
• Remember that the base line tells how much H2O2 is in the initial 5 mL sample. The difference between theinitial and final readings tells how much H2O2 is left after the enzyme-catalyzed reaction. The shorter the time,the more H2O2 remains and therefore, the more KMnO4 is necessary to titrate to the endpoint. If syringes areused, KMnO4 consumed may be calculate as c – b.

39
4. Graph the data for enzyme-catalyzed H2O2 decomposition. For this graph you will need to determine the following:
a. The independent variable: ___________________ Use this value to label the horizontal (x) axis.
b. The dependent variable: ____________________ Use this value to label the vertical (y) axis.
Graph 2.1 Title: ______________________________________

40
Analysis of Results1. From the formula described earlier recall that rate = Δy
ΔxDetermine the initial rate of the reaction and the rates between each of the time points.Record the rates in the table below.
Time Intervals (secondsInitial 0 to10
10 to 30 30 to 60 60 to 90 90 to 120 120 to180
180 to360
Rates*
* Reaction rate (mL H2O2 /sec)
2. When is the rate the highest? Explain why?
3. When is the rate the lowest? For what reasons is the rate low?
4. Explain the inhibiting effect of sulfuric acid on the function of catalase Relate this toenzyme structure and chemistry?
5. Predict the effect that lowering the temperature would have on the rate on enzyme activity.Explain your prediction.
6. Design a controlled experiment to test the effect of varying pH, temperature or enzymeconcentration.

41
AP Biology LaboratoryDate: ___________________ Name and Period: ______________________________________________
AP Biology Lab 3
MITOSIS AND MEIOSIS
OVERVIEWIn this lab you will investigate the process of mitosis and meiosis:
1. You will use prepared slides of onion root tips to study plant mitosis and to calculate the relativeduration of the phases of mitosis in the meristem of root tissue. Prepared slides of whitefishblastula may be used to study mitosis in animal cells and to compare animal mitosis with plantmitosis.
2. You will simulate the stages of meiosis by using chromosome models. You will study crossing over andrecombination that occurs during meiosis. You will observe the arrangements of ascospores in the ascifrom a cross between wild type Sordaria fimicola and mutants for tan spore coat color in this fungus.These arrangements will be used to estimate the percentage of crossing over that occurs between thecentromere and the gene that controls the tan spore color.
OBJECTIVESBefore doing this lab you should understand:
• The events of mitosis in plant and animal cells;• The events of meiosis (gametogenesis in animals and sporogenesis in plants); and• The key mechanical and genetic differences between meiosis and mitosis.
After doing this lab you should be able to:• Recognize the stages of mitosis in a plant or animal cell;• Calculate the relative duration of the cell cycle stages;• Describe how independent assortment and crossing over can generate genetic variation among the
products of meiosis;• Use chromosome models to demonstrate the activity of chromosomes during meiosis I and meiosis II;• Relate chromosome activity to Mendel’s laws of segregation and independent assortment;• Demonstrate the role of meiosis in the formation of gametes or spores in a controlled experiment using
an organism or your choice;• Calculate the map distance of a particular gene from a chromosome’s centromere or between two
genes using an organism of your choice;• Compare and contrast the results of meiosis and mitosis in plant cells; and• Compare and contrast the results of meiosis and mitosis in animal cells.
INTRODUCTIONAll new cells come from previously existing cells. New cells are formed by the process of cell division, whichinvolves both division of the cell’s nucleus (karyokinesis) and the division of the cytoplasm (cytokinesis).
There are two types of nuclear division: mitosis and meiosis. Mitosis typically results in new somatic (body)cells. Formation of an adult organism from a fertilized egg, asexual reproduction, regeneration andmaintenance or repair of body parts are accomplished through mitotic cell division. You will study mitosis inExercise 2A. Meiosis results in the formation of either gametes (in animals) or spores (in plants). Thesecells have half the number of chromosome number of the parent ell. You will study meiosis in Exercise 3B.

42
Where does one find cell undergoing mitosis? Plant and animals differ in this respect. In higher plants theprocess of forming new cells is restricted to special growth regions called meristems. These regions usuallyoccur at the tips of stems or roots. In animals, cell division occurs anywhere new cells re formed or as newcells replace old ones. However, some tissues in both plants and animals rarely divide once the organism ismature.To study the stages of mitosis, you need to look for tissues where there are many cells in the process ofmitosis. This restricts your search to the tips of growing plants, such as the onion root tip, or in the case ofanimals, to developing embryos, such as the whitefish blastula.
EXERCISE 3A.1: Observing Mitosis in Plant and Animal Cells Using Prepared Slides of the Onion RootTip and Whitefish Blastula
Roots consist of different regions (see Figure 3.1a). The root cap functions in protection. The apicalmeristem (Figure 3.1b) is the region that contains the highest percentage of cells undergoing mitosis. Theregion of elongation is the area in which growth occurs. The region of maturation is where root hairsdevelop and where cells differentiate to become xylem, phloem and other tissues.
Figure 3.1a: Median Longitudinal Section Figure 3.1b: Apical Meristem Tip CloseUp

43
Figure 3.2: Whitefish Blastula
The whitefish blastula is often used for the study of cell division. As soon s the egg is fertilized, it begins todivide and nuclear division follows. You will be provided with slides of whitefish blastula, which have beensectioned in various planes in relation to the mitotic spindle. You will be able to seed side and polar views ofthe spindle apparatus.
PROCEDUREExamine prepared slides of either onion root tips or whitefish blastula. Locate the meristematic region of theonion, or locate the blastula with the 10X objective and then use the 40X objective to study individual cells.For convenience in discussion, biologists have described certain stages, or phases, of the continuous mitoticcell cycle, as outlined on this page and the next. Identify one cell that clearly represents each phase. Sketchand label the cell in the boxes provided.
1. The nondividing cell is in a stage called interphase. The nucleusmay have one or more dark-stained nucleoli and is filled with afine network of threads, the chromatin. During interphase DNAreplication occurs.
Interphase

44
Figure 3.32. The first sign of division occurs in
prophrase. There is a thickening of thechromatin, threads, which continuesuntil is evident that the chromatin hascondensed into chromosomes (Figure3.3). With somewhat highermagnification you may be able to seethat each chromosome is composed oftwo chromatids joined at acentromere. As prophase continues,the chromatids continue to shorten andthicken. In late prophrase the nuclearenvelope and nucleoli are no longervisible, and the chromosomes are free inthe cytoplasm. Just before this time, thefirst sign of a spindle appears in thecytoplasm; the spindle apparatus ismade up of microtubules, and it isthought that these microtubules may pullthe chromosomes towards the poles ofthe spindle where the two daughternuclei will eventually form.
Prophase
3. At metaphase the chromosomes have moved to the center of thespindle. One particular portion of each chromosome, thecentromere, attaches to the spindle. One particular portion ofeach chromosome, the centromere, attaches to the spindle. Thecentromeres of all the chromosomes lie at about the same level ofthe spindle, on a plane called the metaphase plate. At metaphaseyou should be able to observe the two chromatids of some of thechromosomes.
Metaphase

45
4. At the beginning of anaphase, the centromere regions of each pairof chromatids separate and are moved by the spindle fibers towardopposite poles of the spindle, dragging the rest of the chromatidbehind them. Once the two chromatids separated, each is called achromosome. These daughter chromosomes continue theirpoleward movement until they form two compact clumps, one at eachspindle pole.
Anaphase
5. Telophase, the last stage of division, is marked by a pronouncedcondensation of the chromosomes, followed by the formation of a newnuclear envelope around each group of chromosomes. Thechromosomes gradually uncoil to form the fine chromatin networkseen in interphase, and the nucleoli and nuclear envelope reappear.Cytokinesis may occur. This is the division of the cytoplasm into twocells. In plants, a new cell wall is laid down between the daughtercells. In animal cells. The old cell will pinch off in the mille along acleavage furrow to form two new daughter cells.
Telophase
Analysis Questions
1. Explain how mitosis leads to two daughter cells, which of which is diploid and geneticallyidentical to the original cell. What activities are going on in the ell during interphase?
2. How does mitosis differ in plant and animal cells? How does the plant mitosis accommodate a rigid,inflexible cell wall?
3. What is the role of the centrosome (the area surrounding the Centrioles)? Is it necessary for mitosis?Defend your answer.

46
EXERCISE 3A.2: Time for Cell Replication
To estimate the relative length of time that a cell spends in the various stages of cell division, you will examinethe meristematic region of a prepared slide of the onion root tip. The length of the cell cycle is approximately24 hours for cell in actively dividing onion root tips.
ProcedureIt is hard to imagine that you can estimate how much time a cell spends in each phase of cell division from aslide of dead cells, yet this is precisely what you will do in this part of the lab. Sine you are working with aprepared slide, you cannot get information about how long it takes a slide to divide. What you can determineis how many cells are in each phase. From this, you can infer the percentage of time each cell spends ineach phase.
1. Observe every cell in one high-power field of view and determine which phase of the cell cycleit is in. This is best done in pairs. The partner observing the slide calls out the phase of eachcell while the other partner records. Then switch so the recorder becomes the observer andvice versa. Count at least two full fields of view. If you have not counted at least 200 cells thencount a third field of view.
2. Record your data in Table 3.1.
3. Calculate the percentage of cells in each phase, and record in Table 3.1.
Consider that it takes, on average, 24 hours (or 1,440 minutes) for each onion root tip cell to complete thecell cycle. You can calculate the amount of time spent in each phase of the cell cycle form the percentageof cells in that stage.
Percentage of cells in stage X 1,440 minutes = ________ minutes of cell cycle spent in stage
Table 3.1Number of Cells
Field 1 Field 2` Field 3 Field 4
Percent ofTotal CellsCounted
Time inEach Stage
Interphase
Prophase
Metaphase
Anaphase
Telophase
Total Cells Counted

47
QUESTIONS
1. If your observations had not been restricted to the area of the root tip that is actively dividing, howwould your results have been different?
2. Based on the data in Table 3.1, what can you infer about the relative length of time an onion root tipcell spends in each stage of cell division?
3. Draw and label a pie chart of the onion root tip cell cycle using the data from Table 3.1
Title: ____________________
EXERCISE 3B:Meiosis
Meiosis involves two successive nuclear divisions that produce two haploid cells. Meiosis I is the reductiondivision. It is their first division that reduces the chromosome number from diploid to haploid and separatesthe homologous pairs. Meiosis II, the second division, separates the sister chromatids. The result is fourhaploid gametes.
Mitotic cell division produces new cells genetically identical to the parent cell. Meiosis increases geneticvariation in the population. Each diploid cell undergoing meiosis can produce 2n differentchromosomal combinations, where n is the haploid number. In humans the number is 223, which is more thaneight million combinations. Actually, the potential variation is even greater because, during meiosis I, eachpair of chromosomes (homologous chromosomes) comes together in a process known as synapsis.Chromatids of homologous chromosomes may exchange parts in a process called crossing over. The relativedistance between two genes on a given chromosome can be estimated by calculating the percentage ofcrossing over that takes place between them.

48
EXERCISE 3B.1: Simulation of Meiosis
In this exercise you will study the process of meiosis by using chromosome simulation kits and following thedirections in Figures 3.4 – 3.8. Your kit should contain two strands of beads of one color and two strands ofanother color. A homologous pair of chromosomes is represented by one strand of each color, with one ofeach pair coming from each parent. The second strands of each color are to be used as chromatids for eachof these chromosomes.
Figure 3.4
Interphase. Place one strand of each color near the center of your work area. (Recall that chromosomes atthis stage would exist as diffuse chromatin and not as visible structures.) DNA synthesis occurs duringinterphase, and each chromosome, originally composed of one strand, is now made up of two strands, orchromatids, joined together at the centromere region. Simulate DNA replication by bringing the magneticcentromere region of one strand in contact with the centromere region of the other of the same color. Do thesame with the homolog.
Summary: DNA replication
Figure 3.5
Prophase I. Homologous chromosomes come together and synapse along their entire length. This pairing,or synapsis, of homologous chromosomes represents the first big difference between mitosis and meiosis. Atetrad, consisting of four chromatids, is formed. Use the models of two chromosomes to simulate synapsisand the process of crossing over. Crossing over can be simulated by popping the beads apart on onechromatid at the fifth bead, or “gene,” and doing the same with the other chromatid. Reconnect the beads tothose of the other color. Proceed through prophase I of meiosis and not how crossing over results inrecombination of genetic information. The visual result of crossing over is called a chiasma (pluralchiasmata).

49
Summary: Synapsis and Crossing Over
Figure 3.6
Metaphase I. The crossed-over tetrads line up in the center of the cell. Position the chromosomes near themiddle of the cell.
Summary: Tetrads align on equator
Figure 3.7
Anaphase I. During anaphase I the homologous chromosomes separate and are “pulled” to opposite ends ofthe cell. This represents a second significant difference between the events of mitosis and meiosis.
Summary: Homologs separate Chromosome number is reduced

50
Figure 3.8
Telophase I. Place each chromosome at opposite sides of the cell. Formation of a nuclear envelope anddivision of the cytoplasm (cytokinesis) often occur at this time to produce two cells, but this is not always thecase. Notice that each chromosome within the two daughter cells still consists of two chromatids.
Summary: 2 haploid cells formed Each chromosome composed of 2 chromatids
Interphase II (Interlines). The amount of time spent “at rest” following Telophase I depends on the type oforganism, the formation of new nuclear envelopes, and the degree of chromosomal uncoiling. Becauseinterphase II does not necessarily resemble interphase I, it is often given another name – interkinesis. DNAreplication does not occur during interkinesis. This represents a third difference between mitosis andmeiosis.
Meiosis II
A second meiotic division is necessary to separate the chromatids of the two chromosomes in the twodaughter cells formed by this first division. This will reduce the amount of DNA to one strand perchromosome. This second division is called meiosis II. It resembles mitosis except that only one homologfrom each homologous pair of chromosomes is present in each daughter cell undergoing meiosis II.
The following simulation procedures apply to haploid nuclei produced by meiosis I.
Figure 3.9
Prophase II. No DNA replication occurs. Replicated Centrioles (not shown) separate and move to oppositesides of the chromosome groups.

51
Figure 3.10
Metaphase II. Orient the chromosomes so that they are centered in the middle of each daughter cell.
Figure 3.11
Anaphase II. The centromere regions of the chromatids now appear to be separate. Separate thechromatids of the chromosomes and pull the daughter chromosomes toward the opposite sides of eachdaughter cell. Now that each chromatid has its own visible separate centromere region, it can be called achromosome.
Summary: Chromatids separate
Figure 3.12
Telophase II. Place the chromosomes at opposite sides of the dividing cell. At this time a nuclear envelopeforms and, in our simulation, the cytoplasm divides.

52
Analysis and Investigation
1. List three major differences between the events of mitosis and meiosis.1.
2.
3.
2. Compare mitosis and meiosis with respect to each of the following in Table 3.2:
Table 3.2
Mitosis MeiosisChromosome Number of ParentCellsNumber of DNA Replications
Number of Divisions
Number of Daughter Cells
Chromosome Number of DaughterCellsPurpose/ Function
3. How are meiosis I and meiosis II different?

53
4. How do oogenesis and spermatogenesis differ?
5. Why is meiosis important for sexual reproduction?
Exercise 3B.2: Crossing Over during Meiosis in Sordaria
Sordaria fimicola is an ascomycete fungus that can be used to demonstrate the results of crossing over duringmeiosis. Sordaria is a haploid organism for most of its life cycle. It becomes diploid only when the fusion ofthe mycelia (filamentlike groups of cells) of two different strains results in the fusion of the two different typesof haploid nuclei to form a diploid nucleus. The diploid nucleus must then undergo meiosis to resume itshaploid state.
Meiosis, followed by one mitotic division, in Sordaria, results in the formation of eight haploid ascosporescontained within a sac called an ascus (plural, asci). Many asci are contained within a fruiting body called aperithecium (ascocarp). When ascospores are mature the ascus ruptures, releasing the ascospores. Eachascospore can develop into a new haploid fungus. The life cycle of Sordaria fimicola is shown in Figure 3.13.
Figure 3.13: The Life Cycle of Sordaria fimicola

54
To observe crossing over in Sordaria, one must make hybrids between the wild type and mutant strains ofSordaria. Wild type Sordaria have black ascospores (+). One mutant strain has tan spores (TN). Whenmycelia of these two different strains come together and undergo meiosis, the asci that develop will containfour black ascospores and four tan ascospores. The arrangement of the spores directly reflects whether ornot crossing over has occurred. In Figure 3.14 no crossing over has occurred. Figure 3.15 shows the resultsof crossing over between the centromere of the chromosome and the gene for ascospore color.
Figure 3.14: Meiosis with No Crossing Over
Formation of Noncrossover Asci
Two homologous chromosomes line up at metaphase I of meiosis. The two chromatids of one chromosomeeach carry the gene for tan spore color (tn) and the two chromatids of the other chromosome carry the genefor wide type spore color (+).

55
The first meiotic division (MI) results in two cells, each containing just one type of spore color gene (either tanor wild type). Therefore, segregation of these genes has occurred at the first meiotic division (MI). Each cellis haploid at the end of meiosis I.
The second meiotic division (MII) results in four haploid cells, each with the haploid number of chromosomes(1N).
A mitotic division simply duplicates these cells, resulting in 8 spores. They are arranged in the 4:4 pattern.
Figure 3.15: Meiosis with Crossing Over
In this example crossing over has occurred in the region between the gene for spore color and thecentromere. The homologous chromosomes separate during meiosis I.
This time the MI results in two cells, each containing both genes (1 tan, 1 wild type); therefore, the genes forspore color have not yet segregated, although the cells are haploid.
Meiosis II (MII) results in segregation of the two types of genes for spore color.
A mitotic division results in 8 spores arranged in the 2:2:2:2 or 2:4:2 pattern. Any one of these sporearrangements would indicate that crossing over has occurred between the gene for spore coat color and thecentromere.
Procedure
1. Two strains of Sordaria (wild type and tan mutant) have been inoculated on a plate of agar. Where themycelia of the two strains meet (Figure 3.16), fruiting bodies called perithecia develop. Meiosis occurswithin the perithecia during the formation of the asci. Use a toothpick to gently scrape the surface of theagar to collect perithecia (the black dots in the figure below).
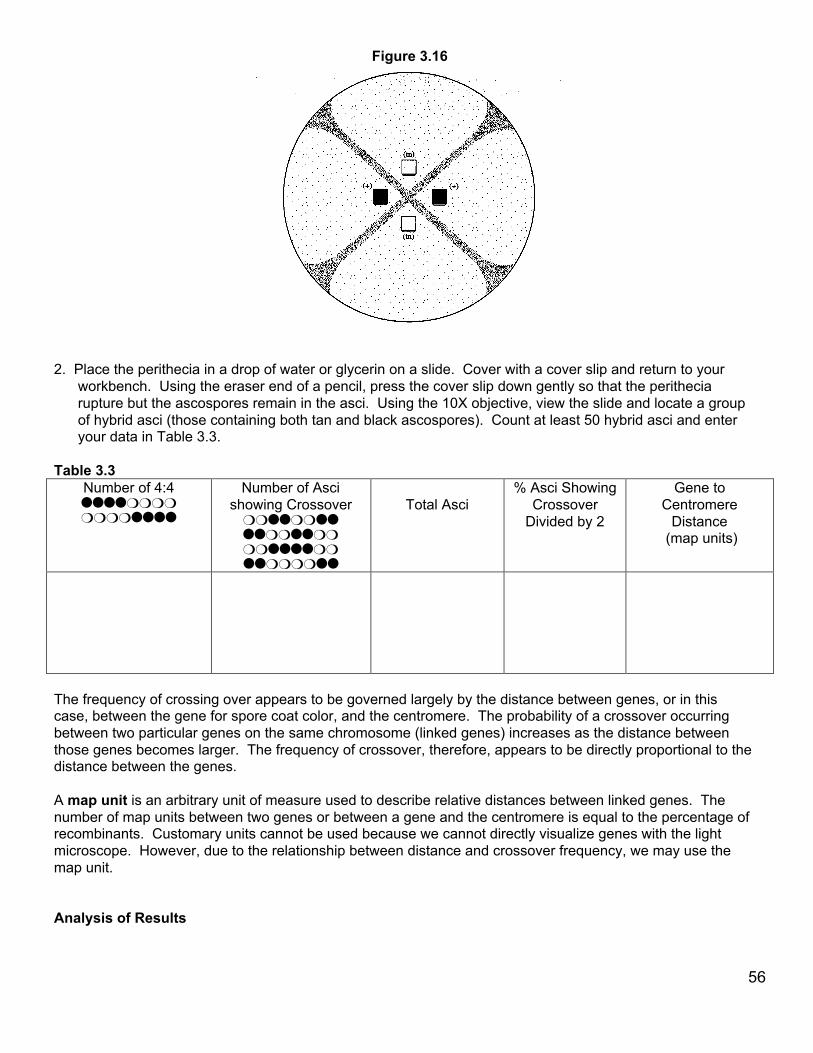
56
Figure 3.16
2. Place the perithecia in a drop of water or glycerin on a slide. Cover with a cover slip and return to yourworkbench. Using the eraser end of a pencil, press the cover slip down gently so that the peritheciarupture but the ascospores remain in the asci. Using the 10X objective, view the slide and locate a groupof hybrid asci (those containing both tan and black ascospores). Count at least 50 hybrid asci and enteryour data in Table 3.3.
Table 3.3Number of 4:4
Number of Ascishowing Crossover
Total Asci% Asci Showing
CrossoverDivided by 2
Gene toCentromere
Distance (map units)
The frequency of crossing over appears to be governed largely by the distance between genes, or in thiscase, between the gene for spore coat color, and the centromere. The probability of a crossover occurringbetween two particular genes on the same chromosome (linked genes) increases as the distance betweenthose genes becomes larger. The frequency of crossover, therefore, appears to be directly proportional to thedistance between the genes.
A map unit is an arbitrary unit of measure used to describe relative distances between linked genes. Thenumber of map units between two genes or between a gene and the centromere is equal to the percentage ofrecombinants. Customary units cannot be used because we cannot directly visualize genes with the lightmicroscope. However, due to the relationship between distance and crossover frequency, we may use themap unit.
Analysis of Results

57
1. Using your data in Table 3.3, determine the distance between the gene for spore color and thecentromere. Calculate the percentage of crossovers by dividing the number of crossover asci (2:2:2:2 or2:4:2) by the total number of asci X 100. To calculate map distance, divide the percentage of crossover asciby 2. The percentage of crossover asci is divided by 2 because only half the spores in each ascus are theresult of a crossover event (Figure 3.3).
2. Draw a pair of chromosomes in Mi and MII and who how you would get a 2:4:2 arrangement ofascospores by crossing over. (Hint: refer to Figure 3.15).

58
AP Biology LaboratoryDate: ___________________ Name and Period: ______________________________________________
AP Biology Lab 4
PLANT PIGMENTS AND PHOTOSYNTHESIS
OVERVIEWIn this lab you will:
1. separate plant pigments using chromatography, and2. measure the rate of photosynthesis in isolated chloroplasts using the dye DPIP.
The transfer of electrons during the light-dependent reactions of photosynthesis reduces DPIP, changing itfrom blue to colorless.
OBJECTIVESBefore doing this lab you should understand:
• how chromatography separates two or more compounds that are initially present in the mixture;• the process of photosynthesis;• the function of plant pigments;• the relationship between light wavelength and photosynthetic rate; and• the relationship between light intensity and photosynthetic rate.
After doing this lab you should be able to:• separate pigments and calculate their Rf values;• describe a technique to determine photosynthetic rates;• compare photosynthetic rates at different light intensities or different wavelengths of light using
controlled experiments; and• explain why the rate of photosynthesis varies under different environmental conditions.
EXERCISE 4A: Plant Pigment ChromatographyPaper chromatography is a useful technique for separating and identifying pigments and other molecules fromcell extracts that contain a complex mixture of molecules. The solvent moves up the paper by capillary action,which occurs as a result of the attraction of solvent molecules to the paper and the attraction of solventmolecules to one another. As the solvent moves up the paper, it carries along any substances dissolved in it.The pigments are carried along at different rates because they are not equally soluble in the solvent andbecause they are attracted, to different degrees, to the fibers in the paper through the formation ofintermolecular bonds, such as hydrogen bonds.
Beta carotene, the most abundant carotene in plants, is carried along near the solvent front because it is verysoluble in the solvent being used and because it forms no hydrogen bonds with cellulose. Another pigment,xanthophylls, differs from carotene in that it contains oxygen. Xanthophylls is found further from the solventfront because it is less soluble in the solvent and has been slowed down by hydrogen bonding to thecellulose. Chlorophylls contain oxygen and nitrogen and are bound more tightly to the paper than are theother pigments.
Chlorophyll a is the primary photosynthetic pigment in plants. A molecule of chlorophyll a is located at thereaction center of photosystems. Other chlorophyll a molecules, chlorophyll b and the carotenoids (that is,carotenes and xanthophylls) capture light energy and transfer it to the chlorphyll a at the reaction center.Carotenoids also protect the photosynthetic system from the damaging effects of ultraviolet light.

59
ProcedureYour teacher will demonstrate the apparatus and techniques used in paper chromatography. Here is asuggested procedure, illustrated in Figure 4.1.
1. Obtain a 50-ml graduated cylinder that has 1 cm of solvent in the bottom. The cylinder is tightlystoppered because this solvent is volatile, and you should be careful to keep the stopper on as muchas possible.
2. Cut a piece of filter paper that will be long enough to reach the solvent. Cut one end of this filter paperinto a point. Draw a pencil line 1.5 cm above the point.
3. Use a coin to extract the pigments from spinach leaf cells. Place a small section of leaf on the top ofthe pencil line. Use the ribbed edge of the coin to crush the cells. Be sure that the pigment line is ontop of the pencil line. You should repeat this procedure 8 to 10 times, being sure to use a new portionof the leaf each time.
4. Place the chromatography paper in the cylinder so that the pointed end is barely immersed in thesolvent. Do not allow the pigment to be in the solvent.
5. Stopper the cylinder. When the solvent is about 1 cm from the top of the paper, remove the paper andimmediately mark the location of the solvent front before it evaporates.
6. Mark the bottom of each pigment band. Measure the distance each pigment migrated from the bottomof the pigment origin to the bottom of the separated pigment band. In Table 4.1 record the distancethat each front, including the solvent front, moved. Depending on the species of plant used, you maybe able to observe 4 or 5 pigment bands.
Figure 4.1

60
Table 4.1Distance Moved by Pigment Band (millimeters)
Band Number Distance Band Color
1.
2.
3.
4.
5.
Distance Solvent Front Moved _________ (mm)
Analysis of ResultsThe relationship of the distance moved by a pigment to the distance moved by the solvent is a constant calledRf. It can be calculated for each of the four pigments using the following formula:
Rf = distance pigment migrated (mm) distance solvent front migrated (mm)Record your Rf values in Table 4.2.
Table 4.2
________________ = Rf for Carotene (yellow to yellow orange)
________________ = Rf for Xanthophyll (yellow)
________________ = Rf for Chlorophyll a (bright green to blue green)
________________ = Rf for Chlorophyll b (yellow green to olive green)
Topics for Discussion
1. What factors are involved in the separation of the pigments?
2. Would you expect the Rf value of a pigment to be the same if a different solvent were used? Explain.
3. What type of chlorophyll does the reaction center contain? What are the roles of the other pigments?

61
EXERCISE 4B: Photosynthesis/The Light Reaction
Light is a part of a continuum of radiation, or energy waves. Shorted wavelengths of energy have greateramounts of energy. For example, high-energy ultraviolet rays can harm living tissues. Wavelengths of lightwithin the visible part of the light spectrum power photosynthesis.
When light is absorbed by leaf pigments, electrons within each photosynthesis are boosted to a higherenergy level, and this energy is used to produce ATP and to reduce NADP to NADPH. ATP and NADPHare then used to incorporate CO2 into organic molecules, a process called carbon fixation.
Design of the Exercise
Photosynthesis may be studied in a number of ways. For this experiment a dye-reduction technique will beused. The dye-reduction experiment tests the hypothesis that light and chloroplasts are required for thelight reactions to occur. In place of the electron acceptor, NADP, the compound DPIP (2,6-dichlorophenol-indophenol), will be substituted. When light strikes the chloroplasts, electrons boosted to high energylevels will reduce DPIP. It will chance from blue to colorless.
In this experiment chloroplasts are extracted from spinach leaves and incubated with DPIP in thepresence of light. As the DPIP is reduced and becomes colorless, the resultant increase in lighttransmittance is measured over a period of time using a spectrophotometer. The experimental designmatrix is presented in Table 4.3.
Table 4.3: Photosynthesis Setup
Cuvettes
1Blank
(no DPIP)
2Unboiled
ChloroplastsDark
3Unboiled
ChloroplastsLight
4Boiled
ChloroplastsLight
5No
ChloroplastsLight
PhosphateBuffer
1 mL 1mL 1 mL 1 mL 1 mL
Distilled H2O 4 mL 3 mL 3 mL 3 mL3 mL + 3
dropsDPIP - 1 mL 1 mL 1 mL 1 mL
UnboiledChloroplasts
3 drops 3 drops 3 drops - -
BoiledChloroplasts - - - 3 drops -
Procedure1. Turn on the spectrophotometer to warm up the instrument and set the wavelengths to 605 nm by
adjusting the wavelength control knob.
2. While the spectrophotometer is warming up, your teacher may demonstrate how to prepare achloroplast suspension from spinach leaves.
3. Set up an incubation area that includes a light, water flask, and test tube rack (see Figure 4.2). Thewater in the flask acts as a heat sink by absorbing most of the light’s infrared radiation while havinglittle effect on the light’s visible radiation.

62
Figure 4.2: Incubation Setup
4. Your teacher will provide you with two beakers, one containing a solution of boiled chloroplasts andthe other one containing unboiled chloroplasts. Be sure to keep both beakers on ice at all times.
5. At the top rim, label the cuvettes 1, 2, 3, 4, and 4, respectively. Be sure to follow your teacher’sdirections on how to label cuvettes. Using lens tissue, wipe the outside walls of each cuvette(remember: handle cuvettes onto near the top). Cover the walls and bottom of cuvette 2 with foil andmake a foil cap to cover the top. Light should not be permitted inside cuvette 2 because it is a controlfor this experiment.
6. Refer to Table 4.3 to prepare each cuvette. Do not add unboiled chloroplasts yet. To each cuvette,add 1 mL of phosphate buffer. To cuvette 1, add 4 mL of distilled H2O. To cuvettes 2, 3, and 4, add 3mL of distilled H2O and 2 mL of DPIP. To cuvette 5, add 3 mL plus 3 drops of distilled water, and 1 mLof DPIP.
7. Bring the spectrophotometer to zero by adjusting the amplifier control knob until the meter reads 0%transmittance. Add 3 drops of unboiled chloroplasts to cuvette 1. Cover the top with Parafilm ® andinvert to mix. Insert cuvette 1 into the sample holder and adjust the instrument to 100% transmittanceby adjusting the light-control knob. Cuvette 1 is the blank to be used to recalibrate the instrumentbetween readings. In other words, you will measure the light transmitted through each of the othertubes as a percentage of the light transmitted through this tube. For each reading, make sure that thecuvettes are inserted into the sample holder so that they face the same way as in the previousreading.
8. Obtain the unboiled chloroplast suspension, stir to mix, and transfe 3 drops to cuvette 2. Immediatelycover and mix cuvette 2. Then remove it from the foil sleeve and insert it into the spectrophotometer’ssample holder, read the % transmittance, and record it as the time 0 reading in Table 4.4. Replacecuvette 2 in the foil sleeve and place it in the incubation test tube rack. Turn on the flood light. Takeand record additional readings at 5, 10, and 15 minutes. Mix the cuvettes contents just prior to eachreading. Remember to use cuvette 1 occasionally to check and adjust the spectrophotometer to 100%transmittance.
9. Obtain the unboiled chloroplast suspension, mix, and transfer 3 drops to cuvette 3. Immediately coverand mix cuvette 4. Insert into the sample holder, read the % transmittance, and record it in Table 4.4.Place cuvette 3 in the incubation test tube rack next to cuvettes 2 and 3. Take and record additionalreadings at 5, 10, and 15 minutes. Mix the cuvette’s contents just prior to each reading. Remember touse cuvette 1 occasionally to check and adjust the spectrophotometer to 100% transmittance.

63
10. Obtain the boiled chloroplast suspension, and mix, and transfer 3 drops to cuvette 4. Immediatelycover and mix cuvette 4. Insert into sample holder, read the % transmittance, and record it in Table4.4. Place cuvette 4 in the incubation test tube rack next to cuvettes 2 and 3. Take and recordadditional readings at 5, 10, and 15 minutes. Mix the cuvette’s contents just prior to each reading.Remember to use cuvette 1 occasionally to check and adjust the spectrophotometer to 100%transmittance.
11. Cover and mix the contents of cuvette 5. Insert it into the sample holder, read the % transmittance,and record it in Table 4.4. Place cuvette 5 in the incubation test tube rack next to tubes 2, 3, and 4.Take additional readings at 5, 10, and 15 minutes. Mix the cuvette’s contents just prior to eachreading. Remember to use cuvette 1 occasionally to check and adjust the spectrophotometer to 100%transmittance.
Table 4.4: Transmittance (%)
Time (minutes)Cuvette 0 5 10 15
2 Unboiled/Dark
3 Unboiled/Light
4 Boiled/Light
5 No Chloroplasts/Light
Analysis of Results
Plot the percentage of transmittance from the four cuvettes on Graph 4.1.Label each plotted line.
For this graph you will need to determine the following:
a. The independent variable: _______________________________________Use this to label the horizontal (x) axis.
b. The dependant variable: _________________________________________Use this to label the vertical (y) axis.

64
Graph 4.1 Title: ______________________________________________________

65
Topics for Discussion
1. What is the function of DPIP in this experiment?
2. What molecule found in chloroplasts does DPIP “replace” in this experiment?
3. What is the source of the electrons that will reduce DPIP?
4. What was measured with the spectrophotometer in this experiment?
5. What is the effect of darkness on the reduction of DPIP? Explain.
6. What is the effect of boiling the chloroplasts on the subsequent reduction of DPIP? Explain.
7. What reasons can you give for the difference in the percentage of transmittance between the livechloroplasts that were incubated in the light and those that were kept in the dark?
8. Identify the function of each of the cuvettes.Cuvette 1: __________________________________________________________________
__________________________________________________________________
Cuvette 2: __________________________________________________________________
__________________________________________________________________
Cuvette 3: __________________________________________________________________
__________________________________________________________________
Cuvette 4: __________________________________________________________________
__________________________________________________________________
Cuvette 5: __________________________________________________________________
__________________________________________________________________

66
AP Biology LaboratoryDate: ___________________ Name and Period: ______________________________________________
AP Biology Lab 5
CELL RESPIRATIONOVERVIEW
In this experiment you will work with seeds that are living but dormant. A seed contains an embryo plant and afood supply surrounded by a seed coat. When the necessary conditions are met, germination occurs and therate of cellular respiration greatly increases. In this lab you will
1. measure oxygen consumption during germination,
2. measure the change in gas volume in respirometers containing either germinating ornongerminating pea seeds, and
3. measure the rate of respiration of these peas at two different temperatures.
OBJECTIVES
Before doing this lab you should understand: • respiration, dormancy, and germination; • how a respirometer works in terms of the gas laws; • the general processes of metabolism in living organisms; and • how the rate of cellular respiration relates to the amount of activity in a cell.
After doing this lab you should be able to: • calculate the rate of cell respiration from experimental data; • relate gas production to respiration rate; • test the rate of cellular respiration in germinating versus nongerminated seeds in a controlled
experiment; and • test the effect of temperature on the rate of cell respiration in germinating versus nongerminated seeds
in a controlled experiment.
INTRODUCTION
Aerobic cellular respiration is the release of energy from organic compounds by metabolic chemicaloxidation in the mitochondria within each cell. Cellular respiration involves a series of enzyme-mediatedreactions.
The equation below shows the complete oxidation of glucose. Oxygen is required for this energy-releasingprocess to occur.
C6H12O6 + 6 02 -> 6 CO2 + 6 H2O + 686 kilocalories of energy/mole of glucose oxidized

67
By studying the equation above, you will notice there are three ways cellular respiration could be measured.One could measure the1. Consumption of 02 (How many moles of 02 are consumed in cellular respiration?)
2. Production of CO2 (How many moles of CO2 are produced in cellular respiration?)
3. Release of energy during cellular respiration
In this experiment the relative volume of 02 consumed by germinating and nongerminating (dry) peas at twodifferent temperatures will be measured.
Background Information
A number of physical laws relating to gases are important to the understanding of how the apparatus that youwill use in this exercise works. The laws are summarized in the general gas law that states:
PV = nRT
where P is the pressure of the gas, V is the volume of the gas, n is the number of molecules of gas, R is the gas constant (its value is fixed), and T is the temperature of the gas (in °K).
This law implies the following important concepts about gases:
1. If the temperature and pressure are kept constant, then the volume of the gas is directly proportional to thenumber of molecules of the gas.
2. If the temperature and volume remain constant, then the pressure of the gas changes in direct proportionto the number of molecules of gas present.
3. If the number of gas molecules and the temperature remain constant, then the pressure is inverselyproportional to the volume.
4. If the temperature changes and the number of gas molecules is kept constant, then either the pressure orvolume (or both) will change in direct proportion to the temperature.
It is also important to remember that gases and fluids flow from regions of high pressure to regions of lowpressure.
In this experiment the CO2 produced during cellular respiration will be removed by potassium hydroxide(KOH) and will form solid potassium carbonate (K2CO3 ) according to the following reaction:
CO2 + 2 KOH -> K2CO3 + H20
Since the CO2 is being removed, the change in the volume of gas in the respirometer will be directly related tothe amount of oxygen consumed.
In the experimental apparatus shown in Figures 5.1 and 5.2, if water temperature and volume remainconstant, the water will move toward the region of lower pressure. During respiration, oxygen will beconsumed. Its volume will be reduced, because the CO2 produced is being converted to a solid. The netresult is a decrease place them on a paper towel. They will be used in respirometer 2.

68
4. Respirometer 3: Refill the graduated cylinder with 50 mL of FLO. Determine how many glass beads wouldbe required to attain a volume equivalent to that of the germinating peas. Remove these beads and placethem on a paper towel. They will be used in respirometer 3.
5. Repeat Steps 1-4 to prepare a second set of germinating peas, dry peas plus beads, and beads for use inrespirometers 4, 5, and 6, respectively.
6. To assemble the six respirometers, obtain six vials, each with an attached stopper and pipette. Place asmall piece of cotton in the bottom of each vial and, using a dropper, moisten the cotton with 15% KOH.*Make sure that the respirometer vials are dry on the inside. Do not get KOH on the sides of therespirometer. Place a small wad of nonabsorbent cotton on top of the KOH-soaked absorbent cotton (seeFigure 5.1). It is important that the amounts of cotton and KOH be the same for each respirometer.* Your teacher may ask you to use soda-lime pellets instead of KOH Solution.
Figure 5.1: Assembled Respirometers
7. Place the first set of germinating peas, dry peas plus beads, and beads in vials 1, 2, and 3, respectively.Place the second set of germinating peas, dry peas plus beads, and beads in vials 4, 5, and 6,respectively. Insert the stopper fitted with the calibrated pipette. Place a weighted collar on each end of thevial (see Figure 5.2).

69
Figure 5.2: Respirometers Equilibrating in the Water Bath
8. Make a sling of masking tape attached to each side of each of the water baths to hold the pipettes out ofthe water during an equilibration period of seven minutes. Vials 1, 2, and 3 should rest in the room-temperature water bath (approximately 25 °C) and vials 4, 5, and 6 should rest in the 10°C water bath(see Figure 5.2).
9. After the equilibration period of seven minutes, immerse all six respirometers entirely in their water baths.Water will enter the pipettes for a short distance and then stop. If the water continues to move into apipette, check for leaks in the respirometer. Work swiftly and arrange the pipettes so that they can be readthrough the water at the beginning of the experiment. They should not be shifted during the experiment.Hands should be kept out of the water bath after the experiment has started. Make sure that a constanttemperature is maintained.
10. Allow the respirometers to equilibrate for three more minutes and then record, to the nearest 0.01 mL, theinitial position of water in each pipette (time 0). Check the temperature in both baths and record it in Table5.1. Every 5 minutes for 20 minutes, take readings of the water's position in each pipette and record thedata in Table 5.1.
Table 5.1: Measurement of Of Consumption by Soaked and Dry Pea Seeds at Room Temperature(25°C) and 10°C Using Volumetric Methods
Beads Alone Germinating Peas Dry Peas and BeadsTemp(°C)
Time(mln) Reading
at time X Diff.*Readingat time X
Diff.* Correcteddiff. Δ
Readingat time X
Diff.* Correcteddiff. Δ
05
10152005
101520
* Difference = (initial reading at time 0) - (reading at time X)Δ Corrected difference = (initial pea seed reading at time 0 - pea seed reading at time X) - (initial bead reading at time 0 -bead reading at time X)

70
Analysis of Results1. In this activity you are investigating both the effect of germination versus nongermination and warm
temperature versus cold temperature on respiration rate. Identify two hypotheses being tested in thisactivity.
a.
b.
2. This activity uses a number of controls. What conditions must remain constant? Why?
3. Graph the results from the corrected difference column for the germinating peas and the dry peas at bothroom temperature and at 10°C.
For this graph you will need to determine the following:
a. The independent variable: __________________________Use this to label the horizontal (x) axis.
b. The dependent variable: ________ Use this to label the vertical (y) axis
Graph 5.1 Title: ____________________________________________________

71
4. Describe and explain the relationship between the amount of 02, consumed and time.
5. From the slope of the four lines on the graph, determine the rate of 02 consumption of germinating and drypeas during the experiments at room temperature and at 10°C Recall that rate = Δy.
ΔxRecord the rates in Table 5 2
Table 5.2
Condition Show Calculations Here Rate(mL 02/minute)
Germinating Peas/10°C
Germinating Peas/Room Temperature
Dry Peas/10°C
Dry Peas/Room Temperature
6. Why is it necessary to correct the readings from the peas with the readings from the beads?
7. Explain the effect of germination (versus nongermination) on pea seed respiration.
8. Graph 5.2 is a sample graph of possible data obtained for oxygen consumption by germinating peas up toabout 8°C. Draw in predicted results through 45°C. Explain your prediction.
Graph 5.2 Title: ___________________________________
9. What is the purpose of KOH in this experiment?

72
10. Why did the vial have to be completely sealed around the stopper?
11. If you used the same experimental design to compare the rates of respiration of 25 g reptile and a 25 gmammal at 10°C, what results would you expect? Explain your reasoning.
12. If respiration in a small mammal were studied at both room temperature (21°C) and 10°C, what resultswould you predict? Explain your reasoning.
13. Explain why water moved into the respirometers' pipettes.
14. Design an experiment to examine the rates of cellular respiration with peas that have been germinating fordifferent lengths of time: 0, 24,48, and 72 hours. What results would you expect? Why?

73
AP Biology LaboratoryDate: ___________________ Name and Period: ______________________________________________
AP Biology Lab 6
MOLECULAR BIOLOGY
OVERVIEWIn this lab you will investigate some basic principles of molecular biology:
1. Plasmids containing specific fragments of foreign DNA will be used to transform Escherichia coli cells,conferring antibiotic (ampicillin) resistance.
2. Restriction enzyme digests of phage lambda DNA will be used to demonstrate techniques forseparating and identifying DNA fragments using gel electrophoresis.
OBJECTIVESBefore doing this lab you should understand:
• How gel electrophoresis separates DNA molecules present in a mixture;• The principles of bacterial transformation;• The conditions under which cells can be transformed;• The process of competent cell preparation;• How a plasmid can be engineered to include a piece of foreign DNA;• How plasmid vectors are used to transfer genes;• How antibiotic resistance is transferred between cells;• The importance of restriction enzymes to genetic engineering experiments.
After doing this lab you should be able to:• Use plasmids as vectors to transform bacteria with a gene for antibiotic resistance in a controlled
experiment;• Demonstrate how restriction enzymes are used in genetic engineering;• Use electrophoresis to separate DNA fragments;• Describe the biological process of transformation in bacteria;• Calculate transformation efficiency;• Be able to use multiple experimental controls;• Design a procedure to select positively for antibiotic-resistant transformed cells; and• Determine unknown DNA fragment sizes when given DNA fragments of known size.
INTRODUCTIONThe bacterium Escherichia coli (E. coli) is an ideal organism for the molecular geneticist to manipulate andhas been used extensively in recombinant DNA research. It is a common inhabitant of the human colon andcan be grown in suspension culture in a nutrient medium such as Luria broth, or in a Petri dish of Luria brothmixed with agar (LB agar) or nutrient agar.
The single circular chromosome of E. coli contains about five million DNA base pairs, only 1/600th the haploidamount of DNA in a human cell. In addition, the E. coli cell may contain small circular DNA molecules (1,000to 200,000 base pairs) called plasmids, which also carry genetic information. The plasmids areextrachromosomal; they exist separately from the chromosome. Some plasmids replicate only when thebacterial chromosome replicates and usually exist only as single copies within the bacterial cell. Othersreplicate autonomously an often occur in as many as 10 to 200 copies within a single bacterial cell. Certainplasmids, called R plasmids, carry genes for resistance to such antibiotics as ampicillin, kanamycin, ortetracycline.

74
In nature genes can be transferred between bacteria in three ways: conjugation, transduction, ortransformation. Conjugation is a mating process during which genetic material is transferred from onebacterium to another of a different mating type. Transduction requires the presence of a virus to act as avector (carrier) to transfer small pieces of DNA from one bacterium to another. Bacterial transformationinvolves transfer of genetic information into a cell by direct uptake of the DNA. During gene transfer, theuptake and expression of foreign DNA by a recipient bacterium can result in conferring a particular trait to arecipient lacking that trait. Transformation can occur naturally but the incidence is extremely low and is limitedto relatively few bacterial strains. These bacteria can take up DNA only during the period at the end oflogarithmic growth. At this time the cells are said to be competent. Competence can be induced in E. coli withcarefully controlled growth conditions. Once competent, the cells are ready to accept DNA that is introducedfrom another source.
Plasmids can transfer genes (such as those for antibiotic resistance) that occur naturally within them, orplasmids can act as carriers (vectors) for introducing foreign DNA from other bacteria, plasmids, or eveneukaryotes into recipient bacterial cells. Restriction endonucleases can be used to cut and insert pieces offoreign DNA into the plasmid vectors (Figure 6.1). If these plasmid vectors also carry genes for antibioticresistance, transformed cells containing plasmids that carry the foreign DNA of interest in addition to theantibiotic resistance gene can be easily selected from other cells that do not carry the gene for antibioticresistance.
I. Create plasmid with gene of interest.
II. Transform recipient cells with plasmid DNA.III. Plate recipients on ampicillin plates and select for resistant colonies.IV. Isolate colonies carrying the plasmid.

75
EXERCISE 6A: Bacterial Transformation – Ampicillin Resistance
You will insert a plasmid that contains a gene for resistance to ampicillin, an antibiotic that is lethal to manybacteria, into competent E. coli cells.
Transformed bacteria can be selected based on their resistance to ampicillin by spreading the transformedcells on nutrient medium that contain ampicillin. Any cells that grow on this medium have been transformed.
Procedure1. Mark 1 sterile 15-mL “+”; this tube will have the plasmid added to it. Mark another tube “-“; this tube will
have no plasmid added.
2. Use a sterile micropipette to add 250 microliters (uL) of ice cold 0.05 M CaCl2 to each tube.
3. Transfer a large (3mm) colony of E. coli from a starter plate to each of the tubes using a sterileinoculating loop. Try to et the same amount of bacteria into each tube. Be careful not to transfer anyagar.
4. Vigorously tap the loop against the wall of the tube to dislodge the cell mass.
5. Mix the suspension by repeatedly drawing in and emptying a sterile micropipette with the suspension.
6. Add 10 uL of pAMP solution (0.005 ug/uL) directly into the cell suspension in tube “+”. Mix by tappingthe tube with your finger. This solution contains the antibiotic-resistant plasmid.
7. Keep both tubes on ice for 15 minutes.
8. While the tubes are on ice, obtain 2 LB agar plates and 2 LB/Amp agar (LB agar containing ampicillin)plates. Label each plate on the bottom as follows: one LB agar plate “LB+” and the other “LB-“; labelone LB/Amp plate “LB/Amp+” and the other “LB/Amp-“.
9. A brief pulse of heat facilitates entry of foreign DNA into the E. coli cells. Heat-shock ccells in both the“+” and “-“ tubes by holding the tubes in a 42 C water bath for 90 seconds. It is essential that cells begiven a sharp and distinct shock, so take the tubes directly from the ice to the 42 C water bath.
10. Immediately return cells to the ice for 2 minutes.
11. Use a sterile micropipette to add 250 uL of room-temperature Luria-Bertani broth to each tube. Mix bytapping with your finger. Any transformed cells are now resistance to ampicillin because they possessthe gene whose product renders the antibiotic ineffective.
12. Place 100 mL of “+” cells on the “LB+” plate and on the “LB/Amp+” plate. Place 100 mL of “-“ cells onthe “LB-“ plate and on the “LB/Amp-“ plate.
13. Immediately spread the cells by using a sterile spreading rod. Repeat the procedure for each plate.
14. Allow plates to set for several minutes. Tape your plates together and incubate inverted overnight at37 C.

76
Analysis of Results1. Observe the colonies through the bottom of the culture plate. Do not open the plates. Count the
number of individual colonies; use a permanent marker to mark each colony as it is counted. If cellgrowth is too dense to count individual colonies, record “lawn”.
LB+ (Positive Control) _____________ LB- (Positive Control) _________________
LB/Amp+ (Experimental) ___________ LB/Amp- (Negative Control) ____________
2. Compare and contrast the number of colonies each of the following pairs of plates. What does eachpair of results tell you about the experiment?
a. LB+ and LB- _________________________________________________________________
_______________________________________________________________________________
b. LB/Amp – and LB/Amp+ ________________________________________________________
_______________________________________________________________________________
c. LB/Amp+ and LB+ _____________________________________________________________
_______________________________________________________________________________
3. Transformation efficiency is expressed as the number of antibiotic-resistant colonies per microgram ofpAMP. Because transformation is limited to only those cells that are competent, increasing the amountof plasmid used does not necessarily increase the probability that a cell will be transformed. A sampleof competent cells is usually saturated with small amounts of plasmid, and excess DNA may actuallyinterfere with the transformation process.
a. Determine the total mass of pAMP used. __________________________________(You used 10 uL of pAMP at a concentration of 0.005 ug/uL.)Total Mass = volume x concentration.
b. Calculate the total volume of cell suspension prepared. ______________________
c. Now calculate the fraction of the total cell suspension that was spread on the plate. Number ofuL spread/total volume. ________________________________________
d. Determine the mass of pAMP in cell suspension that was spread on the plate. Total mass ofpAMP X fraction spread.
e. Determine the number of colonies per mg of plasmid. Express in scientific notation. Number ofcolonies observed/mass pAMP spread [from calculation in Step 3.d] = transformationefficiency. ___________________________________________
4. This is the transformation efficiency. What factors might influence transformation efficiency? Explainthe effect of each you mention.__________________________________________________________________________

77
__________________________________________________________________________
__________________________________________________________________________
EXERCISE 6B: Restriction Enzyme Cleavage of DNA and Electrophoresis
Restriction enzymes, or restriction endonucleases, are essential tools in recombinant DNAmethodology. Several hundred have been isolated from a variety of prokaryotic organisms. Restrictionendonucleases are named according to a specific system of nomenclature. The letters refer to theorganism from which the enzyme was isolated. The first letter of the name stands for the genus nameof the organism. The next two letters represent the second word, or species name. The fourth letter (ifthere is one) represents the strain of the organism. Roman numerals indicate whether the particularenzyme was the first isolated, the second, or so on.
Examples:
HaeIII H = Haemophilus
ae = aegyptus
III = second endonuclease isolated
EcoRI E = genus Escherichia
co = species coli
R = strain RY13
I = first endonuclease isolated
Restriction endonucleases recognize specific DNA sequences in double-stranded DNA (usually a fourto six base pair sequence of nucleotides) and digest the DNA at these sites. The result is theproduction of fragments of DNA of various lengths. Some restriction enzymes cut cleanly through theDNA helix at the same position on both strands to produce fragments with blunt ends (Figure 6.2a).Other endonucleases cleave each strand off-center at specific nucleotides to produce fragments with“overhangs,” or sticky ends (Figure 6.2b). By using the same restriction enzyme to “cut” DNA from twodifferent organisms, complementary “overhangs,” or sticky ends, will be produced and can allow theDNA from two sources to be “recombined.” Digestion with EcoRI or HindIII will produce DNAfragments with sticky ends (Figure 6.2b).
In this exercise samples of DNA obtained from the bacteriophage lambda have been incubated withdifferent restriction enzymes. The resulting fragments of DNA will be separated by using gelelectrophoresis. One sample has been digested with the restriction endonuclease EcoRI, one with therestriction endonuclease HindIII, and the third sample is uncut. The DNA samples will be loaded intowells of an agarose gel and separated by the process of electrophoresis. After migration of the DNAthrough an electrical field, the gel will be stained with methylene blue, a dye that binds to DNA.

78
Figure 6.2a
Figure 6.2b
When any molecule enters an electrical field, the mobility or speed at which it will move is influencedby the charge of the molecule, the strength of the electrical field the size and shape of the molecule,and the density of the medium (gel) through which it is migrating. When all molecules are positioned ata uniform starting site on a gel and the gel is placed in a chamber containing a buffer solution andelectricity is applied, the molecules will migrate and appear as bands. Nucleic acids, like DNA andRNA, move because of the charged phosphate groups in the backbone of the DNA molecule. Becausethe phosphates are negatively charged at neutral pH, the DNA will migrate through the gel toward thepositive electrode.
In this exercise we will use an agarose gel. In agarose the migration rate of linear fragments of DNAis inversely proportional to their size; the smaller the DNA molecule, the faster it migrates through thegel.

79
ProcedureA: Preparing the Gel
1. Prepare the agarose gel for electrophoresis according to the directions given by your teacheror in the kit.
2. Obtain the phage lambda DNA digested with EcoRI endonuclease. The DNA is mixed with agel-loading solution containing a tracking dye, bromophenol blue, that will make it possible to“track” the progress of its migration in the agarose gel.
3. Obtain the phage lambda DNA digested with HindIII endonuclease. The DNA fragments are ofa known size and will serve as a “standard” for measuring the size of the EcoRI fragments fromStep 2. It also contains the tracking dye.
4. Obtain the undigested phage lambda to use as a control. It also contains the tracking dye.
B: Loading the Gel
Helpful Hints for Gel Loading
Pull a small amount of gel-loading solution into the end of a micropipette. (Do not allow the solution tomove up into the pipette or bubbles with be introduced into the well of the agarose gel during loading.)
Hold the tip of the pipette in the buffer solution above the well and gently dispense the solution. Theloading dye is denser than the buffer and will move into the well. (Do not place the tip of the pipette
into the well or your might puncture the gel).
1. Pour enough buffer gently over the gel to cover it.
2. Load 5-10 uL of undigested lambda phage DNA (control) into a well.
3. Load 5-10 uL of the HindIII digest into a second well.
4. Load 5-10 uL of the EcoRI digest into a third well.

80
C: Electrophoresis
1. Place the top on the electrophoresis chamber and carefully connect the electrical leads toan approved power supply (black to black and red to red). Set the voltage to theappropriate level for your apparatus. When the current is flowing, you should see bubbleson the electrodes.
2. Allow electrophoresis to proceed until the tracking dye has moved nearly to the end of thegel.
3. After electrophoresis is completed, turn off the power, disconnect the leads, and removethe cover of the electrophoresis chamber.
D: Staining and Visualization
Note: Wear gloves.
1. Carefully remove the gel bed from the chamber and gently transfer the gel to a staining trayfor straining. Use the scooper provided with your kit or keep your hands under the gelduring the transfer. You may wish to remove a small piece of gel from the upper right-handcorner to keep track of the gel’s orientation. Do not stain in the electrophoresis chamber.
2. Label the staining tray with your name and take it to your teacher for staining.
3. Examine your stained gel on a light box or overhead projector. Compare your gel with thesample gel shown in Figure 6.3.
Figure 6.3: Sample Restriction Digest of Lambda DNA

81
E: Determining Fragment Size
1. After observing the gel, carefully wrap it in plastic wrap and smooth out all of the wrinkles.
2. Using a marking pen, trace the outlines of the sample wells and the location of the bands.
3. Remove the plastic wrap and flatten it out on a white piece of paper on the lab bench. Savethe gel in a Ziploc® plastic bag. Add several drops of buffer. Store at 4*C. You can makeyour measurements directly from the marked plastic wrap.
Analysis and ResultsThe size of the fragments produced by a specific endonuclease (EcoRI in this exercise) can bedetermined by using standard fragments of known size (fragments produced by HindIII, in this case).When you plot the date on semilog graph paper, the size of the fragments is expressed as the log ofthe number of base pairs they contain. This allows date to be plotted on a straight line. The migrationdistance of the unknown fragments, plotted on the x-axis, will allow their size to be determined on thestandard curve.
Graphing
A. Standard Curve for Hind III
1. Measure the migration distance (in cm) for each Hind III band on your gel. Measure from thebottom of the sample well to the bottom of the band. The migration distance for the largeststandard fragment (approximately 23,120 base pairs) nearest to the origin does not need to bemeasured. Record these measurements in Table 6.1.
2. Plot the measured distance for each band of the standard Hind III digest against the actual basepair (bp) fragment sizes given in Table 6.1 using the semilog graph paper of Graph 6.1. Followyour teacher’s directions to draw the best-fit line to your points. This will serve as a standardcurve.
B. Interpolated Calculations for EcoRIFrom the standard curve for Hind III, made from known fragment sizes, you can calculate fragmentsizes resulting from a digest with EcoRI. The procedure is as follows.
1. Measure the migration distances in cm for each EcoRI band. Record the date in Table 6.2.
2. Determine the sizes of the fragments of phage lambda DNA digested with EcoRI. Locate on the x-axis of Graph 6.1 the distance migrated by the first EcoRI fragment. Using a ruler, draw a verticalline from the intersection with the best-fit data line. Now extend a horizontal line from theintersection point to the y-axis. This point gives the base pair size of this EcoRI fragment. Repeatthis procedure and determine the remaining EcoRI fragments. Enter your interpolated date inTable 6.2, in the interpolated bp column.
3. Your teacher will provide you with the actual bp data. Compare your results to these actual sizes.
Note: This interpolation technique is not exact. You should expect as much as 10% to 15% error.

82
Table 6.1: Distance Hin dIII Produced Fragments Migrate in Agarose Gel (cm)
HIND III
Actual bp Measured Distance (cm)
23,130
9,416
6,557
4,361
2,322*
2,027*
570*Δ
125* may form a single bandΔ may not be detected
Table 6.2: Distance EcoRI Produced Fragments Migrate in Agarose (cm)
EcoRIMeasured Distance
(cm)Interpolated
bpActual bp
Band 1
Band 2
Band 3
Band 4
Band 5
Band 6

83
Graph 6.1 Title: __________________________________________________________________

84
4. For which fragment sizes was your graph most accurate? For which fragment sizes was it leastaccurate? What does this tell you about the resolving ability of agarose-gel electrophoresis?
Analysis1. Discuss how each of the following factors would affect the results of electrophoresis:
a. Voltage used __________________________________________________________________________________________________________________________
b. Running time _____________________________________________________________________________________________________________________________
c. Amount of DNA used ______________________________________________________________________________________________________________________
d. Reversal of polarity _________________________________________________________________________________________________________________________
2. Two small restriction fragments of nearly the same base pair size appear as a single band, evenwhen the sample is run to the very end of the gel. What could be done to resolve the fragments?Why would it work?
Questions
1. What is a plasmid? How are plasmids used in genetic engineering?
2. What are restriction enzymes? How do they work? What are recognition sites?
3. What is the source of restriction enzymes? What is their function in nature?
4. Describe the function of electricity and the agarose gel in electrophoresis.
5. A certain restriction enzyme digest results in DNA fragments of the following sizes: 4,000 basepairs, 2,500 base pairs, 2,000 base pairs, 400 base pairs. Sketch the resulting separation byelectrophoresis. Show starting point, positive and negative electrodes, and the resulting bands.

85
6. What are the functions of the loading dye in electrophoresis? How can DNA be prepared forvisualization?
7. Use the graph your prepared from your lab data to predict how far (in cm) a fragment of 8,000 bpwould migrate.
8. How can a mutation that alters a recognition site be detected by gel electrophoresis?
86
AP Biology LaboratoryDate: ___________________ Name and Period: ______________________________________________
AP Biology Lab 7
GENETICS OF ORGANISMS
OVERVIEW
In this lab you will use living organism to do genetic crosse3s. You will learn how to collect and manipulatethe organisms, collect data from F1 and F2 generations, and analyze the results from a monohybrid, dihybridor sex-linked cross. The procedures that follow apply to fruit flies.
OBJECTIVES
Before doing this lab you should understand:• Chi-square analysis of data, and• the life cycle of diploid organisms useful in genetics studies.
After doing this lab you should be able to:• investigate the independent assortment of two genes and determine whether the two genes are
autosomal or sex-linked using a multigenerational experiment, and• analyze the data from your genetic crosses using chi-square analysis techniques.
INTRODUCTION
Drosophila melanogaster, the fruit fly, is an excellent organism for genetics studies because it has simple foodrequirements, occupies little space, is hardy, completes its life cycle in about 12 days at room temperature,produces large amounts of off spring, can be immobilized readily for examination and sorting, and has manytypes of hereditary variations that can be observed with low-power magnification. Drosophila has a smallnumber of chromosomes (four pairs). These chromosomes are easily located in the salivary glands cells.Drosophila exists in stock cultures that can be readily obtained from several sources. Much research aboutthe genetics of Drosophila during the last 50 years has resulted in a wealth of reference literature and aknowledge about hundreds of its genes.
The Life Cycle of Drosophila
The Eggs. The eggs are small, oval shaped, and have two filaments at one end. They are usually laid on thesurface of the culture medium and, with practice, can be seen with the naked eye. The eggs hatch into larvaeafter about one day.
The Larval Stage. The wormlike larvae eats almost continuously, and its black mouth parts can easily beseen moving back and forth even when the larva itself is less distinct. Larvae tunnel through the culturemedium while eating; thus, channels are a good indication of the successful growth of a culture. The larvasheds its skin twice as it increases in size. In the last three larval stages, the cells of the salivary glandscontain giant chromosomes, which may be seen readily under low –power magnification after proper staining.
The Pupal Stage. When a mature larva in a lab culture is about to become a pupa, it usually climbs up theside of a culture bottle or onto the strip provided in the culture bottle. The last larval covering then becomesharder and darker, forming the pupal case. Through this case the later stages of metamorphosis to an adultfly can be observed. In particular, the eyes, the wings, and the legs become readily visible.

87
The Adult Stage. When metamorphosis is complete, the adult flies emerge from the pupal case. They arefragile and light in color and their wings are not fully expanded. These flies darken in a few hours and take onthe normal appearance of an adult fly. They live a month or more and then die. A female dies not mate forabout ten to twelve hours after emerging from the pupa. Once she has mated, she stores a considerablequantity of sperm in receptacles and fertilizes her eggs as she lays them. To ensure a controlled mating, it isnecessary to use females that have not mated before (virgins).
Figure 7.1: The Life Cycle of Drosophila melanogaster
It is important to realize that a number of factors determine the length of time of each stage in the life cycle.Of these factors, temperature is the most important. At room temperature (about 25oC), the complete cycletakes ten to twelve days.

88
Design of the ExerciseThis genetics experiment will be carried on for several weeks. Drosophila with well-defined mutant traits willbe assigned to you by your teacher. You are responsible for making observations and keeping recordsconcerning what happens as mutant traits are passed from one generation to the next.
You will be assigned to study a certain mode of inheritance using particular genetic crosses of flies havingone or two mutations. The modes of inheritance most commonly used are:
1. Monohybrid. In these experiments the mode of inheritance is determined when a single contrasting pairof characteristics is involved.
2. Dihybrid. In these experiments the mode of inheritance is determined when two pairs of contrastingcharacteristics are considered simultaneously.
3. Sex-linked. In these experiments the mode of inheritance is determined when the mutant characteristic isassociated with the X-chromosome.
To make these experiments interesting and challenging, you will not be told the mode of inheritance, nor thename for the particular mutation(s) you are studying. Study the wild type flies (both male and female) untiltheir phenotypic characteristics are familiar. Flies having one or two mutations can then be identified bymaking comparisons with the wild type flies. The most commonly studied mutations are eye color or shape,bristle number or shape, wing size or shape, or antenna size or shape. You should make up your own namefor the particular mutation(s) that you identify in your files.
Procedure1. Obtain a vial of wild type flies. Practice immobilizing and sexing (determining the gender of) these flies.
Examine these flies and note the characteristics of their eyes, wings, bristles, and antennae.
2. To make handling easier, immobilize the flies by chilling them. Since the activity level of the flies isdependent on environmental temperature, the following steps immobilize the flies.
a. Hold the vial containing the flies at an angle and twirl it in ice for several minutes.
b. When the flies are immobilized, dump them into a small, plastic Petri dish containing a #1 Whatmanfilter paper.
c. Place the Petri dish on top of the ice in order to maintain the cool temperature necessary to keep theflies immobilized.
d. Use the dissecting microscope to view the flies. The top of the petri dish can be on or off whenviewing.
3. Distinguish male flies from female flies by liking for the following characteristics (illustrated in Figure 7.2):
a. Males are usually smaller than females.
b. Males have dark, blunt abdomens, and females have lighter, pointed abdomens.
c. Only the males have sex combs, which are groups of black bristles on the uppermost joint of theforelegs.

89
Figure 7.2: Female and Male Drosophila
4. Obtain a vial containing pairs of experimental flies. Record the cross number of the vial. This number willserve as a record as to which cross you have obtained. These flies are the parental generation (P) and havealready been mated. The females should have already laid eggs on the surface of the culture medium. Theeggs (or maybe larvae now) represent the first filial, F1, generation and will be emerging from their pupalcases in about a week.
5. First week (today). Immobilize and remove the adult flies. Observe them carefully under the dissectingmicroscope. Separate the males from the females and look for the mutation(s). Note whether themutations(s) is/are associated with the males or the females. Identify the mutation(s) and give it/them amade-up name and symbol. Record the phenotype and symbol in Table 7.1. The findings should beconfirmed by your teacher.
6. Place the parents in the morgue, a jar containing alcohol or baby oil. Label the vial containing the eggs orlarvae with symbols for the mating. For example, if a sepia-eyed female is crossed with a wild-type male, thelabel could be “sepia female X wild male “. Also be sure to label the vial with your name and the date, Placethe vial in a warm location.
7. Second Week. Begin by observing the F1 flies. Immobilize and examine all the flies. Record their sexand the presence or absence of the mutation(s) (as observed in the parental flies) in Table 7.1. Consider theconclusions that can be drawn from these data. Place 5 or 6 pairs of F1 flies in a fresh culture bottle and therest of the flies in the morgue For this cross the females need not be virgins. Label the new vial “F1 X F1”.Also, label the vial with symbols denoting the cross, the date and your name.
8. Third Week. Remove the F1 flies from the vials and place them in the morgue. The F2 generation are theeggs and/or the larvae in the vial. Place the vial back in the warm location.

90
9. Fourth Week. Begin removing the F2 flies. Record their sex and the presence or absence of the mutantphenotypes (as observed in the parental flies in Table 7.2). The more F2 flies collected, the more reliable thedata will be. You may have to collect flies over a 3- or 4-day period. Try to collect at least 200 flies.
10. To analyze your data, you will need to learn how to use the chi-square test. Go to the Statistical AnalysisSection to review this technique.
Table 7.1: F1 Generation Data Date: ___________
Phenotype and Symbol Females Males
Table 7.2: F2 Generation Data Date: ___________
Phenotype and Symbol Females Males
Analysis of Results
1. Describe and name the observed mutation(s).
2. Write a hypothesis that describes the mode of inheritance of the trait(s) that you studied. This is your nullhypothesis (as described in the Statistical Analysis Section).
3. Refer to the textbook and review Punnett squares. In the space below construct two Punnett squares topredict the expected results of both the parental and F1 crosses from your null hypothesis.
Parental Cross F1 Cross

91
4. Refer to the Punnett squares above. In the box below record the expected ratios for the genotypes andphenotypes of the F1 and F2 crosses in the experiment.
Expected Genotypic Ratio Expected Phenotypic RationF1
F2
5. Do the actual results deviate from what was expected? If so, explain how.
6. From the results, describe your cross.
Is the mutation sex-linked or autosomal? ___________________________
Is the mutation dominant or recessive? ____________________________
Is the cross monohybrid or dihybrid? _______________________________
7. Are the deviations for the phenotypic ratio of the F2 generation with the limits expected by chance? Toanswer the question, statistically analyze the data using the chi-square analysis. Calculate the chi-squarestatistic for the F2 generation in the chart below. Refer to the critical values of the chi-square (Χ2) distributiontable. (Table 7.5) to determine the p (probability value) that is associated with your Χ2 statistic.
Phenotype # Observed (o) # Expected (e) (o-e) (o-e)2 (o-e)2
e
Χ2 =
a. Calculate the chi-square value for these data.
1. How many degrees of freedom are there? ________________
2. chi-square (Χ2 ) = ___________________________________
3. Referring to the critical values chart, what is the probability value for this data? _________
b. According to the probability value, can you accept or reject your null hypothesis? Explain why.
Discussion1. Why was it necessary for the females of the parental generation to be virgins?

92
2. Why was it not necessary to isolate virgin females for the F1 cross?
3. Why were the adult flies removed from the vials at week 2 and 4?
STATISTICAL ANALYSIS SECTION
Using the Chi-Square Test for Statistical Analysis of Experimental Data
Example 1
Statistics can be used to determine if differences among groups are significant, or simply the result ofpredictable error. The statistical test most frequently used to determine whether data obtained experimentallyprovide a good fit or approximation to the expected or theoretical data is the chi-square test. This test can beused to determine if deviations fro the expected values are due to chance alone, or to some othercircumstance. For example, consider corn seedlings resulting from an F1 cross between parents that areheterozygous for color.
A Punnett square of the F1 cross Gg X Gg would predict that the expected proportion of the green:albinoseedlings would be 3:1 . Use this information to fill in the Expected (e) column and the (o-e) column in Table7.3.
Table 7.3
Phenotype Genotype # Observed (o) # Expected (e) (o-e)Green GG or Gg 72Albino gg 12
Total 84
There is a small difference between the observed and expected results, but are these data close enough thatthe difference can be explained by random chance or variation in the sample?
To determine if the observed data fall within acceptable limits, a chi-square analysisperformed to test the validity of a null hypothesis (that there is no statistically significantdifference between the observed and expected data). If the chi-square analysis indicates thatthe data vary too much from the expected 3:1 ratio, an alternative hypothesis is accepted.
The formula for chi-square is:
Χ2 = Σ(o-e)2
ewhere o = observed number of individuals
e = expected number of individuals
Σ = the sum of the values (in this case, the differences, squared, divided by the number expected)
1. This statistical test will examine the null hypothesis, which predicts that the data from the experimentalcross above will be expected to fit the 3:1 ratio.

93
2. Use the data from Table 7.3 to complete Table 7.4.
Table 7.4
Phenotype # Observed (o) # Expected (e) (o-e) (o-e)2 (o-e)2
eGreen 72
Albino 12
Χ2 = Σ(o-e)2
e
3. Your calculations should give you a value of Χ2 = 5.14. This value is then compared to Table 7.5.
Degrees of Freedom (df)Probability (p) 1 2 3 4 50.05 3.84 5.99 7.82 9.49 11.10.01 6.64 9.21 11.3 13.2 15.10.001 10.8 13.8 16.3 18.5 20.5
How To Use the Critical Values Table
1. Determine the degrees of freedom (df) for your experiment. It is the number of phenotypic classes minus1. Since there are two possible genotypes, for this experiment df = 1 (2 samples – 1). If the experiment hasgathered data for a dihybrid cross, there would be four possible phenotypes and therefore 3 degrees offreedom.
2. Find the p value. Under the 1 df column, find the critical value in the probability (p) = 0.05 row: it is 3.84.What dies this mean? If the calculated chi-square value is greater than or equal to the critical value from thetable, then the null hypothesis is rejected. Since for our example Χ2 = 5.14 and 5.14>3.84, we reject our nullhypothesis that there is no statistically significant difference between the observed and expected data. Inother words, chance alone cannot explain the deviations we observed and there is, therefore, reason to doubtour original hypothesis (or to question our data collection accuracy). The minimum probability for rejecting anull hypothesis in the sciences is generally 0.05, so this is the row to use in our chi-square table.
3. These results are said to be significant at a probability of p = 0.05. This means that only 5 % of the timewould you expect to see similar data if the null hypothesis was correct, thus, you are 95% sure that the datado not fit a 3:1 ratio.
4. Since these data do not fit the expected 3:1 ratio, you must consider reasons for this variation. Additionalexperimentation would be necessary. Perhaps the sample size is too small, or errors were made in datacollection. In this example, perhaps the albino seedlings are underrepresented because they died before thecounting was performed.

94
Example 2
In a study of incomplete dominance in tobacco seedlings, the counts in Table 7.6 were made from a crossbetween the two heterozygous (Gg) plants.
Table 7.6Phenotype Genotype # Observed (O)Green GG 22Yellow Green Gg 50Albino gg 12
Total: 84
A Punnett square for this cross indicates that the expected counts should be in a 1 green:2 yellow green:1albino ration (Table 7.7). The expected values for a total count of 84 organisms are therefore:
1 green = 1/4 X 84 = 21
2 yellow green = 1/2 X 84 = 42
1 yellow = 1/4 X 84 = 21 84
Table 7.7
Phenotype # Observed (o) # Expected (e) (o-e) (o-e)2 (o-e)2
eGreen 22 21 1 1 0.05Yellow Green 50 42 8 64 1.52Albino 12 21 9 81 3.86
Χ2 = Σ(o-e)2
e5.43
Go to the chi-square table, this time for two degrees of freedom (there are three phenotypes: 3-1 = 2 df). Ifthe X2 value were greater than or equal to the critical value of 5.99 we would reject our hypothesis. Since5.43 is less than the critical value at p = 0.05, we accept the null hypothesis (this second data set does fit theexpected 1 : 2 : 1 ratio).
Practice ProblemAn investigator observes that when pure-breeding, long–wing Drosophila are mated with pure-breeding, short-wing flies, the F1 offspring have an intermediate wing length.
When several intermediate-wing-length flies are allowed to interbreed the following results are obtained:
Observed
230 long wings510 intermediate-length wings260 short wings
a. What is the genotype of the F1 intermediate-wing-length flies?
b. Write a hypothesis describing the mode of inheritance of wing length in Drosophila (this is your nullhypothesis).

95
c. Complete Table 7.8.
Table 7.8
Phenotype # Observed (o) # Expected (e) (o-e) (o-e)2 (o-e)2
e
Χ2 = Σ(o-e)2
e
d. Calculate the chi-square value for these data.
1. How many degrees of freedom (df) are there? ______________________
2. Χ2 (chi-square) = ________________________
3. Referring to the critical values chart, what is the probability value for these data?
e. According to the critical values of Χ2 can you accept or reject the null hypothesis? Explain why?

96
AP Biology LaboratoryDate: ___________________ Name and Period: ______________________________________________
AP Biology Lab 8
POPULATION GENETICS AND EVOLUTION
OVERVIEWIn this lab you will:
1. learn about the Hardy-Weinberg law of genetic equilibrium, and
2. study the relationship between evolution and changes in allele frequency by using your class to representa sample population.
OBJECTIVESBefore doing this lab you should understand:
• how natural selection can alter allelic frequencies in a population;• the Hardy-Weinberg equation and its use in determining the frequency of alleles in a population; and• the effects on allelic frequencies of selection against the homozygous recessive or other genotypes.
After doing this lab you should be able to:
• calculate the frequencies of alleles and genotypes in the gene pool of a population using the Hardy-Weinberg formula, and
• discuss natural selection and other causes of microevolution as deviations from the conditionsrequired to maintain the Hardy-Weinberg equilibrium.
INTRODUCTIONIn 1908 G.H. Hardy and W. Weinberg independently suggested a scheme whereby evolution could be viewedas changes in the frequency of alleles in a population of organisms. In this scheme, if A and a are alleles fora particular gene locus and each diploid individual has two such loci, then p can be designated as thefrequency of the A allele and q as the frequency of the a allele. Thus, in a population of 100 individuals (eachwith two loci) in which 40% of the alleles are A, p would be 0.49. The rest of the alleles (60%) would be a,and q would be equal for 0.60 ( i.e., p + q = 1.0). These are referred to as allele frequencies. The frequencyof the possible diploid combinations of these alleles (AA, Aa, aa) is expressed as p2 + 2pq + q2 = 1.0. Hardyand Weinberg also argued that if five conditions are met, the population’s allele and genotype frequencies willremain constant from generation to generation. These conditions are as follows:
1. The breeding population is large. (The effect of chance in changes in allele frequencies isthereby greatly reduced.)
2. Mating is random. (Individuals show no mating preference for a particular phenotype.)
3. There is no mutation in the alleles. (No alteration in the DNA sequence of the alleles.)
4. No differential migration occurs. ( No immigration or emigration.)
5. There is no selection. (All genotypes have an equal chance of surviving and reproducing.)

97
The Hardy-Weinberg equation describes an existing situation. If the five conditions are met, then no changewill occur in either allele or genotype frequencies in the population. Of what value is such a rule? It providesa yardstick by which changes in allele frequency, and therefore evolution, can be measured, one can look at apopulation and ask: Is evolution occurring with respect to a particular gene locus? Since evolution is difficult(if not impossible) to observe in most natural populations, we will model the evolutionary process using theclass as a simulated population. The purpose of this simulation is to provide an opportunity to test some ofthe basic tenets of population genetics and evolutionary biology.
EXERCISE 8A: Estimating Allele Frequencies for a Specific Trait within a Sample Population
Using the class as a sample population, the allele frequency of a gene controlling the ability to taste thechemical PTC (phenylthiocarbamide) could be estimated. A bitter-taste reaction to PTC is evidence of thepresence of a dominant allele in either the homozygous condition (AA) or the heterozygous condition (Aa).The inability to taste the chemical at all depends on the presence of homozygous recessive alleles (aa).(Instead of PTC tasting, other traits such as attached earlobes, may be used). To estimate the frequency ofthe PTC-tasting allele in the population, one must find p. To find p, one must first determine q (the frequencyof the nontasting PTC allele), because only the genotype of the homozygous recessive individuals is know forsure (i.e., those that show the dominant trait could be AA or Aa).
PROCEDURE1. Using the PTC taste-test papers provided, tear off a short strip and press it to your tongue tip, PTC tasters
will sense a bitter taste. For the purposes of this exercise these individuals are considered to be tasters.
2. A decimal number representing the frequency of tasters (p2 + 2pq) should be calculated buy dividing thenumber of tasters in the class by the total number of students in the class. A decimal number representingthe frequency of nontasters (q2) can be obtained by dividing the number of nontasters by the total numberof students. You should record these numbers in Table 8.1.
3. Use the Hardy-Weinberg equation to determine the frequencies (P and q) of the two alleles. Thefrequency q can be calculated by taking a square root of q2. Once q has been determined, p can bedetermined because 1 – q = p. Record these values in Table 8.1 for the class and also calculate andrecord values of p and q for the American population.
Table 8.1: Phenotypic Proportions of Tasters and Nontasters and Frequencies of the DeterminingAlleles
Phenotypes Allele Frequency Based on the H-WEquation
Tasters(p2 + 2pq)
Nontasters(q2)
p q
# % # %Class Population
North AmericanPopulation
0.55 0.45
DISCUSSION
1. What is the percentage of heterozygous tasters? __________________
2. What percentage of the North American population is heterozygous for the taster trait? ________

98
EXERCISE 8B: Case Studies
CASE 1 – A Test of an Ideal Hardy Weinberg Population
The entire class will represent a breeding population, so find a large open space for this simulation. In orderto ensure random mating, choose another student at random. In this simulation, we will assume the genderand genotype are irrelevant to mate selection.
The class will simulate a population of randomly mating heterozygous individuals with an initial genefrequency of 0.5 for the dominant allele A and the recessive allele a and the genotype frequencies of 0.25AA, 0.50 Aa and 0.25 aa. Your initial genotype is Aa. Record this on the Data page. Each member of theclass will receive four cards Two cards will have A written on them and two cards will have a. The four cardsrepresent the products of meiosis. Each “parent” contributes a haploid set of chromosomes to the nextgeneration.
PROCEDURE
1. Turn the four cards over so that the letters do not show, shuffle them, and take the card on top tocontribute to the production of the first offspring. Your partner should do the same. Put the two cardstogether. The two cards represent the alleles of the first offspring. One of you should record the genotypeof this offspring in the Case I section on the Data Page. Each student pair must produce two offspring, soall four cards must be reshuffled and the process repeated to produce a second offspring.
2. The other partner should then record the genotype of the second offspring on the Data Page. The veryshort reproductive career of this generation is over. You and your partner now become the nextgeneration by assuming the genotypes of the two offspring. That is, Student 1 assumes the genotype ofthe first offspring and Student 2 assumes the genotype of the second offspring.
3. Each student should obtain, if necessary, new cards representing the alleles in his or her respectivegametes after the process of meiosis. For example, Student 1 becomes genotype Aa and obtains cardsA,A,a,a; Student 2 becomes aa and obtains cards a,a,a,a. Each participant should randomly seek outanother person with whom to mate in order to produce the offspring of the next generation. Remember,the sex of your mate does not matter, not does the genotype. You should follow the same matingprocedure as you did for the first generation, being sure to record your new genotype after eachgeneration. Class data should be collected after each generation for five generations. At the end of eachgeneration, remember to record the genotype you have assumed. Your teacher will collect class dataafter each generation by asking you to raise your hand to report your genotype.
4. Allele Frequency: The allele frequencies, p and q, should be calculated for the population after fivegenerations of simulated random mating.
Number of A alleles present at the fifth generation
Number of offspring with genotype AA ___________ X 2 = ___________ A allelesNumber of offspring with genotype Aa ___________ X 1 = ___________ A alleles
Total = ____________A alleles
P = TOTAL number of A alleles = ______________ TOTAL number of alleles in the population
(number of students X 2)
In this case the total number of alleles in the population is equal to the number of students in the class X 2.

99
Number of a alleles present at the fifth generation
Number of offspring with genotype aa ___________ X 2 = ___________ a allelesNumber of offspring with genotype Aa ___________ X 1 = ___________ a alleles
Total = ____________Aa alleles
P = TOTAL number of a alleles = ______________ TOTAL number of alleles in the population
(number of students X 2)
QUESTIONS1. What does the Hardy-Weinberg equation predicts for the new p and q?
2. Do the results you obtained in this simulation agree? If not, why?
3. What major assumptions were not strictly followed in this simulation?
CASE 2 – Selection
In this Case you will modify the simulation to make it more realistic. In the natural environment, not allgenotypes have the same rate of survival; that is, the environment might favor some genotypes whileselecting against others. An example is the human condition of sickle-cell anemia. This is a disease causedby a mutation on one allele, and individuals who are homozygous recessive often do not survive to reachreproductive maturity. For this simulation you will assume that the homozygous recessive individuals neversurvive (100% selection against, and that heterozygous and homozygous dominant individuals survive 100%of the time.
PROCEDUREThe procedure is similar to that for Case I.
1. Start again with your initial genotype and produce your “offspring” as you did in Case I. This time,however, there is one important difference. Every time your “offspring” is aa, it does not reproduce. Since wewant to maintain a constant population size, the same two parents must try again until they produce twosurviving offspring. You may need to get new “allele” cards from the pool, allowing each individual tocomplete the activity.
2. Proceed through five generations, selecting against the homozygous recessive offspring 100% of the time.Then add up the genotype frequencies that exist in the population and calculate the new p and q frequenciesin the same way that you did for Case I.
QUESTIONS1. How do the new frequencies of p and q compare to the initial frequencies in Case I?
2. What major assumptions were not strictly followed in this simulation?
3. Predict what would happen to the frequencies of p and q if you simulated another five generations.

100
4. In a large population would it be possible to completely eliminate a deleterious recessive allele? Explain.
CASE 3 – Heterozygous AdvantageFrom Case II it is easy to see what happens to the lethal recessive allele in the population. However, datafrom many human populations show an unexpected high frequency of the sickle-cell allele in somepopulations. Thus, our simulation does not accurately reflect the real situation; this is because individualswho are heterozygous are slightly more resistant to a deadly form of malaria than homozygous dominantindividuals. In other words, there is a slight selection against homozygous dominant individuals as comparedto heterozygotes. This fact is easily incorporated into our simulation.
PROCEDURE1. In this round keep everything the same as it was in Case II, except that if your offspring is AA, flip a coin. Ifthe coin lands heads up, the individual does not survive; if tails, the individual does not survive.
2. Simulate five generations, starting again with the initial genotype from Case I. The genotype aa neversurvives, and homozygous dominant individuals only survive if the coin toss comes up tails. Since wewant to maintain a constant population size, the same two parents must try again until they produce twosurviving offspring. Get new “allele” cards from the pool as needed. Total the class genotypes andcalculate the frequencies of p and q.
3. Starting with the F5 genotype, go through five more generations, and again total the genotypes andcalculate the frequencies of p and q.
4. Calculate the information from five more generations.
QUESTIONS
1. Explain how the changes in p and q frequencies in Case II compare with Case I and Case III.
2. Do you think he recessive allele will be completely eliminated in either Case II or Case II? Explain.
3. What is the importance of the heterozygotes (the heterozygote advantage) in maintaining genetic variationin populations?
CASE 4 – Genetic DriftIt is possible to use our simulation to look at the phenomenon of genetic drift in detail.
PROCEDURE1. Divide the lab into several smaller populations (for example, a class of 30 could be divided into
three populations of ten each) so that individuals from one isolated population do not interactwith individuals from another population.
2. Now go through five generations as you did for Case I. Record the new genotypic frequenciesand calculate the new frequencies of p and q for each population.
QUESTIONS1. Explain how the initial genotypic frequencies of the populations compare.
2. What do your results indicate about the importance of population size as an evolutionary force?

101
HARDY-WEINBERG PROBLEMS
1. In Drosophila the allele for normal-length wings is dominant over the allele for vestigial wings (vestigialwings are stubby little curls that cannot be used for flight). In a population of 1,000 individuals, 360 showthe recessive phenotype. How many individuals would you expect to be homozygous dominant andheterozygous for this trait?
2. The allele for unattached earlobes is dominant over the allele for attached earlobes. In a population of 500individuals, 25% show the recessive phenotype. How many individuals would you expect to behomozygous dominant and heterozygous for this trait?
3. The allele for the hair pattern called “widow’s peak” is dominant over the allele for no “widow’s peak”. In apopulation of 1,000 individuals, 510 show the dominant phenotype. How many individuals would youexpect of each of the possible three genotypes for this trait?
4. In the United States about 16% of the population is Rh negative. The allele for Rh negative is recessive tothe allele for Rh positive. If the student population of a high school in the U.S. is 2,000, how manystudents would you expect for each of the three genotypes?
5. In certain African countries 4% of the newborn babies have sickle-cell anemia, which is a recessive trait.Out of the random population of 1,000 newborn babies, how many would you expect for each of the theepossible genotypes?
6. In a certain population, the dominant phenotype of a certain trait occurs 91% of the time. What is thefrequency of the dominant allele?

102
Data PageCase I: Hardy-Weinberg Equilibrium
Initial Class Frequencies: AA _____ Aa_____ aa_____
My Initial Genotype: ______ F1 Genotype _____
F2 Genotype _____
F3 Genotype _____
F4 Genotype _____
F5 Genotype _____
Final Class Frequencies:
AA _____ Aa_____ aa_____
p_______ q _______
Case III: Heterozygous Advantage
Initial Class Frequencies: AA _____ Aa_____ aa_____
My Initial Genotype: ______ F1 Genotype _____ F6 Genotype _____
F2 Genotype _____ F7 Genotype _____
F3 Genotype _____ F8 Genotype _____
F4 Genotype _____ F9 Genotype _____
F5 Genotype _____ F10 Genotype ____
Final Class Frequencies: (after five generations)
AA _____ Aa_____ aa_____
p_______ q _______
Final Class Frequencies: (after ten generations)
AA _____ Aa_____ aa_____
p_______ q _______
Case II: Selection
Initial Class Frequencies: AA _____ Aa_____ aa_____
My Initial Genotype: ______ F1 Genotype _____
F2 Genotype _____
F3 Genotype _____
F4 Genotype _____
F5 Genotype _____
Final Class Frequencies:
AA _____ Aa_____ aa_____
p_______ q _______
Case IV: Genetic Drift
Initial Class Frequencies: AA _____ Aa_____ aa_____
p_______ q _______
My Initial Genotype: ______ F1 Genotype _____
F2 Genotype _____
F3 Genotype _____
F4 Genotype _____
F5 Genotype _____
Final Class Frequencies:
AA _____ Aa_____ aa_____
p_______ q _______

103
AP BiologyDate: ___________________ Name and Period: ______________________________________________
AP Biology Lab 9
TRANSPIRATIONOVERVIEWIn this lab you will:
1. Apply what you know about water potential from Lab 1 (Diffusion and Osmosis) to the movement of waterwithin a plant.
2. Measure transpiration under different lab conditions, and
3. Study the organization of the plant stem and leaf as it relates to these processes by observing sections oftissues.
OBJECTIVESBefore doing this lab you should understand:
• How water moves from roots to leaves in terms of physical /chemical properties of water and theforces provided by differences in water potential.
• The role of transpiration in the transport of water within a plant; and
• The structures used by plants to transport water and regulate water movement.
After doing this lab you should be able to:
• Test the effects of environmental variables on rates of transpiration using a controlled experiment, and
• Make thin sections of stem, identify xylem and phloem cells, and relate function of these vasculartissues to the structures of their cells.
INTRODUCTIONThe amount of water needed daily by plants for the growth and maintenance of tissues is small in comparisonthe amount that is lost through the process of transpiration (the evaporation of water from the plant surface)and guttation (the loss of liquids from the ends of vascular tissues at the margins of leaves). If the water isnot replaced, the plant will wilt and may die.
The transport of water up from the roots in the xylem is governed by differences in water potential (thepotential energy of water molecules). These differences account for water movement from cell to cell andover long distances in the plant. Gravity, pressure, and solute concentration all contribute to water potential toan area of low water potential. The movement itself is facilitated by osmosis, root pressure, and adhesion andcohesion of water molecules.
The Overall Process: Minerals actively transported into the root accumulate in the xylem, increasing soluteconcentration and decreasing water potential. Water moves in by osmosis. As water enters the xylem, itforces fluid up the xylem due to hydrostatic root pressure. But this pressure can only move fluid a shortdistance. The most significant force moving the water and dissolved minerals in the xylem is upward pull as aresult of transpiration, which creates tension. The “pull” on the water from transpiration results fromcohesion and adhesion of water molecules.

104
The Details: Transpiration begins with evaporation of water through stomates (stomata), small openings inthe leaf surface, which open into air spaces that surround mesophyll cells of the leaf. The moist air in thesespaces has a higher water potential that the outside air, and water tends to evaporate from the leaf surface(moving from an area of high water potential to an area of lower water potential.). The moisture in the airspaces is replaced by water from the adjacent mesophyll cells, lowering their water potential (since thecytoplasm becomes more concentrated). Water will then move into the mesophyll cells by osmosis fromsurrounding cells with higher water potentials, including the xylem. As each water molecule moves into themesophyll cell, it exerts a pull on the column of water molecules existing in the xylem all the way from theleaves to the roots. This transpirational pull occurs because of (1) the cohesion of water molecules to oneanother due to hydrogen bond formation, and (2) adhesion of water molecules to the walls of the xylem cellswhich aids in offsetting the downward pull of gravity.
The upward transitional pull on the fluid in the xylem causes a tension (negative pressure) to form in thexylem, pulling the walls of the xylem inward. The tension also contributes to the lowering of the waterpotential in the xylem. This decrease in water potential, transmitted all the way from the leaf to the roots,caused water to move inward from the soil, across the cortex of the root and into the xylem.
Evaporation through the open stomata is a major route of water loss in plants. However, the stomates mustopen to allow the entry of CO2 used in photosynthesis. Therefore, a balance must be maintained between thegain of CO2 and the loss of water by regulating the opening and closing of stomates on the leaf surface.Many environmental conditions influence the opening and closing of stomates and also affect the rate oftranspiration. Temperature, light intensity, air currents, and humidity are some of these factors. Differentplants also vary in the rate of transpiration and in the regulation of stomatal opening.
EXERCISE 9A: TranspirationIn this lab you will measure transpiration under various laboratory conditions using a potometer. Foursuggested plant species are Impatiens (which is a moisture loving plant), Oleander (which is more droughttolerant), Zebrina, and a two-week old Phaseolus vulgaris (which are bean seedlings).
PROCEDUREEach lab group will expose one plant to one treatment.
1. Place the tip of a 0.1 ml pipette into a 16-inch piece of clear plastic tubing.
2. Submerge the tubing and pipette in a shallow tray of water. Draw water through the tubing until all thebubbles are eliminated.
3. Carefully cut the plant stem under water. This step is very important, because no air bubbles must beintroduced into the xylem.
4. While your plant and tubing are submerged, insert the freshly cut stem into the open end of the tubing.
5. Bend the tubing upward into a “U” and use the clamp on a ring stand to hold both the pipette and thetubing (see Figure 9.1).
6. If necessary, use petroleum jelly to make an airtight seal surrounding the stem after it has been insertedinto the tube. Make sure that the end of the stem is immersed in water. Do not put petroleum jelly on thecut end of the stem.
7. Let the potometer equilibrate for 10 minutes before recording the time zero reading.

105
Figure 9.1
Alternative Procedure for Filling Potometer(i) Set up the potometer as shown in Figure 9.1.
(ii) Use a water bottle or pipette to fill the tubing. Add water until the water comes out of the tube and nobubbles remain.
(iii) Quickly cut the plant stem and insert it into the potometer.
8. Expose the plant in the tubing to one of the following treatments (you will be assigned a treatment by yourteacher).
a. Room conditionsb. Floodlight (place a 100-watt bulb 1 meter from the plant and use a beaker filled with water as aheat sink)c. Fan (place at least one meter from the plant, on low speed, creating a gentle breeze)
d. Mist (mist the leaves with water and cover with transparent plastic bag; leave the bottom of thebag open)
9. Read the level of water in the pipette at the beginning of your experiment (time zero) and record yourfinding in Table 9.1.
10. Continue to record the water level in the pipette every 3 minutes for 30 minutes and record the data inTable 9.1.
11. At the end of your experiment cut all the leaves off the plant and mass them. Remember to blot off all theexcess water before massing.
Mass of leaves: _________________ grams

106
Table 9.1 Potometer Readings for Plant _______________________
Time(min) 0 3 6 9 12 15 18 21 24 27 30
Reading(ml)
Calculation of Leaf Surface AreaThe leaf surface area of all the leaves can be calculated by using the Leaf Trace Method.
Leaf Trace MethodAfter arranging all the cut-off leaves on the grid below, trace the edge pattern directly onto the Grid9.1. Count all the grids that are completely within the tracing and estimate the number of grids that liepartially within the tracing. The grid is constructed so that 4 blocks = 1 cm2. The total surface areacan then be calculated by dividing the total number of blocks covered by 4, Record this value here:______________________= Leaf Surface Area (cm2) = _________________ m2
Grid 9.1
12. Calculate the water loss per square meter of leaf surface by dividing the water loss at each reading fromTable 9.1 by the leaf surface area you calculated. Record your results in Table 9.2.

107
Table 9.2: Individual Water Loss in mL/ m2
Time(min) 0 3 6 9 12 15 18 21 24 27 30
WaterLoss(ml)
WaterLossper m2
13. Record the averages for the class data in Table 9.3.
Table 9.3: Class Average Cumulative Water Loss in mL/ m2
Time (minutes)
Treatment 0 3 6 9 12 15 18 21 24 27 30
Room 0
Light0
Fan 0
Mist 0
14. For each treatment, graph the average of the class data for each time interval. You may need to convertdata to scientific notation. All numbers must be reported to the same power of ten for graphing purposes.
For this graph, you will need to determine the following:
a. The independent variable: ________________________
b. The dependent variable: __________________________
Make sure the graph has a title, labels, legends, numbers and number tics and units.

108
Graph 9.1
ANALYSIS OF RESULTS1. Calculate the rate (average amount of water loss per minute per square meter) for each of the treatments.
Room: _____________________________________________________________________
Fan: ______________________________________________________________________
Light: ______________________________________________________________________
Mist: _______________________________________________________________________

109
2. Explain why each of the conditions causes an increase or decrease in transpiration compared with thecontrol.
Condition Effect Explanation of Effect
Room
Fan
Light
Mist
3. Explain the role of water potential in the movement of water from soil through the plant and into the air.
4. What is the advantage of closed stomata to a plant when water is in short supply? What are thedisadvantages?
5. Describe several adaptations that enable plants to reduce water loss from their leaves. Include bothstructural and physiological adaptations.
6. Why did you need to calculate leaf surface area in tabulating your results?

110
EXERCISE 9B: Structure of the Stem
The movement of fluids and nutrients throughout the plant occurs in the vascular tissue: the xylem andphloem of the roots, stems, and leaves. In this exercise you will study the structure of the plat stem bypreparing sections of the stem from the plant that you used in Exercise 9A. If your teacher provides you withprepared slides, proceed to Step 15.
PROCEDURE
1. Obtain a nut-and-bolt microtome from your teacher.
2. Turn the nut until it is almost at the end of the bolt, forming a small “cup”.
3. Using a new, single edge razor blade, cut a short piece of plant stem (approximately 5 mm – slightlylonger than the depth of the “cup” in the nut) from the base of your plant. Make 2 cuts so that both endsare freshly cur. Make sure that this portion of the stem is free of petroleum jelly if you are using the sameplant that you used for Exercise 9A.
4. Stand the stem up on its end in the opening of the nut and carefully pour-melted paraffin into the nut until itfills the opening, completely covering the stem. Your teacher will direct you in safely melting and pouringthe paraffin. (Be careful that the paraffin is not too hot when you pour it or you will cook your stem.) Thisassembly will allow you to hold your stem upright and cut thin slices.
5. Hold the head of the bolt horizontal on the table with one hand. Holding the razor blade in your otherhand, remove the excess wax on top by slicing down to the nut. This technique keeps your fingers out ofthe way of the razor blade (see Figure 9.2).
Figure 9.2: Using the Nut-and Bolt Microtome
6. Twist the bolt just a little, so a thin core of paraffin and stem sticks up above the surface of the nut.
7. Using a slicing motion to cut this section down to the nut. Use as much of the edge of the razor blade aspossible by starting on one end and sliding down to the other with each slice.
8. Put the slice in a dish containing 50% ethanol.

111
9. Twist the bolt a bit more to get another slice. Remember: you are trying to get the thinnest possible slice.It is better to get part of a thin slice that is entirely round. As you cut each slice, put it in the dish of 50%ethanol. Obtain 8 – 10 sections.
10. Leave the section in the 50% ethanol for 5 minutes. Free the plant tissue from the paraffin, if necessary.
11. Using forceps move the sections to a dish of toluidine blue O stain and leave them there for a shortperiod of time (between 1 and 2 minutes).
12. Rinse the section in a dish of distilled water.
13. Mount the sections in a drop of 50% glycerin on a microscope slide.
14. Add a cover slip and observe the sections using a compound microscope.
15. Make a drawing of your sections in the space provided in Figure 9.3. Identify and label the cell and tissuetypes described below.
CELL TYPESParenchyma. The most abundant cell type is parenchyma. Parenchyma cells are relatively unspecialized
and retain their protoplasts throughout their existence. They have primary cell walls. They make up themesophyll of leaves (where most of the photosynthetic activity takes place), the flesh of fruits, the pith ofstems, and the root and stem cortex. Many parenchyma cells are used for food storage (mainly starch).Many parenchyma cells are used for food storage (mainly starch). Starch, you will recall, is a polymer ofglucose. Starch forms grains within parenchyma cells. These grains can be seen inside the cells.Reexamine your section and label the parenchyma cells in your drawing.
Sclerenchyma. Elongated sclerenchyma cells make up fibers and have thick secondary cell walls. They areoften lignified, and the protoplasts die at maturity. Fibers may be found in leaves, stems, and fruits.Usually fibers are in bundles, serving a support function, and often are associated with vascular tissue.Check your stem cross section for fibers. They will be found just outside the vascular bundles, their thickwalls stained bright blue.
Collenchyma. Many young stems and leaves contain collenchyma cells for support. These cells are living atmaturity and characteristically have primary cell walls that are thickened at the corners. Locatecollenchyma cells in your cross section.
TISSUE TYPESXylem. Xylem is a tissue composed of several different cell types. It is the water-conducting tissue that
conveys water and minerals from the soil through the plant. The earliest xylem cells to evolve werefiberlike with thick lignified secondary walls arranged with overlapping ends with a series of membrane-covered “pits” for passing water from one cell to the next. These are the tracheids. The cells that actuallycarry the water were misnamed “tracheary elements” in the seventeenth century (“trachea” means airduct) and name was never corrected. Vessel elements developed later, first appearing in flowering plants,and are larger in diameter, have holes rather than pits, and offer less resistance to water flow thantracheids. Both vessel elements may also contain parenchyma cells and fibers. Look at your crosssections and label the xylem in your drawing.
Phloem. Phloem is a tissue that distributes the carbohydrate products of photosynthesis throughout theplant. This is achieved in flowering plants by the sieve tube members, which have primary cell walls andliving protoplasts at maturity but lack nuclei. Companion cells are associated with sieve tube members.These companion cells have nuclei and play an important role in the transfer of substances from cell tocell. Phloem may also contain parenchyma cells and fibers. Look at your cross section. The phloem is

112
located outside the xylem. This aggregation of xylem and phloem is called the vascular bundle.Monocots and dicots have different arrangements of the xylem and phloem tissues, but the cells andtissue type involved are the same.
Epidermis. The epidermis is the outermost layer of cells that serves as a covering for the above-ground plantparts. Some epidermal tissues are covered with a layer of cutin, which prevents water loss. Thespecialized guard cells of f the epidermis open and close the stomates. Locate the epidermis on yourstem section, and then locate guard cells on the leaf section.
Figure 9.3: Stem Cross Section

113
AP Biology LaboratoryDate: ___________________ Name and Period: ______________________________________________
AP Biology Lab 10
PHYSIOLOGY OF THE CIRCULATORY SYSTEM
OVERVIEWIn this lab you will:
1. in Exercise 10A you will learn how to measure blood pressure.
2. in exercise 10B you will measure pulse rate under different conditions: standing, reclining, after thebaroreceptor reflex, and during and immediately after exercise. The blood pressure and pulse rate will beanalyzed and elated to an index of fitness.
3. in Exercise 10C you will measure the effect of temperature on the hear rate of the water flea, Daphniamagna.
OBJECTIVESBefore doing this lab you should understand:
• the relationship between temperature and the rate of physiological processes, and
• the basic anatomy of various circulatory systems.
After doing this lab you should be able to:
• measure heart rate and blood pressure in a human volunteer;
• describe the effect of changing body position on heart rate and blood pressure;
• explain how exercise changes heart rate;
• determine a human’s fitness index;
• analyze cardiovascular data collected by the entire class; and
• discuss and explain the relationship between heart rate and temperature.
INTRODUCTIONThe cardiovascular (circulatory) system functions to deliver oxygen and nutrients to tissues for growth andmetabolism, and to remove metabolic wastes. The heart pumps blood through a circuit that includes arteries,arterioles, capillaries, venules, and veins. One important circuit is the pulmonary circuit, where there is anexchange of gases within the alveoli of the lungs. The right side of the human heart received deoxygenatedblood from body tissues and pumps it to the lungs. The left side of the heart receives oxygenated blood fromthe lungs and pumps it to the tissues.
With increased exercise, several changes occur within the circulatory system, thus increasing the delivery ofoxygen to actively respiring muscle cells. These changes include increased heart rate, increased blood flowto muscular tissue, decreased blood flow to nonmuscular tissue, increased arterial pressure, increased bodytemperature, and increased breathing rate.

114
Blood PressureAn important measurable aspect of the circulatory system is blood pressure. When the ventricles of the heartcontract, pressure is increased throughout all the arteries. Arterial blood pressure is directly dependent on theamount of blood pumped by the heart per minute and the resistance to blood flow through the arterioles. Thearterial blood pressure is determined using a device known as a sphygmomanometer. This device consists ofan inflatable cuff connected by rubber hoses to a hand pump and to a pressure gauge graduated inmillimeters of mercury. The cuff is wrapped around the upper arm and inflated to a pressure that will shut offthe brachial artery. The examiner listens for the sounds of blood flow in the brachial artery by placing the bellof a stethoscope I the inside of the elbow below the biceps (Figure 10.1).
Figure 10.1: The Use of a Sphygmomanometer to Measure Blood Pressure
At rest, the blood normally goes through the arteries so that the blood in the central part of the artery movesfaster than the blood in the peripheral part. Under these conditions, the artery is silent when one listens.When the sphygmomanometer cuff is inflated to a pressure above the systolic pressure, the flow of blood isstopped and the artery is again silent. As the pressure in the cuff gradually drops to levels between thesystolic and diastolic pressures of the artery, the blood is pushed through the compressed walls of the arteryin a turbulent flow. Under these conditions, the blood is mixed, and the turbulence sets up vibrations in theartery that are heard as sounds in the stethoscope. These sounds are known as the heart sounds, or soundsof Korotkoff.
The sounds are divided into five phases based on the loudness and quality of the sounds.Phase 1. A loud, clear snapping sound is evident, which increases in intensity as the cuff is deflated.In the example shown in Figure 10.2, this phase begins at a cuff pressure of 120 millimeters ofmercury (mm Hg) and ends at a pressure of 106 mmHg.
Phase 2. A succession of murmurs can be heard. Sometimes the sounds seem to disappear duringthis time, which may be a result of inflating or deflating the cuff too slowly. In this example shown inFigure 10.2, this phase begins at a cuff pressure of 106 mmHg and ends at a pressure of 86 mm Hg.
Phase 3. A loud thumping sound similar to that in Phase I, but a less clear, replaces the murmurs. Inthe example shown in Figure 10.2, Phase 3 begins at a cuff pressure of 86 mm Hg and ends at apressure of 81 mm Hg.
Phase 4. A muffled sound abruptly replaces the thumping sounds of Phase 3. In the example shownin Figure 10.2, this phase begins at a cuff pressure of 81 mm Hg and ends at a pressure of 76 mm Hg.
Phase 5. All sounds disappear.
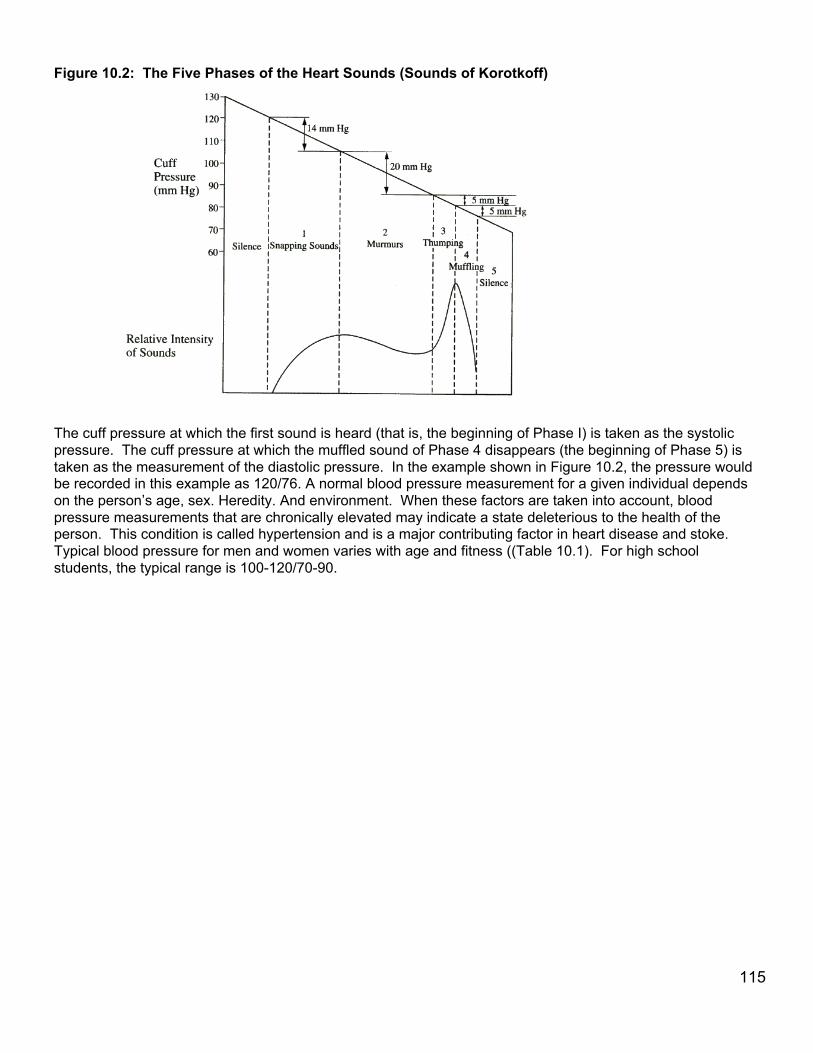
115
Figure 10.2: The Five Phases of the Heart Sounds (Sounds of Korotkoff)
The cuff pressure at which the first sound is heard (that is, the beginning of Phase I) is taken as the systolicpressure. The cuff pressure at which the muffled sound of Phase 4 disappears (the beginning of Phase 5) istaken as the measurement of the diastolic pressure. In the example shown in Figure 10.2, the pressure wouldbe recorded in this example as 120/76. A normal blood pressure measurement for a given individual dependson the person’s age, sex. Heredity. And environment. When these factors are taken into account, bloodpressure measurements that are chronically elevated may indicate a state deleterious to the health of theperson. This condition is called hypertension and is a major contributing factor in heart disease and stoke.Typical blood pressure for men and women varies with age and fitness ((Table 10.1). For high schoolstudents, the typical range is 100-120/70-90.

116
Table 10.1: Typical Blood Pressure for Men and Women at Different Ages
Systolic DiastolicAge(in Years)
Men Women Men Women
0 103 103 69 7011 104 104 70 7112 106 106 71 7213 108 108 72 7314 110 110 73 7415 112 112 75 7616 118 116 73 7217 121 116 74 7218 120 116 74 7219 122 115 75 71
20-24 123 116 76 7225-29 125 117 78 7430-34 126 120 79 7535-39 127 124 80 7840-44 129 127 81 8045-49 130 131 82 8250-54 135 137 83 8455-59 138 139 84 8460-64 142 144 85 8565-69 143 154 83 8570-74 145 159 82 85
EXERCISE 10A: Measuring Blood Pressure
Note: These labs are ONLY for experimental, and not diagnostic purposes.
A sphygmomanometer (blood pressure cuff) is used to measure blood pressure. The cuff, designed to fitaround the upper arm, can be expanded by pumping a rubber bulb connected to the cuff. The pressuregauge, scaled in millimeters, indicates the pressure inside the cuff. A stethoscope is used to listen to theindividual’s pulse (see Figure 10.1). The earpieces of the stethoscope should be cleaned with alcohol swabsbefore and after each use.
PROCEDURE1. Work in pairs. Those who are to have their blood pressure measured should be seated with bothshirtsleeves rolled up.
2. Attach the cuff of the sphygmomanometer snugly around the upper arm.
3. Place the stethoscope directly below the cuff in the bend of the elbow joint.
4. Close the valve of the bulb by turning it clockwise. Pump air into the cuff until the pressure gaugereaches 180 mm Hg.
5. Turn the valve of the bulb counterclockwise and slowly release air from the cuff. Listen for the pulse.
6. When you first hear the heart sounds, not the pressure on the gauge. This is the systolic pressure.
7. Continue to slowly release air and listen until the thumping sound of the pulse becomes strong and then fades. When you hear the full heart beat, not the pressure, this is the diastolic pressure.

117
8. Repeat the measurement two more times and determine the average systolic and diastolic pressure,then record these values in the blood pressure data box.
9. Trade places with your partner. When your average systolic and diastolic pressure have beendetermined, record these values in the blood pressure box.
EXERCISE 10B: A Test of FitnessThe point scores on the following tests provide an evaluation of fitness based not only on cardiac musculardevelopment but also on the ability of the cardiovascular system to respond to sudden changes in demand.CAUTION: Make sure that you do not attempt this exercise if strenuous activity will aggravate ahealth problem.
Work in pairs. Determine the fitness level for one member of the pair (Tests 1 to 5) and then repeat theprocess for the other member.
Test 1: Standing Systolic Compared with Reclining SystolicUse the sphygmomanometer as you did in Exercise 10A to measure the change in systolic blood pressurefrom a reclining to a standing position.
Procedure1. The subject should recline on a lab bench for at least five minutes. At the end of this time, measure thesystolic and diastolic pressure and record these values below.
reclining recliningsystolic pressure ________ mm Hg diastolic pressure ________ mm Hg
2. Remain reclining for two minutes, then stand and immediately repeat measurements the same subject(arms down). Record these values below.
standing standingsystolic pressure ________ mm Hg diastolic pressure ________ mm Hg
3. Determine the change in systolic pressure from reclining to standing by subtracting the standingmeasurement from the reclining measurement. Assign fitness points based on Table 10.2 and record inthe fitness data box.
Table 10.2: Change in Systolic Pressure from Reclining to StandingChange (mm Hg) Fitness Points
rise of 8 or more 3rise of 2 – 7 2no rise 1fall of 2 – 5 0fall of 6 or more -1
Cardiac Rate and Physical FitnessDuring physical exertion, the cardiac rate (beats per minute) increases. This increase can be measured as anincrease in pulse rate. Although the maximum cardiac rate is generally the same in people of the same agegroup, those who are physically fit have a higher stroke volume (milliliters per beat) than more sedentaryindividuals. A person who is in poor physical condition, therefore, reaches his or her maximum cardiac rate ata lower work level than a person of comparable age who is in better shape. Individuals who are in goodphysical condition can deliver more oxygen to their muscles (have a higher aerobic capacity) before reachingmaximum cardiac rate than those in poor condition.

118
Thus, the physically fit have a slower increase in their cardiac rate with exercise and a faster return to theresting cardiac rate after exercise. Physical fitness, therefore, involves not only muscular development butalso the ability of the cardiovascular system to respond to sudden changes in demand.
Test 2: Standing Pulse RateProcedure
1. The subject should stand at ease for 2 minutes after Test 1.
2. After the 2 minutes, determine the subject’s pulse.
3. Count the number of beats for 30 seconds and then multiply by 2. The pulse rate is the number ofheartbeats per minute. Record them in the fitness data box. Assign fitness points based on Table 10.3and record them in the fitness box.
Table 10.3: Standing Pulse RatePulse Rate(beats/min) Fitness Points
61-70 371-80 381-90 3
91-100 1101-110 1111-120 0121-130 0131-140 -1
Test 3: Reclining Pulse RateProcedure1. The subject should recline for 5 minutes on a lab bench.
2. Determine the subject’s resting pulse rate.
3. Count the number of beats for 30 seconds and then multiply by 2. (Note: the subject should remainreclining for the next test.) The pulse rate is the number of heartbeats per minute. Record them in thefitness data box. Assign fitness points based on Table 10.4 and record them in the fitness box.
Table 10.4: Standing Pulse RatePulse Rate(beats/min) Fitness Points
50-60 361-70 371-80 281-90 1
91-100 0101-110 -1

119
Test 4: Baroreceptor Reflex (Pulse Rate Increase from Reclining to Standing)Procedure1. The reclining subject should now stand up.
2. Immediately take the subject’s pulse by counting the number of beats for 30 seconds. Multiply by 2todetermine the pulse rate in beats per minute. Record this value below. The observed increase in pulserate is initiated by baroreceptors (pressure receptors) in the carotid artery and in the aortic arch. Whenthe baroreceptors detect a drop in blood pressure they signal the medulla of the brain to increase theheartbeat and, consequently, the heart rate.
Pulse immediately upon standing = _____beats per minute
3. Subtract the reclining pulse rate (recorded in Test 3) from the pulse rate immediately upon standing(recorded in Test 4) to determine the pulse rate increase upon standing. Record in the fitness box.Assign fitness points based on Table 10.5 and record in the fitness box.
Table 10.5: Pulse Rate Increase from Reclining to Standing
Pulse Rate Increase on Standing (# of beats) 0-10 11-18 19-26 27-34 35-43
Reclining Pulse(beats/min)
Fitness Points50-60 3 3 2 1 061-70 3 2 1 0 -171-80 3 2 0 -1 -281-90 2 1 -1 -2 -391-100 1 0 -2 -3 -3
101-110 0 -1 -3 -3 -3
Test 5: Step Test - EnduranceProcedure
1. The subject should do the following: Place your right foot on an 18-inch stool. Raise your body sothat your left foot comes to rest by your right foot. Return your left foot to the original position. Repeat thisexercise 5 times, allowing 3 seconds for each step up.
2. Immediately after the completion oft his exercise, measure the subject’s pulse for 15 seconds andrecord below; measure again for 15 seconds and record, continue taking the subject’s pulse and recordingthe rates at 650, 90, and 120 seconds.
Number of beats in the 0-15 second interval _______ X 4 = _____beats per minuteNumber of beats in the 16-30 second interval _______ X 4 = _____beats per minuteNumber of beats in the 31-60 second interval _______ X 4 = _____beats per minuteNumber of beats in the 61-90 second interval _______ X 4 = _____beats per minuteNumber of beats in the91-120 second interval _______ X 4 = _____beats per minute
3. Observe the time that it takes the subject’s pulse to return to approximately the level that was recordedin Test 2. Assign fitness points based on Table 10.6 and record them in the fitness data box.

120
Table 10.6: Time Required for Return of Pulse Rate to Standing Level After Exercise
Time (seconds) Fitness Points0 – 30 431 – 60 361 - 90 291 - 120 1121+ 11-10 beats above standing pulse rate 011-20 beats above standing pulse rate -1
4. Subtract the subject’s normal standing pulse rate (recorded in Test 2) from his/her pulse rate immediatelyafter exercise (the 0- to 15- second interval) to obtain pulse rate increase. Record this on the data sheet.Assign fitness points based on Table 10.7 and record them in the fitness data box.
Table 10.7: Pulse Rate Increase After Exercise
Pulse Rate Increase Immediately after Exercise (# ofbeats)
0-10 11-20 21-30 31-40 41+
Standing Pulse(beats/min)
Fitness Points60-70 3 3 2 1 071-80 3 2 1 0 -181-90 3 2 1 -1 -291-100 2 1 0 -2 -3
101-110 1 0 -1 -3 -3111-120 1 -1 -2 -3 -3121-130 0 -2 -3 -3 -3131-140 0 -3 -3 -3 -3

121
DATA SHEET
Blood Pressure Data
Measurement 1 2 3 AverageSystolicDiastolic
Fitness Data
Measurement PointsTest 1: Change in systolic
pressure from recliningto standing
mm Hg
Test 2. Standing pulse ratebeats/min
Test 3. Reclining pulse ratebeats/min
Test 4. Baroreceptor reflexPulse rate increase onstanding
beats/min
Test 5. Step TestReturn of pulse tostanding rate afterexercise
Pulse rate increaseimmediately afterexercise
seconds
beats/min
TOTAL SCORE
Total Score
18-1716-1413-87 or less
Relative Cardiac Fitness
ExcellentGoodFairPoor

122
DISCUSSION1. Explain why blood pressure and heart rate differ when measured in a reclining position and in astanding position.
2. Explain why high blood pressure is a health concern.
3. Explain why an athlete must exercise harder or longer to achieve a maximum heart rate than a personwho is not physically fit.
4. Research and explain why smoking causes a rise in blood pressure.

123
EXERCISE 10C: Heart Rate and TemperatureIn ectothermic animals there is a direct relationship between the rate of many physiological activities andenvironmental temperature. The rate of metabolism in these animals increases as environmentaltemperatures increase from approximately 5oC to 35oC. Increasing the temperature by approximately 10oCresults in doubling of the metabolic rate. That is why a snake or lizard can hardly move when it is cold butbecomes active after warming in the sun.
Figure 10.4 Daphnia(Note the position of the heart)

124
PROCEDURE1. Pick up a Daphnia with a large-bore pipette or eyedropper.
2. Place the Daphnia into the large end of a Pasteur pipette and allow the culture fluid containing theDaphnia to run down into the narrow tip of the pipette.
3. Use a paper towel to draw some of the culture fluid out of the pipette until the Daphnia no longermoves down the tube and the fluid level is approximately 5 mm above the Daphnia.
4. Seal the narrow end of the pipette with clay or petroleum jelly.
5. Score the pipette with a file and break it off about 2 cm above the Daphnia. Seal the broken end bykeeping the pipette upright (sealed end down) and inserting the broken end into clay or petroleum jelly.
6. Place the tube containing the Daphnia into a petri dish or bowl of water that is the same temperature asthe culture fluid. Use a dissecting microscope to observe the Daphnia. Refer to Figure 10.4 to locate theDaphnia’s heart. Count the heartbeats for 10 seconds and then multiply by 6 to obtain the heart rate inbeats per minute. Record the temperature and heart rate in Table 10.8.
7. Now place the tube into a petri dish containing water at 10 to 15oC. Note the temperature and changesin heart rate for every 5oC change in temperature until you can no longer accurately count the beats.
8. Slowly add warm water (not greater than 35oC) to the dish. In Table 10.8 record the temperature andchanges in heart rate for every 5oC change in temperature until you can no longer accurately count thebeats.
Alternative Procedure(i) Obtain two concave depression slides. Pull off several cotton fibers from a cotton ball and place thesein the depression of 1 slide.
(ii) Add a Daphnia to the slide. Place a second slide on top, concave side over the Daphnia, and securethe two slides with 2 rubber bands. Leave 1 strand of rubber band between the two slides to hold themapart for sufficient circulation (see Figure 10.3).
Figure 10.3
(iii) Use several culture dishes to set up baths of varying temperatures. Begin by placing the slide intothe coolest bath.
(iv) Use a dissecting microscope to observe the Daphnia. Refer to Figure 10.4 to locate the Daphnia’sheart. Count the heartbeats for 10 seconds and then multiply by 6 to obtain the heart rate in beats perminute.
(v) Now place the slides in the next warmest bath. Record the temperature and the heart rate after therate has stabilized.

125
(vi) In Table 10.8 record the temperature and changes in heart rate for every change in temperature untilyou can no longer accurately count the beats.Table 10.8: Temperature and Heart Rate Data
Reading Temperature (oC) Heart Rate (beats/minute)12345678
ANALYSIS OF RESULTS
Graph the temperature and heart rate data. For this graph you will need to determine the following:
a. The independent variable : ________________________ Use this to label the horizontal (x) axis.
b. The dependent variable: ___________________________ Use this to label the vertical (y) axis.
c. Make sure your graph has a title, labels, units, a legend, number tics.Graph 10.1 Title: _______________________________________

126
DISCUSSION
1. Why does the temperature affect heart rate in ectothermic organisms?
2. Discuss what results you might obtain if you repeated this experiment using endothermic organisms.
3. Describe at least four ways an ectothermic organism’s behavior helps it regulate its temperature.

127
AP Biology LaboratoryDate: ___________________ Name and Period: ______________________________________________
AP Biology Lab 11
ANIMAL BEHAVIOR
OVERVIEWIn this lab you will observe some aspects of animal behavior.
1. In Exercise 11A you will observe pillbugs and design an experiment to investigate theirresponses to environmental variables.
2. In Exercise 11B you will observe and investigate mating behavior in fruit flies. Your teachermay suggest other organisms or other types of animal behavior to study.
OBJECTIVESBefore doing this lab you should understand:
• The concept of distribution of organisms in a resource gradient, and• The difference between kinesis and taxis.
After doing this lab you should be able to:• Describe some aspects of animal behavior, such as orientation behavior, agnostic behavior,
dominance display, or mating behavior, and• Understand the adaptiveness of the behaviors you studied.
INTRODUCTIONEthology is the study of animal behavior. Behavior is an animal’s response to sensory input andfalls into two basic categories: learned and innate (inherited).
Orientation behaviors place the animal in its most favorable environment. In taxis the animalmoves toward or away from a stimulus. Taxis is often exhibited when the stimulus is light, heat,moisture, sound, or chemicals. Kinesis is a movement that is random and does not result inorientation with respect to a stimulus. If an organism responds to bright light by moving away, that istaxis. If an animal responds to bright light by random movements in all directions, that is kinesis.
Agonistic behavior is exhibited when animals respond to each other by aggressive or submissiveresponses. Often the agonistic behavior is simply a display that makes the organism look big orthreatening. It is sometimes studied in the laboratory with Bettas (Siamese Fighting Fish).
Mating behaviors may involve a complex series of activities that facilitate finding, courting, andmating with a member of the same species.

128
EXERCISE 11A: General Observation of BehaviorsIn this lab you will be working with terrestrial isopods commonly known as pillbugs, sowbugs, or roly-polies. These organisms are members of the Phylum Arthropoda, Class Crustacea, which alsoincludes shrimp and crabs. Most members of this group respire through gills.
PROCEDURE1. Place 10 pillbugs and a small amount of bedding material in a Petri dish. Pillbugs generally do
not climb, but if they do, you may cover the dish with plastic wrap or the Petri dish cover.
2. Observe the pillbugs for 10 minutes. Make notes on their general appearance, movementsabout the dish, and interactions with each other. Notice if they seem to prefer one ara overanother, if they keep moving, settle down, or move sporadically. Note any behaviors thatinvolve 2 or more pillbugs. Try to make your observations without disturbing the animals inany way. Do not prod or poke or shake the dish, make loud sounds, or subject them to brightlights. You want to observe their behavior, not influence it or interfere with it.
________________________________________________________________________________
________________________________________________________________________________
________________________________________________________________________________
________________________________________________________________________________
________________________________________________________________________________
________________________________________________________________________________
________________________________________________________________________________
________________________________________________________________________________
3. Make a detailed sketch of a pillbug.

129
Kinesis in Pillbugs1. Prepare a choice chamber as illustrated in Figure 11.1. The choice chamber consists of two
large, plastic petri dishes taped together with an opening cut between them. Cut the openingwith scissors and use tae to hold the dishes together. Line one chamber with a moist piece offilter paper and the other with a dry piece of filter paper.
2. Use a soft brush to transfer ten pillbugs from the stock culture into the choice chamber. Place5 pillbugs in each side of the choice chamber. Cover the chambers.
3. Count how many pillbugs are on each side of the choice chamber every 30 seconds for 10minutes and then record your data in Table 11.1 (page). Continue to record even if they allmove to one side or stop moving.
4. Return your pillbugs to the stock culture.
5. Graph both the number of pillbugs in the wet chamber and the number in the dry chamberusing Graph 11.1 on page.
Figure 11.1 Choice Chamber

130
Table 11.1Time
(mins.)Number inWetChamber
Number inDryChamber
Other Notes
0.51.01.52.02.53.03.54.04.5505,56,06.57.07.58.08.59.09.510.0

131
For this graph you will need to determine the following:
a. The independent variable: _____________________________________. Use this tolabel the x-axis.
b. The dependent variable: ______________________________. Use this to label thevertical (y) axis.
Graph 11.1 Title: __________________________________________________________

132
ANALYSIS
1. What conclusions do you draw from your data? Explain the physiological reasons for thebehavior observed in this activity.
2. Obtain results from all of the lab groups in your class. With respect to humidity, light,temperature, and other environmental conditions, which type of environment do isopods prefer?How do the data support these conclusions? Give specific examples.
3. How do isopods locate appropriate environments?
4. If you suddenly turned a rock over and found isopods under it, what would you expect them to bedoing? If you watched the isopods for a few minutes, how would you expect to see their behaviorchange?
5. Is the isopod’s response to moisture best classfied as kenesis r taxis? Explain your response.
Student-Designed Experiment to Investigate Pillbug’s Response to Temperature, pH,Background Color, Light or other Variable
1. Select one of the variable factors listed above and develop a hypothesis concerning the pillbug’sresponse to the factor.
2. Use the materials available in your classroom to design an experiment. Remember that heat isgenerated by lamps.
a. State the objective of your experiment.
b. List the materials you will use.
c. Outline your procedure in detail.
d. Decide what data you will collect and design your data sheet.
3. Run your experiment.
4. Make any graphical representation of your data that will help to visualize or interpret the data.
5. Write a conclusion based on your experimental results.
6. Return your isopods to the stock culture.

133
Exercise 11B: Reproductive Behavior in Fruit Flies
INTRODUCTIONIn this experiment you will place 3 or 4 virgin female Drosophila melanogaster flies In The same viaLwith 3 or 4 male flies, and using a dissecting microscope or hand lens, observe the behavior of eachsex. Mating in Drosophila melanogaster follows a strict behavioral pattern. Five phases can bedistinguished (see Figure 11.2):
A. OrientationB. Male song (wing vibration)C. Licking of female genitaliaD. Attempted copulationE. CopulationF. Rejection (extrusion of ovipositer)
Figure 11.2 Courtship Behavior in Drosophila melanogaster
Figure 11.2 A-F. Courtship behavior in D. melanogaster. A. Orientation of the male towards the female. B. Wingvibration by the male. C. The male licks the female’s genitalia with is proboscis. D. Mounting by he male with genitalcontact. E. Flies in copulation. F. A rejection response by the female. The female turns her abdomen towards themale and extends her ovipositer (see arrow).
At least 14 different behaviors have been described. Listed below are 10 of the most easilyrecognized of thee behaviors. Six of the behaviors are seen in males, 4 in females.
Male Behaviors1. Wing vibration. The male extends one or both wings from the resting position an moves
them rapidly up and down.2. Waving. The wing is extended and held 90o from the body, then relaxed without vibration.3. Tapping. The forelegs are extended to strike or tap the female.4. Licking. The male licks the female’s genitalia (on the rear of her abdomen).5. Circling. The male postures and hen circles the female, usually when she is nonreceptive.6. Stamping. The male stamps forefeet as in tapping but does not strike the female.

134
Female Behaviors1. Extruding. A temporary tubelike structure is extended from the female’s genitalia (Figure
11.2 F).2. Decamping. A nonreceptive female runs, jumps, or flies away from the courting male.3. Depressing. A nonreceptive female prevents access to her genitalia by depressing her wings
and curling the tip of her abdomen down.4. Ignoring. A nonreceptive female ignores the male.
PROCEDURE1. Set up the stereomicroscope.
2. Have a paper and pencil handy. The behaviors may happen very rapidly. One person shouldcall out observations while the other person records.
3. Obtain one vial containing virgin females and one vial containing males, and gently tap themale flies into the female vial.
4. Observe first with the naked eye, and once the flies have encountered each other, use thestereomicroscope to make observations.
5. As you identify the various behaviors, record their sequence and duration. Quantifyyour observations. To do this you many consider counting the number of times a behavior takesplace and timing the duration of the behaviors.
6. Discuss possible original experiments investigating reproductive behavior in flies.
RESULTSPrepare a detailed account of the behaviors you have observed. Include sketches and quantitativeanalysis as appropriate.
Student Designed Experiment to Investigate Reproductive Behavior in Fruit FliesDesign a simple experiment to investigate none of the following questions or any other that youdevise.
a. Will males placed in a vial with only males demonstrate courtship behavior?b. Will males respond to dead females?c. Do males compete?d. How will males respond to already mated females?
1. Develop a hypothesis concerning the fruit fly behavior.2. State your objective.3. List the materials you will use.4. Outline your procedure in detail.5. Decide what data you will collect and design your data sheet.6. Run your experiment.7. Make any graphical representation of your data that will help to visualize or interpret the data.8. Write a conclusion based on your experimental results.

135
AP Biology LaboratoryDate: ___________________ Name and Period: ______________________________________________
AP Biology Lab 12
DISSOLVED OXYGEN AND AQUATIC PRIMARYPRODUCTIVITY
OVERVIEW1. In exercise 12A you will measure and analyze the dissolved oxygen (DO) concentration in water
samples at varying temperatures;2. In Exercise 12B you will measure and analyze the primary productivity of natural waters or lab cultures
using screens to simulate the attenuation (decrease) of light with increasing depth.
OBJECTIVESBefore doing the lab you should understand:
• The biological importance of carbon and oxygen cycling in ecosystems,• How primary productivity relates to the metabolism of organisms in an ecosystem,• The physical and biological factors that affect the solubility of gases in aquatic ecosystems, and• The relationship between dissolved oxygen and the processes of photosynthesis and respiration and
how these processes affect primary productivity.After doing this lab you should be able to:
• Measure primary productivity based on changes in dissolved oxygen in a controlled experiment, and• Investigate the effects of changing light intensity on primary productivity in a controlled experiment.
INTRODUCTIONIn the aquatic environment, oxygen must be in solution in a free state (O2) before it is available for use byorganisms. Its concentration and distribution in the aquatic environment are directly dependent on chemicaland physical factors and are greatly affected by biological processes. In the atmosphere there is anabundance of oxygen, with about 200 milliliters of oxygen for every liter of air. Conversely, in the aquaticenvironment there are only about 5 to 10 milliliters of dissolved oxygen in a liter of water. The concentration ofthe oxygen in aquatic environments is a very important component of water quality.
At 20C oxygen diffuses 300,000 times faster in air than in water, making the distribution of oxygen in airrelatively uniform. Spatial distribution of oxygen in water, on the other hand, can be highly variable, especiallyin the absence of mixing by currents, winds, or tides.
Other chemical and physical factors, such as salinity, pH, and especially temperature, can affect the DOconcentration and distribution. Salinity, usually expressed in parts per thousand (ppt), is the content ofdissolved salts in water. Generally, as temperature and salinity increase, the solubility of oxygen in waterdecreases (Figure 12.1).

136
Figure 12.1: Solubility of Oxygen in Water
The partial pressure of oxygen in the air above the water affects the amount of DO in the water. Less oxygenis present at higher elevations since the air itself is less dense; therefore, water at higher elevations containsless oxygen. At 4,000 meters in elevation, (about 13,000 feet), the amount of dissolved oxygen in water isless than two-thirds what it is at sea level. All of these factors work together to increase diversity in aquatichabitats with regard to oxygen availability.
Biological processes, such as photosynthesis and respiration, can also significantly affect DO concentration.Photosynthesis usually increases the DO concentration in water. Aerobic respiration requires oxygen and willusually decrease DO concentration. The measurement if the DO concentration of a body of water is oftenused to determine whether the biological activities requiring oxygen are occurring; consequently, it is animportant indicator of pollution.
EXERCISE 12A: Dissolved Oxygen and Temperature
There are several brands of test kits available to determine the dissolved oxygen content of a water sample.Follow your teacher’s instruction for their use.
Depending on the testing procedure you use, the dissolved oxygen may be measured in parts per million(ppm), or milligrams per liter (mg/L), or milliliters per liter (mL/L). You should be able to make conversionsbetween each of these with the following information:
ppm O2 = O2/L
mg O2/L x 0.698 = mL O2/L
From this you can also calculate the amount of carbon fixed in photosynthesis as follows:
mL O2/L x 0.536 = mg carbon fixed/L

137
PROCEDURE1. Fill 3 of the water sampling bottles with water of the 3 different temperatures provided.2. Determine the DO of each sample using the technique given to you. Record these values in Table
12.1.3. On the monogram of oxygen saturation on page 4, use a straightedge or ruler to estimate the percent
saturation of DO in your samples and record this value in Table 12.1. Line up the edge of a ruler withthe temperature of the water on the top scale and the Do on the bottom scale, then read the percentsaturation from the middle scale
4. Record your values on the class blackboard and then enter class means in Table 12.1.
Table 12.1: Temperature/DO DataTemperature Lab Group DO Class Mean DO Lab Group % DO
Saturation(from nomogram)
Class Mean % DOSaturation
(from nomogram)
5. Graph both the lab group data and class means percent saturation as a function of temperature. Forthis graph you will need to determine the following:
a. The independent variable: _____________________________Use this to label the horizontal (x) axis.
b. The dependent variable: ______________________________Use this to label the vertical (y) axis.
Graph 12.1 Title: ____________________________________________

138
Figure 12.2: Nomogram of Oxygen Saturation
ProductivityThe primary productivity of an ecosystem is defined as the rate at which organic materials (carbon-containing compounds) are stored. Only those organisms possessing photosynthetic pigments can utilizesunlight to create new organic compounds from simple inorganic substances. Green plants obtain carbon forcarbohydrate synthesis from the carbon dioxide in the water of the air according to the basic equation forphotosynthesis:
6CO2 + 6H2O -> C6H12O6 + 6O2
The rate of carbon dioxide utilization, the rate of formation of organic compounds, or the rate of oxygenproduction can be used as a basis for measuring primary productivity. A measure of oxygen production overtime provides a means of calculating the amount of carbon that has been bound in organic compounds over aperiod of time. For each milliliter of oxygen produced, approximately 0.536 milligrams of carbon has beenassimilated.
One method of measuring the rate of oxygen production is the light and dark bottle method. In this method,the DO concentrations of samples of oceans, lake, or river water, or samples of laboratory algal cultures, aremeasured and compared before and after incubation in light and darkness. The difference between themeasurements of DO in the initial and dark bottles is an indication of the amount of oxygen that is beingconsumed in respiration by the organisms in the bottle. In the bottles exposed to light, the biologicalprocesses of photosynthesis and respiration are occurring; therefore, the change over time in DOconcentration from the initial concentrations is a measure of net productivity.
The difference over time between the DO concentration in the light bottle and the dark bottle is the totaloxygen production and therefore an estimate of gross productivity (see Figure 12.3).

139
Figure 12.3: Light-Dark Bottle Method to Determine Gross Productivity
EXERCISE 12B: A Model of Productivity as a Function of Depth in a Lake
Day One1. Obtain 7 water sampling bottles (these are also called BOD bottles, for "biological oxygen demand"). Fill all
the bottles with the lake water or algal sample provided. (You may be asked to add a specific weight ofaquatic plants to each bottle.) Be careful not to leave any air bubbles at the tops of the bottles.
2. Use masking tape to label the cap of each bottle. Mark the labels as follows: I (for "initial"), D (for "dark"),100%, 65%, 25%, 10%, and 2%.
3. Determine the DO for the "Initial" bottle now. Record this DO value in Table 12.2 and in the data table onthe blackboard. Record the class "Initial" bottle mean in Table 12.2. This is the amount of DO that the waterhas to start with (a base line).
4. Cover the "Dark" bottle with aluminum foil so that no light can enter. In this bottle no photosynthesis canoccur, so the only thing that will change DO will be the process of respiration by all of the organismspresent.
5. The attenuation of natural light that occurs due to depth in a body of water will be simulated by using plasticwindow screens. Wrap screen layers around the bottles in the following pattern: 100% light — no screens;65% light — 1 screen layer; 25% light — 3 screen layers; 10% light — 5 screen layers; and 2% light — 8screen layers. The bottles will lie on their sides under the lights, so remember to cover the bottoms of thebottles to prevent light from entering there. Use rubber bands or clothespins to keep the screens in place.
6. Place the bottles on their sides under the bank of lights in the classroom. Be sure to turn the bottles so thattheir labels are down and do not prevent the light from getting to the contents. Leave overnight underconstant illumination.
7. (Optional Exercise.) If time permits, make a wet mount slide of a sample of the lake water used for thisexperiment and draw some of the organisms you observe. Can you identify them?

140
Table 12.2: Respiration
Individual Data Class MeanInitial DO
Dark Bottle DORespiration Rate
(Initial-Dark)
Day Two8. Determine the DO in all the bottles that have been under the lights. Record the "Dark" bottle DO in Table
12.2. Calculate the respiration rate using the formula in the table. Record the values for the other bottles inTable 12.3. Complete the calculations in Table 12.4 to determine the gross and net productivity in eachbottle. The calculations will be based on a time period of 1 day. Enter your respiration rate and gross andnet productivities in the data table on the class blackboard. Determine the class means. Enter these meansin Table 12.2 and Table 12.4.
Table 12.3: Individual Data—Productivity of Screen-Wrapped Samples#ofScreens
% Light DO Gross Productivity[Light Bottle - Dark Bottle]
Net Productivity[Light Bottle - Initial Bottle]
0 100%
1 65%
3 25%
5 10%
8 2%
Table 12.4: Class Data—Mean Productivity#ofScreens
% Light DO Gross Productivity Net Productivity
0 100%
1 65%
3 25%
5 10%
8 2%

141
9. Graph both net and gross productivities as a function of light intensity (class means). The two kinds ofproductivity may be plotted on the same graph. For this graph you will need to determine the following:
a. The independent variable: ____________________________Use this to label the horizontal (x) axis.
b. The dependent variable:________Use this to label the vertical (y) axis.
Graph 12.Title:___________________________________________________________________________

142
QUESTIONS1. What are three ways primary productivity can be measured?
2. What is the relationship between oxygen production and assimilation of carbon?
3. From your graph of the temperature data, what is the effect of temperature on the amount of oxygen thatwater at different temperatures can hold?
4. Refer to your graph of productivity and light intensity. At what light intensity do you expect there to be:
No gross productivity?______ No net productivity? ____
5. A mammal uses only 1 to 2 percent of its energy in ventilation (breathing air in and out) while a fish mustspend about 15 percent of its energy to move water over its gills. Explain this huge difference in theirefforts to collect oxygen.
6. Would you expect the DO in water taken from a stream entering a lake to be higher or lower than the DOtaken from the lake itself? Explain.
7. Would you expect the DO concentration of water samples taken from a lake at 7:00 a.m. to be higher orlower than samples taken at 5:00 p.m.? Explain.
8. In the following drawings of identical containers with identical fish but with different volumes o! water, whichone, A or B, would have more oxygen available to the fish. Explain.
9. What is eutrophication? Research and explain why allowing nitrogen or phosphorous fertilizers to run into abody of water can negatively affect life in it.

143
THE AP BIOLOGY EXAM

144
History of Testing the Laboratories on the AP Biology Exam
Year Lab # Lab Name1988 2 Enzyme Catalysis1989 8 Population Genetics and Evolution1990 5 Cell Respiration1991 9 Transpiration1992 1 Diffusion and Osmosis1993 10 Physiology of the Circulatory System1994 2 Enzyme Catalysis (2nd)1995 6 Molecular Biology
(DNA Electrophoresis)1996 3 Mitosis and Meiosis1997 11 Behavior1998 6 Molecular Biology
(Bacterial Transformation)1999 4 Plant Pigments and Photosynthesis2000 2 Enzyme Catalysis (3rd)2001 12 Dissolved Oxygen and Primary
Productivity2002 1 Diffusion and Osmosis (2nd)2003 7 Genetics of Organisms (Drosophila)2004 4 Plant Pigments and Photosynthesis
(2nd)2005 5 Cell Respiration (2nd)

145
Overview of AP Labs for Take Home Exam
Lab 1 (Diffusion and Osmosis)Some potato cores are placed in different molar solutions. Create a graph of the expected change inmass of the cores of the different concentrations.
List the two components affecting the water potential of a system?1.__________________________
2.__________________________
A cell placed into a hypertonic solution will shrink, swell, or stay the same? _________A cell placed into a hypotonic solution will shrink, swell, or stay the same? _________A cell placed into a isotonic solution will shrink, swell, or stay the same? _________
What is plasmolysis? ___________________________________
Lab 2 (Enzyme Catalysis)What do enzymes do? _________________________________________________________What was the substrate in this experiment? ________________________________________What was the purpose of the H2SO4 and how did it work ?_____________________________Is the consumption of substrate linear? Yes or no? __________________________________Generally, raising the temperature causes the reaction rate to increase or decrease? _______Create a Graph of the amount of product formed over time as a result of an enzymatic reaction.
Lab 3 (Mitosis and Meiosis)List the cell cycle and list what happens to the chromosomal material in each.
a. ________________ - __________________________________________________b. ________________ - __________________________________________________c. ________________ - __________________________________________________d. ________________ - __________________________________________________e. ________________ - __________________________________________________

146
In what phase do cells spend most of their time?_____________________________________
What is crossing over ?________________________________________________________Under a microscope it is noticed that about 33% of the asci show crossover, what are the mappingunits? ______________________Draw a pair of chromosomes in MI and MII, and show how you would get a 2:2:2:2 arrangement ofascospores by crossing over.
Lab 4 (Plant Pigments and Photosynthesis)How does chromatography work? _______________________________________________.Using the table below calculate the Rf values for the pigments. (The solvent front moved 100 mm).
Band # Distance (mm) Rf value1 192 353 424 66
Some chloroplasts are collected. One half of them are boiled and the other half are left unboiled. Onehalf of each of these collections are then placed into either dark or light situations. They are allowed toincubate and grow and then place into a spectrophotometer to measure the absorbance. Using thetable below, estimate absorbance numbers that may go into the empty cells.
Cuvette 0 10 20 30Unboiled/dark
Unboiled/light
Boiled/light
Boiled/Dark
No chloroplasts(Control)
Plot the percent transmittance of your projected results.
Lab 5 (Cell Respiration)

147
Estimate the amount of oxygen consumed in the conditions listed in the table.
Conditions mL Oxygen Consumed per MInuteGerminating Peas @ 5 degrees C.
Germinating Peas @ Room TemperatureDry Peas @ 5 degrees C.
Dry Peas @ 5 Room Temperature
What was the purpose of the glass beads? _______________________________________________What happens to the temperature of a gas when the pressure increases (assuming volume remainsconstant)?_________________________________________________________________________What happens to the volume of a gas when the temperature decreases (assuming volume remainsconstant)?_________________________________________________________________________
Lab 6 (Molecular Biology)How does a restriction enzyme work? _______________________________________________.At what location in the cell do endonucleases work?_____________________________________What is a plasmid? ______________________________________________________________How was the plasmid opened in this experiment? ______________________________________Which fragments of DNA migrate further along a gel electrophoresis plate, long or short fragments?
_________________________________________________________________________What happened to each of the colonies below and why?
LB with plasmid? ___________________________________________________________LB without plasmid? _________________________________________________________LB with plasmid and ampicillin? ________________________________________________LB with ampicillin but without plasmid? __________________________________________
Lab 7 (Genetics and Chi Square)What does Chi square measure? _______________________________________________.What are the chances of getting the following from a cross of AaBbCC x AaBBCc genotype ofAaBBCC? _______________
Compete the following table for the following incomplete dominance monohybrid cross:Bb x Bb where BB = black fur; Bb = auburn fur; bb = albino
Observed phenotype Expected Phenotype Chi square30 black40 brown30 albino
At the 0.05 probability level, are the results significantly different from what was expected? ________
Lab 8 (Population Genetics)What are the five assumptions for the Hardy-Weinberg equilibrium?
a. ___________________________________b. ___________________________________c. ___________________________________d. ___________________________________e. ___________________________________

148
What do the following stand for:a. p2 = ___________________________________b. q2 = ___________________________________c. p2+2pq = ___________________________________
Solve the following:a. In a Hardy-Weinberg population, the frequency of the a allele is 0.4. What is the frequencyof the individuals with the Aa genotype? ___________________________________b. In a population with two alleles A and a, the frequency of a is 0.6. What would be thefrequency of heterozygotes if the population is in Hardy-Weinberg equilibrium? ____________c. Why was the heterozygous condition for sickle cell favorable against malaria___________________________________________________________________________
Lab 9 (Transpiration)Using the following conditions, create a graph showing the relationship between the amount oftranspiration and time. Then in the blank write a short explanation of the physiological responsesbecause of the environmental conditions.
a. a plant at room temperature___________________________________b. a plant in humid conditions___________________________________c. a plant in high light conditions___________________________________d. a plant in very dry conditions___________________________________
Lab 10(Physiology)What is systolic pressure?_____________________________________________________________What is diastolic pressure?____________________________________________________________What does it mean to have high blood pressure? __________________________________________Why does your heart rate go up when you exercise?
________________________________________Why does your heart rate go up when you are vertical vs. horizontal?
___________________________What is Q10?
_______________________________________________________________________Calculate the Q10 for the following conditions: heart rate at a lower temperature = 76; heart rate at a
higher temperature = 145________________________________________________________
Create a graph showing the relationship between temperature and heart rate.

149
Lab 12 (Dissolved Oxygen and Primary Productivity)Create a graph showing the relationship between temperature and the percent saturation of dissolved
oxygen.
Create a graph showing the relationship between the amount of light received and the amount ofproductivity.
Create a graph showing the relationship between the amount of oxygen consumed by photosyntheticorganisms and the amount of carbon fixed.
Using the following conditions, create a graph showing the relationship between the amount oftranspiration and time. Then in the blank write a short explanation of the physiological responsesbecause of the environmental conditions.
a. a plant at room temperature___________________________________b. a plant in humid conditions___________________________________c. a plant in high light conditions___________________________________d. a plant in very dry conditions___________________________________

150
Points of Emphasis for AP Biology Experimental Design Essays
1. State a hypothesis. This is usually stated as an expectation of the results based on the effects of theindependent variable.
2. Design and identify a control group for comparison.
3. Indicate the independent variable. How will it be varied?
4. Describe how the dependent variable will be measured quantitatively. If you are going to derive a rate,indicate the time frame of the measurements.
5. If the dependent variable will be measured indirectly, explain how the method works to measure thedependent variable.
6. Indicate at least two factors that will be held constant.
7. Verify your results through multiple trials or repitition of the same procedure (this step is most frequentlyleft out of the essay).
8. Analyze your results statistically – means etc.
9. If a rate is derived, indicate how it is calculated (equation, slope of the curve, etc.)
10. Explain why you are doing the various procedural steps. This is more important than how many milliliters,milligrams of a solution you are using.
11. If expressing expected results from your experiment, it is a good idea to describe expected results acrossthe range of biological activity (0-1000 C, dark to bright light, red to violet light, quiet to loud).

151
Tips For Writing AP Biology Exam Essays(Free Response Questions)
DO’s 1. The first thing that you should do is to carefully read the question. Before writing an answer, the secondthing you should do is read the question, and the third thing you should do is read the question. This willbe a lot easier this year (2004) because there has been a 10 minute reading period included duringwhich you can read the questions and start to plan your answers before you will be allowed to write inthe essay booklet. Be sure that you answer the question that is asked and only that question, and that youanswer all parts of it. If you are given a choice of parts to answer, choose carefully. Don’t answer all parts inthat case. 2. Briefly outline the answer to avoid confusion and disorganization. Pay close attention to the verbs usedin the directions (such as “describe”, “explain”, compare”, “give evidence for”, “graph”, “calculate”, etc.) and besure to follow those directions. Thinking ahead helps to avoid scratch outs, astrices, skipping around, andrambling. 3. Write an essay. Outlines and diagrams, no matter how elaborate and accurate, are not essays and willnot get you much, if any, credit by themselves. Exceptions: If you are asked as a part of an essay on a lab tocalculate a number, this part does not require an essay, but be sure to show how you got your answer byshowing the formulas you are using, the values you have inserted into those formulas and display the properunits on the answer; or, if you are asked to draw a diagram in the answer, do so, but be sure to annotate itcarefully and thoroughly. 4. Define and/or explain the terms you use. Say something about each of the important terms you use. TheAP Exam will not ask for a list of buzzwords. Use high-level vocabulary but use it in context. 5. Answer the question parts in the order called for, and use the question’s labels (“a”, “b”, etc.) to identifythe different parts of your answer just like they are labeled in the question. It is best not to skip around withinthe question. The essays appear on separate green paper and will be reprinted in the essay book for you. Answer the questions right below where they are reprinted in the booklet. There will be several pagesof lined paper allotted for each question, so when you finish writing an answer, keep turning pages until youfind the next question printed in the pink booklet. 6. Write clearly and neatly. It is foolhardy to antagonize or confuse the reader with lousy penmanship. 7. Go into detail that is on the subject and to the point. Be sure to include the obvious. Most points aregiven for the basics anyway (for example, "light is necessary for photosynthesis”). Answer the questionthoroughly. 8. If you cannot remember a word exactly, take a shot at it--get as close as you can. Even if you don'tremember the name for a concept, describe the concept. 9. Use a ball point pen with dark black ink. If your ink “bleeds” through to the other side of the paper, don’twrite on the back of that page--go to the next page. That will make it make it easier for the reader. 10. If you use a diagram, carefully label it (it will get no points otherwise) and place it in the text at theappropriate place--not detached at the end. Be sure to refer to the diagram in your essay. Also, it is ok towiden your margins a little. This will make the essay easier for most folks to read.

152
11. Bring a watch to the exam so that you can pace yourself. You have four essays with about 22 minutesfor each answer. The proctor will not give you time cues. You should have enough time, but keep an eye onthe clock just in case. 12. Understand that this exam is written to be hard. Over the last five years, the national average for theessay section will be less than 15 points out of a possible 40. That is an average of less than 4 points out of apossible 10 on each essay. It is very likely that you will not know everything. This is expected, but you willknow something about each essay. So relax and do the best you can. Write thorough answers. 13. If you are asked to design or describe an experiment, you should consider including these things:
• hypothesis and/or predictions--call attention to it by calling it by name (“my hypothesis is…) or usingan “ if .....then” structure.
· identify the independent variable(s)--what treatments will you apply?· identify dependent variable(s)--what will you measure to see if the independent variable had an effect?· describe how you will measure the dependent variable, AND why it will work in this case· identify several experimental variables to be held constant, and how you will keep them constant.· describe the organism/materials/apparatus to be used--why are each of the parts important?· describe what you will actually do (how will you apply the treatment)
describe how the data will be graphed and analyzed--how will a rate be determined, how will youcompare the experimental and control groups—compare the means, chi square, etc.. Expect to haveto make a prediction of results based on your experimental design.Your experimental design needs to be at least theoretically possible and scientifically plausible and itis very important that your conclusions/predictions be consistent with (1) the principles involved in thequestion, and (2) with the way you set up your experiment. Make sure the experiment is internallyconsistent.
· Do not hesitate to use the experimental designs that we used in our AP labs this year. 14. If you are asked to draw a graph, include these things:
· set up the graph with the independent variable (manipulated variable) along the x-axis anddependent variable (responding variable) along the y-axis.
· mark off axes in equal (proportional) increments and label with proper units· label each axis with the variable name and include the units in which it is measured (Co, min)
plot points and attempt to sketch in the curve (line). Any curve line that extends beyond the givendata points (extrapolation) must be a dashed line. Remember that a data point of 0,0 may beimplied by the given experimental design—but consider carefully before plotting this point.
· if more than one curve is plotted, write a label on each curve (preferred) or make a legend.give your graph an appropriate title. Tell what the graph is showing? You might try wording it in theform of, “Y” as a function of “X." Include a title somewhere even it there is no room for one on thegiven graph paper.
DON'Ts 1. Don't waste time on background information or a long introduction unless the question calls for historicaldevelopment or historical significance. Answer the question.--don’t rewrite it!! 2. Don't ramble--get to the point, and don't shoot the bull--say what you know and go on to the nextquestion. You can always come back if you remember something. 3. Don't use a pencil, and don't use a pen with an ink color other than black. Don't use a felt-tip penbecause the ink seeps through the page and makes both sides of the paper hard to read. Don't scratch outexcessively. One or two lines through the unwanted word(s) should be sufficient, and don't write more than avery few words in the margin.

153
4. Don't panic or get angry because you are unfamiliar with the question. You probably have read or heardsomething about the subject--be calm and think. Write on other questions and come back. If a question hasseveral parts and you have no clue about one or two parts, don’t quit!! Write whatever you know about theother parts of the question. Every single essay point helps your grade. 5. Don't worry about spelling every word perfectly or using exact grammar. These are not a part of thestandards the graders use. It is important for you to know, however, very poor spelling, lousy grammar, andunreadable handwriting can hurt your chances. 6. If you are given a choice of several topics to write about (“describe 3 of the following 5 topics”),understand that only the first ones you mention will count. You must make choices and stick with them. Ifyou decide that one of your first choices was a bad, then cross out that part of the answer so the reader caneasily tell which part(s) you wish for him/her to read for points. 7. Don't leave questions blank. The mean for the Free Response questions last year (2003) was only about11.4 points out of 40 points possible . You can do better than that!!! Remember that each point you earn onan essay question is the equivalent of about 1.6 correct multiple choice questions, and there is no penalty fora wrong guess, bad spelling; or bad grammar. Make an effort on every question!
Don't Quit!

154
Past AP Biology Essay QuestionsBiochemistry 1965:Biologists and biochemists have made outstanding progress within the past quarter century in elucidatingprinciples and structures which govern the activities of living matter.
These areas of progress include: A. The structure and code of the DNA molecule B. The use of radioactive isotopes as tracers in biological processes C. The citric acid cycle and its relationship to mitochondria D. The use of electron microscopy in revealing the structure of the cell
Discuss any one of these developments and its impact on biological thought and progress. Your answershould include: a. a brief account of the development b. the names of the most prominent investigators involved c. the nature of its impact on biology
1968:Suppose that you have isolated an extract from a tissue and you have found that the extract speeds up therate of a particular reaction. What kind of information would you need to demonstrate that the substanceresponsible for increasing the rate of this reaction is an enzyme? Explain how this information would indicatethat the catalytic effect is due to an enzyme.
1969:Proteins functioning as enzymes exhibit precise specifications.
Discuss the levels of structural organization within proteins which are responsible for specific molecularinteraction.
1972:A class of biology students performed an experiment on the digestion of starch by salivary amylase.Each student determined the length of time required for different dilutions of his saliva to digestcompletely a standard concentration of starch. Iodine was used to test for the presence of starch.The results obtained by some of the class are summarized in the table below.
TIME REQUIRED FOR THE DISAPPEARANCE OF STARCH WITH VARIOUS SALIVA DILUTIONSDilutions (saliva: H2O)
Student 1:9 (10%) 1:19 (5%) 1:49 (2%) 1:99 (1%)A 45 seconds 50 seconds 100 seconds 135 secondsB no end point --------------- -------------- --------------C 90 seconds 100 seconds 200 seconds 270 secondsD 260 seconds 300 seconds 600 seconds 800 seconds
a. Present the data for Student A in graphic form.b. Carefully examine the data collected by the four students above and state as many conclusionsas you can that are supported by these data.c. Assuming there have been no errors in techniques, form as many hypotheses as you can explainthe differences observed.d. Design one experiment to test the validity of one hypothesis.e. Clearly state what data you would want to collect in this experiment to test your hypothesis.

155
1973:Hypotheses derived from laboratory experiments and field observations have been advanced to explain theorigin of life on Earth. Starting with a probable prelife environment, describe the formation and evolution ofthe various trophic forms (nutrition types) up to and including unicelluar organisms.
Describe at least one experiment whose results support one of these scientific hypotheses.
1980:Discuss the lock-and-key theory of enzyme-substrate interaction giving a specific example to illustrate thetheory. Include in your discussion the effects of each of the following: a. Substrate concentration b. pH shifts c. Temperature shifts d. Competitive inhibition
1981:Discuss the biological importance of each of the following organi compounds in relation to cellular structureand function in plants and animals. a. Carbohydrates b. Proteins c. Lipids d. Nucleic acids
1985:Describe the chemical compositions and configuration of enzymes and discuss the factors that modifyenzyme structure and/or function.
1988:After an enzyme is mixed with its substrate, the amount of product formed is determined at 10-secondintervals for 1 minute. Data from this experiment are shown below.
Time (sec) 0 19 20 30 40 50 60Productformed(mg)
0.0 0.25 0.50 0.70 0.80 0.85 0.85
Draw a graph of these data and answer the following questions.
a. What is the initial rate of this enzymatic reaction? b. What is the rate after 50 seconds? Why is it different from the initial rate?
c. What would be the effect on product formation if the enzyme were heated to a temperature of 100 oCfor 10 minutes before repeating the experiment? Why?
d. How might altering the substrate concentration affect the rate of the reaction? Why? e. How might altering the pH affect the rate of reaction? Why?
1994:Enzymes are biological catalysts.
a. Relate the chemical structure of an enzyme to its specificity and catalytic activity.b. Design a quantitative experiment to investigate the influence of pH or temperature on the activity ofan enzyme.c. Describe what information concerning the structure of an enzyme could be inferred from yourexperiment.

156
1996:The unique properties (characteristics) of water make life possible on Earth. Select three properties of waterand:
a) for each property, identify and define the property and explain it in terms of the physical/chemicalnature of water.b) for each property, describe one example of how the property affects the functioning of livingorganisms.
2000:The effects of pH and temperature were studied for an enzyme-catalyzed reaction. The following results wereobtained.
a) How do (1) temperature and (2) pH affect the activity of the enzyme? In your answer, include a discussionof the relationship between the structure and the function of this enzyme, as well as a discussion of howstructure and function of enzymes are affected by temperature and pH.b) Describe a controlled experiment that could have produced the data shown for either temperature or pH.Be sure to state the hypothesis that was tested here.
2002:The following experiment was designed to test whether different concentration gradients affect the rate ofdiffusion. In this experiment, four solutions (0% NaCl, 1% NaCl, 5% NaCl and 10% NaCl) were tested underidentical conditions. Fifteen milliliters (mL) of 0% NaCl were put into a bag formed of idalysis tubing that ispermeable to Na+, Cl- and water. The same was done for each NaCl solution. Each bag was submerged in aseparate beaker containing 300 ml of distilled water. The concentration of NaCl in mg/L in the water outsideeach bag was measured at 40 second intervals. The results from the 5% bag are shown in the table below.
CONCENTRATION IN mg/L OF NaCl OUTSIDE THE 5% NaCl BAGTime
(seconds)NaCl
(mg/L)0 040 13080 220
120 320160 400
(a) Graph the data for the 5% NaCl solution.(b) Using the same set of axes, draw and label three additional lines representing the results that youwould predict for the 0% NaCl, 1% NaCl, and 10% NaCl solutions. Explain your predictions.(c) Farmlands located near coastal regions are being threatened by encroaching seawater creepinginto the soil. In terms of water movement into or out of plant cells, explain why seawater coulddecrease crop production. Include a discussion of water potential in y our answer.

157
2003:Water is important for all living organisms. The functions of water are directly related to its physicalproperties.
(a) Describe how the properties of water contribute to TWO of the following: transpiration thermoregulaton in endotherms plasma membrane structure
(b) Water serves as a reactant and a product in the carbon cycle. Discuss the role of water in thecarbon cycle.(c) Discuss on impact of one of human activity on the water cycle.
Cells 1959 Some of the differentiated structures of plant and animal cells are cell walls, plasma membranes, chromosomes, chloroplasts, mitochondria, and spindle fibers. Discuss four of these with respect to: 1) function
2) physico-chemical nature 1960 Discuss each of the following, writing a paragraph or two for each one:
a) the structure and role of the cell membrane b) the formation of cell walls in plant cells c) the structure and role of chloroplasts d) the structure and role of mitochondria
1963 a. Make a schematic diagram of a generalized plant or animal cell, showing the structure of its parts as revealed by electronmicroscopy. Make a diagram the size of a full page and label it completely, indicating whether the cell is from a plant or an animal. b. List the parts included in your diagram and describe briefly the activities or functions thought to be performed by each one.
1964a. Describe the structure of the cell membrane as revealed by electron microscopy and biochemical studies.b. Explain how the passage of substances through the cell membrane is regulated by the physical and chemical properties of the substances involved.c. Explain how the concentration of a solute on either side of a semi-permeable membrane affects osmosis.

158
1965 Biologists and biochemists have made outstanding progress within the past quarter century in elucidating principles and structures which govern the activities of living matter. These areas of progress include:
A. The structure and code of the DNA molecule B. The use of radioactive isotopes as tracers in biological processes C. The citric acid cycle and its relationship to mitochondria D. The use of electron microscopy in revealing the structure of the cell
Discuss any one of these developments and its impact on biological thought and progress.
Your answer should include: a. a brief account of the development b. the names of the most prominent investigators involved c. the nature of its impact on biology
1969 Suppose a team of scientists is examining the cells of a newly discovered species. They observe under the light microscope an organelle that appears to be different from any that has been described before. Assume that you are director of the research team. Describe the methods that you would have the team use to determine whether the struc- ture is a mitochondrion, ribosome, lysosome, nucleolus, or indeed a new organelle. Discuss the advantages and limitations of each method in revealing the role of the unknown organelle in the living cell.
1970: Electronmicroscope studies have revealed the probable structure of plasma membranes and the membranes of various cell components
a. Describe the kinds of observations and experiments that are used to study the basic structure andmolecular components of these membranes.b. Discuss mechanisms by which materials are thought to move across membranes.c. Discuss the significance of membranes in the biochemical events which occur in mitochondria andchloroplasts.
1975 All living cells exploit their environment for energy and for molecular components in order to maintain their internal environments. Describe the roles of several different membrane systems in these activities.
1978 Describe a model of the cell membrane of a eukaryotic cell and discuss different ways in which substances move across the membrane.
1981 Describe the structural arrangement and function of the membranes associated with each of the following eukaryotic organelles: a. Mitochondrion b. Endoplasmic Reticulum c. Chloroplast d. Golgi Apparatus

159
1983 Describe the fluid-mosaic model of a plasma membrane. Discuss the role of the membrane in the movement of materials through by each of the following processes. a. Active Transport b. Passive Transport
1984 Describe the structure of a generalized eukaryotic plant cell. Indicate the ways in which a nonphotosynthetic prokaryotic cell would differ in structure from this generalized eukaryotic plant cell.
1987 Discuss the process of cell division in animals. Include a description of mitosis and cytokinesis, and of the other phases of the cell cycle. Do not include meiosis.
1992 A laboratory assistant prepared solutions of 0.8 M, 0.6 M, 0.4 M, and 0.2 M sucrose, but forgot to label them. After realizing the error, the assistant randomly labeled the flasks containing these four unknown solutions as flask A, flask B, flask C, and flask D.
Design an experiment, based on the principles of diffusion and osmosis, that the assistant could use to determine which of the flasks contains each of the four unknown solutions. Include in your answer (a) a description of how you would set up and perform the experiment; (b) the results you would expect from your experiment; and (c) an explanation of those results based on the principles involved. (Be sure to clearly state the principles addressed in your discussion.)
1993 Membranes are important structural features of cells. (a) Describe how membrane structure is related to the transport of materials across a membrane. (b) Describe the role of membranes in the synthesis of ATP in either cellular respiration or photosynthesis.
1994 Discuss how cellular structures, including the plasma membrane, specialized endoplasmic reticulum, cytoskeletal elements, and mitochondria, function together in the contraction of skeletal muscle cells.
2001 Proteins-large complex molecules-are major building blocks of all living organisms. Discuss the following inrelation to proteins.
a. The chemical composition and levels of structure of proteinsb. The roles of DNA and RNA in protein synthesisc. The roles of proteins in membrane structure and transport of molecules across themembrane

160
2002The following experiment was designed to test whether different concentration gradients affect the rate ofdiffusion. In this experiment , four solutions (0% NaCl, 1% NaCl, 5% NaCl, and 10% NaCl) were tested underidentical conditions. Fifteen milliliters (ml) of 0% NaCl were put into a bag formed of dialysis tubing that ispermeable to Na+, Cl- and water. The same was done for each NaCl solution. Each bag was submerged ina separate beaker containing 300 ml of distilled water. The concentration of NaCl in mg/L in the water outsidethe bag was measured at 40 sec intervals. The results from the 5% bag are shown in the table below.
CONCENTRATION IN mg/L OF NaCl OUTSIDE THE 5% NaCl BAGTime
(seconds)NaClmg/L
0 040 13080 220
120 320160 400
a. On the axes provided, graph the data for the 5% NaCl solution.b. Using the same set of axes, draw and label three additional lines representing the resultsthat you would predict for the 0% NaCl, 1% NaCl, and 10% NaCl . Explain your predictions.c. Farmlands located near coastal regions are being threatened by encroaching seawaterseeping into the soil. In terms of water movement into or out of plant cells, explain whyseawater could decrease crop production. Include a discussion of water potential in youranswer.
2003A difference between eukaryotes and prokaryotes is seen in the organization of their genetic material.
a. Discuss the organization of the genetic material in prokaryotes and eukaryotes.b. Contrast the following activities in prokaryotes and eukaryotes.
• Replication of DNA• Transcription or translation• Gene regulation• Cell division
2004Meiosis reduces chromosome number and rearranges genetic information.
a. Explain how the reduction and rearrangement are accomplished in meiosis.b. Several human disorders occur as a result of defects in the meiotic process. Identify ONE suchchromosomal abnormality: what effects does it have on phenotype of people with the disorder?Describe how this abnormality could result from a defect in meiosis.
c. Production of offspring by parthenogenesis or cloning bypasses the typical meiosis process.Describe either parthenogenesis or cloning and compare the genomes of the offspring with those ofthe parents.
2004Prokaryotes are found throughout the biosphere. Answer two of the following.
a. Provide three examples of adaptations found in various prokaryotes. Explain how these threeadaptations have ensured the success of prokaryotes.b. Discuss how prokaryotes early in Earth’s history altered environments on Earth.c. Discuss three ways in which prokaryotes continue to have ecological impact today.

161
CELLULAR ENERGETICS1962 Discuss two experiments in which the use of isotopes as tracers has contributed to present knowledge of the photosynthetic process. One experiment should deal with the light phase and the other with the dark phase.
1963 Compare the intermediate steps in the fermentation of a molecule of sugar by yeast with respiration in a muscle tissue cell. Include in your answer the role of ATP formed in each of these two processes.
1965 Discuss the effect of each of the following factors on the rate of photosynthesis in a living plant: a. carbon dioxide b. light intensity c. temperature d. mineral nutrition e. water conservation 1967When a cell is metabolizing in the absence of oxygen and it is then exposed to an environment containingoxygen, a series of oxidation-reduction reactions is initiated which enables the cell to increase its activities.
a. Outline the oxidation-reduction reactions that are initiated under these conditions and indicate thepoint at which molecular oxygen interacts with the oxidative system.b. Explain how the cell derives additional energy by switching from non-oxidative to oxidativemetabolism.
1971The process of photosynthesis consists of two phases, the light reactions and the dark reactions.Discuss each of these groups of reactions and their interrelationships.
1974The overall equation for aerobic respiration is usually written as the reverse of the overall equation forphotosynthesis. What features of the biochemical pathways involved in the processes are the reverse of oneanother and what features are not?
1977Explain how the molecular reactions of cellular respiration transform the chemical bond energy of Krebs cyclesubstrates into the more readily available bond energy of ATP. Include in your discussion the structure of themitochondrion and show how it is important to the reactions of the Krebs cycle and the electron transportchain.
1978Explain how the molecular reactions of photosynthesis transform light energy into chemical bond energy.Include in your discussion the relationship between chloroplast structure and light and dark reactions.
1979In relation to plants, describe in detail one way of: a. measuring the rate of transpiration b. measuring the rate of photosynthesis c. separating pigments

162
1982Describe the similarities and differences between the biochemical pathways of aerobic respiration andphotosynthesis in eukaryotic cells. Include in your discussion the major reactions, the end products, andenergy transfers.
1983 Relate the structure of an angiosperm leaf to each of the following. a. Adaptations for photosynthesis and food storage. b. Adaptations for food translocation and water transport. c. Specialized adaptations to a desert environment.
1986Describe the light reactions of photosynthesis and, for both a C3 and a C4 plant, trace the path of a carbondioxide molecule from the point at which it enters a plant to its incorporation into a glucose molecule. Includeleaf anatomy and biochemical pathways in your discussion of each type of plant.
1989Explain what occurs during the Krebs (citric acid) cycle and electron transport by describing the following: a. The location of the Krebs cycle and electron transport chain in the mitochondria. b. The cyclic nature of the reactions in the Krebs cycle. c. The production of ATP and reduced coenzymes during the cycle. d. The chemiosmotic production of ATP during electron transport.
1990The results below are measurements of cumulative oxygen consumption by germinating and dry seeds. Gasvolume measurements were corrected for changes in temperature and pressure.
Cumulative Oxygen Consumed (mL)Time (minutes) 0 10 20 30 4022o CGerminating Seeds
0.0 8.8 16.0 23.7 32.0
22o CDry Seeds
0.0 0.2 0.1 0.0 0.1
10 o C GerminatingSeeds
0.0 2.9 6.2 9.4 12.5
10 o CDry Seeds
0.0 0.0 0.2 0.1 0.2
a. Using graph paper, plot the results for the germinating seeds at 22 o C and 0 o C.b. Calculate the rate of oxygen consumption for the germinating seeds at 22 o C, using the timeinterval between 10 and 20 minutes.c. Account for the differences in oxygen consumption observed between:
1) germinating seeds at 22 o C and at 10 o C; 2) germinating seeds and dry seeds.
d. Describe the essential features of an experimental apparatus that could be used to measureoxygen consumption by a small organism. Explain why each of these features is necessary.
1993 Membranes are important structural features of cells.
(a) Describe how membrane structure is related to the transport of materials across a membrane.(b) Describe the role of membranes in the synthesis of ATP in either cellular respiration or
photosynthesis.

163
1995Energy transfer occurs in all cellular activities. For 3 of the following 5 processes involving energy transfer,explain how each functions in the cell and give an example. Explain how ATP is involved in each example youchoose. Cellular movement Active transport Synthesis of molecules Chemiosmosis Fermentation
1999The rate of photosynthesis may vary with changes that occur in environmental temperature, wavelength oflight, and light intensity. Using a photosynthetic organism or your choice, choose only ONE of the threevariables (temperature, wavelength of light or light intensity) and for this variable
• design a scientific experiment to determine the effect of the variable on the rate of photosynthesis forthe organism;
• explain how you would measure the rate of photosynthesis in your experiment;• describe the results you would expect. Explain why you would expect these results.
2004A controlled experiment was conducted to analyze the effects if darkness and boiling on the photosyntheticrate of incubated chloroplast suspensions. The dye reduction technique was used. Each chloroplastsuspension was mixed with DPIP, an electron acceptor that changes from blue to clear when it is reduced.Each sample was placed individually in a spectrophotometer and the percent transmittance was recorded.The three samples used were prepared as follows.
• Sample 1 – chloroplast suspension + DPIP• Sample 2 – chloroplast suspension surrounded by aluminum foil wrap to provided a dark environment
+ DPIP• Sample 3 – chloroplast suspension that has been boiled + DPIP
Percent Transmittance in Three SamplesTim
(min)Light, Unboiled
% Transmittance
Sample 1
Dark, Unboiled% Transmittance
Sample 2
Light, Boiled% Transmittance
Sample 30 28.8 29.2 28.85 48.7 30.1 29.210 57.8 31.2 29.415 62.5 32.4 28.720 66.7 31.8 28.5
(a) On the axes provided, construct and label a graph showing the results for the three samples.(b) Identify and explain the control or controls for this experiment.
(c) The differences in the curves of the graphed data indicate that there were differences in thenumber of electrons produced in the three samples during the experiment. Discuss howelectrons are generated in photosynthesis and why the three samples gave differenttransmittance results.

164
2005:Yeast cells are placed in an apparatus with a solution of sugar (a major nutrient for yeast metabolism). Theapparatus detects bubbles of gas released by the yeast cells. The rate of respiration varies with thesurrounding temperatures as indicated by the data below.
Temperature (oC) 0 10 20 30 40 50 60 70Number of bubblesproduced per minute
0 3 7 12 7 4 1 0
a. Graph the results on the axes provided. Determine the optimum temperature for respiration inyeast.b. Respiration is a series of enzyme-catalyzed reactions. Using your knowledge of enzymes and thedata above, analyze and explain the results of this experiment.c. Design an experiment to test the effect of varying the pH of the sugar solution on the rate ofrespiration. Include a prediction of the expected results.
HEREDITY 1961A major concept of the gene theory of inheritance is that the genes are located in chromosomes. Explain howeach of the following helps to establish this idea: a. A genotypic ratio of 1:2:1 in offspring of heterozygotes. b. The phenomenon of crossing over. c. Other chromosomal aberrations. d. The phenomenon of sex determination, as in man.

165
1963a) In corn, a gene for colored (C) kernels is dominant over one for colorless (c) kernels and a gene forsmooth (S) kernels is dominant over one for shrunken (s) kernels. Describe a controlled geneticexperiment to demonstrate that those genes are linked.b) Genetic evidence indicates that these genes are linked and that their cross value is approximately4%. Describe the process of crossing over and explain how its percentage is determined. (Labeleddiagrams may be used as aids in explanation.)
1966The gene was first thought to be a discrete factor or particle that controls a gross character of an organismspecific relationships between genes, enzymes, and proteins, this concept has changed radically. Cite threespecific experiments that illustrate these changes and explain our present concept of the gene.
1967 a) Describe in a brief paragraph the characteristics of mutation.
b) List the various alterations in the hereditary material that result in mutations. Illustrate with a simplediagram.
c) Discuss the ways in which one of the alterations that you list in part b) causes hereditary changes.
1970In most organisms, there are characteristic sets of chromosomes within cell nuclei. Describe ways in whichthe kinds or numbers of chromosomes in the following cells differ from the usual situation and discuss thepossible significance of these differences:
a) children whose cells have an extra autosome b) cells from different members of a hive of honeybees c) red blood cells in mammals d) salivary gland cells in Drosophila e) cells in tetraploid strains of wheat f) gametes in humans containing extra sex chromosomes
1972Several kinds of organisms have been important in genetics research. How have studies of microorganisms,peas, Drosophila , and man each made a different contribution to our knowledge of genetics?
1976Each year a number of children are born with biological defects that impair normal function. For THREE of thefollowing conditions, discuss such aspects as the biological cause, the methods of treatment and possiblemeans of detection and/or prevention. a. Phenylketonuria (PKU) b. Sickle cell anemia c. Down syndrome d. Cretinism e. Erythroblastosis fetalis f. Blue-baby condition g. Tay-Sachs

166
1977Discuss three of the following phenomena in which sex chromosomes are involved with particular reference totheir significance or consequences in humans. a. Sex determination b. Sex-linked inheritance c. Formation of Barr bodies (sex chromatin) d. Variation in kinds and numbers of sex chromosomes
1980Describe in detail the process of meiosis as it occurs in an organism with a diploid chromosome number of 4(2n = 4). Include labeled diagrams in your discussion. Indicate when and how each of the following occurs inmeiosis: a. Crossing over b. Nondisjunction
1983State the conclusions reached by Mendel in his work on the inheritance of characteristics. Explain how eachof the following deviates from these conclusions: a. Autosomal linkage b. Sex-linked (X-linked) inheritance c. Polygenic (multiple-gene) inheritance
1988Discuss Mendel's laws of segregation and independent assortment. Explain how the events of meiosis Iaccount for the observations that led Mendel to formulate these laws.
1993Assume that a particular genetic condition in a mammalian species causes an inability to digest starch. thisdisorder occurs with equal frequency in males and females. In most cases, neither parent of affected offspringhas the condition. (a) Describe the most probable pattern of inheritance for this condition. Explain your reasoning. Include in your discussion a sample cross(es) sufficient to verify your proposed pattern. (b) Explain how mutation could cause this inability to digest starch. (c) Describe how modern techniques of molecular biology could be used to determine whether the mutant allele is present in a given individual.
1996 An organism is heterozygous at two genetic loci on different chromosomes.
a) Explain how these alleles are transmitted by the process of mitosis to daughter cells. b) Explain how these alleles are distributed by the process of meiosis to gametes.
c) Explain how the behavior of these two pairs of homologous chromosomes during meiosis providesthe physical basis for Mendel's two laws of inheritance. Labeled diagrams that are explained in youranswer may be useful.

167
1997In a laboratory population of diploid, sexually reproducing organisms a certain trait is studied. This trait isdetermined by a single autosomal gene and is expressed as two phenotypes. A new population was createdby crossing 51 pure-breeding (homozygous) dominant individuals with 49 percent pure breeding(homozygous) recessive individuals. After four generations, the following results were obtained.
NUMBER OF INDIVIDUALSGeneration Dominant Recessive Total
1 51 49 1002 280 0 2803 240 80 3204 300 100 4005 360 120 480
a. Identify an organism that might have been used to perform this experiment, and explain why thisorganism is a good choice for conducting this experiment.b. On the basis of the data, propose a hypothesis that explains the change in the phenotypicfrequency between generation 1 and generation 3.c. Is there evidence indicating whether or not this population is in Hardy-Weinberg equilibrium?Explain.
2003In fruit flies, the phenotype for eye color is determined by a certain locus. E indicates the dominant allele ande indicates the recessive allele. The cross between a male wild-type fruit fly and a female white-eyed fruit flyproduced the following offspring.
Wild TypeMale
Wild TypeFemale
White EyedMale
White EyedFemale
Brown EyedFemale
F1 0 45 55 0 1
The wild-type and white-eyed individuals from the F1 generation were then crossed to produce the followingoffspring.
F2 23 31 22 24 0
a. Determine the genotypes of the original parents (the P generation) and explain you reasoning.You may use a Punnett square to enhance your description, but the results from the Punnett squaresmust be discussed in your answer.b. Use a Chi-squared test on the F2 generation data to analyze your prediction of the parentalgenotypes. Show all your work and explain the importance of your final answer.c. The brown-eyed female in the F1 generation resulted from a mutational change. Explain what amutation is, and discuss two types of mutations that might have produced the brown-eyed female inthe F1 generation.
Critical Values of the Chi-Squared DistributionDegrees of Freedom (df)
Probability (p) 1 2 3 4 50.05 3.84 5.99 7.82 9.49 11.1
The formula for Chi-squared is:Χ = ∑(o – e)2
ewhere: o – observed number of individuals
e = expected number of individuals ∑ = the sum of the values (in this case, the differences, squared, divided b uy the numberexpected.

168
2004:Meiosis reduces chromosome number and rearranges genetic information.
a. Explain how the reduction and rearranges genetic information.b. Several human disorders occur as a result in the meiotic process. Identify one such chromosomalabnormality; what effects does it have on the phenotype of people with the disorder? Describe howthis abnormality could result from a defect in meiosis.c. Production of offspring by parthenogenesis or cloning by passes the typical meiotic process.Describe either parthenogenesis or cloning and compare the genomes of the offspring with those ofthe parents.
MOLECULAR BIOLOGY1960Discuss the gene, with regard to structure, duplication, mutation, and nature of action.
1962Deoxyribonucleic acid or DNA has been described as the chemical basis of heredity. Discuss present-dayconcepts regarding its: a. chemical nature and physical structure b. mode of duplication c. relationship to protein synthesis
1965Biologists and biochemists have made outstanding progress within the past quarter century in elucidatingprinciples and structures which govern the activities of living matter. These areas of progress include thestructure and code of the DNA molecule. Discuss this development and its impact on biological thought andprogress. Your answer should include: a. a brief account of the development b. the names of the most prominent investigators involved c. the nature of its impact on biology
1965Discuss the role of each of the following in protein synthesis: a. soluble or transfer RNA b. messenger RNA c. ribosomes d. ATP
1967The formation of Watson-Crick complementary base pairs between single strands of molecules of nucleicacids occurs in at least three separate reactions. Discuss each of these reactions from the following points ofview: a. the type of nucleic acids involved b. the role of each nucleic acid in the duplication of cellular constituents
1969Proteins and nucleic acids are fundamental molecules of the living state. a. Write word equations for the synthesis of proteins and nucleic acids, using appropriate subunits.
b. A wide variety of macromolecules exists in proteins and nucleic acids. For each group, explainhow it is possible to have such great variety of structure with a relatively small number of differentsubunits.c. Proteins functioning as enzymes exhibit precise specifications. Discuss the levels of structuralorganization within proteins which are responsible for specific molecular interaction.

169
1974Describe protein synthesis in terms of molecular structures of the nucleic acids and using a specific example,explain how a new phenotypic characteristic may result from a change in DNA.
1977Proteins are composed of amino acid subunits which form stable three-dimensional structures.
a. Describe how the genetic instructions coded in DNA are translated into the primary structure(sequence of amino acid subunits) of a protein molecule.b. Explain how interactions among the individual amino acid subunits influence the transformation ofthe molecule into its three-dimensional structure and how they stabilize it.
1979In relation to the chemical nature of the gene, describe: a. the chemical structure of the gene b. the replication (self-copying) of the gene c. gene mutations, including chromosomal aberrations
1982A portion of a specific DNA molecule consists of the following sequence of nucleotide triplets:
TAC GAA CTT CGG TCC
This DNA sequence codes for the following short polypeptide: methionine - leucine - glutamic acid - proline - arginine
Describe the steps in the synthesis of this polypeptide. What would be the effect of a deletion or an addition inone of the DNA nucleotides? What would be the effect of a substitution in one of the nucleotides?
1984 Experiments by the following scientists provided critical information concerning DNA. Describe each classical experiment and indicate how it provided evidence for the chemical nature of the gene. a. Hershey and Chase - bacteriophage replication b. Griffith and Avery - bacterial transformation c. Meselson and Stahl - DNA replication in bacteria
1985Describe the operon hypothesis and discuss how it explains the control of messenger RNA production andthe regulation of protein synthesis in bacterial cells.
1986Describe the biochemical composition, structure, and replication of DNA. Discuss how recombinant DNAtechniques may be used to correct a point mutation.
1987Describe the production and processing of a protein that will be exported from a eukaryotic cell. Begin with theseparation of the messenger RNA from the DNA template and end with the release of the protein at theplasma membrane.
1990Describe the steps of protein synthesis, beginning with the attachments of a messenger RNA molecule tothe small subunit of a ribosome and ending with the release of the polypeptide from the ribosome. Include inyour answer a discussion of how the different types of RNA function in this process.

170
1992Biological recognition is important in many processes at the molecular, cellular,and organismal levels. Selectthree of the following, and for each of the three that you have chosen, explain how the process of recognitionoccurs and give an example. a. Organisms recognize others as members of their own species. b. Neurotransmitters are recognized in the synapse. c. Antigens trigger antibody responses. d. Nucleic acids are complementary. e. Target cells respond to specific hormones.
1995The diagram below shows a segment of DNA with a total length of 4,900 base pairs. The arrows indicatereaction sites for restriction enzymes (enzyme X and enzyme Y).
(A) Explain how the principles of gel electrophoresis allow for the separation of DNA fragments. (B) Describe the results you would expect from the electrophoretic separation of fragments from thefollowing treatments of the DNA segment above. Assume that the digestions occurred underappropriate conditions and went to completion.
I DNA digested with only enzyme X II. DNA digested with only enzyme Y III. DNA digested with enzyme X and enzyme Y combined IV. Undigested DNA (C) Explain both of the following.
(1) The mechanism of action of restriction enzymes.(2) The different results you would expect if a mutation occurred at the recognition site forenzyme Y.
1998By using techniques of genetic engineering, scientists are able to modify genetic materials so that a particulargene of interest from one cell can be incorporated into a different cell.
• Describe a procedure by which this can be done.• Explain the purpose of each step of your procedure.• Describe how you could determine whether the gene was successfully incorporated.• Describe an example of how gene transfer and incorporation have been used in a biomedical or
commercial application.
1999Scientists seeking to determine which molecule is responsible for the transmission of characteristics from onegeneration to the next knew that the molecule must (1) copy itself precisely, (2) be stable but able to bechanged and (3) be complex enough to determine the organism’s phenotype.
• Explain how DNA meets each of the three criteria stated above.• Select one of the criteria stated above and describe experimental evidence used to determine that
DNA is the hereditary material.

171
2002The human genome illustrates both continuity and change:
(a) Describe the essential features of two of the procedures/techniques below. For each of theprocedures/techniques you describe, explain how its application contributes to understanding genetics.• The use of bacterial plasmid to clone and sequence a human gene• Polymerase chain reaction (PCR)• Restriction fragment length polymorphism (RFLP) analysis(b) All humans are nearly identical genetically in coding sequences and have many proteins that appearidentical in structure and function. Nevertheless, each human has a unique DNA fingerprint. Explain thisapparent contradiction.
2005:The unit of genetic organization is all living organisms is the chromosome.
a. Describe the structure and function of the parts of a eukaryotic chromosome. You may wish toinclude a diagram as part of your description.b. Describe the adaptive (evolutionary) significance of organizing genes into chromosomes.c. How does the function and structure of the chromosome differ in prokaryotes.
EVOLUTION1959Discuss how each of the following contributes evidence that evolution has occurred: a. Paleontology b. Geographical distribution c. Biochemical studies
1959Each group of organisms has a specific set of adaptations (either in the parent animals or in the eggs theyproduce) which helps to insure the survival of sufficient young to maintain the population. Briefly summarizeand compare the structures or other adaptations bearing on this problem as found in an amphibian, a reptile,a marsupial, and a placental mammal. What generalizations can be made from these comparisons?
1960 Although the arthropods began as aquatic animals, the majority have become terrestrial. Discuss the adaptive modifications in the arthropods for terrestrial existence with reference to locomotion, reproduction, and development, respiration, and water balance.
1960 The factors of mutation and isolation are believed to play significant roles in speciation. For each of these factors discuss: a. how it may occur b. the role it plays in speciation
1963 Discuss the evolution of both land animals and land plants from aquatic ancestors with respect to their adaptations for: a. water conservation b. support c. embryo protection

172
1964On the archipelago of the Galapagos Islands, which most geologists believe to be of volcanic origin withoutever having had any land connection with the west coast of South America, Darwin discovered a group ofsmall finches. These birds have since been classified into more than a dozen species. These birds havedifferences, particularly in their adaptations for food-getting. It is believed that all these species aredescendants of a single species which migrated from the mainland. On the mainland there has never beenmore than a single species even though the rate of mutations is thought to be the same in both locations.
Explain how each of the following could have played a role in the development of the many species ofGalapagos finches: a. polyploidy b. genetic drift c. geographic isolation d. unoccupied ecologic niches e. Explain why the mainland species has not differentiated into more than one species.
1966In the vertebrates, changes in mechanisms of fertilization and embryonic development have been of adaptivevalue. Compare these mechanisms and indicate their contribution to the evolutionary success of the followinganimals: a. fish b. amphibian c. bird d. mammal
1966The theory of organic evolution is based on interpretations of observations from diverseareas. Describe theobservations from each of the following areas and explain how they support the theory: a. paleontology b. comparative anatomy or embryology c. biochemistry or genetics
1970An interbreeding population sometimes gives rise to two populations. Discuss the possible roles of each of thefollowing factors in the formation of two distinct species. a. isolation b. selection c. mutation d. genetic drift (Sewall Wright phenomenon)
1972Cite evidence from biochemistry, paleontology, and population genetics that has led biologists to accept thetheory of evolution.
1973On the basis of reliable sampling studies made during a 5-year period, the following observations were madeabout the turtle populations of two lakes, one 300 miles north of the other. Indicate and discuss factors thatmight account for this unequal distribution. a. Turtles of species A are abundant in the northern lake where turtles of species B are rare. b. Turtles of species B are abundant in the southern lake where turtles of species A are rare.

173
1974Hereditary variations are essential to the evolution of populations. a. Describe the different types of hereditary variability b. Explain how this variability can lead to the origin and maintenance of species.
1975Most mammals live on land. Describe and discuss the evolutionary adaptations that make mammals betteradapted to life on land than amphibians.
1977Two geographically isolated populations usually will diverge over a long period of time. a. Describe how the two populations may become different, including factors that can account for these differences. b. Discuss factors that may prevent interbreeding if the two populations ever again occupy the same area.
1978 Describe the nature of each of the following and discuss the role of natural selection in each situation: a. Industrial melanism b. DDT resistance in insects c. Sickle cell anemia and malaria
1979Charles Darwin's theory of natural selection had a significant influence on the understanding of the evolutionof organism. Discuss each of the following: a. the importance of Darwin's voyage on the H.M.S. Beagle to the development of his theory; b. the major points proposed by Darwin in his theory; c. two major refinements in Darwin's theory that stem from modern findings;
1980Discuss the significance of each of the events listed below in the evolution of living things. a. Primordial reducing atmosphere b. Origin of photosynthesis c. Increase in atmospheric oxygen and the development of the ozone layer d. Origin of eukaryotes
1981Define, discuss, and give an example of how each of the following isolating mechanisms contributes tospeciation in organisms. a. Geographical barriers b. Ecological (including seasonal) isolation c. Behavioral isolation d. Polyploidy
1981Describe the special relationship between the two terms in each of the following pairs. a. Convergent evolution of organisms and Australia b. Blood groups and genetic drift c. Birds of prey and DDT
174
1984Describe the modern theory of evolution and discuss how it is supported by evidence from two of the followingthree areas: a. Population genetics b. Molecular biology c. Comparative anatomy and embryology
1984Describe how the following adaptations have increased the evolutionary success of the organisms thatpossess them. Include in your discussion the structure and function related to each adaptation. a. C4 metabolism b. Amniotic egg c. Four-chambered heart d. Pollen
1986Describe the process of speciation. Include in your discussion the factors that may contribute to themaintenance of genetic isolation.
1989Do the following with reference to the Hardy-Weinberg model.
a. Indicate the conditions under which allele frequencies (p and Q) remain constant from onegeneration to the next.b. Calculate, showing all work, the frequencies of the alleles and frequencies of the genotypes in apopulation of 100,000 rabbits of which 25,000 are white and 75,000 are agouti. (In rabbits the whitecolor is due to a recessive allele, w, and agouti is due to a dominant allele, W.)c. If the homozygous dominant condition were to become lethal, what would happen to the allelic andgenotypic frequencies in the rabbit population after two generations?
1990A. Describe the differences between the terms in each of the following pairs. (1) Coelomate versus acoelomate body plan (2) Protostome versus deuterostome development (3) Radial versus bilateral symmetryB. Explain how each of these pairs of features was important in constructing the phylogenetic tree shownbelow. Use specific examples from the tree in your discussion. Chordata
Arthropoda Annelida
Echinodermata Mollusca
Nematoda
Rotifera
Platyhelminthes
Cnidaria

175
Porifera
1991Discuss how each of the following has contributed to the evolutionary success of the organisms in which theyare found. a. Seeds b. Mammalian placenta
c. Diploidy
1992Evolution is one of the unifying concepts of modern biology. Explain the mechanisms thatlead to evolutionary change. Describe how scientists use each of the following as evidence for evolution: 1) Bacterial resistance to antibiotics 2) Comparative biochemistry 3) The fossil record
1994Genetic variation is the raw material for evolution. a. Explain three cellular and/or molecular mechanisms that introduce variation into the gene pool of a plant or animal population. b. Explain the evolutionary mechanisms that can change the composition of the gene pool.
1994Select two of the following three pairs and discuss the evolutionary relationships between the two members ofeach pair you have chosen. In your discussion include structural adaptations and their functional significance.
PAIR A: green algae vascular plants
PAIR B: prokaryotes eukaryotes
PAIR C: amphibians reptiles
1995 The problems of survival of animals on land are very different from those of survival of animals in an aquatic environment. Describe four problems associated with animal survival in terrestrial environments but not in aquatic environments. For each problem, explain an evolutionary solution.
176
1999Scientists recently have proposed a reorganization of the phylogenetic system of classification to include thenew domain, a new taxonomic category higher (more inclusive) than the Kingdom category, as shown in thefollowing diagram.
Universal Ancestor
Domain Bacteria Domain Archaea Domain Eukarya(Eubacteria) (Archaebacteria) (Eukaryotes)
• Describe how this classification scheme presents different conclusions about the relationships amongliving organisms that those presented by the previous five-kingdom system of classification.
• Describe three kinds of evidence that were used to develop the taxonomic scheme above, and explainhow this evidence was used. The evidence may be structural, physiological, molecular and/or genetic.
• Describe four of the characteristics of the universal ancestor.
2000To survive. organisms must be capable of avoiding, annd/or defending against, various types ofenvironmental threats. Respond to each of the following.
a. Describe how protective coloration, mimicry or behavior function as animal defensesagainst predation. Include two examples in your answer.
b. Describe how bacteria or plants protect themselves against environmental threats. Include twoexamples in your answer.c. Compare the humane primary immune response with the secondary immune response to the sameantigen.
2001Charles Darwin proposed that evolution by natural selection was the basis for the differences that he saw insimilar organisms as he traveled and collected specimens in South America and the Galapagos Islands.
a. Explain the theory of evolution by natural selection as presented by Darwin.b. Each of the following relates to an aspect of evolution by natural selection. Explain three of thefollowing.
(i) Convergent evolution and the similarity among species (ecological equivalents) in aparticular biome (e.g., tundra, taiga, etc.)(ii) Natural selection and the formation of insecticide-resistant insects or antibiotic-resistantbacteria.(iii) Speciation and isolation(iv) Natural selection and behavior such as kinesis, fixed-action-pattern, dominance hierarchy,etc.(v) Natural selection and heterozygote advantage

177
2003Biologists are interested in preserving the diversity of living organisms on the planet.
(a) Explain three of the following processes or phenomena, using an appropriate example for each. mutation adaptive radiation polyploidy population bottlenecks growth of the human population
(b) For each process or phenomenon you selected in (a), discuss its impact on the diversity of life onEarth.
2004Darwin is considered the “father of evolutionary biology”. Four of his contributions to the field of evolutionarybiology are listed below:
• the nonconstancy of species• branching evolution, which implies the common descent of all species• occurrence of gradual changes in species• natural selection as the mechanism for evolution
a. For each of the four contributions listed above, discuss one example of supporting evidence.b, Darwin’s ideas have been enhanced and modified as new knowledge and technologies have
become available. Discuss how TWO of the following have modified biologists interpretation of Darwin’soriginal contributions.
• Hardy-Weinberg equilibrium• Punctuated equilibrium• Genetic engineering
Ecology1959:Starting with an open pond of water or with a bare sand beach, discuss the natural succession from a pioneercommunity to a climax community with respect to: 1) physiographic factors 2) biotic factors 3) the order of some of the successional stages which might be expected to occur
1961:Describe the complete cyclic movement of nitrogen within a balanced biotic community.
1963:From an ecological standpoint, discuss briefly the interaction of organisms in: a) the carbon-oxygen cycle b) a specific food chain
1966:The retreat of a glacier leaves barren rock and soil that may be low or lacking in organic material.Characterize the changes that might occur over a long period of time following the retreat of the glacier. Youranswer shouldinclude: a) physical and chemical changes b) changes in flora c) changes in fauna

178
1966:A small, upland, temperate-zone lake of 100 acres surface area and a maximum depth of 10 meters at themiddle is created behind an earthfill dam. High land surrounding the lake is covered with deciduous forest.Springs and a permanent stream flowing into the lake from a pasture grassland provide a constant supply ofwater. For the next five years, the lake and stream remain undisturbed. At the end of the five-year period: a) what organism could be expected in samples taken from the middle of the lake? b) what organisms could be collected from shallow water at the end of the stream entrance? c) how, during the five-year period, did the organisms come to the lake, and why did they thrive there?
1971:A mature forest community is completely destroyed by fire. Describe the stages of succession by which thiscommunity is restored.
1972:A very long-term trip into deep space, lasting at least a decade, is being planned. You have been assignedthe responsibility of designing a balanced ecosystem that will meet the needs of you and several others in thespaceship . Cite the specific types of organisms that you would take and include the role that each would playin the ecosystem. (Assume that the problem of temperature control in the spaceship has been solved.)
1976:Discuss the web of life in a biological community. Your essay should focus on energy flow, conversion, andloss in food chains, including the concepts of trophic levels and pyramids.
1978:Human beings have altered the environment in a variety of ways. Discuss the beneficial and harmfulmodifications of the environment brought about by the use of the following: a) Nuclear energy b) Fertilizers and pesticides c) Fossil fuels and metals
1979:Explain and illustrate with one specific example each of the following concepts: a) competitive exclusion (Gause's principle) b) ecological succession c) nutrient (biogeochemical) cycles
1980:Many areas of North America that were once covered with many small lakes and ponds have undergonesuccession and are now continuously covered with forests. Give a detailed description of the events (bioticand abiotic factors) that lead to the establishment of a climax forest.
1981:Define, discuss, and give an example of each of the following close interactions of species. a) Predator-prey relationships b) Commensalism c) Mutualism
1983:Describe the trophic levels in a typical ecosystem. Discuss the flow of energy through the ecosystem, therelationship between the different trophic levels, and the factors that limit the number of trophic levels.

179
1985:Describe the process of ecological succession from a pioneer community to a climax community. Include inyour answer a discussion of species diversity and interactions, accumulation of biomass, and energy flow.
1986:Describe the biogeochemical cycles of carbon and nitrogen. Trace these elements from the point of theirrelease from a decaying animal to their incorporation into a living animal.
1989:Using an example for each, discuss the following ecological concepts. a) Succession b) Energy flow between trophic levels c) Limiting factors d) Carrying capacity
1993:Living organisms play an important role in the recycling of many elements within an ecosystem. Discuss howvarious types of organisms and their biochemical reactions contribute to the recycling of either carbon ornitrogen in an ecosystem. Include in your answer one way in which human activity has an impact on thenutrient cycle you have chosen.
1998:Interdependence in nature is illustrated by the transfer of energy through trophic levels. The diagram belowdepicts the transfer of energy in a food web of an Artic lake located in Alaska.
a. Choosing organisms from four different trophic levels of this food web as examples, explain howenergy is obtained at each trophic level.b. Describe the efficiency of energy transfer between trophic levels and discuss how the amount foenergy available at each trophic level affects the structure of the ecosystem.c. If in the cells in the dead terrestrial plant material that washed into the lake contained acommercially produced toxin, what would be the likely effects of this toxin on this food web? Explain.

180
2001:A biologist measured dissolved oxygen in the top 30 centimeters of a moderately eutrophic (mesotrophic) lakein the temperate zone. The day was bright and sunny, and the wind was calm. The results of theobservations are represented below.
Hour DissolvedOxygen
mg/L6.00 A.M. 0,98:00 A.M. 1.7
10:00 A.M. 3.112:00 A.M. 4.92:00 P.M. 6.84:00 P.M. 8.16:00 P.M. 7.98:00 P.M. 6.2
10.00 P.M. 4.012:00 midnight 2.4
a. Using graph paper, plot the results that were obtained. Then, using the same set of axes, drawand label an additional line/curve representing the results that you would predict had the day beenheavily overcast.b. Explain the biological processes that are operating in the lake to produce the observed data.Explain also how these processes would account for your predictions of results for a heavily overcastday.c. Describe how the introduction of high levels of nutrients such as nitrates and phosphates into thelake would affect subsequent observations. Explain your prediction.
2003:Many populations exhibit the following growth curve:
a. Describe what is occurring in the population during phase A.b. Discuss three factors that ought cause the fluctuations shown in phase B.c. Organisms demonstrate exponential (r0 or logistic (K) reproductive strategies. Explain these twostrategies and discuss how they affect population size over time.
2004:Death is a natural and necessary part of life cycles at all levels of organization.
a. Discuss two examples of how cell death affects the development and functioning of a multicellularorganism.b. Discuss one example of how substances are degraded and reused in cells.c. Discuss the evolutionary significance of death.

181
2004:In most aquatic environments, primary production is affected by the light available to the community oforganisms.
Using measurement of dissolved oxygen concentration to determine primary productivity, design a controlledexperiment to test the hypothesis that primary productivity is affected by either the intensity or the wavelengthof light. In your answer be sure to include the following:
• a statement of the specific hypothesis that you are testing• a description of your experimental design (Be sure to include a description of what data you would
collect and how you would present and analyze the data using a graph.)• a description of results that would support your hypothesis.
Embryology1961:
A. Name and describe the origin, function, and mechanism of operation of the four extraembryonicmembranes of a bird. (Labeled diagrams may be used as aids in explanation.)B. For three of these membranes of a bird briefly describe one variation in either development or functionin a mammal, such as a human.
1966:In vertebrates, changes in the mechanisms of fertilization and embryonic development have been of adaptivevalue. Compare these mechanisms and indicate their contribution to the evolutionary success of the followinganimals: A. fish B. amphibian C. bird D. mammal
1976:During development in multicellular organisms, the cells become different from one another, even though theypossess a common genetic heritage. Describe experiments in several organisms which explore the problemof differentiation at the gene level, the cell level, or the tissue level, and discuss how these experiments haveaided our understanding of development.
1988:Discuss the processes of cleavage, gastrulation, and neurulation in the frog embryo; tell what each processaccomplishes. Describe an experiment that illustrates the importance of induction in development.
Humans1961:
A. Name and describe the origin, function, and mechanism of operation of the four extraembryonicmembranes of a bird. (Labeled diagrams may be used as aids in explanation.)B. For three of these membranes of a bird briefly describe one variation in either development or functionin a mammal, such as a human.
182
1966:In vertebrates, changes in the mechanisms of fertilization and embryonic development have been of adaptivevalue. Compare these mechanisms and indicate their contribution to the evolutionary success of the followinganimals: A. fish B. amphibian C. bird D. mammal
1974:Compare and contrast the origin and maturation of the male and female gametes in a flowering plant and in amammal.
1979:Describe the role of the hypothalamus, the pituitary hormones, and the ovarian hormones in the regulation ofthe human menstrual cycle. Include in your discussion the concept of feedback control and the way in whichfertilization of the egg alters the menstrual cycle.
1989:Describe negative and positive feedback loops, and discuss how feedback mechanisms regulate each of thefollowing: A. The menstrual cycle in a nonpregnant human female B. Blood glucose levels in humans
1959:The blood, lymph, and other internal fluids have often been referred to as the "internal environment" of thecells. Many parts of the body are involved in maintaining the constancy of this internal environment. Discusshow 1) the kidneys and 2) the endocrine glands help to maintain the constancy of the internal environment.
1961:Describe and compare the excretory system of a flatworm (Platyhelminthes), an earthworm (Annelida), and agrasshopper (Arthropoda). Include labeled diagrams with your answer.
1961:Discuss the structure and function of the sympathetic and parasympathetic nervous system of a mammal.What neurohumors are associated with each system? Labeled diagrams may be included with your answer.
1962: a. Compare the digestive system of a planarian with that of an earthworm. b. Compare the body wall of a hydra with that of a tapeworm. c. Compare the circulatory system of a crayfish with that of an earthworm.
1964: a. Make a schematic diagram of a typical myelinated motor neuron. Make the diagram the size of a full page and label it completely. b. List the part included in your diagram and describe briefly the function performed by each one. c. Discuss the mechanism of synaptic transmission.

183
1964:In normal metabolism, the glucose concentration of the blood tends to remain constant (within a range of 80to 120 milligrams per hundred milliliters). Discuss the role of each of the following in maintaining thishomeostatic condition: a. the kidneys b. the islands of Langerhans c. the pituitary gland
1964:Describe the structure and the mechanism of operation of each of the following: a. a pseudopodium b. a flagellum c. a striated muscle cell
1965:Discuss each of the following as it relates to the functioning of the heartbeat in a mammal: a. the autonomic nervous system b. the structure of cardiac muscle c. the sinus node, the auriculoventricular bundle (bundle of His)
1966:Irritability of responsiveness to stimuli is a common characteristic of living organisms. Among many othersthese responses include: a. Geotropic responses in plants b. Simple reflex responses in animalsDiscuss each of these responses. Your answer should include a description of: a. the responses b. an experiments which will demonstrate the responses c. the mechanisms involved in the responses
1967:Nitrogenous waste products are excreted by animals in various forms. Many aquatic animals excreteammonia, birds and reptiles excrete uric acid, and man excretes urea. Describe the formation of two of thesewaste products and discuss the adaptive value of these three methods of nitrogenous excretion.
1968:Self-regulatory or homeostatic feedback mechanisms are present in the endocrine, vascular, and respiratorysystems of vertebrates. Describe one such feedback system, discussing the evidence which indicates thatfeedback occurs.
1971:Describe the anatomy and physiology of the autonomic nervous system of vertebrates. How does this systemhelp a vertebrate to survive?
1971:The transmission of an impulse from a nerve to the surface of a resting muscle initiates a contraction in thatmuscle. Biochemical and biophysical studies of muscle tissue have resulted in an explanation for musclecontraction known as the sliding filament theory.
a. Describe the chemical changes that occur when a nerve impulse is transmitted to the surface of aresting muscle cell.
b. Describe the internal structure of a muscle fiber as revealed by electron microscopy. c. On the basis of this structure, explain the sliding-filament theory.

184
1973:The action of organs and organ systems must be coordinated. Discuss the interaction of factors involved incontrolling heart rate and breathing rate in mammals during periods of relaxation and periods of stress.
1974:Individual organisms make short-term adjustments to temporary environmental changes in temperature,moisture, light, or the chemical environment. Chooseany one of these environmental factors and describemechanisms by which a) animals, and b)plants may adjust to changes in that factor.
1975:Regulation of biological systems is commonly achieved by means of feedback control. In each of thefollowing systems, describe how feedback control is used for regulation, and give a specific example for eachsystem. a. the size of a population b. the rate of physiological process c. the rate of an enzyme reaction
1975:The immune response of organisms involve antigens, antibodies, and other factors. Describe the immuneresponse and discuss its role in three of the following phenomena: a. blood transfusions b. Rh incompatibility c. tissue transplants
1976:Discuss the intake, transport, exchange, and release of gases in mammals.
1978:Discuss the mechanism by which a muscle cell contracts or a nerve cell transmits an impulse. Include in yourdiscussion the relationship between cell structure and function.
1979:Describe the structure and function of the stomach, pancreas, and small intestine as digestive and endocrineorgans in the human. (For each organ, include the relevant cell types and their functions.)
1980:In humans, discuss the transport of gases (oxygen and carbon dioxide) by the blood and exchange of thesegases between the blood and cells of the body. Include in your discussion the cellular and fluid composition ofthe blood.
1981:Describe the structure and function of the mammalian kidney. Include a discussion of the regulation of waterbalance by kidney and hormonal interaction.
1981:Describe the structure and function of the reflex arc in higher vertebrates. Include a description of the celltypes and a discussion of the mechanism of transmission of the impulse.
1982:Describe the following mechanisms of response to foreign materials in the human body. a. The antigen-antibody response to a skin graft from another person. b. The reactions of the body leading to inflammation of a wound infected by bacteria.

185
1983:Describe the structure of a mammalian respiratory system. Include in your discussion the mechanisms ofinspiration and expiration.
1984:Discuss the sources and actions of each of the following pairs of hormones in humans and describe thefeedback mechanisms that control their release. a. Insulin..glucagon b. Parthyroid hormone..calcitonin c. Thyrotropin (TSH) ..thyroxine (T4)
1985:Describe the anatomical and functional similarities and differences within each of the following pairs ofstructures. a. Artery..vein b. Small intestine..colon c. Skeletal muscle..cardiac muscle d. Anterior pituitary..posterior pituitary
1986:Beginning at the presynaptic membrane of the neuromuscular junction, describe the physical and biochemicalevents involved in the contraction of a skeletal muscle fiber. Include the structure of the fiber in yourdiscussion.
1986:Describe the processes of fat and protein digestion and product absorption as they occur in the humanstomach and small intestine. Include a discussion of the enzymatic reactions involved.
1987:Discuss the exchange of oxygen and carbon dioxide that occur at the alveoli and muscle cells of mammals.Include in your answer a description of the transport of these gases in the blood.
1989:Describe negative and positive feedback loops, and discuss how feedback mechanisms regulate each of thefollowing: a. The menstrual cycle in a nonpregnant human female. b. Blood glucose levels in humans.
1991:The graph below shows the response of the human immune system to exposure to an antigen. Use this graphto answer part a and part b of this question.
a. Describe the events that occur during period I as the immune system responds to the initial exposure tothe antigen.
b. Describe the events that occur during period II following a second exposure to the same antigen. c. Explain how infection by the AIDS virus (HIV) affects the function of both T and B lymphocytes.

186
1992:Biological recognition is important in many processes at the molecular, cellular,and organismal levels. Selectthree of the following, and for each of the three that you have chosen, explain how the process of recognitionoccurs and give an example. a. Organisms recognize others as members of their own species. b. Neurotransmitters are recognized in the synapse. c. Antigens trigger antibody responses. d. Nucleic acids are complementary. e. Target cells respond to specific hormones.
1992:Survival depends on the ability of an organism to respond to changes in its environment. Some plants flowerin response to changes in day length. Some mammals may run or fight when frightened. For both of theseexamples, describe the physiological mechanism involved in the response.
1993:Many physiological changes occur during exercise.
(a) Design a controlled experiment to test the hypothesis that an exercise session causes short-termincreases in heart rate and breathing rate in humans.(b) Explain how at least three organ systems are affected by this increased physical activity and discussinteractions among these systems.
1994:Discuss how cellular structures, including the plasma membrane, specialized endoplasmic reticulum,cytoskeletal elements, and mitochondria, function together in the contraction of skeletal muscle cells.
1996:Structure and function are related in the various organ systems of animals.Select two of the following four organ systems in vertebrates: * respiratory * digestive * excretory * nervous
For each of the two systems you choose, discuss the structure and function of two adaptations that aid in thetransport or exchange of molecules (or ions). Be sure to related structure to function in each example.

187
2002:The activities of organisms change at regular time intervals. These changes are called biological rhythms.The graph depicts the activity cycle over a 48-hour period for a fictional groups of mammals called pointy-eared bombats, found on an isolated island in the temperate zone.
a. Describe the cycle of activity for bombats. Discuss how three of the following factors might affectthe physiology and/or behavior of the bombats to result in this pattern of activity.
• temperature• food availability• presence of predators• social behavior
b. Propose a hypothesis regarding the effect of light on the cycle of activity in bombats. Describe acontrolled experiment that could be performed to test this hypothesis and the results you wouldexpect.
2002:In mammals, heart rate during period of exercise is linked to the intensity of exercise.
a.. Discuss the interactions of the respiratory, circulatory and nerbous systems during exercise.b. Design a controlled experiment to determine the relationship between intensity aof exercise andheart rate.c. Graph the results uou expect for both the control and the experimental groups for the controlledexperiment you described in part B. Remember to label the axes.
2004:Homeostasis, maintaining a steady state internal environment, is a characteristic of all living organisms.Choose three of the following physiological parameters and for each, describe how homeostasis ismaintained in an organism of your choice. Be sure to indicate which animal you have chosen for eachparameter. You may use the same animal or different animals for your three descriptions.
• blood glucose levels• body temperature• pH of blood• osmotic concentration of blood• neuron resting membrane potential
2005:An important defense against diseases in vertebrate animals is the ability to elinate, inactivate, or destroysubstances and organisms. Explain how the immune system achieves three of the following:
• Provides an immediate nonspecific immune response• Activates T and B cells in response to an infection• Responds to a later exposure to the same infectious agent• Distinguishes itself from nonself

188
Plants1960:The seed is the organ having great survival value. Discuss: a) the structure of seeds from this point of view; b) the phenomenon and biological importance of dormancy of seeds.
1961:Trace the evolutionary trends shown by the gametophyte generation in a bryophyte (a liverwort or moss), afern, and a pine with respect to: a) origin and structure b) mode of nutrition c) structure and mode of transport of the sperm d) relative size and longevity compared to the sporophyte generation
1962:A. Compare the nutrition of bread mold (Rhizopus) with that of the gametophyte generation of a fern.B. Compare the conduction of food materials, water, and salts in the sporophyte generation of a fern.C. Compare sexual reproduction in an alga (such as Spirogyra or Oedogonium) with that in a moss.
1964:During its development from zygote to maturity, a bean plant forms the following structures: 1. stem 2. secondary roots 3. vascular cambium 4. embryo sac 5. cotyledons A. Describe briefly the development origin of each of the five. B. Describe briefly the functions of each of the five.
1965:Discuss trends in the evolution of the sporophytes and gametophytes, using a moss, fern, and a floweringplant, as examples emphasizing: a. structure or morphology b. mode of nutrition
1965:The diagram below represents a longitudinal section of a complete flower. This is one of the most highlyevolved structures in the plant kingdom and is at least partially responsible for the degree of success thatthese organisms have achieved in our present environment. a. Name the numbered parts and give the function of each in the life cycle of the plant.
b. Tell in what way each of these parts has improved the chances of survival of this plant comparedwith a fern.
1967:Asexual reproduction is common among plants, including the fungi. Explain four methods of asexualreproduction (either natural or artificial) and give an example of each.
1968:Flowering plants have become the predominant, widespread plants of the land whereas ferns are morerestricted in their distribution. Explain the features of flowering plants that have made them more successfulthan the ferns.

189
1969:For plants, adaptations to a land environment are different from adaptations to a fresh water environment.Using your knowledge about anatomy, development, and physiology of angiosperms, discuss the problems ina land existence and adaptations of angiosperms that have evolved as solutions to these problems.
1973:Seeds that are randomly positioned when planted in a pot of soil placed on a window sill produce seedlingswith downward growing roots and upward growing shoots. Above ground, the shoots are oriented toward light.Describe the physiological mechanisms that occur to produce: a) the downward growth of the roots b) the upward growth of the shoots c) the bending of the shoots toward light
1975:Most flowering plants live on land. Describe and discuss the evolutionary adaptations that make floweringplants better adapted to life on land than mosses.
1977:Discuss the reproduction of a flowering plant, including pollination, fertilization, fruit formation, and seeddevelopment.
1982:In the life cycles of a fern and a flowering plant, compare and contrast each of the following: a. The gametophyte generation b. Sperm transport and fertilization c. Embryo protection
1984:Define the following plant responses and explain the mechanism of control for each. Cite experimentalevidence as part of your discussion. a) phototropism b) photoperiodism
1985:Describe the structure of a bean seed and discuss its germination to the seedlingstage. Include in your essay hormonal controls, structural changes, and tissue differentiation.
1990:Discuss the adaptations that have enabled flowering plants to overcome the following problems associatedwith life on land. a. The absence of an aquatic environment for reproduction b. The absence of an aquatic environment to support the plant body c. Dehydration of the plant
1992:Survival depends on the ability of an organism to respond to changes in its environment. Some plants flowerin response to changes in day length. Some mammals may run or fight when frightened. For both of theseexamples, describe the physiological mechanism involved in the response.
1959:Considering the respective foles played by the root, stem, and leaf in the life of a dicotyledonous plant,contrast the organization of these three organs.

190
1960:With regard to photoperiodism in plants discuss: a) one type of plant phenomenon affected; b) the mechanism of the operation of photoperiodism; c) the relative importance of intensity and duration of light;
1961:Discuss the movement of water from the soil through a vascular plant during transpiration with regard to: a) tissues traversed b) processes and forces involved c) environmental factors which are conducive to a high rate of transpiration d) the effects of this process upon the plant
1962:The opening and closing of the stomata are, in part, associated with the changing osmotic relationshipsexisting between the guard cells and the surrounding epidermis and mesophyll.
a) Describe the structure of a guard cell and discuss the osmotic relationships that tend to result instomatal opening. Labeled diagrams may be used as aids in explanation.b) Stomata are usually closed in the dark but tend to open in the light. Describe two possible causes ofchange in the guard cells or in their environment which result in stomatal opening.
1964:Each of the five leaf structures indicated in the diagram below is related to either the raw materials of, or by-products of, or regulation of the rate of leaf photosynthesis. a) Name the five structures in order. b) Discuss how each may regulate or in some way affect the rate of photosynthesis.
1969:For plants, adaptations to a land environment are different from adaptations to a fresh water environment.Using your knowledge about anatomy, development, and physiology of angiosperms, discuss the problems ina land existence and adaptations of angiosperms that have evolved as solutions to these problems.
1970:Since the days when Charles Darwin and his son Francis initiated an investigation of the phototropic responseof stems and of grass coleoptiles, subsequent investigators have added much to our knowledge of thisresponse. Describe the mechanism now proposed to explain phototropism in stems or coleoptiles and onecrucial experiment that provided evidence for this mechanism.
1973:Seeds that are randomly positioned when planted in a pot of soil placed on a window sill produce seedlingswith downward growing roots and upward growing shoots. Above ground, the shoots are oriented toward light.Describe the physiological mechanisms that occur to produce: a) the downward growth of the roots b) the upward growth of the shoots c) the bending of the shoots toward the light
1974:Individual organisms make short-term adjustments to temporary environmental changes in temperature,moisture, light, or the chemical environment. Choose any one of these environmental factors and describemechanisms by which plants may adjust to changes in that factor.
1976:Discuss the manner in which water, minerals, and organic compounds are transported in flowering plants.

191
1978:Discuss the structural and functional adaptations found in higher plants that enable them to conserve waterunder different environmental conditions.
1979: In relation to plants, describe in detail one way of: a) measuring the rate of transpiration b) measuring the rate of photosynthesis c) separating pigments
1980:In flowering plants, describe in detail the transport of water, carbohydrates, and inorganic solutes (nitrates, forexample). Discuss the theories that have been proposed to explain how these substances are transported.
1983:Relate the structure of an angiosperm leaf to each of the following: a) Adaptations for photosynthesis and food storage b) Adaptations for food translocation and water transport c) Specialized adaptations to a desert environment
1984:Define the following plant responses and explain the mechanism of control for each. Cite experimentalevidence as part of your discussion. a) Phototropism b) Photoperiodism
1985:Describe the structure of a bean seed and discuss its germination to the seedling stage. Include in your essayhormonal controls, structural changes, and tissue differentiation.
1987:Describe the effects of plant hormones on plant growth and development. Design an experiment todemonstrate the effect of one of these plant hormones on plant growth and development.
1988:Trace the pathway in a flowering plant as the water moves from the soil through the tissues of the root, stem,and leaves to the atmosphere. Explain the mechanisms involved in conducting water through these tissues.
1990:Discuss the adaptations that have enabled flowering plants to overcome the following problems associatedwith life on land. a) The absence of an aquatic environment for reproduction. b) The absence of an aquatic environment to support the plant body c) Dehydration of the plant

192
1991:A group of students designed an experiment to measure transpiration rates in a particular species ofherbaceous plant. Plants were divided into groups and were exposed to the following conditions.
Group I - Room conditions (light, low humidity, 200 C, and little air movement)
Group II - Room conditions with increased humidity
Group III - Room conditions with increased air movement (fan)
Group IV - Room conditions with additional light
The cumulative water loss due to transpiration of water from each plant was measured at 10-minute intervalsfor 30 minutes. Water loss was expressed as milliliters of water per square centimeter of leaf surface area.The data for all plants in Group I (room conditions) were averaged. The average cumulative water loss by theplants in Group I is presented in the table below.
Average Cumulative Water Loss by the Plants in Group I
Time(minutes)
Average Cumulative Water Loss (milliliters H2/centimeter2)
10 3.5 x 10-420 7.7 x 10-430 10.6 x 10⁻⁴
a. Construct and label a graph using the data for Group I. Using the same set of axes, draw and labelthree additional lines representing the results that you would predict for Groups II, III, and IV.b. Explain how biological and physical processes are responsible for the differences between each of yourpredictions and the data for Group I.c. Explain how the concept of water potential is used to account for the movement of water from the plantstem to the atmosphere during transpiration.
1995: Angiosperms (flowering plants) and vertebrates obtain nutrients from their environment in different ways:
(A) Discuss the type of nutrition and the nutritional requirements of angiosperms and vertebrates.
(B) Describe 2 structural adaptations in angiosperms for obtaining nutrients from the environment. Relate structure to function.
(C) Interdependence in nature is evident in symbiosis. Explain two symbiotic relationships that aid in nutrient uptake, using examples from angiosperms and/or vertebrates. (Both examples may be angiosperms, both may be vertebrates, or one may be from each group.

193
1996:Numerous environmental variables influence plant growth. Three students each planted a seedling of thesame genetic variety in the same type of container with equal amounts of soil from the same source. Theirgoal was to maximize their seedling's growth by manipulating environmental conditions. Their data are shownbelow.
Plant Seedling Mass(grams)
Day 1 Day 30Student A 4 24Student B 5 35Student C 4 64
a) Identify three different environmental variables that could account for differences in the mass of theseedlings at day 30. Then choose one of these variables and design an experiment to test thehypothesis that your variable affects growth of these seedlings.b) Discuss the results you would expect if your hypothesis is correct. Then provide a physiologicalexplanation for the effect of your variable on plant growth.
2004Organisms rarely exist alone in the natural environment. The following are five examples of symbioticrelationships.
• plant root nodules• digestion of cellulose• epiphytic plants• AIDS (acquired immune deficiency syndrome)• Anthrax
Choose FOUR of the above and for each example chosen,a. identify the participants involved in the symbiosis and describe the symbiotic relationship, andb. discuss the specific benefit or detriment, if any, that each participant receives from the relationship.
2005:Angiosperms )flowering plants) have a wide distribution in the biosphere and the largest number of species inthe plant kingdom.
a. Discuss the function of four structures for reproduction found in angiosperms and the adaptive(evolutionary) significance of each.b. Mosses (bryophytes{ have not achieved the widespread terrestrial success of angiosperms.Discuss how the anatomy and reproductive strategies of mosses limit their distribution.c. Explain alteration of generations in either angiosperms or mosses.
194
Diversity of Life2003
Regulatory (control) mechanisms in organisms are necessary for survival. Choose three of thefollowing examples and explain how eachis regulated.
a. Flowering in plantsb. water balance in plantsc. Water balance In terrestrial vertebratesd. body temperature in terrestrial vertebrates.
2004Organisms differ from one another and yet share common characteristics.
a. Select two kingdoms and briefly describe three characteristics used to distinguish betweenmembers of one kingdom and members of the other.b. Describe three characteristics (at least one molecular and one cellular) that members of these twokingdoms share.c. Propose an explanation for the existence of similarities and differences between the two kingdoms.

195
AP Biology Review Section(all pages refer to Campbell and Reece, 7th edition)
I. Molecules and CellsA. Chemistry of Life
1. Water (this should be an easy review) (Chapter 3) but be sure to go over the properties likecohesion, heat of vaporization, etc. Look at the chapter review on page 56. and tie the properties towhy they are important to life in general. At the end of the chapter is a good discussion of pH andbuffers if you are still uncertain about this.
2. Organic Molecules (from carbon to DNA) (Chapter 4 and 5) This is really a big area, but youknow a lot. Review the summary pages at the ends of the chapters, especially page 90. Look overfunctional groups on page 64-65. You should be able to recognize major classes of molecules from astructural formula.
3. Free Energy Change (definitions of pg 145 and graphs on [g 151 –152) ATP (pg 148)
4. Enzymes. Review the outline on page 158. Review inhibitors and allosteric sites (pg 155-156)
B. Cells1. Prokaryotic and Eukaryotic. Review the diagram of a prokaryotic cell on pg. 98. Remember thatthey are in the domain Eubacteria. Eukaryotic cell parts (Chapter 6). Review key concepts on pg.122. Be able to describe the Archea.
2. Membranes. Review structure diagram on pg. 127. but also remember the functional aspects likediffusion, active transport, osmosis etc. Look at the function of proteins on page 128, the Na/K ATPasepump on pg. 135, endocytosis diagrams on page 138.
3. Subcellular Organization (These are the cell parts in chapter 6). Remember structure relates tofunction….cells have what they need to use. Review page 122.
4. Cell Cycle and Regulation. This is a big area. Mitosis is Chapter 12. Look at the pie chart on pg221 and review the stages of mitosis on pg 222-223. Try to tie this to DNA replication. This cycle isregulated by factors (pg 229-230). Remember that cancer doesn’t follow the rules.
C. Cellular Energetics1. Coupled Reactions - Don’t worry too much. Just remember free energy change and that somereactions are easier to run than others and they are coupled with the hard ones.
2. Fermentation and Cellular Respiration (Chapter 9). This is a big area. glycolysis, Kreb’selectron transport and ATP production. Look at the overall diagrams of comparison like on pg 164,172, 174. Do NOT try to memorize all the details, but focus on the end products like NADH, FADH,and ATP. Which is more efficient. How is each stp regulated? (remember phosphofructokinase??)Where is oxygen used? Where is CO2 produced? Which has the redox reactions? How do you getthe 36 ATP? Why is fermentation less efficient? Review page 179. The diagrams in your book are allcolor-coded: green is glycolysis, orange is Krebs and purple is hydrogen transport.
3. Photosynthesis (Chapter 10). Do the same kind of review as for Chapter 9. Start with thediagrams on page 185, 190, 193, 194 (Light reactions and the Calvin Cycle). Look at the end productsof the light reaction (ATP, NADPH) as they drive the Calvin Cycle. Why is this a redox reaction? Howis this regulated? Where is the carbon dioxide used? Where is the oxygen produced? Why areplants green? This is all for C3 plants, review the exceptions for the Calvin Cycle in C4 and CAM

196
plants on page 197. Why does photorespiration happen? (Page 195) Look at the C4 diagram onpage 196.
II. Heredity and EvolutionA. Heredity
1. Meiosis (pg 238-246)(this should be an easy review) Tie meiosis to crossing over (pg 248 and theSordaria experiment. Compare to mitosis (pg 247).
2. Gametogenesis (egg and sperm production) (pg 974-975) and plants (597-600). Gametes arehaploid and involve meiosis in their production.
3. Eukaryotic chromosomes (pg 219 and 359).
4. Inheritance patterns (monohybrid, dihybrid crosses, sex linkage) Patterns such as 3:1 and9:3:3:1. All problems will be simple and not require a calculator.
B. Molecular Genetics1. RNA and DNA structure and function (this is the whole central dogma) Review replication,transcription, translation, but do it generally. Individual enzymes are very unlikely to be asked 0 withthe excetpion of ligase (glue), restriction endonuclease (specific cuts) and polymerase (RNA poly doestranscription; DNA poly does replication). Be sure to list the differences in DNA and RNA (see pagefor a food summary of RNA).
2. Gene Regulation (everything from operons to methylation to pre m-RNA to introns to inactiveproteins. This covers a lot of territory. Think feedback here and look at the diagrams on pg 362 and372.
3. Mutation – Know the basics of deletion, duplication, inversion, insertion and translocation. Thosemutations can happen at the nucleotide level, the gene level, or the chromosomal level (pg 328-329).
4. Viral Structure and Replication Know the relationship between nucleic acid, protein, lytic andlysogenic cycles. Review Chapter 18 in general and pages 338-336 for specific diagrams. Be sure tounderstand HIV as a virus (pg 342).
5. Nucleic Acid Technology and Applications This is where the objectives of your transformationand restriction digest lab go.. Review these labs. How can you tell how big a piece of DNA is? Knowabout transposons , sequencing, PCR, DNA fingerprints, and cloning.
C. Evolutionary Biology1. Early Evolution of Life (Chapter 26). Know the origin of life, Miller’s experiment and the Oparinhypothesis (page 213). What is the significance of the four gases: methane, ammonia, water andhydrogen? Skim this chapter and read the last section on the Tree of Life and study the tChapterReview on page 532.
2. Evidence for Evolution – Think about molecular biology (chimps and us differ by 1% in our DNA,fossils, homology ( similar structures) and embryology (similar development) . Why is a tunicateconsidered a chordate?
3. Mechanisms of Evolution- This is chapters 22,23,24. We have concentrated on the mechanismsin a population (Hardy-Weinberg) and the factors that cause change such as mutation, naturalselection, immigration, emigration and a small population, speciation and adaptation. There are lots ofexamples in this chapter. You should know an example for each. Look over the chapters, especially

197
the diagrams and summaries of key concepts at the end of the chapters. Try some of the multiplechoice questions to see how you do (Answers are in Appendix A).
III. Organisms and PopulationsA. Taxonomy
1. There are 6 kingdoms: Monera, Archea, Protists, Fungi, Animalia, Plantae. (page 495-497).
2. Each kingdom is divided into subgroups (the phylum classification).These groups are illustrated for animals on page 635 and for plants on pages 578-579.**Pay attention to the notion of Alteration of Generations in Plants (page 576) While animalsalso alternate between diploid and haploid, plants often live a great portion of their time in thehaploid. For example, moss is haploid. Only the tall spikes that come out of the fuzzy stuff arediploid.
3. The different classes of chordates are listed and described on page 672. The orders ofmammals are on page 699. Read the Chapter Review Section on page 707-708.
B. Plants – Read the review outline for each of these chapters 35,36,37,38,39,40.1. Review tissues and general functions such as the transport of wter and food and thefunctioning of the stomata. (page 717-719, 750).
2. Review the structure of tissues: stems, leaf, root (pages 721, 725, 726, 727). These oftenoccur as multiple choice questions.
3. Look at the chart for plant hormones (page 794) and review the short-day, long-day andflowering plants (page 807). Remember this is the “nervous system” of the plant. Manymovements are regulated by the presence of hormones.
C. Animals (Chapters 40-49) Read the end of the chapter reviews for each of these chapters.1. Review tissues, organs and general functions of each system (RUN MRS LIDEC). Relateeach organ to the problem it solves for the organism and how it differs in different environments(structure is related to function!)
2. Look at the diagrams of the heart (page 872), the eye (page 1059), the brain (page 1032),the kidney (pages 932-933) to prepare for the multiple choice questions.
3. Review each of the sensory organs such as the eye (page 1059) and the ear (pages 1052-1053).
4. Review movement. Check the diagram on pages 1067-1068. Look at the diagrams andread the text about how a muscle works (pages 1066-1072).
5. Review development (Chapter 21). Know the follwing terms: morula, blastula, gastrula,neurala, ectoderm, mesoderm, endoderm, endoderm, grey crescent, animal pole, vegetal pole,blastopore.
D. Ecology1. Tie adaptation to the environment (page 1081).
2. Review ecosystems (Chapter 54). Tis is easy material, but look through the chapter andlook at terms such as producer, consumer, productivity, food and energy pyramids and thecarbon, nitrogen and phosphorous cycles.

198
3. Review the key concepts for population ecology (Chapter 52). Know terms like limitingfactors, carrying capacity, exponential curves and steady growth. Review the key concepts forbehavioral biology (Chapter 51). Know key terms such as learning, cognition and sociobiology.
E. Animal BehaviorLook through the pictures in Chapter 51/ Check the Chapter Review on page 1133. It is filled withvocabulary, but the most important is probably the learning and behavior section.