Embed Size (px)
Citation preview

i
[Note: with the publication of the Fifth Edition of AP-42, the Chapter and Section number forNitric Acid was changed to 8.8.]
BACKGROUND REPORT
AP-42 SECTION 5.9
NITRIC ACID
Prepared for
U.S. Environmental Protection AgencyOAQPS/TSD/EIB
Research Triangle Park, NC 27711
1-96
Pacific Environmental Services, Inc.P.O. Box 12077
Research Triangle Park, NC 27709919/941-0333

ii
1-96AP-42 Background Report
TECHNICAL SUPPORT DIVISION
U.S. ENVIRONMENTAL PROTECTION AGENCYOffice of Air Quality Planning and StandardsResearch Triangle Park, North Carolina 27711

iii
This report has been reviewed by the Technical Support Division of the Office of Air QualityPlanning and Standards, EPA. Mention of trade names or commercial products is not intended toconstitute endorsement or recommendation for use. Copies of this report are available throughthe Library Services Office (MD-35), U.S. Environmental Protection Agency, Research TrianglePark, NC 27711.

iv
TABLE OF CONTENTS
1.0 INTRODUCTION . . . . . . . . . . . . . . . . . . . . . . . . . . . . . . . . . . . . . . . . . . . . . . . . . . . . . . . 1
2.0 INDUSTRY DESCRIPTION . . . . . . . . . . . . . . . . . . . . . . . . . . . . . . . . . . . . . . . . . . . . . . 2
2.1 GENERAL . . . . . . . . . . . . . . . . . . . . . . . . . . . . . . . . . . . . . . . . . . . . . . . . . . . . . 22.2 PROCESS DESCRIPTION . . . . . . . . . . . . . . . . . . . . . . . . . . . . . . . . . . . . . . . . 22.3 EMISSIONS AND CONTROLS . . . . . . . . . . . . . . . . . . . . . . . . . . . . . . . . . . . . 62.4 REVIEW OF SPECIFIC REFERENCES . . . . . . . . . . . . . . . . . . . . . . . . . . . . . 92.5 REFERENCES FOR CHAPTER 2 . . . . . . . . . . . . . . . . . . . . . . . . . . . . . . . . . 12
3.0 GENERAL EMISSION DATA REVIEW AND ANALYSIS PROCEDURES . . . . . . . 13
3.1 LITERATURE SEARCH AND SCREENING SOURCE TESTS . . . . . . . . . 133.2 EMISSION DATA QUALITY RATING SYSTEM . . . . . . . . . . . . . . . . . . . . 143.3 EMISSION FACTOR QUALITY RATING SYSTEM . . . . . . . . . . . . . . . . . . 163.4 REFERENCES FOR CHAPTER 3 . . . . . . . . . . . . . . . . . . . . . . . . . . . . . . . . . 18
4.0 POLLUTANT EMISSION FACTOR DEVELOPMENT . . . . . . . . . . . . . . . . . . . . . . . . 19
4.1 REVIEW OF SPECIFIC DATA SETS . . . . . . . . . . . . . . . . . . . . . . . . . . . . . . 194.2 CRITERIA POLLUTANT EMISSIONS DATA . . . . . . . . . . . . . . . . . . . . . . . 284.3 NONCRITERIA POLLUTANT EMISSIONS DATA . . . . . . . . . . . . . . . . . . 314.4 DATA GAP ANALYSIS . . . . . . . . . . . . . . . . . . . . . . . . . . . . . . . . . . . . . . . . . 334.5 REFERENCES FOR CHAPTER 4 . . . . . . . . . . . . . . . . . . . . . . . . . . . . . . . . . 34
APPENDIX A: AP-42 SECTION 5.9 . . . . . . . . . . . . . . . . . . . . . . . . . . . . . . . . . . . . . . . . . . . . 37
v
LIST OF TABLES
TABLE 4.2-1: (METRIC UNITS) NITROGEN OXIDES . . . . . . . . . . . . . . . . . . . . . . . . . . . . 29TABLE 4.2-1: (ENGLISH UNITS) NITROGEN OXIDES . . . . . . . . . . . . . . . . . . . . . . . . . . . 30TABLE 4.3-1: (METRIC UNITS) GLOBAL WARMING GASES . . . . . . . . . . . . . . . . . . . . 32TABLE 4.3-1: (ENGLISH UNITS) GLOBAL WARMING GASES . . . . . . . . . . . . . . . . . . . 32TABLE 4-4: LIST OF CONVERSION FACTORS . . . . . . . . . . . . . . . . . . . . . . . . . . . . . . . . 36
LIST OF FIGURES
FIGURE 2.2-1: TYPICAL WEAK NITRIC ACID PLANT . . . . . . . . . . . . . . . . . . . . . . . . . . . 4FIGURE 2.2-2: FLOW DIAGRAM OF HIGH STRENGTH NITRIC ACID
PRODUCTION FROM WEAK NITRIC ACID . . . . . . . . . . . . . . . . . . . . . . . . . . . . . . . . 7

1
1.0 INTRODUCTION
The document "Compilation of Air Pollutant Emission Factors" (AP-42) has been
published by the U.S. Environmental Protection Agency (EPA) since 1972. Supplements to
AP-42 have been routinely published to add new emission source categories and to update
existing emission factors. AP-42 is routinely updated by the EPA to respond to new emission
factor needs of the EPA, State and local air pollution control programs, and industry.
An emission factor relates the quantity (weight) of pollutants emitted to a unit of activity
of the source. The uses for the emission factors reported in AP-42 include:
1. Estimates of area-wide emissions;
2. Emission estimates for a specific facility; and
3. Evaluation of emissions relative to ambient air quality.
The purpose of this report is to provide background information from process information
obtained from industry comment and 14 test reports to support revision of the process description
and/or emission factors for nitric acid plants.
Including the introduction (Chapter 1), this report contains four chapters. Chapter 2 gives a
description of the nitric acid industry. It includes a characterization of the industry, an overview
of the different process types, a description of emissions, and a description of the technology
used to control emissions resulting from the nitric acid process. A review of specific data sets
which contributed any additional information for the revised AP-42 section is also presented.
Chapter 3 is a review of emissions data collection and analysis procedures. It describes the
literature search, the screening of emission data reports, and the quality rating system for both
emission data and emission factors. Chapter 4 details criteria and noncriteria pollutant emission
factor development. It includes the review of specific data sets and the results of data analysis. A
data gap analysis for the pollutant emission factor development process is also presented.
Appendix A presents a copy of the revised AP-42 Section 5.9.

2
2.0 INDUSTRY DESCRIPTION
2.1 GENERAL1,2
In 1991, there were approximately 65 nitric acid (HNO3) manufacturing plants in the U.S.
with a total capacity of 10 million megagrams (11 million tons) of acid per year.2 The plants
range in size from 5,400 to 635,000 megagrams (6,000 to 700,000 tons) per year. About 70
percent of the nitric acid produced is consumed as an intermediate in the manufacture of
ammonium nitrate (NH4NO3), which is primarily used in fertilizers.1 The majority of the nitric
acid plants are located in agricultural regions such as the Midwest, South Central, and Gulf
States in order to accommodate the high volume of fertilizer use. Another 5 to 10 percent of the
nitric acid produced is used for organic oxidation in adipic acid manufacturing. Nitric acid is also
used in organic oxidation to manufacture terephthalic acid and other organic compounds.
Explosive manufacturing utilizes nitric acid for organic nitrations. Nitric acid nitrations are used
in producing nitrobenzene, dinitrotoluenes, and other chemical intermediates.1 Other end uses of
nitric acid are gold and silver separation, military munitions, steel and brass pickling,
photoengraving, and acidulation of phosphate rock.
2.2 PROCESS DESCRIPTION1,3,4
Nitric acid is produced by two methods. The first method utilizes oxidation, condensation,
and absorption to produce a weak nitric acid. Weak nitric acid can have concentrations ranging
from 30 to 70 percent nitric acid.3 The second method combines dehydrating, bleaching,
condensing, and absorption to produce high strength nitric acid from weak nitric acid. High
strength nitric acid generally contains more than 90 percent nitric acid.3 The following text
provides more specific details for each of these processes.

3
Weak Nitric Acid Production
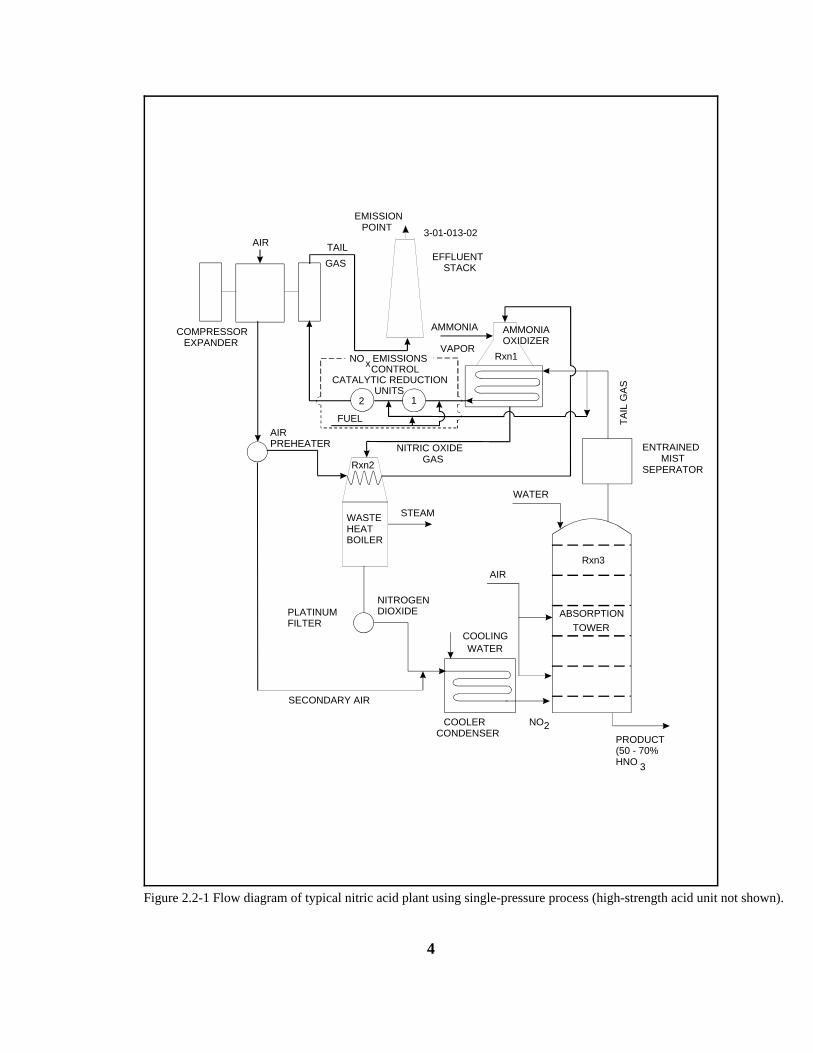
Nearly all the nitric acid produced in the U.S. is manufactured by the high temperature
catalytic oxidation of ammonia as shown schematically in Figure 2.2-1.
4
3-01-013-02
PRODUCT(50 - 70%HNO 3
COOLERCONDENSER
NO2
SECONDARY AIR
PLATINUMFILTER
NITROGENDIOXIDE
COOLINGWATER
AIRRxn3
ABSORPTIONTOWER
WATER
ENTRAINEDMIST
SEPERATOR
NITRIC OXIDEGAS
Rxn2
FUEL
COMPRESSOREXPANDER
AIR TAIL
GAS
EMISSIONPOINT
EFFLUENTSTACK
AMMONIA
VAPORNO EMISSIONS
CONTROLx
CATALYTIC REDUCTIONUNITS
2 1
PREHEATERAIR
WASTEHEATBOILER
STEAM
AMMONIAOXIDIZER
Rxn1
TA
IL G
AS
Figure 2.2-1 Flow diagram of typical nitric acid plant using single-pressure process (high-strength acid unit not shown).

5
This process typically consists of three steps: 1. ammonia oxidation, 2. nitric oxide oxidation,
and 3. absorption. Each step corresponds to a distinct chemical reaction.
Ammonia Oxidation. First, a 1:9 ammonia/air mixture is oxidized at a temperature of 750
to 800EC (1380 to 1470EF) as it passes through a catalytic converter, according to the following
reaction:4
(1)4NH3 % 5O2 6 4NO % 6H2O
The most commonly used catalyst is made of 90 percent platinum and 10 percent rhodium gauze
constructed from squares of fine wire. Under these conditions the oxidation of ammonia to
nitric oxide proceeds in an exothermic reaction with a range of 93 to 98 percent yield.1 Higher
catalyst temperatures increase reaction selectivity toward nitric oxide (NO) production. Lower
catalyst temperatures tend to be more selective toward nitrogen (N2) and nitrous oxide (N2O).1
Nitric oxide is considered to be a criteria pollutant and nitrous oxide is known to be a global
warming gas. The nitrogen dioxide/dimer mixture then passes through a waste heat boiler and a
platinum filter.
Nitric Oxide Oxidation. The nitric oxide formed during the ammonia oxidation is
oxidized in another operation. The process stream is passed through a cooler/condenser and
cooled to 38EC (100EF) or less at pressures up to 800 kPa
(116 psia). The nitric oxide reacts noncatalytically with residual oxygen to form
nitrogen dioxide and its liquid dimer, nitrogen tetroxide:1
(2)2NO % O2 6 2NO2 6 N2O4
This slow, homogeneous reaction is temperature and pressure dependent. Operating at low
temperatures and high pressures promotes maximum production
of NO2 within a minimum reaction time.
Absorption. The final step introduces the nitrogen dioxide/dimer mixture into an
absorption process after being cooled. The mixture is pumped into the bottom of the absorption
tower, while liquid dinitrogen tetroxide is added at a higher point. Deionized water enters the
top of the column. Both liquids flow countercurrent to the dioxide/dimer gas mixture. Oxidation
takes place in the free space between the trays, while absorption occurs on the trays. The
absorption trays are usually sieve or bubble cap trays. The exothermic reaction occurs as follows:

6
(3)3NO2 % H2O 6 2HNO3 % NO
A secondary air stream is introduced into the column to re-oxidize the NO which is formed
in Reaction 3. This secondary air also removes NO2 from the product acid. An aqueous solution
of 55 to 65 percent (typically) nitric acid is withdrawn from the bottom of the tower.1 The acid
concentration can vary from 30 to 70 percent nitric acid.3 The acid concentration depends upon
the temperature, pressure, number of absorption stages, and concentration of nitrogen oxides
entering the absorber.
There are two basic types of systems used to produce weak nitric acid: 1) single-stage
pressure process, and 2) dual-stage pressure process. In the past, nitric acid plants have been
operated at a single pressure, ranging from atmospheric pressure to 1400 kPa (14.7 to 203 psia).1
However, since Reaction 1 is favored by low pressures and Reactions 2 and 3 are favored by
higher pressures, newer plants tend to operate a dual-stage pressure system, incorporating a
compressor between the ammonia oxidizer and the condenser. The oxidation reaction is carried
out at pressures from slightly negative to about 400 kPa (58 psia), and the absorption reactions
are carried out at 800 to 1,400 kPa (116 to 203 psia).1
In the dual-stage pressure system, the nitric acid formed in the absorber (bottoms) is
usually sent to an external bleacher where air is used to remove (bleach) any dissolved oxides of
nitrogen. The bleacher gases are then compressed and passed through the absorber. The
absorber tail gas (distillate) is sent to an entrainment separator for acid mist removal. Next, the
tail gas is reheated in the ammonia oxidation heat exchanger to approximately 200EC (392EF).
The final step expands the gas in the power-recovery turbine. The thermal energy produced in
this turbine can be used to drive the compressor.1
High Strength Nitric Acid Production
High strength nitric acid (98 to 99 percent concentration) can be obtained by concentrating
weak nitric acid (30 to 70 percent concentration) using extractive distillation.1 The weak nitric
acid cannot be concentrated by simple fractional distillation. The distillation must be carried out
in the presence of a dehydrating agent. Concentrated sulfuric acid (typically 60 percent sulfuric
acid) is most commonly used for this purpose. The nitric acid concentration process consists of
feeding strong sulfuric acid and 55 to 65 percent nitric acid into the top of a packed dehydrating
column at approximately atmospheric pressure. The acid mixture flows downward,

7
WEAKNITRIC ACID
ABSORPTIONCOLUMN
INERT,UNREACTEDGASES
AIR
O , NO2
STRONGNITRIC ACID
CONDENSOR
COOLINGWATER
BLEACHER
HNO , NO , O3 2 2
DEHYDRATINGCOLUMN
50-70%HNO3
H SO2 4
Figure 2.2-2. Flow diagram of high-strength nitric acid production from weak nitric acid.
countercurrent to ascending vapors. Concentrated nitric acid leaves the top of the column as 99
percent vapor, containing a small amount of NO2 and O2 resulting from dissociation of nitric
acid.1 The concentrated acid vapor leaves the column and goes to a bleacher and a countercurrent
condenser system to effect the condensation of strong nitric acid and the separation of oxygen
and nitrogen oxide by-products. These by-products then flow to an absorption column where the
nitric oxide mixes with auxiliary air to form NO2, which is recovered as weak nitric acid. Inert
and unreacted gases are vented to the atmosphere from the top of the absorption column.
Emissions from this process are relatively small. A small absorber can be used to recover NO2.
Figure 2.2-2 presents a flow diagram of high strength nitric acid production from weak nitric
acid.
2.3 EMISSIONS AND CONTROLS3,4,5
Emissions from nitric acid manufacture consist primarily of NO and NO2 (which account
for visible emissions), and trace amounts of HNO3 mist and NH3. By far, the major source of
nitrogen oxides is the tail gas from the acid absorption tower. In general, the quantity of NOx

8
emissions are directly related to the kinetics of the nitric acid formation reaction and absorption
tower design. NOx emissions can increase when there is (1) insuffficient air supply to the
oxidizer and absorber, (2) low pressure, especially in the absorber, (3) high temperatures in the
cooler/condenser and absorber, (4) production of an excessively high-strength product acid, (5)
operation at high throughput rates, and (6) faulty equipment such as compressors or pumps which
lead to lower pressures, leaks, and reduced plant efficiency.4
The two most common techniques used to control absorption tower tail gas emissions are
extended absorption and catalytic reduction. Extended absorption reduces nitrogen oxide
emissions by increasing the efficiency of the existing process absorption tower or incorporating
an additional absorption tower. An efficiency increase is achieved by increasing the number of
absorber trays, operating the absorber at higher pressures, or cooling the weak acid liquid in the
absorber. The existing tower can also be replaced with a single tower of a larger diameter and/or
additional trays (see reference 5 for the relevant equations).
In the catalytic reduction process (often termed catalytic oxidation or incineration), tail
gases from the absorption tower are heated to ignition temperature, mixed with fuel (natural gas,
hydrogen, propane, butane, naphtha, carbon monoxide, or ammonia) and passed over a catalyst
bed. In the presence of the catalyst, the fuels are oxidized and the nitrogen oxides are reduced to
N2. The extent of reduction of NO2 and NO to N2 is a function of plant design, fuel type
operating temperature and pressure, space velocity through the reduction catalytic reactor, type
of catalyst, and reactant concentration. Catalytic reduction can be used in conjunction with other
NOx emission controls. Other advantages include the capability to operate at any pressure and the
option of heat recovery to provide energy for process compression as well as extra steam.
Catalytic reduction can achieve greater NOx reduction than extended absorption. However, high
fuel costs have caused a decline in its use.
Two seldom used alternative control devices for absorber tail gas are molecular sieves and
wet scrubbers. In the molecular sieve technique, tail gas is contacted with an active molecular
sieve which catalytically oxidizes NO to NO2 and selectively adsorbs the NO2. The NO2 is then
thermally stripped from the molecular sieve and returned to the absorber. The molecular sieve
technique has successfully controlled NOx emissions in existing plants. However, many new
plants do not install this method of control. Its implementation incurs high capital and energy
costs. The molecular sieve technique is a cyclic system, whereas most new nitric acid plants are
continuous systems.

9
Wet scrubbers use an aqueous solution of alkali hydroxides or carbonates, ammonia, urea,
potassium permanganate, or caustic chemicals to "scrub" NOx from the absorber tail gas. The NO
and NO2 are absorbed and recovered as nitrate or nitrate salts. When caustic chemicals are used,
the wet scrubber is referred to as a caustic scrubber. Some of the caustic chemicals used are
solutions of sodium hydroxide, sodium carbonate, or other strong bases that will absorb NOx in
the form of nitrate or nitrate salts. Although caustic scrubbing can be an effective control device,
it is often not used due to its incurred high costs and the necessity to treat its spent scrubbing
solution.
Comparatively small amounts of nitrogen oxides are also lost from acid concentrating
plants. These losses (mostly NO2) are from the condenser system, but the emissions are small
enough to be controlled easily by inexpensive absorbers.
Acid mist emissions do not occur from the tail gas of a properly operated plant. The small
amounts that may be present in the absorber exit gas streams are removed by a separator or
collector prior to entering the catalytic reduction unit or expander.
The acid production system and storage tanks are the only significant sources of visible
emissions at most nitric acid plants. Emissions from acid storage tanks may occur during tank
filling.
The emission factors vary considerably with the type of control employed and with
process conditions. For comparison purposes, the EPA New Source Performance Standard on
nitrogen emissions expressed as NO2 for both new and modified plants is 1.5 kilograms of NO2
emitted per megagram (3.0 lb/ton) of 100 percent nitric acid produced. 3
2.4 REVIEW OF SPECIFIC REFERENCES
Pacific Environmental Services (PES) contacted the following sources to obtain the most
up-to-date information on process descriptions and emissions for this industry.
1) Alabama Air Division, ADEM, Montgomery, Alabama.
2) Arkansas Department of Pollution Control and Ecology Division of Air Pollution,
Little Rock, Arkansas.
3) Chemical Manufacturers Association.
4) Florida Department of Environmental Regulation - Bureau of Air Quality
Management, Tallahassee, Florida.

10
5) Georgia Department of Natural Resources - Environmental Protection Division,
Atlanta, Georgia.
6) J.R. Simplot Company, Pocatello, Idaho.
7) Kansas Department of Health and Environment - Bureau of Air Quality, Topeka,
Kansas.
8) Michigan Department of Natural Resources - Air Pollution Control Division,
Lansing, Michigan.
9) Missouri Department of Natural Resources - Division of Environmental Quality,
Jefferson City, Missouri.
10) Monsanto Company, Pensacola, Florida.
11) Ohio Environmental Protection Agency.
12) Pennsylvania Department of Environmental Resources, Harrisburg, Pennsylvania.
Responses were received from the J.R. Simplot Company and the Monsanto Company. No
responses were received from the remaining sources. PES was unable to incorporate the
information received from these two sources into the AP-42 section revision because the data
contained in their reports are not complete. Additional details on the exclusion of these reports
can be found in Section 4.1 of this report.
Reference 1: Alternative Control Techniques Document: Nitric and Adipic Acid
Manufacturing Plants.
This reference provided the nitric acid process description. It details ammonia oxidation,
nitric oxide oxidation, and absorption. Percent yields, temperatures, and pressures are a few of
the details given by this reference. The dual-stage pressure system is also detailed.
Reference 2: North American Fertilizer Capacity Data.
This reference provided production capacities for the nitric acid plants located in the
United States as of 1991. There were approximately 65 nitric acid manufacturing plants with a
total capacity of 10 million megagrams (11 million tons) of acid per year.
Reference 3: Code of Federal Regulations.
This reference provided information on the industrial manufacture of nitric acid. High
strength nitric acid (95 to 99 percent concentration) can be obtained by concentrating weak nitric
acid (30 to 70 percent concentration). The New Source Performance Standard on nitric acid

11
plant emissions was also located in the CFR. For both new and modified plants, approximately
1.5 kilograms of NO2 is emitted per megagram (3.0 pounds/ton) of 100 percent nitric acid
produced.
Reference 4: A Review of Standards of Performance for New Stationary Sources—Nitric
Acid Plants.
This reference provided details on the control equipment used in nitric acid plants. This
control equipment consists of extended absorption and catalytic reduction. This reference also
provided information for weak nitric acid production; specifically for the first step of ammonia
oxidation. There were several small differences between References 1 and 4; the values
presented in this report are taken from the most current reference, Reference 1.
Reference 5: Unit Operations of Chemical Engineering.
This reference provides the equations necessary to evaluate the efficiency of increasing the
number of absorber trays in an absorption tower, operating the absorber at higher pressures, or
cooling the weak acid liquid in the absorber. This reference also gives equations to determine
whether an existing tower should be replaced with a single tower of a larger diameter or if adding
additional trays would be sufficient or whether utilizing a combination of these options would be
more efficient.
12
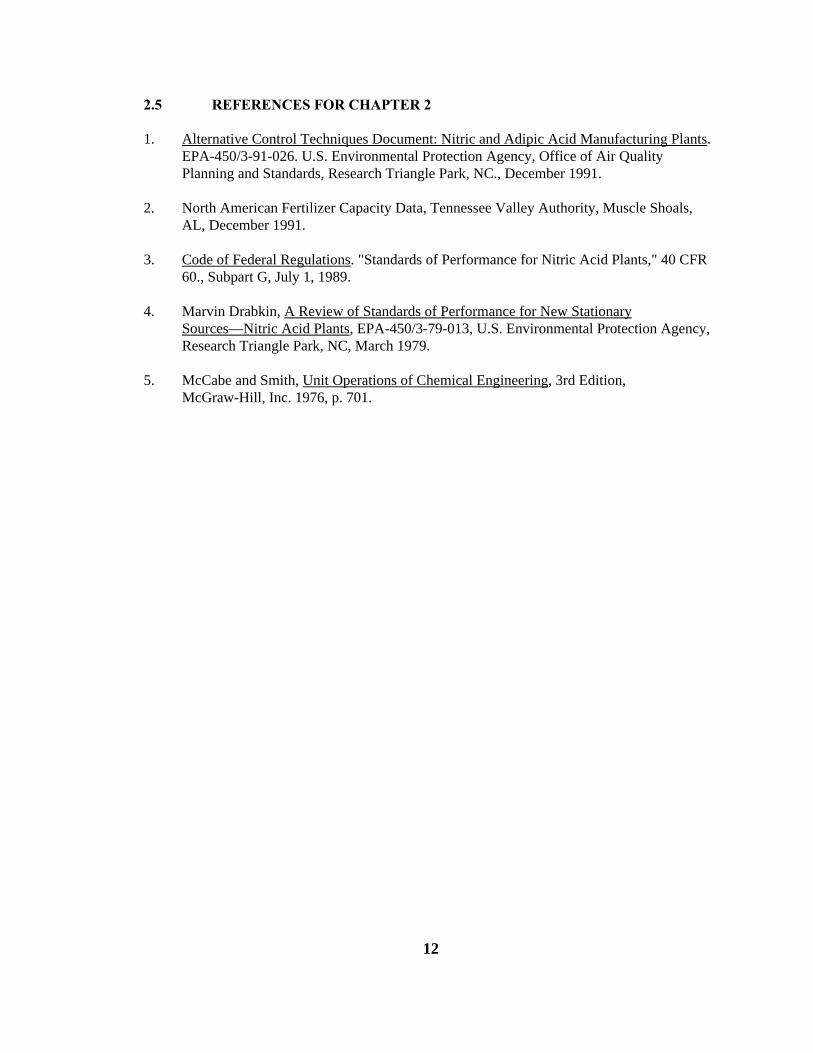
2.5 REFERENCES FOR CHAPTER 2
1. Alternative Control Techniques Document: Nitric and Adipic Acid Manufacturing Plants.EPA-450/3-91-026. U.S. Environmental Protection Agency, Office of Air QualityPlanning and Standards, Research Triangle Park, NC., December 1991.
2. North American Fertilizer Capacity Data, Tennessee Valley Authority, Muscle Shoals,AL, December 1991.
3. Code of Federal Regulations. "Standards of Performance for Nitric Acid Plants," 40 CFR60., Subpart G, July 1, 1989.
4. Marvin Drabkin, A Review of Standards of Performance for New StationarySources—Nitric Acid Plants, EPA-450/3-79-013, U.S. Environmental Protection Agency,Research Triangle Park, NC, March 1979.
5. McCabe and Smith, Unit Operations of Chemical Engineering, 3rd Edition, McGraw-Hill, Inc. 1976, p. 701.

13
3.0 EMISSION DATA REVIEW AND ANALYSIS PROCEDURES
3.1 LITERATURE SEARCH AND SCREENING SOURCE TESTS
The first step in the investigative process involved a search of available literature relating
to criteria and noncriteria pollutant emissions associated with nitric acid plants. This search
included, but was not limited to, the following references:
1) AP-42 background files maintained by the Emission Factor and Methodologies
Section provided the three references from the 1980 AP-42 and several source tests.
2) "Locating and Estimating" (L&E) reports (as applicable) published by the Emission
Factor and Methodologies Section. Nitrogen oxides are the primary emission from
nitric acid production, and there are no L&E reports based on nitrogen oxides (NOx).
3) Handbook of Emission Factors, Parts I and II, Ministry of Housing, Physical Planning
and Environment, The Netherlands, 1980/1983 provided NOx emission factors for
uncontrolled processes, catalytic reduction, and extended absortion of the tail gas
from nitric acid processes. For additional details, see Chapter 4.1 of this report under
the discussion for Reference 15.
To reduce the amount of literature collected to a final group of references pertinent to this
report, the following general criteria were used:
1. Emissions data must be from a primary reference; i.e., the document must constitute
the original source of test data. For example, a technical paper was not included if the
original study was contained in the previous document.
2. The referenced study must contain test results based on more than one test run.
3. The report must contain sufficient data to evaluate the testing procedures and source
operating conditions (e.g., one-page reports were generally rejected).
If no primary data were found and the previous update utilized secondary data, secondary
data were still used and the Emission Factor Rating lowered, if needed. A final set of reference
materials was compiled after a thorough review of the pertinent reports, documents, and
information according to these criteria. The final set of reference materials is given in Chapter
4.5.

14
3.2 EMISSION DATA QUALITY RATING SYSTEM
As part of Pacific Environmental Services' analysis of the emission data, the quantity and
quality of the information contained in the final set of reference documents were evaluated. The
following data were always excluded from consideration:
1. Test series averages reported in units that cannot be converted to the selected
reporting units;
2. Test series representing incompatible test methods (e.g., comparison of the EPA
Method 5 front-half with the EPA Method 5 front- and back-half);
3. Test series of controlled emissions for which the control device is not specified;
4. Test series in which the source process is not clearly identified and described; and
5. Test series in which it is not clear whether the emissions were measured before or
after the control device.
Data sets that were not excluded were assigned a quality rating. The rating system used
was that specified by the OAQPS for the preparation of AP-42 sections. The data were rated as
follows:
A Rating
Multiple tests performed on the same source using sound methodology and reported in
enough detail for adequate validation. These tests do not necessarily conform to the
methodology specified in either the inhalable particulate (IP) protocol documents or the
EPA reference test methods, although these documents and methods were certainly used as
a guide for the methodology actually used.
B Rating
Tests that were performed by a generally sound methodology but lack enough detail for
adequate validation.
C Rating
Tests that were based on an untested or new methodology or that lacked a significant
amount of background data.
D Rating
Tests that were based on a generally unacceptable method but may provide an order-of-
magnitude value for the source.

15
The following criteria were used to evaluate source test reports for sound methodology
and adequate detail:
1. Source operation. The manner in which the source was operated is well documented
in the report. The source was operating within typical parameters during the test.
2. Sampling procedures. The sampling procedures conformed to a generally acceptable
methodology. If actual procedures deviated from accepted methods, the deviations
are well documented. When this occurred, an evaluation was made of the extent
such alternative procedures could influence the test results.
3. Sampling and process data. Adequate sampling and process data are documented in
the report. Many variations can occur unnoticed and without warning during testing.
Such variations can induce wide deviations in sampling results. If a large spread
between test results cannot be explained by information contained in the test report,
the data are suspect and were given a lower rating.
4. Analysis and calculations. The test reports contain original raw data sheets. The
nomenclature and equations used were compared to those (if any) specified by the
EPA to establish equivalency. The depth of review of the calculations was dictated
by the reviewer's confidence in the ability and conscientiousness of the tester, which
in turn was based on factors such as consistency of results and completeness of
other areas of the test report.
3.3 EMISSION FACTOR QUALITY RATING SYSTEM
The quality of the emission factors developed from analysis of the test data was rated
utilizing the following general criteria:
A (Excellent)
Developed only from A-rated test data taken from many randomly chosen facilities in the
industry population. The source category is specific enough so that variability within the
source category population may be minimized.
B (Above average)
Developed only from A-rated test data from a reasonable number of facilities. Although no
specific bias is evident, it is not clear if the facilities tested represent a random sample of
the industries. As in the A-rating, the source category is specific enough so that variability
within the source category population may be minimized.

16
C (Average)
Developed only from A and B-rated test data from a reasonable number of facilities.
Although no specific bias is evident, it is not clear if the facilities tested represent a
random sample of the industry. As in the A-rating, the source category is specific enough
so that variability within the source category population may be minimized.
D (Below average)
The emission factor was developed only from A- and B-rated test data from a small
number of facilities, and there is reason to suspect that these facilities do not represent a
random sample of the industry. There also may be evidence of variability within the source
category population. Limitations on the use of the emission factor are noted in the
emission factor table.
E (Poor)
The emission factor was developed from C and D-rated test data, and there is reason to
suspect that the facilities tested do not represent a random sample of the industry. There
also may be evidence of variability within the source category population. Limitations on
the use of these factors are always noted.
The use of these criteria is somewhat subjective and depends to an extent on the individual
reviewer.

17
3.4 REFERENCES FOR CHAPTER 3
1. Technical Procedures for Developing AP-42 Emission Factors and Preparing AP-42Sections. U.S. Environmental Protection Agency, Air Management Technology Branch,Office of Air Quality Planning and Standards, Research Triangle Park, NC, April 1992.
2. AP-42, Supplement A, Appendix C.2, "Generalized Particle Size Distributions." U.S.Environmental Protection Agency, October 1986.

18
4.0 POLLUTANT EMISSION FACTOR DEVELOPMENT
4.1 REVIEW OF SPECIFIC DATA SETS
Reference 1: La Roche Industries, Inc. Oxides of Nitrogen Emissions Test Report.
This test was performed in accordance with the EPA Reference Methods 1 through 4 and
7E. All of the required information as outlined in Chapter 3.2 of this report is provided and the
results are consistent; therefore, this test is rated "A". No control device was used in this
process. Production data are given in terms of short tons of 100 percent HNO3 produced per day.
Emission factors are given as pounds of NOx emitted per short ton of 100 percent HNO3
produced. Emission rates were calculated by multiplying the emission factor by the production
rate and any relevant conversion factors. Equivalent metric units were also calculated for the
emissions data. CO2 and O2 emissions were also tested. The data state that zero percent CO2 was
emitted. Since the measuring device is not specified, the accuracy of these readings is not
known.
Reference 2: Bison Nitrogen Products Co. Source Test Report. October 1978.
This test was performed in accordance with the EPA Reference Methods 1 through 4 and
7. All of the required information as outlined in Chapter 3.2 of this report is provided and the
results are consistent; therefore, this test is rated "A". Extended absorption was used as a control
device in this process. Production data are given in terms of short tons of 100 percent HNO3
produced per day. Emission factors are given as kilograms of NOx emitted per metric ton of 100
percent HNO3 produced. These emission factors were converted into the desired units (pounds
per short ton) using the appropriate conversion factors.
CO2 emissions were also tested using an ORSAT. The CO2 emissions were calculated by
using the percent of CO2 contained in the stack gas on a dry basis and dividing it by 100 to obtain
a fractional value of CO2. This fraction was then multiplied by the stack gas volumetric flow rate
and any corresponding conversion factors to obtain the emission rate of CO2 in terms of pounds
of CO2 emitted per hour. The production rates and emission factors were obtained as described
in the preceding paragraph.
Reference 3: Agrico Chemical Company Source Test Report. May 1980.

19
This test was performed in accordance with the EPA Reference Methods 1 through 4 and
7. All of the required information as outlined in Chapter 3.2 of this report is provided and the
results are consistent; therefore, this test is rated "A". Extended absorption with a caustic
scrubber were used as control devices in this process. Production data are given in terms of short
tons of 100 percent HNO3 produced per day. Emission factors are given as pounds of NOx
emitted per short ton of 100 percent HNO3 produced. PES calculated emission rates by
multiplying the emission factor by the production rate. Equivalent metric units were also
calculated for the emissions data. CO2 emissions were also tested using gas chromatography. No
emissions were detected.
Reference 4: Agrico Chemical Company Source Test Report. November 1976.
This test was performed in accordance with the EPA Reference Methods 1 through 4 and
7. All of the required information as outlined in Chapter 3.2 of this report is provided and the
results are consistent; therefore, this test is rated "A". Extended absorption with a caustic
scrubber were used as control devices in this process. Production data are given in terms of short
tons of 100 percent HNO3 produced per day. Emission factors are given as pounds of NOx
emitted per short ton of 100 percent HNO3 produced. PES calculated emission rates by
multiplying the emission factor by the production rate. Equivalent metric units were also
calculated for the emissions data. CO2 emissions were also tested using gas chromatography. No
emissions were detected.
Reference 5: Agrico Chemical Company Source Test Report. June 1976.
This test was performed in accordance with the EPA Reference Methods 1 through 4 and
7. All of the required information as outlined in Chapter 3.2 of this report is provided and the
results are consistent; therefore, this test is rated "A". A caustic scrubber was used as the control
device in this process. Production data are given in terms of short tons of 100 percent HNO3
produced per day. Emission factors are given as pounds of NOx emitted per short ton of 100
percent HNO3 produced. PES calculated emission rates by multiplying the emission factor by the
production rate. Equivalent metric units were also calculated for the emissions data. CO2
emissions were also tested using gas chromatography. No emissions were detected.
20
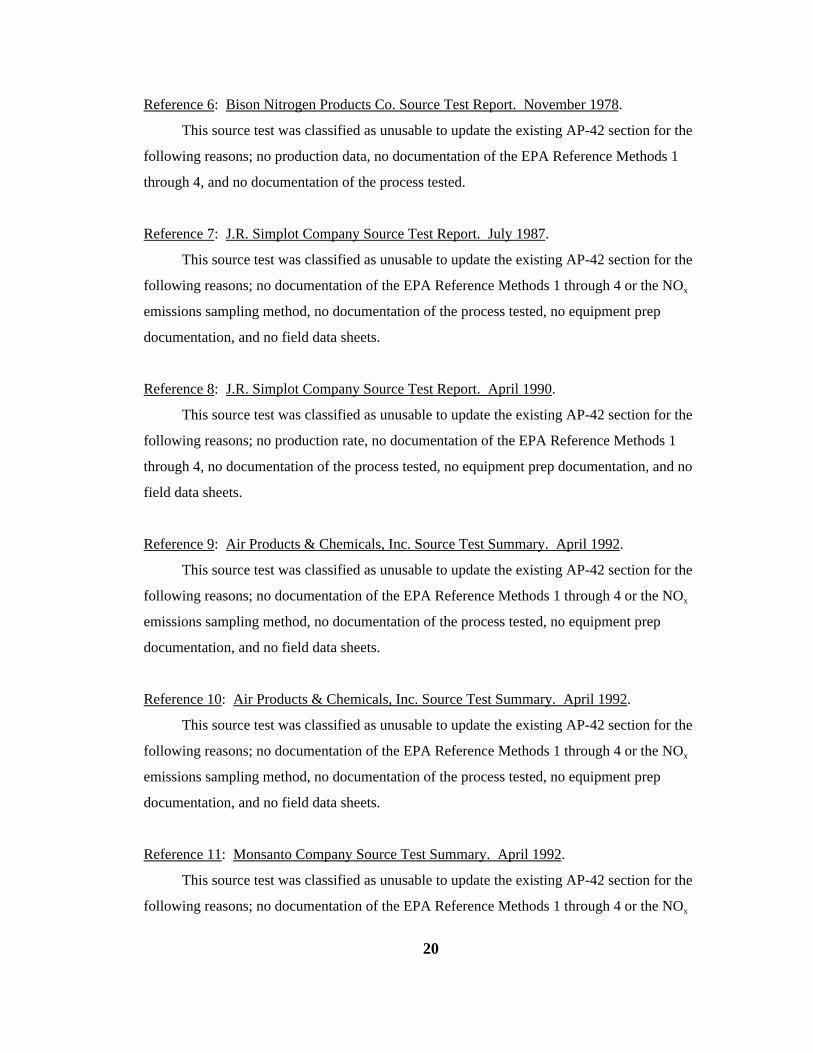
Reference 6: Bison Nitrogen Products Co. Source Test Report. November 1978.
This source test was classified as unusable to update the existing AP-42 section for the
following reasons; no production data, no documentation of the EPA Reference Methods 1
through 4, and no documentation of the process tested.
Reference 7: J.R. Simplot Company Source Test Report. July 1987.
This source test was classified as unusable to update the existing AP-42 section for the
following reasons; no documentation of the EPA Reference Methods 1 through 4 or the NOx
emissions sampling method, no documentation of the process tested, no equipment prep
documentation, and no field data sheets.
Reference 8: J.R. Simplot Company Source Test Report. April 1990.
This source test was classified as unusable to update the existing AP-42 section for the
following reasons; no production rate, no documentation of the EPA Reference Methods 1
through 4, no documentation of the process tested, no equipment prep documentation, and no
field data sheets.
Reference 9: Air Products & Chemicals, Inc. Source Test Summary. April 1992.
This source test was classified as unusable to update the existing AP-42 section for the
following reasons; no documentation of the EPA Reference Methods 1 through 4 or the NOx
emissions sampling method, no documentation of the process tested, no equipment prep
documentation, and no field data sheets.
Reference 10: Air Products & Chemicals, Inc. Source Test Summary. April 1992.
This source test was classified as unusable to update the existing AP-42 section for the
following reasons; no documentation of the EPA Reference Methods 1 through 4 or the NOx
emissions sampling method, no documentation of the process tested, no equipment prep
documentation, and no field data sheets.
Reference 11: Monsanto Company Source Test Summary. April 1992.
This source test was classified as unusable to update the existing AP-42 section for the
following reasons; no documentation of the EPA Reference Methods 1 through 4 or the NOx
21
emissions sampling method, no documentation of the process tested, no equipment prep
documentation, and no field data sheets.
Reference 12: J.R. Simplot Co. Emissions Summary. February 1990.
This source test was classified as unusable to update the existing AP-42 section for the
following reasons; no documentation of the EPA Reference Methods 1 through 4 or the NOx
emissions sampling method, no documentation of the process tested, no documentation of control
equipment and its efficiency, no equipment prep documentation, and no field data sheets.
Reference 13: J.R. Simplot Co. Emissions Summary. May 1990.
This source test was classified as unusable to update the existing AP-42 section for the
following reasons; no documentation of the EPA Reference Methods 1 through 4 or the NOx
emissions sampling method, no documentation of the process tested, no documentation of control
equipment and its efficiency, no equipment prep documentation, and no field data sheets.
Reference 14: J.R. Simplot Co. Emissions Summary. July 1990.
This source test was classified as unusable to update the existing AP-42 section for the
following reasons; no documentation of the EPA Reference Methods 1 through 4 or the NOx
emissions sampling method, no documentation of the process tested, no documentation of control
equipment and its efficiency, no equipment prep documentation, and no field data sheets.
Reference 15: Handbook of Emission Factors, Parts I and II, Ministry of Housing, Physical
Planning and Environment.
This reference provides NOx and NH3 emission factor ranges for uncontrolled processes,
catalytic reduction, and extended absortion of tail gas for the nitric acid process. The reducing
agent used in the catalytic reduction is not specified. The units in the emissions table are in
kilograms of emission per ton of 100 percent nitric acid produced. For comparison purposes,
PES has converted these factors into units similar to those presented in the AP-42. Uncontrolled
emissions from the tail gas are given as a range from 20 to 40 pounds of NOx emitted per ton of
100 percent HNO3 produced and 0.02 to 0.2 pounds of NH3 emitted per ton of 100 percent HNO3
produced. The revised uncontrolled emission factor in the revised AP-42 is 57 pounds of NOx
emitted per ton of 100 percent HNO3 produced; NH3 emissions are not given. The uncontrolled

22
emissions in this reference (15) are lower than those reported in the revised AP-42. Since
Reference 15 does not provide the raw test data used in developing these emission factors, the
uncontrolled NOx emission factor in the revised AP-42 will remain unchanged. For this same
reason, none of the NH3 emission factors will be added to the revised AP-42.
The catalytic reduction and extended aborption NOx emission factors in the revised AP-42
fall within the ranges specified by Reference 15. However, since no raw test data are provided to
support the emission ranges, the revised AP-42 will remain unchanged. Reference 15 did not
specify whether the emissions resulted from a single-stage or dual-stage pressure process.
Reference 16: Control of Air Pollution from Nitric Acid Plants.
The 1980 AP-42 has this reference noted to be the source of the emission factor for
hydrogen fueled catalytic reduction, natural gas/hydrogen fuel catalytic reduction, and a high
strength acid plant. EPA performance tests on four nitric acid plants are used to provide results
of NOx emissions testing. It is unclear from this reference whether the reported emissions occur
before or after a control device. It is also unclear what type of control device may be present.
The emissions are given in parts per million by volume (ppmv). Since no stack gas flow rate is
provided, there is no way of converting ppmv to pounds per ton (lb/ton) or kilogram per
megagram (kg/Mg). Emissions in the 1980 AP-42 are given in these later units. It cannot be
verify whether these emission values are the same as thoseing appear in the 1980 AP-42.
Reference 17: Atmospheric Emissions from Nitric Acid Manufacturing Process.
The 1980 AP-42 has this reference noted to be the source of the emission factors for
uncontrolled systems, hydrogen fueled catalytic reduction, natural gas/hydrogen fuel catalytic
reduction, and a high strength nitric acid plant.
Uncontrolled. Twelve plants were tested to provide uncontrolled NOx emissions data from
a single-stage pressure process. The average emission factor calculated the results of these
tests is 57 pounds of NOx emitted per ton of 100 percent HNO3 produced with a range
from 33 to 110 pounds per ton. The average production rate is 229 tons of HNO3

23
produced per day, with a range from 55 to 750 tons per day at an average rated capacity of
97 percent with a range from 72 to 100 percent. This uncontrolled emission factor will
replace the 1980 AP-42 uncontrolled emission factor. However, the emission factor rating
will be lowered to an "E" rating.
Hydrogen fueled Catalytic Reduction. Three plants were tested for NOx emissions from
hydrogen fueled catalytic incinerators in a single-stage pressure process. One of the
plant's results was not included in the average emission factor calculation. This plant's
emissions were extremely high when compared to the other facilities which were tested on
catalytic incineration. The 1980 AP-42 also excluded this plant's results. The revised AP-
42 will leave this emission factor unchanged. However, the emission factor rating will be
lowered to an "E" since there are no raw source test data to support the emission factor.
The emission factor is based on data from two plants with an average production rate of
160 tons of 100 percent HNO3 produced per day with a range of 120 to 209 tons per day at
an average rated capacity of 98 percent (range of 95 to 100). The average absorber exit
temperature is 85BF (29BC) with a range from 78 to 90BF and the average exit pressure is 85
psig (range of 80 to 94).
Natural gas/hydrogen fueled Catalytic Reduction. This emissions data was not included in
the 1980 AP-42. Six plants were tested for NOx emissions from natural gas/hydrogen
fueled catalytic reduction in a single-stage pressure process. These tests were performed
prior to the initiation of New Source Performance Standards (NSPS). Reference 18
provides NOx emissions data for both single-stage and dual-stage pressure processes that
were gathered after the initiation of NSPS. Testing performed after NSPS implementation
will provide more accurate and detailed data. For this reason, the emissions from this
reference will not be used to revise the AP-42 factors.
High Strength Acid Plant. A single unit was tested at a high strength acid plant for NO2
emissions. The production rate was 3000 pounds of HNO3 produced per hour (1.5 tons per
hour) at a 100 percent rated capacity, of 98 percent nitric acid. The NO2 emission factor
reported is 5 pounds of NO2 emitted per 1000 pounds of 100% HNO3 produced. This
factor has been converted to units of pounds per ton and kilograms per megagram in AP-

24
42. The AP-42 emission factor will remain unchanged. However, since there are no raw
test data given to support this factor, the emission factor rating will be lowered to an "E".
This reference also provides emissions information for natural gas fueled catalytic
reduction. However, the authors of the 1980 AP-42 chose not to include these emissions in
developing the 1980 emission factors; instead, Reference 18, taken from the 1980 AP-42,
provided the necessary emissions. It is uncertain why the emission factors contained in
Reference 17 were not included. An assumption can make based upon the fact that since the
testing was performed prior to NSPS, the authors assumed that testing data gathered after NSPS
was initiated would provide more valid information to develop emission factors. Reference 18,
taken from the 1980 AP-42, provides testing data completed after the initiation of NSPS.
Emissions occuring after the NSPS should be better controlled than those occuring prior to the
NSPS. For these reasons, the natural gas fueled catalytic reduction emission factor was left
unchanged in the 1992 AP-42.
Reference 18: A Review of Standards of Performance for New Stationary Sources-Nitric Acid
Plants.
The 1980 AP-42 lists this reference as providing emissions information for uncontrolled
processes as well as natural gas fueled catalytic reduction, extended absorption, and chilled
absorption with a caustic scrubber for nitric acid manufacturing processes. The following is a
detailed description of the information available from this reference.
Uncontrolled. The uncontrolled emission factor given in the 1980 AP-42 is noted to
originate from this reference. However, after reviewing this reference, PES could not
verify that the emissions in the 1980 AP-42 originated from information contained in
Reference 18. The only discussion on uncontrolled emissions provides a sentence stating
a range of NOx emissions from 20 to 28 kilograms of NOx emitted per megagram of 100
percent HNO3 produced. No further information is provided. For this reason, the
uncontrolled emission factor presented in the revised AP-42 will be taken from Reference
17 of this report.

25
Natural Gas fueled Catalytic Reduction. The fuel for the catalytic incinerator is assumed
to be natural gas as implied by this reference. Seven plants were tested for NOx emissions.
The average production rate was 341 tons of 100 percent HNO3 produced per day with a
range of 55 to 1077 tons per day. The emission factor in the 1992 AP-42 will remain the
same; however, the emission factor rating will be lowered to an "E" since there are no raw
test data provided for evaluation.
Extended Absorption. The extended absorption emission factor in the 1980 AP-42 is
noted to originate from this reference. Five single-stage pressure process plants and three
dual-stage pressure process plants were tested for NOx emissions. The 1980 AP-42 did not
differentiate between the two processes. The number of plants tested were noted
incorrectly in the 1980 AP-42. The emission factor in the revised AP-42 will be corrected
to reflect the two different processes. The single-stage pressure process plants had an
average production rate of 542 tons of 100 percent HNO3 produced per day with a range
from 209 to 1049 tons per day. The dual-stage pressure process plants had an average
production rate of 586 tons of 100 percent HNO3 per day with a range from 315 to 937
tons per day. Since no raw test data is provided, the emission factors will be given a rating
of "E".
Chilled Absorption with Caustic Scrubber. One plant was tested for NOx emissions from a
chilled absorption system with a caustic scrubber. This single-stage pressure process had a
production rate of 692 tons of 100 percent HNO3 produced per day. The emission factor
will be added to the revised AP-42, and it will be given an emission factor rating of "E"
since there are no raw test data available for review.
4.2 CRITERIA POLLUTANT EMISSIONS DATA
No data on emissions of volatile organic compounds, lead, sulfur dioxide, carbon
monoxide, or particulate matter were found nor expected for the nitric acid process. The
remaining criteria pollutant, nitrogen oxide, is discussed below.
Nitrogen oxides.

26
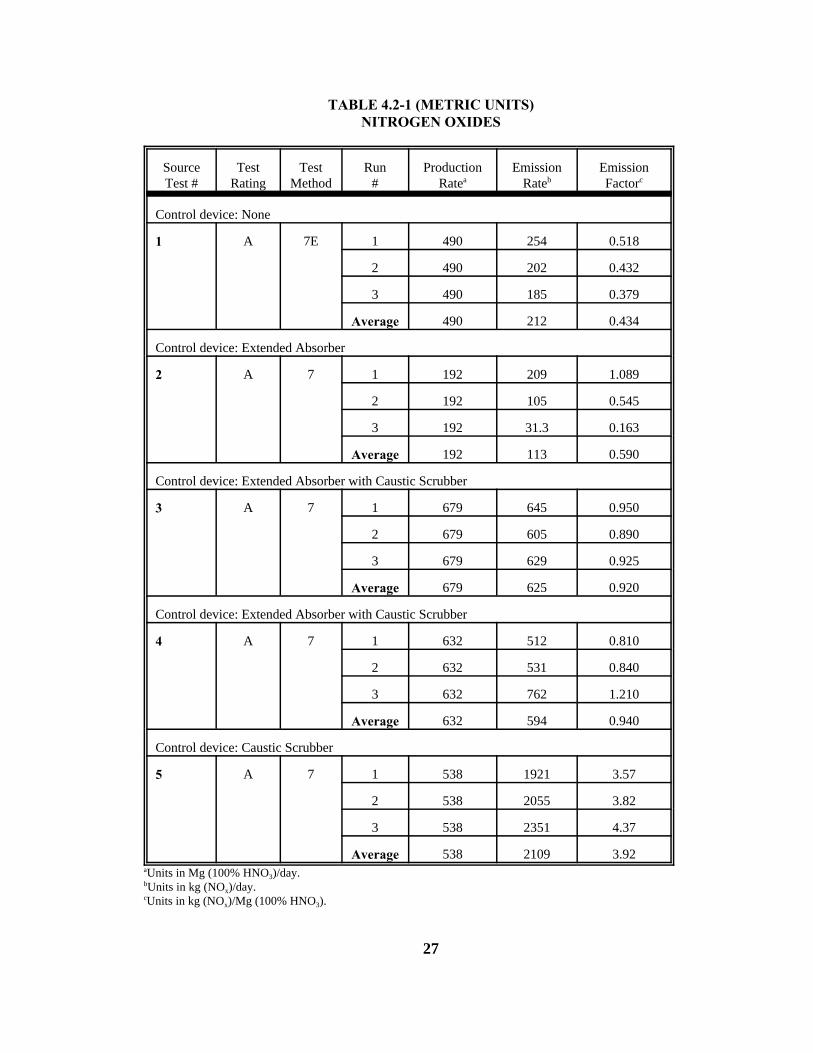
Fourteen source tests were received to update the AP-42 section. Only five tests contained
sufficient information to qualify as valid reports. The other nine were omitted due to various
reasons; no production data, no EPA sampling method specified or no process description. One
of the valid source tests which had no control device contained lower emission factors than any
of the other tests with control devices. After careful review, PES could not conclude why these
factors were lower without any additional information. Emission data for the five source tests can
be seen in Table 4.2-1, but were not used to revise existing emission factors since these tests may
not be representative of the entire industry. Further details on all of these tests can be found in
Chapter 4.1 of this report.
After careful evaluation of the existing emission factors for NOx in the 1980 AP-42, PES
concluded that several emission factors needed to be corrected. The uncontrolled emission
factor, the natural gas/hydrogen combination fuel for catalytic reduction emissions, and the
extended absorption emisson factor were corrected. The emission factor footnotes were
corrected for each of the emission sources. For additional details on how all of these corrections
were made, please see Chapter 4.1 of this report under the discussion for References 16, 17, and
18.
27
TABLE 4.2-1 (METRIC UNITS)NITROGEN OXIDES
SourceTest #
TestRating
TestMethod
Run#
ProductionRatea
EmissionRateb
EmissionFactorc
Control device: None
1 A 7E 1 490 254 0.518
2 490 202 0.432
3 490 185 0.379
Average 490 212 0.434
Control device: Extended Absorber
2 A 7 1 192 209 1.089
2 192 105 0.545
3 192 31.3 0.163
Average 192 113 0.590
Control device: Extended Absorber with Caustic Scrubber
3 A 7 1 679 645 0.950
2 679 605 0.890
3 679 629 0.925
Average 679 625 0.920
Control device: Extended Absorber with Caustic Scrubber
4 A 7 1 632 512 0.810
2 632 531 0.840
3 632 762 1.210
Average 632 594 0.940
Control device: Caustic Scrubber
5 A 7 1 538 1921 3.57
2 538 2055 3.82
3 538 2351 4.37
Average 538 2109 3.92aUnits in Mg (100% HNO3)/day.bUnits in kg (NOx)/day.cUnits in kg (NOx)/Mg (100% HNO3).

28
TABLE 4.2-1 (ENGLISH UNITS)NITROGEN OXIDES
SourceTest #
TestRating
TestMetho
d
Run#
ProductionRatea
EmissionRateb
EmissionFactorc
Control device: None
1 A 7E 1 540 558.9 1.035
2 540 446.0 0.863
3 540 408.8 0.757
Average 540 468.2 0.867
Control device: Extended Absorber
2 A 7 1 212 461.5 2.177
2 212 230.9 1.089
3 212 69.1 0.326
Average 212 249.9 1.179
Control device: Extended Absorber with Caustic Scrubber
3 A 7 1 749 1423 1.90
2 749 1333 1.78
3 749 1386 1.85
Average 749 1378 1.84
Control device: Extended Absorber with Caustic Scrubber
4 A 7 1 697 1129 1.62
2 697 1171 1.68
3 697 1680 2.41
Average 697 1310 1.88
Control device: Caustic Scrubber
5 A 7 1 593 4234 7.14
2 593 4530 7.64
3 593 5183 8.74
Average 593 4649 7.84aUnits in tons (100% HNO3)/day.bUnits in lb (NOx)/day.cUnits in lb (NOx)/ton (100% HNO3).

29
4.3 NONCRITERIA POLLUTANT EMISSIONS DATA
Hazardous Air Pollutants.
Hazardous Air Pollutants (HAPs) are defined in the 1990 Clean Air Act Amendments. No
data on emissions of these pollutants were found for the nitric acid process.
Global Warming Gases.
Pollutants such as methane, carbon dioxide, and NO have been found to contribute to
overall global warming. Nitrogen oxide can be classified within the NOx category; however, no
information was provided to distinguish the percent of NO contained in the NOx data. Fourteen
source tests were received for review to update AP-42 emission factors. These tests provided
NOx emissions data. Five of these tests contained enough data to use as valid source tests. The
results of these tests can be seen in Table 4.2-1 in Chapter 4.2 under the NOx section.
One of the valid source tests, Reference 2, also provided CO2 emissions data. The other
four tests stated that no CO2 emissions were present. For details on how CO2 emissions were
calculated, see Chapter 4.1 under the Reference 2 discussion. The CO2 emissions can be found
in Table 4.3-1. One test does not provide sufficient data to establish emission values which are
characteristic of the nitric acid industry.

30
TABLE 4.3-1 (METRIC UNITS)CARBON DIOXIDE
SourceTest #
TestRating
TestMethod
Run#
ProductionRatea
EmissionRateb
EmissionFactorc
Control device: Extended Absorption
2 A 7 1 192 16264 84.7
2 192 19574 102
3 192 22415 117
Average 192 19418 101
aUnits in Mg (100% HNO3)/day.bUnits in kg (CO2)/day.cUnits in kg (CO2)/Mg (100% HNO3).
TABLE 4.3-1 (ENGLISH UNITS)CARBON DIOXIDE
SourceTest #
TestRating
TestMethod
Run#
ProductionRatea
EmissionRateb
EmissionFactorc
Control device: None
2 A 7 1 212 35856 169
2 212 43152 203
3 212 49416 233
Average 212 42808 202
aUnits in tons (100% HNO3)/day.bUnits in lb (CO2)/day.cUnits in lb (CO2)/ton (100% HNO3).

31
Ozone Depletion Gases.
Chlorofluorocarbons have been found to contribute to ozone depletion. No data on
emissions of these pollutants were found for the nitric acid process.
4.4 DATA GAP ANALYSIS
None of the emission factors in the AP-42 is based on primary source test data.
Consequently, the emission factor ratings have been lowered to an "E". After review of the
references used to create the AP-42 emissions, the emission factors have been redefined to reflect
the nitric acid process more effectively. Although more definition has been given to the factors,
more testing is necessary to determine if the values are indeed correct.
Three tests recieved to update the AP-42 utilized extended absorption for the control
device. The emission factors calculated from these tests are below the emission factors specified
in the revised AP-42. It seems that the AP-42 emission factors are valid for the extended
absorption process. One test received used a caustic scrubber to control emissions from the tail
gas. There is no emission factor in the AP-42 to compare its results. Only one test was received
which contained no control device on the tail gas stream. This test provides surprising results in
that its emission factor has the same magnitude of those facilities utilizing control devices.
Without further information, it cannot be determined why these results occured.

32
4.5 REFERENCES FOR CHAPTER 4
1. Oxides of Nitrogen Emissions Test Report. La Roche Industries, Inc., Cherokee, AL.Sanders Engineering & Analytical Services, Inc., Mobile, AL. December 1990.
2. Source Test Report. Bison Nitrogen Products Company, Woodward, OK. Moutrey &Associates, Inc., Oklahoma City, OK. October 1978.
3. Source Test Report. Agrico Chemical Company, The Verdigris Plant, Catoosa, OK. May1980.
4. Source Test Report. Agrico Chemical Company, The Verdigris Plant, Catoosa, OK.November 1976.
5. Source Test Report. Agrico Chemical Company, The Verdigris Plant, Catoosa, OK. June1976.
6. Source Test Report. Bison Nitrogen Products Company, Woodward, OK. Moutrey &Associates, Inc., Oklahoma City, OK. November 1978.
7. Source Test Report. J.R. Simplot Company, Helm, CA. Petro Chem EnvironmentalServices, Bakersfield, CA. July 1987.
8. Source Test Report. J.R. Simplot Company, Helm, CA. Pape & Steiner EnvironmentalServices, Bakersfield, CA. April 1990.
9. Source Test Summary. Air Products & Chemicals, Inc., Facility source ID: 1OPEN57000422, Pensacola, FL. Department of Environmental Regulation, Air PollutantInformation System, Master Detail Report, Santa Rosa County, FL. April 7, 1992.
10. Source Test Summary. Air Products & Chemicals, Inc., Facility source ID: 1OPEN57000423, Pensacola, FL. Department of Environmental Regulation, Air PollutantInformation System, Master Detail Report, Santa Rosa County, FL. April 7, 1992.
11. Source Test Summary. Monsanto Company, Facility source ID: 1OPEN17004042,Pensacola, FL. Department of Environmental Regulation, Air Pollutant InformationSystem, Master Detail Report, Escambia County, FL. April 10, 1992.
12. Emissions Summary. J.R. Simplot Company, Don Siding, ID. February 1990.
13. Emissions Summary. J.R. Simplot Company, Don Siding, ID. May 1990.
14. Emissions Summary. J.R. Simplot Company, Don Siding, ID. July 1990.
15. Handbook of Emission Factors, Parts I and II, Ministry of Housing, Physical Planning andEnvironment, The Netherlands, 1980/1983.
16. Control of Air Pollution from Nitric Acid Plants, Office of Air Quality Planning andStandards, U.S. Environmental Protection Agency, Research Triangle Park, NC. August1971. Unpublished.

33
17. Atmospheric Emissions from Nitric Acid Manufacturing Processes, 999-AP-27, U.S.Department of Health, Education, and Welfare, Cincinnati, OH. 1966.
18. Marvin Drabkin, A Review of Standards of Performance for New Stationary Sources -Nitric Acid Plants, EPA-450/3-79-013, U.S. Environmental Protection Agency, ResearchTriangle Park, NC. March 1979.

34
TABLE 4-4.LIST OF CONVERSION FACTORS
Multiply: by: To obtain:
mg/dscm 4.37 x 10⁻⁴ gr/dscf
m2 10.764 ft2
acm/min 35.31 acfm
m/s 3.281 ft/s
kg/hr 2.205 lb/hr
kPa 1.45 x 10⁻¹ psia
kg/Mg 2.0 lb/ton
Mg 1.1023 ton
l 1000 m3
mg 1000 g
metric ton 0.001 kg
Temperature conversion equations:
Fahrenheit to Celsius:
EC '(EF&32)
1.8
Celsius to Fahrenheit:
EF ' 1.8(EC) % 32

35
APPENDIX A.
AP-42 SECTION 5.9.
[Not presented here. See instead current AP-42 Section 8.8.]