Embed Size (px)
Citation preview

Anyone’s GuessThe Need for Nutrition Labeling at
Fast-Food and Other ChainRestaurants
?
?
?
? ? ?Center for Science in the Public Interest
$7 USA / $10 CAN
Table of Contents
Summary . . . . . . . . . . . . . . . . . . . . . . . . . . . . . . . . . . . . . . . . . . . . . . . . . . . . . . . . . . . 1
The Importance of Food Choices to Health . . . . . . . . . . . . . . . . . . . . . . . . . . . . . . . 3
Americans’ Eating Habits . . . . . . . . . . . . . . . . . . . . . . . . . . . . . . . . . . . . . . . . . . . . . 4
Eating Out Trends . . . . . . . . . . . . . . . . . . . . . . . . . . . . . . . . . . . . . . . . . . . . . . . . . . . . 5
Impact of Restaurant Foods on Americans’ Diets . . . . . . . . . . . . . . . . . . . . . . . . . . 5
Nutritional Quality of Restaurant Foods . . . . . . . . . . . . . . . . . . . . . . . . . . . . . . . . . . 7
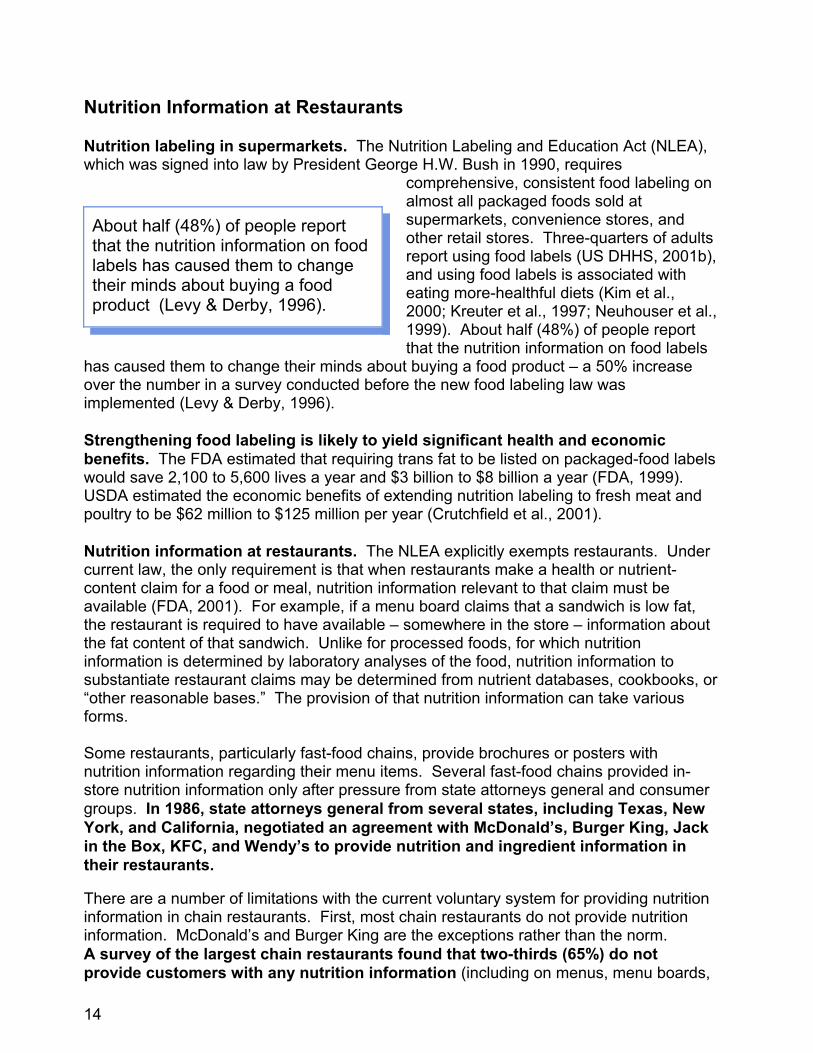
Nutrition Information at Restaurants . . . . . . . . . . . . . . . . . . . . . . . . . . . . . . . . . . . 14
Recommendations . . . . . . . . . . . . . . . . . . . . . . . . . . . . . . . . . . . . . . . . . . . . . . . . . . 16
References . . . . . . . . . . . . . . . . . . . . . . . . . . . . . . . . . . . . . . . . . . . . . . . . . . . . . . . . 18
Appendix A: Examples of Restaurants that Provide Nutrition Information on the Internet . . . . . . . . . . . . . . . . . . . . . . . . . . . . . . . . . . . . . . . . . . . . . . . . . . . . . . 22
Model Menus . . . . . . . . . . . . . . . . . . . . . . . . . . . . . . . . . . . . . . . . . . . . . . . . . . . . . . . 23
For more information or model legislation, please contact:Dr. Margo G. Wootan
Center for Science in the Public Interest1875 Connecticut Avenue, NW, Suite 300
Washington, DC 20009phone: 202-777-8352
fax: 202-265-4954email: [email protected]
November 2003
Anyone’s Guess is available online (free of charge) at www.cspinet.org/restaurantreportor by mailing a check for $7 ($10 in Canada) to CSPI at the above address.

1
“Despite nutritional gains at home,Americans will find it difficult toimprove their diets because theypurchase so many meals outsidethe home,” U.S. Department ofAgriculture (Lin et al., 1999).
Summary: Nutrition Labeling at Fast-Food and Other ChainRestaurants
n Obesity is one of the greatest public health challenges of our time.
b Obesity rates in adults doubled over the last twenty years. Currently, two-thirds of American adults (65%) are overweight or obese. Obesity rates havedoubled in children and tripled in teens over the past two decades.
b Obesity costs American families, businesses, and governments about$117 billion each year in health-care and related costs.
b The negative health consequences of obesity already are evident. Between1990 and 2001, diabetes rates rose by 60%. Type 2 diabetes can no longer becalled “adult onset” because of rising rates in children.
n Only 12% of Americans eat a healthy diet according to the U.S. Department ofAgriculture’s (USDA) Healthy Eating Index. Between 1978 and 1995, the averageperson’s calorie intake increased by 167 calories, from 1,876 to 2,043 calories.
n The 1990 Nutrition Labeling and EducationAct (NLEA) requires food manufacturers toprovide nutrition information on nearly allpackaged foods. However, NLEA explicitlyexempts restaurants. At most restaurants,people can only guess the nutritional contentof the food.
b Yet, Americans are increasinglyrelying on restaurants to feed themselves and their families. In 1970, Americansspent just 26% of their food dollars on restaurant meals and other foods preparedoutside their homes. Today, we spend almost half (46%) our food dollars onaway-from-home foods. The average American consumes about one-third of hisor her calories from foods from restaurants and other food-serviceestablishments.
n Increases in Americans’ caloric intake over the past two decades are due in part toincreases in the frequency of eating out. Studies have found a positive associationbetween eating out and higher caloric intakes and higher body weights. Children eatalmost twice as many calories when they eat a meal at a restaurant (770 calories) as athome (420 calories).

2
The U.S. Surgeon General’s “Call toAction” to reduce obesity recommended:“increase availability of nutritioninformation for foods eaten and preparedaway from home” (2001).
n The nutritional quality of restaurant foods and meals varies widely, and a range ofoptions is usually available. However, without nutrition information, it can be difficult tocompare options and make informed decisions. Americans rank nutrition second onlyto taste in determining their food purchases. Studies show that estimating the calorieand fat content of restaurant foods is difficult.
n Foods that people eat from restaurants and other food-service establishments aregenerally higher in nutrients for which over-consumption is a problem (like fat andsaturated fat) and lower in nutrients that people need to eat more of (like calcium andfiber) as compared to home-prepared foods.
n It is not uncommon for a restaurantentree to provide half of a day’scalories, saturated and trans fat, orsodium. Include an appetizer, drinkand dessert, and it is easy to consumea whole day’s calories, saturated andtrans fat, and sodium in a single meal.
n Portion sizes at restaurants are often large, pricing can make larger serving sizesmore appealing, and studies show that people tend to eat greater quantities of foodwhen they are served more.
n The current system of voluntary labeling at restaurants is inadequate given the largerole that restaurant foods play in Americans’ diets. Approximately two-thirds of thelargest chain restaurants do not provide any nutrition information about their foods totheir customers.
Recommendation: Congress and/or state or local legislatures should requirefood-service chains with ten or more units to list on their menus the calorie,saturated and trans fat (combined), and sodium contents of standard menu items. Restaurants that use menu boards, where space is limited, should be required toprovide at least calorie information on their menu boards. While listing othernutrition information could help consumers make healthier choices, calorie, saturatedand trans fat, and sodium information is most needed, given that cardiovasculardiseases are the leading causes of death and obesity rates are rising rapidly. Suchinformation, clearly displayed at the point of decision, would allow consumers to makeinformed choices at restaurants and is an important strategy for reducing obesity andprotecting the nation’s health.

3
Obesity costs American families,businesses and governments about$117 billion in health-care and relatedcosts each year (U.S. Department ofHealth and Human Services, 2001).
The Importance of Food Choices to Health
Unhealthy diets and physical inactivity are leading causes of premature death,disabilities, and high health-care costs in the United States. According to the U.S.Department of Health and Human Services (DHHS), poor diets, along with physicalinactivity, cause about 310,000 to 580,000 premature deaths each year (Table 1;McGinnis & Foege, 1993). That is five times the number of people killed by guns, AIDS,and drug use combined.
Table 1: Leading Contributors to Premature Death (deaths per year)
Diet and Physical Inactivity 310,000 - 580,000
Tobacco 260,000 - 470,000
Alcohol 70,000 - 110,000
Microbial Agents 90,000
Toxic Agents 60,000 - 110,000
Firearms 35,000
Sexual Behavior 30,000
Motor Vehicles 25,000
Unhealthy eating is a major cause of obesity, heart disease, cancer, stroke, diabetes,high blood cholesterol, high blood pressure, osteoporosis, tooth decay and other healthproblems. Poor diet can result in disabilities and loss of independence from stroke,heart disease or osteoporosis-related hip fracture, or blindness and limb amputationsdue to diabetes.
Obesity is one of the greatest healthchallenges of our time. Rates are increasing rapidly in both adultsand children. Obesity rates in adultsdoubled over the last twenty years (Flegalet al., 2002). Currently, two-thirds ofAmerican adults (65%) are overweightor obese. Obesity rates have doubled inchildren and tripled in teens over the past two decades (Ogden et al., 2002). Obesity costsAmerican families, businesses, and governments about $117 billion in health-care andrelated costs each year (US DHHS, 2001).

4
Ava
ilabl
e C
alor
ies
(per
cap
ita)
1970 1983 1994
The negative health consequences of obesity already are evident. Between 1990 and 2001,diabetes rates rose by 60% (Mokdad et al., 2003). Type 2 diabetes can no longer be called“adult onset” because of rising rates in children. In one study, the incidence of type 2diabetes in adolescents increased ten-fold between 1982 and 1994 (Pinhas-Hamiel et al.,1996). Employers pay an average of $4,410 more per year for employee beneficiaries whohave diabetes than for beneficiaries who do not have diabetes (Ramsey et al., 2002), andthe federal government spends $14.5 billion a year on diabetes through Medicare andMedicaid (NIH, 2000).
Americans’ Eating Habits
According to the U.S. Department of Agriculture (USDA), though “Americans’ eatingpatterns, as measured by the Healthy Eating Index, have slightly but significantly improvedsince 1989...the diets of most Americans still need improvement” (Bowman et al., 1998). Only 12% of Americans eat a healthy diet (i.e., a diet consistent with federal nutritionrecommendations) (Bowman et al., 1998). Less than 1/3 of Americans meet dietaryrecommendations for grains (22%), fruits (17%) and vegetables (31%) (Bowman et al.,1998), and our diets are too high in saturated fat, added sugars, sodium, and calories. Only2% of children eat a healthy diet (Munoz et al., 1997). Children’s diets generally are toohigh in fat, saturated fat, and sodium and too low in fiber (Lin et al., 1996).
Between 1978 and 1995, average calorie intake increased by 167 calories per day,from 1,876 to 2,043 calories according to national nutrition surveys (Lin et al., 1999). Note, however, that self-reported intake data underestimates calorie consumption. Foodsupply data, which overestimate calorie intake but provide reliable time-trend data, alsoshow that Americans are eating more calories. From 1970 to 1983, the number of availablecalories was relatively stable at about 3,200 to 3,300 calories per person per day (Putnam &Allshouse, 1999). Then, it started to increase. In 1994, there were 3,800 caloriesavailable for each person per day, which is 1,800 calories more than a sedentary adultneeds.
Calories Available in Food Supply
3,800 calories available

5
Consumption of Away-from-home Foods Has Doubled
Eating Out Trends
Restaurant foods are an increasingly important part of Americans’ diets. In 1970,Americans spent just 26% of their food dollars on restaurant meals and other mealsprepared outside their homes (Lin et al., 1999). Today, we spend almost half (46%) ourfood dollars at restaurants (NRA, 2002). Almost half (44%) of adults patronize a restauranton any given day (Ad Age, 2001).
On average, Americans (age 8 and older) eat 218 restaurant meals per year (NRA, 2002). Although people with higher incomes eat out more often than those with lower incomes,people with household incomes below $15,000 per year eat out 3.2 meals per week(compared to 4.9 restaurant meals per week for people with household incomes over$75,000 per year) (Ebbin, 2000).
Reasons why Americans are eating out more frequently include higher incomes, moreaffordable and convenient fast-food outlets, increased marketing by restaurants, morewomen working outside the home, and more two-earner households (Lin et al., 1999).
Impact of Restaurant Foods on Americans’ Diets
In the past, when eating out was an occasional treat, few had to worry about the nutritionalquality of restaurant foods. Today, however, restaurant foods make up a sizeableproportion of the American diet. Over the last two decades, meals and snacks fromrestaurants and other food-service establishments have increased by almost 70%, from16% of meals and snacks in 1978 to 27% in 1995 (Lin et al., 1999). According to USDA,away-from-home food provided 34% of total calories in 1995, compared to 18% ofcalories in 1978 (Lin et al., 1999).

6
Children eat almost twice as manycalories when they eat at arestaurant (770 calories) comparedto at home (420 calories) (Zoumas-Morse et al., 2001).
Increases in Americans’ caloric intake over the past two decades may be due in part toincreases in eating out (Lin et al., 1999). Children eat almost twice as many calorieswhen they eat at a restaurant (770 calories) compared to at home (420 calories)(Zoumas-Morse et al., 2001). One study foundthat women who eat out more often (more than 5times a week) consume 288 more calories eachday than women who eat out less often (Clemenset al., 1999). (Despite eating more calories, thewomen did not consume more of beneficialnutrients such as calcium or fiber.) Fast-foodmeals also are linked to eating more calories,more saturated fat, fewer fruits and vegetables,and less milk (French et al., 2001; Jeffery &French, 1998; McNutt et al., 1997).
Although away-from-home foods make up 27% of meals and snacks, as noted above, theyprovide 34% of calories. This suggests that when people eat out, they either eat largerquantities of food, higher-calorie foods, or both than when eating at home (Lin et al., 1999). Several, though not all (French et al., 2001), studies have found a positive associationbetween eating out and body weight or body fatness (Binkley et al., 2000; Jeffery &French, 1998; Ma et al., 2003; McCrory et al., 2000; McCrory et al., 1999).
Foods that people eat from restaurants and other food-service establishments are generallyhigher in nutrients for which over-consumption is a problem (like fat and saturated fat) andlower in nutrients that people need to eat more of (like calcium and fiber) as compared tohome-prepared foods (Lin et al., 1999; Clemens et al., 1999; Jeffery & French, 1998; Ma etal., 2003; McCrory et al., 1999). The foods that children eat from fast-food and otherrestaurants also are higher in fat and saturated fat and lower in fiber, iron, calcium,and cholesterol than foods from home (Lin et al., 1996; Zoumas-Morse et al., 2001).
Although many Americans have made nutritional improvements to their diets over thepast 20 years, the improvements have been smaller for away-from-home foods thanfor home-prepared foods (Lin et al., 1999). For example in 1978, the total fat content offoods was the same for home-prepared and away-from-home foods (41% of calories). In1995, the fat content of home-prepared foods dropped to 31.5% of calories compared to37.6% of calories for foods eaten from restaurants and other food-service establishments(Lin et al., 1999). In 1995, Americans’ average saturated-fat intake from home foods was10.9% of calories, compared with 12.5% of calories from restaurants and 13.8% of caloriesfrom fast-food establishments (Lin et al., 1999).
Over the last two decades, calcium intake from foods prepared at home increased (from 402mg to 425 mg per 1,000 calories). In contrast, the calcium density from away-from-homefoods decreased (from 368 mg to 343 mg per 1,000 calories) (Lin et al., 1999). Home-prepared foods also provide more fiber (8.1 g/ 1,000 cal) than fast foods (5.6 g/1,000 cal)and other restaurant foods (6.2 g/1,000 cal) (Lin et al., 1999).

7
“Foods prepared at home are generallymuch more healthful than away-from-home foods,” USDA (Lin et al., 1999).
Nutritional Quality of Restaurant Foods
Restaurant foods are often 1) high in calories, saturated and trans fat, and sodium,2) served in large portions, and 3) priced in a way that makes larger serving sizesmore appealing. In addition, “away-from-home foods are typically ready-to-eat andconsumed ‘as is,’ and the consumer hasless control over or knowledge of theirnutritional content” (Lin et al., 1999).
Nutritional quality of popular restaurantfoods. According to studies conducted by the Center for Science in the Public Interest(CSPI) and nutrition information obtained from restaurants (Jacobson & Hurley, 2002), it isnot uncommon for restaurant meals to provide half a day’s to a whole day’s worth of calories(1,100 to 2,350 calories) (Table 2).
Restaurant appetizers can use up half a day’s calories before people even get to their meal. Buffalo wings with blue cheese dressing (1,010 calories) and stuffed potato skins with sourcream (1,260 calories) each provide about a half a day’s calories. No one would mistakecheese fries with ranch dressing for a health food, but few would guess that a typical servinguses up more than a whole day’s worth of calories (3,010 calories).
Restaurant Foods Can Be High in Calories
Carrot Cake from Cheese Fries Cheesecake Factory
3,010 calories 1,560 calories

8
Table 2: Restaurant Foods Can Be High in Calories, Saturated and Trans Fat and Sodium*
Calories Saturatedand Trans
Fat (g)
Sodium(mg)
AppetizersBuffalo Wings (12 wings, 13 oz.) with Blue Cheese DressingStuffed Potato Skins (8 skins, 12 oz.) with Sour Cream (5 Tb.)Cheese Fries (4 cups, 27 oz.) with Ranch Dressing (8 Tb.)
7001,0101,1201,2602,3803,010
162240487991
1,7502,4601,2701,3004,0204,890
DrinksMcDonald’s Coca-Cola, Super Size (42 oz.)7-Eleven Double Gulp, Coca-Cola (64 oz.)Dunkin’ Donuts Coolatta, Made with Cream, Large (32 oz.)McDonald’s Shake, Large (32 oz.)
410600820
1,010
00
22†
19†
4060
144
530
Entrees/MealsFrench Toast (3 slices) with Syrup (¼ cup) and MargarineSchlotzsky’s Chicken Breast Sandwich, Light & Flavorful (Large, 29 oz.)House Lo Mein (4½ cups)Spaghetti with Meatballs (3½ cups)Dinner House Mushroom Cheeseburger with Onion Rings (11 rings)Grand Slam-type Platter (2 Scrambled Eggs, 2 Pancakes with Syrup and Margarine, 2 Sausage Links and 2 Strips of Bacon)Fried Seafood Combo Platter (with 4 Tb. Tartar Sauce, Fries, Coleslaw and 2 Biscuits with Butter [2 Pats])Burger King Double Whopper with Cheese Value Meal, King Size (with King Fries and King Coca-Cola Classic)
910
1,010
1,0601,160
9001,8001,010
2,170
2,180
13
4†
7†
10†
285219
39
48
1,030
4,520
3,4602,2101,0702,1301,770
4,390
2,600
DessertCinnabon Classic (7½ oz.)Fudge Brownie Sundae (10 oz.)Cheesecake Factory Carrot Cake (1 slice)
6701,1301,560
1430
23†
800400520
Note: Recommended daily limits for a 2,000 calorie diet are 20 grams of saturated fat and 2,400 mg ofsodium.
*Jacobson & Hurley, 2002. †Includes only saturated fat.

9
>Drinks Can Pack the Calories of a Meal
Large Shake at McDonald’s (42 oz.) Hamburger (280 calories) 1,010 calories French Fries, small (210 calories)
Coca-Cola Classic, small (150 calories) 640 calories total
Drinks can pack the calories of a meal. A large shake from McDonald’s has1,010 calories. A large Dunkin’ Donuts Coolatta made with cream has 820 calories.
Restaurant entrees such as a large Schlotzsky’s Light and Flavorful chicken breastsandwich (1,010 calories), spaghetti with meatballs (1,160 calories), and French toastwith syrup and margarine (910 calories) each provide about a thousand calories, beforeadding side dishes. The calorie contents of whole meals are higher. A fried seafoodplatter has 2,170 calories. A king size Burger King Double Whopper with Cheese ValueMeal provides 2,180 calories.
Though people know that dessert is a splurge, many do not realize how many calories itcan add. A Cinnabon Classic has 670 calories, and just one slice of the CheesecakeFactory’s Carrot Cake has 1,560 calories.
Who Would Guess?
Tuna Salad Sandwich Roast Beef Sandwich with Mustard 720 calories 460 calories

10
Note: Recommended daily limits for a 2,000 calorie diet are 20 grams of saturated fat and 2,400 mg of sodium. *Jacobson & Hurley, 2002. †Includes only saturated fat.
The nutritional quality of restaurant foods and meals varies widely and a range ofoptions is usually available (Table 3). However, without nutrition information, it can bedifficult to compare options and make informed decisions. For example, Szechuan Shrimpand Kung Pao Chicken may look equally attractive at a Chinese restaurant until theircalories and saturated fat are revealed: 930 versus 1,620 calories and 2 versus 13 gramsof saturated fat. Without nutrition information, many may not realize that a tuna saladsandwich from a typical deli has 50% more calories and twice as much saturated fat as aroast beef sandwich with mustard. While most people probably know that the vegetable ofthe day is a healthier choice than an order of French fries, many may not realize that thefries contain ten times as many calories. Ordering a venti Caffe Mocha with whole milkinstead of a grande Caffe Latte with skim milk at Starbucks will more than triple the caloriesin your drink and add three-quarters of a day’s worth of saturated fat.
Table 3: Nutritional Quality of Restaurant Foods Vary Widely*
Menu Item Calories Saturated + Trans Fat (g)
Sodium(mg)
Entrees/MealsSzechuan Shrimp (3½ cups)Kung Pao Chicken (4½ cups)
9301,620
2†
13†2,4602,610
Grilled Chicken (6 oz.) with Baked Potato with Sour Cream (1 Tb.) and Vegetable (1 cup)Chicken Fingers (5 pieces, 9 oz.) with French Fries (2 cups) and Coleslaw (1 cup)
Roast Beef with Mustard Sandwich (9 oz.)Tuna Salad Sandwich (11 oz.)Overstuffed Tuna Salad with Mayo Sandwich (13 oz.)
640
1,640
460720980
5
30
48
11
820
2,640
9901,3201,310
Burger King SandwichesHamburgerChicken Whopper without Mayonnaise with MayonnaiseWhopperWhopper with CheeseDouble Whopper with Cheese
Dinner House Side DishesVegetable of the DayBaked Potato with Sour Cream (1 Tb.)French Fries (2 cups)Loaded Baked Potato (bacon, butter, cheese, etc.) Onion Rings (11)
StarbucksCaffe Latte with Skim Milk, Grande (16 oz.)Caffe Latte with Whole Milk, Grande (16 oz.)Caffe Mocha with Whole Milk, Whipped Cream, Grande (16 oz.)Caffe Mocha with Whole Milk, Whipped Cream, Venti (20 oz.)
310
420580760850
1,150
60310590620900
160270420530
6
36
153233
12
1219
23
1†
9†
13†
16†
580
1,2501,3701,0001,4301,530
15030
460570
1,050
220210190250

11
Table 4: Portion Sizes at Restaurants
Menu Item Serving Size CaloriesSoda Pop (Cola)FDA Official Serving12 oz. Can20 oz. BottleBurger King, King Size w/ Ice7-Eleven Double Gulp w/ Ice
1 cup (8 oz.)1½ cups (12 oz.) 2½ cups (20 oz.)4 cups of Soda (42 oz. cup)6 cups of Soda (64 oz. cup)
100150250430600
SteaksUSDA Official Serving (Sirloin)Dinner House Serving (Sirloin)Steak House Serving (Porterhouse)
3 oz.7 oz.20 oz.
220410
1,100
MuffinsFDA Official ServingRestaurant Serving
2 oz.4 oz.
160430
Portion sizes. The large portion sizes served at restaurants greatly affect the nutritionalquality of the foods and their impact on Americans’ diets and waistlines. It is common forrestaurants to serve two to three times more than what is considered a standardserving size (see Table 4). A Double Gulp from 7-Eleven contains six servings, meaning itprovides six times as many calories as would a standard serving size of soft drink. Aporterhouse steak from a typical steak house restaurant weighs more than a pound. According to USDA serving sizes, that is enough meat to serve a family of six. A typicalpastry from a sit-down restaurant is often twice as big as the Food and Drug Administration’s(FDA) standard serving size. Larger portions also mean higher saturated fat and sodiumnumbers.
Portion sizes have grown over time. In the 1950s, a “family size” bottle of Coke was26 ounces, while now a single-serve bottle is 20 ounces. McDonald’s original burger, fries,and 12-ounce Coke provided 590 calories. Today, a Super Size Value Meal that includes aQuarter Pounder with Cheese, Super Size Fries, and a Super Size Coke delivers 1,550calories. A typical bagel used to weigh 2 to 3 ounces, compared to 4 to 7 ounces today(Young & Nestle, 1995).
Although portion sizes started to increase in the 1970s, they grew sharply in the 1980s andhave continued to increase since then (Young & Nestle, 2002). This trend has occurred inparallel with increases in overall calorie intake, available calories in the food supply, and theprevalence of overweight and obesity (Young & Nestle, 2002).
Large portions are a problem not only because they provide more calories, but also becausestudies show that when adults and children are served more food, they eat more food(Booth et al., 1981; Orlet Fisher, et al., 2003; Rolls et al., 2000; Wansink, 1996; Young &Nestle, 2002).

12
Note: Recommended daily limits for a 2,000 calorie diet are 20 grams of saturated fat and 2,400 mg of sodium. *NANA, 2002. †Includes only saturated fat.
In addition, a national survey found that when people eat out, 67% report that they eat allof their entree either all or most of the time (AICR, 2001). Most restaurant owners believethat people generally do not share restaurant entrees. Rather, entrees are purchased forconsumption by individuals (Young & Nestle, 1995). Thus, the large portion sizes at fast-food and other restaurants likely contribute to overeating.
Portions and price. Food pricing can move people toward larger portions. For foodmanufacturers and restaurants, the actual monetary costs of larger portions are smallbecause the cost of the food itself is small (on average about 20% of retail costs)compared to marketing, labor, overhead, distribution, and other costs (Nestle, 2002). Thus, even the relatively small amounts of extra money consumers spend when upgradingto larger portions mean larger corporate profits. In addition, consumers perceive largerportions as better monetary values.
A national study found that a medium-sized movie-theater popcorn costs just 71 centsmore than the small. People may not realize that it also “costs” them 500 more caloriesand 24 extra grams of saturated and trans fat (Table 5; NANA, 2002). A Cinnabon Classiccosts 24% more than a Minibon, but it contains 123% more calories. Purchasing a DoubleGulp instead of a Gulp at 7-Eleven costs 37 cents more, but adds450 more calories. Restaurant customers often get many more calories and moresaturated fat and sodium for a small difference in price. Providing nutritioninformation on menus and menu boards would reveal the nutritional cost ofchoosing larger portions at restaurants.
Table 5: Portions and Price*
Menu Item ServingSize
Calories Saturated +Trans Fat (g)
AveragePrice ($)
Wendy’s Classic Double with Cheese Classic Double with Cheese Old Fashioned Combo Meal 2 (with Biggie Fries and Medium Cola)
11 oz. 7601,360
19†
26†3.324.89
McDonald’s French Fries Small Medium Large Super Size
2½ oz.5 oz.6 oz.7 oz.
210450540610
389
10
1.031.501.671.90
Movie Theater Popcorn without “Butter” Small Medium
7 cups16 cups
400900
1943
3.133.84
7-Eleven, Coca-Cola Classic Gulp Double Gulp
16 oz.64 oz.
150600
00
0.891.26
Cinnabon Minibon Cinnabon Classic
3 oz.
7 ½ oz.300670
514
2.012.49

13
The USDA concluded that “differences ininformation may also impede healthfuleating, in that the nutritional quality ofaway-from-home foods may be lessapparent to consumers than for food athome,” USDA (Lin et al., 1999).
Without nutrition information, it is difficult to estimate the caloric content ofrestaurant foods. Numerous studies show that people have a difficult time estimatingportion sizes, especially large portions(Young & Nestle, 1995). In addition, astudy published by the University ofMississippi found that peopleunderestimate the calorie content ofmeals purchased at restaurants(Johnson et al., 1990). A study conducted by the Center forScience in the Public Interest and NewYork University found that even well-trained nutrition professionals could not accurately estimate the calorie content of typicalrestaurant meals (Table 6; Backstrand et al., 1997). Although the dietitians were able toaccurately estimate the caloric content of a cup of whole milk (the control in the study),they consistently underestimated the calories in restaurant foods and meals. Theirestimates were off by large amounts – by 200 to 600 calories. For example, when showna typical dinner-house hamburger and onion rings, the dietitians on average estimated thatit had 865 calories, when it actually contained 1,550 calories. Since not even experts inthe field of nutrition are able to accurately estimate the caloric content of restaurant foods,consumers are unlikely to do better.
Table 6: Dietitians’ Estimates of the Calorie Content of PopularRestaurant Foods*
Food Item Actual CalorieContent
Average CalorieEstimate
% Difference
Whole Milk (1 cup) 150 155 3% over
Lasagna (2 cups) 960 695 28% under
Grilled Chicken Caesar Salad with Dressing (4 cups)
660 440 33% under
Porterhouse Steak Dinner† 1,860 1,240 33% under
Hamburger (10 oz.) and Onion Rings (11 rings)
1,550 865 44% under
Tuna Salad Sandwich (11 oz.) 720 375 48% under
*Backstrand et al., 1997. †The dinner included a porterhouse steak (20 oz.) with a Caesar salad(2 cups), vegetable of the day (1 cup) and a baked potato with butter (1 Tb.).
14
About half (48%) of people reportthat the nutrition information on foodlabels has caused them to changetheir minds about buying a foodproduct (Levy & Derby, 1996).
Nutrition Information at Restaurants
Nutrition labeling in supermarkets. The Nutrition Labeling and Education Act (NLEA),which was signed into law by President George H.W. Bush in 1990, requires
comprehensive, consistent food labeling onalmost all packaged foods sold atsupermarkets, convenience stores, andother retail stores. Three-quarters of adultsreport using food labels (US DHHS, 2001b),and using food labels is associated witheating more-healthful diets (Kim et al.,2000; Kreuter et al., 1997; Neuhouser et al.,1999). About half (48%) of people reportthat the nutrition information on food labels
has caused them to change their minds about buying a food product – a 50% increaseover the number in a survey conducted before the new food labeling law wasimplemented (Levy & Derby, 1996).
Strengthening food labeling is likely to yield significant health and economicbenefits. The FDA estimated that requiring trans fat to be listed on packaged-food labelswould save 2,100 to 5,600 lives a year and $3 billion to $8 billion a year (FDA, 1999). USDA estimated the economic benefits of extending nutrition labeling to fresh meat andpoultry to be $62 million to $125 million per year (Crutchfield et al., 2001).
Nutrition information at restaurants. The NLEA explicitly exempts restaurants. Undercurrent law, the only requirement is that when restaurants make a health or nutrient-content claim for a food or meal, nutrition information relevant to that claim must beavailable (FDA, 2001). For example, if a menu board claims that a sandwich is low fat,the restaurant is required to have available – somewhere in the store – information aboutthe fat content of that sandwich. Unlike for processed foods, for which nutritioninformation is determined by laboratory analyses of the food, nutrition information tosubstantiate restaurant claims may be determined from nutrient databases, cookbooks, or“other reasonable bases.” The provision of that nutrition information can take variousforms.
Some restaurants, particularly fast-food chains, provide brochures or posters withnutrition information regarding their menu items. Several fast-food chains provided in-store nutrition information only after pressure from state attorneys general and consumergroups. In 1986, state attorneys general from several states, including Texas, NewYork, and California, negotiated an agreement with McDonald’s, Burger King, Jackin the Box, KFC, and Wendy’s to provide nutrition and ingredient information intheir restaurants.
There are a number of limitations with the current voluntary system for providing nutritioninformation in chain restaurants. First, most chain restaurants do not provide nutritioninformation. McDonald’s and Burger King are the exceptions rather than the norm.A survey of the largest chain restaurants found that two-thirds (65%) do notprovide customers with any nutrition information (including on menus, menu boards,

15
pamphlets, table tents, or posters) (Almanza et al., 1997). Second, the nutritioninformation is not always accessible. Even when restaurants have developed nutritionpamphlets, they can be hard to find in individual outlets. Brochures may not be in anobvious location, and employees may not know where to find them. Third, the nutritioninformation provided can be difficult to use. Large, complicated tables listingeverything from protein and cholesterol to iron and vitamin A can be hard to use becausethey present an overwhelming amount of nutrition information in small print for each fooditem. Also, not many harried diners want to lose their place in line to decipher a poster. In addition, it is unlikely that many more restaurants will provide nutrition informationunder a voluntary system. Two-thirds of the largest chain restaurants believe that they donot have a responsibility to provide nutrition labeling (Almanza et al., 1997).
A number of restaurant chains offer nutrition information on their websites (see AppendixA for examples). While nutrition information on the web is of value, it is not convenient oraccessible to the customer at the point of decision making in the restaurant. Also, theinformation may be displayed in a hard-to-read format. If restaurants can providenutrition information on websites and through printed materials, they should be able toplace some of that information on their menus and menu boards. (Note: thoserestaurants that already have nutrition information electronically available would not incuradditional cost to analyze their menu items if calorie labeling were required on menus andmenu boards).
Some restaurants provide menu items that are labeled as “light fare,” “healthy heart,” orother “healthy” designation. Although some of those programs have been shown toincrease the sales of the healthy-designated items (Albright et al., 1990; Anderson &Haas, 1990), there are a number of limitations with this approach. First, there usually area limited number of “healthy fare” items on the menu, and nutrition information regardingthose items is not always provided on the menu or menu board. In addition, providingnutrition information for only the “healthy” foods or meals does not allow patrons tocompare the “healthy” items to other menu options and determine what tradeoffs theymay be making by forgoing a dish off the regular menu. For example, providing calorielabeling for all menu items would reveal that at a Mexican restaurant you could save 570calories by choosing the low-fat chicken enchiladas platter (690 calories) instead of aregular chicken enchiladas platter (1,260 calories).
In summary, most restaurants do not provide any nutrition information about theirfoods. While several major fast-food chains provide complete information abouttheir products, that information is often presented in a hard-to-read, hard-to-useformat.
In a study in a cafeteria setting, signs indicating the calorie content of available foodssignificantly decreased the number of calories that people purchased (Milich et al., 1976). An unpublished evaluation of a menu labeling program at four northwest table-servicerestaurants also found that calorie labeling on menus led to entree selections that werelower in calories (Heart Institute of Spokane, 2002).
Product reformulation: a key benefit of nutrition labeling. A key benefit of mandatorynutrition labeling on packaged foods has been the reformulation of existing products andthe introduction of new nutritionally improved products (Silverglade, 1995).

16
Between 1991 (before implementation of the Nutrition Labeling and Education Act) and1995 (after implementation), the number of available fat-modified cheese products tripledand the market share for fat-modified cookies increased from zero percent of the marketto 15% (Levy & Derby, 1996). In a similar fashion, nutrition labeling on menus and menuboards may spur nutritional improvements in restaurant foods.
Recommendations
In their “Call to Action” to reduce obesity, the U.S. Surgeon General and the U.S.Department of Health and Human Services recommended: “increase availability ofnutrition information for foods eaten and prepared away from home” (US DHHS, 2001). In 1999, a report from the U.S. Department of Agriculture and Food and DrugAdministration recommended that “Americans could adopt nutrition policy, educationalprograms, and promotion strategies to improve both the nutritional quality of food awayfrom home and consumers’ food choices when eating out” (Lin et al., 1999).
Given 1) the rising rates of obesity, 2) the increasing role of restaurant foods inAmericans’ diets, 3) the negative impact of eating out on the nutritional quality of ourdiets, 4) the large portion sizes and high calorie, saturated and trans fat, and sodiumcontents of restaurant foods, and 5) the lack of nutrition information available in mostrestaurants, Congress and/or state or local legislatures should require food-servicechains with ten or more units to list the calorie, saturated and trans fat (combined),and sodium contents of standard menu items on their menus. Restaurants thatuse menu boards, where space is limited, should be required to provide at leastcalorie information next to each item on their menu boards. Maine, New Hampshire,New York, Pennsylvania and the District of Columbia legislatures (at the time this reportwent to press) were considering legislation to require calorie and other nutrition labelingon menus and menu boards at chain restaurants. A similar federal bill has beenintroduced.
Sample Restaurant Menu Board
1 Standard menu items should be analyzed by collecting a representative sample fromseveral units of the chain and subjecting them to nutrient analysis in a laboratory. Manycommercial laboratories can provide nutritional analyses. Costs vary between labs andrange from about $55-$95 for calorie analysis per meal, food or beverage. Analysis ofcalories, saturated plus trans fat, and sodium averages about $220 per menu item.
17
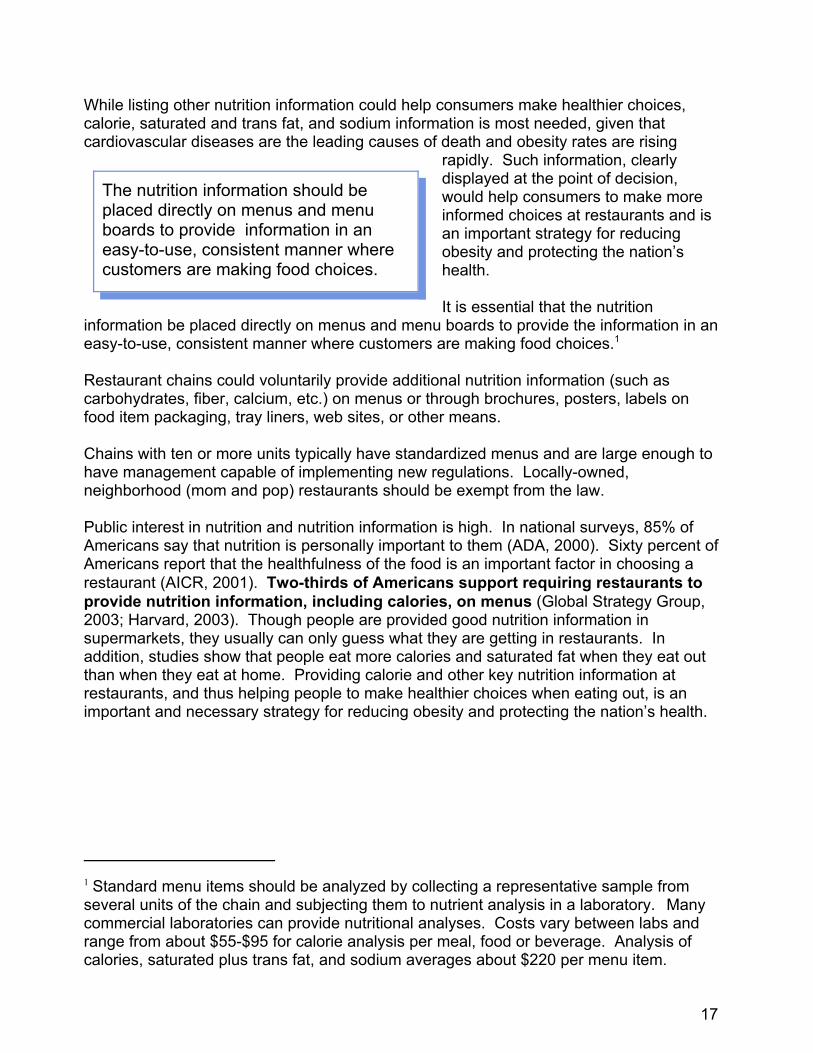
The nutrition information should beplaced directly on menus and menuboards to provide information in aneasy-to-use, consistent manner wherecustomers are making food choices.
While listing other nutrition information could help consumers make healthier choices,calorie, saturated and trans fat, and sodium information is most needed, given thatcardiovascular diseases are the leading causes of death and obesity rates are rising
rapidly. Such information, clearlydisplayed at the point of decision,would help consumers to make moreinformed choices at restaurants and isan important strategy for reducingobesity and protecting the nation’shealth.
It is essential that the nutritioninformation be placed directly on menus and menu boards to provide the information in aneasy-to-use, consistent manner where customers are making food choices.1
Restaurant chains could voluntarily provide additional nutrition information (such ascarbohydrates, fiber, calcium, etc.) on menus or through brochures, posters, labels onfood item packaging, tray liners, web sites, or other means.
Chains with ten or more units typically have standardized menus and are large enough tohave management capable of implementing new regulations. Locally-owned,neighborhood (mom and pop) restaurants should be exempt from the law.
Public interest in nutrition and nutrition information is high. In national surveys, 85% ofAmericans say that nutrition is personally important to them (ADA, 2000). Sixty percent ofAmericans report that the healthfulness of the food is an important factor in choosing arestaurant (AICR, 2001). Two-thirds of Americans support requiring restaurants toprovide nutrition information, including calories, on menus (Global Strategy Group,2003; Harvard, 2003). Though people are provided good nutrition information insupermarkets, they usually can only guess what they are getting in restaurants. Inaddition, studies show that people eat more calories and saturated fat when they eat outthan when they eat at home. Providing calorie and other key nutrition information atrestaurants, and thus helping people to make healthier choices when eating out, is animportant and necessary strategy for reducing obesity and protecting the nation’s health.

18
References
Advertising Age. “Ad Age Almanac: Eating Out.” Advertising Age December 31, 2001, p. 22.
Albright CL, Flora JA, Fortmann SP. “Restaurant Menu Labeling: Impact of Nutrition Informationon Entree Sales and Patron Attitudes.” Health Education Quarterly 1990, vol. 17, pp. 157-167.
Almanza BA, Nelson D, Chai S. “Obstacles to Nutrition Labeling in Restaurants.” Journal of theAmerican Dietetic Association 1997, vol. 97, pp. 157-161.
American Dietetic Association (ADA). “Nutrition and You: Trends 2000.” Journal of the AmericanDietetic Association 2000, vol. 100, pp. 626-627.
American Institute for Cancer Research (AICR). “As Restaurant Portions Grow, Vast Majority ofAmericans Still Belong to ‘Clean Plate Club,’ New Survey Finds.” Washington, DC: AICR NewsRelease, January 15, 2001.
Anderson J, Haas MH. “Impact of a Nutrition Education Program on Food Sales in Restaurants.” Journal of Nutrition Education 1990, vol. 22, pp. 232-238.
Backstrand J, Wootan MG, Young LR, Hurley J. Fat Chance. Washington, DC: Center forScience in the Public Interest, 1997.
Binkley JK, Eales J, Jekanowski M. “The Relation Between Dietary Change and Rising USObesity.” International Journal of Obesity 2000, vol. 24, pp. 1032-1039.
Booth DA, Fuller J, Lewis V. “Human Control of Body Weight: Cognitive or Physiological? SomeEnergy Related Perceptions and Misperceptions.” In: Cioffi LA, James WPT, Van Itallie TB, eds. The Body Weight Regulatory System: Normal and Disturbed Mechanisms. New York, NY: RavenPress, 1981, pp. 305-314.
Bowman S, Lino M, Gerrior S, Basiotis P. The Healthy Eating Index: 1994-96. Washington, DC:U.S. Department of Agriculture, Center for Nutrition Policy and Promotion, 1998.
Clemens LHE, Slawson DL, Klesges RC. “The Effect of Eating Out on Quality of Diet inPremenopausal Women.” Journal of the American Dietetic Association 1999, vol. 99, pp. 442-444.
Crutchfield S, Kuchler F, Variyam JN. “The Economic Benefits of Nutrition Labeling: A CaseStudy for Fresh Meat and Poultry Products.” Journal of Consumer Policy 2001, vol. 24, 185-207.
Ebbin R. “Americans’ Dining-Out Habits.” Restaurants USA, November 2000. Accessed at<http://www.restaurant.org/rusa/magArticle.cfm?ArticleID=138> on April 12, 2002.
Flegal KM, Carroll MD, Ogden CL, Johnson CL. “Prevalence and Trends in Obesity Among USAdults, 1999-2000.” Journal of the American Medical Association 2002, vol. 288, pp. 1723-1727.
Food and Drug Administration (FDA), U.S. Department of Health and Human Services. “NutritionLabeling of Restaurant Foods.” 21 C.F.R., sec. 101.10, 2001, p. 47.
19
Food and Drug Administration (FDA), U.S. Department of Health and Human Services. FederalRegister 1999, vol. 64, pp. 62772-62774.
French SA, Story M, Jeffery RW. “Environmental Influences on Eating and Physical Activity.” Annual Review of Public Health 2001, vol. 22, pp. 309-335.
French SA, Story M, Neumark-Sztainer D, Fulkerson JA, Hannan P. “Fast Food Restaurant Useamong Adolescents: Associations with Nutrient Intake, Food Choices and Behavioral andPsychosocial Variables.” International Journal of Obesity 2001, vol. 25, pp. 1823-1833.
Global Strategy Group. Nationally representative poll commissioned by the Center for Science inthe Public Interest. Washington, D.C.; September 4-8, 2003.
Harvard Forums on Health. “Obesity as a Public Health Issue: A Look at Solutions.” National pollby Lake Snell Perry & Associates, June 2003.
Heart Institute of Spokane. “Menu2 Pilot Results.” Accessed at<http://www.this.org./comm_edu/mn2rest.html> on December 22, 2002. Jacobson MF, Hurley JG. Restaurant Confidential. New York, NY: Workman Publishing, 2002.
Jeffery RW, French SA. “Epidemic Obesity in the United States: Are Fast Food and TelevisionViewing Contributing?” American Journal of Public Health 1998, vol. 88, pp. 277-280.
Johnson WG, Corrigan SA, Schlundt DG, Dubbert PM. “Dietary Restraint and Eating Behavior inthe Natural Environment.” Addictive Behaviors 1990, vol. 15, pp. 285-290.
Kim SY, Nayga RM, Capps O. “The Effect of Food Label Use on Nutrient Intakes: AnEndogenous Switching Regression Analysis.” Journal of Agricultural and Resource Economics2000, vol. 25, pp. 215-231.
Kreuter MW, Brennan LK, Scharff DP, Lukwago SN. “Do Nutrition Label Readers Eat HealthierDiets? Behavioral Correlates of Adults’ Use of Food Labels.” American Journal of PreventiveMedicine 1997, vol. 13, pp. 277-283.
Levy AS, Derby BM. The Impact of the NLEA on Consumers: Recent Findings from FDA’s FoodLabel and Nutrition Tracking System. Washington, DC: Center for Food Safety and AppliedNutrition, Food and Drug Administration, 1996.
Lin B, Guthrie J, Frazao E. Away-From-Home Foods Increasingly Important to Quality ofAmerican Diet. Washington, DC: U.S. Department of Agriculture, Economic Research Service,1999. Agriculture Information Bulletin No. 749.
Lin B, Guthrie J, Frazao E. “Nutrient Contribution of Food Away From Home.” America’s EatingHabits: Changes and Consequences. Washington, DC: U.S. Department of Agriculture,Economic Research Service, 1999b. Agriculture Information Bulletin No. 750, pp. 213-242.
Lin BH, Guthrie J, Blaylock JR. The Diets of America’s Children: Influence of Dining Out,Household Characteristics, and Nutrition Knowledge. Washington, DC: U.S. Department ofAgriculture, Economic Research Service, 1996. Agricultural Economic Report No. 746.
20
Ma Y, Bertone ER, Stanek III EJ, Reed GW, Hebert JR, Cohen NL, Merriam PA, Ockene IS.“Association between Eating Patterns and Obesity in a Free-living US Adult Population.”American Journal of Epidemiology 2003, vol. 158, pp. 85-92.
McCrory MA, Fuss PJ, Saltzman E, Roberts SB. “Dietary Determinants of Energy Intake andWeight Regulation in Healthy Adults.” Journal of Nutrition 2000, vol. 130 (Supplement), pp. 276S-279S.
McCrory MA, Fuss PJ, Hays NP, Vinken AG, Greenberg AS, Roberts SB. “Overeating inAmerica: Associations between Restaurant Food Consumption and Body Fatness in HealthyAdult Men and Women Ages 19 to 80.” Obesity Research 1999, vol. 7, pp. 564-571.
McGinnis JM, Foege WH. “Actual Causes of Death in the United States.” Journal of theAmerican Medical Association 1993, vol. 270, pp. 2207-2212.
McNutt SW, Hu Y, Schreiber GB, Crawford PB, Obarzanek E, Mellin L. “A Longitudinal Study ofthe Dietary Practices of Black and White Girls 9 and 10 Years Old at Enrollment: The NHLBIGrowth and Health Study.” Journal of Adolescent Health 1997, vol. 20, pp. 27-37.
Milich R, Anderson J, Mills M. “Effects of Visual Presentation of Caloric Values on Food Buyingby Normal and Obese Persons.” Perceptual and Motor Skills 1976, vol. 42, pp. 155-162.
Mokdad AH, Ford ES, Bowman BA, Dietz WH, Vinicor F, Bales VS, Marks J. “Prevalence ofObesity, Diabetes, and Obesity-Related Health Risk Factors, 2001.” Journal of the AmericanMedical Association 2003, vol. 289, pp. 76-79.
Munoz K, Krebs-Smith S, Ballard-Barbash R, Cleveland L. “Food Intakes of U.S. Children andAdolescents Compared with Recommendations.” Pediatrics 1997, vol. 100, pp. 323-329.
National Alliance for Nutrition and Activity (NANA). From Wallet to Waistline: The Hidden Costs ofSuper Sizing. Washington, DC: NANA, June 2002.
National Institutes of Health (NIH), Office of the Director, U.S. Department of Health and HumanServices. Disease-Specific Estimates of Direct and Indirect Costs of Illness and NIH Support. Bethesda, MD: NIH, 2000.
National Restaurant Association (NRA). “Industry at a Glance.” Accessed at<http://www.restaurant.org/research/ind_glance.cfm> on April 12, 2002.
Nestle M. Food Politics. Berkeley, CA: University of California Press, 2002.
Neuhouser ML, Kristal AR, Patterson RE. “Use of Food Nutrition Labels Is Associated with LowerFat Intake.” Journal of the American Dietetic Association 1999, vol. 99, pp. 45-50, 53.
Ogden CL, Flegal KM, Carroll MD, Johnson CL. “Prevalence and Trends in Overweight AmongUS Children and Adolescents, 1999-2000.” Journal of the American Medical Association 2002,vol. 288, pp. 1728-1732.
Orlet Fisher J, Rolls BJ, Birch LL. “Children’s Bite Size and Intake of an Entree are Greater withLarge Portions than with Age-Appropriate or Self-Selected Portions.” American Journal of ClinicalNutrition 2003, vol. 77, pp. 1164-1170.

21
Pinhas-Hamiel O, Dolan L, Daniels S, et al. “Increased Incidence of Non-Insulin-DependentDiabetes Mellitus among Adolescents.” The Journal of Pediatrics 1996, vol. 128, pp. 608-615.
Putnam JJ, Allshouse JE. Food Consumption, Prices, and Expenditures. Washington, DC: U.S.Department of Agriculture, Economic Research Service, 1999. Statistical Bulletin No. 965.
Ramsey S, Summers K, Leong S, et al. “Productivity and Medical Costs of Diabetes in a LargeEmployer Population.” Diabetes Care 2002, vol. 25, pp. 23-29.
Rolls BJ, Engell D, Birch LL. “Serving Portion Size Influences 5-Year-Old But Not 3-Year-OldChildren’s Food Intake.” Journal of the American Dietetic Association 2000, vol. 100, pp. 232-234.
Silverglade BA. “Food Labeling: Rules You Can Live By.” Legal Times, July 17, 1995, pp. 21-24.
U.S. Department of Health and Human Services (US DHHS). The Surgeon General’s Call toAction to Prevent and Decrease Overweight and Obesity. Rockville, MD: U.S. Department ofHealth and Human Services, Public Health Service, Office of the Surgeon General, 2001.
U.S. Department of Health and Human Services (US DHHS), Centers for Disease Control andPrevention, National Center for Health Statistics. Healthy People 2000 Final Review. Hyattsville,MD: U.S. Department of Health and Human Services, Centers for Disease Control andPrevention, National Center for Health Statistics, 2001b. DHHS Publication No. 01-0256.
Wansink B. “Can Package Size Accelerate Usage Volume?” Journal of Marketing 1996, vol. 60,pp. 1-14.
Young LR, Nestle M. “The Contribution of Expanding Portion Sizes to the US Obesity Epidemic.” American Journal of Public Health 2002, vol. 92, pp. 246-249.
Young LR, Nestle M. “Portion Sizes in Dietary Assessment: Issues and Policy Implications.” Nutrition Reviews 1995, vol. 53, pp. 149-158.
Zoumas-Morse C, Rock CL, Sobo EJ, Neuhouser ML. “Children’s Patterns of MacronutrientIntake and Associations with Restaurant and Home Eating.” Journal of the American DieteticAssociation 2001, vol. 101, pp. 923-925.

22
Appendix A: Examples of Restaurants that Provide Nutrition Informationon the Internet
Arby’s: http://www.arbys.com/arb06.htmlBaja Fresh: http://www.bajafresh.com/jump.jsp?itemID=68&itemType=CATEGORY &iMainCat=4&iSubCat=10&i3Cat=68Baskin-Robbins: http://www.baskinrobbins.com/about/nutritional.shtml Blimpie Subs and Salads: http://www.blimpie.com/framesets/sfs_nutrition.htmBoston Market:: http://www.boston-market.com/food/index.jsp?page=nutritionBurger King: http://www.burgerking.com/Food/index.aspxCarl’s Jr.: http://www.carlsjr.com/homeChick-fil-A: http://www.chick-fil-a.com/content/nutri/nutriInnerFrame.htmChuck E. Cheese’s: http://www.chuckecheese.com/cec2002/restaurants/nutritional.htmlChurch’s Chicken: http://www.churchs.com/home.aspDomino’s Pizza: http://www.dominos.com/C1256B420054FF48/vwContentByKey/W256QR93351DENNEN#Dunkin’ Donuts: http://www.dunkindonuts.com/nutrition/El Pollo Loco: http://www.crazychicken.com/consumer/con_index.htmlFazoli’s: http://www.fazolis.com/nutrition.asp Godfather’s Pizza: http://www.godfathers.com/nutrition.htmlHaagen-Dazs Ice Cream Café: http://www.haagen-dazs.com/Hardee’s: http://www.hardeesrestaurants.com/nutrition/KFC: http://www.kfc.com/kitchen/nutrition.htmKrispy Kreme Doughnuts: http://www.krispykreme.com/varieties.htmlKrystal: http://www.krystalco.com/food/nutrition/home.aspLittle Caesars: http://littlecaesars.com/menu/nutrition.asp?category=menuLong John Silver’s: http://www.ljsilvers.com/nutrition/default.htmMcDonald’s: http://www.mcdonalds.com/countries/usa/food/index.htmlPizza Hut: http://www.pizzahut.com/menu/nutritioninfo.aspRound Table Pizza: http://www.roundtablepizza.com/RTP/LO/default.aspSchlotzsky’s Deli: http://www.schlotzskys.com/nutrition.htmlSubway: http://subway.com/applications/NutritionInfo/index.aspxTaco Bell: http://www.tacobell.com/TCBY: http://www.tcby.com/TCBY_Sorbet_and_%20Yogurt_Nutrition_Chart.pdfWendy’s: http://www.wendys.com/food/index.jsp?country=US&lang=ENWhataburger:: http://www.whataburger.com/menulist.cfmWhite Castle: http://www.whitecastle.com/_pages/nutrition.as

SANDWICHES HAMBURGER
CHEESEBURGER
FILET-O-FISH®
CRISPY CHICKEN
QUARTER POUNDER®
BIG N’ TASTY®
BIG MAC®
CHICKEN McGRILL®
DOUBLE QUARTER POUNDER®
.89 .99
1.99 2.79 2.29 2.29 2.39
2.89
2.99
280 Cal
330 Cal
470 Cal
550 Cal
430 Cal
540 Cal
590 Cal
450 Cal
760 Cal

290 cal 2.29430 cal 2.89550 cal 2.79450 cal 2.89470 cal 1.99
590 cal 2.39540 cal 2.29530 cal 2.29430 cal 2.29760 cal 2.99330 cal 0.99280 cal 0.89
220 cal 1.29 330 cal 1.49 430 cal 1.69510 cal 1.89 770 cal 2.29 1,010 cal 2.49280 cal 1.49 430 cal 1.69 560 cal 2.59 10 cal 0.99 15 cal 1.09
150 cal 0.99360 cal 1.59210 cal 1.29 5 cal 0.89100 cal 0.99
380 cal 1.99280 cal 1.99610 cal 2.16330 cal 1.29
Model Menu Boards: Fast Food
SANDWICHESBIG BURGER BIG N’ TASTY CHICKEN NUGGETS (6PC) QUARTER POUNDER with CHEESE CHICKEN NUGGETS (9PC)
QUARTER POUNDER CRISPY CHICKEN DOUBLE QUARTER POUNDER CHICKEN GRILL CHEESEBURGER FILET OF FISHHAMBURGER
SALADSCHICKEN CAESAR+ 230 cal 2.59 CHEF+ 280 cal 2.89 GARDEN+ 230 cal 1.99
KIDS’ MEAL BIG KIDS’ MEALComes with sm. french fry, child-size drink and toy. For kids under 12. Comes with sm. french fry and child-size drink.
HAMBURGER 600 cal 1.99 DOUBLE HAMBURGER 700 cal 2.80CHEESEBURGER 650 cal 2.49 DOUBLE CHEESEBURGER 800 cal 3.304 CHICKEN NUGGETS 510 cal 2.89 6 CHICKEN NUGGETS 610 cal 3.30
FRENCH FRIESSMALL 210 cal 1.03 MEDIUM 450 cal 1.50 LARGE 540 cal 1.67 SUPER SIZE 610 cal 1.90
BEVERAGES Small Medium Large Super Size
SODA SHAKE* ORANGE JUICE COFFEE**
1% MILK
DESSERTSFRUIT ‘N YOGURT PARFAIT CONE 150 cal 0.99without Granola FLURRY* BAKED PIE 260 cal 0.99SUNDAE* COOKIES* 250 cal 0.99
Daily Values are based on a 2,000 calorie diet.+Calories include reduced calorie dressing. Please see nutrition brochure for other dressing information.*Calories depend on flavor/variety. Average for line. Please see nutrition brochure for more details**Calories without cream or sugar. Please see nutrition brochure for details.

Model Menu Board: Mall Restaurant
grilled sandwichesserved w/lettuce, tomato, and mayo
GREAT STEAK 660 cal $4.49w/Onions & Provolone
SUPER STEAK 660 cal $4.69w/Onions, Peppers, Mushrooms & Provolone
HAM EXPLOSION 710 cal $4.69w/Onions, Peppers, Mushrooms & Swiss
HAM DELIGHT 710 cal $4.49w/Pineapple & Swiss
CHICKEN PHILLY 640 cal $4.69w/Onions & Swiss
CHICKEN TERIYAKI 580 cal $4.69w/Onions, Swiss & Teriyaki
TURKEY PHILLY 690 cal $4.49w/Onions & Swiss
VEGGIE DELIGHT 570 cal $4.19Fresh Grilled Veggies w/Provolone & Swiss
COMBO IT! Add Small Fry & Drink +610 cal $6.39
baked potatoes
GREAT POTATO 600 cal $4.49w/Steak or Turkey, Onions & Cheese
BROCCOLI & CHEESE 340 cal $3.29
fresh cut friesCooked in 100% Cholesterol Free Peanut Oil
SM. 460 cal $1.49 REG. 540 cal $1.99 LRG. 920 cal $2.79
Daily Values are based on a 2,000 calorie diet.

The Daily Values for a 2,000 calorie diet are 20 g of saturated fat and 2,400 mg of sodium. Saturated fat numbers include trans fat.
Model Menu: Dinner House Restaurant
starters & snacks Spicy Buffalo WingsTossed in our hot or mild Buffalo sauce. Served with blue cheese dressing and celery sticks. 1,010 cal, 22 g sat fat, 2,460 mg sodium $6.99
Fried Mozzarella SticksMozzarella cheese lightly breaded and deepfried. Served with marinara sauce. 830 cal, 28 g sat fat, 1,890 mg sodium $5.99
Blooming OnionA whole onion, cut like a flower, batteredand golden fried. Served with zesty dippingsauce. 2,130 cal, 57 g sat fat, 3,840 mg sodium $6.99
Stuffed Potato SkinsLarge potato shells fried golden brown,filled with Jack and Cheddar cheese, crispsmoked bacon, green onions, parsley and sourcream. 1,260 cal, 48 g sat fat, 1,300 mg sodium $6.69
Cheese FriesFrench fries smothered in cheese, sprinkledwith bacon and served with ranch dressing. 3,010 cal, 91 g sat fat, 4,890 mg sodium $6.99
salads
Chicken Caesar Salad
Grilled chicken over Romaine lettuce. Served withcroutons, Parmesan cheese, and our special Caesardressing.
660 cal, 11 g sat fat, 1,490 mg sodium $6.99
Oriental Chicken Salad A quarter pound of skinless chicken breast over amound of Romaine lettuce, snow peas, waterchestnuts, red cabbage, carrots and other fixings. Topped with our homemade Oriental dressing. 750 cal, 12 g sat fat, 1,140 mg sodium $6.99

The Daily Values for a 2,000 calorie diet are 20 g of saturated fat and 2,400 mg of sodium. Saturated fat numbers include trans fat.
lunch/dinner entrees Sirloin Steak Seven ounces USDA choice steak, grilled toyour satisfaction. Served with French friesand seasonal vegetables. 1,060 cal, 23 g sat fat, 1,000 mg sodium $12.99
BBQ Baby Back RibsA one pound platter of slow roasted ribs,basted in our special barbeque sauce andserved with French fries and cole slaw. 1,530 cal, 36 g sat fat, 1,610 mg sodium $10.59
Chicken FingersLightly breaded chicken tenders servedwith French fries, cole slaw and dippingsauce. 1,640 cal, 30 g sat fat, 2,640 mg sodium $7.99
Steak FajitasSliced steak over sauteed onions and bellpeppers. Served with soft tortillas,guacamole, sour cream, salsa and cheese.
1,190 cal, 28 g sat fat, 2,810 mg sodium $11.69
Grilled Chicken We grill a tender boneless marinatedchicken breast and serve with vegetablesand a baked potato with a dollop of sourcream on the side. 640 cal, 5 g sat fat, 820 mg sodium $9.79
burgers
Our burgers are 100% USDA ground beef. Each is grilled to medium-well unless otherwise requested and served on atoasted roll with French fries and fixings. (Nutrition information includes sides.)
Bacon & Cheese Grilled Chicken Sandwich
Grilled chicken, crisp bacon, tomato, onion, mayo, lettuce and cheese on a toasted bun. 1,230 cal, 24 g sat fat, 2,110 mg sodium $7.99
HamburgerTender USDA ground beef, grilled to your liking. 1,240 cal, 29 g sat fat, 1,270 mg sodium $7.99
Mushroom CheeseburgerSauteed mushrooms over our All-American Burger with melted Jack cheese. 1,490 cal, 40 g sat fat, 1,540 mg sodium $7.50
sides Vegetable of the day
60 cal, 1 g sat fat, 150 mg sodium $1.99
Baked potato w/sour cream 310 cal, 2 g sat fat, 30 mg sodium $2.99
Loaded baked potato 620 cal, 19 g sat fat, 570 mg sodium $4.99
French fries
590 cal, 12 g sat fat, 460 mg sodium $1.99
Onion rings 900 cal, 23 g sat fat, 1,050 mg sodium $1.99
$1.99
$3.99
$2.99$2.99
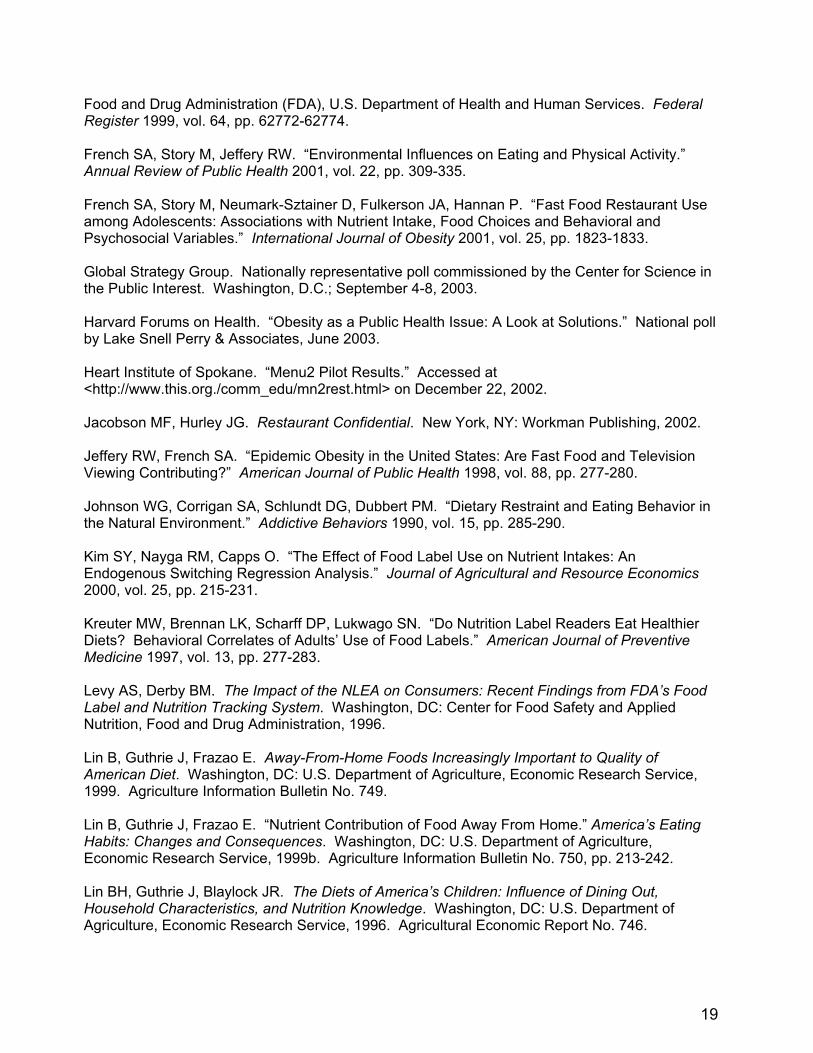
Model Menu: Pizza Restaurant
specialty pizzas*
Medium $12.29 Large $15.29
lover’s lineGet more of the toppings you love. Our Lover’s Line pizzaspack on more of your favorite toppings!
Pepperoni Lover’sLoaded with more cheese and more pepperoni. 900 cal 19 g sat fat 2,070 mg sodium
Meat Lover’sA combination of pepperoni, Italian sausage, bacon,beef and pork toppings. 980 cal 19 g sat fat 2,290 mg sodium
Veggie Lover’sFresh mushrooms, red onions, green peppers,tomatoes and black olives. 730 cal 11 g sat fat 1,390 mg sodium
Supreme pizzasOur most famous selections, top of the line in every way.
SupremeOur signature blend of pepperoni, beef and porktoppings, green peppers, ham, red onions andmushrooms. 870 cal 16 g sat fat 1,820 mg sodium
Super Supreme ($1.00 more)A nine-topping feast of pepperoni, ham, Italiansausage, beef, pork, green peppers, red onions, freshmushrooms and black olives. 930 cal 16 g sat fat 2,120 mg sodium
Chicken SupremeTender chunks of grilled chicken breast with greenpeppers, red onions and mushrooms. 730 cal 11 g sat fat 1,580 mg sodium
*Nutrition information is for three slices with pan style crust. See nutrition brochure for other crust types.
BREADSTICKS Crispy on the outside, soft & chewy on the inside. Served with tangy marinara sauce.
Single order of 5 sticks 800 cal 5 g sat fat 1,700 mg sodium
Family order of 10 sticks 320 cal 2 g sat fat 680 mg sodium (Nutrition information for 2 stick serving)
PERSONAL PAN PIZZA All the tempting flavor of our pan pizza packed into an individual serving.
CHEESE 630 cal 12 g sat fat 1,370 mg sodium
1 TOPPING** 660 cal 11 g sat fat 1,550 mg sodium
**Nutrient values vary with crust type and topping. See nutrition brochure for more details.
The Daily Values for a 2,000 calorie diet are 20 g of saturated fat and 2,400 mg of sodium.

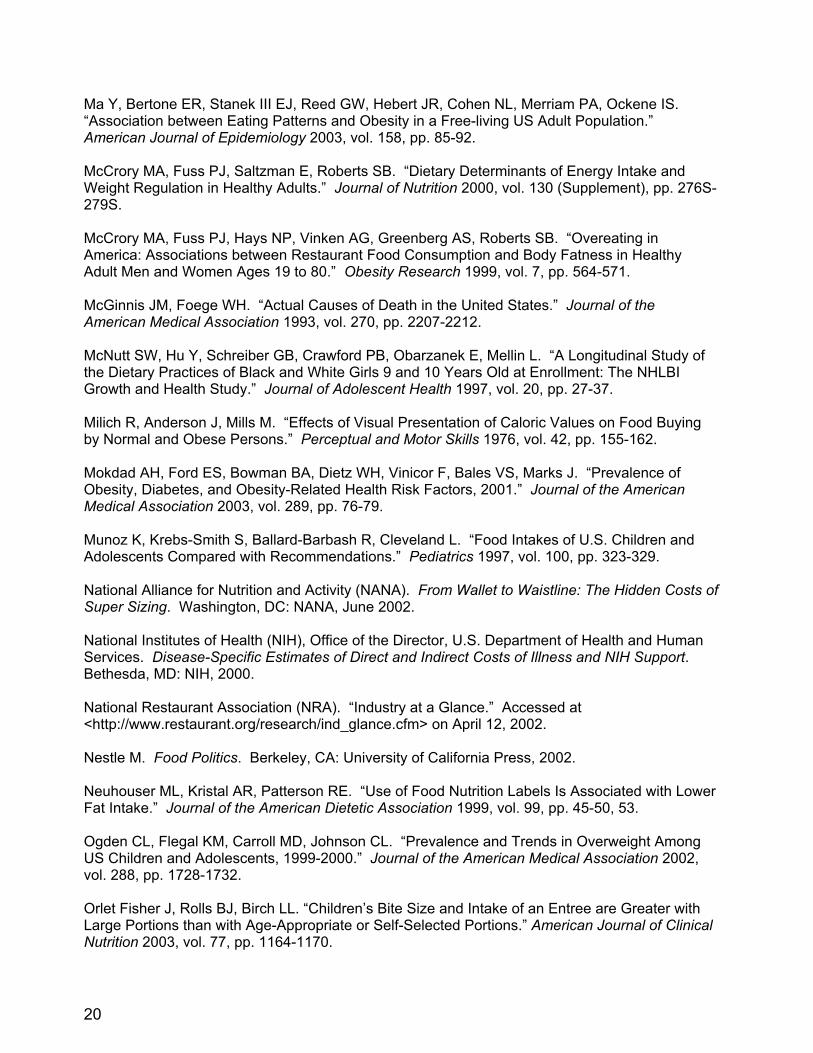
Model Menu: Breakfast Restaurant
Legendary Breakfasts
Crack of DawnTwo eggs,* any style, two hotcakes with syrup and margarine, two sausage links and two strips of bacon. 1,010 cal 19 g sat fat 1,770 mg sodium $5.39
Farmer’s Hearty BreakfastTwo eggs,* two fluffy pancakes with syrup and margarine, two sausage links, two strips of crisp bacon and hash browns. Sure to satisfy yourhearty appetite! 1,230 cal 22 g sat fat 1,970 mg sodium $6.69
Early RiserA bowl of hot cereal, served with 2% milk,orange juice, seasonal fresh fruit and toast.
600 cal 3 g sat fat 660 mg sodium $6.39
Country BiscuitA biscuit split and topped with eggs over-easyand our country gravy. Served with twosausage links and two strips of bacon 1,110 cal 27 g sat fat 2,580 mg sodium $5.49
Pancakes n’ Such
Thick-sliced French ToastThree slices of our own bread dipped in our egg and milk mixture, then grilled to perfection.
Served with syrup and margarine and your choice of breakfast meat.**
1,130 cal 20 g sat fat 1,740 mg sodium $5.29
Momma’s Pancake BreakfastA classic. Four of our traditional pancakes served up with syrup,
margarine and your choice of breakfast meat.** 1,160 cal 19 g sat fat 2,680 mg sodium $5.49
*Nutrition information listed for scrambled eggs. Please see nutrition brochure for other types of eggs.**Nutrient values vary depending on meat selection. Please see nutrition brochure for more details.
The Daily Values for a 2,000 calorie diet are 20 g of saturated fat and 2,400 mg of sodium.Saturated fat numbers include trans fat.
breakfast ham 100 cal 1 g sat fat 910 mg sodium $2.89
hash browns 220 cal 3 g sat fat 200 mg sodium $1.69
toast(2 slices) with margarine 260 cal 4 g sat fat 390 mg sodium $1.35
thick-sliced bacon (4) 130 cal 4 g sat fat 530 mg sodium $2.29
sausage links (4) 340 cal 13 g sat fat 670 mg sodium $2.29
pancakes (3) with syrup and 770 cal 9 g sat fat 1,490 mg sodium $2.49
cold cereal with 2% milk 210 cal 2 g sat fat 380 mg sodium $1.89
oatmeal with 2% milk 210 cal 2 g sat fat 380 mg sodium $1.89
Belgian WaffleTopped with strawberries and whipped cream. Served with your choice ofbreakfast meat.** 1,020 cal 22 g sat fat 1,740 mg sodium $6.39
Eggs, Etc.
Lighten UpTwo scrambled Egg Beaters, served withhash browns and toast to get you off to agood start. 480 cal 6 g sat fat 670 mg sodium $3.69
Two Egg ComboTwo eggs,* any style, served with hashedbrowns and toast. 650 cal 8 g sat fat 660 mg sodium $3.69
Ham and Cheese OmeletteA combo of diced, smoked ham with sharpcheese. Served with hash browns and toastwith margarine. 990 cal 26 g sat fat 1,790 mg sodium $6.49
Sides
*Nutrition information listed for scrambled eggs. Please see nutrition brochure for other types of eggs.**Nutrient values vary depending on meat selection. Please see nutrition brochure for more details.
The Daily Values for a 2,000 calorie diet are 20 g of saturated fat and 2,400 mg of sodium.Saturated fat numbers include trans fat.

Model Menu Board: Coffee Shop
COFFEE DRINKS
SMALL MEDIUM LARGE
COFFEE OF THE DAY+ 10 cal 1.40 10 cal 1.60 10 cal 1.70
DECAF COFFEE OF THE DAY+
CAPPUCCINO*CAFFE LATTE*CAFFE MOCHA*§WHITE CHOCOLATE MOCHA*§
10 cal110 cal160 cal250 cal330 cal
1.402.552.552.753.20
10 cal140 cal210 cal330 cal440 cal
1.603.103.103.303.75
10 cal180 cal270 cal410 cal550 cal
1.703.403.403.554.00
COLD BEVERAGESICED CAFFE LATTE* 100 cal 2.55 130 cal 3.10 160 cal 3.50
ICED CARAMEL LATTE* 160 cal 2.80 220 cal 3.40 270 cal 3.80
ICED CAFFE MOCHA*† 150 cal 2.75 190 cal 3.30 240 cal 3.55ICED CAFFE AMERICANO+ 10 cal 1.75 10 cal 2.05 10 cal 2.40
COFFEE ALTERNATIVES
TAZO CHAI* 200 cal 2.70 260 cal 3.10 330 cal 3.35
STEAMED CIDER 170 cal 1.75 230 cal 2.00 290 cal 2.25
HOT CHOCOLATE*† 270 cal 2.20 350 cal 2.45 440 cal 2.70
*Calorie content depends on type of milk used. See nutrition brochure for more information.+ without milk § with whipped cream †without whipped cream
2 TB skim milk= 10 cal 2 TB 2% milk= 15 cal 2 TB whole milk= 20 cal 2 TB half and half= 40 calwhipped cream = 100 cal
Daily Values are based on a 2,000 calorie diet.

Actual Menu Brochure: Baja Fresh