Embed Size (px)
Citation preview
Deep-Sea Research, 1971, Vol. 18, pp. 1207 to 1219. Pergamon Press. Printed in Great Britain.
Anticyclonic eddies formed from shoreward meanders of the Gulf Stream*
P. M. SAUNDERS~"
(Received 13 April 1971; revised and accepted 14 July 1971)
Abstract--During a 3-month period (September to December, 1969) measurements with an airborne radiation thermometer and air-dropped BT's revealed the existence of a northward meander of the Gulf Stream, its amplification and the production of an anticyclonic eddy (diameter ca. 100 km). In the same area and period (October to December, 1968) 60 days of current records were obtained at six depths from the surface down to 2000 m; they show that the meander and eddy circulations are confined to the upper 1000 m and are weak with surface currents of only 30-75 cm/sec.
The energy of the eddy is shown to reside principally in the form of available potential energy, whichis present in the local deformation of the density field and estimated to be 102a ergs; this quantity is 30 times larger than the total kinetic energy of the circulation (3 × 10²¹ ergs). Estimates are made of the rate of destruction of the total energy of the eddy by (i) enhanced heat loss to the atmosphere and (ii) dissipation of kinetic energy by turbulent vertical diffusion: the eddy lifetime from these processes is estimated as 6 months and 1 year respectively.
I N T R O D U C T I O N
THE SINUOUS meandering behaviour of the Gulf Stream in the region between Cape Hatteras and the Grand Banks has been revealed by multiple ship surveys (FuGLISTER a n d WORTHINGTON, 1951; FUGLISTER, 1963) and by isotherm following from both ships (FUGLISTER and VOORHIS, 1965) and aircraft (WILKERSON and NOBLE, 1970). Various explanations for this behaviour have been put forward. WARREN (1963) and ROBINSON and NIILER (1967) attribute the meanders to a steering of the Stream by bottom topography whilst others have sought the explanation in barotropic or baroclinic forms of hydrodynamic instability. Recently ORLANSKI (1969) and ROBINSON (1970) have incorporated both these processes into theoretical models and achieved some success in predicting the mean position and envelope of positions of the Stream and the scale and phase speed of meanders.
FUGL1STER and WORTHINGTON (1951) were the first to record the formation of an eddy or ring, ~ which is generated after the excursions in a meander become very large. The narrow base of the meander then closes off producing a separate circulation quite distinct from the Stream. FUGLISTER (1971) made a study of the properties and behaviour of eddies resulting from southward meanders of the Stream into the Sargasso Sea; their circulations are cyclonic or counterclockwise when viewed from above. Cyclonic eddies generally move southwest away from the stream at speeds of about 10 cm/sec; when formed their diameter is about 150 km (measured by the 15°C isotherm at 200 m) though this decreases with time. On the other hand, their surface currents which are close to 1.5 m/see barely weaken in the same 6-month period. The
*Contribution Number 2660 from the Woods Hole Oceanographic Institution. fWoods Hole Oceanographic Institution, Woods Hole, Massachusetts. 02543, U.S.A. ~FUGLISTER (1971) employs the latter term; the more widely accepted term eddy will be used here.
1207

1208 P.M. SAUNDERS
central core of a cyclonic eddy (down to 2000 m) contains Slope Water from the shoreward side of the Stream which when diffused into the surrounding Sargasso Sea produces a freshening and cooling; the time-scale of this process, or the eddy lifetime, is thought to be over one year. Fuglister estimates the frequency of production of cyclonic eddies between longitudes 65°W and 55°W as between 5 and 8 per year and postulates a similar number of anticyclonic eddies formed by shoreward meanders of the Stream into the Slope Water. Several references to the existence of such eddies can be found in the literature, certainly as early as ISELIN (1936). In this paper is presented a description of the formation of an anticyclonic eddy, followed by a discussion of its properties and behaviour which may be contrasted with the corresponding aspects of cyclonic eddies summarized above.
OBSERVATIONS OF THE THERMAL STRUCTURE
An experiment was designed to connect the length and time scales of temperature fluctuations in the upper mixed layer of the ocean by combining an aircraft survey with measurements made from a mooring. By chance we observed a meander of the Gulf Stream which developed into an eddy. The aircraft flew east-west tracks of 250 km. length in the area 39-40°N, 68-71°W, separated by a distance of 30 km in the north-south direction. The mooring was situated at 39°12'N, 70°03'W, close to the center of the survey area. Measurements were made from the aircraft with a radiation thermometer and with the air-dropped expendable BT (AXBT). The techniques employed in using the radiation thermometer have been described (SAUNDERS, 1970) and an accuracy of ±0.2°C can be achieved. The AXBT is a buoy dropped from the aircraft which in turn drops a thermistor; the temperature-time (depth) data is telemetered to the aircraft which continues along its line of flight. The accuracy of the AXBT temperature appears to be :~0-5°C, but its depth accuracy (0-400 m) is not known. Six surveys were conducted at an altitude of 300 m in good flying conditions during the 2½-month period 15 September to 4 December, 1969. These data were supplemented by opportune ship and aircraft observations* made in the weeks centered on flight dates.
Maps were drawn of the temperature at the surface and at 200 m for each of the six flights. A region of 4 ° of longitude and 3½ ° of latitude was mapped and the analyses are presented in Figs. 1-7.
In mid-September weak temperature gradients exist at the surface throughout the entire region; the contrast at the shoreward edge of the Stream is only I-2°C. It is apparent (Fig. 1) that at the time of observation a meander is present with an amplitude of nearly 100 km and wavelength between 300 and 400 km. The 200 m map for the same period shows the sharp frontal zone~" which separates the Sargasso Sea ( > 18°C) from Slope Water (10-12°C). The 400 m depth contour is also indicated: about 10 km to the north lies the 200 m isobath commonly regarded as the edge of the shelf whilst 20 km to the south the water depth exceeds 2000 m. Three weeks later (Fig. 2) the meander has pushed about 50 km to the north and east: in the Slope Water region the north-south gradient of surface temperature increases with the seasonal cooling.
*The sources of supplemental data are listed in the acknowledgements.
tThe sharpness of the frontal zone is not manifest from our few observations but rather from the previous observational studies cited in the Introduction.

Anticyclonic eddies from the Gulf Stream 1209
72 70 68W 72 70 68W
,ooo . : +ooo .
< . :
!
Fig. 1. Analysis of isotherms (°C) at the surface (right) and at 200 m (left). Data points are indicated as dots; the open circle marks the location of the mooring and current meters. The 400 m isobath is shown (near top) as well as the climatological position of the Gulf Stream
(pecked line). Flight date - - 15 September 1969.
400 ~
?2 I 1 I
• - 400rn
• " " ~ ~ _ ~ - - - - ~ x . - 3 9
//////• 13-~o OCT L3~
,
I i F
Fig. 2.
70 68W 72 70 68W I I 1 A . ~
21 . . . ~.4ON
> 2 2
~..39
• - . • I SURFACE I
See Fig, 1. Flight date - - 6 October 1969.
Current measurements begin at this time and the 200 m value is plotted on the 200 m map. In a further two weeks (Fig. 3) the axis of the meander acquires a marked north- west tilt and the 200 m current runs to the northeast. A sharp frontal zone has now developed at the surface. Because of poor weather our next flight scheduled for two weeks later was delayed until an interval of one month had elapsed (see Fig. 4). During this period the meander became elongated and during the first week of November, we judge, became separated from the stream forming an anticyclonic eddy. The eddy has dimensions of about 200 by 100 km at the surface and 120 by 60 km measured by the 15°C isotherm at 200 m; a value about two-thirds of that reported by FUGLISTER (1971) for cyclonic eddies. Sharp frontal features now exist on the northern and eastern side of the eddy. On the northern edge of the eddy warm (21°C)
1 2 1 0 P . M . SAUNDERS
72
4 0 0 m ~
70 68 W • . . . . . --r T /~.,.>k..
10 -12
"21 ~M / ql:'C
72 70 68 W
- ~ 4 0 N
, 400m~ 21"~3 39 - 22 9
' : ' " ". " " ~ - s 8
• / / " I SURFAC~ l
38
1 i i J
Fig. 3.
• I _ _ _ [ . . . . a _ _
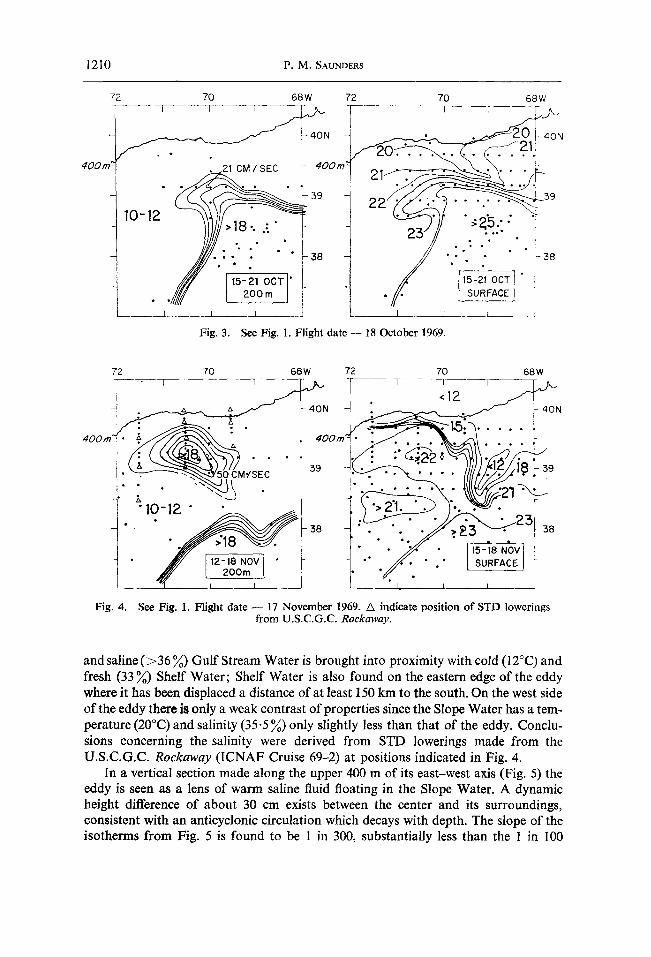
S e e Fig. 1. F l i g h t d a t e - - 18 O c t o b e r 1969.
72 70 68 W 72 70 68 W " I I l I ~. [ T l 1 ~
/ . . . . i
• • . " , ~ . ~.......-v-v,.. • i~I:/#/:.~.~
- - • •
• ~#7 r ~ i • i . . S . . . I'~G2c21 1 { Z O O r n t i . / / / . - L , ,
"~ 1 i [ _ _ " i . i ,
Fig . 4. See Fig. 1. F l i g h t d a t e - - 17 N o v e m b e r 1969. ZX i n d i c a t e p o s i t i o n o f S T D l o w e r i n g s f r o m U . S . C . G . C . Rockaway.
and saline (>36 %) Gulf Stream Water is brought into proximity with cold (12°(3) and fresh (33 %) Shelf Water; Shelf Water is also found on the eastern edge of the eddy where it has been displaced a distance of at least 150 km to the south. On the west side of the eddy there is only a weak contrast of properties since the Slope Water has a tem- perature (20°C) and salinity (35.5 %) only slightly less than that of the eddy. Conclu- sions concerning the salinity were derived from STD lowerings made from the U.S.C.G.C. Roekaway (ICNAF Cruise 69-2) at positions indicated in Fig. 4.
In a vertical section made along the upper 400 m of its east-west axis (Fig. 5) the eddy is seen as a lens of warm saline fluid floating in the Slope Water. A dynamic height difference of about 30 cm exists between the center and its surroundings, consistent with an anticyclonic circulation which decays with depth. The slope of the isotherms from Fig. 5 is found to be 1 in 300, substantially less than the 1 in 100
Anticyclonic eddies from the Gulf Stream 1211
I00
200
3 0 0
4 0 0
Fig. 5.
NOVEMBER 17, 1969
71 ° 700 69* 68 ° W
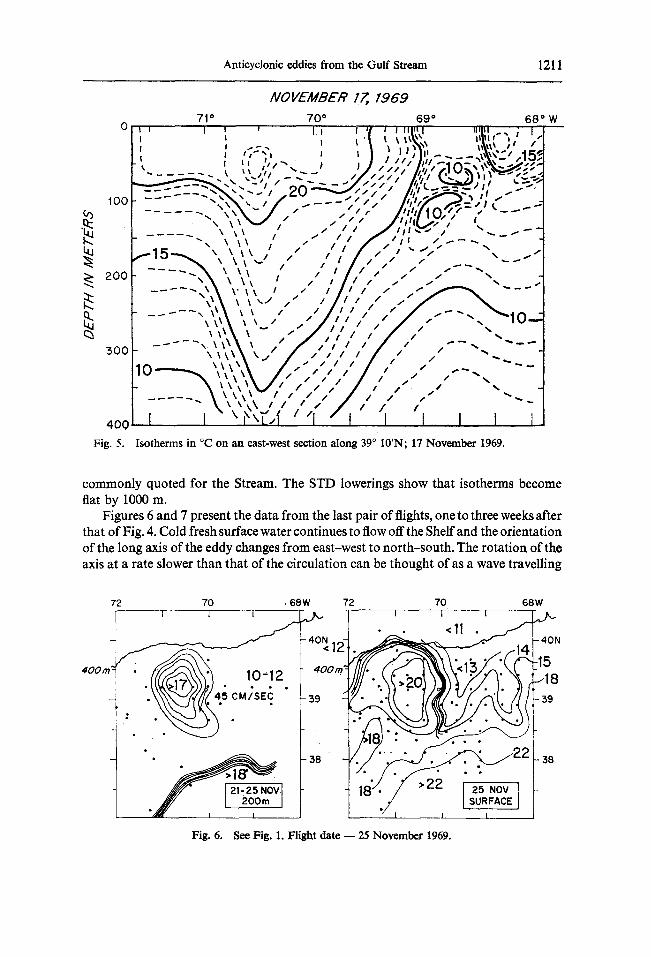
Isotherms in °C on an east-west section along 390 10'N; 17 November 1969.
commonly quoted for the Stream. The STD lowerings show that isotherms become flat by 1000 m.
Figures 6 and 7 present the data from the last pair of flights, one to three weeks after that of Fig. 4. Cold fresh surface water continues to flow off the Shelf and the orientation of the long axis of the eddy changes from east-west to north-south. The rotation of the axis at a rate slower than that of the circulation can be thought of as a wave travelling
72 70 .68W 72 I 1 I
4O0
" J ~ i I ]
7O 1 t l
• <11 , /
• . i z
"<1~" [
/7" ,22 I 25 NOV /, , 1 SURFACE I
6 8 W
-40N
.15 :-.-18 '--39
38
Fig. 6. See Fig. 1. Flight date - - 25 November 1969.

1212 P . M . SAUNDERS
72 70 68 W I I I ~
~-40N
, o o o 4 °"
4 ' 7 I • !1///>18" 1 • #/ i , - , ,o~cl ~ ' . / . . . , ,
Fig. 7.
I I
See Fig. 1. Flight date - - 4 December 1969.
72 70 68W i I 1
-18
14-" DEC " . . I SURFACE
• - ] • l
around the circumference: probably the wave travels in the same direction as the flow although our data cannot confirm this hypothesis.
In early December the current records terminated (as planned) but instruments and moorings were not recovered until early January on R.V. Chain Cruise 97. XBT's and hydrostations were made and the data therefrom is presented in Fig. 8. It will be seen
72
400m~ ! i
~ . . "'-;. 10-12
70 68W 72 70 , , '
~ : 1213 • 4~ 1 4
- 3 8 I , " 2 2 0 "
I %-J g FJAcNE I
I i f _ _
68W
-40N
- 3 9
3 8
Fig. 8. See Fig. 1. No aircraft data.
that in the two months that have elapsed since the eddy formed a west-southwest drift of close to 3 cm/sec is indicated. No further observations were undertaken until R.V. Chain Cruise 98, about 6 weeks later. Despite a widespread search of the upper 400 m of the Slope Water between 73°30'W and 70°W employing XBT's the eddy could not be found and its fate remains unknown.*
*Or did so until recent communications from B. J. Thompson. See concluding paragraph.

Anticyclonic eddies from the Gulf Stream 1213
DIRECT CURRENT MEASUREMENTS
Six current records from a two-month period beginning October 6, 1969 were examined by the writer. Four instruments mounted at depths of 13, 53, 105, and 207 m were attached to moorings No. 317 situated near 39°12'N, 70°03'W; two further instruments at depths of 1044 and 2066 m were attached to mooring No. 310 situated near 39°10'N, 70°03'W. The separation of these moorings, approximately 3"5 km, will be ignored in what follows.
Observations of currents, made every 15 rain, are already smoothed from high frequency (wave) noise (WzBsTER, 1967). In order to smooth out the energetic oscill- atory motions of tidal and inertial frequency we have formed 5 day vector averages and plotted the results for the upper 5 instruments in Fig. 9. These average currents are computed once per day by taking the means of the two components for the five day period centered on mid-day and combining them to form the vector average.
OCT. 11 15 19 23 27 31 NOV. 6 10 14 18 22 26 30 DEC. 7 9 13 17 21 25 29 2 4 8 12 16 20 24 28 2 4
, : , , , z. / / / / / / / / / / / / / / /7/k\\ \ \ \ , , 13 M , i t i l//////f ///
. . . . . , , . . . . ._._~//l l l / .d//"///9//s\k\\ \ I . 5 3 l
,a\ttkliti t/I///< 105 M
207 M -. . . . . . . . . . . t / I I I ,' i f t l . / / S ~ / , . . \ \ \ I 1 . . \
\\\\\h t ! i lI//Say 1044 l
3103"~" . . . . . . ( X 3)"" ~l~ ' l ' I / " " - ' -~" - "< ' t \ \ \~ ' ' ' " . . . . . . ~'~'""'~J¢"~'~¢'~//;';':'""
/00 CM / $EC
Fig. 9. Time series of 5 day vector average currents during the period 6 October to 4 December, 1969 measured at 5 depths at 39°12'N, 70°0YW.
The upper four records (Fig. 9) show a northeasterly flow for the period 19 October to 11 November followed by a southerly flow from 12 November to 2 December. Inspection of Figs. 1-8 reveal that this result corresponds closely to flow around isotherms, and leads to the interpretation that on 12 November the eddy center passed through the mooring site. Undoubtedly the most surprising feature of the measure- ments is the weakness of the flow, 30-50 era/see northeast and 50-70 cm/sec south. (In cyclonic eddies and in the Stream, surface flows are 150 to 250 cm/sec.) Geostrophic computations carried out from 1500 m STD lowerings at 70°30'W, 39°45'N and 39°30'N give surface currents in the north sector of the eddy as 75 cm/sec (assuming I000 db as a level of no motion); this estimate is closely comparable with the direct current

1214 P . M . S A t m D E R S
measurements. The relative weakness of the circulation is clearly related to the shallow- ness of the slope of the isotherms mentioned in the previous section during discussion of Fig. 5.
The two deep current records from near 1000 and 2000 m show a westward motion of between 2 and 5 cm/sec, close to the westward drift of both meander and eddy. In order to show the eddy circulation I have plotted Y the virtual displacement of a particle towards the north; if the northward velocity component is v the Y(t) = ftoV dt. In Fig. 10 the upper four instruments (10--200 m) show Y increasing (a northward component) up till 12 November; then Y decreasing (a southward component). The two deep records (amplified 20 times) show oscillatory motions of a few cm/sec and period ten days which nearly obscure the change over the entire 2 month record length; nevertheless I believe the 1000 m current responds in sympathy with the near surface observations whilst the 2000 m current does not. Support for this view is to be found in Table 1 which records approximately 1 month vector average currents for the six instruments. If the eddy circulation does not penetrate to the bottom, then steering of the eddy by bottom topography can be neglected.
Fig. 10.
1 5 0 0
1 0 0 0
, C
oa
¢*
% !
1 3
5 0 0
o 53
io~ ~ 2 0 7 ~
3 0 1 0 4 4
O~ " 2 0 6 6
I I I . I T r I I i ! 1 I ..v ] . t 1 I 1o 2 0 I 1o zo I ~o
Oct. Nov. Dec.
1969
Virtual displacement of water particles in north-south direction (current to north is positive) from six depths for two month period at 39°12'N, 70°0YW.
E N E R G Y T R A N S F O R M A T I O N S - - E D D Y L I F E T I M E
Once the anticyclonic eddy becomes distinct from the Stream it must decay. As we shall show its principal source of energy is to be found in the stratification, in the potential and internal energy associated with the downwarping of the isotherms

Anticyclonic eddies from the Gulf Stream 1215
Table 1. Vector average speeds and directions
' Meander ' ' Eddy" Depth Period 19 Oct.-12 Nov. Period 12 Nov.-2 Dec.
Instrument Speed Directed to Speed Directed to identification (m) (cm/sec) degrees, true (cm/sec) degrees, true
3173 13 37 035 50 185 3174 53 32 045 51 190 3175 105 21 032 48 200 3176 207 16 025 39 190 3103 1044 2.4 300 5"0 240
(1.5) (015) (3-0) (210) 3104 2066 1-0 310 2.1 245
(1.7) (065) (1.0) (175)
Data in parentheses represent the motion relative to a co-ordinate system travelling westward at 3 era/see.
(Fig. 5) and isopycnal surfaces. Two processes can reduce the eddy energy, (1) seasonal cooling of the eddy water column greater than that in the surrounding water and (2) dissipation of kinetic energy by molecular viscosity into heat.
LORENZ (1955) introduced the concept of available potential energy (APE) which represents the difference between the potential and internal energy of the existing stratification and that resulting from a levelling of all density surface by isentropic displacements. He shows that in an isolated fluid which is without dissipation the sum of the kinetic energy and the available potential energy is invariant: in the presence of dissipation their sum decreases with time.
The computation of APE requires a more detailed knowledge of the denlity field than we possess, but an estimate of its magnitude has been made in the following manner. Employing data from the Rockaway (ICNAF Cruise 69-2) and from FUGLISTER (1971), we have computed the potential energy of sample water columns found in the Slope Water, Gulf Stream and Sargasso Sea. Empirically we find a linear correlation between it and the temperature at 200 m in the column. Using the data for the period about one week after the formation of the eddy (Fig. 4), we have averaged the 200 m temperature, azimuthally and radially out to 100 Icm, and found it 1-85°C warmer than the surrounding Slope Water (here assumed at 11.5°C). The potential energy difference associated with this temperature change is found to be 3-5 × 10 a ergs/unit column (cm~); this multiplied by ~r × (100 kin) 2 gives an estimate of the APE of the eddy as 10 ~3 ergs. Such an approximate calculation has an uncertainty of at least a factor of 2.
The current measurements also enable us to compute the kinetic energy of the circulation in the vortex, viz.
bottom R . . . . . f .! ½ p(V2+ U '2 + V'e).27rrdrdz.
stir[ace ~ 0
-V is the mean tangential velocity at radius r and depth z, U is the radial mean velocity (assumed zero), V' and U' are the deviations of instantaneously measured components from the means and R is the effective outer radius of the eddy (about 75 kin). In our data we have made averages over 10 days for this computation, and in order to convert

1216 P . M . SAUNDERS
from time (see Fig. 9) to radius, we have made the frozen field assumption, convecting the mean flow past the mooring at a speed of 3 cm/sec. Thus we write r ---- 3-0 It--t0[ where to is the time of arrival of the eddy center. The total kinetic energy of the flow in the upper 200 m as computed from direct current measurements is found to be (2.3 4-0.8) × 1021 ergs of which about one-third is in the fluctuating components. Now the geostrophic computations mentioned earlier show that two-thirds of the kinetic energy in the vortex is contained in the upper 200 m: thus combining the geostrophic and directly measured currents, we conclude that the total kinetic energy in the vortex is (3"5 4- 1.0) × 1021 ergs. Accordingly, the available potential energy is very approximately 30 times the kinetic energy of the eddy. A similar disparity exists between APE and KE for large scale atmospheric motions (LORENZ, 1955).
A comprehensive study of the energetics of the decaying eddy is a formidable observational task and not one that can be accomplished with our data. Nevertheless certain further quantities can be estimated which may be instructive and serve as a guide to future studies. Figure I 1 shows a series of BT records made during the 2-month period 18 November to 26 January near the center of the eddy. A striking feature of these soundings is the surface cooling accompanied by the deepening of the mixed layer; surface temperature fell from 22 to 14°C whilst the mixed layer increased from 20 to 350 m. Below 400 m the temperature in the eddy may also decay but because of the
0 26 JAN 5JAN 4DEC 18 NOV
W J I /
iO0
2OO
3(30
4 0 0
5O0 0 5 10 15 20 25 30
TEMPERATURE, ° C
Fig. 11. Sequence of temperature-depth curves near the center of the eddy from about 10 days after its formation until last reported. Note the seasonal deepening and cooling of the mixed layer;
seasonal effects do not generally penetrate below 100-150 m in the Slope Water.

Anticyclonic eddies from the Gulf Stream 1217
uncertainty of the proximity of the sounding to the eddy center we cannot estimate its magnitude. A mean reduction of temperature of 4°C averaged over the upper 300 m of the water column represents a heat content loss of 120 kg cal/cm~; over a 2-month period this amounts to a loss of 2 kg cal/cm ~ day or 1.5 cal/cm~/minute. If all the heat were transferred across the interface, say two-thirds in the form of latent heat and one-third in the form of sensible heat, the evaporation would amount to nearly 1.5 m of water. The values for both total heat transfer and evaporation seem too large-- perhaps by a factor of 2 (see the survey by MALKUS, 1962) and suggest that redis- tribution of heat within the ocean may also be taking place. Further support for this idea is found in the existence of cool, fresh surface water near the eddy center, seen in Figs. 5 and 11. If an upper layer of the ocean responds directly to the action of the wind, then Slope Water must sometimes displace eddy surface water and continued cooling must subsequently mix the former down. Whatever its origin, the cooling of the water column in the eddy which is more intense and extends deeper than the cooling of the surrounding Slope Water represents a loss of available potential energy calculated to be roughly one-third of the initial value. If this intense exchange rate with the atmosphere continues, we predict an eddy lifetime of 6 months.
Further insight into processes by which available potential energy is lost can be gained by considering the two forms of kinetic energy present in the circulation. From the current meter records we can determine the rate of conversion of kinetic energy between the mean and f luc tuat ing (or turbulent) horizontal motion of the circulation. The contribution at a level Z to such a conversion can be shown to be measured by the integral
Jo \ or surface
and the contribution within the entire eddy by f Idz. % ottom
A derivation of the above integral for a rectilinear flow is given by STARR (Ch. 2, 1968); we have proceeded in a similar fashion, employing cylindrical-polar rather than Cartesian co-ordinates and making the assumption of azimuthal symmetry. From the available data we can make only a rough estimate of the above integral. Again 10 day averages were formed to define means and fluctuations and the spatial gradients estimated from the frozen field assumption used earlier. The question may be asked-- why 10 day averages ? We made trial calculations of the above integral for 5, 10, and 20 day means and these gave estimates for the period 19 October to 11 November at 53 m which were in the ratios 0-25:1:1.25. Tentatively we conclude that the 10 day averages contain the principal contribution to the energy conversion integral, although the sample length lends little support for such a generalization. Values derived by integrating from the outside of the meander-eddy to its center and from its center to the outside at each of the upper 4 instruments are shown in Table 2. Because the current records terminate early and because the integral has its principal contribution from large radii, the estimates for the latter period are almost certainly too small.
The first important conclusion to emerge is that energy flow is from fluctuating motion to the mean and not vice versa. It will be recalled that a similar result was found by WEBSTER (1961) for the Stream proper. We find that the outer* regions of the
*Outer for an anticyclonic eddy.

1218 P.M. SAUNDERS
Table 2. Conversion o f fluctuation kinetic energy to mean kinetic energy.
Contribution by level - - units, 10 I° ergs cm -I sec -x
Depth Instrument No. (m) Oct 19-Nov 11 Nov 12-Nov 28
3173 13 28 4.5 3174 53 17 4 3175 105 10 1 3176 207 3 -0.6
mean flow exhibit large negative lateral viscosity whilst the inner regions exhibit smaller positive values. Overall the outer regions predominate and we compute that the mean kinetic energy of the circulation increases at a rate of about 1015 ergs/sec.
Since we anticipate not an increase but rather a decrease with time a sink must exist for this energy flux. Probably the sink lies in the small scale interaction of the turbulent vertical Reynolds stress with the vertical shear of the horizontal motion and its subsequent dissipation to heat. A dissipation of 1016 ergs/sec over an eddy of radius 75 km leads to a dissipation in the entire water column of only 6 ergs/cm2/sec, a value comparable with estimates presented by WEBSTER (1969). The energy source
for this presumed dissipation from the mean motion, and say art equal amount from the equally energetic fluctuating motions, viz. 2 × 101~ ergs/sec must lie in the avail- able potential energy. Such a rate of energy loss gives a lifetime of 5 × 10⁷ sec or (accurate enough for our purposes) 1 year.
To summarize: the two energy conversion processes considered here, viz. exchange of heat with the atmosphere and dissipation through vertical mixing processes, lead to approximate estimates of an eddy lifetime ranging from 6 months to 1 year.
With such a life expectancy we might anticipate that observations of anticyclonic eddies in the Slope Water should be more frequent. Yet they are not. In a recent report (THOMPSON and GOTTHARDT, 1971) the solution to this dilemma was provided by observations in the winter of 1970-71 of the movement of a similar eddy. The latter was tracked moving at speeds of up to 10 cm/sec from 39°N, 71°W to 36°N, 74°W and there observed to coalesce with the Stream. We have evidence that the eddy described in this paper did likewise.
Acknowledgements--They are too numerous: to the Captain and crew of the C54Q aircraft and to Messrs. R. E. FRAZ~L and E. A. D~NTON who assisted in the airborne measurements; to Mr. G. H. VOLKMANN who directed observations on Chain Cruises 96--98; and to Mr. P. SMITh who assisted with the current computations. To the Coast Guard Oceanographic Unit who made available data from the Rockaway (ICNAF Cruise 69-2); to the Naval Oceanographic Office who made available ART and AXBT data and who prior to publication shared the vital new information described in the last paragraph: and to the Fleet Numerical Weather Facility for supplemental BT data. This work was made possible by support from the Office of Naval Research under Grant Number N00014-66-C0241 ; NR 083-004.
REFERENCES
FUGLISTEP. F. C. (1963) Gulf Stream '60. Prog. Oceanogr., 1, 265-283. FUGLISTER F. C. (1971) Cyclonic rings formed by the Gulf Stream 1965-66. In: Studies in physical
oceanography--d tribute to Georg Wiist on his 80th birthday, Gordon & Breach. (In Press)
Anticyclonic eddies from the Gulf Stream 1219
FUGLISTER F. C. and A. D. Voova~Is (1965) A new method of tracking the Gulf Stream. Limnol. Oceanogr. Suppl. 10, 115-124.
FtJGUSTER F. C. and L. V. WORTmNGTON (1951) Some results of a multiple ship survey of the Gulf Stream. Tellus, 3, 1-14.
ISELIN C. O'D. (1936) A study of the circulation of the western North Atlantic. Pap. phys. Oceanogr. Met. 4, (4), 1-101.
LORENZ E. N. (1955) Available potential energy and the maintenance of the general circulation. Telhts, 7, 157-167.
MALKUS J. S. (1962) Large-scale interactions, In: The Sea, M. N. HILL, editor, lnterscience, l , 88-294.
ORLANSKI I. (1969) The influence of bottom topography on the stability of jets in a baroclinic fluid. J. Atmos. Sci., 26, 1216-1232.
ROBINSON A. R. (1971) The Gulf Stream. A paper presented at the discussion meeting 'Ocean currents and their dynamics'. Phil. Trans. R. Soc., A270, 351-370.
ROarNSON A. R. and P. P. NIILER (1967) The theory of free inertial currents---1. Path and structure. Tellus, 19, 269-291.
SAUNDERS P. M. (1970) Corrections for airborne radiation thermometry. J. geophys. Res., 75, 7596-7601.
STARR V. P. (1968) Physics of negative viscosity phenomena. McGraw-Hill, 256 pp. THOMPSON B. J. and G. A. GOTTHARDT (1971) Life cycle of a North Atlantic eddy. Trans. Ant.
geophys. Un., 52, (4), 241. WARREN B. A. (1963) Topographical influences on the path of the Gulf Stream. Tellus, 15, 167-183. WEBSTER F. (1961) The effect of meanders on the kinetic energy balance of the Gulf Stream. Tellus,
13, 392-401. WEBSTER F. (1967) A scheme for sampling deep-sea currents from moored buoys. Trans., 2nd Inter.
Buoy Tach. Sympos., Mar. Tech. Soc., Washington, D.C., 419-431. WEBSTER F. (1969) Turbulence spectra in the ocean. Deep-Sea Res., Suppl. 16, 357-368. WILKERSON J. C. and V. E. NOBLE (1970) Time-space variations of the Gulf Stream boundary as
observed by airborne remote sensing techniques., In: Proc. 6th Symp. Remote Sensing of Environment, Ann Arbor, Mich., 2, 671-680.