Embed Size (px)
Citation preview

Anticipating households’ demand for peak
bandwidth.
Brahim Allan and Doug Williams
BT, Research and Innovation Department
Ipswich, United Kingdom
{brahim.allan; doug.williams}@bt.com
Abstract—This paper describes an analysis of the evolution of
peak bandwidth demand for households in the United Kingdom
out to 2033. The model used to make the predictions is based
on that developed by the Broadband Stakeholder Group but the
model is extended to 2033 and predictions related to TV usage,
web usage and file downloads are updated. A range of different
scenarios are used to probe likely peak bandwidth demand.
Whilst many networks are developed primarily to support video
services this exploration suggests that it is the requirements of
large file downloads, not video streaming, that generate the
highest levels of peak demand.
I. INTRODUCTION
The telecoms industry values early estimates of future bandwidth demand as they help inform and guide infrastructure investments. On a national scale these investments can run into billions of Euros. They have supported and stimulated changes in the way we communicate and will continue to do so.
Recent announcements on network investments use technologies that depend on deep penetration of fibre, sometimes all the way to the customer’s premises but more often with the final connection being copper in some form, either twisted pair or coaxial cable. It is now possible to reach nearly 1Gb/s downstream using technologies such as G.fast (1) (on twisted pair) or Docsis 3.0 on coaxial cable (2).
Estimates of future bandwidth demand have emerged from many sources. One method, which is re-visited in this work, came from the Broadband Stakeholder Group (BSG) who were considering future peak bandwidth demand for consumers in the UK (3).
Nielsen’s “Law” on Internet bandwidth, which mirrors other Internet laws such as Moore’s Law, states that “a high-end [business] user's connection speed grows by 50% per year.” Nielsen goes on to predict that 1 Tb/s “should be enough” (4). This is based on the requirements of a high resolution colour monitor and rather overlooks trends in compression technology and TV viewing. Further, Nielsen’s analysis refers to a business context, not households, and his predictions on growth consider supply (what is available) not demand (what is needed).
An Alcatel study on bandwidth demand (5), forecasting 75Mb/s would be sufficient in 2018, was focused on households, and in particular on video. This bandwidth was required to support multiple TV streams: one Ultra High Definition (UHD or ‘4k’) TV stream; two High Definition (HD) streams and one Standard
Definition (SD) stream. The video traffic was modelled using Monte Carlo techniques.
Cisco have developed their Visual Networking Index forecast tool to the rise in video traffic. It gives rise to some specific claims about future bandwidth requirements, for example, the Visual networking Index Report suggests that broadband speeds will double between 2014 and 2019 with global fixed broadband speeds reaching 43Mb/s, up from 20 Mb/s in 2014 (6). Cisco’s work is perhaps more concentrated on core total traffic than on peak traffic; they predict that consumer Internet video traffic will be 80 percent of all consumer Internet traffic in 2019.
The BSG model “Domestic demand for bandwidth” (3) attempts to build a model for bandwidth demand based on the anticipated usage from within households. It suggests that the top 1% of households would be satisfied with 38 Mb/s in 2023 for all but the busiest minute. For the median user, excluding the busiest four minutes each month, 19 Mb/s is thought to be sufficient in 2023. These compare with the median demand in 2013 and 2018 which are modelled as 8Mb/s and 12 Mb/s respectively.
The BSG model builds on real world evidence on bandwidth requirements of different applications and takes into account assumptions of the household types, derived using demographics, usage intensity and three main TV types: Standard Definition TV (SD); High Definition TV (HD) and Ultra-High Definition or “4k” TV (UHD). It aims to provide a holistic and quantified view of the peak bandwidth demand that will be required by UK households.
This paper revisits the BSG model, extending and updating the model to reflect a different set of assumptions about future
consumer behaviour. It is organized as follows. Section ΙΙ
describe the modelling structure. Section ΙΙΙ, presents the input
assumptions used in the revised model and Section ΙV presents the revised model results, exploring the impact of different sets of assumption on peak bandwidth requirements to 2033.
II. MODELLING STRUCTURE
Estimating bandwidth requirements is a complex activity. There is uncertainty about the way application, and the way they are used will evolve.. The emergence and success of applications and devices that are now common place: Facebook, YouTube, Netflix and iPads for example would have been very difficult to predict in 1995. Inevitably, we may be missing something, but to not try to estimate future demand is negligent.
19th International ICIN Conference - Innovations in Clouds, Internet and Networks - March 1-3, 2016, Paris.
141
The original model is described well in the BSG report (3). Here we provide an overview of the model and highlight some important assumptions and introduce a new set of scenarios.
The model generates a view on peak demand for bandwidth in households by considering the aggregated demand from individuals which is derived by developing models of the bandwidth required per application and models of application usage per individual as shown in Figure 1.
Figure 1 Model building block
The model estimates bandwidth for 156 different household types, aggregated as shown in the following figure. This update retains the original demographic types but our revision will affect both usage intensities and main TV types.
Figure 2 Household types
The model considers the main TV screen as the main end user consumption device. However, web surfing and IPTV could also be delivered to companion devices, such as smartphones and tablets, and secondary TV’s. We have introduced SUHDTV (Super Ultra High Definition TV - sometimes known as “8K TV”) viewing and ownership predictions alongside those for with SD, HD and UHD. The model generates a total of 156 household types by considering households with different numbers of adults and children (13 variants) and by defining 4 usage intensities and 3 main TV types.
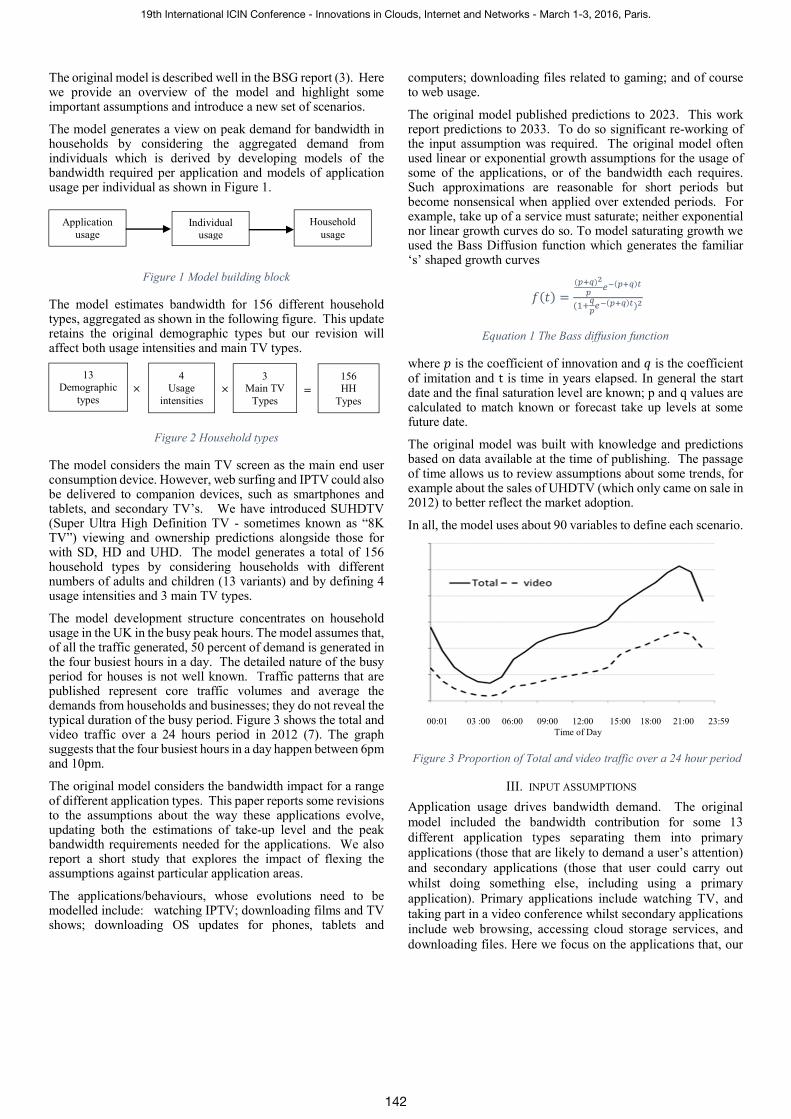
The model development structure concentrates on household usage in the UK in the busy peak hours. The model assumes that, of all the traffic generated, 50 percent of demand is generated in the four busiest hours in a day. The detailed nature of the busy period for houses is not well known. Traffic patterns that are published represent core traffic volumes and average the demands from households and businesses; they do not reveal the typical duration of the busy period. Figure 3 shows the total and video traffic over a 24 hours period in 2012 (7). The graph suggests that the four busiest hours in a day happen between 6pm and 10pm.
The original model considers the bandwidth impact for a range of different application types. This paper reports some revisions to the assumptions about the way these applications evolve, updating both the estimations of take-up level and the peak bandwidth requirements needed for the applications. We also report a short study that explores the impact of flexing the assumptions against particular application areas.
The applications/behaviours, whose evolutions need to be modelled include: watching IPTV; downloading films and TV shows; downloading OS updates for phones, tablets and
computers; downloading files related to gaming; and of course to web usage.
The original model published predictions to 2023. This work report predictions to 2033. To do so significant re-working of the input assumption was required. The original model often used linear or exponential growth assumptions for the usage of some of the applications, or of the bandwidth each requires. Such approximations are reasonable for short periods but become nonsensical when applied over extended periods. For example, take up of a service must saturate; neither exponential nor linear growth curves do so. To model saturating growth we used the Bass Diffusion function which generates the familiar ‘s’ shaped growth curves
���� �
�����
��������
� ��
���������
Equation 1 The Bass diffusion function
where � is the coefficient of innovation and � is the coefficient of imitation and t is time in years elapsed. In general the start date and the final saturation level are known; p and q values are calculated to match known or forecast take up levels at some future date.
The original model was built with knowledge and predictions based on data available at the time of publishing. The passage of time allows us to review assumptions about some trends, for example about the sales of UHDTV (which only came on sale in 2012) to better reflect the market adoption.
In all, the model uses about 90 variables to define each scenario.
Figure 3 Proportion of Total and video traffic over a 24 hour period
III. INPUT ASSUMPTIONS
Application usage drives bandwidth demand. The original
model included the bandwidth contribution for some 13
different application types separating them into primary
applications (those that are likely to demand a user’s attention)
and secondary applications (those that user could carry out
whilst doing something else, including using a primary
application). Primary applications include watching TV, and
taking part in a video conference whilst secondary applications
include web browsing, accessing cloud storage services, and
downloading files. Here we focus on the applications that, our
Application
usage Individual
usage
Household
usage
13
Demographic
types
3 Main TV
Types
156 HH
Types
4
Usage
intensities � � �
00:01 03 :00 06:00 09:00 12:00 15:00 18:00 21:00 23:59
Time of Day
19th International ICIN Conference - Innovations in Clouds, Internet and Networks - March 1-3, 2016, Paris.
142

analysis has suggested, will have the most significant impact on
peak bandwidth demand.
These include watching TV (specifically IPTV: Internet
Protocol Television i.e TV delivered over the IP network) and ;
downloading large files, including those for Operating System
(OS) updates and for console gaming.
A. TV viewing (Linear TV) and formats
To understand the impact of TV viewing on peak bandwidth demand of TV viewing we need to develop an understanding of the way TV viewing is changing in the UK. Thinkbox (8) have aggregated results from various sources to develop a picture of all forms of video viewing which suggest that in 2014:
• 79% is live broadcast TV; ‘Linear TV’ in this paper
• 15% is Playback TV; Personal Video Recorder (‘PVR Viewing’ in this paper)
• 3.6% is Broadcaster Video on Demand VoD, (‘Catch-Up TV’ in this paper)
• 2.6% is Subscription Video on Demand (‘Catalogue TV’ in this paper)
Of these, Catch-Up and Catalogue will result in demand for bandwidth. Linear TV may do so (if the content is distributed over networks as is the case for IPTV services from BT and Talk, Talk) and PVR Viewing may do so if the PVR function becomes network based.
Figure 4 shows our derived share of TV viewing by type from to 2010 to 2030 based on historical and extrapolated figures. We foresee that Linear TV viewing will continue to dominate TV watching behaviour though its share of viewing is expected to drop to 65% by 2030.
PVR Viewing, amongst those that had owned a PVR for several years and in the absence of Catch-Up services, peaks at about 12% of all viewing (9). We think that Catch-Up services will become more closely associated with the main TV. There is an increasing number of requests for BBC’s iPlayer both relatively and absolutely, from TV related devices, such as set-top boxes and TV media players, rather than PC’s tablets and mobiles. As Catch-Up services become an apparently intrinsic part of the base TV offering, through Smart TVs and through services like YouView, FreeView Play, Sky, FreeSat and others) (10) we anticipate that PVR Viewing will be be partially substituted by Catch-Up TV. Films and Sport is often not available on Catch-Up services, due to rights agreements, and for such content, PVR Viewing will remain a convenient option. Overall we predict PVR Viewing will decline slowly, reaching about 6% of all viewing by 2030.
Catch-Up TV demand, generated by services like BBC iPlayer, All4, ITV Hub and Demand 5 and Now TV from Sky, is expected to grow steadily. Statistics for BBC iPlayer, the UK’s most frequently used Catch-Up service, are well recorded (10) and show that requests to the service have been growing at about 38 percent year on year for the last 5 years. Requests for Catch-Up viewing from other channels are less well documented though the Broadcasters’ Audience Research Board (BARB) have recently started to report some of this viewing through their TV Player measurements (11).
For the longer term view we assume that requests to Catch-Up services will scale with the popularity of the Linear TV channels they serve. BBC iPlayer requests apparently dominate Catch-Up viewing with the iPlayer receiving an estimated 65% of Catch-Up requests (11) even though the BBC channnels only command about 32% of all Linear TV viewing. Overall, we predict that improved Catch-Up services from commercial channels and Catch-Up services that are more closely integrated with TV services will drive the popularity of Catch-Up TV to reach 17% by 2030.
Figure 4 Share of viewing by type
In the model, viewing of Catalogue TV, services such as Netflix and Amazon Prime are predicted to reach a total of about 12% of all TV viewing by 2030. Subscription VOD services are relatively new in the UK and there is plenty of opportunity for growth in subscription and usage. In 2015, Catalogue TV viewing is estimated to account for only 3% of all viewing (12). In 2014, 3 million, or approximately one in 10 UK households, have a Netflix subscription. In the US, subscription levels are higher and the anticipated shift to Catalogue TV is more dramatic with one source (13) predicting that up to 30% of all viewing will move to Catalogue TV sources by 2030. The UK figures we have derived from early BARB TV Player reports (11) are more modest, reflecting the differing nature of the TV market in the two countries.
The TV manufacturing industry is promoting a migration from HD sets to UHDTV (or ‘4K’) TV sets. The emergence of UHDTVs in turn promotes the development of UHD content. In time (we use a start date of 2023) SUHDTVs (“8k TVS”) may become available.
This habit of updating TVs is important as it affects the type of content that is produced and that affects the bandwidth required per stream. How much bandwidth is required per instance depends largely on whether the stream is SD, HD, UHD or even SUHD TV and on the efficiency of the video codec. We have based the analyses on the following:
1- Total amount of IPTV, in minutes per user per month
2- How the TV viewing is split between SD, HD, UHD and SUHD
3- How the TV set types are split between SD, HD, UHD and SUHD
4- An assumption that codec bandwidth efficiencies will improve at about 9% per annum
0%
10%
20%
30%
40%
50%
60%
70%
80%
90%
100%
20
10
20
11
20
12
20
13
20
14
20
15
20
16
20
17
20
18
20
19
20
20
20
21
20
22
20
23
20
24
20
25
20
26
20
27
20
28
20
29
20
30
Linear PVR Catch up Catalogue
Linear
PVR
Catch Up
Catalogue
19th International ICIN Conference - Innovations in Clouds, Internet and Networks - March 1-3, 2016, Paris.
143

UHDTV sets are being adopted much faster than expected when the BSG model was published. The price differential between UHDTV and HDTV sets is diminishing and the BSG prediction of 9% take up by 2023 is looking very modest considering that UHD adoption in 2015 was thought to be 6% according to a Strategy Analytics study (14), a figure not inconsistent with the 1.2 Million anticipated UHDTV sets sold in the UK by the end of 2015 (15).
Figure 5 Main TV set by resolution
Figure 5 shows the main TV set type distribution by resolution for SD, HD, UHD and SUHD TV sets from 2010 to 2030 based on a knowledge of the rate of UHD TV sales in 2015. SUHDTV sales are generated on the assumption that SUHDTV sets become available from 2023 (they were demonstrated at the Consumer Electronics Show in January 2016) and that their take up will be as fast as that achieved by UHD TVs.
The graph shows that, in 2015, 90 percent of UK households had at least one HDTV set. UHD TV sets could be found in about 6 percent of UK Households in 2015 (14) (15).
Figure 6 TV format watched by resolution
Although HDTVs ownership is high, close to 90% in 2015, the amount of TV viewing that is HD is relatively low. Based on a 10 minute period on a Sunday evening in September 2015, BARB data suggests that 25% of TV viewed is HD (11). To develop predictions that model this behaviour, we assume an ‘s’ curve growth with a start date that lags the emergence of the TV sets by 8 years.
Another important parameter is the bandwidth required per video stream. For Catch-Up and Catalogue TV services we use stream sizes for SD, HD and UHD of 2, 5 and 19 Mb/s in 2015. We assume the required bandwidth for a given resolution will decrease at about 9% per year due to improvements in compression technologies including the more wide-scale adoption of codecs developed using the H.265 specification. (17). Bandwidth requirements for Linear TV are taken as being 1.5x the bandwidth required for Catalogue and Catch-Up TV variants. This is because Linear TV often has to fix, in advance, the capacity through which it will stream content. The tendency is to specify capacity to accommodate the ‘worst case’ to ensure good enough picture quality at all times. Further, Linear TV does not have the option of using a more efficient multi-pass encode process based on analysis of scene complexity. By contrast the Catalogue TV offering from Netflix currently uses per title assessments of complexity to define encode profiles and this may shift to per scene assessments (18).
The original BSG model took no account of SUHDTV, had
modest assumptions about the take up of UHDTV and did not
differentiate the bandwidth requirements of Linear TV when
compared with Catch-Up and Catalogue TV. These are
addressed in this revision.
B. Mobile OS download
The size of Apple’s mobile Operating System downloads since 2007 is plotted in Figure 7. In June 2015, Apple announced iOS 9 and made a virtue of its smaller size, approximately 1GB. They also indicated that iOS updates would become more frequent but smaller. Likewise Microsoft have indicated that Windows 10 will be the last time they promote a wholesale change-out of an OS. Google too are working on enabling future Android upgrades to work on older devices, for which they are working to reduce the install size of the Android OS. Nevertheless we should anticipate that periodic upgrades in the underlying hardware will require occasional fundamental upgrades in operating system and that the value, to handset manufacturers, of using new software releases as a moment to generate new sales through focused marketing will ensure they persist with this pattern of occasional major upgrades. We therefore continue to use the relatively modest assumption adopted by BSG that the size of OS updates will grow at 10% per year, but we introduce the flexibility to affect the frequency of such downloads considering monthly or even fortnightly updates to be likely by 2033.
The wait time for an OS download has been a matter of concern. We have gained a sense, from user forums etc. that users appear unhappy with downloads that take hours to complete but tolerate download times of about 30 minutes. However we have also noted that the downloading of an OS update is becoming a background task. Settings on mobile devices allow the latest updates to be downloaded automatically in the background. Users are then invited to install it, usually after it having been downloaded overnight.
In this revision to the model we explore the impact of the download time for OS updates allowing the case where they are downloaded more slowly.
0%
20%
40%
60%
80%
100%
20
10
20
11
20
12
20
13
20
14
20
15
20
16
20
17
20
18
20
19
20
20
20
21
20
22
20
23
20
24
20
25
20
26
20
27
20
28
20
29
20
30
SD HD (2k) UHD (4k) SUHD (8k)
0%
20%
40%
60%
80%
100%
20
10
20
11
20
12
20
13
20
14
20
15
20
16
20
17
20
18
20
19
20
20
20
21
20
22
20
23
20
24
20
25
20
26
20
27
20
28
20
29
20
30
SD HD (2k) UHD (4k) SUHD (8k)
19th International ICIN Conference - Innovations in Clouds, Internet and Networks - March 1-3, 2016, Paris.
144
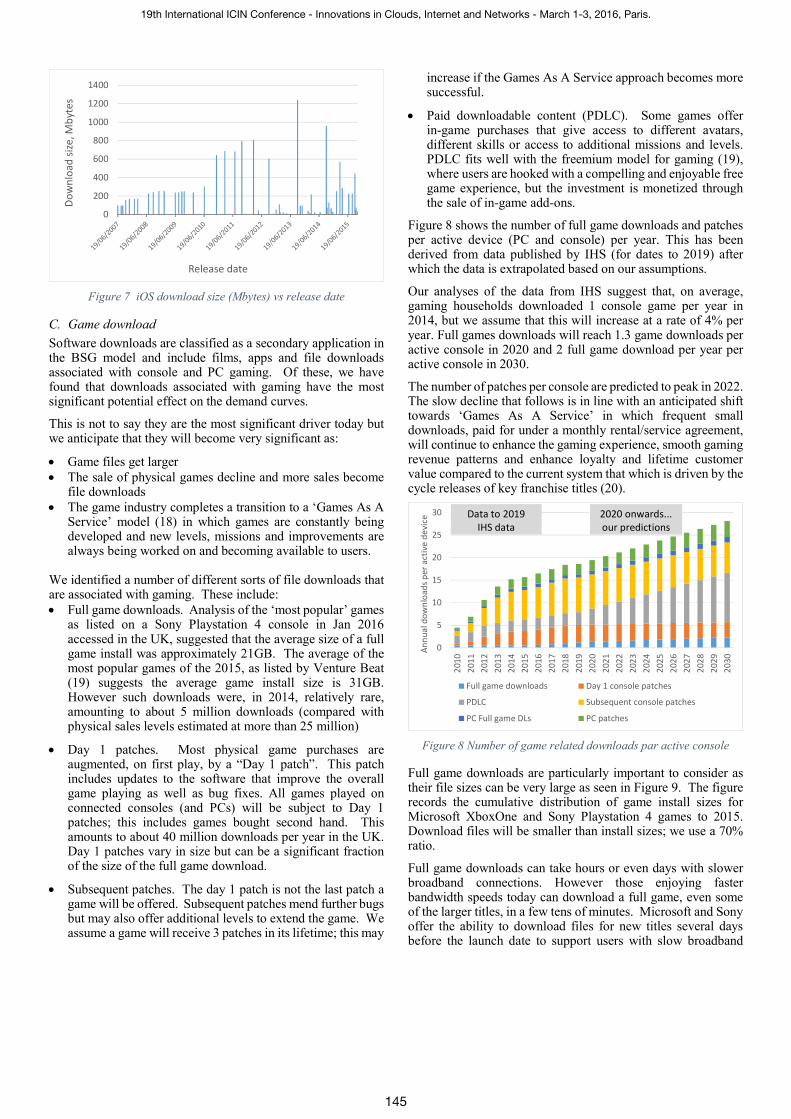
Figure 7 iOS download size (Mbytes) vs release date
C. Game download
Software downloads are classified as a secondary application in the BSG model and include films, apps and file downloads associated with console and PC gaming. Of these, we have found that downloads associated with gaming have the most significant potential effect on the demand curves.
This is not to say they are the most significant driver today but we anticipate that they will become very significant as:
• Game files get larger
• The sale of physical games decline and more sales become file downloads
• The game industry completes a transition to a ‘Games As A Service’ model (18) in which games are constantly being developed and new levels, missions and improvements are always being worked on and becoming available to users.
We identified a number of different sorts of file downloads that are associated with gaming. These include:
• Full game downloads. Analysis of the ‘most popular’ games as listed on a Sony Playstation 4 console in Jan 2016 accessed in the UK, suggested that the average size of a full game install was approximately 21GB. The average of the most popular games of the 2015, as listed by Venture Beat (19) suggests the average game install size is 31GB. However such downloads were, in 2014, relatively rare, amounting to about 5 million downloads (compared with physical sales levels estimated at more than 25 million)
• Day 1 patches. Most physical game purchases are augmented, on first play, by a “Day 1 patch”. This patch includes updates to the software that improve the overall game playing as well as bug fixes. All games played on connected consoles (and PCs) will be subject to Day 1 patches; this includes games bought second hand. This amounts to about 40 million downloads per year in the UK. Day 1 patches vary in size but can be a significant fraction of the size of the full game download.
• Subsequent patches. The day 1 patch is not the last patch a game will be offered. Subsequent patches mend further bugs but may also offer additional levels to extend the game. We assume a game will receive 3 patches in its lifetime; this may
increase if the Games As A Service approach becomes more successful.
• Paid downloadable content (PDLC). Some games offer in-game purchases that give access to different avatars, different skills or access to additional missions and levels. PDLC fits well with the freemium model for gaming (19), where users are hooked with a compelling and enjoyable free game experience, but the investment is monetized through the sale of in-game add-ons.
Figure 8 shows the number of full game downloads and patches per active device (PC and console) per year. This has been derived from data published by IHS (for dates to 2019) after which the data is extrapolated based on our assumptions.
Our analyses of the data from IHS suggest that, on average, gaming households downloaded 1 console game per year in 2014, but we assume that this will increase at a rate of 4% per year. Full games downloads will reach 1.3 game downloads per active console in 2020 and 2 full game download per year per active console in 2030.
The number of patches per console are predicted to peak in 2022. The slow decline that follows is in line with an anticipated shift towards ‘Games As A Service’ in which frequent small downloads, paid for under a monthly rental/service agreement, will continue to enhance the gaming experience, smooth gaming revenue patterns and enhance loyalty and lifetime customer value compared to the current system that which is driven by the cycle releases of key franchise titles (20).
Figure 8 Number of game related downloads par active console
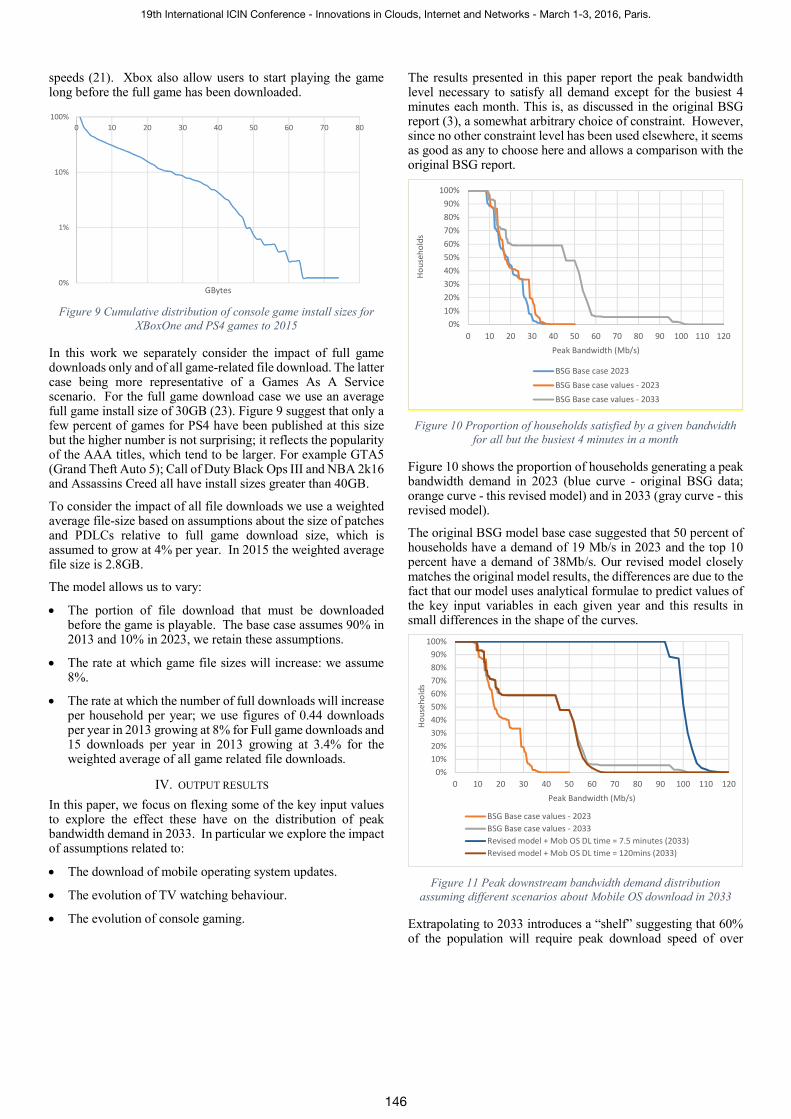
Full game downloads are particularly important to consider as their file sizes can be very large as seen in Figure 9. The figure records the cumulative distribution of game install sizes for Microsoft XboxOne and Sony Playstation 4 games to 2015. Download files will be smaller than install sizes; we use a 70% ratio.
Full game downloads can take hours or even days with slower broadband connections. However those enjoying faster bandwidth speeds today can download a full game, even some of the larger titles, in a few tens of minutes. Microsoft and Sony offer the ability to download files for new titles several days before the launch date to support users with slow broadband
0
200
400
600
800
1000
1200
1400
Do
wn
loa
d s
ize
, M
byt
es
Release date
0
5
10
15
20
25
30
20
10
20
11
20
12
20
13
20
14
20
15
20
16
20
17
20
18
20
19
20
20
20
21
20
22
20
23
20
24
20
25
20
26
20
27
20
28
20
29
20
30
An
nu
al d
ow
nlo
ad
s p
er
act
ive
de
vice
Full game downloads Day 1 console patches
PDLC Subsequent console patches
PC Full game DLs PC patches
Data to 2019
IHS data
2020 onwards...
our predictions
19th International ICIN Conference - Innovations in Clouds, Internet and Networks - March 1-3, 2016, Paris.
145
speeds (21). Xbox also allow users to start playing the game long before the full game has been downloaded.
Figure 9 Cumulative distribution of console game install sizes for
XBoxOne and PS4 games to 2015
In this work we separately consider the impact of full game downloads only and of all game-related file download. The latter case being more representative of a Games As A Service scenario. For the full game download case we use an average full game install size of 30GB (23). Figure 9 suggest that only a few percent of games for PS4 have been published at this size but the higher number is not surprising; it reflects the popularity of the AAA titles, which tend to be larger. For example GTA5 (Grand Theft Auto 5); Call of Duty Black Ops III and NBA 2k16 and Assassins Creed all have install sizes greater than 40GB.
To consider the impact of all file downloads we use a weighted average file-size based on assumptions about the size of patches and PDLCs relative to full game download size, which is assumed to grow at 4% per year. In 2015 the weighted average file size is 2.8GB.
The model allows us to vary:
• The portion of file download that must be downloaded before the game is playable. The base case assumes 90% in 2013 and 10% in 2023, we retain these assumptions.
• The rate at which game file sizes will increase: we assume 8%.
• The rate at which the number of full downloads will increase per household per year; we use figures of 0.44 downloads per year in 2013 growing at 8% for Full game downloads and 15 downloads per year in 2013 growing at 3.4% for the weighted average of all game related file downloads.
IV. OUTPUT RESULTS
In this paper, we focus on flexing some of the key input values to explore the effect these have on the distribution of peak bandwidth demand in 2033. In particular we explore the impact of assumptions related to:
• The download of mobile operating system updates.
• The evolution of TV watching behaviour.
• The evolution of console gaming.
The results presented in this paper report the peak bandwidth level necessary to satisfy all demand except for the busiest 4 minutes each month. This is, as discussed in the original BSG report (3), a somewhat arbitrary choice of constraint. However, since no other constraint level has been used elsewhere, it seems as good as any to choose here and allows a comparison with the original BSG report.
Figure 10 Proportion of households satisfied by a given bandwidth
for all but the busiest 4 minutes in a month
Figure 10 shows the proportion of households generating a peak bandwidth demand in 2023 (blue curve - original BSG data; orange curve - this revised model) and in 2033 (gray curve - this revised model).
The original BSG model base case suggested that 50 percent of households have a demand of 19 Mb/s in 2023 and the top 10 percent have a demand of 38Mb/s. Our revised model closely matches the original model results, the differences are due to the fact that our model uses analytical formulae to predict values of the key input variables in each given year and this results in small differences in the shape of the curves.
Figure 11 Peak downstream bandwidth demand distribution
assuming different scenarios about Mobile OS download in 2033
Extrapolating to 2033 introduces a “shelf” suggesting that 60% of the population will require peak download speed of over
0%
1%
10%
100%
0 10 20 30 40 50 60 70 80
GBytes
0%
10%
20%
30%
40%
50%
60%
70%
80%
90%
100%
0 10 20 30 40 50 60 70 80 90 100 110 120
Ho
use
ho
lds
Peak Bandwidth (Mb/s)
BSG Base case 2023
BSG Base case values - 2023
BSG Base case values - 2033
0%
10%
20%
30%
40%
50%
60%
70%
80%
90%
100%
0 10 20 30 40 50 60 70 80 90 100 110 120
Ho
use
ho
lds
Peak Bandwidth (Mb/s)
BSG Base case values - 2023
BSG Base case values - 2033
Revised model + Mob OS DL time = 7.5 minutes (2033)
Revised model + Mob OS DL time = 120mins (2033)
19th International ICIN Conference - Innovations in Clouds, Internet and Networks - March 1-3, 2016, Paris.
146

44Mb/s. This shelf is consistent with a secondary application, such as downloading a file, which is undertaken by at least 60% of the population. This is most likely to be caused by demands created from downloading a software file such as a game.
Figure 11 explores the impact of changing the assumptions about mobile Operating System files.
The blue curve represents the effect of more frequent fortnightly ‘on demand’ mobile OS downloads. By 2033, assuming 10% year on year growth in the file size, an OS download will be over 5GB. To download this in a tolerable 7.5 minutes requires a bandwidth of over 90Mb/s and since just about all households will have mobile devices this will create a requirement for all households to have a peak bandwidth capability greater than 100Mb/s. Allowing the same size OS file to download overnight (over 120 minutes) is modelled in the brown curve. This creates no significant change in the peak bandwidth demand and closely follows the base case – with a peak bandwidth requirement of 45Mb/s for about 60% of households.
Figure 12 Peak downstream bandwidth demand distribution
assuming different scenarios about IPTV in 2033.
Figure 12 shows the effect of incorporating updated predictions related to TV. These include incorporating the faster take up rates of UHDTV and SUHDTV and improved estimations of the bandwidth required per stream (blue graph), and even adopting an assumption that all TV is carried over IPTV (green curve). This latter assumption represents a significant change in TV distribution but is a scenario that should be considered. Broadcast spectrum may, over the next 18 years, be ‘recovered’ and sold for use by mobile operators but only if wired distribution of TV could be guaranteed. The most striking thing about this graph is that the shape of the distribution of peak bandwidth demand appears broadly the same as the base case except for the peak bandwidth required by the least demanding households; this increases from about 10Mb/s to 15Mb/s. This is because in this scenario all households will be watching HDTV over IPTV at some time and, given that watching TV and web browsing will almost certainly overlap for at least 4 minutes even in single occupancy households, the additional few Mb/s
to support IPTV must be included in the minimum peak bandwidth requirement.
Figure 13 Peak downstream bandwidth demand distribution
assuming different scenarios about the evolution of gaming in 2033
Finally, we consider the potential impact of gaming, considering how files that are already 20GB in size and may be presumed to grow at 8% year on year may be delivered in the future. In Figure 13, the pale blue curve shows that, if game files remain large and urgent (i.e. a pattern of pre downloading, or of games being designed to be playable after downloading a small fraction of the whole file has only limited success) then a significant minority (5%) of households will perceive a need for bandwidth approaching 1Gb/s. If the ‘Games As A Service’ model (GAAS) prevails, each downloaded game file will be smaller and gaming will be characterized by downloading many files ‘on a whim’ under a subscription model. In this case all gaming households (estimated to be about 60% of households by 2033) may consider a need for peak bandwidths of about 150Mb/s.
V. CONCLUSIONS
This paper presents predictions of the distribution of peak household bandwidth demand out to 2033 based on a model first published by the Broadband Stakeholder Group in 2013.
The model developed by Broadband Stakeholder Group appears robust and flexible and useful for exploring the impact of different scenarios.
The exploration reveals an initially surprising, but ultimately rational result, that variation in the likely evolution of IPTV will have an impact on the demand for peak bandwidth amongst the least demanding of households but no impact on the demand amongst more demanding households.
Varying likely scenarios around large file download behaviours have been shown to have significant impact on peak bandwidth demand. The paper cannot reveal which scenario is most likely as the different scenarios are dependent upon certain behaviours and expectations becoming normalized amongst the wider population. For example we cannot really know the time that future customers will be happy to wait for a file to download, nor can we anticipate with any certainty the degree to which future customers will be happy for files to be downloaded automatically, in anticipation of being required. However it is
0%
10%
20%
30%
40%
50%
60%
70%
80%
90%
100%
0 10 20 30 40 50 60 70 80 90 100 110 120
Ho
use
ho
lds
Peak Bandwidth (Mb/s)
BSG Base case values - 2023
BSG Base case values - 2033
Updated take-up and encoding rates
Updated take up and encoding rates + All TV is IPTV
0%
10%
20%
30%
40%
50%
60%
70%
80%
90%
100%
0 100 200 300 400 500 600 700 800 900 1000
Ho
use
ho
lds
Peak Bandwidth (Mb/s)
BSG Base case values - 2023
BSG Base case values - 2033
Full Games 20GB in 2015, not 7GB, 90% urgent by 2033
GAAS model, games 2GB in 2015, not 7GB, but all urgent
19th International ICIN Conference - Innovations in Clouds, Internet and Networks - March 1-3, 2016, Paris.
147

understood that saving time, offering control and instant gratification are highly marketable propositions and higher peak bandwidth up to 1Gb/s for example, could be marketed as offering these benefits.
The wide distribution of possible outcomes created by the different scenarios, which in turn depend strongly on likely future norms in behaviours, suggest that service and network providers will have to listen carefully to customers to understand which of the family of future behaviours are deemed acceptable. It underpins and reinforces a need for renewed focus on customer satisfaction as an arbiter of success rather than the achievement of particular peak bandwidth speed.
VI. ACKNOWLEDGMENTS
The authors would like to thank Robert Kenny, one of the
authors of the BSG model, for reviewing this work and for
valuable advice received during the preparation of this paper.
VII. REFERENCES
1. ITU-T. G.9701 : Fast access to subscriber terminals (G.fast)
- Physical layer specification. s.l. : ITU, 2014. 2. CableLabs. DOCSIS 3.0 Specification. 2015 : CableLabs,
December 02, 2013.
3. Kenny., R. and Broughton. T. Domestic demand for
bandwidth. London : Broadband Stakeholder Group, 2013.
4. Nielsen, J. Nielsen's Law of Internet Bandwidth. Nielsen
Norman Group. [Online] April 5th, 1998. [Cited: November
13th , 2015.] http://www.nngroup.com/articles/law-of-
bandwidth/.
5. Harstead E., and Sharpe R. Future Fiber-To-The-Home
bandwidth demands favor Time Division Multiplexing Passive
Optical Networks. s.l. : IEEE Communications Magazine, Nov
2012.
6. CISCO. Cisco Visual Networking Index: Forecast and
Methodology. Cisco White Paper. s.l. : Cisco, May 27, 2015.
7. Crabtree, B, et al. Moving to Content-Centric Networks.
s.l. : ICIN, 2013.
8. Thinkbox. www.thinkbox.tv. [Online] 2014. [Cited:
November 10th, 2015.] http://www.thinkbox.tv/nickable-
stuff/nickable-charts/total-uk-video-consumption/.
9. Thinkbox (Slide 35). Thinkbox Annual Review . s.l. :
Thinkbox, 2013.
10. Walker, I., BBC Communications.
http://downloads.bbc.co.uk. [Online] June 2015. [Cited:
November 10, 2015.]
http://downloads.bbc.co.uk/mediacentre/iplayer/iplayer-
performance-jun-jul15.pdf.
11. BARB. BARB TV Player Press Release. [Online] July 24,
2015. [Cited: November 10th, 2015.]
http://www.barb.co.uk/press/release/379.
12. Williams, C. Netflix signs up more than one in 10 British
households. [Online] The Telegraph, August 2014.
http://www.telegraph.co.uk/finance/newsbysector/mediatechn
ologyandtelecoms/media/11021782/Netflix-signs-up-more-
than-one-in-10-British-households.html.
13. Szalai, Georg. hollywoodreporter. [Online]
hollywoodreporter, 2014.
http://www.hollywoodreporter.com/news/netflix-3-million-uk-
subscribers-724558.
14. Watkins, David. Nearly 50% of US Homes Will Own a
4K TV by 2020, says Strategy Analytics. s.l. : Strategy
Analytics, 2015.
15. 4k's Market Today: SES Ultra HD conference. Nick
Simon, account Director GfK. London : s.n., 2015.
16. ITU-T. H.265 Specification: High Efficiency Video
Coding. s.l. : ITU-T, 2015.
17. Netflix. Per Title Encode Optimisation. Netflix tech Blog.
[Online] Netflix, December 14, 2015. [Cited: January 7th,
2016.] http://techblog.netflix.com/2015/12/per-title-encode-
optimization.html.
18. Bothun, Deborah. The evolution of video gaming and
content consumption. s.l. : PWC.
19. Grubb, Jeff. November 2015 NPD: Call of Duty outsells
Falout 4 as Playstation take November. Venture beat. [Online]
Dec 10th, 2015. [Cited: Jan 9th, 2016.]
http://venturebeat.com/2015/12/10/november-npd-cod-beats-
fallout/.
20. Kent, Jack. Xbox 360 freemium model. [Online] Xbox
360. http://www.freemium.org/xbox-360-live/.
21. Prolonging the magic: The potential eceonomy of teh 7th
generation console game. Niebor, D.B. 1, s.l. : Eludamos.
Journal for Computer Game Culture, 2014, Vol. 8.
22. Ask Microsoft anything about XBoxOne. [Online] UK
IGn, 2013. http://uk.ign.com/articles/2013/08/05/ask-
microsoft-anything-about-xbox-one.
23. Wikipedia. Bass diffusion model. Wikipedia. [Online]
https://en.wikipedia.org/wiki/Bass_diffusion_model.
24. Fitzgearld, B. Sony to Buy Assets of Streaming-Game
Pioneer OnLive. 2015 : Wall Street Journal, New York.
19th International ICIN Conference - Innovations in Clouds, Internet and Networks - March 1-3, 2016, Paris.
148