Embed Size (px)
Citation preview
Anticipated merger between Ladbrokes plc and certain businesses of Gala Coral
Group Limited Provisional findings report
20 May 2016
© Crown copyright 2016
You may reuse this information (not including logos) free of charge in any format or medium, under the terms of the Open Government Licence.
To view this licence, visit www.nationalarchives.gov.uk/doc/open-government-licence/ or write to the Information Policy Team, The National Archives, Kew, London TW9 4DU, or email: [email protected].
The Competition and Markets Authority has excluded from this published version of the provisional findings report information which the inquiry group considers should be excluded having regard to the three considerations set out in section 244 of the Enterprise Act 2002 (specified information: considerations relevant to
disclosure). The omissions are indicated by []. Some numbers have been replaced by a range. These are shown in square brackets. Non-sensitive wording
is also indicated in square brackets.

1
Contents Page
Provisional findings .................................................................................................... 4 1. The reference ....................................................................................................... 4 2. The Parties ........................................................................................................... 5
Ladbrokes ............................................................................................................. 5 Gala Coral ............................................................................................................. 6
3. The gambling industry in the UK ........................................................................... 7 Betting and gaming products ........................................................................... 7 Sector description ............................................................................................ 9 Market shares: retail LBOs ............................................................................ 13 Sector regulation ........................................................................................... 14
4. The Transaction and relevant merger situation ................................................... 14 Structure of the Transaction ................................................................................ 14 Rationale for the transaction ............................................................................... 15 Jurisdiction .......................................................................................................... 16
Enterprises ceasing to be distinct ....................................................................... 16 Turnover test ....................................................................................................... 17 Provisional conclusion on jurisdiction .................................................................. 17
5. Counterfactual..................................................................................................... 17 Views of the Parties ............................................................................................ 18 CMA assessment ................................................................................................ 18
6. Market definition.................................................................................................. 19 Product markets – Supply of gambling products ................................................. 19
Segmentation by channel – the online channel ............................................. 19 Background information on the profile of retail customers ............................. 20 Constraint from other gaming venues ............................................................ 38 Different types of gambling products ............................................................. 41 Provisional conclusion on product markets ................................................... 42
Geographic market – Gambling operations ........................................................ 42 Local dimension ............................................................................................. 42 National dimension ........................................................................................ 46
Product market – Operation of greyhound tracks ............................................... 46
Geographic market – Operation of greyhound tracks ......................................... 47 Product market – Greyhound media rights ......................................................... 47
Geographic market – Greyhound media rights ................................................... 48 7. Loss of competition at the local level in the supply of gambling products in the
retail channel ..................................................................................................... 49 Assessment framework ....................................................................................... 49 Entry/exit analysis ............................................................................................... 50
Insights into the role of location and distance ................................................ 51 Insights into the role of fascia ........................................................................ 53
Refurbishment requests ...................................................................................... 54
Insights into the role of location and distance ................................................ 54 Insights into the role of fascia ........................................................................ 56
Concessions ....................................................................................................... 57
Insights into the role of location and distance ................................................ 57 Insights into the role of fascia ........................................................................ 59
CMA survey ........................................................................................................ 60 Insights into the role of location and distance ................................................ 60

2
Insights into the role of fascia ........................................................................ 62 Other factors mentioned in the CMA survey, other surveys and further evidence ........................................................................................................................... 63
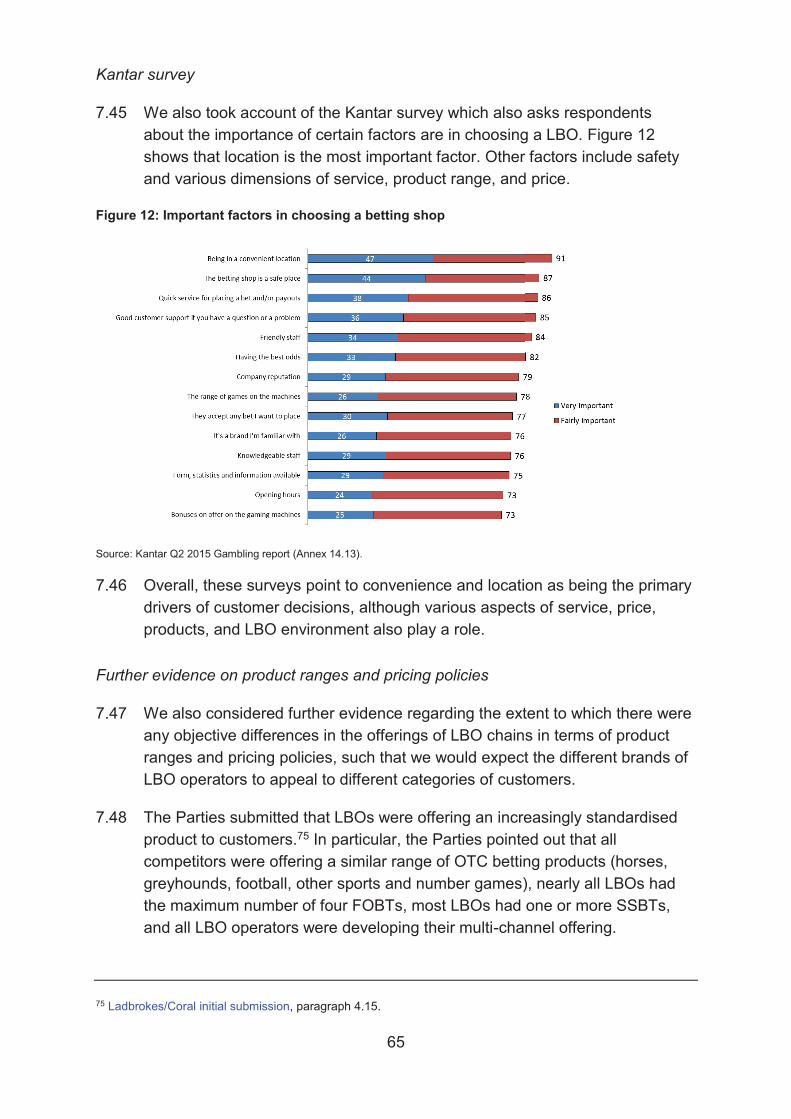
CMA survey ................................................................................................... 63 Further evidence on product ranges and pricing policies .............................. 65
Third parties ........................................................................................................ 67 Insights into the role of distance and location ................................................ 67 Insights into the role of fascia and differentiation ........................................... 67
Parties’ internal documents on relevance of location .......................................... 68 Conclusion on the factors driving competitive interaction between LBOs in local areas .................................................................................................................. 68
CMA methodology for identifying potential local competition concerns............... 69 Alternative methodologies based on fascia counting and distance bands ..... 70 The weighted share of shops approach ......................................................... 71 Establishing an association between the WSS and other pieces of evidence 79 Setting the candidate WSS intervention threshold ......................................... 83 Adjustments to identify local areas of concern............................................... 89
Provisional conclusion ........................................................................................ 93 8. Impact of the Transaction at the national level as a result of the aggregated loss
of competition at the local level .......................................................................... 93 Centrally-set parameters of competition ........................................................ 94 Impact of the Transaction on incentives relating to centrally-set parameters 98 Provisional conclusion ................................................................................. 103
9. National theories of harm .................................................................................. 103 Competition for the top-price in sports betting ............................................. 103 Competition for the top-price in horse racing ............................................... 104 Competition for best-price in football coupons ............................................. 106 Provisional conclusion ................................................................................. 109
Loss of potential competition ............................................................................ 109 Past entry decisions .................................................................................... 109
Future expansion plans ............................................................................... 110 Provisional conclusion ................................................................................. 110
Loss of innovation ............................................................................................. 111 The Parties’ submissions ............................................................................. 111 Third party’s submissions ............................................................................ 112 Internal documents ...................................................................................... 112 Provisional conclusion ................................................................................. 112
10. Operation of greyhound tracks .......................................................................... 113 Impact on racegoers ......................................................................................... 113
Factors driving customer choice .................................................................. 113 Views of the parties and third parties ........................................................... 114
The strength and location of other tracks .................................................... 115 Provisional conclusions ..................................................................................... 116 Impact of the Transaction on greyhound media rights ...................................... 116
Identity of key purchasers of media rights ................................................... 116 The Parties’ ability and incentive to increase prices of greyhound media rights ................................................................................................................... 118
Governance arrangements of the purchasers of media rights ..................... 120 11. Other theories of harm ...................................................................................... 122
The Parties’ relationship with Playtech ............................................................. 122 Background to the relationship and impact of the Transaction .................... 123
3
Potential for Playtech to favour the Merged Entity ....................................... 123 Provisional conclusion ................................................................................. 127
Online betting and gaming ................................................................................ 127
Buyer power in the acquisition of media rights .................................................. 128 12. Countervailing factors - New entry and expansion ............................................ 129
Parties’ submissions ......................................................................................... 130 Third parties ...................................................................................................... 131 CMA assessment .............................................................................................. 132 Provisional conclusion ...................................................................................... 133
13. Overall provisional conclusions ......................................................................... 134
Appendices
A: Terms of reference and conduct of the inquiry B: Regulation C: Survey evidence D: Price differences between online and retail E: Econometric analysis F: Refurbishment decisions G: Concession policies H: Variable margins I: Sensitivity analysis J: List of SLC areas by reference to the location of the centroid LBO
Glossary
4
Provisional findings
1. The reference
1.1 On 11 January 2016, the Competition and Markets Authority (CMA) referred the anticipated merger between Ladbrokes plc (Ladbrokes) of certain businesses (Coral) of Gala Coral Group Limited (the Transaction) for further investigation and report by a Group of CMA Panel Members (Inquiry Group).
1.2 In exercise of its duty under section 36(1) of the Enterprise Act 2002 (the Act), the CMA must decide the following questions:
(a) whether arrangements are in progress or in contemplation which, if carried into effect, will result in the creation of a relevant merger situation; and
(b) if so, whether the creation of that situation may be expected to result in a substantial lessening of competition within any market or markets in the United Kingdom for goods or services.
1.3 Our terms of reference are in Appendix A. The original statutory deadline to publish our final report was 24 June 2016. Following the decision by the inquiry group, to extend the reference period, under section 39(3) of the Act, we are required to publish our final report by 19 August 2016.1
1.4 This document, together with its appendices, constitutes our provisional findings, notified to Ladbrokes and Coral and published in accordance with the CMA’s rules of procedure.2 Further information relevant to this inquiry, including a non-confidential version of the joint submission received from Ladbrokes and Coral, as well as summaries of evidence received in oral hearings, can be found on the case page.
1.5 Throughout this document, where relevant, we refer to Ladbrokes and Coral collectively as the Parties.
1 See the Notice of extension of the inquiry statutory period (20 May 2016). 2 CMA Rules of Procedure for Merger, Market and Special Reference Groups (CMA17), Rule 11.

5
2. The Parties
Ladbrokes
2.1 Ladbrokes is a company listed on the London Stock Exchange, and its shares are held through a large range of small shareholdings.3 Ladbrokes operates a betting4 and gaming5 business in the UK and in a number of other countries including Ireland, Belgium, Spain and Australia.6 As of 12 October 2015, it operated 2,154 licensed betting offices (LBOs) in Great Britain and 77 in Northern Ireland, offering betting services for sporting and non-sporting events and gaming services. It also offers betting and gaming services through its Ladbrokes.com website and via mobile applications and it owns the Betdaq betting exchange. Ladbrokes operates a telephone betting service and maintains pitches at approximately half of UK racecourses.
2.2 In addition, Ladbrokes owns and operates two greyhound tracks at Crayford in Kent and Monmore Green in the West Midlands. Ladbrokes is also a member of the Bookmakers Afternoon Greyhound Service (BAGS) and holds a 23.41% interest in Satellite Information Services (Holdings) Limited (SIS).
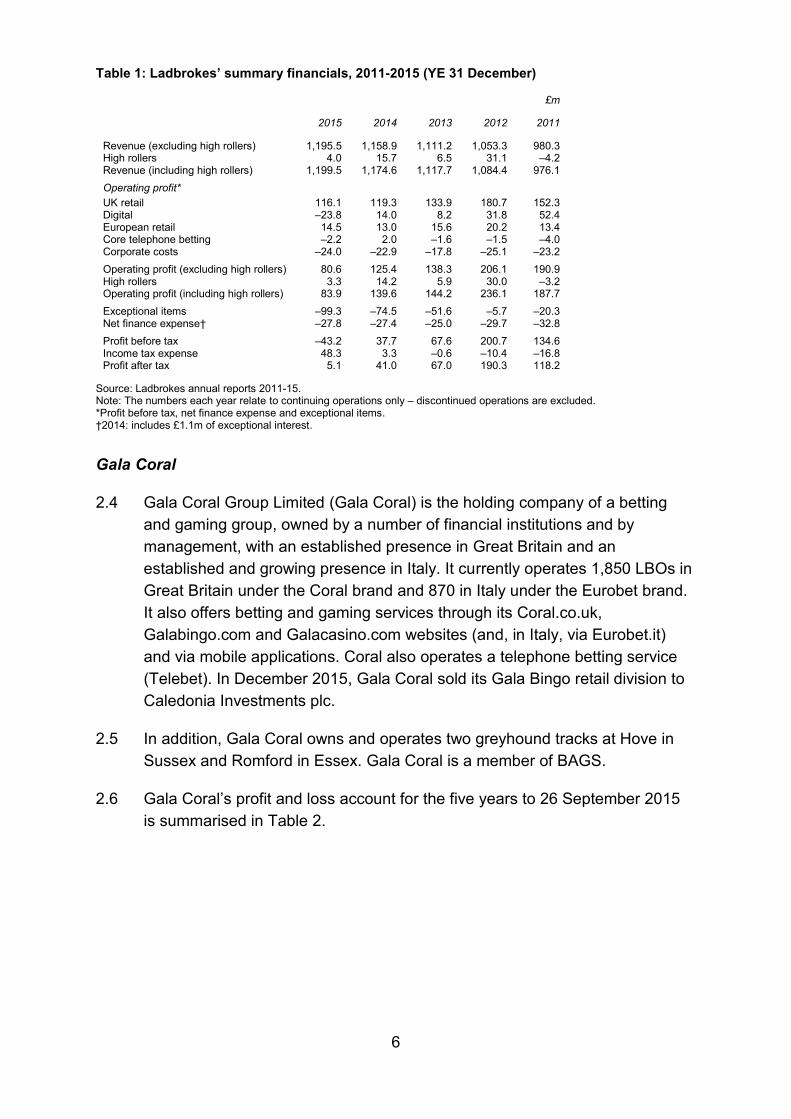
2.3 Ladbrokes’ profit and loss account for the five years to 31 December 2015 is summarised in Table 1 below.
3 No single shareholder of Ladbrokes holds in excess of 10% of the voting rights. [] 4 By betting we mean making or accepting a bet on: (a) the outcome of a race, competition or other event or process; or (b) the likelihood of anything occurring or not occurring, or whether anything is or is not true. 5 By gaming we mean playing a game of chance for a prize. 6 We have not included a description of Ladbrokes’ international operations in this document, as they are not relevant to the questions under consideration in the present inquiry.
6
Table 1: Ladbrokes’ summary financials, 2011-2015 (YE 31 December)
£m
2015 2014 2013 2012 2011
Revenue (excluding high rollers) 1,195.5 1,158.9 1,111.2 1,053.3 980.3 High rollers 4.0 15.7 6.5 31.1 –4.2 Revenue (including high rollers) 1,199.5 1,174.6 1,117.7 1,084.4 976.1 Operating profit* UK retail 116.1 119.3 133.9 180.7 152.3 Digital –23.8 14.0 8.2 31.8 52.4 European retail 14.5 13.0 15.6 20.2 13.4 Core telephone betting –2.2 2.0 –1.6 –1.5 –4.0 Corporate costs –24.0 –22.9 –17.8 –25.1 –23.2 Operating profit (excluding high rollers) 80.6 125.4 138.3 206.1 190.9 High rollers 3.3 14.2 5.9 30.0 –3.2 Operating profit (including high rollers) 83.9 139.6 144.2 236.1 187.7 Exceptional items –99.3 –74.5 –51.6 –5.7 –20.3 Net finance expense† –27.8 –27.4 –25.0 –29.7 –32.8 Profit before tax –43.2 37.7 67.6 200.7 134.6 Income tax expense 48.3 3.3 –0.6 –10.4 –16.8 Profit after tax 5.1 41.0 67.0 190.3 118.2
Source: Ladbrokes annual reports 2011-15. Note: The numbers each year relate to continuing operations only – discontinued operations are excluded. *Profit before tax, net finance expense and exceptional items. †2014: includes £1.1m of exceptional interest.
Gala Coral
2.4 Gala Coral Group Limited (Gala Coral) is the holding company of a betting and gaming group, owned by a number of financial institutions and by management, with an established presence in Great Britain and an established and growing presence in Italy. It currently operates 1,850 LBOs in Great Britain under the Coral brand and 870 in Italy under the Eurobet brand. It also offers betting and gaming services through its Coral.co.uk, Galabingo.com and Galacasino.com websites (and, in Italy, via Eurobet.it) and via mobile applications. Coral also operates a telephone betting service (Telebet). In December 2015, Gala Coral sold its Gala Bingo retail division to Caledonia Investments plc.
2.5 In addition, Gala Coral owns and operates two greyhound tracks at Hove in Sussex and Romford in Essex. Gala Coral is a member of BAGS.
2.6 Gala Coral’s profit and loss account for the five years to 26 September 2015 is summarised in Table 2.

7
Table 2: Gala Coral's summary financials, 2011-2015 (YE September)
£m
2015 2014 2013 2012 2011
Total turnover 1,291.8 1,243.4 1,184.3 1,189.5 1,117.0 Operating profit* Coral Retail 114.1 115.6 120.0 138.4 142.9 Eurobet Retail 0.5 5.5 1.8 2.3 2.5 Online 41.0 38.0 16.1 19.9 28.2 Gala Retail† 36.5 34.8 24.9 43.5 41.4 Gala Casino‡ - –0.7 10.4 14.5 16.9 Telebet 1.1 –0.5 High rollers§ –7.6 - Corporate¶ –20.4 –20.7 –18.4 –25.6 –71.8 Operating profit 165.2 172.0 154.8 193.0 160.1 Exceptional items –193.4 –128.4 –72.9 –74.2 –579.9 Profit on disposal 90.0 7.3 –54.3 –2.8 21.9 Net finance expense –169.0 –217.1 –233.1 –235.0 –227.8 Profit before tax –107.2 –158.1 –205.5 –119.0 –625.7 Income tax expense –3.9 –2.2 –13.2 –4.2 –17.7 Profit after tax –111.1 –160.3 –218.7 –123.2 –643.4
Source: Gala Coral annual reports 2011-15. *Operating profit is stated pre-exceptional items. †Discontinuing post-2015 year end. ‡Business disposed of during 2013 and 2014. §Discontinued 2015. ¶'Group administrative expenses' plus 'Other operating income' for 2011.
3. The gambling industry in the UK
3.1 In this section, we first describe the various betting and gaming services offered to customers by bookmakers before going on to address the size of the overall sector, the growth of the online channel and relative importance of the different types of gambling7 products. Finally, we set out the shares of supply of the major bookmakers by number of LBOs and note the presence of regulation in this industry.
Betting and gaming products
3.2 Gambling products offered by the Parties include both betting (for example on sports and other events) and gaming (for example games of chance such as virtual roulette, and games involving an element of skill such as blackjack).
Betting
3.3 Customers may bet on the outcomes of various sports events, including horse racing, greyhound racing, football, golf or tennis, or on other special events, such as the outcome of the general election or whether there will be snow on Christmas Day. Betting may be over-the-counter (OTC) in LBOs (off-course) or at stands on-course, via Self Service Betting Terminals (‘SSBTs’) in LBOs,
7 By gambling we mean betting, gaming and participating in a lottery.
8
online (via PC, tablet or mobile phone) or via telephone. Customers are also able to bet on virtual racing and sports and other products based on randomly generated numbers, including the outcome of Lottery events (such as the Irish Lottery)8 and other products created specifically for LBOs, such as 49’s.9 A customer may place a bet on a horse or dog race at odds offered by a bookmaker in advance of a race starting (these are called ‘early prices’), or they may choose to place their bet at ‘starting prices’. The starting price on a horse race is the price at the start of the race as set and validated by the Starting Price Regulatory Committee,10 communicated to all bookmakers on an industry-wise basis by SIS and Turf TV. Some bookmakers, particularly online, offer ‘best odds guaranteed’. This means that if the bettor takes an early price on a race, and the starting price is higher, they get the starting price instead. In other words, they are always paid out at the highest price – either the early price or the starting price. Approximately 80 to 85% of horse racing bets across the industry are placed by bettors at the starting price set by reference to the on-course business; for greyhound racing, the figure is approximately 98%.
3.4 In setting odds, bookmakers will attempt to determine the probability of a given outcome occurring. In estimating the probability of Manchester United winning at home, for example, the bookmaker will try to account for the form of the teams, injuries to key players, influence of the crowd, the referee and many other factors.
3.5 The bookmaker will also have to have regard for the money that is likely to be placed. They will price their odds to ensure that sufficient action is taking place on both sides of a bet. If a bookmaker’s betting odds are not aligned to public opinion, then a disproportionately large amount of money will be placed on only one side of a bet. A bookmaker’s priority is to drive as much volume as possible with odds that adequately reflect the true probabilities of the outcomes. In reality, this never leads to a balanced book (ie a book that results in a positive margin regardless of the outcome) because the majority of bets are made on the favourites.
3.6 The bookmaker will also add a profit margin (known as the ‘overround’) by skewing the odds slightly in their favour. Thus, instead of the odds applied to
8 Irish Lottery is randomly generated numbers betting products for sale in LBOs. 9 49’s is a twice daily draw that takes place at lunchtime and teatime every day. Customers can bet on one to five numbers from the 49 in each draw (bookmakers’ bets may vary). Six numbers and a ‘booster ball’ are drawn and customers can select to play either the six number or seven number draw (which includes the booster ball to increase the chances of winning). See the 49’s website. 10 A committee designated by the Press Association.
9
all the expected outcomes adding up to 100%, they will add up to something in excess of 100%, ensuring that, on average, the bookmaker makes a profit.
3.7 Bookmakers employ teams of traders to determine what odds they should offer or source such odds from third parties. For most bookmakers, odds are set centrally by each bookmaker and communicated to each retail store (and the bookmaker’s website, if it has an online channel).
Gaming
3.8 Bookmakers offer customers the opportunity to play games of chance, such as roulette, bingo and various slot machine games, and games involving skill, such as poker and blackjack. By far the most popular is roulette (accounting for approximately []% of total gaming stakes in FY15 for Ladbrokes and []% for Coral, for example).
3.9 Bookmakers offer gaming both in-store, using computerised gaming machines (known as ‘Fixed Odds Betting Terminals’ or ‘FOBTs’)11, and via their online channels (via PC, tablet or mobile phone). Gaming machines used in-store are primarily category B2 machines with a few B3 and C category machines.12 B2 machines are permitted to accept a maximum stake of £10013 and the maximum payout is £500. For B3 machines the maximum stake is £2 and the maximum payout is £500.14 For category C machines the maximum stake is £1 and the maximum payout is £100. LBOs are limited to a maximum of four B2 or B3 machines in each store, and as a result there are four machines in nearly all LBOs.
3.10 For most games other than roulette, the amount returned to players by way of prizes (‘Return to Player’ or ‘RTP’) is set by the machine’s manufacturer, game supplier and/or the bookmaker. For roulette, the rules of the game set the RTP.15
Sector description
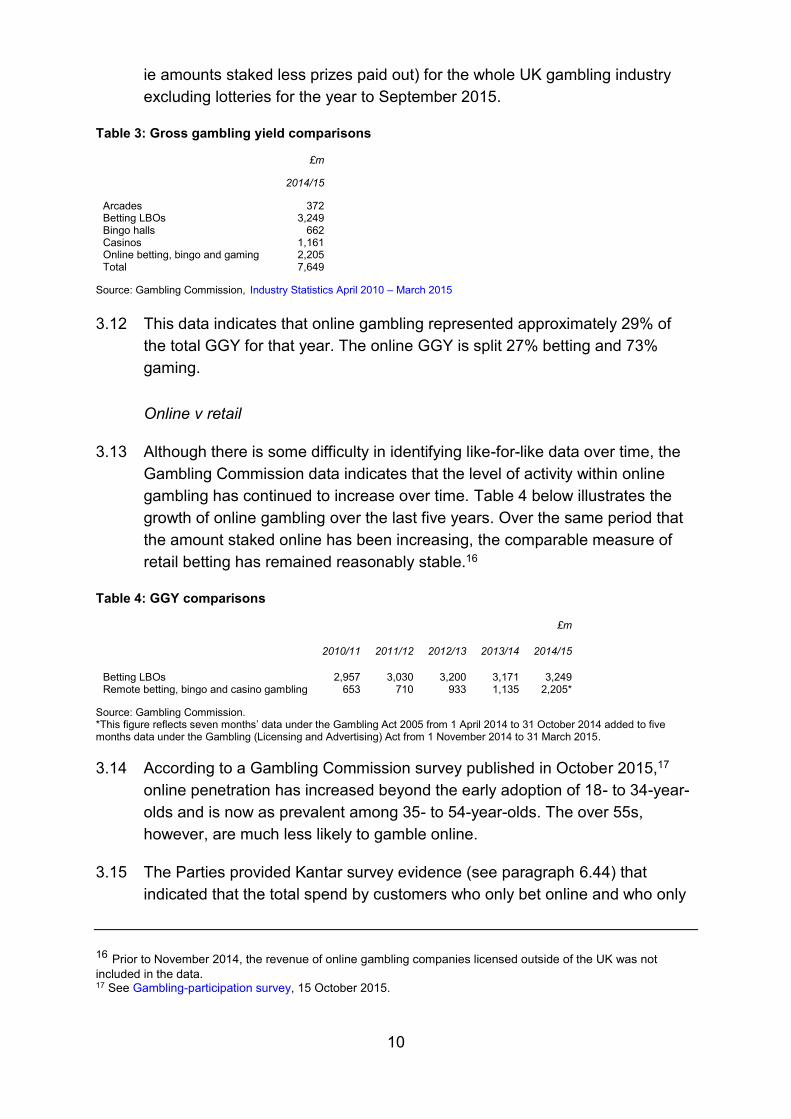
3.11 Table 3 shows data from the Gambling Commission which estimates the gross gambling yield (‘GGY’, equal to consumer expenditure on gambling,
11 The majority of gaming machines in the UK are created by Inspired Gaming, and Global Draw 12 B2 machines may also offer category B3 games and certain lower categorised gaming content. 13 No more than £50 can be staked without either staff intervention or the use of account-based play. 14 Gambling Commission, Gaming machine categories. 15 The odds are fixed consistent with standard roulette rules. If a bet is placed on a single number, for example, and wins the payout (in European roulette) is 35 to 1, whereas the odds against winning are 36 to 1.
10
ie amounts staked less prizes paid out) for the whole UK gambling industry excluding lotteries for the year to September 2015.
Table 3: Gross gambling yield comparisons
£m
2014/15
Arcades 372 Betting LBOs 3,249 Bingo halls 662 Casinos 1,161 Online betting, bingo and gaming 2,205 Total 7,649
Source: Gambling Commission, Industry Statistics April 2010 – March 2015
3.12 This data indicates that online gambling represented approximately 29% of the total GGY for that year. The online GGY is split 27% betting and 73% gaming.
Online v retail
3.13 Although there is some difficulty in identifying like-for-like data over time, the Gambling Commission data indicates that the level of activity within online gambling has continued to increase over time. Table 4 below illustrates the growth of online gambling over the last five years. Over the same period that the amount staked online has been increasing, the comparable measure of retail betting has remained reasonably stable.16
Table 4: GGY comparisons
£m
2010/11 2011/12 2012/13 2013/14 2014/15
Betting LBOs 2,957 3,030 3,200 3,171 3,249 Remote betting, bingo and casino gambling 653 710 933 1,135 2,205*
Source: Gambling Commission. *This figure reflects seven months’ data under the Gambling Act 2005 from 1 April 2014 to 31 October 2014 added to five months data under the Gambling (Licensing and Advertising) Act from 1 November 2014 to 31 March 2015.
3.14 According to a Gambling Commission survey published in October 2015,17 online penetration has increased beyond the early adoption of 18- to 34-year-olds and is now as prevalent among 35- to 54-year-olds. The over 55s, however, are much less likely to gamble online.
3.15 The Parties provided Kantar survey evidence (see paragraph 6.44) that indicated that the total spend by customers who only bet online and who only
16 Prior to November 2014, the revenue of online gambling companies licensed outside of the UK was not included in the data. 17 See Gambling-participation survey, 15 October 2015.
11
play games online (ie do not visit a LBO) has now surpassed total spend by customers who only bet or game in LBOs. According to the Parties,18 between Q2 2014 and Q2 2015, the proportion of total spend by retail-only bettors19 declined from 44% to 34%, while online only (regular) bettors’ spend increased from around 28% to around 34%. The trend is even more pronounced for regular gamers: the proportion of total spend by retail-only gamers declined from around 46% to nearly 28%, while online only (regular) gamers increased from around 17% to nearly 31%.
3.16 Both the Gambling Commission data and the Parties’ evidence demonstrate that, as a percentage of total gambling spend, the proportion spent by retail-only customers has declined. However, in absolute terms, the level of retail gambling has remained fairly stable. In other words, there has been strong growth in the online channel, but this has not coincided with a comparable rate of decline in the retail channel in absolute terms.
Gambling activities
3.17 Since their introduction, FOBTs (also referred to as gaming machines) have represented a material share of the overall retail gambling industry GGY. Figure 1 shows the breakdown of off-course GGY by segment for 2014/15.
18 Ladbrokes/Coral initial submission, paragraph 3.15. 19 Retail-only is used to refer to customers who only use betting or gaming services in LBOs.
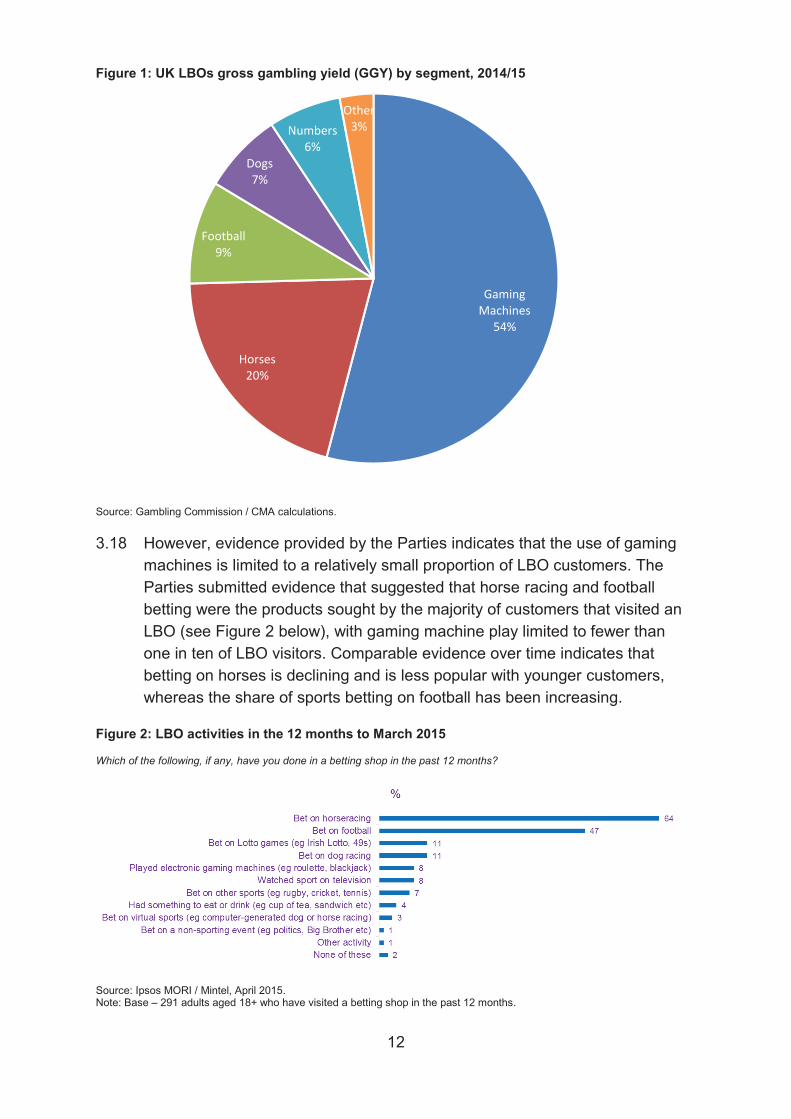
Gaming Machines
54%
Horses20%
Football9%
Dogs7%
Numbers6%
Other3%

13
Market shares: retail LBOs
3.19 For the last ten years or so, the number of LBOs has been stable at around 9,000, although there has been a decline of more than 3% over the 18 months to September 2015 (there were 8,819 LBOs as at 30 September 2015).20 Figure 3 shows the market share of LBOs by operator as at September 2015, based on Gambling Commission data, which splits out the number of LBOs for the largest four operators.
Figure 3: Share of LBOs, by operator, September 2015
Source: Gambling Commission / CMA calculations.
3.20 Historically, the number of LBOs operated by independent LBO operators has declined at the same time as the main national LBO operators (William Hill, Ladbrokes, Coral, Betfred and Paddy Power Betfair) have continued to grow their estates. More recently, as the economic environment has become more challenging, independent LBO operators have continued to close LBOs, and some of the main national LBO operators have also either reduced the rate at which they are growing their estates or started to close more unprofitable LBOs. The big four plus Paddy Power Betfair have approximately 91% of UK LBOs. Data provided by the Parties indicates that the number of independently owned LBOs is approximately 933, split among 217 independent operators, although these include some operators with chains of LBOs, generally on a regional basis. For example, Jennings operates around
20 Gambling Commission, Industry statistics.
William Hill26%
Ladbrokes25%
Gala Coral Group21%
Betfred16%
Other13%

14
100 LBOs. The Gambling Commission told us that the main driver behind the recent decline in the overall number of LBOs has been the growth in operating costs (including higher taxes on machine revenues and higher prices for media rights) outpacing the growth in revenues.
3.21 All the large LBO operators have an online presence but there are also many online-only operators (eg Bet365, 888, Bwin.party, Sky Bet / Sky Vegas, 32Red).
Sector regulation
3.22 We noted that the gambling industry is also characterised by a certain level of regulation including restrictions over the supply of gambling products and we took this into account in our assessment. Further relevant detail on the regulation of the UK gambling industry is provided in Appendix B.
4. The Transaction and relevant merger situation
Structure of the Transaction
4.1 On 24 July 2015, Ladbrokes and Gala Group Finance plc entered into an agreement to merge their businesses by way of the acquisition by Ladbrokes of the entire issued share capital of GC Group (Jersey) Limited, which is the holding company for the Coral retail, Eurobet retail and Coral online businesses (referred to in this report as Coral). The Parties made a public announcement regarding the Transaction on the same date.
4.2 Gala Coral’s ‘bricks-and-mortar’ bingo operations (under the Gala Bingo brand) and the Gala Coral property companies21 will not form part of the Transaction.
4.3 In consideration for the Transaction,22, Ladbrokes will issue new ordinary shares to the existing shareholders of Coral representing 45.88% of the enlarged issued share capital. 23 Existing Ladbrokes shareholders will own
21 Gala Coral operated under an ‘opco/propco’ structure with rentals charged between group companies for properties which acted as security under a propco loan taken out in 2005. [] 22 The total enterprise value attributed to Coral by the Transaction is approximately £1.7 billion. The total enterprise value of the combined entity, Ladbrokes Coral, is approximately £3.1 billion, with a combined equity value of £1.9 billion. These values are subject to change in accordance with Ladbrokes’ share price from time to time []. 23 This is prior to the placing of additional shares and the provision of shares to Playtech, as discussed below in section 11, paragraphs 11.3 and 11.4.

15
54.12% of the Merged Entity.24 Following completion, the combined entity will be renamed Ladbrokes Coral plc.
4.4 The Transaction is conditional, among other things, on merger clearance by the CMA in the UK, merger clearance by the Competition and Consumer Protection Commission in the Republic of Ireland,25 and all material regulatory licenses, consents or authorisations required for the operation of the combined entity.
Rationale for the transaction
4.5 Ladbrokes and Coral have stated26 that five opportunities have been identified and will be central to the strategy of the new Ladbrokes Coral. They are:
(a) the potential to deliver faster online growth;
(b) the creation of the UK’s largest LBO estate, which is expected to be strongly cash generative, more efficient and sustainable in the long term;
(c) the creation of an extensive international portfolio of regulated businesses;
(d) the delivery of significant synergies; and
(e) the creation of an enhanced and integrated technology platform.
4.6 Ladbrokes Coral intends to deliver a dual-brand strategy (ie keeping both the Ladbrokes and Coral brands) in the UK across both its retail and online businesses.
4.7 With regards to the synergies expected from the Transaction, Ladbrokes believes that the combined group will be able to achieve recurring annual cost synergies of at least £65 million as a result of the Transaction. It expects these synergies to be phased in over three years, with approximately 35% delivered in year one, 85% by year two and 100% by the end of year three post-completion. The principal sources of quantified synergies are as follows:
(a) Approximately £7 million from reduced corporate costs.
24 These percentages are subsequent to Ladbrokes’ equity issuance of 9.99% of the shares then in issue on 28 July 2015, in which Playtech subscribed for 22.9% of the new shares but before the provision of additional shares to Playtech as described at paragraphs 11.3 and 11.4. 25 The Transaction was cleared by the Irish Competition and Consumer Protection Commission on 12 March 2016. 26 Ladbrokes’ shareholder circular, 30 October 2015.
16
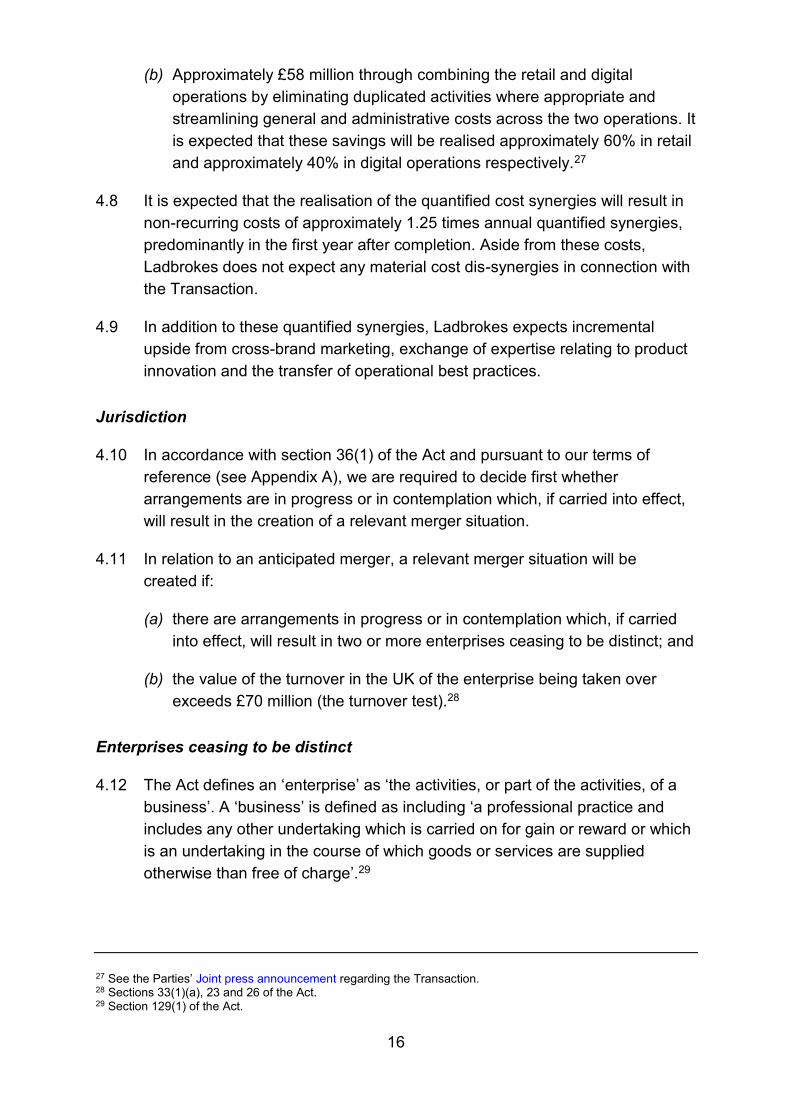
(b) Approximately £58 million through combining the retail and digital operations by eliminating duplicated activities where appropriate and streamlining general and administrative costs across the two operations. It is expected that these savings will be realised approximately 60% in retail and approximately 40% in digital operations respectively.27
4.8 It is expected that the realisation of the quantified cost synergies will result in non-recurring costs of approximately 1.25 times annual quantified synergies, predominantly in the first year after completion. Aside from these costs, Ladbrokes does not expect any material cost dis-synergies in connection with the Transaction.
4.9 In addition to these quantified synergies, Ladbrokes expects incremental upside from cross-brand marketing, exchange of expertise relating to product innovation and the transfer of operational best practices.
Jurisdiction
4.10 In accordance with section 36(1) of the Act and pursuant to our terms of reference (see Appendix A), we are required to decide first whether arrangements are in progress or in contemplation which, if carried into effect, will result in the creation of a relevant merger situation.
4.11 In relation to an anticipated merger, a relevant merger situation will be created if:
(a) there are arrangements in progress or in contemplation which, if carried into effect, will result in two or more enterprises ceasing to be distinct; and
(b) the value of the turnover in the UK of the enterprise being taken over exceeds £70 million (the turnover test).28
Enterprises ceasing to be distinct
4.12 The Act defines an ‘enterprise’ as ‘the activities, or part of the activities, of a business’. A ‘business’ is defined as including ‘a professional practice and includes any other undertaking which is carried on for gain or reward or which is an undertaking in the course of which goods or services are supplied otherwise than free of charge’.29
27 See the Parties’ Joint press announcement regarding the Transaction. 28 Sections 33(1)(a), 23 and 26 of the Act. 29 Section 129(1) of the Act.

17
4.13 Both Ladbrokes and Coral engage in the supply for reward of betting and gaming services in the UK. We are therefore satisfied that Ladbrokes and Coral are both businesses and in turn enterprises for the purpose of the Act.
4.14 The Act provides that two enterprises ‘cease to be distinct’ if they are brought under common ownership or common control.30 We are satisfied that as a result of the Transaction, the enterprise presently carried on by Gala Coral and the enterprise presently carried on by Ladbrokes will be brought under common ownership or common control. Accordingly, they will cease to be distinct enterprises for the purpose of the Act.
Turnover test
4.15 The turnover test is satisfied where the value of the turnover in the UK of the enterprise being taken over exceeds £70 million.31 According to the Parties, Coral generated turnover in the UK of approximately [] in the financial year ending 26 September 2015. Consequently, the turnover test is satisfied.32
Provisional conclusion on jurisdiction
4.16 In view of the foregoing, we provisionally found that the Transaction, if carried into effect, will result in the creation of a relevant merger situation. As a result, we must consider whether the creation of that relevant merger situation may be expected to result in a substantial lessening of competition (SLC) within any market or markets in the United Kingdom for goods or services.33
5. Counterfactual
5.1 The assessment as to whether the creation of the relevant merger situation may be expected to result in an SLC involves a comparison of the prospects for competition with the Transaction against the competitive situation that would exist in the absence of the Transaction. This situation, referred to as the ‘counterfactual’, is the benchmark against which we assess the competitive effects of the Transaction.
5.2 The counterfactual is necessarily uncertain since it is not an observable event. Our Merger Assessment Guidelines (the Guidelines) explain that we may examine several possible counterfactual scenarios and ultimately will select
30 Section 26 of the Act. 31 Section 23(1)(b) of the Act. 32 As the turnover test in section 23(1)(b) of the Act is satisfied in this case, it is not necessary to consider the application of the share of supply test in section 23(2) to (4) of the Act. 33 Section 36(1)(b) of the Act.

18
the most likely scenario. Typically, the most likely scenario in an anticipated merger will be a continuation of the prevailing conditions of competition. The Guidelines note that ‘the [CMA] will typically incorporate into the counterfactual only those aspects of scenarios that appear likely on the basis of the facts available to it and the extent of its ability to foresee future developments’.34
Views of the Parties
5.3 The Parties submitted that, in their view, the Transaction should be assessed against a counterfactual of the prevailing conditions of competition. They also said that the Transaction should be assessed against an alternative counterfactual which takes account of the (now completed) merger of Paddy Power plc (Paddy Power) and Betfair Group plc (Betfair).35
CMA assessment
5.4 We found no evidence to the effect that, absent the Transaction, either Ladbrokes or Coral would exit the gambling industry or cease to own and operate greyhound racing tracks (and neither party has indicated that it might do so).
5.5 Given that we are examining an anticipated merger and neither company has acquired shares in the other,36 Ladbrokes and Coral are currently independent competitors. Absent the Transaction, we have provisionally found that Ladbrokes and Coral would likely remain independent competitors, irrespective of whether Coral would remain under the ownership of Gala Coral, [] or would merge with another company that does not raise competition concerns. We also considered that our analysis of competitive effects will need to take account of the now completed merger between Paddy Power and Betfair.
5.6 As such, we have provisionally concluded that the Transaction should be assessed against the prevailing conditions of competition as the relevant counterfactual.
34 Merger Assessment Guidelines, paragraph 4.3.6. 35 The Paddy Power / Betfair merger was cleared by the CMA in December 2015 and also cleared by the Irish Competition and Consumer Protection Commission. All other conditions to the merger having been cleared, the merger completed and the combined Paddy Power Betfair plc began trading on the London and Irish stock exchanges on 2 February 2016. 36 Although the Merger Agreement has been signed, clearance by the merger control authorities is a condition precedent to completion of the Transaction.

19
6. Market definition
6.1 The purpose of market definition is to provide a framework for the CMA’s analysis of the competitive effects of a merger. The relevant market (or markets) is the market within which the merger may give rise to an SLC and contains the products that are close alternatives to the customers of the merged companies. Market definition is a useful analytical tool but is not an end in itself, and identifying the relevant market involves an element of judgment. The boundaries of the market do not determine the outcome of the CMA’s analysis of the competitive effects of a merger in a mechanistic way. The CMA may also take into account constraints outside the relevant market (or markets).37
6.2 In line with the CMA’s normal practice, we examine in this section two dimensions of market definition: the product dimension; and the geographic dimension.
6.3 We considered the appropriate market definition for the purposes of assessing the Transaction by reference to the two broad categories of services in which the Parties overlap: (i) the supply of gambling products; and (ii) the operation of greyhound tracks.
Product markets – Supply of gambling products
6.4 In this section we consider the appropriate scope of the relevant product markets in relation to which the Parties’ activities overlap. As part of our assessment we considered whether it is appropriate to segment the supply of gambling products by distribution channel. In particular, given the growth of the online channel, this included an assessment as to whether retail and online channels should be regarded as forming part of the same relevant product market. We also considered whether we should distinguish between betting and gaming products offered in LBOs and whether it is appropriate to distinguish between the different types of betting products.
Segmentation by channel – the online channel
6.5 The Parties are engaged in the provision of gambling products in LBOs situated in Great Britain and online through their websites. We assessed the extent to which retail customers38 of the Parties regard the online channel as
37 Merger Assessment Guidelines, paragraphs 5.2.1 and 5.2.2. 38 We use the term ‘retail customers’ to refer to customers who use gambling services provided in LBOs.
20
a suitable alternative to gambling in LBOs. In this regard, we considered the following evidence:
(a) Information on the profile of retail customers.
(b) Submissions of the Parties on the constraint provided by the online channel.
(c) Third party views.
(d) Implications of customer migration from retail to online.
(e) Price and margin differences between the online and retail channels.
(f) Customer surveys.
6.6 In assessing this evidence, we considered whether we would expect retail customers, in response to an increase in price (or a deterioration in the quality) of the LBO offering, to divert to the online channel to such an extent that such a price increase or deterioration of quality would not be profitable. 39 This requires us to seek to separate out ‘diversion’, ie the share of customers who might be expected to move online due to a change in price and/or quality in retail, from ‘migration’. ‘Migration’ is the expected effect whereby the share of customer activity within the online channel is expected to continue to increase independently of any changes in the relative offering of retail and online.
Background information on the profile of retail customers
6.7 We examined whether retail customers would be likely to switch to the online channel in response to a small but significant and non-transitory increase in price or deterioration of quality in the retail channel. In particular, we assessed to what extent the preferences of customers that use the retail and online channels differ. We summarise below our main findings on the profile of the Parties’ retail customers.
6.8 The survey evidence available to us, including the survey commissioned by the CMA (the CMA survey), the Kantar survey and the Parties’ surveys (see details of each of these surveys below in paragraphs 6.44 and 6.45), indicates that a significant proportion (approximately 60 to 80%)40 of the visits made to
39 When selecting a candidate market, the CMA will assess whether the hypothetical monopolist could profitably raise the price of at least one of the products in the candidate market by at least a small but significant amount over a non-transitory period of time (ie by a ‘SSNIP’ – a small but significant and nontransitory increase in price). See Merger Assessment Guidelines, paragraphs 5.2.10 to 5.2.11. 40 See Table 1 in Appendix C.

21
LBOs by the Parties’ retail customers are by retail-only customers, ie customers that have not used the online channel during the period specified in the survey in question (either the last six months or the last 12 months). This means that about 40% of the visits made by the Parties’ retail customers are by ‘multi-channel’ customers, ie customers that used both the retail and the online channels during that period.41
6.9 The CMA customer survey examined the profile of customers interviewed (see paragraphs 6.44 and 6.45 below and Appendix C concerning the methodology and results of the CMA survey). We use frequency of visits to an LBO as a proxy for spend, the latter being the concept of most relevance for us; this is discussed in more detail further below. We sampled customer visits to the surveyed LBO and our analysis is on this basis; the estimates below are, therefore, expressed in units of customer visits:
(a) 90% of visits are made by customers who are male.
(b) 27% of visits are made by customers who are aged 18 to 35, 42% by customers aged 36 to 59 and 30% by customers aged 60+.
(c) Nearly three-quarters of visits are made by customers who have been retail-only over the last six months.
(d) Two-thirds of visits are made by customers who have travelled from home and about a quarter by customers who have travelled from their workplace, in the local area.
(e) While for over 60% of visits it was not the customer’s main reason for making the trip, for a quarter it was the customer’s only reason.
(f) 28% of visits are made by customers who visit LBOs in general (ie the surveyed LBO and/or other LBOs) most days, 38% by customers who visit two to four times a week, 22% by customers who visit once a week, and only 4% by customers who visit less than once a month (this means that nearly 90% of visits are accounted for by customers who visit LBOs at least once a week).
6.10 The different survey evidence considered by the CMA showed a much higher proportion of males among the most frequent visitors and, broadly, a higher proportion of over 55s or over 60s among the most frequent visitors.
41 The CMA survey points to a lower proportion of visits by multi-channel customers than the telephone surveys. This is addressed in more detail below in paragraph 6.62.
22
6.11 Third parties (see below in paragraph 6.19) have indicated that there are important differences in the way customers use the retail and online channels. These differences may mean that retail customers do not regard the online channel as a close alternative. By way of example, there are social elements associated with the pursuit of gambling and gaming activities inside an LBO that cannot be replicated online. In addition, the possibility of gambling anonymously and the ability to make payments in cash in the retail channel are further factors that are valued by some retail customers and that are not present in the online channel. Online customers must provide details of their identity and bank account details. Retail customers who value these features are therefore less likely to switch to the online channel.
6.12 The Parties’ internal documents are also informative in this regard. One of Ladbrokes’ internal documents notes that []. In addition, market research quoted by Coral refers to another ‘major advantage’ of the retail channel over the online channel: ‘The major advantage retail has over online – mentioned spontaneously in all groups – is the ability to get hard cash in hand – immediately’.
6.13 William Hill also submitted Kantar Survey evidence showing that, for its customers, the key drivers for LBO customers were a convenient location, a quick service for placing bets as well as receiving payouts and safety. However, the evidence also showed that online customers were more sensitive to price than retail customers.
The Parties’ submissions
6.14 The Parties submitted that the online channel could be regarded as forming part of the same product market as the retail channel. They stated that a substantial (and growing) proportion of their retail customers now gamble online, with retail customers increasingly switching consumption between the two channels. The Parties further stated that this substitution remains an ongoing constraint for all bookmakers, whether retail, online or both. The Parties noted that of customers who started betting in an LBO, a large proportion (44 to 56%) now use online channels at least once a month. The Parties also submitted that approximately 46% of their regular customers and 37% of their regular retail customers use the online channel.42
6.15 The Parties further submitted that evidence of the constraint imposed by the online channel on the Parties’ retail operations could be seen through the Parties’ pricing decisions. The Parties submitted that their trading teams made
42 Kantar’s market sizing survey Q1 2015 – Q4 2015.
23
constant reference to, and relied on, information about odds offered by online operators while both compiling and adjusting their retail odds. Also, the Parties stated that they tended to offer the same or very similar odds both online and in their LBOs for the vast majority of events across horse racing, greyhound racing, football (in relation to those selections in the higher leagues where the majority of staking takes place), and other sports.
6.16 The Parties could not identify with certainty over two-thirds of their retail customers who also gamble online, since the vast majority of retail bets are placed anonymously.43 The Parties submitted that they therefore had no ability to mitigate the threat of migration of customers from the retail to the online channel by engaging in price discrimination in favour of those retail customers who use the online channel.
6.17 The Parties also stated that their retail strategy has been focused on emulating the online experience inside a LBO and on encouraging multi-channel use. A number of recent innovations by LBO operators, including the Parties, were driven by the need to compete with online bookmakers and to offer retail customers some of the benefits of online betting, including the introduction of SSBTs and the possibility to bet in-play through such terminals or other means.
6.18 Additional submissions made by the Parties on the extent to which the online channel constrains the retail channel are set out below where relevant.
Third party views
6.19 We received mixed views from other LBO operators and other third parties regarding the extent to which online bookmakers are perceived as a constraint to which they need to respond:
(a) William Hill stated that online bookmakers do not impose a significant constraint on LBOs. In particular, it submitted that:
(i) Retail business operations have remained resilient, even as the online betting and gaming business has grown;
(ii) Only a limited proportion of customers uses both channels and for those customers, the channels largely complement (rather than compete with) each other; and
43 The Parties can identify retail customers who use loyalty cards (for Coral this is called the Connect Card and for the Ladbrokes the Grid card). For Coral, Connect customers account for [].
24
(iii) The main parameters of competition differ as between the retail and online channel.
In support of its submissions, William Hill made the following observations:
(i) Based on Gambling Commission statistics, retail gross win had increased slightly in the four years to 2014 while online turnover had increased by more than 140%.44
(ii) According to William Hill, Coral’s and Paddy Power’s latest financial results indicate that the growth of their respective online businesses has not occurred at the expense of their respective retail operations.45
(iii) The online channel represents a discrete revenue base with materially different pricing, customer behaviour and product mixes compared with the retail channel, which indicates a low level of demand-side substitution.46
(iv) Differences in the gross win margin between the online and retail channels illustrate the underlying differences in prices and betting types between the retail and online channel.
(v) The majority of the Parties’ retail customers do not use the online channel.47
(vi) The two channels attract very different customer demographics, as online customers are typically younger and more affluent, and a greater proportion of online users is female.
(vii) Retail and online customers value different product characteristics given that retail customers tend to value convenience, service, anonymity and safety while online customers are more price-sensitive.
(b) Paddy Power Betfair explained that the competitive constraint from online bookmakers was becoming more significant as access to online products was becoming easier. Paddy Power Betfair stated that it responded to that constraint []. Paddy Power Betfair also told us that it was currently
44 William Hill initial submission, paragraph 9. 45 Addendum to William Hill response to issues statement, paragraphs 5-11. 46 William Hill initial submission, paragraph 3. 47 This was based on data from Kantar, which shows that 11% of the Parties’ customers had placed a bet in both online and retail channels in the 12 months prior to being surveyed, while 80% of Coral’s customers and 76% of Ladbrokes’ customers were retail-only.
25
[]. As a result, Paddy Power Betfair’s retail offering remained a growth business despite the online constraint. Paddy Power Betfair said that it expected these trends to continue over the next two years across the sector. However, it also noted that the []. Paddy Power Betfair stated that it offered []and explained it adopted this strategy because it [].
(c) Betfred submitted that the option of gambling online was not available to all retail customers. Some customers preferred to bet with cash, and others preferred the social element of being in a LBO environment. Betfred said that it still regarded online and retail as distinct markets and expected there to be an appetite for both in the future. However, Betfred also noted that retail gross margins had reduced due to online competition.
(d) Jennings submitted that it had previously responded to online competition by reducing its margins. However, Jennings also pointed out that the majority of LBO customers still enjoyed the social aspect that a vibrant betting office could bring, and stressed that the retail and online channels had different customer bases. Jennings explained that retail customers were more likely to respond to a deterioration in quality at their preferred LBO by going to a rival retail operator than by switching online.
(e) A customer submitted that, based on figures provided by the Parties, the retail gambling sector was not in structural decline. The customer also noted, based again on information provided by the Parties, that almost two-thirds of the Parties’ customers only used the retail channel and would therefore be particularly negatively affected by the Transaction. This customer also submitted a number of examples showing significant differences in prices and terms provided by the Parties to their retail and online customers indicating that the Parties already discriminated against retail customers.
6.20 We also sought views from bookmakers that operate online only and do not have any retail operations. In general, online bookmakers had little information on the preferences and behaviour of retail customers and no strong views on whether these customers were likely to respond to a deterioration in quality or an increase in price in retail by switching online. Bet365 submitted that while the change in demographics was expected to lead to a migration of customers from the retail to the online channel in the future, there would still be a significant number of customers that would continue to prefer the retail channel. Gamesys explained that its customer acquisition strategy was focused on customers who gambled online. Sky Betting and Gaming explained that it had acquired customers from a number

26
of sources including other online bookmakers, LBO operators, and customers who were new to gambling.
Implications of customer migration from retail to online
6.21 As mentioned above in paragraph 3.16, the evolution of GGY indicates that the online channel has grown significantly in the last five years. Growth in the online channel has been the main driver of the overall growth of the gambling sector in the last few years, while the retail channel has remained relatively stable, both in terms of GGY and number of LBOs.
The Parties’ submissions on the significance of migration
6.22 The Parties submitted that long-term industry trends provided strong evidence of migration from the retail to the online channel. In the Parties’ view, this migration demonstrated that customers considered the two channels to be substitutable.48 In particular, the Parties pointed out the following:
(a) OTC gross win within retail had been rising steadily until the development of online betting, but subsequently peaked and started falling steadily, in line with the growth of the online channel.
(b) Kantar’s consumer research showed that 53% of online-only customers had previously used the retail channel and had therefore migrated to the online channel;
(c) Research conducted by Ladbrokes [].
(d) A number of internal documents referred to the threat of retail customers migrating online.49 For example:
(i) []; and
(ii) []
6.23 The Parties also submitted financial analyst reports which stated that the gambling industry was becoming increasingly dynamic with the ongoing development of the online and mobile channels. A common view amongst analysts was that the retail channel continued to be a mature ‘cash cow', although there were signs of structural decline, with the possibility of growth in mobile betting accelerating cannibalisation.
48 Ladbrokes/Coral initial submission, paragraph 3.15. 49 Ladbrokes/Coral initial submission, paragraph 3.4.

27
Other sources of evidence on the significance of migration
6.24 However, we consider that other pieces of evidence (summarised at 6.26 below) indicate that the migration referred to by the Parties does not necessarily mean that the two channels are substitutable for the purposes of defining the relevant market.50
6.25 Migration of customers to the online channel does not necessarily mean that customers – whether they are retail-only or multi-channel customers – who choose to gamble in an LBO would divert to the online channel to a sufficient degree to render a price increase or deterioration of quality in the retail channel unprofitable. Rather, it is entirely possible that general changes in customer preferences or behaviours over time result in a degree of migration which does not indicate a sufficient degree of substitutability between the retail and online channel and cannot be equated with diversion (which is relevant for market definition purposes).
6.26 We consider that the evidence available to us shows that the observations of customer migration are unlikely to be indicative of a degree of diversion that would result in the online channel forming part of the same market as the retail channel. For instance, see the following:
(a) At its hearing, Ladbrokes explained that its strategy was ‘to bring online and retail closer together, to keep customers betting in the shops and to win their online business’ and stated that the underlying principles behind the multi-channel strategy was to retain retail customers that are migrating online. Although Ladbrokes stated that its multi-channel strategy was also about retaining retail customers, we considered that Ladbrokes’ strategy in this regard appears to be driven primarily by a focus on increasing its multi-channel customers’ use of its online offers;
(b) Coral stated at its hearing that ‘the purpose of our multi-channel strategy is to say this migration is going to happen and is happening and we want to capture as much of that as we possibly can, rather than preventing the migration happening’;
(c) The Parties’ own internal documents indicate that they tend to focus on their competitors51 in the retail channel when they track the performance of their retail estates. These internal documents did not indicate that the Parties have adopted strategies on the basis of which they would change
50 That is in the sense that the profit lost on sales to customers that would switch to the online channel in response to a small but significant and non-transitory increase in price in the retail channel would be sufficient to make this price rise unprofitable. 51 Including retail competitors who also provide an online offering (which all large, national LBO operators do).
28
their price, quality, range and service (PQRS) offerings directly as a result of an increase in the constraint imposed by the online channel. For instance: (i) []
(ii) []
(iii) []
(iv) []
(d) A Mintel market research report (April 2015) states that ‘online gambling is not cannibalising betting shops’ core customer base, which is the same size in 2015 as it was in 2011, but that occasional punters are increasingly choosing the convenience of their smartphone, tablet or computer rather than seeking out the nearest high street bookmaker’. The report also states that ‘the single most important influence on the future of the industry could be the choice punters make between the two visions now on offer – an ‘omnichannel’ future in which shop and online experiences become identical and interchangeable, or a differentiated one in which the shop presents a far more participatory, social and experiential offer that stands alone on its own merits’.
Our provisional view on the significance of migration
6.27 The evidence above is difficult to interpret for the purposes of defining the relevant product market. Overall, viewed in the round, the evidence indicates that the emergence and growth of the online channel has had at least a medium to long term strategic impact on the Parties’ LBO offering. In particular, the increasing number of retail customers who either already are or could be gambling online in the future appears to play an important role in the Parties’ strategic considerations as to how they position and develop their products and services in their LBOs (as illustrated by investments in SSBTs and other features which at least partially replicate the online experience inside LBOs).
6.28 However, for the online constraint to be sufficiently strong in a market definition context, we would have to consider that a small but significant increase in price or deterioration in quality in LBOs would result in a degree of switching to online providers that would render such a price increase or deterioration of quality unprofitable. The fact that a number of retail customers appear to have migrated to online operators over time, irrespective of changes in quality or price of the retail offering (or indeed, in spite of
29
improvements in quality or price in the retail channel), does not enable us to draw any strong inferences about the degree of substitutability of the two channels for the remaining retail customers. We did not consider that there was sufficient evidence of the Parties’ changing their price, quality, range and service (PQRS) offer directly as a result of an increase in the constraint imposed by the online channel, taking account in particular the Parties’ own internal documents.
6.29 Therefore, we provisionally consider that evidence of customer migration to the online channel is, in and of itself, not sufficient for the online channel to be regarded as forming part of the same relevant product market as the retail channel.
Price and gross win differences between online and retail
6.30 Although we considered that customer migration is not, in and of itself, sufficient evidence of diversion such that the online channel would form part of the same relevant product market as the retail channel, we conducted further analysis with a view to establishing the strength of the constraint from the online channel. In particular, we assessed the extent to which the Parties charge different prices for their products in the retail channel compared with the online channel, and whether any differentials between the two channels have changed over time (see analysis in Appendix D).
6.31 We started by comparing the different ‘components’ that determine the price of gambling products, ie the odds, the RTP and the promotions. 52 This analysis shows that the Parties tend to charge higher prices for their gambling products in the retail channel compared to the online channel. For most betting products, with the exception of football, the Parties offer the same odds in the two channels. However, their promotions tend to be more generous (ie better from the perspective of customers) online. In gaming the Parties tend to offer more generous RTPs online for games with an adjustable RTP (which represent approximately [] of gaming stakes).
6.32 The magnitude of these price differentials could be an indicator of the strength of customers’ preferences for gambling in the retail rather than the online channel.53 However, the existence of price differentials between the two channels, in and of itself, does not necessarily imply that there is no competitive interaction between them or that these channels are necessarily in different product markets. It is possible in theory, for instance, that retail
52 By promotions we mean special offers by LBO operators applied uniformly across all their LBOs. 53 For instance, for football, the average overround was [] higher in retail compared to online, but the average odds offered on the favourite were broadly the same across the channels.

30
customers might be willing to accept a certain ‘surcharge’ for gambling in LBOs, but that they would decide to go online if retail prices were to increase over and above this surcharge.
6.33 The Parties submitted that the assessment of various price differentials, in itself, underestimated the constraint from the online on the retail channel. In particular, the Parties submitted that the differential in football odds between retail and online was not significant enough to be meaningful. The Parties also submitted that the CMA’s analysis overestimated the difference between promotions across channels, particularly given the increasing degree of convergence between promotions offered online and in the retail channel.
6.34 Bearing in mind the possible limitations of this analysis, we also considered differences in gross win margins between the two channels for selected product lines. We considered that the gross-win margin of a product line can be used as a high-level proxy for the pricing of these products, insofar as it reflects the average loss made by customers on these products (which is itself a function of the odds, the RTP, the promotions and other factors, including the purchasing behaviour of customers).
6.35 The Parties submitted that this approach was unreliable because differences in margins between the two channels may reflect differences in product mixes and customer behaviours rather than differences in prices. The Parties pointed out that online customers tend to place larger bets, be better informed and ‘cherry pick’ the best odds. By contrast, according to the Parties there was greater demand from LBO customers for particular products with higher margins and LBO customers tended to be less focused on choosing the best odds for each bet.
6.36 We recognise that there are some difficulties involved in using gross win margins to estimate price differentials between the two channels. However, to the extent that there are material differences in product mixes and customer behaviours between the two channels, this may in itself indicate that the two channels tend to appeal to different types of customers. It also seems to us from the data provided that product mixes and customer behaviours have not changed materially in the past few years, and therefore, it is still informative to consider variations over time, and notably whether the margin differential between the two channels has tightened. In particular, if retail customers were increasingly willing to gamble online in response to a worsening of the retail offering, then we would expect price differentials between the two channels to narrow over time.

31
6.37 We compared gross win margins between the online and retail channels at two levels: at an aggregated level for different sports and product lines; and at a more disaggregated level for a selection of different types of bets.
6.38 Figure 4 and Figure 5 below show the differential in gross win margin for Coral and Ladbrokes, between 2013 and 2015 for Coral54 and between 2011 and 2015 for Ladbrokes, in horse betting, greyhound betting, football betting and gaming.
Figure 4: Differential in gross win margin for Coral (percentage points by which the gross win margin in the retail channel is above the gross win in the online channel)
[]
Source: Coral submission. Note: []
Figure 5: Differential in gross win margin for Ladbrokes (percentage points by which the gross win margin in the retail channel is above the gross win in the online channel)
[]
Source: Ladbrokes submission.
6.39 This analysis provides some indication that the differential between online and retail margins has slightly tightened between 2011 and 2015, but that this trend was neither uniform across products nor constant over time:
(a) For greyhounds, the differential [].
(b) For horses, the differential [].
(c) For football, the differential [].
6.40 We also sought to compare margins for more specific types of products (see Appendix D), and this led to similar conclusions, in that we could see a slight tightening of the margin differential between online and retail for some products, although this was not a uniform trend.
6.41 Overall, there are some indications that the differential in margins has been compressed slightly for some products over the past three years, which might indicate that the Parties are seeking to improve the competitiveness of their retail offering in response to the online constraint. However, that change was relatively modest in magnitude, and it did not apply to all product lines. This indicates that the competitive constraint exercised by online providers on retail operators remains limited.
54 []
32
Customer surveys
6.42 In addition to looking at the Parties’ internal documents, considering third party views and conducting an analysis of the price and margin differentials between the retail and online channels, we also looked for more direct evidence of how customers say they would behave in relation to the online channel. We therefore reviewed the survey evidence provided by the Parties and commissioned our own face-to-face survey of Ladbrokes’ and Coral’s customers (the CMA survey).
6.43 As we are trying to understand, among other things, whether customers would be likely to divert to the online channel in response to a small, but significant, non-transitory increase in price in the retail channel (applying the SSNIP test),55 our survey asked customers what they would do if the LBO they were visiting when they were interviewed was closed for refurbishment for six months.
Description of surveys
6.44 The Parties submitted the results from their own and other surveys as evidence to the CMA’s inquiry. The surveys referred to by the Parties and considered here are the following:
(a) A face-to-face survey conducted by Routeways on behalf of the Parties at the Parties’ LBOs (48 LBOs in 26 localities) between July and September 2015 (Parties face-to-face survey).
(b) A telephone survey, conducted by Researchcraft on behalf of the Parties on non-consecutive dates between 11 December 2015 and 13 January 2016 (Parties telephone). The 74 interviews completed by QRS during the period 11 to 20 December were sourced from a consumer lifestyle database, with contacts selected on a random basis. The 426 interviews by PDS between 4 and 13 January were sourced from contacts that had previously completed the Kantar Media Bettor survey.
(c) An online survey, conducted by Researchcraft on behalf of the Parties between 11 and 20 December 2015 (Parties online), which had 549 respondents; and
55 When selecting a candidate market, the CMA will assess whether the hypothetical monopolist could profitably raise the price of at least one of the products in the candidate market by at least a small but significant amount over a non-transitory period of time (ie by a ‘SSNIP’ – a small but significant and nontransitory increase in price). See Merger Assessment Guidelines, paragraphs 5.2.10 to 5.2.11.
33
(d) The Kantar UK Gambling Market Sizing surveys, which are conducted on a regular, quarterly basis, in its current format since 2013. The Kantar survey is a large-scale, regular survey which is comprehensive in its coverage of the subject matter and used widely across the industry.
6.45 The CMA engaged DJS Research56 to conduct a face-to-face survey at 30 LBOs belonging to the Parties across a sample of 15 areas where the Parties operate in close proximity to each other (using a stratified random sample design based on distance between LBOs, fascia count density and a London/urban/rural split). The survey was carried out between 25 January and 22 February 2016. The CMA survey was designed to provide a representative sample of customer visits to Ladbrokes and Coral LBOs.
6.46 A total of 3,921 interviews were conducted during the CMA’s fieldwork, with at least 100 in each of the surveyed LBOs. With a response rate of 40%, there was a good level of response, and respondents were broadly similarly distributed, by age and gender, to those who refused to be interviewed. We are satisfied, therefore, that the CMA survey provides a reasonable sample base for providing evidence.
6.47 The different surveys conducted for the purpose of this inquiry provide various estimates of diversion to the online channel, represented by the proportion of LBO customers (or, in the case of the face-to-face surveys, the proportion of visits made to LBOs by customers) who would go online if the LBO where they were interviewed (or the LBO which they might normally visit) was closed for refurbishment for a period of time (six or 12 months). We used this metric in the context of, and together with, the other evidence set out above, to evaluate the extent to which retail customers (including retail-only and multi-channel customers) regard online providers as a good alternative to gambling in LBOs.
6.48 In the context of the CMA survey, we used frequency of visits to an LBO as a proxy for spend, this being the concept of most relevance. A customer who visits frequently (such as every day or once a week) is more likely to be surveyed (and therefore given relatively more weight) than a customer who visits less frequently. This is in contrast to the Parties’ telephone and online surveys, which are based on samples of customers, such that any customer who has visited one of the Parties’ LBOs within the previous 12 months of being interviewed has an equal chance of being selected for the survey, regardless of their frequency of visit. The results in Table 4 below will reflect this distinction, which is discussed in more detail in Appendix C. The Kantar
56 See DJS Research Report.

34
survey questionnaire was not designed to provide evidence for this merger inquiry and does not ask diversion questions. Therefore it is not included in Table 5 below. However, we regard it as a high quality survey and have drawn on its results for various purposes.
Results from the surveys
6.49 Table 4 below summarises the results from the four surveys.
Table 4: Online diversion estimated in four customer surveys
%
Regular customers (monthly+)
All customers surveyed
CMA survey N/A 6 Parties’ survey – online 21 14 Parties’ survey – telephone 20 20 Parties’ survey – face-to-face N/A 5
Source: Parties’ survey results, unweighted; CMA survey results.
6.50 These results show that the CMA survey points to a lower level of online diversion (at 6%) than the Parties’ surveys (with the exception of the Parties’ face-to-face survey).
6.51 If the results from the Parties’ telephone survey were to be re-weighted on the basis of the frequency of customer visits, the diversion to the online channel would be materially lower and, given the smaller sample size, subject to a high level of uncertainty. However, we estimate that such a re-weighting would reduce the level of diversion to the online channel to around 14%.57
6.52 Given the different results of the surveys with regard to online diversion, we investigated whether there were methodological differences which could explain these results.
Assessment of the Parties’ survey methodologies
6.53 We have some reservations concerning the Parties’ surveys that are discussed below. Our full assessment of the different surveys is set out in Appendix C.
6.54 The Parties’ online survey was sourced from an online panel. We consider that this design and survey mode mean that the findings will not be representative across channel use and are likely to be heavily biased in favour of those who gamble online and who would divert online. We generally do not consider it to be an appropriate survey mode to estimate cross-channel
57 A 95% confidence internal around the estimated diversion ratio of 14% would be between 6% and 22%.
35
substitution. While this is the over-arching weakness of the online survey, it also shares many of the features we discuss in the context of the Parties’ telephone survey.
6.55 The Parties’ telephone survey interviewed 362 customers who had visited an LBO of any fascia in the last 12 months (with the other 138 being online-only customers). Most of the survey was conducted using a re-contact sample of respondents to the Kantar Media Bettor survey, while the remainder was sourced from a Consumer Lifestyle database. We have weighted the results of the Parties’ telephone survey by frequency of visits so that they can be interpreted in units of customer visits, the concept of most relevance for this inquiry; this reduces the effective sample size of retail customers to just 81, which limits the value of the results of this survey.
6.56 In their submissions, the Parties have cited diversion ratios from their telephone survey based on the responses to a question that does not follow the usual structure of a diversion question.58 Leaving aside further issues with the question wording, this casts material doubt on the reliability of estimating diversion ratios from this survey.
6.57 The Parties’ face-to-face survey was conducted at a random sample of 48 of their LBOs in 26 specified overlap areas. Initially, the survey was conducted as an exit-survey, but responses were low, so the interviewers moved in-shop and the field work period was extended. Of the 48 LBOs surveyed, 100+ interviews were achieved in 6 LBOs, over 55 interviews in 12 LBOs, with the remaining 30 LBOs achieving only 55 or fewer interviews, even after the extended fieldwork period.
6.58 Many of the responses to questions were prompted, and, in total, there are up to eight questions (depending on responses received) about online behaviour and choice immediately before the section on diversion.
6.59 The Parties face-to-face survey reports high-level results not substantively dissimilar to those from the CMA survey in terms of both customer profile and stated diversion. However, given the number of issues around the methodology and very low achieved numbers, as the Parties have themselves
58 The Parties asked customers what they would do if they wanted to place a bet or play a game and their usual betting shop was closed. There is no requirement that this hypothetical bet is one for which they would have used a betting shop in the first place. If a respondent uses different channels for different types of bet, then the wording of this question leaves too much room for interpretation (the respondent might think about a bet for which they would have gone online in the first place). The effect of this ambiguity in the wording of the diversion question might have been compounded by the list of questions asked just before, which emphasised online gambling behaviours.

36
highlighted, we concluded that overall it is likely to be a less reliable source of evidence for the inquiry than the CMA face-to-face survey.
Assessment of the CMA survey methodology
6.60 A limitation of the CMA survey is that, due to the high number of local areas where the Parties’ LBOs operate in close proximity to each other, and, as explained in more detail below in paragraph 7.37, our sample focused on areas where the density of LBOs was neither particularly high nor particularly low to give us additional information on the drivers of local competition in these types of areas that were particularly valuable to our analysis. The results of the diversion questions, particularly those where specific fascia and individual LBOs were given as diversion destinations, are reflective of the competitive conditions in each surveyed area. We consider that we have fairly robust estimates for each of the LBOs where the survey was conducted.
6.61 The Parties have submitted that the CMA survey created a framing bias against the online channel, pointing to the fact that the survey was conducted inside an LBO and also referring to the ordering and wording of the questions. They also considered there to be too few questions about online use in general. We made some alterations to the draft questionnaire with a view to mitigating the risk of a framing bias. Nonetheless, the survey was conducted within LBOs. While this enables the survey to reflect customer visits, we cannot rule out that this may have put some respondents into a mindset in which they were more likely to cite another LBO as an alternative than if the question had been asked in a more neutral setting.
6.62 We used frequency of visits to an LBO as a proxy for spend. A customer who visits frequently is more likely to be surveyed (ie given relatively more weight) than a customer who visits less frequently; an in-store survey with a random selection of customer visits therefore effectively weights the results by frequency of visits. However, the Parties have submitted that findings from other surveys show that multi-channel customers tend to stake more than retail-only customers and that, as multi-channel customers are more likely to say they would divert online, on the basis of spend the CMA survey would have understated diversion to online. We have also considered whether the CMA survey may have under-sampled multi-channel customers. Both of these aspects could have an impact on the interpretation of the CMA survey results.
Provisional conclusion on online diversion
6.63 Having conducted our analysis of the survey evidence available, we provisionally considered that we cannot rule out some degree of framing bias in the CMA survey and that it is likely that the CMA survey has
37
underestimated the share of spend by multi-channel customers and consequently may have underestimated the likely diversion to online alternatives to some extent. The extent of this underestimation is difficult to quantify, but we consider that it would be appropriate to increase the diversion ratio to the online channel for the purposes of our analysis of the effects of the Transaction.
6.64 Having considered that the results of the CMA survey provide a lower bound (6%) and the Parties’ telephone survey (re-weighted to a customer visits basis) an upper bound (14%) for the estimate of the diversion ratio to the online channel, we considered that a 10% diversion ratio, which is in the middle of the upper and lower bounds identified by the surveys we are taking into account in this context, was a reasonable reflection of how retail customers would respond to a price increase or deterioration of quality in the retail channel (see further details in Appendix C). Therefore, we provisionally decided that it would be reasonable and appropriate to perform our competition assessment on the basis of a diversion ratio from the retail channel to the online channel of 10%.
Provisional conclusion
6.65 With regard to the extent to which the online channel constrains the LBO channel, the evidence available to us at this stage indicates the following:
(a) Retail customers are increasingly likely to also gamble online and there is a material degree of migration over time. There are some indications that this development has had an impact on the retail channel at a medium to long term strategic level, in particular insofar as product development and innovation of LBO offerings are concerned.
(b) The increasing likelihood of customers also gambling online appears to have also had at least a small impact on the Parties’ pricing strategies for retail channel. More specifically, there are some indications that the price differential between online and retail has tightened slightly in respect of some products over the past three years.
6.66 Most of the evidence, however, shows that the majority of retail customers continue to have a strong preference for gambling in LBOs:
(a) The CMA’s survey points to a low rate of ‘online diversion’ (6%). The Parties’ telephone and online surveys show higher rates of online diversion. For the reasons set out above and at Appendix C, we provisionally decided to consider a diversion ratio of 10% to be a
38
reasonable estimate and reflective of the various pieces of evidence available to us in the round.
(b) Despite a slight tightening of the price differential between retail and online for some products, the Parties continue to be able to sustain significant price differentials between their online and retail channels. The Parties have submitted evidence indicating that both pricing and margin differentials are explained by LBO customers’ higher demand for particular products with higher margins and by the fact that online and retail channels attract different segments of the gambling population. However, we considered that both the pricing differentials and the product mix differentials are indicative of significant differences between the populations of retail and online customers (for example, through the use of enhanced promotions and higher RTPs for online customers).
(c) While the Parties’ internal documents do mention the threat of retail customers migrating online, the emphasis in most relevant internal documents tends to be on competition between LBOs. The evidence also indicates that the Parties’ response to online growth appears to focus on capturing the aggregate spend of multi-channel customers rather than preventing or reducing substitution. Overall, the evidence on customer migration to the online channel is compatible with a relatively low degree of diversion to the online channel in response to an increase in price or a worsening of the qualitative offering in the retail channel.
6.67 Overall, we provisionally found that the constraint from online providers is unlikely to be sufficiently strong for the online channel to form part of the same relevant product market as the LBO channel. However, we consider that the online channel does constrain the retail channel and we have taken this constraint is taken into account in our competitive assessment.
Constraint from other gaming venues
6.68 We examined whether LBO operators were likely to be constrained by other gaming venues such as casinos or adult gaming centres (AGC).
6.69 The Parties submitted that the supply of gaming products in LBOs is to some degree constrained by venues other than LBOs which offer similar gaming opportunities, in particular AGCs and, to a lesser extent casinos.

39
Third party views
6.70 In general, LBO operators submitted that they did not compete with other gaming venues:
(a) Paddy Power Betfair told us that it did not generally consider casinos, arcades, or AGCs as competitors for its existing LBOs. Paddy Power Betfair also stated that [].
(b) William Hill stated that other gaming venues operate in separate markets to LBOs. William Hill provided some research by Circle Research indicating that high spend gamers also tend to bet on sports. William Hill submitted that this implied that such customers would be interested in a combination of OTC betting and gaming opportunities that could not be replicated by casinos, arcades, and AGCs. William Hill stated that it did not take account of competition from such gaming venues when making decisions on price or quality in LBOs.
(c) Betfred told us that it did not include other gaming venues when considering its local competitors. Betfred noted that the game machine offering was identical in terms of B3 content only.
(d) The British Amusement Catering Trade Association (BACTA) told us that the difference in regulatory treatment between LBOs and AGCs caused a ‘deeply unfair and uncompetitive situation’. The BACTA further submitted that the growth in number of B2 machines over recent years had drawn a significant number of players away from the AGCs, and that this was responsible for a significant reduction in AGC numbers on the high street.
6.71 The only LBO operator who submitted a different view on this question was Jennings, although this was based on experience in only one area: [].
Differences in product ranges
6.72 There are some important differences in the product range that can be offered by LBOs and other gaming venues which result from the regulatory regime for the provision of gambling services. Most notably, LBOs can offer both Category B2 and Category B3 content on their gaming machines, whereas AGCs can only offer B3 content. Category B2 gaming machines have a maximum permitted stake of £100, whereas Category B3 machines have a maximum permitted stake of £2 (both types have a maximum permitted prize

40
of £500). Casinos are allowed to offer B2 content as well as B3 and B1 content.59
Customer surveys
6.73 Both our survey and the Parties’ surveys indicated low rates of diversion to other gaming venues such as AGCs or casinos:
(a) In the CMA survey, the rate of diversion to other gaming venues was 1% for Ladbrokes customers and less than 1% for Coral customers. The results were low even in areas where there is a range of such gaming venues available (eg Skegness).
(b) In the Parties’ surveys, the rate of diversion to other gaming venues was 1% for customers who were contacted by telephone, and 9% for customers who were contacted online (we note that these results are based on a sample of customers, not customer visits, and that, as discussed above, we consider customer visits to LBOs to be an appropriate proxy for spend, the latter being the concept of most relevance to our inquiry).
Internal documents
6.74 The evidence from the Parties’ internal documents regarding the constraint posed by other gaming venues is mixed:
(a) Coral’s internal documents indicate that:
(i) []
(ii) []
(b) All the Parties’ refurbishment request forms [].
(c) Ladbrokes internal documents indicate that:
(i) []
(ii) []
59 B1 content has a maximum stake of £5 but allows for maximum prizes of up to £10,000 (compared to £500 for B2 and B3 machines).
41
Provisional conclusion
6.75 Based on the evidence set out above, we provisionally found that other gaming venues do not appear to constrain LBO operators to a significant extent and, therefore, should not be included in the same product market as LBOs.
Different types of gambling products
6.76 We considered whether it was appropriate to segment the market for the provision of gambling products in LBOs, for example between betting and gaming products and/or between different types of betting or gaming product. The Parties submitted that the market should not be segmented by type of betting event or on the basis of the gaming product.
6.77 The Parties noted that:
(a) in previous decisions, the UK competition authorities considered the market for off-course betting as a whole without segmenting it by different categories of events on which customers can bet; 60 and
(b) customers bet across all events and a range of games, albeit that there may be some customer preference for specific categories of events or particular games.
6.78 From a supply-side perspective, an LBO operator is able and tends to offer all betting products, as well as a number of different gaming products. As shown in paragraph 3.17, the mix of gambling services offered by LBO operators and the relative importance of each service in the overall GGY of bookmakers has changed in the last five years, but all the main LBO operators have adapted their portfolio of products and all face broadly similar conditions of competition for each of the products they offer through their LBOs.
6.79 Our investigation has shown that LBO operators compete to supply all betting and gaming products and the conditions of competition between the firms are broadly the same for each product that is supplied through an LBO. The offering of LBO operators through LBOs actually appears to be fairly standardised, with all offering a similar range of betting products and a similar number and type of gaming machines.
60 It was noted that the UK competition authorities have identified separate markets for fixed odds betting and pool betting in previous decisions. However, as the Parties only have a very limited presence in pool betting, this distinction is not material to the competitive assessment in this case.
42
6.80 We did not receive any submissions indicating that it would be appropriate to distinguish between different types of betting or gaming products in our analysis of the Transaction.
6.81 We, therefore, provisionally found that it is appropriate to consider the different betting and gaming products as part of the same relevant market.
Provisional conclusion on product markets
6.82 We provisionally found the following:
(a) The constraint from online providers is unlikely to be sufficiently strong for the online channel to form part of the same relevant product market as the LBO channel. However, we did find that the online channel poses a level of constraint on LBOs and that this constraint will be taken into account as part of the competitive assessment.
(b) Gaming venues do not constrain LBO operators to a sufficient extent to form part of the same relevant product market as LBOs.
(c) It is not appropriate for the purposes of assessing this Transaction to further segment the market for the provision of gambling products in LBOs – instead, the different betting and gambling products will be considered as part of the same relevant product market.
6.83 Therefore, taking into account the considerations set out above, we provisionally concluded that the relevant product market for the purposes of our assessment of the competitive effects of the Transaction should be the supply of gambling products in LBOs.
Geographic market – Gambling operations
Local dimension
6.84 Our starting point is the recognition that customers gamble in LBOs within a given travel time from their point of origin and that, therefore, from a customer’s perspective competition between LBOs depends on the distance that customers are prepared to travel to alternative LBOs.
6.85 In section 8, we explain that while some competitive parameters of the Parties’ offering are determined by reference to local conditions of competition
43
(eg concessions,61 refurbishment decisions, level of staffing and location of LBOs), others are determined centrally and applied uniformly across the Parties’ estates (eg odds, promotions, RTP and betting limits).
6.86 As explained in the Merger Assessment Guidelines,62 when assessing mergers involving a large number of local geographic markets, the CMA may start by examining the geographic catchment area within which the great majority of the relevant site’s custom is located. Catchment areas will typically be narrower than the relevant geographic market and are used as a tool to assist the CMA’s analysis of the competitive effects of the merger, and therefore do not represent an alternative conceptual approach to the hypothetical monopolist test. Rather, they provide a starting point for identifying local areas for further analysis without reaching a firm conclusion on the boundaries of that particular relevant geographic market. This is the framework we have adopted in this case.
Parties’ submissions
6.87 In one of its most recent decisions in this sector – Betfred/Tote63 – the OFT used 400m and 800m radii around each LBO as a starting point for its analysis, before then also using a 200m radius on a cautious basis.64
6.88 The Parties stated that the Betfred/Tote catchment areas, which were adopted on a ‘cautious’ basis by the OFT in a phase 1 investigation, are clearly conservative. In particular, the Parties’ noted that using a 200m catchment radius in addition to a 400m and 800m catchment radius risks being overly-inclusive.
Third party views
6.89 We asked third parties for their views about the distance over which the competitive interaction between LBOs takes place. The evidence we received was mixed. However, it indicates that the Parties’ competitors responded to differences in local competition at least to some degree. For instance, William Hill regarded the competitive pressures in the retail channel as being more local than national, as customer behaviour was driven by: (a) the location of an LBO; (b) the quality of the service and staff; and (c) the overall ‘environment’ of its local operations. The submissions of other LBO operators
61 By concessions we mean special offers by bookmakers limited to particular LBOs that typically enhance the return to customers (concessions) 62 Merger Assessment Guidelines, paragraph 5.2.25. 63 See the OFT decision of the Completed acquisition by Lightcatch Limited (trading as Betfred) of Tote (Successor Company) Limited, 16 December 2011 (Betfred/Tote). 64 Betfred/Tote, paragraphs 35 and 36.
44
such as Betfred, Paddy Power and Jennings also indicate that, at least in urban centres, the main competitive constraint on their LBOs came from other LBOs within 400m (see a more detailed analysis of these third party submissions in paragraph 7.53).
Internal documents
6.90 The Parties’ internal documents and submissions indicate that location and distance are the key competitive parameters which the Parties’ have regard to when taking business decisions and to inform their understanding of their retail operations (see a more detailed analysis of the Parties’ internal document in paragraphs 7.56 to 7.59).
Other evidence
6.91 We also considered data from the following pieces of evidence to identify the distance over which LBOs are likely to compete:
(a) Entry-exit analysis – We measured the effect of LBO openings and closures on the turnover of Ladbrokes and Coral LBOs located nearby. This analysis (explained in more detail below in paragraphs 7.13 to 7.16 and in Appendix E) showed that the entry/exit of a competitor had a statistically significant effect on the turnover of the Parties’ LBOs for distances up to 1,600m, although the effect decreased relatively rapidly after 400m.
(b) Refurbishment requests – We reviewed [] capex requests made by the Parties’ LBO managers in response to a ‘competitive event’65 in their catchment area. This analysis is explained in more detail below in paragraphs 7.18 to 7.25, and in Appendix F). We observed from this analysis that [] of the refurbishment requests were made in response to competitive events that had occurred within 400m of the LBO making the request, and [] were made in response to a competitive event that had occurred less than 200m away. There were [] where a request was made in response to a competitive event occurring between 400m and 800m of the incumbent LBO.
(c) Concessions policies – We reviewed the Parties’ policies on offering concessions in their LBOs. This analysis is explained in more detail below
65 The competitive events that triggered the requests were generally the entry of a new competitor, but also included the refurbishment or relocation of a competing LBO.
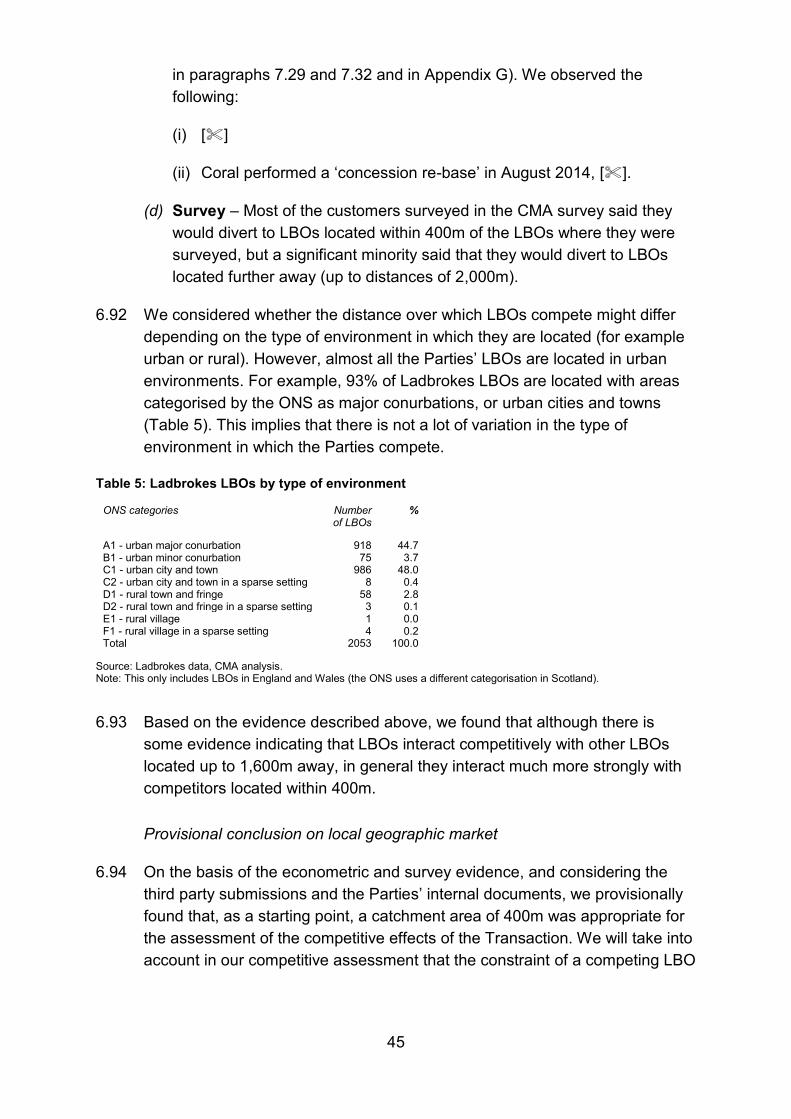
45
in paragraphs 7.29 and 7.32 and in Appendix G). We observed the following:
(i) []
(ii) Coral performed a ‘concession re-base’ in August 2014, [].
(d) Survey – Most of the customers surveyed in the CMA survey said they would divert to LBOs located within 400m of the LBOs where they were surveyed, but a significant minority said that they would divert to LBOs located further away (up to distances of 2,000m).
6.92 We considered whether the distance over which LBOs compete might differ depending on the type of environment in which they are located (for example urban or rural). However, almost all the Parties’ LBOs are located in urban environments. For example, 93% of Ladbrokes LBOs are located with areas categorised by the ONS as major conurbations, or urban cities and towns (Table 5). This implies that there is not a lot of variation in the type of environment in which the Parties compete.
Table 5: Ladbrokes LBOs by type of environment
ONS categories Number of LBOs
%
A1 - urban major conurbation 918 44.7 B1 - urban minor conurbation 75 3.7 C1 - urban city and town 986 48.0 C2 - urban city and town in a sparse setting 8 0.4 D1 - rural town and fringe 58 2.8 D2 - rural town and fringe in a sparse setting 3 0.1 E1 - rural village 1 0.0 F1 - rural village in a sparse setting 4 0.2 Total 2053 100.0
Source: Ladbrokes data, CMA analysis. Note: This only includes LBOs in England and Wales (the ONS uses a different categorisation in Scotland).
6.93 Based on the evidence described above, we found that although there is
some evidence indicating that LBOs interact competitively with other LBOs located up to 1,600m away, in general they interact much more strongly with competitors located within 400m.
Provisional conclusion on local geographic market
6.94 On the basis of the econometric and survey evidence, and considering the third party submissions and the Parties’ internal documents, we provisionally found that, as a starting point, a catchment area of 400m was appropriate for the assessment of the competitive effects of the Transaction. We will take into account in our competitive assessment that the constraint of a competing LBO
46
diminishes as distance increases. However, our competitive assessment will also take account of competitive constraints beyond 400m where appropriate.
National dimension
6.95 As Coral does not operate LBOs in Northern Ireland, the Parties only overlap in Great Britain. The effect of the Transaction on the ‘national’ parameters of competition is assessed by reference to Great Britain, where the Parties overlap.
Product market – Operation of greyhound tracks
6.96 The Parties submitted that their tracks competed with other leisure venues (such as bingo halls, bowling alleys, and cinemas) without, however, providing specific evidence substantiating that submission.
6.97 All greyhound track operators who responded to our questionnaire submitted that they competed with other leisure activities at least to some extent, and that other leisure activities constrained their decisions on price and quality at least to some degree.
6.98 In interpreting the evidence mentioned above, we took into account that greyhound tracks present a combination of characteristics that is not replicated by the other leisure activities referred to by the greyhound track operators as providing a competitive constraint (namely the ability to bet on a sporting event together with access to food and drinks, etc).66
6.99 Therefore, in the absence of compelling evidence to widen the product market to include other leisure activities, we assessed the effects of the Transaction on the basis of a product market consisting of greyhound tracks only, while recognising that the constraint from other forms of entertainment outside of this market may be material.
6.100 In any event, we do not consider the precise delineation of the product market to be determinative of the competitive assessment in this case because we provisionally do not consider that an SLC may be expected to result from the Transaction on the basis of the narrower definition of the relevant product market.
66 Although horse racing may replicate these characteristics, neither the Parties nor any of the third party track bookmakers referred to horse racing as providing any constraint on the operation of their greyhound tracks and we have not considered this in our assessment.

47
Geographic market – Operation of greyhound tracks
6.101 The Parties stated that racegoers only travel a maximum of 20 to 30 miles or 40 minutes to go to a greyhound track. However, the Parties also emphasised that the analysis should take account of local transport links.
6.102 We received a range of views from greyhound track operators regarding the catchment areas of their tracks, which indicate that the catchment area of each greyhound track varies from 12 miles to up to 60 miles.
6.103 There is a limit on the extent to which we can use information from other greyhound track operators to assess the geographic market of the Parties’ tracks. However, it is clear from the information available to us that the plausible overlap would be between Coral’s track in Romford and Ladbrokes’ track in Crayford, which are located roughly 20 miles apart. The two most relevant competitors to these two tracks are Harlow (located roughly 19 miles from Romford) and Wimbledon (located roughly 19 miles from Crayford). All other tracks are further than 30 miles away.
6.104 We therefore provisionally found that it is not necessary to conclude on the exact boundaries of the geographic market. We assessed the geographic overlap between these tracks in our competitive assessment based on more precise information about the respective customers’ location, transport links, and third party views on the local geography.
Product market – Greyhound media rights
6.105 We did not receive any evidence of significant demand- or supply-side substitution between greyhound racing and other types of sporting events. We therefore consider that the relevant product market should be no wider than media rights for greyhound racing.
6.106 We considered whether there was a degree of segmentation within the market, in particular whether it was necessary to distinguish between different types of races. We did not receive any evidence indicating that these distinctions were material to purchasers of media rights. All greyhound track operators who responded to our questionnaire hold both graded and open races,67 and SIS told us that there was no reason why different types of race could not be held at any racetrack. BAGS also told us that all racetracks were
67 Greyhound races can be ‘graded’ (where the dogs are supplied by trainers attached to the track and selected by the manager of that track) or ‘open’ (where any dog can participate subject to qualifying criteria). Greyhound races can also be flat, hurdles, or handicap races.
48
capable of holding all types of events. We concluded that it was not necessary to distinguish between different product markets based on types of races.
6.107 We then considered whether it was necessary to make a distinction based on the quality of the races held. SIS explained that the six bookmaker-owned greyhound tracks, together with perhaps three other tracks,68 are acknowledged as having the best management and providing the best product for betting purposes. SIS would always seek to acquire media rights from high quality tracks in preference to others. However, SIS also pointed out that the quality of racing had recently improved at Irish tracks.
6.108 BAGS said that the quality of racing varied across the industry, and that in general the bookmaker-owned tracks had a stronger focus on quality. However, BAGS also commented that it was difficult to make a clear distinction between premium and standard tracks and that the quality changes from year to year. We have also seen evidence that BAGS has provided guidance to greyhound tracks in order to improve the quality of their racing for betting purposes.
6.109 Although there may be differences in the quality of racing produced by different tracks, the evidence also indicated that the quality varied over time, such that it is difficult to delineate fixed segments in this market based on qualitative features of specific tracks.
6.110 We therefore provisionally concluded that the appropriate product market for our assessment was the provision of media rights for greyhound races, but we note that the quality of this product might vary, such that suppliers of high-quality races might compete more closely against each other than with other tracks. We evaluated the effect of such differentiation as part of our competitive assessment.
Geographic market – Greyhound media rights
6.111 We noted that it is possible to acquire media rights from overseas greyhound tracks for broadcast in the UK. However, we found that currently the BAGS programme (which constitutes the majority of greyhound races broadcast in LBOs) includes only tracks located in Great Britain. We did not receive any evidence indicating that the location of the tracks within Great Britain was relevant to purchasers of media rights.
68 SIS identified the independent tracks that provide the same standard of quality as the bookmaker-owned tracks as being [].

49
6.112 We therefore provisionally concluded that we should assess the effect of the Transaction on the market for purchase of greyhound media rights on a national basis.
7. Loss of competition at the local level in the supply of gambling products in the retail channel
7.1 This section considers whether, as a result of the Transaction, the loss of an existing competitor in the retail channel at a local level may be expected to give rise to competition concerns. It also explains how we identified local areas in which competition concerns may arise.
7.2 As a result of the Transaction, the Merged Entity would face less competition in local areas where the Parties currently both have at least one LBO.
7.3 We therefore examined whether, as a result of a loss of competition in any of these local areas, the Merged Entity would have the ability and incentive to increase prices and/or deteriorate other parameters of its offering in local areas where the Parties currently overlap. As part of our assessment, we investigated to what extent LBO operators have differentiated offerings (eg in terms of concessions, branding, product range, quality of service or LBO environment), such that customers might consider some of the LBO operators to be closer competitors than others. We also investigated whether independent LBO operators exert the same level of competitive constraint on the Parties as large national LBO operators.
7.4 We were also mindful of constraints that may arise from online operators as well as other constraints LBO operators may face from activities outside the relevant product market, including gaming operators.69
7.5 Overall, we found strong evidence demonstrating that the Parties can and do vary some aspects of their retail offering across local areas in response to differences in local conditions of competition. Such competitive responses include the refurbishment of LBOs as well as offering more concessions. This evidence is set out in more detail in paragraphs 7.9 to 7.33.
Assessment framework
7.6 We examined several sources of evidence relating to the competitive interaction between LBOs at a local level. In terms of identifying local areas where the Transaction may be expected to give rise to competition concerns we also considered various analytical approaches and ultimately chose a
69 See section 6 on market definition.

50
methodology that takes account of the wide variety of evidence available to us and best reflects the key parameters of competition at the local level. We refer to this methodology as the weighted share of shops (WSS) approach (see further at paragraph 7.71 below).
7.7 For the reasons explained below, we considered the WSS approach to be the most appropriate and best suited methodology in the specific circumstances of this industry. In addition, given the size of the Parties’ LBO estates and the large number of local areas where both Parties are present, we considered that it would be desirable to develop a methodology that, by virtue of its design, systematically incorporates detailed relevant information arising from the evidence available to us in our competitive assessment without, to the extent possible, having to conduct a manual assessment of each of such a large number of areas.70
7.8 We summarise below the key provisional findings arising from each of the main pieces of evidence we considered in the context of our assessment of local competitive effects and explain how this evidence informed our choice of methodology, in particular with regard to two key factors:
(a) The importance of location, including local concentration or density in terms of the number of competing LBOs as well as relative distance between competing LBOs as a proxy for the level of competitive constraint.
(b) The degree of differentiation between different LBO operators, including the importance of brands or fascia.
Entry/exit analysis
7.9 As a starting point for our analysis, we measured how the volumes transacted at the Parties’ respective LBOs changed in response to the entry or exit of other competing LBOs in local areas. This analysis can shed some light on the closeness of competition between LBOs, both in terms of geography and fascia: the more customers that consider the new LBO as a good alternative to the Parties’ LBOs, the larger the volume change in the Parties’ LBOs.
7.10 We collected data on the betting and gaming stakes taken by the Parties’ LBOs over the past five years, and we identified all cases of LBO openings and closures in Great Britain over that period. There were over 800 cases of
70 As explained at footnote 77 below, the Parties overlap in such a large number of local areas that a manual individual assessment of each of such a large number of areas would not appear to be either practicable or feasible within the statutory timetable of a phase 2 merger investigation.
51
LBO openings and over 600 cases of LBO closures within 1,600m of Ladbrokes and Coral LBOs over the last five years. We considered this to be a sufficient number of observations to estimate robustly the effect of entry or exit in local areas.
7.11 This analysis did not control for some of the local factors that affect volumes, with the implication that we have likely underestimated the impact of entry/exit.71 Nevertheless, this analysis provided us with some insights into the distance over which LBOs compete, and the closeness of competition between fascia.
7.12 The details of this analysis are explained in Appendix E. In the remainder of this summary of our entry/exit analysis, we use the term ‘centroid LBO’ to refer to each specific LBO at which we assessed volume changes, and the term ‘focal competitor LBO’ to refer to the LBOs entering or exiting the local areas. We examined how the entry or exit of the focal competitor LBO affected the volume of stakes in the centroid LBO.
Insights into the role of location and distance
7.13 Our analysis showed that the impact of entry/exit is reduced significantly as the distance between the centroid LBO and the focal competitor LBO increases. Figure 6 below shows that the average reduction in volumes is [] when the focal competitor LBO is located between 0 and 200m, and just [] when the competitor is located between 200 and 400m. The impact then drops below [] when entry occurs further than 400m away from the centroid LBO.
71 For example, it is reasonable to assume that new entry is more likely to occur in areas where demand is growing. New entry will have a negative effect on the volumes of the centroid LBO, but growing demand will have a positive effect on volumes. Because we do not control for the effect of local changes in demand, our analysis is likely to underestimate the ‘true’ effect of new entry.

52
Figure 6: Average effect of entry/exit on volumes by distance
Source: CMA analysis. Note: The average effect reported in this chart is calculated from Tables A and B in Appendix E as the arithmetic average of the coefficients that are statistically significant within each distance band.
7.14 We then considered the interaction between distance and local concentration with regard to impact on volumes. We estimated the average change in volumes due to entry/exit for different categories of competitive environments defined by reference to: (a) the distance between the centroid LBO and the focal competitor LBO (as above); and (b) the number of LBOs within 400m of the centroid LBO before entry. We limited this analysis to cases of entry/exit within 400m of each focal competitor LBO. The results are reported in Table 6 below.
7.15 Our analysis demonstrates that the magnitude of the impact of entry/exit on volumes does not just depend on the distance between the centroid LBO and the focal competitor LBO, but also on the number of other LBOs present in the area prior to entry/exit. Nonetheless, distance is likely to be the key factor, however. By way of illustration, when the focal competitor LBO is located close to the centroid LBO, the impact of entry/exit on volumes can be large even where there is already a significant number of other LBOs in the area. In contrast, when the focal competitor LBO is located further away, its impact is generally only important when there are not many other LBOs in the area.
0-200m 200-400m 400-800m 800-1600m
Ave
rage
imp
act
on
vo
lum
es
Distance between the centroid LBO and the focal competitor LBO
[]
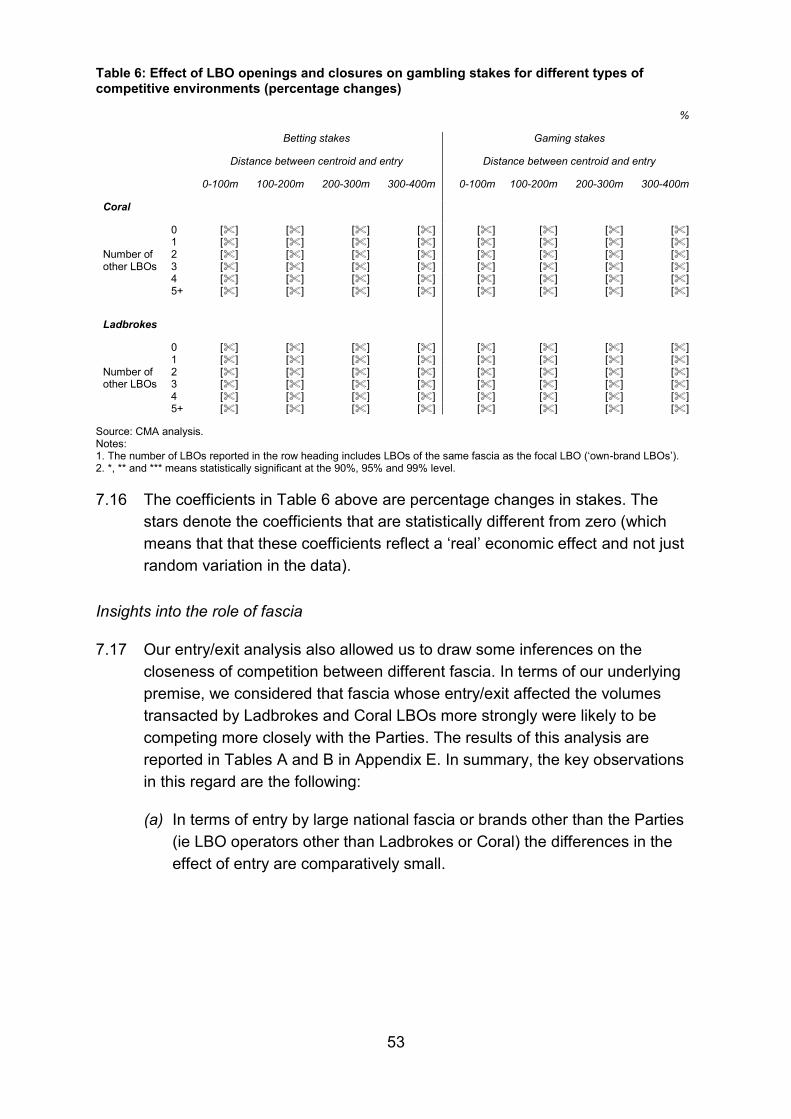
53
Table 6: Effect of LBO openings and closures on gambling stakes for different types of competitive environments (percentage changes)
%
Betting stakes Gaming stakes
Distance between centroid and entry Distance between centroid and entry
0-100m 100-200m 200-300m 300-400m 0-100m 100-200m 200-300m 300-400m
Coral
Number of other LBOs
0 [] [] [] [] [] [] [] [] 1 [] [] [] [] [] [] [] [] 2 [] [] [] [] [] [] [] [] 3 [] [] [] [] [] [] [] [] 4 [] [] [] [] [] [] [] [] 5+ [] [] [] [] [] [] [] []
Ladbrokes
Number of other LBOs
0 [] [] [] [] [] [] [] [] 1 [] [] [] [] [] [] [] [] 2 [] [] [] [] [] [] [] [] 3 [] [] [] [] [] [] [] [] 4 [] [] [] [] [] [] [] [] 5+ [] [] [] [] [] [] [] []
Source: CMA analysis. Notes: 1. The number of LBOs reported in the row heading includes LBOs of the same fascia as the focal LBO (‘own-brand LBOs’). 2. *, ** and *** means statistically significant at the 90%, 95% and 99% level.
7.16 The coefficients in Table 6 above are percentage changes in stakes. The stars denote the coefficients that are statistically different from zero (which means that that these coefficients reflect a ‘real’ economic effect and not just random variation in the data).
Insights into the role of fascia
7.17 Our entry/exit analysis also allowed us to draw some inferences on the closeness of competition between different fascia. In terms of our underlying premise, we considered that fascia whose entry/exit affected the volumes transacted by Ladbrokes and Coral LBOs more strongly were likely to be competing more closely with the Parties. The results of this analysis are reported in Tables A and B in Appendix E. In summary, the key observations in this regard are the following:
(a) In terms of entry by large national fascia or brands other than the Parties (ie LBO operators other than Ladbrokes or Coral) the differences in the effect of entry are comparatively small.
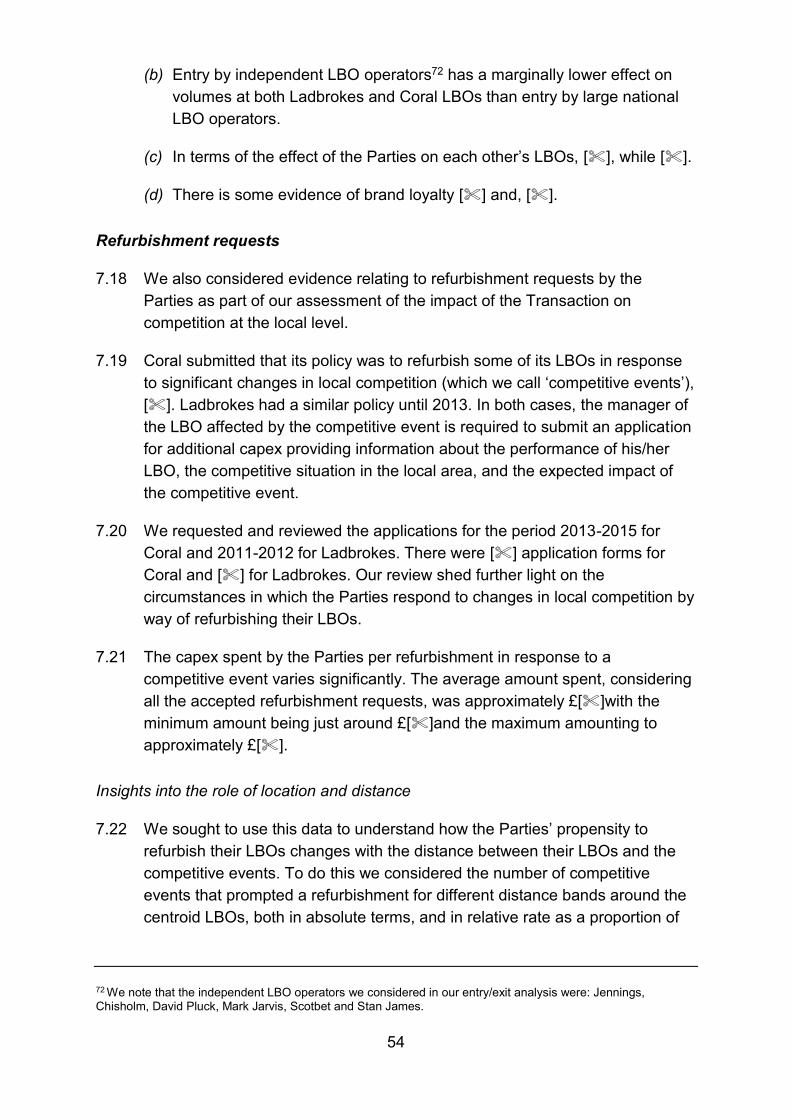
54
(b) Entry by independent LBO operators72 has a marginally lower effect on volumes at both Ladbrokes and Coral LBOs than entry by large national LBO operators.
(c) In terms of the effect of the Parties on each other’s LBOs, [], while [].
(d) There is some evidence of brand loyalty [] and, [].
Refurbishment requests
7.18 We also considered evidence relating to refurbishment requests by the Parties as part of our assessment of the impact of the Transaction on competition at the local level.
7.19 Coral submitted that its policy was to refurbish some of its LBOs in response to significant changes in local competition (which we call ‘competitive events’), []. Ladbrokes had a similar policy until 2013. In both cases, the manager of the LBO affected by the competitive event is required to submit an application for additional capex providing information about the performance of his/her LBO, the competitive situation in the local area, and the expected impact of the competitive event.
7.20 We requested and reviewed the applications for the period 2013-2015 for Coral and 2011-2012 for Ladbrokes. There were [] application forms for Coral and [] for Ladbrokes. Our review shed further light on the circumstances in which the Parties respond to changes in local competition by way of refurbishing their LBOs.
7.21 The capex spent by the Parties per refurbishment in response to a competitive event varies significantly. The average amount spent, considering all the accepted refurbishment requests, was approximately £[]with the minimum amount being just around £[]and the maximum amounting to approximately £[].
Insights into the role of location and distance
7.22 We sought to use this data to understand how the Parties’ propensity to refurbish their LBOs changes with the distance between their LBOs and the competitive events. To do this we considered the number of competitive events that prompted a refurbishment for different distance bands around the centroid LBOs, both in absolute terms, and in relative rate as a proportion of
72 We note that the independent LBO operators we considered in our entry/exit analysis were: Jennings, Chisholm, David Pluck, Mark Jarvis, Scotbet and Stan James.
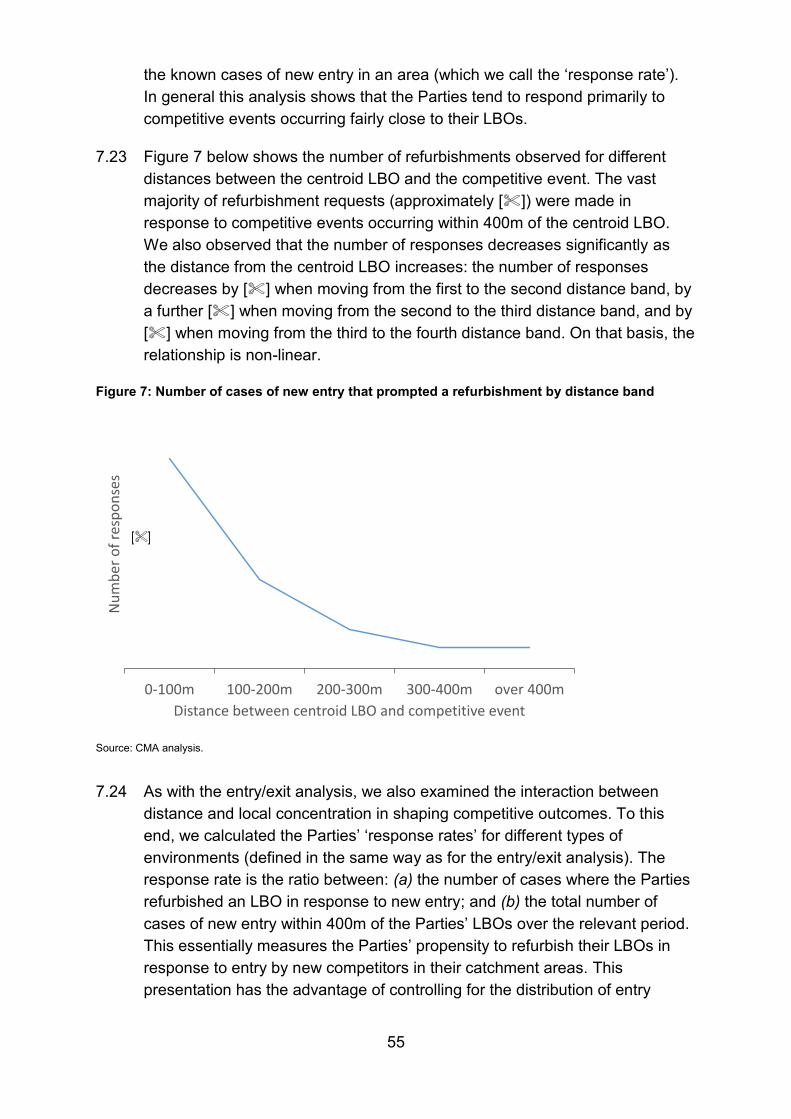
55
the known cases of new entry in an area (which we call the ‘response rate’). In general this analysis shows that the Parties tend to respond primarily to competitive events occurring fairly close to their LBOs.
7.23 Figure 7 below shows the number of refurbishments observed for different distances between the centroid LBO and the competitive event. The vast majority of refurbishment requests (approximately []) were made in response to competitive events occurring within 400m of the centroid LBO. We also observed that the number of responses decreases significantly as the distance from the centroid LBO increases: the number of responses decreases by [] when moving from the first to the second distance band, by a further [] when moving from the second to the third distance band, and by [] when moving from the third to the fourth distance band. On that basis, the relationship is non-linear.
Figure 7: Number of cases of new entry that prompted a refurbishment by distance band
Source: CMA analysis.
7.24 As with the entry/exit analysis, we also examined the interaction between
distance and local concentration in shaping competitive outcomes. To this end, we calculated the Parties’ ‘response rates’ for different types of environments (defined in the same way as for the entry/exit analysis). The response rate is the ratio between: (a) the number of cases where the Parties refurbished an LBO in response to new entry; and (b) the total number of cases of new entry within 400m of the Parties’ LBOs over the relevant period. This essentially measures the Parties’ propensity to refurbish their LBOs in response to entry by new competitors in their catchment areas. This presentation has the advantage of controlling for the distribution of entry
0-100m 100-200m 200-300m 300-400m over 400m
Nu
mb
er o
f re
spo
nse
s
Distance between centroid LBO and competitive event
[]
56
events (so if the response rate for a particular environment is high, we know that this is not just because there are more entry events in that environment, but also because the Parties tend to respond to these events more). The results are reported in Table 7.
7.25 We found that there was a clear pattern showing that the response rate decreased with greater distance to the new entrant, and with a greater number of other competing LBOs. This indicates that the strength of the competitive interaction between two LBOs depends on the distance between these two LBOs relative to the number and location of other competitors.
Table 7: Response rate for different types of competitive environments
Distance between centroid LBO and entrant
0-100m 100-200m 200-300m 300-400m
Number of other LBOs (400m)
0 [] [] [] [] 1 [] [] [] [] 2 [] [] [] [] 3 [] [] [] [] 4 [] [] [] [] 5+ [] [] [] []
Source: CMA analysis of refurbishment requests submitted by the Parties. Note: The number of LBOs reported in the row heading excludes LBOs of the same fascia as the centroid LBO (ie that is own-brand LBOs); the two categories ‘zero competitor, 200-300’ and ‘zero competitor 300-400’ had fewer than ten new entrants in the periods considered.
Insights into the role of fascia
7.26 The refurbishment request data also allowed us to make some observations on the role of fascia. In particular, the Parties’ response rates to entry by different fascia or brands, as shown in Table 8 below, demonstrated that:
(a) in terms of the interaction between the Parties, [], while []; and
(b) in terms of the interaction with other large national LBO operators, the differences are less pronounced. Coral has similar response rates to []. Ladbrokes has a higher-than-average response rate to [].
7.27 The refurbishment request data did not allow us to calculate response rates for independent LBO operators given that the data on LBO openings available to us covered only a share of independent LBO operators.
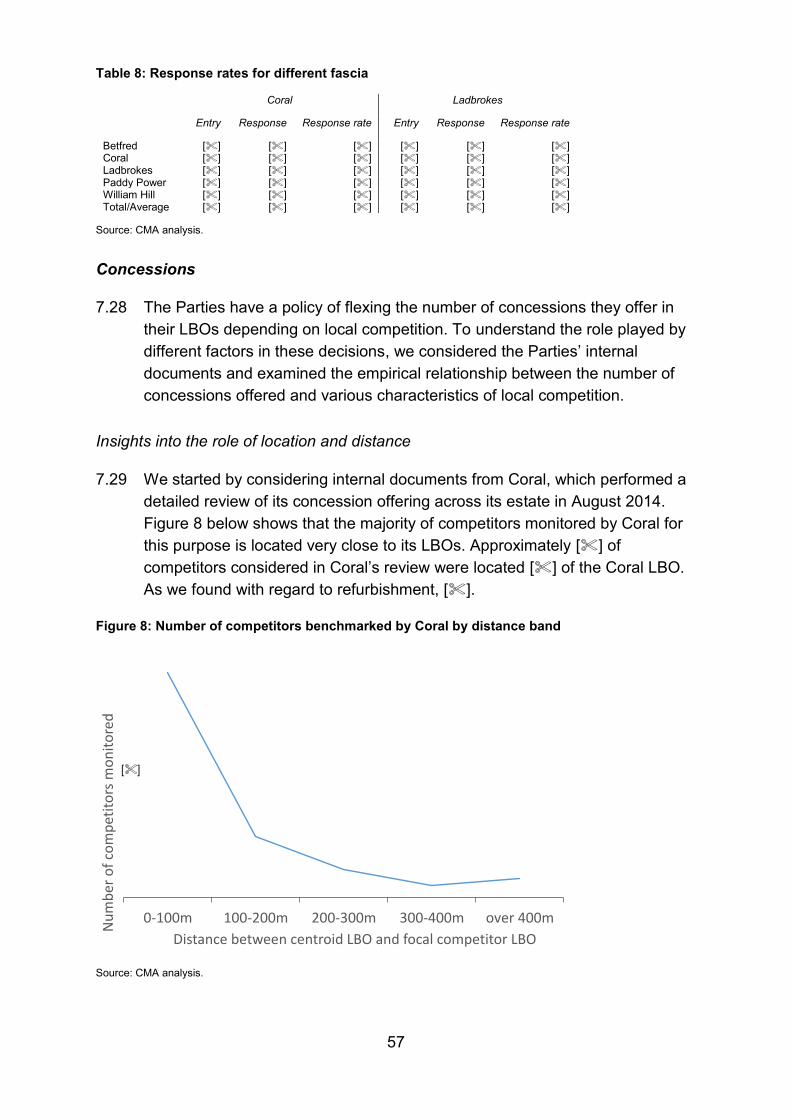
57
Table 8: Response rates for different fascia
Coral Ladbrokes
Entry Response Response rate Entry Response Response rate
Betfred [] [] [] [] [] [] Coral [] [] [] [] [] [] Ladbrokes [] [] [] [] [] [] Paddy Power [] [] [] [] [] [] William Hill [] [] [] [] [] [] Total/Average [] [] [] [] [] []
Source: CMA analysis.
Concessions
7.28 The Parties have a policy of flexing the number of concessions they offer in their LBOs depending on local competition. To understand the role played by different factors in these decisions, we considered the Parties’ internal documents and examined the empirical relationship between the number of concessions offered and various characteristics of local competition.
Insights into the role of location and distance
7.29 We started by considering internal documents from Coral, which performed a detailed review of its concession offering across its estate in August 2014. Figure 8 below shows that the majority of competitors monitored by Coral for this purpose is located very close to its LBOs. Approximately [] of competitors considered in Coral’s review were located [] of the Coral LBO. As we found with regard to refurbishment, [].
Figure 8: Number of competitors benchmarked by Coral by distance band
Source: CMA analysis.
0-100m 100-200m 200-300m 300-400m over 400m
Nu
mb
er o
f co
mp
etit
ors
mo
nit
ore
d
Distance between centroid LBO and focal competitor LBO
[]
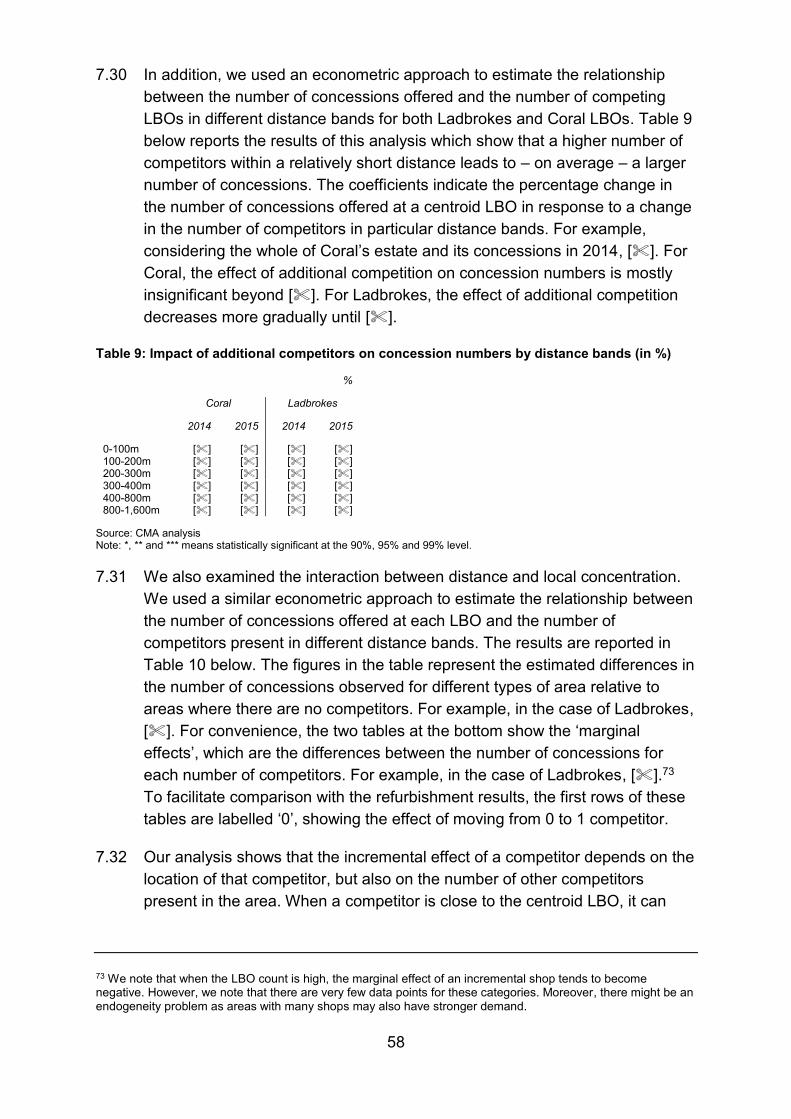
58
7.30 In addition, we used an econometric approach to estimate the relationship between the number of concessions offered and the number of competing LBOs in different distance bands for both Ladbrokes and Coral LBOs. Table 9 below reports the results of this analysis which show that a higher number of competitors within a relatively short distance leads to – on average – a larger number of concessions. The coefficients indicate the percentage change in the number of concessions offered at a centroid LBO in response to a change in the number of competitors in particular distance bands. For example, considering the whole of Coral’s estate and its concessions in 2014, []. For Coral, the effect of additional competition on concession numbers is mostly insignificant beyond []. For Ladbrokes, the effect of additional competition decreases more gradually until [].
Table 9: Impact of additional competitors on concession numbers by distance bands (in %)
%
Coral Ladbrokes
2014 2015 2014 2015
0-100m [] [] [] [] 100-200m [] [] [] [] 200-300m [] [] [] [] 300-400m [] [] [] [] 400-800m [] [] [] [] 800-1,600m [] [] [] []
Source: CMA analysis Note: *, ** and *** means statistically significant at the 90%, 95% and 99% level.
7.31 We also examined the interaction between distance and local concentration. We used a similar econometric approach to estimate the relationship between the number of concessions offered at each LBO and the number of competitors present in different distance bands. The results are reported in Table 10 below. The figures in the table represent the estimated differences in the number of concessions observed for different types of area relative to areas where there are no competitors. For example, in the case of Ladbrokes, []. For convenience, the two tables at the bottom show the ‘marginal effects’, which are the differences between the number of concessions for each number of competitors. For example, in the case of Ladbrokes, [].73 To facilitate comparison with the refurbishment results, the first rows of these tables are labelled ‘0’, showing the effect of moving from 0 to 1 competitor.
7.32 Our analysis shows that the incremental effect of a competitor depends on the location of that competitor, but also on the number of other competitors present in the area. When a competitor is close to the centroid LBO, it can
73 We note that when the LBO count is high, the marginal effect of an incremental shop tends to become negative. However, we note that there are very few data points for these categories. Moreover, there might be an endogeneity problem as areas with many shops may also have stronger demand.
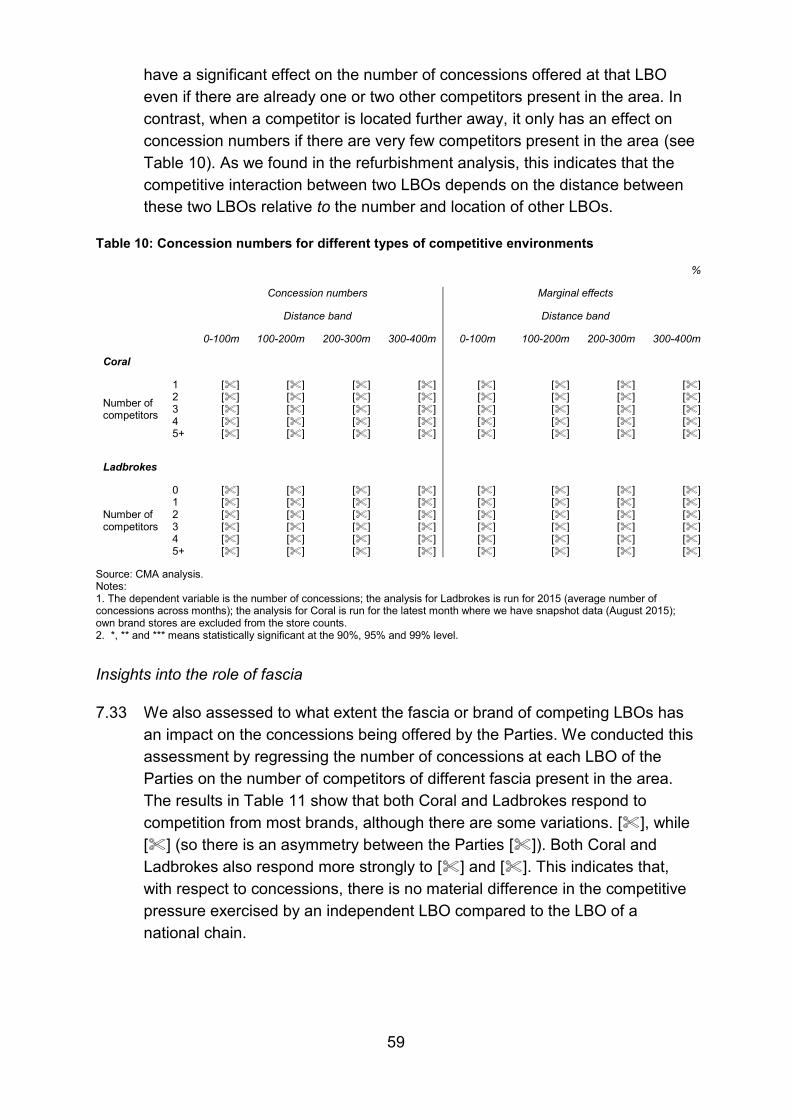
59
have a significant effect on the number of concessions offered at that LBO even if there are already one or two other competitors present in the area. In contrast, when a competitor is located further away, it only has an effect on concession numbers if there are very few competitors present in the area (see Table 10). As we found in the refurbishment analysis, this indicates that the competitive interaction between two LBOs depends on the distance between these two LBOs relative to the number and location of other LBOs.
Table 10: Concession numbers for different types of competitive environments
%
Concession numbers Marginal effects
Distance band Distance band
0-100m 100-200m 200-300m 300-400m 0-100m 100-200m 200-300m 300-400m
Coral
Number of competitors
1 [] [] [] [] [] [] [] [] 2 [] [] [] [] [] [] [] [] 3 [] [] [] [] [] [] [] [] 4 [] [] [] [] [] [] [] [] 5+ [] [] [] [] [] [] [] []
Ladbrokes
Number of competitors
0 [] [] [] [] [] [] [] [] 1 [] [] [] [] [] [] [] [] 2 [] [] [] [] [] [] [] [] 3 [] [] [] [] [] [] [] [] 4 [] [] [] [] [] [] [] [] 5+ [] [] [] [] [] [] [] []
Source: CMA analysis. Notes: 1. The dependent variable is the number of concessions; the analysis for Ladbrokes is run for 2015 (average number of concessions across months); the analysis for Coral is run for the latest month where we have snapshot data (August 2015); own brand stores are excluded from the store counts. 2. *, ** and *** means statistically significant at the 90%, 95% and 99% level.
Insights into the role of fascia
7.33 We also assessed to what extent the fascia or brand of competing LBOs has an impact on the concessions being offered by the Parties. We conducted this assessment by regressing the number of concessions at each LBO of the Parties on the number of competitors of different fascia present in the area. The results in Table 11 show that both Coral and Ladbrokes respond to competition from most brands, although there are some variations. [], while [] (so there is an asymmetry between the Parties []). Both Coral and Ladbrokes also respond more strongly to [] and []. This indicates that, with respect to concessions, there is no material difference in the competitive pressure exercised by an independent LBO compared to the LBO of a national chain.
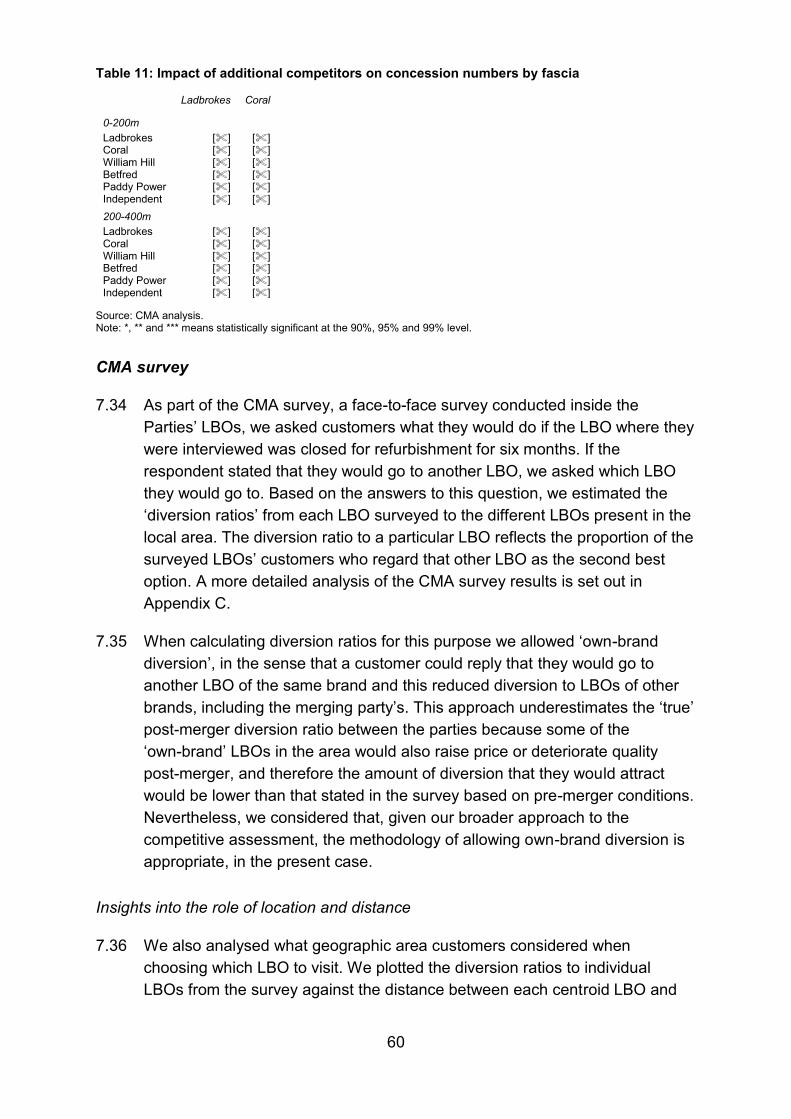
60
Table 11: Impact of additional competitors on concession numbers by fascia
Ladbrokes Coral
0-200m Ladbrokes [] [] Coral [] [] William Hill [] [] Betfred [] [] Paddy Power [] [] Independent [] [] 200-400m Ladbrokes [] [] Coral [] [] William Hill [] [] Betfred [] [] Paddy Power [] [] Independent [] []
Source: CMA analysis. Note: *, ** and *** means statistically significant at the 90%, 95% and 99% level.
CMA survey
7.34 As part of the CMA survey, a face-to-face survey conducted inside the Parties’ LBOs, we asked customers what they would do if the LBO where they were interviewed was closed for refurbishment for six months. If the respondent stated that they would go to another LBO, we asked which LBO they would go to. Based on the answers to this question, we estimated the ‘diversion ratios’ from each LBO surveyed to the different LBOs present in the local area. The diversion ratio to a particular LBO reflects the proportion of the surveyed LBOs’ customers who regard that other LBO as the second best option. A more detailed analysis of the CMA survey results is set out in Appendix C.
7.35 When calculating diversion ratios for this purpose we allowed ‘own-brand diversion’, in the sense that a customer could reply that they would go to another LBO of the same brand and this reduced diversion to LBOs of other brands, including the merging party’s. This approach underestimates the ‘true’ post-merger diversion ratio between the parties because some of the ‘own-brand’ LBOs in the area would also raise price or deteriorate quality post-merger, and therefore the amount of diversion that they would attract would be lower than that stated in the survey based on pre-merger conditions. Nevertheless, we considered that, given our broader approach to the competitive assessment, the methodology of allowing own-brand diversion is appropriate, in the present case.
Insights into the role of location and distance
7.36 We also analysed what geographic area customers considered when choosing which LBO to visit. We plotted the diversion ratios to individual LBOs from the survey against the distance between each centroid LBO and

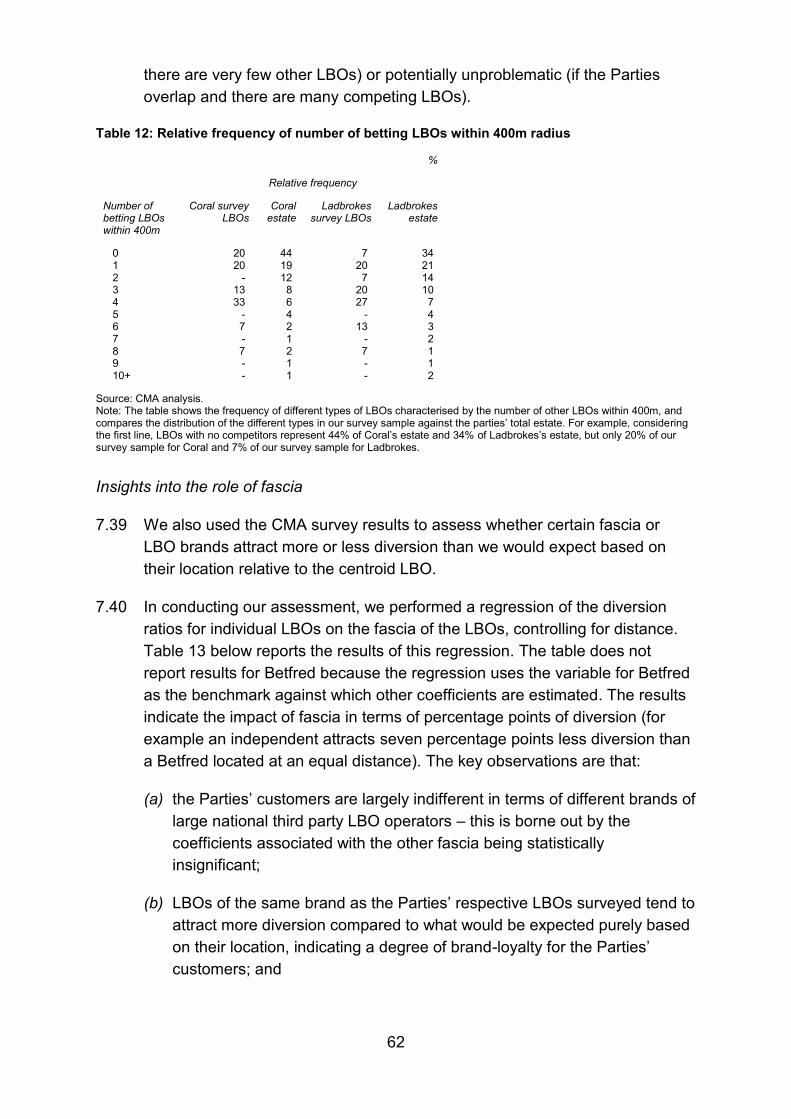
62
there are very few other LBOs) or potentially unproblematic (if the Parties overlap and there are many competing LBOs).
Table 12: Relative frequency of number of betting LBOs within 400m radius
%
Relative frequency
Number of betting LBOs within 400m
Coral survey LBOs
Coral estate
Ladbrokes survey LBOs
Ladbrokes estate
0 20 44 7 34 1 20 19 20 21 2 - 12 7 14 3 13 8 20 10 4 33 6 27 7 5 - 4 - 4 6 7 2 13 3 7 - 1 - 2 8 7 2 7 1 9 - 1 - 1 10+ - 1 - 2
Source: CMA analysis. Note: The table shows the frequency of different types of LBOs characterised by the number of other LBOs within 400m, and compares the distribution of the different types in our survey sample against the parties’ total estate. For example, considering the first line, LBOs with no competitors represent 44% of Coral’s estate and 34% of Ladbrokes’s estate, but only 20% of our survey sample for Coral and 7% of our survey sample for Ladbrokes.
Insights into the role of fascia
7.39 We also used the CMA survey results to assess whether certain fascia or LBO brands attract more or less diversion than we would expect based on their location relative to the centroid LBO.
7.40 In conducting our assessment, we performed a regression of the diversion ratios for individual LBOs on the fascia of the LBOs, controlling for distance. Table 13 below reports the results of this regression. The table does not report results for Betfred because the regression uses the variable for Betfred as the benchmark against which other coefficients are estimated. The results indicate the impact of fascia in terms of percentage points of diversion (for example an independent attracts seven percentage points less diversion than a Betfred located at an equal distance). The key observations are that:
(a) the Parties’ customers are largely indifferent in terms of different brands of large national third party LBO operators – this is borne out by the coefficients associated with the other fascia being statistically insignificant;
(b) LBOs of the same brand as the Parties’ respective LBOs surveyed tend to attract more diversion compared to what would be expected purely based on their location, indicating a degree of brand-loyalty for the Parties’ customers; and
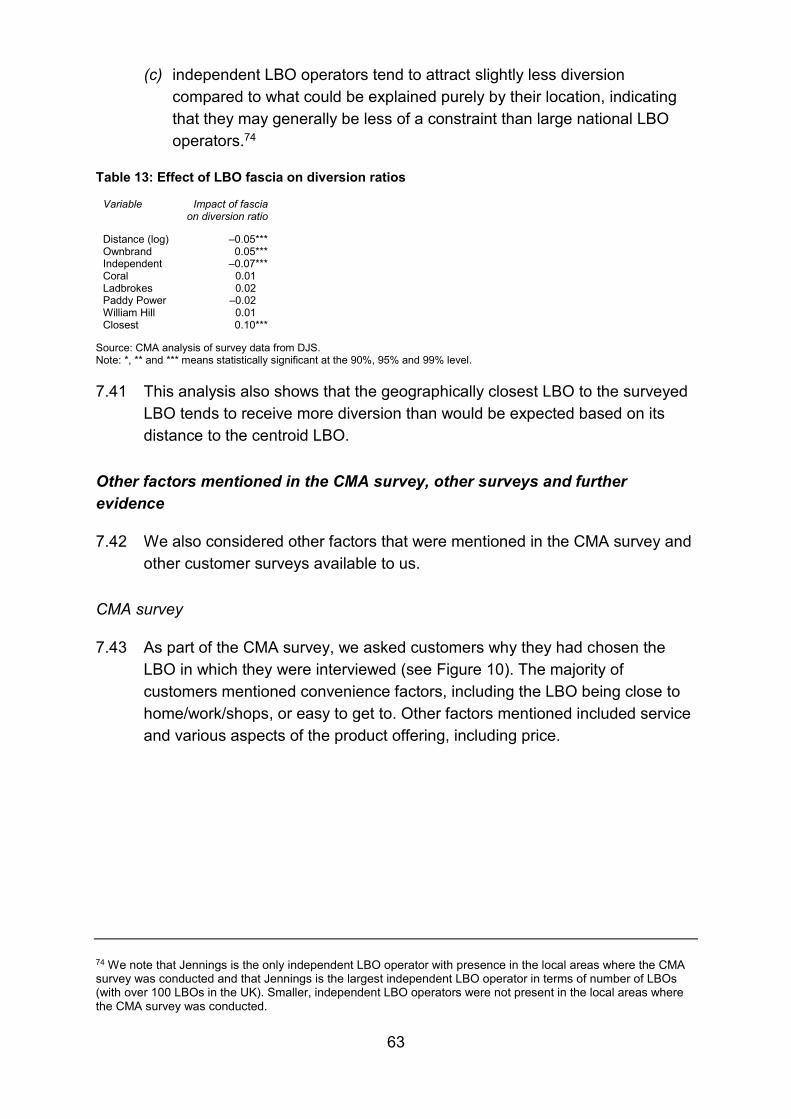
63
(c) independent LBO operators tend to attract slightly less diversion compared to what could be explained purely by their location, indicating that they may generally be less of a constraint than large national LBO operators.74
Table 13: Effect of LBO fascia on diversion ratios
Variable Impact of fascia on diversion ratio
Distance (log) –0.05*** Ownbrand 0.05*** Independent –0.07*** Coral 0.01 Ladbrokes 0.02 Paddy Power –0.02 William Hill 0.01 Closest 0.10***
Source: CMA analysis of survey data from DJS. Note: *, ** and *** means statistically significant at the 90%, 95% and 99% level.
7.41 This analysis also shows that the geographically closest LBO to the surveyed LBO tends to receive more diversion than would be expected based on its distance to the centroid LBO.
Other factors mentioned in the CMA survey, other surveys and further evidence
7.42 We also considered other factors that were mentioned in the CMA survey and other customer surveys available to us.
CMA survey
7.43 As part of the CMA survey, we asked customers why they had chosen the LBO in which they were interviewed (see Figure 10). The majority of customers mentioned convenience factors, including the LBO being close to home/work/shops, or easy to get to. Other factors mentioned included service and various aspects of the product offering, including price.
74 We note that Jennings is the only independent LBO operator with presence in the local areas where the CMA survey was conducted and that Jennings is the largest independent LBO operator in terms of number of LBOs (with over 100 LBOs in the UK). Smaller, independent LBO operators were not present in the local areas where the CMA survey was conducted.
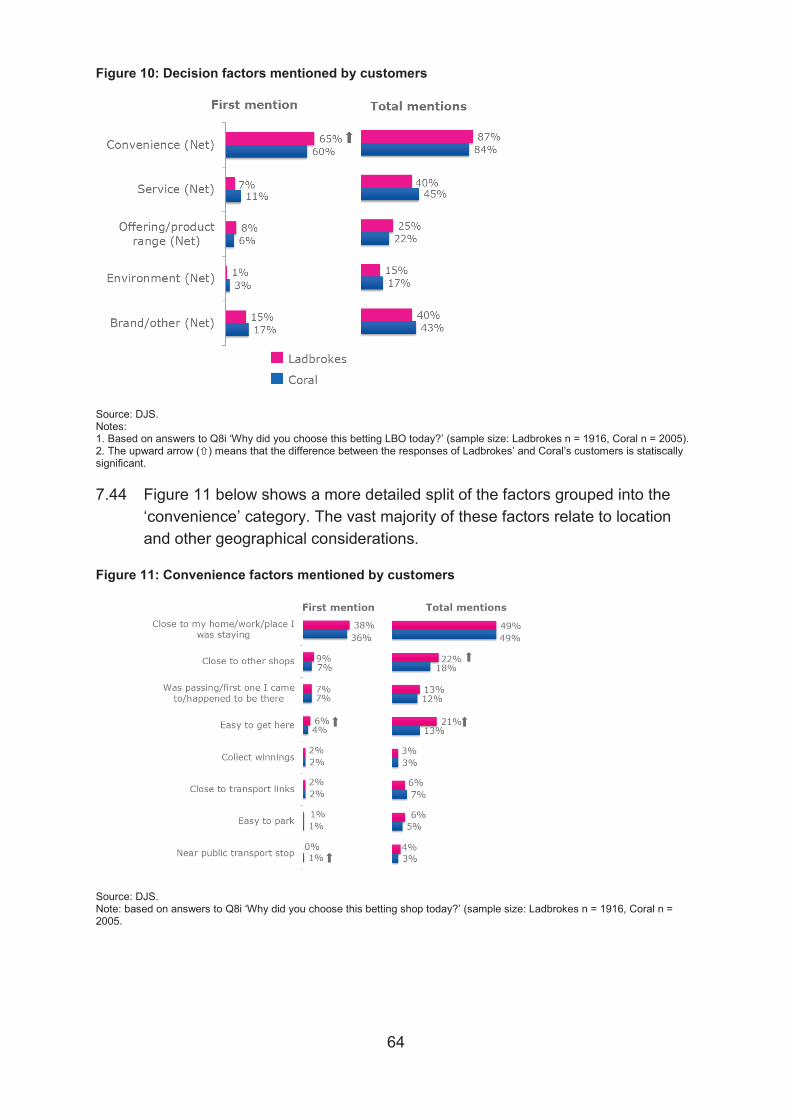
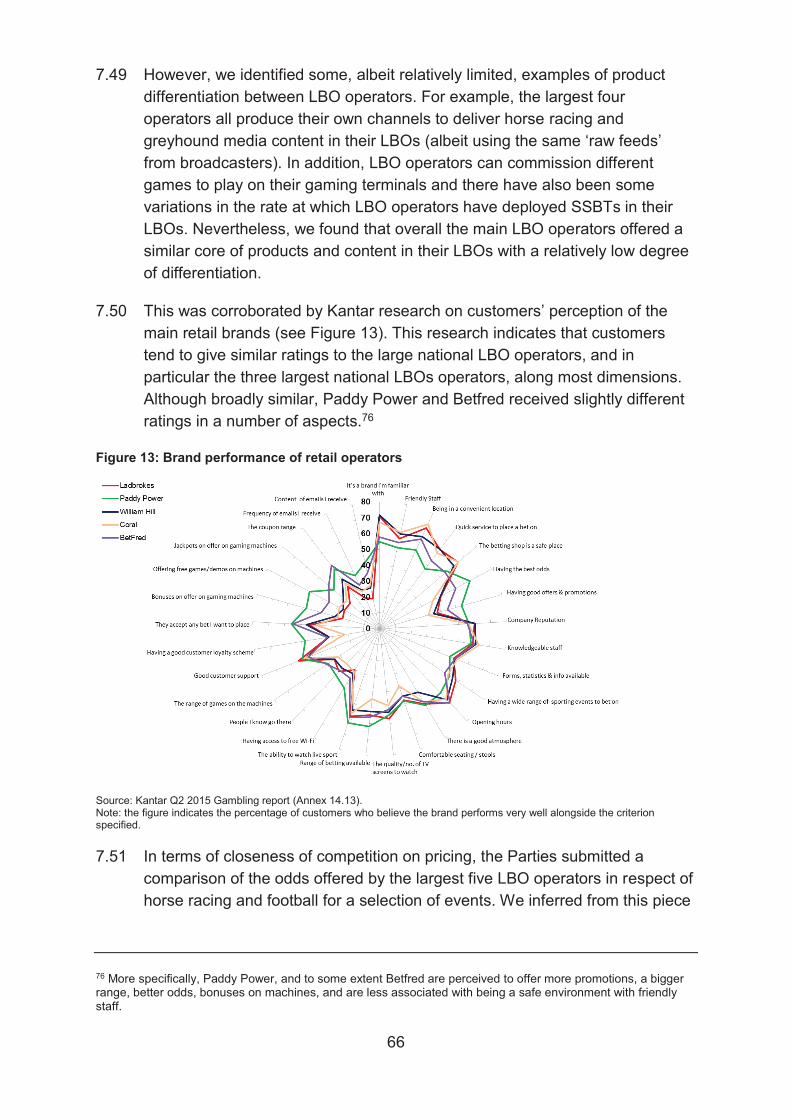
67
of evidence that the Parties do not compete more closely with each other on odds for horse racing or football than with other retail LBO chains. However, we note that it only covered a limited number of selections, and it did not incorporate the effect of promotions, which can be a factor of price competition between retail operators.
7.52 Overall we found no evidence indicating that there were any significant differences in the value propositions of large, national LBO operators.
Third parties
Insights into the role of distance and location
7.53 We also gathered evidence from third parties on the key parameters of local competition. The Parties’ competitors confirmed that they responded to differences in local competition at least to some degree. In terms of the relevant distance over which this competitive interaction takes place, submissions from third parties included the following:
(a) Betfred submitted that LBOs operating within large towns or urban areas tended to compete over 400m, and LBOs operating outside urban areas tended to compete over 800m. Betfred added that in metropolitan or city areas it was more difficult to identify relevant competitors based on a specific radius.
(b) Paddy Power Betfair submitted that the area in which it monitors competitors varies significantly based on local geography. []. Paddy Power Betfair stated that the constraint of a competing LBO on one of its own LBOs would be greater the closer it was geographically located. It further stated that location was the most important factor in determining who their main competitors were.
(c) Jennings submitted that LBOs tended to compete over 250m in metropolitan areas, 800m in urban areas, and 5km in rural areas.
Insights into the role of fascia and differentiation
7.54 The majority of the Parties’ competitors submitted that there were no major differences between the offering of the Parties compared with the offering of other large national LBO operators. For instance, Betfred submitted that the LBO offering of the Parties and that of William Hill was very similar.
7.55 Some of the Parties’ competitors also commented on the constraint from independent LBO operators. Overall, many third parties made the point that a
68
lack of scale may prevent smaller independent LBO operators from competing as effectively as large rivals with a national network of LBOs (see below in paragraph 7.84 to 7.89).
Parties’ internal documents on relevance of location
7.56 The Parties submitted evidence indicating that convenience of location is the number one driver of customer choice of LBO and further stated that sometimes the closest competitor will exercise the strongest constraint, but various factors mean that this will not necessarily be the case in all circumstances.
7.57 The Parties’ own internal documents support the view that location and distance are key competitive parameters which should therefore be central to our methodology to identify problematic local areas.
7.58 By way of example, as noted above, approximately [] of competitors that Coral considered in its concession review were located within [] of the Coral LBO, and [] were located within [] of the Coral LBO.
7.59 In addition, [].
7.60 Moreover, []. In a submission to the CMA, the Parties noted that ‘all competitors are equal’ and that distance is a reasonable proxy for strength of competitive constraint.
7.61 We consider that this evidence supports the proposition that distance, including relative distance between competing LBO operators, as well as local concentration are critical to the assessment of local competitive effects in this market.
Conclusion on the factors driving competitive interaction between LBOs in local areas
7.62 The pieces of evidence that we considered showed a strong association between the strength of the competitive interaction between two LBOs on the one hand, and the distance between them and their competitors on the other hand. Conversely, among the large, national chains of LBO operators the identity of the brand generally had a weak impact, indicating that factors of that nature played a largely negligible role for the purpose of assessing the effectiveness of local competition. We concluded that the strength of the competitive interaction between the Parties in a given local area could therefore be approximated based on the number and location of their LBOs relative to the number and location of competing LBOs.
69
7.63 Our analysis of the evidence also provided us with some more detailed insights into the role of distance and local geography:
(a) The competitive constraint exerted by one LBO on another tends to decrease quite significantly as the distance between LBOs increases.
(b) The Parties respond to competition primarily within 400m of their LBOs, although there are some examples of competitive interactions or responses in relation to LBOs located further away.
(c) The geographically closest LBO exerts a competitive pressure that is higher than would be expected based purely on its distance from the centroid LBO.
CMA methodology for identifying potential local competition concerns
7.64 We therefore considered how to design a methodology that would best build on and reflect these insights.
7.65 We set out below first the alternative methodologies that we considered and concerns that led us to reject them for the purposes of the competitive assessment in the present case; and secondly how we developed a methodology which we ultimately chose to apply and on the basis of which we reached our provisional findings in respect of local areas that are likely to raise competition concerns as a result of the Transaction. More specifically, with regards to our chosen methodology (which is the weighted share of shops, or WSS approach) we take the following approach:
(a) We set out below how the WSS, approach operates. In particular we explain how, in using the WSS methodology, we:
(i) assigned a weight to each LBO based on its distance from the centroid LBO (that is, the LBO on which a particular catchment area was centred);
(ii) adjusted the resulting weights to take account of stronger than average constraints (for the geographically closest LBO) and weaker than average constraints (for independent LBO operators);
(iii) took account of the cumulative constraint of a group of competing LBOs; and
(iv) took account of the constraint imposed by the online channel on LBOs.

70
(b) We explain how we establish an association between the WSS and other pieces of evidence, including the entry/exit data, our analysis of refurbishment decisions and survey evidence.
(c) We explain how we set our intervention threshold and made some further adjustments prior to reaching our provisional finding as to the local areas in relation to which the Transaction may be expected to give rise to an SLC.
Alternative methodologies based on fascia counting and distance bands
7.66 In developing our approach to the competitive assessment, we considered methodologies that are based on counting fascia or LBOs within certain distance bands.
7.67 For instance, we considered the approach used by the OFT in assessing the most recent merger in this industry (Betfred/Tote) in the context of a phase 1 investigation. In essence, this approach consisted of counting the number of fascia within different distance bands and identifying potential competition concerns based on the reduction in the number of fascia.
7.68 However, we were conscious that we have obtained more evidence and have been able to perform a greater degree of analysis in this investigation than would have been possible in the context of the OFT’s phase 1 investigation at the time. Furthermore, given our findings on the lack of significant differentiation between LBO brands and the insignificant role of fascia in local areas, we did not consider the counting of fascia to be an approach that is sufficiently reflective of the evidence available to us in this case.
7.69 We therefore considered other approaches to identifying potentially problematic local areas, including by segmenting areas by distance band and considering the competitive impact of all LBOs in the area rather than simply the different fascia.
7.70 By way of illustration, one of the approaches that we considered was to segment the different types of competitive environments on the basis of: (a) the distance between one merging party’s LBO and the other merging party’s LBO, using 100m distance bands; and (b) the number of other LBOs within 400m of the first merging party’s LBO. However, we were mindful of the limitations of such a methodology, including the following:
(a) First, such an approach would not take account of the exact location of competing LBOs within the 400m area. It therefore would not reflect the evidence available to us which shows that the competitive constraint exercised by a competitor decreases quite rapidly with distance, even
71
within a 400m band. We considered that it would not be possible to capture this factor at a later stage through the detailed assessment of maps given the large number of the Parties’ LBOs that overlap and the time available,77 so we considered it necessary to incorporate this factor in our assessment metric in the first place.
(b) Second, such an approach would also not capture the cumulative constraint exercised by a group of LBOs on another LBO. It would treat LBOs of competitors and the other merger party asymmetrically, in that it would count all LBOs of competitors (including several LBOs of the same fascia) but would not take into account potentially multiple LBOs of the other merger party. However, the CMA survey, in particular, indicates that customers generally divert to multiple LBOs of the same brand (where they exist) in a particular catchment area. The competitive constraint from the other merger party in a particular area is therefore better reflected by the sum of diversion to all of its LBOs in that particular area.78 Given that this industry is characterised by clusters of LBOs (including several LBOs of the same brand) in certain areas, and given that in the context of this inquiry it was not practicable or feasible to capture this feature of the industry through a detailed assessment of a large number of individual maps, we considered that a methodology which does not reflect the competitive dynamics that arise from such clusters of LBOs would be less suitable for our purposes.
(c) Segmenting the analysis by distance bands risks disregarding competitive constraints that may be located just outside a maximum distance band. Such an outcome would not sufficiently reflect actual competitive dynamics.
The weighted share of shops approach
7.71 In view of the above, we developed a methodology that, in our provisional view, better reflects the evidence we obtained in the course of our investigation, in particular as it builds on the key parameters of competition,
77 We considered to what extent it would be possible to take account of the precise location of LBOs as well as relative distances between them by way of a manual assessment, eg by examining local area maps where the Parties overlap. However, we considered this to be a less suitable approach in this case, in particular given that: (a) it would be more difficult to take account of varying degrees of competitive constraints as between different LBOs (eg independent LBO operators appear to generally be a weaker constraint than large, national LBO operators); and (b) the Parties overlap in such a large number of local areas that such an approach would not appear to be either practicable nor feasible within the statutory framework of a phase 2 merger investigation. 78 For example, one of the Ladbrokes LBOs that was being surveyed in the CMA Survey was Lad2246 in London. There are three Coral LBOs within 400m of Lad2246, and the survey indicated that each of them would receive a significant amount of diversion, ie 20%, 17% and 5%. Therefore, the sum of diversion to Coral in this catchment area is 42%, which is significantly higher than the diversion ratio to an individual Coral LBO.
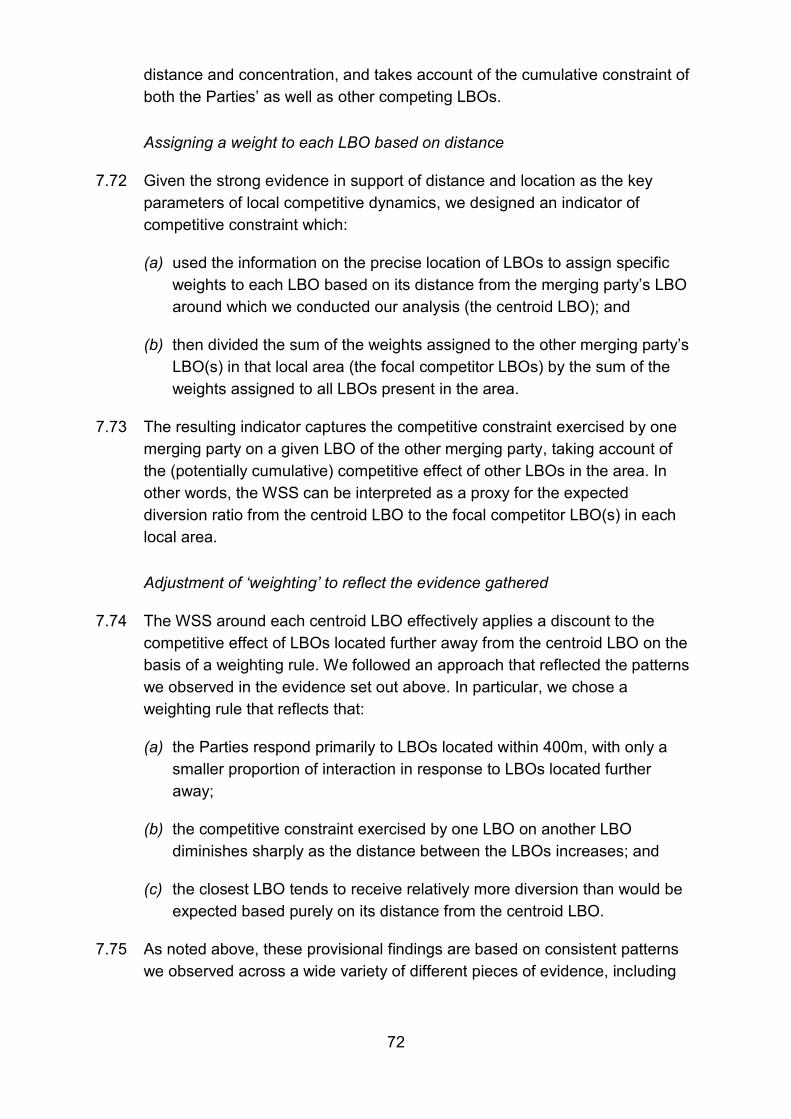
72
distance and concentration, and takes account of the cumulative constraint of both the Parties’ as well as other competing LBOs.
Assigning a weight to each LBO based on distance
7.72 Given the strong evidence in support of distance and location as the key parameters of local competitive dynamics, we designed an indicator of competitive constraint which:
(a) used the information on the precise location of LBOs to assign specific weights to each LBO based on its distance from the merging party’s LBO around which we conducted our analysis (the centroid LBO); and
(b) then divided the sum of the weights assigned to the other merging party’s LBO(s) in that local area (the focal competitor LBOs) by the sum of the weights assigned to all LBOs present in the area.
7.73 The resulting indicator captures the competitive constraint exercised by one merging party on a given LBO of the other merging party, taking account of the (potentially cumulative) competitive effect of other LBOs in the area. In other words, the WSS can be interpreted as a proxy for the expected diversion ratio from the centroid LBO to the focal competitor LBO(s) in each local area.
Adjustment of ‘weighting’ to reflect the evidence gathered
7.74 The WSS around each centroid LBO effectively applies a discount to the competitive effect of LBOs located further away from the centroid LBO on the basis of a weighting rule. We followed an approach that reflected the patterns we observed in the evidence set out above. In particular, we chose a weighting rule that reflects that:
(a) the Parties respond primarily to LBOs located within 400m, with only a smaller proportion of interaction in response to LBOs located further away;
(b) the competitive constraint exercised by one LBO on another LBO diminishes sharply as the distance between the LBOs increases; and
(c) the closest LBO tends to receive relatively more diversion than would be expected based purely on its distance from the centroid LBO.
7.75 As noted above, these provisional findings are based on consistent patterns we observed across a wide variety of different pieces of evidence, including
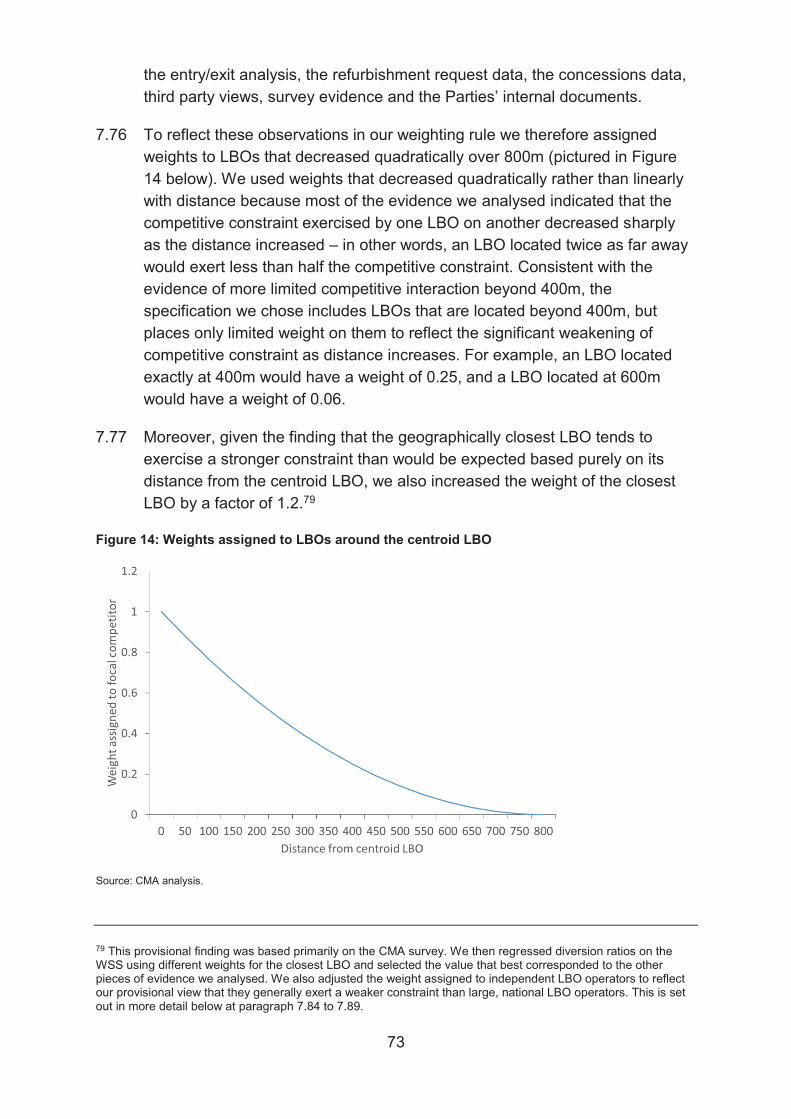
74
Worked examples illustrating weighting
7.78 The two worked examples below in Figure 15 illustrate the approach we took to calculating the WSS as an indicator of the degree of competitive constraint in a given local area.
Figure 15: Worked examples of WSS calculations
Centroid shop Coral [1–(200/800)]2 = 23.6% Competitors Ladbrokes 200m 1.2*[1–(50/800)]2 + [1–(100/800)]2 + [1–(200/800)]2
William Hill 100m
Betfred 50m
Centroid shop Coral
1.2*[1–(20/800)]2 = 85.6% Competitiors Ladbrokes 20m 1.2*[1–(20/800)]2 + [1–(450/800)]2
William Hill 450m
Source: CMA analysis.
7.79 In the first example, a Coral LBO is the ‘centroid LBO’ facing three competitors within 200m (and no further competitors within 800m). As such, this scenario would result in a ‘four to three’ fascia count reduction within 200m, meaning that the Merged Entity would face only two other competitors in this local area. However, the WSS approach takes account of the relative distance of these competing LBOs to the centroid LBO, rather than limiting itself to merely counting competing LBOs within distance bands. As such, the WSS approach reflects the fact that both the Betfred and the William Hill LBO are closer to the centroid Coral LBO than Ladbrokes’ LBO. In applying the formula set out above,80 the WSS is 23.6%.
7.80 In the second example, a Coral LBO is the centroid LBO facing just two competitors, a Ladbrokes just 20m away (the focal competitor LBO) and a William Hill 450m away. The WSS approach is not limited to identifying a ‘three to two’ fascia count reduction within 800m, but recognises that the focal competitor LBO is just 20m away and the other competitor is quite a bit further away. As such, the WSS approach arrives at a high value of 85%, which also reflects the ‘uplift’ attributed to the Ladbrokes LBO based on it being the geographically closest competitor to the Coral centroid LBO.
80 By assigning a weight to each LBO based on its distance from the centroid LBO and dividing the sum of the weights assigned to the other merging party (here Coral) by the sum of the weights assigned to all shops present in the area (including Coral).

75
Taking account of the cumulative constraint of a group of LBOs
7.81 The WSS approach is also capable of reflecting the cumulative constraint that may arise from a group of LBOs of the same brand. This is illustrated by the worked example below.
Figure 16: Worked example of cumulative constraints by a group of LBOs
Centroid shop Coral [1–(200/800)]2 = 23.6% Competitors Ladbrokes 200m 1.2*[1–(50/800)]2 + [1–(100/800)]2 + [1–(200/800)]2
William Hill 100m
Betfred 50m
Centroid shop Coral
1.2*[1–(200/800)]2 + 1.2*[1–(280/800)]2 + 1.2*[1–(350/800)]2 = 41.7% Competitiors Ladbrokes 200m
1.2*[1–(50/800)]2 + [1–(100/800)]2 + [1–(200/800)]2
+ [1–(280/800)]2 + [1–(350/800)]2 Ladbrokes 350m
Ladbrokes 280m
William Hill 100m
Betfred 50m
Source: CMA analysis.
7.82 The first local area example in Figure 15 above is the same example as the first example in Figure 16. The second local area example in Figure 16 also has a Coral LBO as the centroid LBO. There is one Ladbrokes focal competitor LBO 200m away from the centroid LBO. However, there are two additional Ladbrokes LBOs between 200m and 400m. This scenario would still result in a ‘four to three’ within 400m.
7.83 However, the evidence we obtained in this investigation showed that the competitive environment in the second example is different from the first example given the large number of Ladbrokes focal competitor LBOs whose cumulative constraint on Coral is significantly higher. Unlike other methodologies, the WSS approach reflects this cumulative constraint. The higher WSS value of 41.7% in this example (as opposed to 23.6% in the first example) indicates that it is more likely to give rise to competition concerns.
Weight assigned to independent LBO operators
7.84 As noted above in 7.55, the evidence available to us indicated that independent LBO operators do exercise a constraint, but that this constraint is generally weaker than the constraint exercised by national LBO operators. In particular, third parties have made the following submissions in this regard:
(a) William Hill submitted that, although some independent LBO operators represented a robust constraint on neighbouring LBOs, others would not.
76
William Hill explained that small chains of independent LBO operators did not have the scale to operate across the same breadth of sports as national LBO operators, and that they could not manage risk in the same way as national LBO operators. Furthermore, William Hill noted that national LBO operators would source their own media content, which would not be a financially viable option for independents. According to William Hill, some independent LBO operators were more vulnerable to rising regulatory costs and could not match the depth or breadth of the OTC offering of the main chains.
(b) Paddy Power Betfair noted that independent LBO operators were not as significant a constraint as the major national LBO operators on the basis that they may have less of an ability to invest in product, technology and LBO environment, and a lack of leverage with major suppliers. Paddy Power Betfair also stated that small independent LBO operators would not be able to take the same level of risk as national LBO operators and therefore set lower betting limits to customers.
(c) Betfred also stated that small independent chains were likely to face challenges in terms of their ability to offer enhancements and bonuses. It noted that small independent LBO operators may suffer from a lower degree of customer confidence regarding their ability to pay out winnings and may have restricted or more limited maximum pay-outs.
(d) Jennings submitted that the competitive constraint that an independent LBO operator can offer will depend upon the ability to compete financially by offering enhanced terms that affect the overall profit margin and the ability to provide the quality and comfort that the modern day customer expects. Jennings stated that only a few independent operators could achieve this.
7.85 The Gambling Commission also noted that the independent sector had declined considerably since 2009 and that without the significant ‘economies of scale’ available, new bookmakers faced a challenging economic environment.
7.86 A consumer research report produced by Mintel and submitted by Ladbrokes (‘Mintel Report – Betting Shops UK’, February 2014) noted a 12% decline in independent LBOs, or smaller chains, and attributed that to the lack of high-profile advertising and limited online presence.
77
7.87 We also reviewed a KPMG report that was commissioned by the Association of British Bookmakers (ABB). 81 []
7.88 In addition to the evidence set out above, we also considered that the econometric evidence on the impact of entry and exit on the Parties’ volumes as well as the survey evidence indicate that the constraint imposed by independent LBO operators is lower than the constraint exerted by large, national LBO operators. Third party evidence also supported the view that independent LBO operators are generally associated with a lack of sufficient scale. This, in turn, may impact on their ability to compete as effectively as large, national LBO operators, for instance in terms of their ability to invest in products and technology as well as the level of concessions or betting limits they are able to offer.
7.89 In summary, in light of the evidence set out above, we provisionally decided to reflect the lower constraint exerted by independent LBO operators by discounting the weight associated with independent LBO operators for the purposes of our calculations of the WSS. As such, we attributed a base weight of 0.9, rather than 1.0, to independent LBO operators.
Taking into account the constraint imposed by the online channel
7.90 As set out in more detail above,82 the evidence available to us indicated that the online channel is not a sufficiently strong constraint for it to form part of the same relevant product market as the supply of gambling products in LBOs.
7.91 However, we noted that the emergence and growth of the online channel has had at least a medium to long term strategic impact on the Parties’ LBO offering. In particular, the evidence indicates that the increasing number of retail customers who either already are or could be gambling online in the future plays an important role in the Parties’ strategic considerations as to how they position and develop their products and services in their LBOs. We noted that the increasing likelihood of customers also gambling online and the degree of customer migration appears to have also had at least a small impact on the Parties’ pricing strategies for the retail channel. There are also
81 The KPMG report analysed the potential impact of possible future changes to tax, regulation and underlying demand and costs on the profitability of LBOs. [] The report is based upon an industry sample containing detailed financial data for the calendar year of 2014 for 6,347 LBOs which was provided by ABB’s members. Of these 6,347 LBOs, 110 are independent LBO operators which equates to 12.5% of the total number of independent LBOs. operated at the end of 2014. 82 See section 6 on market definition.
78
some indications that the price differential between online and retail has tightened slightly in respect of some products over the past three years.
7.92 The extent to which the online channel constrains the retail channel has been taken into account in our competitive assessment. As explained below, this is illustrated by the evidence we took into account in designing the WSS approach and how we performed our analysis.
7.93 Several pieces of evidence that formed the basis of our competitive assessment are based on the relationship between local concentration and LBO performance (for instance in terms of the impact of local competition on volumes of stakes received, frequency of refurbishments, and concession offerings). The results yielded by this type of evidence and analysis inherently incorporate the effect of the online constraint. This is because the extent to which LBO operators respond to constraints from online operators will already be reflected in a weaker relationship between local LBO concentration and LBO performance. This means that we do not need to make additional assumptions about the level of the constraint. For example, given that any constraint from the online channel would, by its nature, manifest itself uniformly across the entire retail estate, where the Parties offer more concessions across their estate to dissuade their customers from diverting online, then local concentration would have a less material effect on their concession offering.83
7.94 The survey evidence explicitly quantifies the strength of the online constraint in the form of the diversion ratio to online providers. The higher the diversion to online providers, the lower the diversion to local LBOs. Despite the CMA survey pointing to a rate of ‘online diversion’ of only 6%, we considered it to be reasonable, appropriate and more reflective of the various pieces of evidence available to us in the round to apply a higher diversion ratio of 10% for the purposes of our competitive assessment.84 The ‘uplift’ we applied to
83 The Parties submitted that these relationships were based on historical data, and therefore may not capture the extent to which the competitive interaction between the two channel has evolved more recently. However, we note that our analysis of concessions is based on data that is less than one year old. We replicated this analysis for earlier periods, going back to 2011, and note that a comparison with these earlier periods does not show a clear trend that we would interpret as an increasing competitive constraint. Moreover, the refurbishment decisions analysis relies on very recent data for Coral (covering the period from 2013 to 2015) and slightly less recent data for Ladbrokes (covering the period 2011-2012). While response rates are lower for Coral than for Ladbrokes, this could be explained by virtue of differences in company policies rather than changes in the online constraint over time. We also exmained whether the effect of entry/exit on volumes (which drives refurbishment decisions) varied over time, but found no evidence that it did. We inferred from these different tests we conducted that our evidence is not ‘out of date’, and that it is reflective the current level of the online constraint on the competitive decisions of retail operators. 84 The rationale for applying this ‘uplift’ to the observed diversion ratio is set out in more detail in the section on market definition at paragraph 6.64 and in Appendix C. As a result of the increased diversion ratio to the online channel, we adjusted downwards the diversion ratio to all the LBOs on a pro-rata basis.

79
the diversion ratio to the online channel resulted in a reduction of diversion ratios to local LBO operators pro-rata to the diversion measured by the survey.
Dynamic assessment – taking into account planned openings and closures of LBOs
7.95 We also took into account the Parties’ respective pipeline LBOs85 insofar as one Party’s planned LBO would overlap in local areas with either an existing LBO or a pipeline LBO of the other party. Similarly, where we obtained compelling evidence of the Parties’ LBOs being closed imminently, these LBOs have not been taken into account in our forward-looking assessment.86
7.96 We also gathered evidence of third party LBO operators’ planned openings and closures of LBOs and have taken this evidence into account in the same way as the Parties’ evidence in that regard.
7.97 We also considered William Hill’s submission87 to the effect that LBOs that are loss-making or ‘at risk’ based on the KPMG report cited above88 should be excluded from the CMA’s analysis. However, where we did not have compelling evidence of specific LBOs’ likely exit from the market in the short to medium term, we were unable to assume that such LBOs would not exert a competitive constraint in the future. Even if the financial situation of some LBOs identified in the KPMG study was not sustainable, we cannot rule out that some of those LBOs might be acquired by another LBO operator. As set out at paragraph 3.20 above, the total number of LBOs has remained stable in the last years. This indicates that financial difficulties LBOs may face do not necessarily result in closure of these LBOs.
Establishing an association between the WSS and other pieces of evidence
7.98 In order to confirm that the WSS approach was suited to our purposes, and prior to establishing a WSS intervention threshold for our competitive
85 We considered such LBOs to qualify as ‘pipeline LBOs’ for the purposes of our assessment if: (a) there was evidence of a plan to open the LBOs within the next 12 months; and (b) all necessary consents to operate the LBOs had been obtained. In total there are [] pipeline LBOs and [] Ladbrokes LBOs that meet these requirements. We also examined further below, as part of our assessment of the loss of potential competition at a national level, whether the Parties would – absent the Transaction – expand significantly into local areas in which they are not currently present over and above their current respective pipeline of entry into specific areas. See section 9, in particular the assessment of the loss of potential competition theory of harm. 86 The Parties had to adduce evidence to the effect that an LBO closure would likely occur within 12 months based on specific indications that closure decisions were definitive and irreversible, for instance based on evidence of a lease having been terminated or notice of termination having been served. 87 William Hill initial submission, paragraphs 48-49. 88 See paragraph 7.87.
80
assessment, we considered how the WSS correlated with the evidence we gathered on the competitive interaction between LBOs. A material correlation between the WSS methodology and our evidence on entry and exit analysis, the Parties’ refurbishment decisions, the concessions evidence and the survey evidence would support the robustness of our approach.
Entry/exit data
7.99 Based on the data from the entry/exit analysis outlined above, we generated boxplots charts to illustrate the results.89 These show the distribution of WSS for different levels of volume change. The line in the middle of each ‘box’ shows the median value of WSS that caused the corresponding volume change, and the box and ‘whiskers’ show the rest of the distribution.90 For example: the top left chart indicates that an average volume change of []% is caused by entrants with a median WSS of approximately 30%; an average volume change of []% is caused by entrants with a median WSS of approximately 15%; and an average volume change of []% is caused by entrants with a WSS of approximately 5%. This indicates a positive association between the WSS of the entrant and the effect on volumes at the centroid LBO.
7.100 The boxplots charts below show that there is a positive association between the WSS of an LBO entering/exiting the market and its effect on volumes at the centroid LBO. More specifically, entrants located in the 0-200m distance band (green boxplot), are associated with, on average, higher WSS scores and result in a greater reduction in betting or gaming stakes than entrants that are further away from the centroid LBO.
89 The vertical axis of the boxplots displays the predicted average change in betting or gaming stakes resulting from entry, ie the estimated value of the coefficient within each distance band. The horizontal axis depicts the WSS as calculated for the entrant. We calculated the WSS for each entrant and plotted all entrants on the chart in accordance with the corresponding distance bands that were used in the entry/exit analysis. 90 A boxplot is a way of graphically depicting the distribution of data through their quartiles. The quartiles of a ranked set of data values are the three points that divide the data set into four equal groups, each group comprising a quarter of the data. The middle box of the boxplot represents the middle 50% of values. The median marks the mid-point of the data and is shown by the line that divides the box into two parts. Half the values are greater than or equal to this value and half are less. The upper and lower lines (‘whiskers’) represent the values outside the middle 50%, each of which represents around 25%. The whiskers, as defined in our charts, exclude outliers and may represent therefore slightly less than 25%.
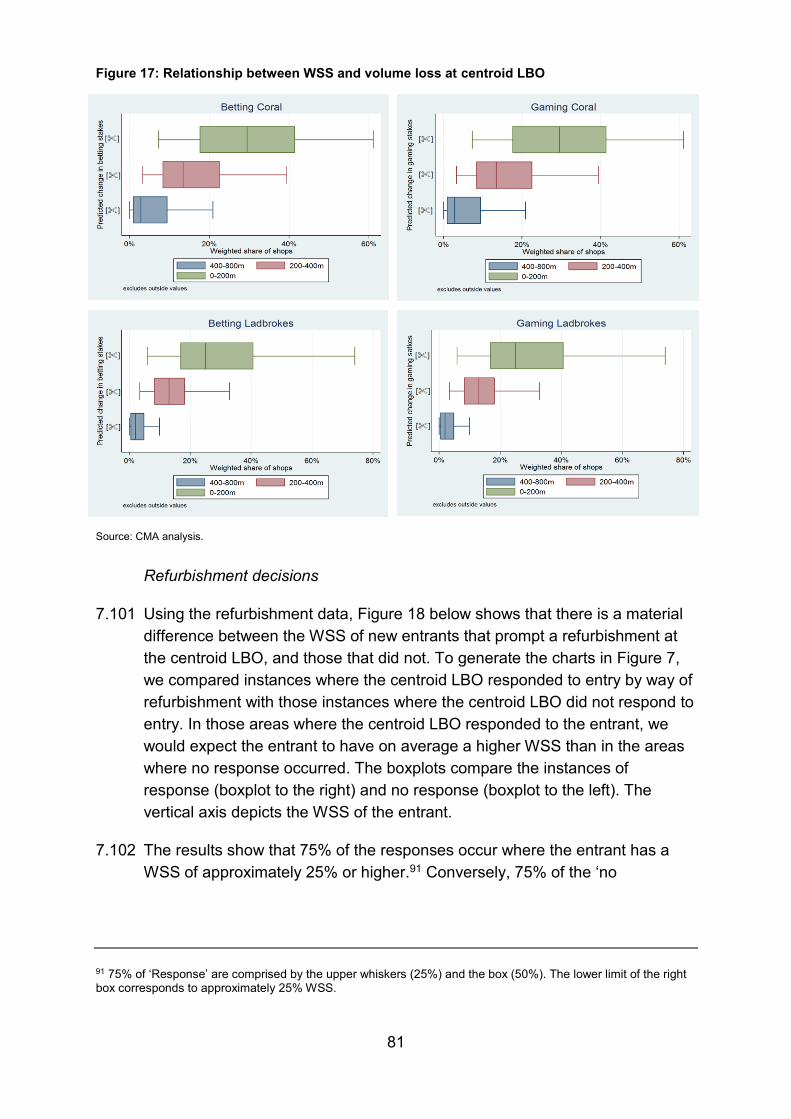
81
Figure 17: Relationship between WSS and volume loss at centroid LBO
Source: CMA analysis.
Refurbishment decisions
7.101 Using the refurbishment data, Figure 18 below shows that there is a material difference between the WSS of new entrants that prompt a refurbishment at the centroid LBO, and those that did not. To generate the charts in Figure 7, we compared instances where the centroid LBO responded to entry by way of refurbishment with those instances where the centroid LBO did not respond to entry. In those areas where the centroid LBO responded to the entrant, we would expect the entrant to have on average a higher WSS than in the areas where no response occurred. The boxplots compare the instances of response (boxplot to the right) and no response (boxplot to the left). The vertical axis depicts the WSS of the entrant.
7.102 The results show that 75% of the responses occur where the entrant has a WSS of approximately 25% or higher.91 Conversely, 75% of the ‘no
91 75% of ‘Response’ are comprised by the upper whiskers (25%) and the box (50%). The lower limit of the right box corresponds to approximately 25% WSS.

82
responses’ occur in areas where the entrant has a WSS of approx. 22% or lower.92
Figure 18: Relationship between the WSS and refurbishment decisions
Source: CMA analysis. Note: Outside values not included.
Survey evidence
7.103 Using the survey data, Figure 19 below shows that there is a positive association between the WSS of Ladbrokes and Coral LBOs and the diversion between the Parties. Each point on the chart shows the diversion ratio representing diversion from the centroid LBO to the focal competitor LBOs, following the adjustments we made to increase the diversion ratio to the online channel from 6% to 10%. As such, there are 30 points in total. The dotted line represents the estimated relationship between WSS and the diversion ratio.93 The R2 is a statistical measure of how close the data are to the fitted regression line and indicates the proportion of variance in the dependent variable (diversion ratios) that is predictable from the independent variable (WSS).94
92 75% of the ‘no responses’ are comprised by the lower ‘whiskers’ (25%) and the box (50%). The upper limit of the left box corresponds to approximately 22% WSS. 93 Technically, this means that we regressed the diversion ratios on the WSS of the other merger party. 94 This means that for this particular data set 37% of the variation of the diversion ratios can be explained by the level of the WSS.
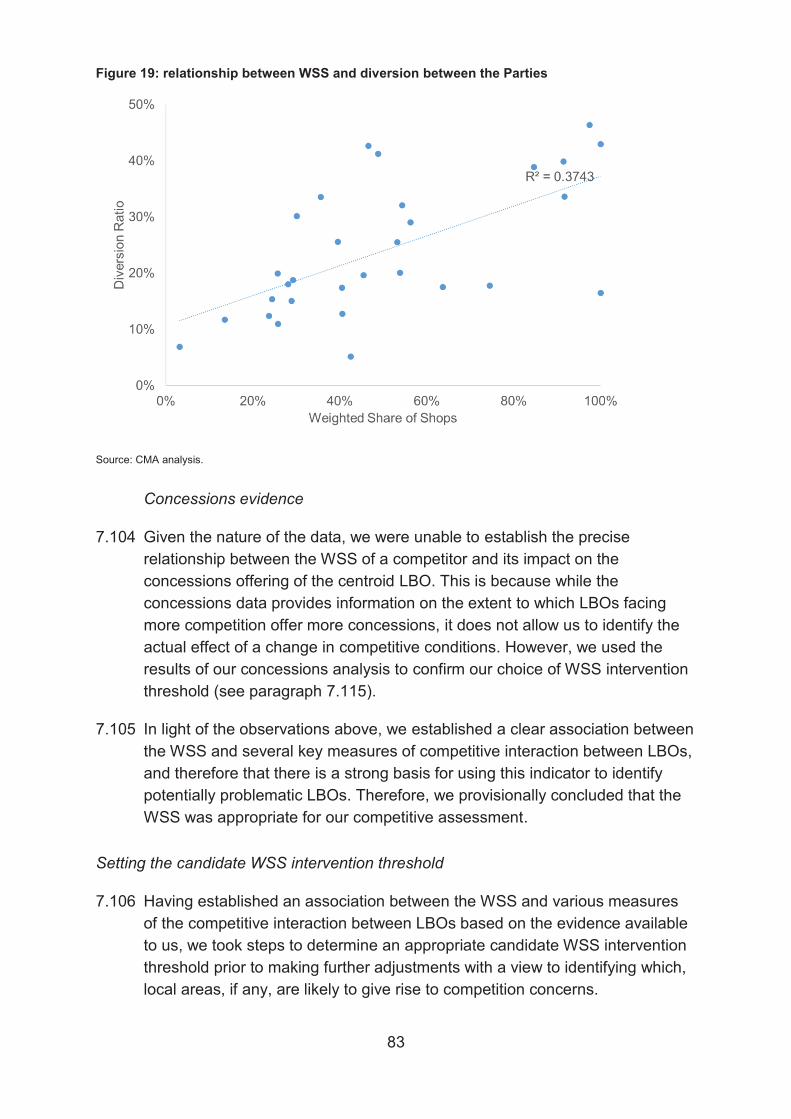
84
7.107 We proceeded in two steps:
(a) First, we identified a plausible range of WSS intervention thresholds based on the relationship between the WSS and diversion ratios predicted from the CMA survey results.
(b) Second, we checked whether the LBOs that failed the different thresholds in this range belonged to categories of areas where the other pieces of evidence indicated a relationship between local concentration and competitive outcomes.
Consideration of a range of WSS thresholds
7.108 We started by establishing a more precise relationship between the WSS we calculated for each local area and the predicted diversion ratios. We did this by regressing the diversion ratios estimated in the CMA survey on the WSS of all of the different LBOs receiving diversion.
7.109 In practice, this means that we plotted the adjusted diversion ratios to individual LBOs from the CMA survey against the WSS of these LBOs and estimated a linear relationship between WSS and diversion ratios.95 This is
95 We note that we applied a weight of 2 for own-brand shops when we calculated the WSS for the purpose of estimating the relationship between WSS because we found some evidence of the Parties’ customers displaying a degree of brand-loyalty. If there is a degree of brand loyalty, the customers of the centroid LBO will be more likely to divert to own-brand LBOs, which will reduce diversion to the other party’s LBOs. However, we decided not to adjust the weight of own-brand LBOs when applying the WSS formula to all LBOs of the estate. This is because, post-Transaction, there is a second effect working in the opposite direction: if own-brand LBOs have a degree of diversion to the other party, then they will also have an incentive to raise price post-merger. If this is the case, then the customers of the centroid LBO will be less likely to divert to own-brand LBOs since price and/or quality will have deteriorated at these LBOs.
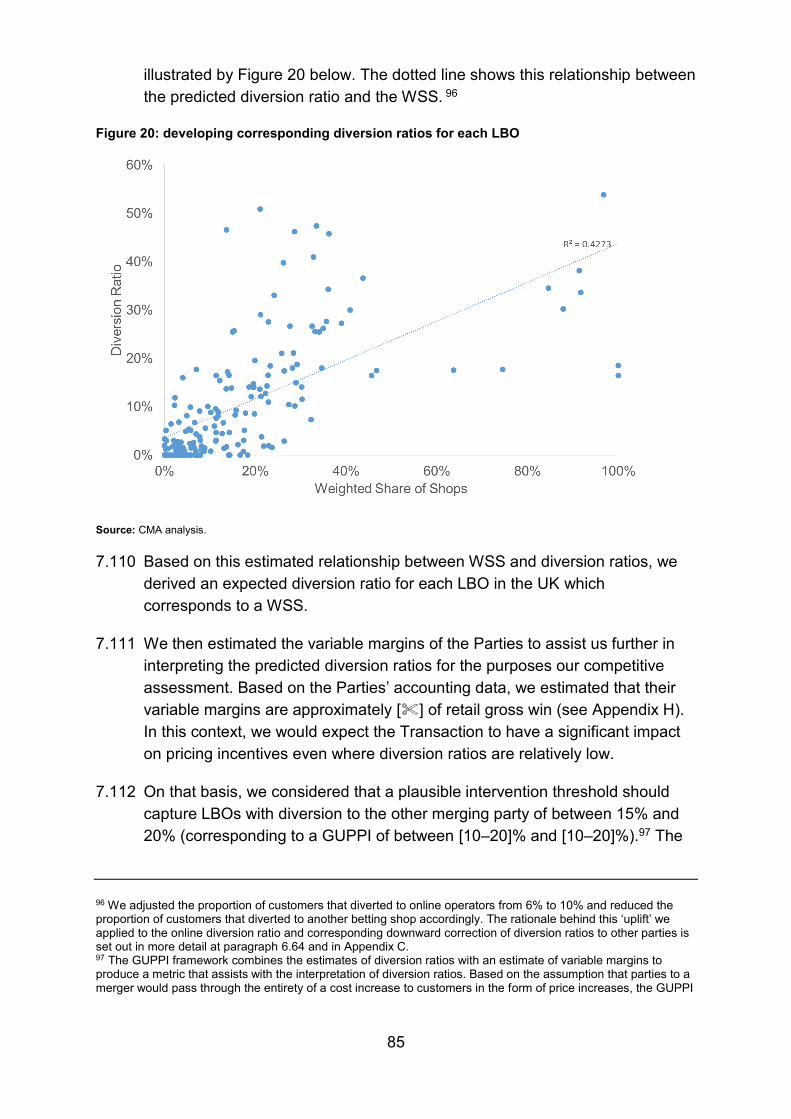
85
illustrated by Figure 20 below. The dotted line shows this relationship between the predicted diversion ratio and the WSS. 96
Figure 20: developing corresponding diversion ratios for each LBO
Source: CMA analysis.
7.110 Based on this estimated relationship between WSS and diversion ratios, we derived an expected diversion ratio for each LBO in the UK which corresponds to a WSS.
7.111 We then estimated the variable margins of the Parties to assist us further in interpreting the predicted diversion ratios for the purposes our competitive assessment. Based on the Parties’ accounting data, we estimated that their variable margins are approximately [] of retail gross win (see Appendix H). In this context, we would expect the Transaction to have a significant impact on pricing incentives even where diversion ratios are relatively low.
7.112 On that basis, we considered that a plausible intervention threshold should capture LBOs with diversion to the other merging party of between 15% and 20% (corresponding to a GUPPI of between [10–20]% and [10–20]%).97 The
96 We adjusted the proportion of customers that diverted to online operators from 6% to 10% and reduced the proportion of customers that diverted to another betting shop accordingly. The rationale behind this ‘uplift’ we applied to the online diversion ratio and corresponding downward correction of diversion ratios to other parties is set out in more detail at paragraph 6.64 and in Appendix C. 97 The GUPPI framework combines the estimates of diversion ratios with an estimate of variable margins to produce a metric that assists with the interpretation of diversion ratios. Based on the assumption that parties to a merger would pass through the entirety of a cost increase to customers in the form of price increases, the GUPPI
86
corresponding WSS range is 30% to 40%, which we then focused on with a view to determining a candidate WSS intervention threshold.
Focus on WSS thresholds between 30% and 40%
7.113 The evidence on concessions, refurbishments, and volume changes resulting from entry and exit assisted us in identifying an appropriate WSS intervention threshold within this range.
7.114 More specifically, we identified LBOs that failed three hypothetical thresholds within this range – 30%, 35% and 40% – as a starting point and checked whether they belonged to the categories of areas where these other pieces of analysis identified an effect of local concentration.
7.115 In performing this exercise, we were mindful of the fact that the format we used for each individual piece of analysis on concessions, refurbishments and volume changes incorporates less information than the WSS (which, as noted above, takes account of the precise location of competing LBOs and the number and location of the focal competitor’s LBO(s)). Therefore, there may be valid reasons why the WSS threshold may ‘fail’ certain LBOs that do not belong to the categories of areas identified as potentially problematic by these pieces of analysis.98 Nevertheless, we would expect that the majority of LBOs ‘failing’ the threshold to fall within these areas. Conversely, it is possible that a given WSS threshold may not identify as potentially problematic areas that do fall into such a category, and that there may be valid reasons for this as well.99
7.116 Table 14, Table 15 and Table 16 show the proportion of LBOs that failed the WSS thresholds under the 30%, 35% and 40% thresholds for each category.
could be interpreted as a notional price increase. However, we did not have sufficient information to estimate reliably a rate of pass-through. We therefore consider that the GUPPI, rather than predicting a certain level of actual price increase, is best interpreted as an indicator of a shift in incentives to worsen the overall product offering. We note that GUPPI in the magnitude of 10% has been found to indicate competition concerns in the UK and at the EU level. See, for instance, the European Commission in its decision on M.6497 – Hutchison 3G Austria / Orange Austria (2012) considered a GUPPI between 10 and 20% ‘highly significant’. In its decisions on the Cineworld / City Screen (2013) and Zipcar / Streetcar (2010) the Competition Commission considered that a GUPPIs above 10%, together with the other evidence considered in those inquires, were indicative that a substantial loss of competition might arise from those mergers. 98 Examples may include scenarios where there are many competing LBOs within 400m but these are located far away, or if the other party has several shops in that catchment area. 99 For example, the competing LBOs are located particulary close to the centroid LBO.
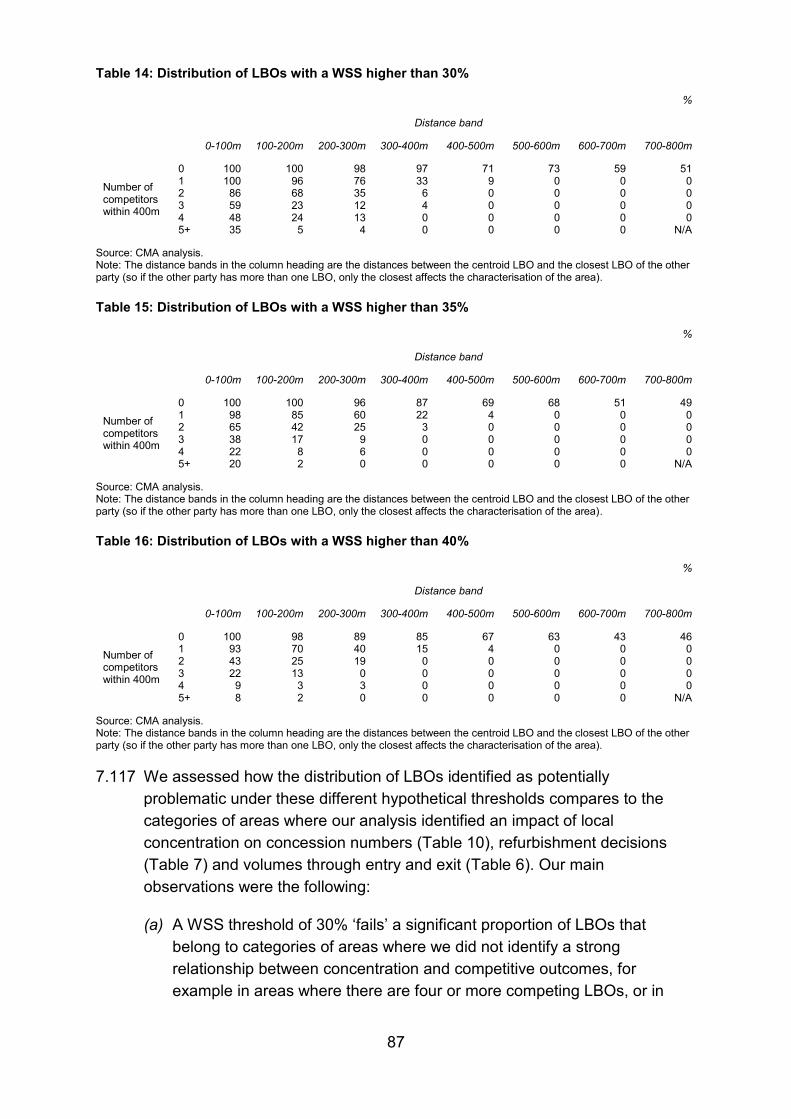
87
Table 14: Distribution of LBOs with a WSS higher than 30%
%
Distance band
0-100m 100-200m 200-300m 300-400m 400-500m 500-600m 600-700m 700-800m
Number of competitors within 400m
0 100 100 98 97 71 73 59 51 1 100 96 76 33 9 0 0 0 2 86 68 35 6 0 0 0 0 3 59 23 12 4 0 0 0 0 4 48 24 13 0 0 0 0 0 5+ 35 5 4 0 0 0 0 N/A
Source: CMA analysis. Note: The distance bands in the column heading are the distances between the centroid LBO and the closest LBO of the other party (so if the other party has more than one LBO, only the closest affects the characterisation of the area).
Table 15: Distribution of LBOs with a WSS higher than 35%
%
Distance band
0-100m 100-200m 200-300m 300-400m 400-500m 500-600m 600-700m 700-800m
Number of competitors within 400m
0 100 100 96 87 69 68 51 49 1 98 85 60 22 4 0 0 0 2 65 42 25 3 0 0 0 0 3 38 17 9 0 0 0 0 0 4 22 8 6 0 0 0 0 0 5+ 20 2 0 0 0 0 0 N/A
Source: CMA analysis. Note: The distance bands in the column heading are the distances between the centroid LBO and the closest LBO of the other party (so if the other party has more than one LBO, only the closest affects the characterisation of the area).
Table 16: Distribution of LBOs with a WSS higher than 40%
%
Distance band
0-100m 100-200m 200-300m 300-400m 400-500m 500-600m 600-700m 700-800m
Number of competitors within 400m
0 100 98 89 85 67 63 43 46 1 93 70 40 15 4 0 0 0 2 43 25 19 0 0 0 0 0 3 22 13 0 0 0 0 0 0 4 9 3 3 0 0 0 0 0 5+ 8 2 0 0 0 0 0 N/A
Source: CMA analysis. Note: The distance bands in the column heading are the distances between the centroid LBO and the closest LBO of the other party (so if the other party has more than one LBO, only the closest affects the characterisation of the area).
7.117 We assessed how the distribution of LBOs identified as potentially problematic under these different hypothetical thresholds compares to the categories of areas where our analysis identified an impact of local concentration on concession numbers (Table 10), refurbishment decisions (Table 7) and volumes through entry and exit (Table 6). Our main observations were the following:
(a) A WSS threshold of 30% ‘fails’ a significant proportion of LBOs that belong to categories of areas where we did not identify a strong relationship between concentration and competitive outcomes, for example in areas where there are four or more competing LBOs, or in
88
areas where there are two competing LBOs and the closest LBO of the other merging party is more than 200m away. This indicated that a WSS of 30% would likely identify too many areas which would appear unlikely to raise concerns.
(b) A WSS threshold of 40% fails only a low proportion of LBOs in categories of areas where the remainder of the evidence shows a fairly strong relationship between local concentration and competitive outcomes, notably in areas where there is only one competing LBO, and in areas where there are two competing LBOs, but the closest LBO of the other merging party is less than 200m away. This indicates that a WSS of 40% would likely fail to identify areas which are likely to raise concerns.
(c) Our analysis indicates that the distribution of LBOs with a WSS threshold above 35% best reflects the evidence on concessions, refurbishments, and volume changes through entry and exit.100
7.118 On balance, we therefore provisionally concluded that a candidate threshold of 35% WSS is consistent with the evidence available to us and forms an appropriate basis and intervention threshold for the purposes of identifying local areas that may give rise to competition concerns.
Initial focus on competitive effects within 400m
7.119 In applying this threshold, we focused on local areas where the centroid LBO and the closest LBO of the other party are located within 400m of each other. Our approach in this regard was based on the evidence available to us which corroborated that the competitive interaction between LBOs occurs primarily within 400m, including the entry and exit analysis, the Parties’ internal documents on concessions and refurbishment as well as the survey evidence.101
100 We also note that a 35% WSS threshold corresponds to a level of diversion of 17.7%, which is likely to alter the Parties’ pricing incentives given the level of the Parties’ variable margins (which result in a corresponding GUPPI [10-20]%. 101 We also note that in areas where the other merger party (ie the focal competitor LBO) is located at a greater distance from the centroid LBO, high WSS values might not necessarily adequately reflect the actual competitive constraint on the centroid LBO. In light of the evidence on the importance of relative distance, the WSS is primarily determined by the relative distance from the centroid LBO to both the focal competitor’s LBO(s) and the LBOs of third parties. While it does take account of absolute distances as well, its primary focus on relative distances means that it can produce results that could be interpreted as overstating the competitive constraint from LBOs in settings where LBOs are located at a significant distance from the centroid LBO. We were mindful of this in interpreting the WSS results for local areas where the distance between the centroid LBO and the focal competitor LBO(s) exceeded 400m.
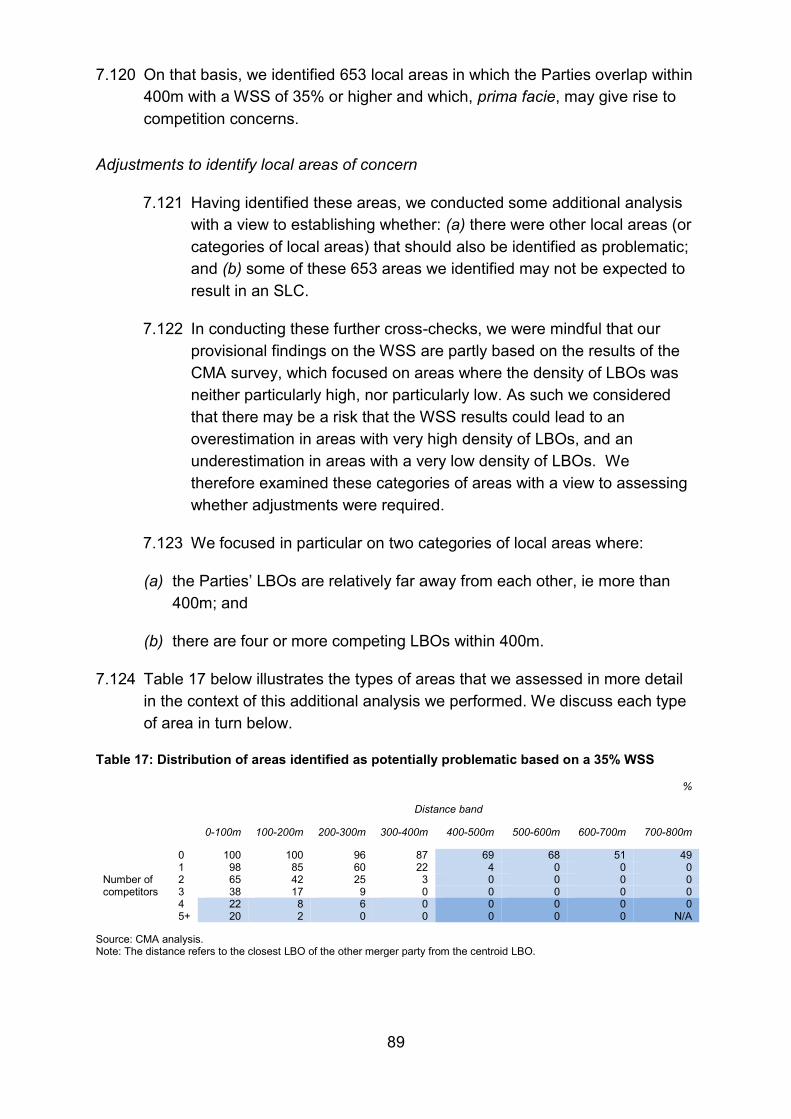
89
7.120 On that basis, we identified 653 local areas in which the Parties overlap within 400m with a WSS of 35% or higher and which, prima facie, may give rise to competition concerns.
Adjustments to identify local areas of concern
7.121 Having identified these areas, we conducted some additional analysis with a view to establishing whether: (a) there were other local areas (or categories of local areas) that should also be identified as problematic; and (b) some of these 653 areas we identified may not be expected to result in an SLC.
7.122 In conducting these further cross-checks, we were mindful that our provisional findings on the WSS are partly based on the results of the CMA survey, which focused on areas where the density of LBOs was neither particularly high, nor particularly low. As such we considered that there may be a risk that the WSS results could lead to an overestimation in areas with very high density of LBOs, and an underestimation in areas with a very low density of LBOs. We therefore examined these categories of areas with a view to assessing whether adjustments were required.
7.123 We focused in particular on two categories of local areas where:
(a) the Parties’ LBOs are relatively far away from each other, ie more than 400m; and
(b) there are four or more competing LBOs within 400m.
7.124 Table 17 below illustrates the types of areas that we assessed in more detail in the context of this additional analysis we performed. We discuss each type of area in turn below.
Table 17: Distribution of areas identified as potentially problematic based on a 35% WSS
%
Distance band
0-100m 100-200m 200-300m 300-400m 400-500m 500-600m 600-700m 700-800m
Number of competitors
0 100 100 96 87 69 68 51 49 1 98 85 60 22 4 0 0 0 2 65 42 25 3 0 0 0 0 3 38 17 9 0 0 0 0 0 4 22 8 6 0 0 0 0 0 5+ 20 2 0 0 0 0 0 N/A
Source: CMA analysis. Note: The distance refers to the closest LBO of the other merger party from the centroid LBO.
90
Competitive interaction beyond 400m distance – ‘two to one’ local areas within 1,600m
7.125 There are 130 LBO areas identified by the 35% WSS threshold in which the Parties’ LBOs are located more than 400m away from each other. This relatively high number of local areas beyond 400m is partly due the construction of the WSS formula, as we have explained above.102 Given that the evidence from refurbishment decisions, concession decisions and the entry/exit analysis indicates that the vast majority of competitive interaction takes place within 400m of the centroid LBO,103 we considered it less likely that competition concerns would arise beyond 400m.
7.126 However, we provisionally considered that areas identified by a 35% WSS threshold may be expected to result in an SLC in circumstances where the distance between the Parties’ LBOs is greater than 400m and the Transaction would result in a ‘two to one’ within 1,600m as there are no third party LBOs within that distance.104 This is based on the following reasons:
(a) We have assessed in more detail the more limited instances which show competitive interaction beyond 400m. In approximately two-thirds of the concession decisions and half of the refurbishment decisions no other competitor was mentioned, indicating that the competitive constraint of LBOs outside 400m is particularly relevant when no other competitors are present.
(b) We considered that the area is more likely to be problematic if the distance from the centroid LBO to the closest competing LBO is significantly greater than the distance from the centroid LBO to the focal competitor LBO.
7.127 We have sought to illustrate our considerations relating to areas characterised by these greater distances by two hypothetical examples Figure 21 below illustrates a situation in which an area with a WSS higher than 35% and a distance between the Parties’ LBOs beyond 400m may not be expected to raise competition concerns: the Ladbrokes LBO is located close to the edge of but within the 800m catchment area of the Coral centroid LBO and there are two competitors located just outside the 800m radius. Even though the two
102 See previous footnote. 103 See paragraph 7.13 for entry/exit analysis, paragraph 7.22 for refurbishment decisions and paragraph 7.29 for concession decisions. 104 As noted above at paragraph 6.91, the evidence available ot us indicated that LBOs interact competitively with other LBOs located up to 1,600m away although this interaction already decreased rapidly beyond 400m. In particular, our analysis showed that the entry or exit of a competitor had a statistically significant effect on the turnover of the Parties’ LBOs for distances up to 1,600m.
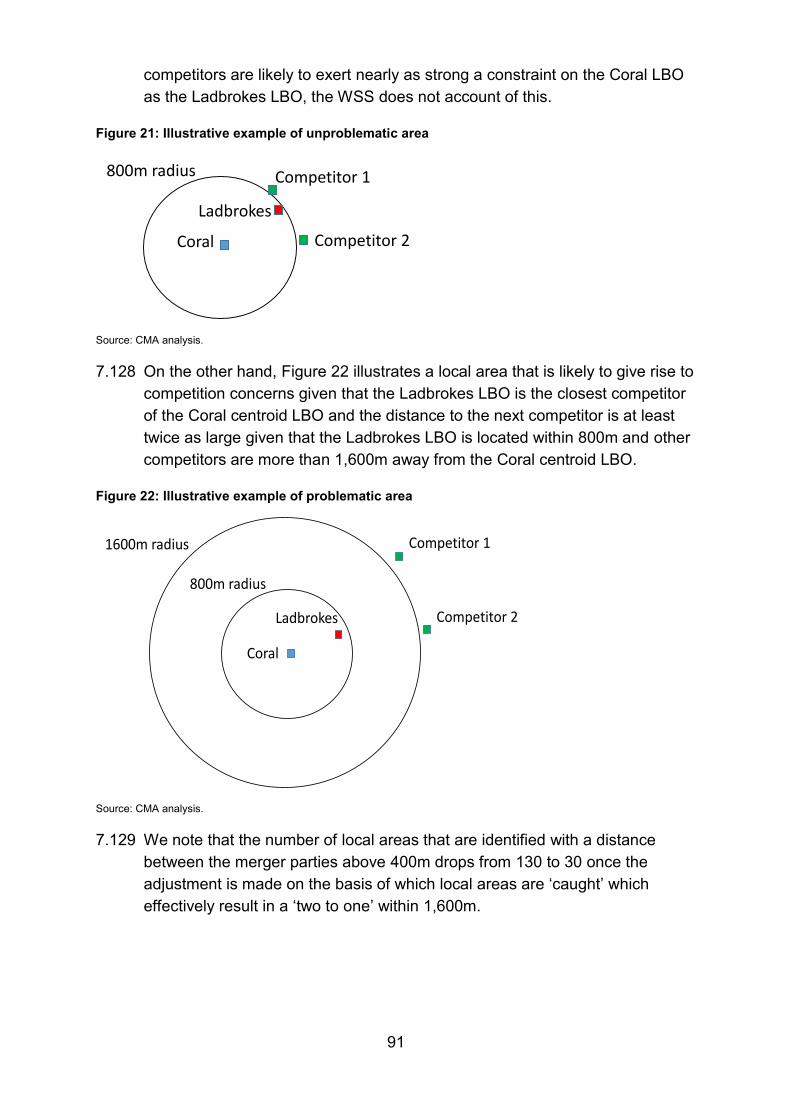
91
competitors are likely to exert nearly as strong a constraint on the Coral LBO as the Ladbrokes LBO, the WSS does not account of this.
Figure 21: Illustrative example of unproblematic area
Source: CMA analysis.
7.128 On the other hand, Figure 22 illustrates a local area that is likely to give rise to competition concerns given that the Ladbrokes LBO is the closest competitor of the Coral centroid LBO and the distance to the next competitor is at least twice as large given that the Ladbrokes LBO is located within 800m and other competitors are more than 1,600m away from the Coral centroid LBO.
Figure 22: Illustrative example of problematic area
Source: CMA analysis.
7.129 We note that the number of local areas that are identified with a distance between the merger parties above 400m drops from 130 to 30 once the adjustment is made on the basis of which local areas are ‘caught’ which effectively result in a ‘two to one’ within 1,600m.
800m radius
Competitor 2
Competitor 1
Ladbrokes
Coral
800m radius
Competitor 2
Competitor 1
Ladbrokes
Coral
1600m radius

92
Areas with four or more competing LBOs
7.130 In terms of local areas that are characterised by a very high LBO density, the 35% WSS threshold identified 24 areas where there are four or more competing LBOs. These are high demand areas, typically in city centres. We have reviewed these areas in more detail and observed that they have both a large number of competing LBOs as well as a large number of LBOs of the other merger party (which explains the relative high WSS figure attributed to them).
7.131 However, the evidence on refurbishment decisions (Table 7) and concession decisions (Table 10) does not show material competitive interaction in settings where there are four or more competing LBOs are present. We therefore considered it likely that areas with four or more competing LBOs are more competitive than the value of the WSS appears to indicate, in particular given that customers have the possibility to choose from a significant number of competing LBOs within 400m.
7.132 Therefore, although we considered the WSS to be a very good indicator of competitive harm in areas with average density of LBOs, we were mindful that adjustments were appropriate in high density areas. In particular, in light of the evidence available to us in the round, we considered that the presence of four competing LBOs will provide a sufficient competitive constraint on the centroid LBO such that areas with these features are unlikely to give rise to competition concerns.
Conclusions on adjustments
7.133 Applying the adjustments mentioned above, we provisionally found SLCs in 629 areas (within 400m) with up to three competitors and 30 SLCs in areas above 400m where the Transaction results in a two to one within 1,600m.
7.134 Further sensitivity analysisIn order to further test the robustness of the provisional conclusions on the local areas we identified and the adjustments we applied, we performed a series of sensitivity analysis.
7.135 In particular, we examined whether the outcome of our analysis, based on a 35% WSS threshold, would differ depending on the weight assigned to the geographically closest LBO (using a weight of 1.3 instead of 1.2), the functional form we apply to the weights (cubic, instead of quadratic), the distance beyond which we did not assign any weight to LBOs (600m instead of 800m) and the weight assigned to independent LBO operators (0.8 instead of 0.9). Each of these sensitivities showed a relatively small effect (see Appendix I).
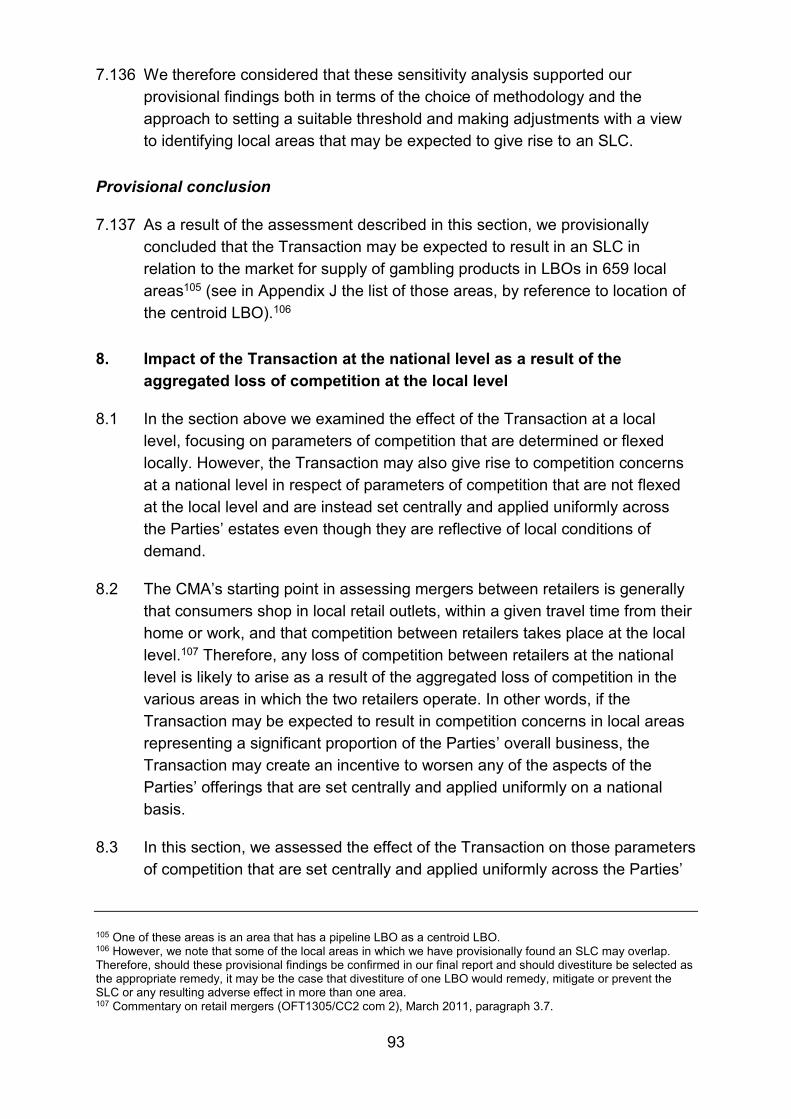
93
7.136 We therefore considered that these sensitivity analysis supported our provisional findings both in terms of the choice of methodology and the approach to setting a suitable threshold and making adjustments with a view to identifying local areas that may be expected to give rise to an SLC.
Provisional conclusion
7.137 As a result of the assessment described in this section, we provisionally concluded that the Transaction may be expected to result in an SLC in relation to the market for supply of gambling products in LBOs in 659 local areas105 (see in Appendix J the list of those areas, by reference to location of the centroid LBO).106
8. Impact of the Transaction at the national level as a result of the aggregated loss of competition at the local level
8.1 In the section above we examined the effect of the Transaction at a local level, focusing on parameters of competition that are determined or flexed locally. However, the Transaction may also give rise to competition concerns at a national level in respect of parameters of competition that are not flexed at the local level and are instead set centrally and applied uniformly across the Parties’ estates even though they are reflective of local conditions of demand.
8.2 The CMA’s starting point in assessing mergers between retailers is generally that consumers shop in local retail outlets, within a given travel time from their home or work, and that competition between retailers takes place at the local level.107 Therefore, any loss of competition between retailers at the national level is likely to arise as a result of the aggregated loss of competition in the various areas in which the two retailers operate. In other words, if the Transaction may be expected to result in competition concerns in local areas representing a significant proportion of the Parties’ overall business, the Transaction may create an incentive to worsen any of the aspects of the Parties’ offerings that are set centrally and applied uniformly on a national basis.
8.3 In this section, we assessed the effect of the Transaction on those parameters of competition that are set centrally and applied uniformly across the Parties’
105 One of these areas is an area that has a pipeline LBO as a centroid LBO. 106 However, we note that some of the local areas in which we have provisionally found an SLC may overlap. Therefore, should these provisional findings be confirmed in our final report and should divestiture be selected as the appropriate remedy, it may be the case that divestiture of one LBO would remedy, mitigate or prevent the SLC or any resulting adverse effect in more than one area. 107 Commentary on retail mergers (OFT1305/CC2 com 2), March 2011, paragraph 3.7.

94
estates, but reflect the aggregate effect of the competitive constraints that the Parties face in each of the local areas where they operate.
8.4 More specifically, as part of our assessment, we considered:
(a) which parameters of the Parties’ offerings are set centrally and applied uniformly across the Parties’ estates;
(b) which of these parameters are derived from the aggregated effect of the local competitive dynamics; and
(c) whether the Transaction will provide the Merged Entity with an incentive to worsen its offering in respect of these parameters of competition.
Centrally-set parameters of competition
8.5 The Parties’ submissions and supporting evidence indicate that the parameters of competition listed below are set centrally by the Parties and tend to be applied uniformly across their respective estates.
Odds in sports betting and promotions
8.6 The Parties (as well as other bookmakers) employ teams of traders to determine the odds they should offer for sporting and other events. In setting odds, a bookmaker will seek to recover its costs, maximise its margin and minimise its risk exposure. The Parties explained that the first step they take in setting these odds is to estimate the probability of an event occurring by reference to different sources of relevant information. The trading teams then determine the margin they aim to apply on the different selections in order to establish the initial odds. Some bookmakers also have a target margin for each event, sometimes expressed as an ‘overround’. Once the initial odds have been released to the market, a bookmaker may adjust those odds up to the moment of the event (or during the event for in-play betting).
8.7 The Parties have submitted evidence showing that the odds set by the Parties centrally are dependent on the aggregate performance of the Parties’ LBOs at a local level because one of the aims of the Parties’ when determining their odds is to drive volume into their LBOs. For instance, [].
8.8 The Parties’ internal documents indicate that both Ladbrokes and Coral evaluate the cumulative constraints posed by each of their retail competitors at a local level across their estates when setting the odds of their betting products centrally:
(a) []
95
(b) []
8.9 The Parties offer uniform, estate-wide promotions to varying degrees. By way of example, promotions commonly offered by the Parties are ‘best price guarantees’108 or enhanced odds on ‘Lucky 15’ bets109 in horse racing, but reflect the competitive constraints that the Parties face at local level.
8.10 The Parties submitted that their promotions reflect the local competitive constraints across the estate portfolio. For example, Ladbrokes’ ‘Happy Hour’ for horse racing (ie ‘Best Odds Guaranteed’ for horse races during certain times of the day) [] its estate.
Betting limits
8.11 Competition on betting limits encompasses both the upper limit of the stake that an individual customer is allowed to place by the operator (ie no bets are accepted above a certain stake limit) and ‘permission to lay’ (PTL) whereby individual bets above a certain limit may be accepted but require explicit permission from the operator.
8.12 Coral sets a maximum staking threshold centrally and permission is required to accept bets above this limit. Coral applies that threshold across its estate of LBOs, although the decision whether to request permission from central management to accept a higher bet is made by the local manager in light of local conditions.
8.13 Ladbrokes sets maximum staking limits centrally and applies them across its estate. Ladbrokes’ shop managers do not have autonomy to depart from betting limits for a particular customer.
8.14 For both Parties, decisions on betting limits and on PTL depend to a large extent on the effect of those decisions on revenues at a local level.
The RTP in gaming (for those games that have adjustable RTPs)
8.15 As explained above, for the most popular games such as roulette, the RTP is set by the rules of the game (see paragraph 3.10). For other types of games
108 This promotion consists of the following: if a customer places a bet at fixed odds in a LBO at an ‘early price’, and is offered a best-price guarantee as a concession or promotion on that bet, then the customer will benefit if the starting price drifts out to better odds than were offered by the early price. Conversely, if the starting price changes and becomes less favourable to the customer, the customer will receive the fixed odds at the time the bet was placed. 109 A Lucky 15 bet consists of 15 bets involving four selections in different events. If only one selection wins, the returns on the winning bet are paid to double the odds. If all four selections win, a bonus of 10% is added to total returns. A Lucky 15s concession bet triples the odds for one winner on a Lucky 15 bet rather than merely doubling the odds.

96
such as slots, RTPs are, in the vast majority of instances, operated at a standard level which is set by the content developer. In the case of Ladbrokes’ slots content, the standard RTP levels for each stake band are set by it and applied to games by content developers. In the small number of instances where RTPs are adjusted, the decision to make the adjustment and the level at which the RTP ratio is set will be determined centrally and applied across the entire estate. []
8.16 The Parties submitted that the decisions to adjust their RTPs were made by reference to the cumulative performance of the gaming machines across each local area in which they operate LBOs. In considering whether to adjust the RTP ratio, retail operators will consider the effect that such a change will have on their gross win margin and staking levels in local LBOs. The decision to adjust the RTP ratio is informed by the aggregate of all the volumes a bookmaker could lose across its estate as a result. The main cause of losing customers in the event of an RTP ratio change is if customers perceive that the game is no longer ‘lucky’ and does not pay out sufficiently frequently or in sufficient amount. In such a case, customers may decide not to bet at the same level with that game, choose a different game in the same LBO, or choose to use a gaming machine in another LBO. Therefore, to the limited extent that RTPs are informed by competitive conditions (ie instead of, for instance, being triggered by regulatory changes) it is the aggregated impact on local competition that dictates an LBO operator’s RTP strategy.
Product ranges (for example the range of events broadcast in LBOs and the types of games offered)
8.17 There are limitations on the ability of LBO operators to compete on the basis of product range (eg number of gaming machines allowed per LBO and the importance of roulette as main drivers of demand). However, retail operators can differentiate themselves by trying to develop games with an attractive look and feel, despite the large degree of commonality across games. The decisions on which LBOs are first implemented may to some extent be influenced by the local competition.
8.18 With regards to betting, LBO operators also can differentiate their offer in terms of the events broadcast at their LBOs in order to increase volume. Although this is a decision taken centrally and applied uniformly, the success of such a strategy will depend on the aggregate constraints exerted at local level across their estate by other main LBO operators.
97
Decisions on product development (innovation)
8.19 Decisions on product innovation are taken centrally and applied uniformly although some innovations may not be rolled out to all LBOs across the entire LBO operator’s estate at the same time.
8.20 However, given that decisions on product development and innovation do not appear to be driven primarily by an aggregation of local competitive conditions,110 we examine the extent to which the Transaction may give rise to harm at a national level in our assessment of national theories of harm below (section 9).
8.21 We will examine in paragraphs 9.51 to 9.63 whether the Transaction may be expected to result in an SLC as a result of a loss of competition relating to innovation.
Strategic decisions on the opening, closure or relocation of LBOs.
8.22 To the extent that the opening, closure and relocation of LBOs is motivated and/or flexed by local considerations, our assessment of the competitive impact of the Transaction is contained in our examination of local effects set out above in section 7.
8.23 We also considered whether there was an element of strategic decision-making in relation to opening, closure and relocation of LBOs that occurs centrally at national level. However, we considered that strategic decision-making in this regard was likely to be influenced by competitive interaction at a national level (between large, national LBO operators) and, as such, could not be properly characterised as being motivated purely by an aggregation of local constraints. As such, we considered separately as a national theory of harm whether the Transaction may be expected to lead to a loss of potential competition in areas where the Parties may open new LBOs and compete against each other. Our assessment in this regard is set out below at section 9.
Third party views
8.24 Evidence from third parties largely corroborates the Parties’ submissions that the competitive parameters listed above are set centrally and applied uniformly across the estates of LBO operators. However, evidence from third
110 By way of illustration, the evidence available to us indicates that large national LBO operators monitor each other’s product developments and innovations and, to the extent that they appear promising or successful, seek to emulate such developments. For example, [].

98
parties also indicates that the list of parameters of competition that are applied uniformly and not flexed locally varies to a small extent. For instance, William Hill submitted that []. Conversely, Jennings submitted that the odds it offered for some of its betting products (eg Irish Lottery, 49s, football betting) would vary depending on the level of competition in each local area.
8.25 Overall, the evidence indicates that there are several parameters of competition on which the Parties and other LBO operators currently take decisions centrally and where such decisions are applied uniformly across their estates. However, decisions on these parameters appear to reflect the aggregation of competitive dynamics that LBO operators encounter in the local areas in which they are active.
8.26 We assess below whether the Transaction may be expected to provide the Merged Entity with any incentive to worsen these aspects of their offerings.
Impact of the Transaction on incentives relating to centrally-set parameters
8.27 To the extent that the Transaction may be expected to result in competition concerns in local areas representing a significant proportion of the Parties’ LBO estates, the Transaction may create an incentive to worsen aspects of the Parties’ offerings that are set centrally and applied uniformly and which are determined on the basis of aggregated local competitive constraints.
Parties’ submissions
8.28 The Parties submitted that the extent of any recapture of customers in the event of a uniform degradation of competitive parameters after the Transaction was likely to be negligible. In support of this view, the Parties cited the relatively small overlap in the Parties’ estates (30% and 40% of the Parties’ estates overlap within 400m and 800m, respectively), the presence of third party LBOs in the majority of local areas where the Parties overlap and the constraint from the online channel.
8.29 The Parties also submitted that the only possible scope for a deterioration of uniformly-set competitive variables (derived from the aggregate effect of local competitive dynamics) would be if the Transaction were to give rise to a material change in the ‘average’ level of local competition faced by the Parties which was not addressed by remedies. According to the Parties, as long as the competitive constraints on the Parties did not change substantially in any of the local overlap areas (as would be the case, in their view, after appropriate remedial divestments) the aggregate competitive constraint felt by the Parties would also remain unchanged. On this basis, the Parties submitted that there would be no aggregated loss of competition and no
99
incentive for the Parties to worsen any aspects of their offerings which are set at the national level.
8.30 However, at this stage of our assessment we are examining whether the Transaction may be expected to result in an SLC, and in this particular context with regard to parameters that are driven by an aggregation of local competitive conditions, but not flexed locally and are instead applied uniformly across the Parties’ estates at a national level. We do not take into account, at this stage, whether any hypothetical remedial action in respect of parameters of competition that are flexed locally may also resolve possible concerns in respect of other parameters of competition.
Third party views
8.31 William Hill submitted that significant parameters of competition between the Parties were determined nationally. William Hill noted that the Parties, after the Merger, would have a market share, by number of LBOs, of around 45% at a national level, which meant that the Transaction would lead to a significantly greater concentration at a national level than when the Monopoly and Mergers Commission reviewed the merger between Ladbrokes and Coral in 1998.
8.32 Betfred also expressed concerns that the Transaction would lead to an increase in concentration in the industry, in terms of the number of LBOs owned by each LBO operator, with two LBO operators controlling over 70% of the LBOs in Great Britain after the Transaction.
8.33 Other LBO operators, including Paddy Power Betfair, [].
8.34 One customer submitted that price competition in fixed odds betting was governed exclusively by decisions made at the national level and that the Transaction would lead to significantly reduced price competition and value in fixed odds betting for LBO customers. This customer also submitted that the removal of a major national operator would result in poorer value to customers across all LBOs irrespective of any local considerations.
Effect of the aggregation of local overlaps between the Parties’ LBOs
8.35 As stated above, the Transaction could create an incentive for the Merged Entity to worsen its offering in respect of those parameters which are set centrally if a significant share of the Parties’ customers were to regard the Parties’ respective LBOs as close substitutes.

100
8.36 As noted above, our starting point was that customers in retail markets tend to make their decisions based primarily on the choices available to them locally. As part of our assessment as to whether harm may arise at a national level, we estimated ‘aggregated diversion ratios’ reflecting the weighted average of local diversion ratios. In doing so, we sought to estimate the proportion of one merging party’s customers who would regard the other merging party’s LBOs as their best alternative, taking account of the evidence on closeness of competition between the Parties and other LBO operators at a local level as set out in section 7.
Calculation of aggregated diversion ratios
8.37 Given that customers make their decisions based primarily on the choices available to them locally, our aggregated diversion ratios are based on a ‘bottom up’ approach reflecting the weighted average of local diversion ratios.
8.38 We did not consider that a ‘top down’ market share approach, which would merely reflect the Parties’ share of LBOs at national level, would be an appropriate indicator of potential competition concerns. Retail operators are not distributed uniformly around local centres of demand. In particular, there is much more limited overlap between the Parties’ estates in local areas than national market shares might imply. As submitted by the Parties and confirmed by our analysis, of the total number of Ladbrokes’ LBOs, the percentage of Ladbrokes’ LBOs overlapping with Coral’s LBOs is 30% within 400m and 40% within 800m. Similarly, of the total number of Coral’s LBOs, the percentage of Coral’s LBOs overlapping with Ladbrokes’ LBOs is 34% within 400m and 43% within 800m. This shows that for the majority of their respective LBOs, the Parties do not overlap within those distance bands. As such, estimating a diversion ratio based on national market shares would not be a suitable measure of the closeness of competition between the Parties in respect of these parameters given that such market shares would not take account of the (lower) level of local geographic overlap between the Parties’ estates.
8.39 The ‘aggregated diversion ratio’ between the Parties that we calculated represents the proportion of all customers lost by Ladbrokes that would be ‘recaptured’, ie customers that would divert to Coral if Ladbrokes worsened its PQRS across all of its LBOs (and vice versa). We used the aggregated diversion ratio to assess the overall closeness of competition between the Parties, which provided us with an indication as to their overall incentive to change their offering on parameters of competition at a national level.
8.40 In calculating the aggregated diversion ratio, we did not ‘allow’ own-brand diversion to influence results (whereas we did allow for such own-brand

101
diversion in the context of the local assessment). The rationale for our approach in this regard was that the national theory of harm evaluates the effect of the merger on the parameters of competition that are decided centrally and applied uniformly across the estates. By way of illustration, if a customer decides to leave a Ladbrokes LBO because Ladbrokes has increased prices or otherwise worsened its offering across its whole network, then this customer is unlikely to go to another Ladbrokes LBO. In this context the logical approach we followed was therefore to ‘disallow’ own-brand diversion by calculating diversion ratios based also on responses to the survey question that asked customers (ie those who said they would go to an own-brand LBO if the surveyed LBO were closed) where they would go if all LBOs of the brand they visited on that occasion were closed.
8.41 We calculated the estimated aggregated diversion ratio between the Parties as follows:
(a) First, we estimated a linear relationship between the ‘weighted share’ of each LBO and the diversion it received in the areas we surveyed. More specifically, we calculated the ‘weighted share’ of each LBO within 800m of any surveyed LBO and we regressed the diversion ratio of each individual LBO in the surveyed areas on its weighted share. The regression result (ie the coefficient and the intercept) provided us with the ‘best fit’ between weighted share of LBOs and diversion ratio.
(b) Second, we extrapolated this estimated relationship between the weighted share of LBOs and diversion across the entire estate of each of the Parties. For each LBO, we calculated the sum of the other merger party’s weighted share of LBOs (within 800m). We then used the regression results to predict diversion from each LBO to the other merger party. Based on this approach, we have only captured diversion between the Parties’ LBOs where they overlap within 800m.111
(c) In a third step, we derived the aggregated diversion ratio from Ladbrokes to Coral and vice-versa. We calculated the average weighted by the value of stakes.
111 Accordingly we assumed that the diversion ratio between the Parties in areas where their LBOs were further away than 800m was 0%. We note that, by not taking account of diversion beyond 800m, we may have underestimated the aggregate diversion ratios between the Parties. Such an underestimate can arise in circumstances where there is no competitor to a Party’s LBO within the 800m catchment area and a significant number of customers would likely divert to LBOs that are located outside the 800m catchment area, including to LBOs of the other party. Our aggregated diversion ratios between the Parties are therefore lower-bound estimates in this regard.
102
8.42 We note that the aggregated diversion ratio between the Parties, as described above, takes account of the proportion of customers that would divert ‘out of the market’, in other words would no longer gamble in a retail LBO. This includes customers that would divert to the online channel as well as customers who would not engage in any gambling activity at all. For the purpose of calculating the aggregated diversion ratios, we applied a diversion ratio to the online channel of 10%.112
8.43 As explained above in paragraphs 7.37 and 7.38, we surveyed customers in 30 LBOs in 15 different areas. Our sample focused on areas where the density of LBOs was neither particularly high nor particularly low (see paragraph 7.37 above).
8.44 Even if the sample of areas we surveyed may not fully be representative of all the Parties’ estates, we found no reason to believe that our calculations have overestimated the aggregated diversion ratios between the Parties. This is because we took a cautious approach and allocated a 0% diversion ratio between the Parties in areas where their LBOs were further away than 800m.
8.45 To assist our interpretation of the aggregated diversion ratios between the Parties, we estimated the correspondent GUPPI. As explained in paragraph 7.112, the GUPPI is a simple method that consists of a multiplication of the diversion ratio from company A to B by company B's margins. The GUPPI measures the merged firm’s incentive to raise price unilaterally post-merger (in the absence of merger-induced efficiencies, entry, and repositioning).
8.46 The cost data submitted by the Parties indicates that their average variable margin over the past two years is approximately []% (see Appendix H). With this margin assumption, a diversion ratio of 13.1% (from Ladbrokes to Coral) and 17.6% (from Coral to Ladbrokes) translates into a GUPPI of [5-15]% and [5-15]%, respectively.
8.47 A GUPPI of this order of magnitude indicates that the Parties, as a result of the Transaction, would have a material incentive to worsen their offer with respect to those that are set centrally and applied uniformly across the Parties’ estates.113
112 For the reasons explained in paragraph 6.64. 113 See footnote 97 in which we explain that a GUPPI in the magnitude of 10% has been found to be indicate competition concerns.
103
Provisional conclusion
8.48 Overall, on the basis of our analysis of the estimated aggregated diversion ratio between the Parties, we provisionally conclude that the Transaction may be expected to result in an SLC as a result of the aggregation of the reduction of competition at the local level, because there would likely be a material incentive for the Parties to worsen centrally-set aspects of their offering that derive from the aggregated effect of the local competitive dynamics.
9. National theories of harm
9.1 A merger between retailers may also give rise to effects that are not merely a reflection of the aggregated loss of competition at a local level. In particular, harm may arise at a national level where retail mergers result in the loss of potential competition that goes beyond the merger parties’ respective current estates. Similarly, the loss of competition in relation to innovation in a given retail sector or certain nationally set pricing parameters may not be limited to an aggregation of the loss of local competitive constraints.
9.2 In this section, we examined the effect of the Transaction on the parameters of competition that are set centrally and applied uniformly and do not merely reflect an aggregation of local constraints. More specifically, we assessed whether the Transaction may be expected to result in an SLC as a result of a loss of competition for the ‘top-price’ in sports betting, a loss of potential competition, or a loss competition relating to innovation.
Competition for the top-price in sports betting
9.3 We also explored whether there were other forms of competition between the Parties at the national level which are not merely a reflection of aggregated local effects.
9.4 In the course of investigation, we became aware that some bookmakers define aspects of their pricing strategies in terms of how often they should offer the best odds for particular selections. In particular:
(a) In horse racing, some bookmakers aim to be ‘top-price’ for a defined proportion of the races covered by the Racing Post Pricewise column (which tend to be the most popular races). This aim is often referred to as ‘achieving more blacktype’;114
114 ‘Blacktype’ refers to the fact that a bold typeface is used to designate the best price for a particular race and therefore indicates that a particular bookmaker is top or joint top price on a selection in the Racing Post Pricewise.
104
(b) In football, some retail operators also seek to offer the top-price on their coupons for certain selections. In the case of Coral this strategy is formulated as an explicit commitment to its retail customers (eg Coral’s Top-price League Leaders or ‘TPLL’).
9.5 We understand that the overall objective of these strategies is to improve the customers’ perception of the betting operators’ overall value proposition. This type of pricing strategy differs from the more common approach described above, in particular as it do that benchmark against a narrow set of national LBO operators. We therefore investigated whether the Transaction may be expected to result in an SLC as a result of a reduction of competition for the ‘top-price’ position at the national level, independently from the aggregation of local effects.
9.6 More specifically, we considered: (a) the gross win/revenue derived from bets on the selections covered by this form of competition (which we use as a proxy for the commercial and competitive significance of this pricing strategy); and (b) the number and identity of retail operators competing (or ‘bidding’) for the ‘top-price’, in particular insofar as they are monitored or taken into account by the Parties when competing for the ‘top-price’.
Competition for the top-price in horse racing
Coral
9.7 With regard to horse racing, [].
9.8 [] We therefore considered whether a reduction in the number of these LBO operators from three to two would reduce the competitive constraint that Coral faces in practice.
9.9 In terms of the bookmakers with which Coral competes with for ‘top-price’ in horse racing, [].
9.10 []
9.11 With regard to the commercial significance of this top-price competition, Coral submitted that the Racing Post Pricewise races represent only [0–5]% of all UK horse races and [10–20]% of Coral’s gross win in horse racing. Moreover, []. Overall, Coral estimates that these ‘blacktype’ pricing positions therefore account for less than 1% of its total horse racing stakes.
Ladbrokes
9.12 With regard to horse racing, Ladbrokes [].

105
9.13 []
9.14 []
9.15 []
9.16 []
9.17 Ladbrokes also stated that the Pricewise scheme only covers a small proportion of races ([]%) and that its pricewise top-prices [].
9.18 Ladbrokes estimated that, in the last financial year, , those ‘blacktype’ horse racing selections equated to a staking by Ladbrokes’ customers of approximately £[] million and £[] million in terms of Ladbrokes’ gross win. This represents [small proportion] as a proportion of Ladbrokes’ total retail horse racing gross win and [small proportion] as a proportion of Ladbrokes’ total retail gross win including OTC betting and FOBTs.115
Evidence from third parties
9.19 A customer stated that prices that appear in the Pricewise tables provide absolutely no measure of the prices offered on horse racing by bookmakers, as any ‘best price’ will only be available to very small stakes for a very short time at the start of the day, and are sometimes never available.
9.20 No third party expressed concerns with the effect of the Transaction on top-price competition in horse racing.
CMA assessment
9.21 While there is evidence to show that some bookmakers compete to have their odds for some selections in horse racing ‘blacktyped’ as top-price in Racing Post’s Pricewise list, the evidence set out above indicates that in horse racing the nature of the competition through the Racing Post Pricewise scheme is not limited to LBO operators in the retail market.
9.22 Several online operators also compete for the ‘blacktype’ top-price and therefore post-Transaction, the Merged Entity would still need to compete against at least nine operators to have the top-price in the Racing Post Pricewise selection.
115 The above estimates are based on Ladbrokes earning a gross win margin on ‘blacktype’ selections that is equivalent to its overall planned gross win margin for horse racing ([]%). []
106
9.23 We, therefore, provisionally considered that the loss of rivalry between the Parties for more ‘blacktype’ top-price Racing Post Pricewise selections is unlikely to result in any material worsening of the competitive offering, in particular given that the Merged Entity will still need to compete against a large number of operators to be able to offer the ‘blacktype’ top-price after the Transaction.
9.24 In any event we note that:
(a) as submitted by the Parties, the horse races in the Pricewise column account only for around [0–5]% of all horse racing in the UK; and
(b) Pricewise top-prices are only offered by Coral and Ladbrokes for a short period of time. They account for a small proportion of the Parties’ total gross win in horse racing in the retail channel (less than 1% of Coral’s total horse racing stakes and approximately [] of Ladbrokes’ total horse racing gross win).
Competition for best-price in football coupons
Coral
9.25 With regard to football betting, Coral has a commitment to customers that it will be top or joint top-price on a minimum of half of the 22 teams that are first or second place in 11 leagues in the UK and Europe. This commitment is referred to as TPLL and applies to the weekend long list coupon. The commitment was introduced in the 2015/16 football season and, on 14 March 2016, was changed from a weekly commitment to a season-long commitment.
9.26 Coral explained that its TPLL commitment was made against William Hill, Ladbrokes and Betfred solely because those are the only competitors with a similar coupon offering that also attempt to hold their coupon prices in-store, therefore, the only competitors against which Coral has an easily identifiable reference point and against which the coupon prices can be compared at a given point in time.116
9.27 Coral also stated that its TPLL commitment had no impact on the way in which football prices are set, as Coral’s football odds are based on a combination of market information, online pricing (including from the Asian market) and Coral’s own assessment of the true underlying probability.
116 According to Coral, Paddy Power Betfair, for example, changes approximately 85% of the odds between the time when its coupon is first issued and the time of the match, rendering it impossible to compare against for this purpose.

107
9.28 With regard to the commercial significance of TPLL, Coral estimated that the selections that benefited from TPLL accounted for about £[] million of retail gross win in football (or 1% of Coral’s football gross win in retail, or 0.1% of total gross win in the retail channel).
Ladbrokes
9.29 With regard to football, Ladbrokes offers Top Price Top Team (TPTT) coupons which are usually made available on Fridays. These coupons guarantee matched or better odds than those offered by both William Hill and Coral on 20 of the most backed teams in that weekend’s key UK matches. Depending on the fixtures in a particular week, Ladbrokes may also guarantee the best odds on international matches such as European Championship qualifying matches if there are no Premier League matches being played. Customers are required to make at least five selections on the coupon (an accumulator bet) to receive the benefit of the top-prices.
9.30 Ladbrokes explained that it did not record separately the volume of betting that takes place on the 20 selections on the TPTT coupon for which the odds are equal to, or more competitive than, William Hill and Coral.117 However, Ladbrokes estimated that, in the last financial year, approximately []% of staking occurs on the 20 selections on the TPTT coupon, which is estimated to equate approximately to staking on these selections of £[] million. Ladbrokes estimates that the value of stakes on the 20 selections on the TPTT accounts for around [a small proportion]% as a proportion of Ladbrokes’ total retail football gross win, and [a small proportion]% as a proportion of Ladbrokes’ total retail gross win including OTC betting and FOBTs.
Evidence from third parties
9.31 William Hill submitted []. []
9.32 Paddy Power Betfair submitted that [].
9.33 Betfred told us that its [].
CMA assessment
9.34 There is evidence to show that the Parties compete to offer the best price for some selections on football coupons with a commitment to match or improve
117 In Scotland, the coupon guarantees to match or better the odds on 30 of the most backed teams in the relevant weekend’s matches.
108
on the prices offered by a limited number of other retail operators including each other.
9.35 However, when setting their football coupon prices retail operators take into account the prices of all other bookmakers, including online bookmakers.
9.36 Moreover, competition to offer the best odds in football is not limited to LBO operators in relation to which a guarantee is provided (namely the Parties, William Hill and Betfred). Paddy Power Betfair and other independent LBO operators also offer football coupons in their LBOs. As noted by a customer ‘Betfred, Paddy Power and all of the smaller chains of LBOs […] have been printing coupons in LBOs for several years’. This means that, although the Parties’ may currently only guarantee their best prices against a subset of competitors, there is nothing to prevent other LBO operators from offering better prices than the Parties or to otherwise (continue to) engage in top-price competition for these selections.
9.37 According to Coral, Paddy Power Betfair’s current approach, for instance, is to change the odds it offers in football coupons more frequently than the Parties and prints its football coupons later in the week than the Parties. The odds it offers on these football selections can therefore take account of more recent events (eg injuries of certain players) and they are therefore not currently covered by the Parties’ respective best price guarantees for these selections. However, Paddy Power Betfair could easily change its strategy in respect of top-price competition for certain selections in football coupons if it found a shift in strategy to attract more customers who value such price guarantees.
9.38 After the Transaction, even though there may be a reduction in the number of operators against which a price guarantee is offered in relation to football coupons, several LBO operators will continue to provide football coupons and may continue to compete or commence competing with the Merged Entity to offer better odds. We therefore provisionally considered that the Transaction will not result in a material worsening of the competitive offering in relation to football coupon prices.
9.39 Finally, the bets in the coupon top-price football selection offered by the Parties do not account for a large proportion of their total gross win and of their gross win in football: (a) around 1% of Coral’s football gross win and for 0.1% of its total gross win in the retail channel; and (b) around [small proportion]% of Ladbrokes’ football gross win and for [small proportion]% of its total gross win in the retail channel

109
Provisional conclusion
9.40 For the reasons set out above, we provisionally found that the Transaction may not be expected to result in an SLC in relation to competition for the top price in football coupons and horse racing.
Loss of potential competition
9.41 We assessed whether the Transaction may be expected to lead to a loss of potential competition in areas where the Parties may open new LBOs and compete against each other.
9.42 We considered that the following conditions would need to be met cumulatively for this to occur:118
(a) Absent the Transaction, the Parties would expand significantly into local areas in which they are not currently present thereby creating additional local overlaps (over and above their pipeline of entry into specific areas).
(b) Entry into new overlap areas absent the Transaction would have led to substantially greater competition.
(c) The expansion plans of the Parties are such that they would be substantially more likely than other competitors to enter into new overlap areas.
Past entry decisions
9.43 We examined the changes in the retail estates of the Parties and other retail operators over the last five years and we found the following:
(a) On average, the number of LBO openings, closures and relocations only represent about 3 to 5% of the total number of LBOs in a given year.
(b) Ladbrokes went through a peak of expansion and relocation activity between 2011 and 2013. During this period, Ladbrokes opened on average [] LBOs within 1,600m of a Coral each year. [] this phase of active expansion and reconfiguration [].
118 Poundland/99p, phase 1 decision, paragraph 302. As part of its phase 2 inquiry (which resulted in a clearance decision), the Poundland/99p panel concluded that the merger would not lead to a substantial loss of potential competition because it was not likely the Parties would have been substantially more likely than other competitors to enter into new overlap areas. (A report on the anticipated acquisition by Poundland Group plc of 99p Stores Limited, paragraph 6.91).
110
(c) Coral also had a peak of expansion and relocation activity []. [] this phase of expansion [].
Future expansion plans
9.44 Based on the Parties’ internal documents and other submissions we then assessed whether the patterns observed over the last five years provide a reliable indication of future expansion that would have occurred absent the Transaction.
9.45 The Parties submitted that the retail market had experienced a recent decline in new LBO openings due to increased costs and a reduction in retail demand corresponding with the growth of online betting. Both Coral and Ladbrokes have scaled back their plans for LBO openings as a result.
9.46 The Parties’ internal documents show the following:
(a) []
(b) []
9.47 The Parties’ []. These internal documents were prepared during the course of the negotiations of the Transaction and therefore must be interpreted with caution. However, for both Parties that projected slowdown is consistent with what has been observed recently. Also, our analysis of past changes in William Hill’s, Betfred’s, and Paddy Power Betfair’s retail estates showed that they have also experienced lower rates of LBO openings in 2015.
Provisional conclusion
9.48 The evidence set out above indicates that the Parties went through brief phases of active expansion and reconfiguration of their respective LBO networks. Some of this activity has resulted in new overlaps. However, both Ladbrokes and Coral have reduced this activity more recently and their internal documents indicate that they envisage lower rates of expansion and relocations in the future.
9.49 On the basis of this evidence we provisionally consider that the Parties would not expand significantly into local areas in which they are not currently present thereby creating additional local overlaps (over and above their pipeline of entry into specific areas), meaning that the first criterion (as set out in paragraph 9.42) is not met.

111
9.50 Therefore, we provisionally found that that the Transaction may not be expected to result in an SLC as a result of a reduction of potential competition at the national level.
Loss of innovation
9.51 We considered whether the Transaction may affect innovation119 in ways other than as a result of the aggregation of the reduction of competition at the local level. This may be the case if innovation is facilitated or stimulated by having a plurality of large suppliers in the market. In such circumstances a merger could reduce innovation simply by ‘taking out’ one major player and therefore reducing a degree of variety and the scope of experimentation in the market. This problem could be compounded in circumstances where only big players innovate, or where one of the merging parties tends to generate more innovations or to roll out innovations more quickly.
9.52 We therefore assessed whether this industry is characterised by innovative features and whether the competitive interaction between the Parties has been driving innovation in the industry.
The Parties’ submissions
9.53 The Parties submitted that the retail betting industry has relatively limited opportunity for innovation in terms of the basic product. To the extent that innovation is a parameter of competition, the Parties stated that recent developments in the retail space have been driven primarily by innovations in online gambling and are either aimed at replicating the online experience inside LBOs or improving the links between an operator’s retail and online offerings. As mentioned above in paragraph 6.29, the growth of the online channel has had at least a medium to long term strategic impact on the retail sector. This impact can be seen particularly in relation to the introduction of new products, which replicate the online experience in an LBO and extend the LBO customers’ experience beyond the LBO space in order to capture as much as possible of the online spend of multi-channel customers within their own online offering.
9.54 During the site visit, Ladbrokes’ partner company Chelsea Apps Factory explained that it generated its ideas from a variety of sources. This included monitoring other competitors, but also conducting customer research.
119 We use the term innovation to encompass both the generation of innovative ideas and the execution or implementation of such ideas.
112
Third party’s submissions
9.55 Paddy Power Betfair explained that [] it considered itself to be the most innovative player in the industry. []
9.56 William Hill submitted that no single operator was leading the market in terms of innovation and stated that it is currently developing an omnichannel wallet product that will enable customers to utilise and top-up their balances across different products. [] William Hill also said that important innovations such as FOBTs and SSBTs had been introduced by the manufacturers of such machines rather than the bookmakers themselves.
9.57 Jennings submitted that it had not introduced any new products recently and was not in the process of developing any new products. It also stated that it was too small to develop new products itself, and that it tended to adopt concepts that were already proven in the market. Jennings said that it was easier for large bookmakers to introduce new products as they had a larger estate of LBOs across which they could engage in trials.
Internal documents
9.58 The Parties’ internal documents indicate that they try to differentiate their offerings through innovation to increase revenues and market share.
9.59 These innovations may consist of new LBO concept, for example the so-called ‘Coral White Shop’ or the introduction of an ‘Apple-shop style service’.
9.60 []
9.61 A Coral internal document regarding the installation of new FOBTs in Coral’s LBOs shows that after this initiative had a good impact on Coral’s performance, William Hill, Paddy Power and Betfred quickly responded by agreeing to roll out a similar type of cabinet of a gaming machine in an attempt to capitalise on the same performance boost that Coral had seen.
Provisional conclusion
9.62 The representations from third parties summarised above indicate that the innovations rolled out by the LBO operators are frequently developed by third parties, including equipment manufacturers, software developers, and online providers. There are also some examples of LBO operators seeking to replicate online functionalities in their retail environment, indicating that the sources of innovation are not limited to retail competitors. No competitor thought that either Ladbrokes or Coral was particularly innovative.

113
9.63 Based on this evidence, we provisionally found that the Transaction may not be expected to result in a substantial loss of innovation (other than the loss of innovation that may arise as consequence of the loss of competition at a local level).
10. Operation of greyhound tracks
10.1 As mentioned above in paragraphs 2.2 and 2.5, the Parties each own two greyhound tracks: Coral owns a track in Romford (Essex) and another in Hove (Sussex); while Ladbrokes owns a track in Crayford (Kent), and another in Monmore Green (near Wolverhampton).
10.2 Greyhound tracks derive revenues from two groups of customers: racegoers, who pay admission fees and consume food and drinks; and the purchasers of media rights, who pay the tracks for the use of the media content associated with the races. In this section, we examine the effect of the Transaction on these two groups of customers. We also investigated whether the Merged Entity would be likely to be able to influence the decisions of media rights purchasers to the detriment of other greyhound track operators.
Impact on racegoers
10.3 As stated above at paragraph 6.103, the only plausible overlap between the Parties’ greyhound tracks would be between Coral’s track in Romford and Ladbrokes’ track in Crayford which are located roughly 20 miles apart. Given their physical proximity, we considered whether, as a result of the Transaction, if one of these tracks raised its prices or reduced its quality, a significant share of its customers would choose to go to the other party’s track (as opposed to another track or another entertainment venue).
Factors driving customer choice
10.4 We asked track operators and the GBGB to rank the different factors that they thought were driving customers’ choice between race tracks. All the operators who answered this question ranked location as the most important factor. Other significant factors included the quality of the facilities and the catering. We therefore put significant weight on the location of the Parties’ tracks relative to their competitors’ tracks in our assessment.
10.5 The Romford and Crayford tracks are located roughly 20 miles apart, on different sides of the river Thames. The two tracks are separated by the Dartford crossing, and there are no direct public transport options between them.
114
Views of the parties and third parties
10.6 The Parties submitted that Romford and Crayford do not compete against each other, in particular as they are separated by the river Thames, with the Dartford Crossing, a toll road, being the nearest bridge. We were told that customers living south of the Thames had a clear preference for visiting Crayford while customers living north of the Thames had a clear preference for visiting Romford.
10.7 Third parties expressed different views as to whether the two tracks were good alternatives:
(a) The GBGB said that, due to limited transport links between the two tracks, ‘it would be unlikely that a significant proportion of racegoers at either track would consider the other as an alternative destination’.
(b) Similarly, Sheffield Sports stadium said that ‘it is unlikely that many racegoers would frequent both tracks’.
(c) On the other hand, William Hill commented that ‘as the tracks are roughly 30 minutes from one another, William Hill would expect that the tracks have a sizeable proportion of shared customers’ and that ‘either destination would be a viable alternative for potential racegoers’.
(d) Kinsley Greyhound Stadium noted that the tracks were 19 miles apart and that this ‘would not deter grass roots greyhound enthusiasts who would migrate to the next local track given the short distance’.
(e) SIS’s Greyhound Operations Manager, who also had experience of running greyhound tracks, told us that the Parties’ tracks operated in very distinct markets mainly as a result of customer preferences and loyalty towards their ‘local’ track. As an example of these customer preferences and the lack of substitutability between different tracks – even if they operate in relatively close proximity – he noted that when the Catford track closed, very few customers diverted to the Crayford track, even though it was only seven miles away.
10.8 In terms of evidence on the location of customers, Ladbrokes provided evidence which showed that the majority of its Crayford customers came from postcode areas south of the river Thames.120 Although we were unable to
120 Ladbrokes provided address information that it collected from customers who booked certain types of packages (‘Restaurant’ and ‘Party Pack’ tickets, which together accounted for [] of Ladbrokes’ ticket sales by number). This showed that [] of these customers registered addresses in 5five postcode areas located south of the Thames (BR, DA, ME, TN, SE), [] coming from the DA postcode area where Crayford is located.
115
obtain data on Romford’s customers, we considered it reasonable to infer that the dispersion of Romford’s customers in relation to the transport links surrounding the Romford track is likely to bear a similar relationship to the dispersion of Crayford’s customers in relation to the transport links surrounding the Crayford track.121 Most notably, we considered that the Thames and surrounding transport links are likely to act as a ‘natural barrier’ for Crayford customers considering visiting Romford as they are for Romford customers considering visiting Crayford.
10.9 We also assessed whether the closure of the Walthamstow track, which is located nine miles away from the Romford track, was associated with higher footfall at Romford. Coral provided evidence on the number of admissions at the Romford track and the track’s turnover (split by sources) since 2003 which showed that there was no significant impact caused by the closure of the Walthamstow track in August 2008. This is consistent with the Parties’ submission that most customers were unlikely to travel over long distances to attend a greyhound meeting.
10.10 We also noted that [] Ladbrokes’ internal documents reporting its benchmarking exercise against other greyhound tracks.
The strength and location of other tracks
10.11 We considered whether other greyhound tracks could constrain the Parties’ pricing decisions post-Transaction. There are currently two other greyhound tracks located within 30 miles of the Parties’ tracks:
(e) The Harlow greyhound track (operated by Barclay Entertainment) is located 19 miles away from Romford; and
(f) The Wimbledon greyhound track (operated by GRA) is approximately 19 miles away from Crayford. It was announced on 25 February 2016 that the Wimbledon track will close and will be holding its last meeting on Saturday 18 June 2016.
10.12 Although the Romford track might face some competition from the Harlow track, this is likely to be very limited given the evidence we obtained about the distinct nature of local markets for greyhound tracks. For the same reasons, we considered it unlikely that Crayford would face competition from other greyhound tracks even before the closure of Wimbledon.
121 We did not find evidence of material differences in the offerings of the Romford and Crayford tracks or the chacteristics of the local areas. Moreover, it seemed unlikely that there would be material differences in the profile or preferences of each track’s customers.
116
Provisional conclusions
10.13 Our analysis indicates that the Romford and Crayford greyhound tracks do not compete closely with each other and there is unlikely to be a significant number of customers switching between them. The evidence indicates that customers would potentially be more likely to cease attending greyhound races altogether or switch to other forms of entertainment in response to an increase in price at their local track. In addition, we were mindful of the fact that the Parties would continue to face a level of constraint from other forms of entertainment as regards their pricing and quality policies.
10.14 We therefore provisionally concluded, on the basis of the evidence available, that the Transaction may not be expected to result in an SLC in relation to the greyhound tracks at the Crayford and Romford.
Impact of the Transaction on greyhound media rights
10.15 In this section we set out our analysis of the impact of the Transaction on media rights in relation to greyhound racing. In particular, we examined whether post-Transaction the Parties would have the ability to increase the price charged for media rights for their greyhound racing and whether they could increase the share of broadcast meetings held at their tracks to the detriment of other operators.
10.16 In order to inform our analysis, we have assessed:
(a) the identity of key purchasers of media rights;
(b) the Parties’ ability and incentive to increase prices of greyhound media rights; and
(c) the governance arrangements of the purchasers of media rights.
Identity of key purchasers of media rights
BAGS
10.17 BAGS is a not-for-profit company limited by guarantee whose membership is only open to UK licensed betting operators. BAGS’ main role is to establish an annual schedule of greyhound races (designed primarily to fit around the core horse racing content available in LBOs), and to contract with individual racetracks for the organization of these races. BAGS then sells the media rights for these races to SIS, which broadcasts the races in LBOs. Ladbrokes and Coral are both members of BAGS.

117
10.18 In 2015, 20 racetracks held BAGS meetings, for a total of 30,030 races. BAGS holds contracts for the sale of media rights for 17 of these racetracks. Coral currently has a direct contractual relationship with SIS for its racetracks, although some of the races at its tracks are included in the BAGS schedule.
SIS
10.19 SIS is one of the main providers of audio visual content and data to LBOs, covering horse racing and greyhound racing as well as numbers betting and virtual content. Ladbrokes has a 23% shareholding in SIS. William Hill and Betfred also have shareholdings in SIS. Coral has no shareholding in SIS.
10.20 With respect to greyhound racing, SIS has traditionally focused on broadcasting the media content purchased by BAGS. Recently, SIS has started to procure media rights for greyhound racing directly. This started in 2009 when SIS bought media rights for Coral’s tracks directly from Coral. Some of the races under this agreement fit into the BAGS schedule and SIS contracts with BAGS in relation to those races. SIS told us that it renewed its contract with Coral at the end of 2015.122 SIS also submitted that it was currently in the process of negotiating with Ladbrokes for the procurement of media rights at Crayford and Monmore Green. According to recent press reports, SIS has signed an exclusive four year agreement for the track and broadcast rights at Ladbrokes’ greyhound tracks (Crayford and Monmore Green).123
10.21 SIS submitted that in the future it intends to buy at least a portion of its media rights directly from racetracks, rather than through BAGS. SIS explained that this was partly a response to concerns raised by its customers (the major bookmakers) about their dissatisfaction with the BAGS process, in particular with not being involved in decisions regarding the allocation of BAGS fixtures.
10.22 SIS applies a FRAND124 policy both when purchasing media rights and when pricing its products to LBO operators in which it undertakes not to discriminate between operators.
Greyhound TV
10.23 Greyhound TV is a joint venture between the Racing Post, Ladbrokes, Coral, William Hill, Betfred, bet 365, and Betfair. The Parties told us that Greyhound
122 The new contract is for an initial term of [] from []. Coral has an option to terminate the contract at the end of this initial term. If Coral does not exercise this right the contract will continue for a further period of []. 123 SIS press release. 124 Fair, reasonable and non-discriminatory.

118
TV is a not-for-profit enterprise set up to provide a programme of evening greyhound meetings that can be viewed on terrestrial television through Sky and Freesat and which is made available directly to its bookmaker shareholders. The Racing Post is responsible for selecting the races which are to be broadcast on Greyhound TV. The Parties told us that []. Greyhound TV also broadcasts races from tracks which are not owned by its shareholders. The GBGB told us that Greyhound TV broadcast 5,500 races in 2015.
The Parties’ ability and incentive to increase prices of greyhound media rights
Market shares and capacity
10.24 We understand that all the greyhound media content broadcast in UK LBOs is purchased and distributed by BAGS, SIS (which broadcasts primarily the BAGS content), and Greyhound TV. GBGB told us that content broadcast by Greyhound TV represented 5,500 races in 2015, compared to 30,030 races for BAGS.
10.25 The Parties have a share of approximately [25–35]% of the races scheduled by BAGS. The greyhound races purchased by BAGs represent roughly 85% of the UK races broadcast in LBOs.
10.26 We assessed whether other greyhound track operators would have sufficient capacity to increase their offering in response to any attempted price increase by the Merged Entity. Two tracks told us that they could increase supply if requested by a purchaser of media rights. Other tracks had some reservations about their capacity to meet additional demand.
10.27 The evidence from the purchasers of media rights in this regard was mixed. BAGS provided some evidence that the greyhound industry was generally capacity constrained although there were also indications that BAGS had been able to increase the number of tracks from which it procured races over the last two years. SIS also stated that the industry was generally ‘over-supplied’ in that there were more tracks which were willing to provide races for the BAGS schedule, than there was room in that schedule.
10.28 Overall, the evidence indicated that there was some additional capacity available to media rights purchasers in the short term in that some greyhound tracks would be able to sell rights to additional races which are already taking place at their tracks but which are not currently part of a broadcast schedule. Although tracks are capacity constrained in terms of the number of overall races they can hold, it seems that these constraints could be overcome within
119
a relatively short period (around six months) if the associated media rights contracts were of sufficient value and duration.
Views of purchasers of media rights
10.29 The two organisations that purchase the Parties’ media content, BAGS and SIS, submitted that, should the Merged Entity try to raise prices for its media rights, they had other viable alternatives that they could switch to, or threaten to switch to. In particular, they mentioned the following:
(a) BAGS stated that it could tell the Parties it would source media content elsewhere in response to a hypothetical attempt by the Parties to increase the price for media rights by the Merged Entity. In such a scenario, BAGS thought there would be at least five other tracks who could deliver more racing at a suitable level of quality although BAGS questioned whether there would be sufficient greyhounds and noted that bookmakers would need to agree to purchase that content.
(b) SIS told us that the Transaction would have no immediate impact on its business because:
(i) it had contracted the rights of [] until [], and was in the process of contracting the rights of [] for the same period;
(ii) [] would not seek to impose a price increase at the end of [], in part because [] had agreed to the ‘low-margin low-cost’ model adopted by SIS;
(iii) if the cost of media rights for these tracks were to increase significantly, then other tracks would be prepared to increase the number or quality of their fixtures for a price more acceptable to the market; and
(iv) it had started to source greyhound content from other countries (notably []), and it viewed such content as a potential substitute for UK content in the medium term.
10.30 We have provisionally found that the evidence set out above indicated that both BAGS and SIS had a sufficient number of other options to purchase media content, such that they would be able to resist a potential attempt by the Merged Entity to raise price.
120
Provisional conclusion
10.31 In summary, we note in particular that:
(a) the Parties have a relatively small share of the overall market, there are several alternative ‘quality’ tracks and other tracks have the ability to improve their quality if necessary, in response to a price increase by the Parties; and
(b) there is capacity to broadcast additional races from other greyhound tracks in the short term and to develop additional capacity in the medium-term.
10.32 On that basis, and in light of the evidence set out above, we provisionally found that the Transaction may not be expected to result in an SLC in the sale of media rights for greyhound events.
Governance arrangements of the purchasers of media rights
10.33 We also assessed whether, as a result of the Transaction, the Merged Entity would be able to influence the decisions of the media rights purchasers in which they hold interests on the number, allocation and pricing of meetings to the detriment of other greyhound track operators.
BAGS
10.34 We reviewed BAGS Articles of Association and assessed evidence on BAGS’ governance and past voting practices.
10.35 We found that the Merged Entity would be unlikely to be able to determine the outcome of decisions on the number, allocation and pricing of BAGS meetings, in particular because:
(a) decisions on such matters are taken at board level pursuant to the Articles of Association and the Merged Entity will not command a majority or a blocking position at board level; and
(b) the Merged Entity would not have sufficient voting rights to force any alteration to the Articles of Association and therefore would not be able to amend the decision-making structure in its favour without the support of other members.
10.36 We also found that there is a convention that directors appointed by bookmakers which own greyhound tracks do not participate in decisions
121
where they are conflicted (ie decisions on the number, pricing and allocation of BAGS meetings).
10.37 We considered there might be a residual risk of the Merged Entity participating in discussions and decisions about contracts and fixtures at board level, should this existing convention regarding conflicts not be respected in the future (although it would still not be able to determine the outcome of such decisions by itself due to the absence of any majority or blocking position).
10.38 However, we found that even in this scenario, the other members of BAGS would be unlikely to support any attempt by the Merged Entity to increase the price it charges BAGS for the rights to its greyhound meetings (as that would result in an increase in the cost of the other members’ acquiring the broadcast of such meetings). We also consider that any hypothetical attempts by the Merged Entity to increase its own allocation of BAGS meetings could destabilise the BAGS governance structure given that preferential terms for some bookmakers owning and operating racetracks would be inconsistent with the stated objective and envisaged function of BAGS as well as the role its Members attribute to the association. Furthermore, SIS told us that some of its bookmaker customers (including []) were unhappy with the operation of BAGS precisely because they were unable to influence the allocation of fixtures by BAGS and that BAGS was not prepared to exploit the rights it had by permitting the development of new services into new markets (eg streaming).
SIS
10.39 In view of the fact that SIS intends to increase the number of tracks with which it contracts directly for greyhound track media rights, we also considered whether the Merged Entity would be able to influence the decisions of SIS regarding the procurement of greyhound media rights to the detriment of other greyhound track operators.
10.40 As Coral is not a shareholder in SIS, there will be no increase in the voting rights or board representation of the Merged Entity as a result of the Merger.
10.41 Moreover, we consider that the Merged Entity would not be able to influence SIS’ decisions on media rights contracts and pricing given the conflict provisions contained in the Articles of Association, the dual board structure and the existence of a separate media content sub-committee (in which directors representing bookmakers do not participate).
122
Greyhound TV
10.42 Greyhound TV only broadcasts a very small number of greyhound races as compared to BAGS. However, in view of the fact that both Parties own shares in Greyhound TV, we have also reviewed the corporate governance structure to assess whether the Merged Entity would be able to influence decisions on the procurement of greyhound media content to the detriment of other greyhound track operators.
10.43 We consider that the Merged Entity would not be able to influence Greyhound TV’s decisions on the procurement of media rights in view of the fact that it will not have a majority or blocking position on the board and given the conflict provisions already in place. Furthermore, given the Greyhound TV operating model and [], it appears unlikely that it would try to raise prices or reduce quality.
Provisional conclusion
10.44 On balance and on the basis of the evidence available, we provisionally considered that the Merged Entity is unlikely to be able to increase its allocation of broadcast races to the detriment of other operators. This is because the Parties are unlikely to have the ability to influence the decisions of the relevant media rights purchasers to the detriment of other greyhound track operators.
10.45 Therefore, on balance, we provisionally found that the Transaction may not be expected to result in an SLC in the national market for the sale of greyhound media rights.
11. Other theories of harm
The Parties’ relationship with Playtech
11.1 A third party identified a potential theory of harm relating to the impact of the Transaction on the supply of software by Playtech to competitors of the Merged Entity. In this section, we set out our provisional findings that the Transaction would be unlikely to provide Playtech with a sufficient incentive to engage in a foreclosure strategy to the detriment of competitors to the Merged Entity. We also provisionally found that the Merged Entity would be unlikely to be able to leverage its relationship with Playtech so as to harm its rivals.
123
Background to the relationship and impact of the Transaction
11.2 Playtech is the world’s largest publicly listed online gambling software and services supplier. It provides Coral’s online sports betting and gaming platform as well as Coral’s mobile offering. Playtech also provides gambling software to Ladbrokes as well as advisory services in order to develop Ladbrokes’ digital business. Playtech also supplies other UK bookmakers, including William Hill, Paddy Power Betfair and bet365125 with gambling software and services.
11.3 Playtech currently holds 9.71% of the shares in Ladbrokes and it will receive a further £40 million of shares at completion of the Transaction.126 Following the Transaction, existing shareholders of Ladbrokes will end up holding 54.12% of the new Ladbrokes Coral (prior to the issue of new shares to Playtech). Applying this percentage to Playtech’s current shareholding in Ladbrokes, Playtech’s stake may be expected to be diluted to [] of the combined Ladbrokes Coral. This will amount to [] shares in the new Ladbrokes Coral.
11.4 Taken together with the 9.71% of Ladbrokes already owned by Playtech (or about [] post-dilution), the receipt of additional shares on completion would give Playtech a total of about [] million shares in the Merged Entity equivalent to approximately []% of the Merged Entity.
11.5 Playtech supplies online gaming software and services to Ladbrokes and Coral based on a revenue-sharing model under which a certain proportion of its fees are calculated based on the revenue derived from the gambling products supplied to Ladbrokes’ and Coral’s end customers. Playtech is also currently providing digital marketing services to Ladbrokes, although it has been agreed that these services []. The existing terms of the marketing services agreement will be replaced by new provisions regarding []. As remuneration for these services, Ladbrokes will pay: (a) £40 million to Playtech in the form of shares upon completion of the Transaction (as explained above); and (b) £35 million in cash, payable upon completion of the []. Thereafter, [].
Potential for Playtech to favour the Merged Entity
11.6 A third party submitted that the Transaction would create an incentive for Playtech to pursue strategies that favoured the Merged Entity, as a
125 Playtech Annual Report, 2014. 126 Conditional upon completion of the Transaction, Ladbrokes and Playtech agreed to accelerate the determination of amounts due by Ladbrokes to Playtech under a marketing services agreement between them. The sum agreed was £75 million, of which £40 million shall be satisfied by way of the issue of shares in the Merged Entity.
124
consequence of the increase of its equity share and the combined revenue share arising from the Transaction.
11.7 We considered whether, as a result of the Transaction, Playtech was likely to pursue potential foreclosure strategies to the detriment of the Merged Entity’s rivals. The potential foreclosure strategies that a company in Playtech’s position might be able to adopt to the detriment of the Merged Entity’s rivals could include any one or more of the following: (a) a refusal to supply access to Playtech’s software; (b) an increase in the price charged for that software; (c) delays in the provision of its software (or updates); and (d) the provision of a worse service in any other way in either existing or future contracts, for instance by making available less experienced or qualified staff during the product development phase or by degrading the quality of aftersales services. References to foreclosure strategies in this section should therefore be understood to cover the full range of these different types of potential measures unless we refer to a specific potential foreclosure strategy. We took into account that less aggressive or more subtle (partial) foreclosure strategies would likely be less harmful.
11.8 For this theory of harm to materialise, each of the following questions would need to be answered in the affirmative:127
(a) Would Playtech have the ability totally or partially to foreclose the Merged Entity’s competitors (ie other bookmakers) by virtue of increasing prices or refusing to supply them with an important input for their business?
(b) Would Playtech have an incentive to do so, in the sense that this would be a profit-maximising strategy?
Would the effect of such a foreclosure strategy be sufficient to reduce competition in the affected market, in which Playtech itself is not active, to an extent that it may be expected to result in an SLC?
Playtech’s ability and incentive to harm the Merged Entity’s rivals
11.9 It would appear that, irrespective of whether Playtech may have the ability totally or partially to foreclose other bookmakers, the Transaction is unlikely to provide Playtech with the incentive to engage in such a strategy.
11.10 Following the Transaction, Playtech’s shares in Ladbrokes will increase, although, as stated above, its percentage shareholding in the Merged Entity is actually expected to decrease. In addition, a greater proportion of Playtech’s
127 Merger Assessment Guidelines, paragraph 5.6.7.
125
overall revenue will be derived from the Merged Entity through the revenue-sharing agreements. However, for the reasons set out below, we provisionally consider that these changes are not likely to alter Playtech’s incentives such that it would engage in a total or partial foreclosure strategy.
11.11 As part of our assessment, we compared the:
(a) dividend revenue Playtech would achieve from an increased shareholding in Ladbrokes and the overall revenue that Playtech would achieve through its revenue-sharing agreements with the Merged Entity; with
(b) revenue Playtech would achieve from UK-based customers other than the Parties.
11.12 Based on Playtech’s 2015 revenues, although the Merged Entity would be the largest UK customer of Playtech, other UK customers would continue to constitute [] of Playtech’s total UK revenues. On a worldwide basis, the Merged Entity would represent []% of Playtech’s revenues. Even adding Playtech’s dividends from its equity interest in Ladbrokes to its revenue generated from its commercial relations with Ladbrokes and Coral, the total revenue Playtech would receive from Ladbrokes and Coral represents [] of its revenue generated from other customers in the UK.
11.13 Therefore, Playtech’s gain from a potential foreclosure strategy would have to be substantial to outweigh its potential losses through potential reduction in its revenues from other UK customers.
11.14 At least in the short term, if it were incentivised to do so, Playtech might be able to take actions which could result in a deterioration of the qualitative offering of the Merged Entity’s competitors. In order for Playtech to derive any benefit from such action, it would need to result in end-customers diverting away from those competitors and to the Merged Entity, thereby increasing revenues of the Merged Entity (and indirectly Playtech’s revenues).
11.15 We note that Playtech mainly supplies products and services for online gambling and any foreclosure strategy by Playtech would primarily impact the online gambling offer of the Merged Entity’s competitors. In the online channel, the Parties compete with a large number of online bookmakers and have a combined share of supply of less than 15%. The Parties do not have a particularly strong position in the online channel and there are many other competitors. Therefore it would appear to be even more difficult for any foreclosure strategy to result in a benefit to Playtech as customers may be less likely to switch to using the Parties’ online gambling services (as opposed to other competitors) so as to result in any indirect increase of revenue to Playtech.

126
11.16 As such, it appears unlikely that any potential short term deterioration of the Merged Entity’s rivals’ offer – insofar as it would arise as a consequence of a foreclosure strategy by Playtech – would enable the Merged Entity materially to increase its customer base or prices such that Playtech would stand (indirectly) to make material gains.
11.17 Furthermore, [] and third party submissions128 indicate that, at least in the medium or longer term, the Merged Entity’s competitors would be in a position to develop alternatives to Playtech’s gambling software, either in-house or by switching to a competing supplier of gambling software.129 We considered that Playtech would likely take this into account in evaluating the potential merits of a foreclosure strategy that would disadvantage the Merged Entity’s competitors.
11.18 We also note that any potential increase in the value of Playtech’s shareholding in the Merged Entity resulting from the hypothetical foreclosure strategies that could be adopted by Playtech appears too far removed to be assessed and, in any case, highly speculative.
11.19 Given our view that Playtech is unlikely to have the incentive to engage in any foreclosure strategy, we did not need to assess whether such a strategy would have any impact on the supply of gambling products in the UK.
The Merged Entity’s ability and incentive to harm its rivals
11.20 We also considered whether the Transaction would impact the relationship between the Merged Entity and Playtech such that the Merged Entity would have the ability and incentive to harm its rivals. For example, the Merged Entity might be able to leverage its position as Playtech’s largest UK customer so as to foreclose its competitors.
11.21 The evidence available to us did not provide any support for this theory of harm. Although the Parties might have an incentive to seek preferential treatment from Playtech, we did not find evidence of any ability to do so. The internal documents provided by [].130 This evidence is consistent with statements made by []. Overall, we therefore considered that the Merged Entity would not be in a position to influence Playtech such that it would adopt a foreclosure strategy to the detriment of the Merged Entity’s rivals.
128 Paddy Power Betfair has not expressed concerns regarding any potential Playtech’s foreclosure strategy arising from the Transaction []. 129 We note that, in April 2016, William Hill invested £90 million in the new owner of gambling technology business OpenBet. 130 Ladbrokes has no equity interest in Playtech and that Playtech does not appear to be in a situation of economic dependence from Ladbrokes.

127
11.22 Given our view that the Merged Entity is unlikely to have the ability to engage in any foreclosure strategy through its relationship with Playtech, we did not need to assess whether such a strategy would have any impact on the supply of gambling products in the UK.
Provisional conclusion
11.23 The evidence described above indicates that:
(a) the combined revenue received from the Merged Entity (as a result of dividends and through the revenue-sharing arrangements) would represent only a small proportion of Playtech’s revenue generated from its other customers in the UK; and
(b) Playtech’s gain from any foreclosure strategy targeted at the Merged Entity’s rivals would have to be substantial in order to outweigh potential losses it would suffer from engaging in such a strategy.
11.24 On the basis of that evidence, we provisionally found that the Transaction is not likely to give Playtech an incentive to favour the Merged Entity to the detriment of other bookmakers, because any gains that may accrue from any foreclosure strategy would be unlikely to outweigh the losses Playtech would suffer as a result of such a strategy in both the short and long term. We also provisionally found that the Merged Entity is unlikely to be able to leverage its relationship with Playtech to the detriment of the Merged Entity’s rivals.
11.25 Therefore, we provisionally found that the Transaction may not be expected to result in an SLC in the markets for the supply of gambling products online and in LBOs under the theories of harm addressed in this section.
Online betting and gaming
11.26 We considered whether Transaction may be expected to result in a substantial lessening of competition in the supply of gambling services online, by providing the Parties with the ability and incentive to increase the price and/or decrease the quality of their online betting and/or gaming offering.
11.27 No third parties expressed concerns in that connection in relation to the effect of the Transaction in the supply of gambling services online.
11.28 Furthermore, the evidence available to us indicates that:
(a) the Parties’ online operations compete in the UK with a large number of online gambling sites;
128
(b) the combined estimated share of supply of the Parties in the supply of online gambling services in the UK will be less than 15% with an increment of less than 5% as a result of the Transaction; and
(c) two competitors of the Parties in the supply of online gambling services – Paddy Power and Betfair – have recently merged and the CMA has cleared that merger, having concluded that Paddy Power and Betfair face sufficient competitive constraints from a number of alternative online betting and gaming bookmakers.
11.29 For these reasons, we provisionally found that the Transaction may not be expected to result in an SLC in the supply of gambling services online.
Buyer power in the acquisition of media rights
11.30 LBO operators acquire (directly or indirectly from racecourses and greyhound track operators) the media rights to broadcast events from these venues in their LBOs and/or on their online platforms.
11.31 Two third parties submitted that the increase in the number of LBOs owned by the Merged Entity may give the Merged Entity buyer power in the acquisition of media rights for horse races and/or greyhound meetings, thereby enabling it to reduce the price paid for these rights or offering worse commercial conditions to the media rights owners.
11.32 For the Transaction to raise competition concerns on the basis of increased buyer power, the Merged Entity would need to have:
(a) an incentive to reduce the amount it purchases to reduce the price it pays; and
(b) sufficient market power downstream to increase the price it charges customers as a result of selling a reduced quantity.131
11.33 Our investigation indicated that:
(a) media rights owners tend to negotiate bilaterally with each betting operator for the sale of their media rights; and
(b) at the downstream level, there was no indication that customers would bet more per race if they were presented with fewer races.
131 Merger Assessment Guidelines, paragraph 5.4.20.
129
11.34 Against this background, we provisionally considered that, as the prices are negotiated bilaterally, the Merged Entity would have no incentive to reduce the quantity purchased in order to reduce the price.
11.35 Furthermore, even if the Merged Entity had greater buyer power in the market for media rights, it would be unlikely that this would translate into consumer harm. Given that broadcasting the content of marginal race courses is profitable even at pre-Transaction purchasing prices, the Merged Entity would be unlikely to lower their purchasing prices to the point where some race courses would have to close and it would have less content to broadcast in their LBOs.
11.36 Therefore, we provisionally found that the Transaction may not be expected to raise competition concerns on the basis of increased buyer power of the Merged Entity in the acquisition of media rights for horse races and/or greyhound races.
12. Countervailing factors - New entry and expansion
12.1 The Merger Assessment Guidelines explain that as part of our assessment of the effect of a merger on competition, we assess whether entry by new firms or expansion by existing firms may mitigate or prevent an SLC.132
12.2 The Merger Assessment Guidelines further explain that:
In assessing whether entry or expansion might prevent an SLC, the [CMA] will consider whether such entry or expansion would be:
(a) timely;
(b) likely; and
(c) sufficient.
Potential (or actual) competitors may encounter barriers which adversely affect the timeliness, likelihood and sufficiency of their ability to enter (or expand in) the market. Barriers to entry are thus specific features of the market that give incumbent firms advantages over potential competitors. Where entry barriers are low, the merged firm is more likely to be constrained by entry; conversely, this is less likely where barriers are high. The strength
132 Merger Assessment Guidelines, section 5.8.

130
of any given set of barriers to entry or expansion will to some extent depend on conditions in the market, such as a growing level of demand.133
12.3 As we provisionally found that the Transaction may be expected to result in an SLC in the markets for the supply of gambling products in LBOs in several local areas where the Parties overlap134 and as a result of the aggregate effect of the reduction of competition in these local areas, we assessed whether entry or expansion would be likely, timely and sufficient to prevent or mitigate the SLCs in those markets.
12.4 For an SLC to be prevented or mitigated all three of these criteria would have to be met, that is entry or expansion would have be timely, likely and sufficient.
Parties’ submissions
12.5 The Parties submitted that new entry or expansion on a substantial scale (eg 5% of LBOs by number) could be achieved in the short term through the merger or acquisition of independent retail bookmakers. The Parties stated that if an estate was to build organically it would take longer, but noted that Paddy Power Betfair’s estate had grown by approximately 55 LBOs per year over recent years, indicating that organic growth need not be small or slow.
12.6 The Parties submitted that the barriers to entry and expansion for opening LBOs were relatively low, as it was relatively straightforward and inexpensive to open and operate an LBO. The Parties stated further that the expertise and capital required to operate a gambling retail business were not a fundamental barrier to entry and that this was attested to by the large number of independent LBOs. The Parties said that, in addition, regulatory compliance costs135 did not pose a fundamental barrier to entry or expansion as licences could be obtained with relative ease and the costs were not prohibitive.136
12.7 The Parties also stated that, given the nature of the products offered by LBOs, there were no significant switching costs for customers. The Parties explained
133 Merger Assessment Guidelines, paragraphs 5.8.3 and 5.8.4. 134 See section 7 and Appendix J. 135 In order to operate an LBO, an operator would need certain licences, principally: (i) a general betting (standard) operating licence issued by the Gambling Commission; (ii) a premises licence for each LBO issued by the relevant local authority (also allowing the operator to offer up to four FOBTs per licensed premises); and (iii) personal licences for key management issued by the Gambling Commission. 136 The Parties submitted that the maximum application cost for a premises licence was £3,000, with a maximum annual licence fee of £600. The application and annual costs for a betting (standard) operating licence depended on the number of shops that a bookmaker held. For example, a bookmaker with up to four shops would pay £977 to apply for a licence and a £1,531 annual fee. However, the operating licensing cost per shop decreased as the number of shops increased.

131
that a key driver for customers was an attractive location, as well as the quality and service of the establishment, and that, as such, customers would be expected to switch to any new LBO located sufficiently close to those of the Parties, should the Parties worsen their offering (in terms of price or non-price factors of competition).
Third parties
12.8 In contrast to the view expressed by the Parties that barriers to entry and expansion were relatively low, most third parties who responded to specific questions from the CMA on the topic considered that such barriers were high.
12.9 Paddy Power Betfair submitted that organic entry was particularly difficult and that, because only a limited number of independent operators existed from whom LBOs might be acquired, entry into this market via acquisition was also challenging. Paddy Power Betfair also stated that []. Paddy Power Betfair submitted that since the change in the planning legislation in April 2015,137 the opening of LBOs had become markedly more difficult and required [] upfront costs (up to [] on planning consultants and legal costs) with unknown chances of success. [] Paddy Power Betfair submitted that, while it could still expand, it was almost impossible for a new entrant to enter the market with significant scale.
12.10 William Hill submitted that, overall, the obstacles to creating and expanding an LBO estate remained high and had recently increased, for instance as a result of the changes to planning regulations in 2015.
12.11 Betfred stated that it was becoming more and more difficult to open new LBOs and that LBO operators had had to adjust to significant regulatory and taxation changes, increasing negative press as to their services and most recently the change in planning rules.
12.12 Jennings submitted that many LBOs that had opened within the last five years would not have been able to do so under the new planning legislation. Jennings also stated that landlords were less inclined to wait while an operator obtained the new use class through the planning process unless receiving a significant rental during the void period. Jennings explained that
137 A local planning application is now required for all proposed LBOs pursuant to the Town and Country Planning (Use Classes) (Amendment) (England) Order 2015 which came into effect on 15 April 2015. This order removed licensed betting shops from the town centre use class - A2 - and placed them in a class of their own (‘sui generis’). It had the effect of removing permitted development rights (where previously A2 use was permitted in units classed A3, A4 or A5) and also requiring a planning application for all proposed LBOs (the only effective exception being if it traded as a betting shop previously).

132
this added to the overall cost of opening a new site and would make some projects unviable.
12.13 Chisholm submitted that small chains of LBOs were under significant financial pressure owing to the high cost of media rights and the recent increase in machine gaming duty on B2 machines to 25%. []
CMA assessment
12.14 We commenced our assessment by examining whether there was compelling evidence of entry or expansion being likely and sufficient in the local areas where we have provisionally found an SLC. As set out above, in order to prevent or mitigate an SLC, entry or expansion would have to meet all three criteria (timely, likely and sufficient).
Likelihood and sufficiency
12.15 Our review of the recent history of entry into the market for the supply of gambling products in Great Britain indicates that there have been some examples of entry/expansion by independent bookmakers and that Paddy Power has expanded its network of LBOs in the recent years. The evidence submitted by some LBO operators also indicates that they plan to open some LBOs, in the normal course of their business.
12.16 However, the total number of independent-operated LBOs has declined,138 and Paddy Power Betfair submitted that it planned to increase its estate by no more than approximately 20 LBOs in each of the next three years. William Hill also stated that in the next year it planned to open around 25 LBOs in the next year.
12.17 Furthermore, the evidence available to us does not indicate that any other bookmakers (for example, online bookmakers) have plans to enter or expand in the retail gambling market on any significant scale, in terms of number of LBOs.
12.18 The evidence from third parties set out in paragraphs 12.8 to 12.13 also indicates that barriers to entry and expansion are significant and that a programme of sizeable entry or expansion within the next couple of years appears unlikely.
138 According to data supplied by the Parties, the number of independently-owned LBOs is approximately 933 (split among 217 independent bookmakers).
133
12.19 In particular, third party evidence also indicates that, as a result of the recent changes in the planning regulations, there may be additional regulatory obstacles to the opening of a new LBO in some locations.
12.20 We are also mindful that, as explained in paragraphs 7.83 to 7.89, the competitive constraint exercised by smaller ‘independent’ LBO operators is generally weaker than the constraint exercised by national LBO operator. Therefore, a LBO operator with a certain scale is more likely to effectively constrain the Merged Entity in a way that mitigates or prevents an SLC at the local level.
12.21 We considered that the evidence, overall, indicates that new LBOs will continue to be opened (both by independent LBO operators and through larger, national LBO operators expanding their estate) in competition with the Merged Entity. However, entry or expansion is unlikely to take place on a sufficient scale in all the local areas where we provisionally found that the Transaction may be expected to result in an SLC.
12.22 Without evidence indicating that entry or expansion by bookmakers is likely to occur in all these areas, we provisionally found that we cannot rely on the likelihood of entry to prevent or mitigate an SLC in those areas.
Timeliness
The evidence of historical entry and expansion, combined with the impact of the new planning regulations in 2015, imply that entry or expansion via new openings on a sufficient scale (to prevent or remedy the SLC we have provisionally found) is unlikely to take place within a two year period.
Provisional conclusion
12.23 Based on the evidence set out above, we provisionally found that there are significant barriers to opening a sizeable number of LBOs and that, in view of the expansion plans of LBO operators operating in Great Britain, entry is unlikely to occur on a sufficient scale in the different markets where we provisionally found an SLC in the supply of gambling products.
12.24 We therefore provisionally found that entry or expansion is unlikely to prevent or mitigate the SLCs that may be expected to result from the Transaction.

134
13. Overall provisional conclusions
13.1 We have provisionally found that the Transaction may be expected to result in an SLC:
(a) within 659 local markets in Great Britain for the supply of gambling products in LBOs; and
(b) within the market for the supply of gambling products in Great Britain, as a result of the aggregated loss of competition at the local level.
13.2 We have also provisionally found that the Transaction may not be expected to result in an SLC:
(a) at a national level in relation to
(i) competition for the top price for certain selections in football coupons and horse racing;
(ii) any reduction of potential competition;
(iii) any loss of innovation;
(b) in relation to the supply of gambling products online;
(c) in relation to the operation of the Romford and Crayford greyhound tracks;
(d) in relation to the supply of media rights for greyhound races in the UK; and
(e) as a result of increased buyer power in relation to the acquisition of media rights for horse racing and greyhound racing.
We also provisionally found that the Transaction would likely not result in Playtech having an incentive to favour the Merged Entity to the detriment of other LBO operators and would not give the Merged Entity the ability to leverage its relationship with Playtech to the detriment of the Merged Entity’s rivals.