Embed Size (px)
Citation preview
NBER WORKING PAPER SERIES
ANTI-DEPRESSANTS AND SUICIDE
Jens LudwigDave E. Marcotte
Karen Norberg
Working Paper 12906http://www.nber.org/papers/w12906
NATIONAL BUREAU OF ECONOMIC RESEARCH1050 Massachusetts Avenue
Cambridge, MA 02138February 2007
The research reported here was supported by small grants to Marcotte and Ludwig from UMBC andthe Georgetown University Graduate School of Arts and Sciences. Norberg was supported with fundingfrom NIH grant 5K08MH001809, and the Center for Health Policy at Washington University. Noneof the authors have received funding from pharmaceutical companies or other entities with financialinterests relevant to the paper's topic. Thanks to Jonathan Caulkins, Philip Cook, Jeff DeSimone, WilliamDickens, Carlos Dobkin, Dan Feenberg, Ted Gayer, Chris Hansen, Jeffrey Kling, Alain Lesage, ByronLutz, Sara Markowitz, James Mercy, Matthew Miller, Steve Pischke, Steve Raphael, David Salkever,Eric Slade, Betsey Stevenson, Justin Wolfers, and seminar participants at the CDC, NBER and APPAMfor assistance and helpful comments. IMS Health, Inc. was very generous and helpful in providingnecessary data. Steve Hemelt and Ozlen Luznar provided excellent research assistance. Commentscan be directed to any of the paper's authors at [email protected], [email protected], [email protected]. Any errors and all opinions are of course our own. The views expressed hereinare those of the author(s) and do not necessarily reflect the views of the National Bureau of EconomicResearch.
© 2007 by Jens Ludwig, Dave E. Marcotte, and Karen Norberg. All rights reserved. Short sectionsof text, not to exceed two paragraphs, may be quoted without explicit permission provided that fullcredit, including © notice, is given to the source.
Anti-depressants and SuicideJens Ludwig, Dave E. Marcotte, and Karen NorbergNBER Working Paper No. 12906February 2007JEL No. I12,I18
ABSTRACT
Does drug treatment for depression with selective serotonin reuptake inhibitors (SSRIs) increase ordecrease the risk of completed suicide? The question is important in part because of recent governmentwarnings that question the safety of SSRIs, one of the most widely prescribed medications in the world.While there are plausible clinical and behavioral arguments that SSRIs could have either positiveor negative effects on suicide, randomized clinical trials have not been very informative because ofsmall samples and other problems. In this paper we use data from 26 countries for up to 25 years toestimate the effect of SSRI sales on suicide mortality using just the variation in SSRI sales that canbe explained by cross-country variation in the growth of drug sales more generally. We find that anincrease in SSRI sales of 1 pill per capita (about a 12 percent increase over 2000 sales levels) is associatedwith a decline in suicide mortality of around 5 percent. These estimates imply a cost per statisticallife far below most other government interventions to improve health outcomes.
Jens LudwigGeorgetown UniversityPublic Policy Institute3520 Prospect Street, NWWashington, DC 20007and [email protected]
Dave E. MarcotteDepartment of Public PolicyUMBC1000 Hilltop CircleBaltimore, MD [email protected]
Karen NorbergWashington University School of MedicineDepartment of PsychiatryCampus Box 8134660 South EuclidSt. Louis, MO 63110and [email protected]

I. INTRODUCTION
Does anti-depressant drug treatment increase or decrease the risk of completed suicide?
Since major depression is a leading risk factor for suicide, and because antidepressant drugs are
generally effective in treating depression [Goldsmith et al., 2002], it might be expected that
increasing use of antidepressants would reduce suicide.1 However a number of recent studies
suggest that the most commonly used class of antidepressant drugs – selective serotonin reuptake
inhibitors (SSRIs) – might actually increase the risk of suicidal behavior [FDA, 2006, Hammad
et al., 2006]. One candidate explanation is heterogeneity in psychopharmacological effects:
some patients might experience a worsening of mood from SSRI treatment. Another candidate
explanation comes from the possible behavioral responses of patients and medical practitioners
to the improved safety and reduced side effects of SSRIs relative to older tri-cyclic
antidepressants (TCAs), a version of what Viscusi [1984, 1985] terms the “lulling effect.” In
response to these recent studies, regulatory agencies in both the US and UK have issued
warnings about the use of SSRIs first for people under 18 years of age [U.K. Department of
Health, 2003; FDA 2003, 2004; Goode 2003] and more recently for adults as well [FDA, 2005].
This topic is of interest to economists for at least two reasons. First, it is important.
Suicide increased dramatically for youth starting in 1950 and is now the third leading cause of
death among persons age 15-24 in the US [Cutler, Glaeser and Norberg, 2001; Goldsmith et al.,
2002]. Suicide is an important cause of death in all age groups, claiming the lives of around
30,000 Americans every year and another one million people or so worldwide [Goldsmith et al.,
2002]. Recent estimates suggest the lifetime prevalence of major depressive disorders is on the
1 In their seminal paper Hamermesh and Soss [1974] present a model in which individuals commit suicide if the present value of expected lifetime utility is zero. Within their framework SSRIs might reduce suicide by changing the technological relationship that determines the cost of maintaining some minimum subsistence quality of life, by changing the enjoyment people obtain from any given level of consumption, or improving people’s productivity.
1

order of 17 percent [Kessler, Berglund et al., 2005].2 In 2000, SSRIs were the second most
commonly prescribed drug class in the U.S., and the third best-selling drug class in the world
[IMS Health, 2006]. Understanding how SSRIs affect suicide is relevant for policy decisions
about whether to restrict or encourage access to these drugs, and about how to regulate their use.
A second reason this question is of interest to economists is that the standard empirical
tools of medical and public health research have not been very informative about the effects of
SSRIs on the outcome of arguably greatest medical and policy concern – suicide mortality.
Randomized clinical trials (RCTs) employ sample sizes that are too small to detect effects on
rare health outcomes such as suicide completion. As a result most previous studies, and even
meta-analyses of studies, rely on measures of non-lethal “suicidality,” [e.g., Fergusson et al.,
2005; Hammad et al., 2006], but the association between these indicators and actual suicide
mortality remains unclear [Cutler, Glaeser and Norberg, 2001; Baldessarini et al., 2006a]. In
addition the subjects enrolled in RCTs typically exclude subjects at highest risk for suicide, and
the conditions under which both treatment and control subjects receive treatment in clinical trials
may differ from the standard level of care provided to patients outside of such trials. The lack of
evidence about completed suicide has generated intense controversy about the FDA warnings, in
part because the warnings could create harm by deterring SSRI use among patients who might
benefit from antidepressant treatment. As one researcher involved in the FDA review panels told
the New York Times, “Sitting up there and having the public yell that you’re killing their children
is no fun.” A medical historian told the Times “It’s like a religious war,” with a level of
argument not seen since “the 1960s and 1970s, when scientists were challenging psychoanalysis”
[Carey, 2006].
2 These disorders also impose substantial costs on society beyond their impact on suicide, such as by affecting human capital accumulation, employment, productivity, crime, child abuse, accidents, homelessness and divorce [Frank and McGuire, 2000; Marcotte and Wilcox-Gök, 2001; Currie and Stabile, 2004].
2

In principle analysis of population-level data could provide the statistical power needed
to detect relationships between SSRI use and suicide mortality. Yet existing epidemiological
studies have employed weak research designs, typically before-after comparisons using data
from one or a few countries, which provide limited power to rule out the influence of
confounding factors. More recently a few studies have drawn on county- or country-level panel
data to at least control for shared period effects or time-invariant attributes of these jurisdictions
[Dahlberg and Lundin, 2005; Gibbons et al., 2005; Ludwig and Marcotte, 2005]. Despite these
improvements causal inference from these studies remains difficult because variation in SSRI
drug sales over time and across jurisdictions may be simultaneously determined with changes in
the prevalence of mental disorders: SSRI sales might increase in response to increases in the
prevalence of depression. Even the timing of when SSRIs are approved for sale may be
endogenous, given that previous studies find time-to-approval is shorter for important drugs that
treat high-visibility health problems [Dranove and Meltzer, 1994; Carpenter, 2002].
The contribution of the present paper is to provide new empirical estimates for the effects
of SSRIs on suicide mortality by combining the statistical power associated with analysis of
population-level data together with a plausibly exogenous source of identifying variation in SSRI
sales. Specifically, we construct a panel dataset for 26 countries for up to 25 years, and exploit
just the variation in SSRI sales across countries over time that can be explained by differences
across countries in how quickly they usually bring new drugs in general to market, and by
differences in how rapidly new drug sales typically increase. We show that differences across
countries in the rate of sales growth for the other major new drugs that were introduced in the
1980s for treatment of non-psychiatric health conditions can explain a substantial amount of
variation in SSRI sales. This source of variation would not seem to be susceptible to bias from
3
reverse causation (SSRI sales increase because of increasingly prevalent mental health
disorders), or from bias due to correlations between adoption of SSRIs and general
improvements in mental health care systems.
We estimate that an increase in SSRI sales of 1 pill per capita (around a 12 percent
increase over 2000 sales levels) would reduce suicide mortality rates by around 5 percent. These
estimates imply that around 1 suicide is averted for every 200,000 pills sold.3 Commonly used
SSRIs can currently be obtained in the United States for around $0.10 per pill, which suggests a
cost per statistical life saved from increasing SSRI use of around $20,000 – far below most other
government regulations or policies to improve health. A formal benefit-cost analysis requires
grappling with difficult conceptual and normative questions about how to value safety gains
among a population at high risk of attempting self injury. We briefly discuss these important
issues in the concluding section, although a full treatment is beyond the scope of this paper.
A more practical concern with our instrumental variables (IV) research design stems from
the possibility that countries where new drug sales increase at different rates might differ in other
ways that are relevant for mental health and suicide. One way we address these concerns is to
control for country and year fixed effects and even country-specific linear trends. We also show
that our point estimates are hardly affected by also controlling for each country’s population age
structure, unemployment rate, and real GDP per capita. The estimates are also quite similar
when we restrict our analytic sample just to member countries of the Organization for Economic
Co-Operation and Development (OECD), which may be less dissimilar than our broader sample
of countries with respect to potential confounding factors.
3 In Table 1 below we show that the mean suicide rate for our sample over the study period is about 10 per 100,000. Our point estimate thus implies that an increase in SSRI sales of 1 pill per capita reduces suicide mortality by 5%*(10 / 100,000) = .000005 deaths per capita. So an increase in SSRI sales of 200,000 pills would reduce mortality by 1 statistical life.
4

As another specification check we show that our IV estimates suggest no relationship
between SSRI sales and accident deaths, which should not be affected by SSRI drug treatment.
Finally, we demonstrate that countries with high versus low rates of growth in drug sales more
generally experienced very similar trends in suicide mortality during the 1980s, when SSRIs
were not widely used. The differences in suicide mortality trends between high- and low-drug-
growth countries are instead concentrated in the 1990s, when SSRI use became widespread.
The remainder of the paper is organized as follows. The next section briefly summarizes
previous empirical work in this area; Section 3 describes our data; Section 4 presents our
empirical methods and results, and the final section discusses implications of the results.
II. BACKGROUND
The concern that antidepressant drugs could increase, rather than decrease, the risk of
suicide dates back to the introduction of the first tri-cyclic antidepressants (TCAs) in the 1950’s.
Long before the FDA’s recent “black box” warning for SSRIs, the agency required that
antidepressant drugs include some standard warning language for patients.4 There are both
clinical and behavioral arguments for why TCAs might increase the risk of suicide. One clinical
mechanism has to do with the slow therapeutic effects of these drugs. Most antidepressants
(including both SSRIs and TCAs) take at least four or more weeks to result in a clinically
significant improvement in depressed mood. However, other psychopharmacological effects
may occur within the first few days of treatment. As early as the 1960’s, psychiatry textbooks
warned that the risk of suicide may increase during early phases of treatment because the
medications may give depressed patients the energy to follow through on a suicidal motive, long
4 “The possibility of a suicide attempt is inherent in major depressive disorder and may persist until significant remission occurs. Close supervision of high-risk patients should accompany initial drug therapy. Prescriptions for Drug X should be written for the smallest quantity of tablets consistent with good patient management, in order to reduce the risk of overdose.”
5
before they lead to an improvement in mood [FDA 2006]. A second clinical concern stems from
the possibility of heterogeneity in drug effects across patients. Specifically, recent studies
suggest antidepressants might worsen mood in patients with undiagnosed bipolar disorder
[Baledessarini et al., 2006b]. There is also growing evidence that the effects of antidepressants,
as well as their side effects, may differ for children, adolescents, and adults [FDA 2006].
The behavioral mechanism through which antidepressant drugs might increase suicide
risk stems from the potential of TCAs to be highly toxic in overdose. As a result, a prescription
for these drugs might lower the “price” of suicide by providing easy access to an effective
method of self harm. This type of “instrumentality effect” would imply that suicide methods are
not perfectly substitutable and that people at high risk for suicide are at least somewhat
responsive to the availability of different methods.5
A major technological innovation in the treatment of depression (and the focus of the
present study) occurred in 1984 with the introduction of the selective serotonin reuptake
inhibitors (SSRIs). SSRIs are described as “selective” because they affect only the reuptake
pumps responsible for serotonin, a small molecule that serves as a neurotransmitter, or “chemical
messenger,” in the brain. SSRIs increase the amount of the neurotransmitter serotonin that is
active in the synapses between cells, thereby enhancing neuronal activity and improving mood.
In contrast to SSRIs, the TCAs affect multiple neurotransmitters. While the SSRIs seem to be
similar to the older TCAs in their ability to reduce depression (e.g., Trindade et al. [1998],
5 Suicide methods may not be perfect substitutes in part because of considerable variability in skill required, physical pain, likelihood of rescue, likelihood of a fatal outcome, and likelihood of permanent injury if the outcome is not fatal. Different methods of suicide are not readily available to everyone at all times – for example, “only” around one-third of American households own guns [Cook and Ludwig, 1996], tall buildings or bridges are more common in some places than others, and some people are more likely to receive prescription medications than others. Research provides at least qualified support for the idea that changing access to suicide methods – such as reduced access to guns, or reducing the carbon monoxide content of domestic gas – may achieve at least temporary reductions in suicide [Krietman, 1976; Ludwig and Cook, 2000; Goldsmith et al., 2002; Duggan, 2003].
6

Mallick et al., [2003], Ryan [2003], Green [2003], Vaswani et al. [2003]),6 they are more
selective in their operation and therefore have fewer physical side effects (such as dry mouth,
drowsiness, or cardiac arrhythmia) and are less toxic in overdose.
The introduction of SSRIs may have reduced the population suicide rate in two ways.
First, SSRIs reduced the “price” of treating depression. The milder physical side-effect profile
may increase the willingness of patients to start and continue taking medication, and has also led
antidepressant drugs to be prescribed for a much wider range of patients by a wider range of
practitioners [Guze, 1996; Lawrenson et al., 2000]. It is true that some of the increase in SSRI
use could have been substitution from talk therapy, and current research is ambiguous about the
relative effectiveness of the two forms of treatment [e.g., Klein, 2000]. But overall SSRIs have
probably played a role in the increase in the number of people receiving treatment for depression
in the U.S. [Kessler, Demler et al., 2005; Thorpe et al., 2004].
A second mechanism through which SSRIs might reduce suicide comes from the fact that
SSRIs might partially substitute for the older TCAs. The lower toxicity of SSRIs relative to
TCAs could reduce the risk of suicide through an instrumentality effect. The improved ratio of a
therapeutic dose to a toxic dose of SSRIs means that an act of intentional self harm by
swallowing, say, a one-month supply of SSRIs is probably less lethal than swallowing a one-
month supply of TCAs.7 The introduction of SSRIs might therefore increase the “price” of
completed suicide, if substitutes for TCAs as a method of relatively “painless” suicide were less
easily available.
7 However, little is known about the actual case fatality rates for overdoses with SSRIs versus TCAs, and it is an open question whether persons attempting self harm via overdose are aware of the relative toxicity of one medication over another.
7

However there are also clinical and behavioral arguments to suggest that SSRIs could
potentially lead to an increase in the risk of suicide to patients using antidepressant drugs and
overall suicide rates. The clinical concern stems from the possibility of heterogeneity in
psychopharmacological effects, and in particular the possibility that the risk of an adverse effect
of antidepressant drug treatment on mood may be more pronounced with SSRIs than TCAs.
Even if SSRIs and TCAs had the same effects on suicidal states, the increased prevalence of drug
treatment following the introduction of SSRIs could have led to an increased number of persons
at risk for an adverse drug reaction.
It is also possible that SSRIs could potentially increase suicide risk through a “lulling
effect” [Viscusi, 1984, 1985]. Economists have long been concerned about the possibility that
consumers will reduce safety precautions in response to the introduction of new, safer consumer
products [see for example Peltzman, 1975]. Viscusi’s [1984, 1985] elaboration of this idea
raises the possibility that improved product safety could increase product injury rates if
consumers misperceive risks.
In the case of SSRIs the increased safety of these drugs relative to TCAs may have led a
broader (and perhaps less experienced or qualified) set of health practitioners to be willing to
provide drug treatment for depression, and may also have led payers, clinicians, and patients to
accept a shortening of in-patient hospital stays and reduction of intensity of outpatient treatment8
with a consequent drop in the vigilance of patient monitoring. In many countries there have been
dramatic changes in the locations of psychiatric service provision over the past 40 years, with
state psychiatric hospitalization being replaced by treatment in community settings. The
development of safer and more effective drug treatments is thought to have contributed to this
8 Many studies find that a combination of drug treatment and psychotherapy is more effective than either treatment alone [eg, March et al., 2004], so SSRIs might increase the risk of suicide among those patients who would formerly have been referred for more intensive treatment and supervision.
8

shift in the location of care. But there is a long history of concern that the deinstitutionalization
process may have led to a higher suicide rate [e.g. Hansen et al., 2001; Flechner, Wolf and
Priebe, 1995; Salzer et al., 2006] for much the same reasons that improved product safety could
increase the risk of product injury rates if consumers (or clinicians or policy makers) have
misperceived the actual risks. While little is known about perceptions of the risk of SSRI use or
overdose, it is possible that the risk of death from overdose with SSRIs is low enough (either
absolutely or relative to that of TCAs) so that users or providers engage in what Kahneman and
Tversky [1979] call “editing” and ignore these risks altogether [see also Kunreuther, 1978].9
Another “lulling effect” might stem from the fact that some self-injury attempts may be
motivated by reasons other than the desire to end life, including to signal for help, punish family
or friends, or secure resources more generally [Rosenthal, 1993; Cutler, Glaeser and Norberg,
2001; Marcotte, 2003]. The introduction of a safer overdose alternative – SSRIs – could
paradoxically lead to an increase in the number of suicide attempts, thus increasing the number
of unintentional deaths resulting from self-injury attempts without lethal intent.
The question of whether antidepressant drugs might actually increase suicide risk first
came to national attention in 1990, with the publication of a report describing six adult patients
who apparently became suicidal as a result of being treated with fluoxetine (Prozac). The
ensuing debate led the FDA to review the issue, with hearings in 1991. A review of all of the
clinical trials conducted by the manufacturer revealed no sign of increased suicidality associated
with the use of Prozac [Beasley et al, 1991].
Over the next several years, as newer drugs came to market, pooled analyses of
individual clinical trials were updated in order to search for possible signs of risk. In May of
9 This is also in some ways analogous to what Akerlof, Dickens and Perry (ADP) [2000] argue workers and firms might do in low-inflation environments. ADP also note that the salience of an event might also be relevant in whether individuals pay attention versus ignore some factors; see for example Gleitman [1996].
9

2003, GlaxoSmithKline reported an increased risk of suicide-related adverse events in a pediatric
trial of paroxetine (Paxil). This led to an analysis of all available pediatric trials, and finally to an
FDA “black box” warning of increased risk of suicidal behavior associated with antidepressant
use in pediatric patients. Since then, the FDA has commissioned several large pooled studies, the
first covering pediatric clinical trials of new antidepressants, and the most recent covering adult
trials. Taken together, these studies have found a plausible and statistically significant
association between assignment to SSRI (versus placebo) and non-lethal suicidal behavior in
adolescents [Hammad et al 2006] and in young adults, as well as a statistically significant
decrease in suicidal ideation and behavior from drug treatment in older adults [FDA 2006].
There are several reasons why RCTs will have difficulty identifying the relationship
between SSRIs and the outcome that is arguably of greatest medical and policy concern –
completed suicide. The most important limitation of the clinical trial study is sample size: even
studies with the largest pooled RCT samples have had sample sizes too small to detect
differences in important but rare outcomes such as suicide [Deyo, 2004]. For example, a recent
meta-analysis involving a total of 87,650 patients found just 24 completed suicides, and so relied
on an outcome measure that pools together fatal and non-fatal attempts [Fergusson et al., 2005].
This study found a statistically significant increase in the risk of (lethal plus non-lethal) suicide
attempts for patients receiving SSRIs compared to placebo, and no difference in the risk of
suicide attempts between patients receiving SSRIs and tricyclic antidepressants. However as
Baldessarini et al. [2006a, p. 246-7] note, only a small fraction of patients with suicidal thoughts
attempt suicide, few attempts prove to be fatal, and, importantly, the risk factors for suicide
attempts versus completions differ markedly [see also Cutler, Glaeser and Norberg, 2001].
10

The second problem with RCTs is that the participants who are enrolled may be
unrepresentative of the average patient. For ethical and practical reasons, most clinical trials
avoid enrolling subjects with prior histories of suicide attempts or current histories of suicidal
ideation [Pearson et al., 2001]. As a consequence, these studies exclude those people at highest
risk for suicide [Goldsmith et al., 2002; Zimmerman et al, 2002; Baldessarini, 2005; Ferguson et
al., 2005, Baldessarini et al., 2006a; Khan et al., 2000, 2001]. In addition the type of treatment
offered in RCTs may be unrepresentative of the usual community levels of care. For example,
they may take place in academic medical centers and outpatient settings, with structured
protocols and better staffing than may be available in non-academic mental health settings. A
final problem is that most new drug trials involve comparisons between the new drug and
placebo, but providers and policy analysts may also be most interested in the comparison
between newer drugs and those already on the market.
To study questions that cannot be addressed by RCTs, investigators have used a variety
of “non-experimental” research designs. However, most previous population-based studies of
SSRIs and suicide have used research designs with limited power to rule out the influence of
competing explanations. Specifically, most of these studies have simply compared suicide rates
before and after SSRIs become available in a particular jurisdiction. Studies of Sweden, Finland,
Norway, Hungary and Australia using this “interrupted time series” design have found that
suicide rates declined as SSRI use increased [Isacsson, 2000; Rihmer et al., 2001; Ohberg et al.,
1998; Hall et.al., 2003], although a study in Italy found no effect [Barbui et al., 1999]. Yet the
independent effects of SSRI use are difficult to infer from studies that rely on simple before-and-
after comparisons within a given country. The overall problem with this study design is that it
cannot distinguish the effects of the policy change – in this case, the introduction of SSRIs –
11

from the effects of other factors such as deinstitutionalization that might be changing over the
same time period.
One way to improve on this before-and-after design is to compare suicide outcomes
across multiple jurisdictions that have changed their policies regarding SSRI use at different
times in a standard fixed-effects setup with panel data.10 Two studies have used this approach to
examine variation in SSRI sales across jurisdictions over time within a single country. Using
data for the U.S. for the years 1996 to 1998, Gibbons et al. [2005, 2006] find that increases in
prescriptions for SSRIs and other newer anti-depressants are associated with lower suicide rates
both within and between counties, including for children and adolescents. The authors note that
this is consistent with anti-depressant efficacy and low toxicity in the event of a suicide attempt,
but also with the possibility that local SSRI sales levels may be positively correlated with the
quality of local mental health care. Dahlberg and Lundin [2005] examine variation in SSRI sales
across counties and age groups in Sweden, and find no significant association between SSRI
sales and suicide rates.
A third study using this same basic approach examines variation in use of SSRIs across
countries over time. Ludwig and Marcotte [2005] use data from 27 countries over 20 years, and
condition on country-specific linear trends as well as country and year fixed effects. They find
that an increase in SSRI sales of one pill per capita is associated with a 2.5 percent decline in
suicide rates. That study serves as the launching-off point for the current research.
The obvious concern is that even standard “fixed effects” estimates that compare trends
across countries over time may be susceptible to bias from other unmeasured factors that affect
both changes in SSRI use and suicide mortality. For example, if countries try to improve access
10 A different approach adopted by Jurrlink et al. [2006] is to use individual-level data from medical records and compare suicide rates for those who receive SSRI treatment versus others, using propensity-score matching methods to control for selection into SSRI treatment on the basis of observable background characteristics.
12
to psychiatric medications in tandem with other improvements to their mental health systems, a
standard panel-data analysis may overstate any socially beneficial effect of SSRIs on suicide
mortality. Alternatively, the movement towards deinstitutionalization, or other forces leading to
increases in the prevalence of mental health problems, may have driven increased anti-depressant
drug sales, or caused government regulators to bring SSRIs to market sooner.11 In this case, any
beneficial effect of SSRI sales on suicide risk might be masked by the positive correlation
between suicide rates and market demand for drug treatment of depression.
In the present study, we seek to overcome this source of bias by using a research design
that relies on just the variation in SSRI sales that can be predicted from the rate of growth in
sales of the major non-psychiatric medications that were introduced over the same time period
(the 1980s) in which SSRIs were introduced. The next section describes our data while the
subsequent section discusses our methods and findings.
III. DATA
In this paper we examine country-level data in order to take advantage of both the
statistical power of population data for studying suicide mortality and the variation across
countries in both the levels and trends of sales of SSRI and other drugs.
Annual data on suicide mortality is widely available for a large sample of countries from
the World Health Organization (WHO), which in turn obtains these data from national vital
statistics reporting systems. Data for each country include the annual number of total suicides
and by gender and age, as well as relevant population counts. We have these data for at least
1980 through 1999 for all countries, and have been able to extend the panel through at least 2000
for about half of our countries. Most of these suicide reports were recorded by local medical or
11 Previous research suggests that more important drugs that address more high-visibility health problems seem to be approved by the FDA more quickly [Kaitin et al., 1991 ; Dranove and Meltzer, 1994 ; Carpenter, 2002].
13

public health officials using the International Classification of Diseases, 9th Revision (ICD-9)
system for coding cause of death, although by the end of the panel some countries use the newer
ICD-10. While data from the United States suggests that both coding schemes capture suicides
in a consistent fashion [Anderson et al., 2001], in our analysis we accounted for the possibility
that a shift from ICD-9 to ICD-10 may produce changes in recorded suicide rates in some
countries within our sample. Our analytical methods also account for the possibility of fixed
cultural or institutional differences across countries in how suicides are officially recorded.
The main constraint on the construction of our country-level sample is the availability of
data on SSRI sales. Our core analytic sample consists of the 26 countries for which we have
been able to obtain annual SSRI sales data from IMS Health, Inc., a commercial firm that
provides data on international pharmaceutical sales to manufacturers and health care providers.
The diverse set of countries in our main analytic sample are: Argentina; Australia; Austria;
Belgium; Brazil; Canada; Chile; Columbia; Ecuador; Finland; France; Greece; Ireland; Israel;
Italy; Japan; Luxembourg; Mexico; Netherlands; New Zealand; Norway; Portugal; Spain; United
Kingdom; United States; and Venezuela. One possible concern is that our sample of countries is
too diverse, although we demonstrate below that our results are similar when we restrict attention
to just member nations of the Organization for Economic Co-Operation and Development
(OECD).12 We exclude countries that transitioned from Communist to other forms of
government during our sample period (including Germany) to avoid confounding the
introduction of SSRIs with the profound social changes that accompanied these transitions.13
12 This restriction drops Argentina, Brazil, Chile, Colombia, Ecuador, Israel, and Venezuela. 13 For example in the Ukraine suicide mortality rates per 100,000 declined steadily from 1981 to 1991 from 23.7 to 20.5, but following the replacement of the USSR by the Commonwealth of Independent States in 1991, when Ukraine became an independent country, suicide rates increased steadily and by 2000 equaled 29.3, perhaps related to increases in heavy drinking [Webb et al., 2005]. For Germany the challenge is that we cannot obtain annual suicide mortality data for East Germany prior to 1989; in that year suicide rates per 100,000 are more 1.5 times as
14

Another practical motivation for excluding former Communist countries is limited availability of
data on drug sales, and in some cases also limited data on suicides in the pre-transition period.
For each of these countries we have information about drug approval dates back to 1980
for all SSRIs, which includes fluvoxamine, paroxetine, fluoxetine, sertraline, citalopram and
venlafaxine. We have also been able to obtain data on actual SSRI sales for these countries for
each year back to 1990. The fact that we do not have SSRI sales data before 1990 could in
principle complicate our analysis, although it is important to note that most countries began to
sell SSRIs starting only in the late 1980s and in almost all countries SSRI sales growth was a
phenomenon of the 1990s (see Table 1). For countries that approved SSRIs before 1990 we do
know what sales were in the years before approval – zero. We use linear interpolation to impute
sales in years between the date of SSRI approval and 1990.14 More complicated imputation
procedures are possible, but we show below that our results are not sensitive to how we address
this problem since we obtain nearly identical results when we set to missing those country-year
observations in the 1980s that come after SSRIs had been approved in a country.
To implement our preferred IV strategy below, we also obtained similar information from
IMS Health about drug introduction dates and sales data for four drug classes other than SSRIs.
We selected drugs that satisfied three criteria: (1) Like SSRIs, they must have been introduced
in the 1980s so that the set of institutions that generally affect the drug adoption process are
similar across drug types; (2) Like SSRIs, they must have been among the top-ten selling drug
classes at the end of our study period (1998-2000), in the event that there is some general “major
drug” effect on regulatory approval or sales trends; and (3) Unlike SSRIs, these drugs should not
high in East versus West Germany (25.8 versus 16.5). Using data just on West Germany over our study period is problematic in part because of increased migration of East Germans into the West following reunification. 14 Specifically for each country we know sales in the year before approval (zero) and from our data sales levels in 1990, and then just linearly interpolate SSRI sales data in the intervening years.
15
be used in the treatment of psychiatric illnesses, to avoid the potential endogeneity problems
described above. The drug classes that satisfy these criteria are summarized in Table 2: Statins, a
class of drugs designed to lower LDL (“bad”) cholesterol; proton pump inhibitors (PPIs), which
are used to treat stomach and duodenal ulcers; and two drug classes used to treat hypertension,
calcium channel blockers (CCBs) and angiotensin-converting enzyme (ACE) inhibitors.15
Below we describe how we use information on the introduction and rates of sales growth for
these drugs to construct our instruments.
In our analyses we also controlled for a number of socio-demographic factors thought to
affect suicide rates. For example there is a powerful age structure to suicide mortality (Table 1),
and so we control for the annual distribution of each country’s population across different age
groups. We also have data on unemployment rates from the OECD, and data on real per capita
gross domestic product adjusted for changes over time in exchange rates [World Bank, 2006].
IV. FINDINGS
Our preferred estimates, which use just the variation in SSRI sales across countries over
time that can be explained by variation in the rate of growth in sales of other drugs, suggest that
an increase in SSRI sales of 1 pill per capita reduces suicide mortality by around 5 percent. This
negative relationship is larger in absolute value among relatively younger people, although our
estimates for age-specific impacts of SSRI sales are limited by the fact that we have data on
suicide mortality but not SSRI sales broken out separately by age groups.
A. OLS Results
Before we present our preferred IV research design and findings, it is useful to have some
basic understanding of our data and the nature of the variation in both SSRI sales and suicide
15 We were only able to obtain sales data for these drugs back to 1994, and so linearly interpolate annual sales figures for countries for the years between when the country first approved the drug for sale and 1994 (in cases where countries approved the drugs before 1994).
16

mortality across countries over time. As a point of departure, consider the time series of log
suicide rates and SSRI sales per capita for the OECD countries in our sample from 1980 to 2000
(Figure 1). Consistent with the hypothesis that SSRIs may reduce suicide we find a decline in
suicide mortality in this sample of countries starting in the mid-1990s, about when SSRI sales
increase dramatically. However this is something less than definitive proof given the data also
show some changes in suicide mortality early in the period before SSRIs were on the market.16
Some additional insight into what is going on in the data comes from estimating equation
(1), where Yit equal to the natural log of country i’s suicide rate per 100,000 people in year t, and
SSRIit is the number of SSRI pills sold per capita in country i in year t. We control for the share
of the population in different age groups (15-24, 25-34, 35-44, 45-54, 55-64 and 65 and up), an
indicator for whether the country records deaths in that year using the ICD-10 versus -9 system,
and country and year fixed effects di and dt and country-specific linear time trends, Timet×di.17
(1) Yit = a0 + a1 SSRIit + a2 Xit + di + dt + (Timet×di) + v1it
Equation (1) is estimated using population-weighted least squares.18 Estimation without
population weights generates very similar point estimates but, as we would expect, slightly larger
16 The specific increase in the early 1980s observed in Figure 1 is probably driven by changes in suicide in several countries during a period of economic recession. Another contributing factor is the increase in suicide rates in Mexico from extremely low initial levels up closer to international norms, which presumably reflects some declining stigma of suicide in that predominantly Catholic country. 17 The raw data suggested that these country-specific linear terms may be important given differences in trends even before SSRI use became widespread. For example, in Austria the suicide rate declined from 25.4 per 100,000 in 1980 to 23.3 by 1990 and 18.1 by 2001. In contrast, the suicide rate in Mexico increased steadily from 1.4 per 100,000 in 1980 to 3.8 by 2001. The rise in suicide rates over the panel for Mexico may reflect a change in reporting, rather than real patterns of mortality, due to a declining stigma associated with suicide. Other predominantly Catholic countries (Ireland, Spain, Italy) saw similar patterns. 18 The signal-to-noise ratio of country-level suicide rates seems to be higher for larger countries. For example the suicide rate per 100,000 in the U.S. changes modestly year to year (from 1980 to 1985 the annual rate 11.9, 12.0, 12.2, 12.1, 12.4, 12.4). The year-to-year variability is much larger in Luxembourg (12.8, 16.7, 21.3, 21.9, 18.6, and 14.8). Another way to see this comes from dividing countries in our sample up those with populations above versus below the median, then calculating residualized log suicide rates where we take out country-specific linear trends for 1980-2000. The variance of the residuals for large vs. small countries is .06 vs. .12.
17
standard errors. To account for serial correlation we calculate standard errors that are clustered
at the country level [Bertrand et al., 2004].19
Most of the variation in suicide mortality rates is across countries rather than over time.
Country fixed effects account for around four-fifths of the total variation in log suicide rates in
our panel. These persistent differences in suicide rates across countries are thought to be due to
in part to climate, culture, urbanicity, and perhaps differences in data recording practices [Smith
et al., 1995; Goldsmith et al., 2002, Chapter 6]. Country and year fixed effects plus country-
specific linear trends account for 90 percent of the variation in log suicide rates in our panel.
Table 3 shows countries that experienced relatively larger increases in SSRI sales over
our study period also experienced relatively larger declines in suicide. When we regress log
suicide rates against SSRI sales and country and year fixed effects (column 1), an increase in
sales of 1 pill per capita (about 12 percent of the mean 2000 sales levels in our sample) is
associated with a reduction in suicide of around 3.5 percent. Figure 2 provides some additional
intuition about this estimate by plotting for each country the change in log suicide rates from
1980-95 against the change in SSRI sales.20 We can also see the substantial variation in the
growth of SSRI sales across countries. For example SSRI sales increased about twice as much in
the US as in the UK, while by 1995 Japan had not even introduced SSRIs for sale yet. Of course
countries may experience different trajectories in suicide rates for a variety of reasons other than
SSRI sales. The second column of Table 3 shows that controlling for population age structure
19 Hansen [2006] shows that standard errors calculated in this way may be overly conservative compared to more efficient generalized least squares estimates. Since our main IV estimates below are statistically significant with the more conservative approach, we present clustered standard errors throughout the paper for simplicity. 20 Even though we have suicide and SSRI sales data through at least 1999 for all of the countries in our sample, with our IV design described below we lose some country-years’ of data after 1995, and so for consistency in these figures we focus here on the 1980-95 period. Re-doing Figure 2 using data through 1999 yields a similar picture.
18

reduces the magnitude of the point estimate by around one-third. Adding country-specific linear
trends (column 3) has only a modest impact on the magnitude of our point estimate.
The larger concern with these OLS estimates is that SSRI sales may be endogenous to the
conditions that influence suicide. For example, increases in major depressive disorder could
drive up SSRI sales. Since reliable longitudinal, population-level estimates for the prevalence of
severe depressive disorder are not available for our sample of countries, OLS estimates may
understate in absolute value any beneficial effect of SSRIs on suicide. On the other hand,
countries might expedite approval of SSRIs or implement policies designed to improve access to
SSRIs as part of a larger portfolio of efforts designed to improve mental health, in which case
OLS would overstate the protective effects of SSRI on suicide mortality.
Some indication that these concerns may be empirically relevant comes from the fact that
there is much more variation across countries in how quickly they approve SSRIs for public sale
compared to how quickly these countries approve other drugs. The vertical axis in Figure 3
shows the number of years that each country actually had SSRIs for sale as of 1995 (note SSRIs
were first approved for sale anywhere in the world market in 1984).21 The horizontal axis shows
how many years SSRIs would have been on the market as of 1995 if each country had approved
SSRIs as quickly as they approved the other major new drugs introduced in the 1980s (from
Table 2, Statins, PPIs, CCBs, and ACEs). That is, for each country we calculate the average
adoption lag for Statins, PPIs, CCBs and ACES (most countries in our sample approved these
drugs within a year or two of when they were introduced to the world market), and then calculate
each country’s predicted approval date for SSRIs as the year SSRIs first came on the world
21 SSRIs were first sold anywhere in the world in West Germany in 1984, which is dropped from our sample as described in Section III because of the effects of reunification on suicide in Germany plus the difficulty of obtaining reliable data on suicides for East Germany prior to this period.
19

market (1984) plus the country’s average adoption lag for these four other drugs.22 Most
countries in our sample approved these drugs within a year or two of when they were introduced
to the world market. The extra variability in the timing of SSRI approval compared to other
drugs suggests regulators may have had special concerns about these anti-depressant drugs or
about the underlying health problems they are designed to address.
In fact we find some evidence suggesting that countries with increasing suicide rates may
have been quicker to approve SSRIs for public use, as shown in the fourth column of Table 3.
We re-estimate our basic panel-data setup as in equation (1) but now add a set of indicator
variables for each of the five years before SSRIs were first sold in each country. We find that
these pre-SSRI year indicators are jointly significant (p<.01) and become less negative (smaller
in absolute value) as we get closer to the time SSRIs were approved.
One possible concern with this specification check is suggested by Wolfer’s [2006]
observation that in some applications jurisdiction-specific linear trends could pick up un-
modeled dynamic policy responses in addition to picking up differences across areas in pre-
existing trends, which could bias our coefficient estimates for the indicators for pre-SSRI years.
Some protection against this concern comes from the fact that our key explanatory variable of
interest in these OLS models is actual SSRI sales, rather than a simple indicator for SSRIs being
on the market. In any case we obtain similar results when we re-run our specification test
22 There are many cultural and institutional reasons why drug approval times might vary across countries. To take just one example, the U.S. Prescription Drug User Fee Acts (PDUFA) was intended to provide additional resources to FDA to speed up drug approvals by charging drug companies user fees. User fees from drug companies vary considerably – for example the United Kingdom’s Medicine and Healthcare Products Regulatory Agency receives 100% of funding from user fees, while Japan’s Koseisho regulatory agency does not charge any user fees [Berndt et al., 2005]. Sociological factors may also influence patterns of technology adoption. For example, Skinner and Staiger [2005] found that some states in the US consistently adopted effective new technologies, whether hybrid corn, tractors, or heart attack treatments, earlier than other states. They also found that early adoption was closely associated with social capital and state-level 1928 high school graduation rates, but not per capita income, density, or (in the case of Beta Blockers) expenditures on heart attack patients.
20
without country-specific linear trends, or replace the SSRI variable with a series of indicator
variables for the number of years SSRIs were on the market.
It is more difficult to generate a similarly transparent test for the endogeneity of SSRI
sales growth once these drugs are on the market, though there is ample reason to be worried
about simultaneity with trends in SSRI sales and mental health conditions. These conceptual
concerns together with the empirical findings above motivate the IV analysis that follows.
B. Main Findings
Our preferred research design seeks to identify the effect of SSRIs on overall suicide
mortality using just the variation in SSRI sales across countries over time that can be explained
by differences across countries in the timing of when new drugs are approved more generally,
and the general rate at which sales of new drugs increase once they are on the market. The
variation in SSRI sales that can be explained by variation in sales for other drugs is plausibly
orthogonal to pre-existing trends in mental health conditions or mental health treatment
environments across countries. The preferred model is given by the system:
(2) itittiititit vdTimeddXbSSRIbbY 2210 * ++++++= (3) itittiit
kitkit vdTimeddXckPSALEScSSRI 320 *)( ++++++= ∑δ
As in OLS equation (1) Yit represents the log suicide mortality rate per 100,000 in country
i in year t, and SSRIit is the actual SSRI sales (pills per capita) observed in each country each
year. Our instruments, PSALES(k)it, equal the predicted level of sales of SSRIs in country i in
year t in the kth year we predict SSRIs to have been in the market if the country had approved
SSRIs as quickly as the country approved the four other major new drugs introduced in the 1980s
that are not used to treat mental health conditions (Statins, PPIs, CCBs, and ACEs), and then
assuming that the SSRI sales grow each year they are on the market at the same rate as these
21
other drugs. Put differently, our instruments represent the counterfactual SSRI sales pattern we
would have expected in these countries if SSRI sales followed the same introduction and sales
patterns observed for other drugs.
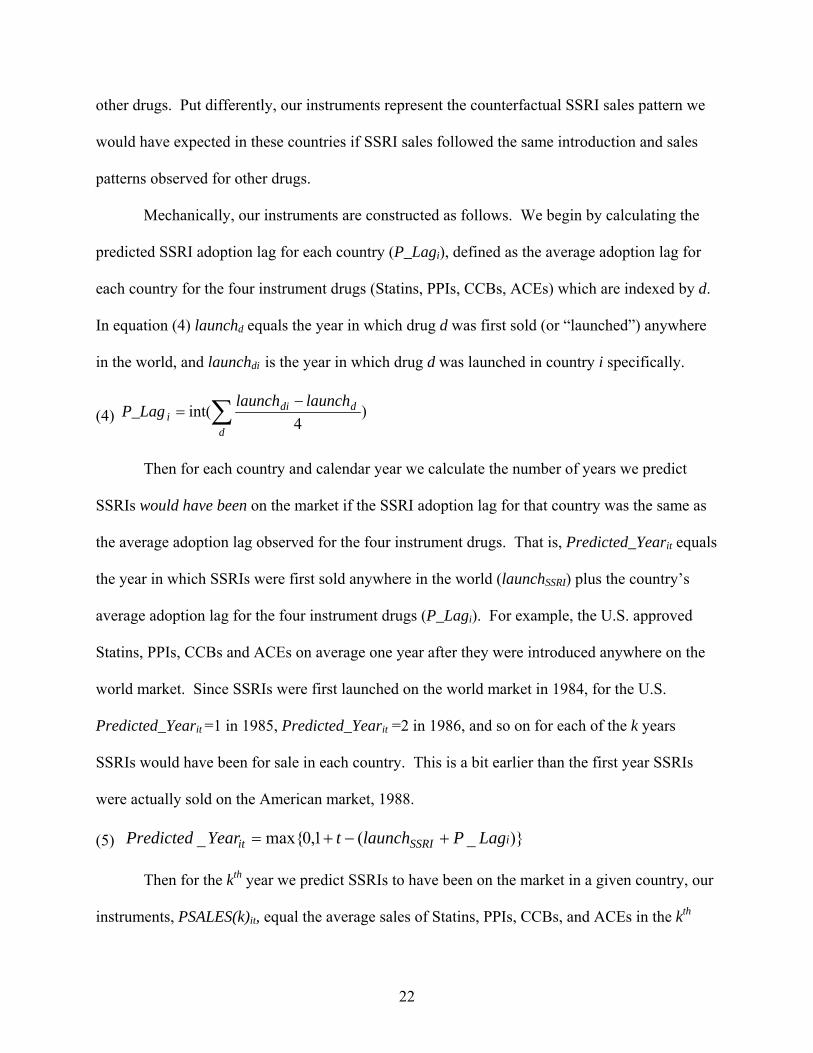
Mechanically, our instruments are constructed as follows. We begin by calculating the
predicted SSRI adoption lag for each country (P_Lagi), defined as the average adoption lag for
each country for the four instrument drugs (Statins, PPIs, CCBs, ACEs) which are indexed by d.
In equation (4) launchd equals the year in which drug d was first sold (or “launched”) anywhere
in the world, and launchdi is the year in which drug d was launched in country i specifically.
(4) ∑ −=
d
ddii
launchlaunchP_Lag )
4int(
Then for each country and calendar year we calculate the number of years we predict
SSRIs would have been on the market if the SSRI adoption lag for that country was the same as
the average adoption lag observed for the four instrument drugs. That is, Predicted_Yearit equals
the year in which SSRIs were first sold anywhere in the world (launchSSRI) plus the country’s
average adoption lag for the four instrument drugs (P_Lagi). For example, the U.S. approved
Statins, PPIs, CCBs and ACEs on average one year after they were introduced anywhere on the
world market. Since SSRIs were first launched on the world market in 1984, for the U.S.
Predicted_Yearit =1 in 1985, Predicted_Yearit =2 in 1986, and so on for each of the k years
SSRIs would have been for sale in each country. This is a bit earlier than the first year SSRIs
were actually sold on the American market, 1988.
(5) )}_(1,0max{_ iSSRIit LagPlaunchtYearPredicted +−+=
Then for the kth year we predict SSRIs to have been on the market in a given country, our
instruments, PSALES(k)it, equal the average sales of Statins, PPIs, CCBs, and ACEs in the kth
22
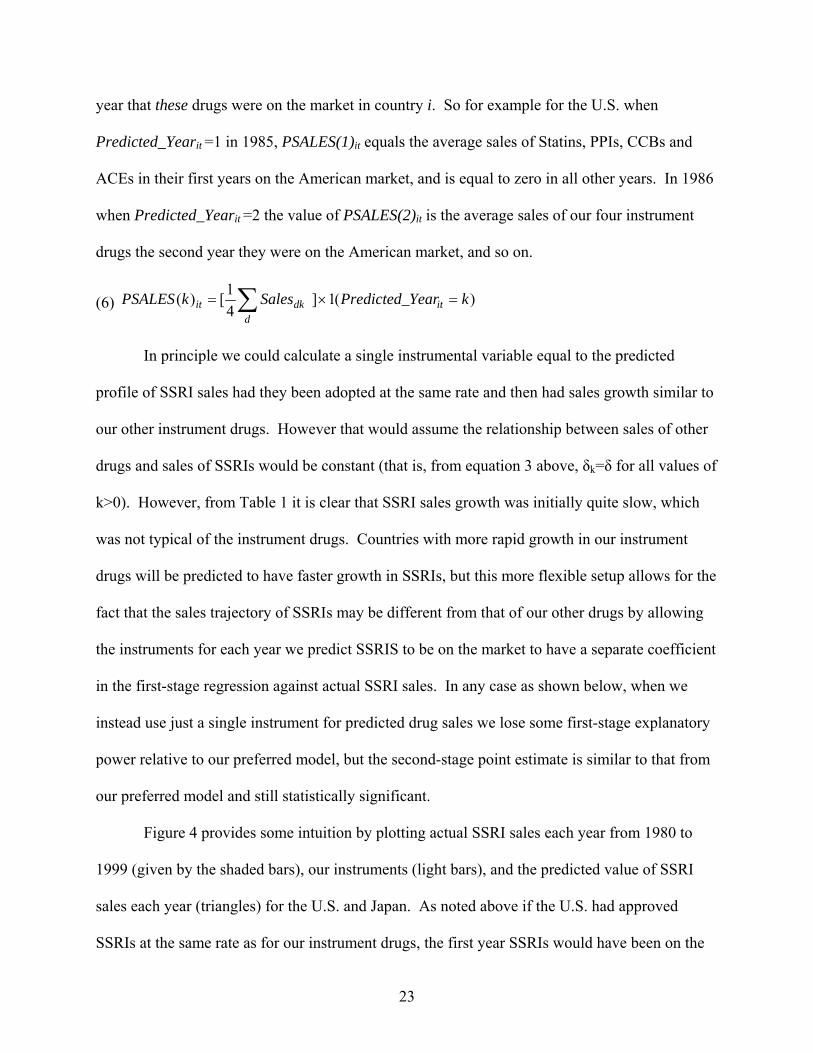
year that these drugs were on the market in country i. So for example for the U.S. when
Predicted_Yearit =1 in 1985, PSALES(1)it equals the average sales of Statins, PPIs, CCBs and
ACEs in their first years on the American market, and is equal to zero in all other years. In 1986
when Predicted_Yearit =2 the value of PSALES(2)it is the average sales of our four instrument
drugs the second year they were on the American market, and so on.
(6) )(1]41[)( kYearPredicted_SaleskPSALES it
ddkit =×= ∑
In principle we could calculate a single instrumental variable equal to the predicted
profile of SSRI sales had they been adopted at the same rate and then had sales growth similar to
our other instrument drugs. However that would assume the relationship between sales of other
drugs and sales of SSRIs would be constant (that is, from equation 3 above, δk=δ for all values of
k>0). However, from Table 1 it is clear that SSRI sales growth was initially quite slow, which
was not typical of the instrument drugs. Countries with more rapid growth in our instrument
drugs will be predicted to have faster growth in SSRIs, but this more flexible setup allows for the
fact that the sales trajectory of SSRIs may be different from that of our other drugs by allowing
the instruments for each year we predict SSRIS to be on the market to have a separate coefficient
in the first-stage regression against actual SSRI sales. In any case as shown below, when we
instead use just a single instrument for predicted drug sales we lose some first-stage explanatory
power relative to our preferred model, but the second-stage point estimate is similar to that from
our preferred model and still statistically significant.
Figure 4 provides some intuition by plotting actual SSRI sales each year from 1980 to
1999 (given by the shaded bars), our instruments (light bars), and the predicted value of SSRI
sales each year (triangles) for the U.S. and Japan. As noted above if the U.S. had approved
SSRIs at the same rate as for our instrument drugs, the first year SSRIs would have been on the
23

market in America would have been 1985, instead of the actual year of 1988. The height of the
light bar for the U.S. in 1985 represents the value of PSALES(1)it for the U.S. in 1985 (i.e. the
average sales level of our four instrument drugs the first year they were on the American
market), while the height of the light bar for 1986 is the value of PSALES(2)it for that year. The
top panel of Figure 4 shows that the sales trajectory for the four instrument drugs in America was
steeper in the early years after they were on the market compared to the sales trajectory for
SSRIs, which is reflected in the predicted SSRI sales value that we calculate from our first stage.
The bottom panel of Figure 4 shows that Japan is generally a bit slower than the U.S. in
approving new drugs [Currie, 1993] but still approved our four instrument drugs on average
within two years of their introduction anywhere in the world market. However Japan was much
slower in approving SSRIs for sale, and in fact did not approve SSRIs for sale until 1999 – fully
15 years after they first came on the world market.23 Comparing the top and bottom panels of
Figure 4 also highlights the fact that most of the variation with our instruments will come from
differences across countries in the rate of drug sales growth once new drugs are on the market,
rather than differences in the timing of when new drugs are generally are first introduced for sale
in our countries. This also follows logically from the evidence in Figure 3 showing that most
countries in our panel are relatively rapid adopters of new drugs, and so there is relatively little
variation across our sample in the predicted date of SSRI adoption.
The first column of Table 4 shows our first-stage coefficients, which are positive as
expected – countries with higher rates of growth in new drugs in general have higher rates of
growth in SSRI sales as well. The first-stage F-test on our excluded instruments is equal to 29.2
23 Why approval of SSRIs was so delayed in Japan is not clear, but the stigma associated with depression is especially severe in Japan [Desapriya and Nobutada, 2002]. The eventual approval of SSRIs in 1999 may have been hastened by industry pressure [Kubota, 1997], or by an exceptional 50% increase in suicide rates during the 1990s, a period when virtually all the developed world saw suicide rates fall [Koo and Cox, 2006].
24
(p<.01). Given that we have a relatively large number of instruments (15), Hansen, Hausman
and Newey [2005] suggest that the concentration parameter may be a better indicator for first-
stage explanatory power, which in our case is equal to 15×(F-1)=422.9. Hahn and Hausman
[2002] suggest an alternative test for weak instruments that is essentially based on a comparison
of IV estimates run “forward” versus “backward” (i.e. switching the dependent variable and
endogenous explanatory variable, then rescaling the latter appropriately). If the two sets of
estimates are significantly different then 2SLS may be inappropriate, although in our application
we do not reject this null hypothesis at the usual 5 percent cutoff.
The second column of Table 4 shows that the IV estimates from our second-stage
equation suggest that an increase of 1 SSRI pill per capita reduces suicide rates by around 5
percent, which is statistically significant at the usual cutoff. That our preferred IV estimate is
somewhat larger in absolute value compared to the naïve panel-data estimates shown in Table 3
is consistent with the idea that variation in actual SSRI sales may be driven in part by worrisome
trends within these countries with respect to suicide mortality or negative mental health
conditions generally, although a standard Hausman test [1978] shown in the last row of the table
does not allow us to quite reject the null hypothesis that our OLS and IV estimates are equal
(p=.11). For purposes of interpretation, a one pill per capita increase in SSRI sales represents
about a 12 percent increase over the average 2000 sales level across our sample of countries. An
increase of one pill per capita also represents a 41 percent increase over average sales over our
entire sample period, so that the estimated elasticity of suicide with respect to SSRI sales implied
by the results in Table 4 is equal to around -.12.24
24 When we replicate our IV estimates and include indicator variables for each of the five years before we predict SSRIs to first be sold in each country, we find these indicators are not statistically significant. However this is not a very powerful test because there is so little variation across our countries in the predicted timing of when SSRIs
25

C. Sensitivity Analyses
In general our results seem fairly robust to alternative model specifications and changes
in our analytic sample. For example our findings are not driven by the experiences of just a few
outlier countries. This is easiest to see from a visual inspection of the difference-in-difference
analog to our preferred IV estimates (Figure 5). The horizontal axis shows the change in the
predicted value of SSRI sales from 1980 to 1995 for each country from equation (4) above,
while the vertical axis shows the simple change in log suicide rates over the same period. The
simple bi-variate relationship between change in log suicide rates and change in predicted SSRI
sales is negative, consistent with the results of our preferred IV analysis, and does not visually
appear to be driven by the experiences of outlier countries. More formally in Table 5 we re-
estimate our preferred IV model excluding different countries that Figure 5 suggests might exert
special leverage over the regression line (namely the U.S., Mexico, and Japan) and obtain similar
results. The second column of Table 5 shows that qualitatively similar results hold when we
restrict the analytic sample just to member nations of the OECD in our sample.
The remainder of Table 5 shows the results are qualitatively similar to a variety of other
changes in our estimation approach, including dropping country-year observations in the late
1980s when SSRI sales were imputed, excluding our controls for population age structure and
ICD-10 coding, or adding in controls for each country’s unemployment rate and/or real GDP per
capita. Our panel is a bit unbalanced because the amount of data available on our instrument
drugs varies a bit across years,25 but replicating our analysis on a balanced panel using data just
would first be sold if each country’s adoption lag for SSRIs was similar to the average adoption lag for Statins, PPIs, CCBs and ACEs. 25 We have sales data through at least 1999 for all countries, and for a few additional years for a sub-set of our sample. In addition because there is a bit of variation across countries in when they approved our four instrument drugs for sale the number of years-on-the-market for which we can calculate our instruments will vary slightly across countries. As a result our standard IV estimates drop some country-year observations in the late 1990s.
26

through 1997 yields similar results. While our main estimates weight by country population, the
un-weighted point estimate is similar although somewhat less precisely estimated. Re-
calculating the estimates using actual rather than logged suicide rates yields a point estimate of -
.24, which given an average suicide rate of 10.2 in our panel (Table 1) implies that an increase in
SSRI sales of 1 pill per capita reduces suicide by around -2.5%, about half the size of the log
specification and now no longer statistically significant. However given the substantial
differences in suicide levels across countries described above a log-linear model that estimates
SSRI impacts in proportional rather than absolute terms seems preferable.
Our preferred model uses separate instruments for each of the (k) years drugs are on the
market to allow the shapes of the trajectories of sales growth for our instrument drugs to differ
from the trajectory of SSRI sales (consistent with inspection of Figure 4). When we restrict the
first-stage coefficient of other drug sales on SSRI sales to be the same regardless of how long
drugs have been on the market (i.e., we replace our series of variables for other drug sales in the
kth year they are on the market with a single linear term for other drug sales), the first-stage
explanatory power of our instrument set declines (F=21.2, versus 29.2 in our preferred model).
One result is that as shown in Table 5 the standard error around our second-stage estimate is
almost twice as large as with our preferred model. In any case the point estimate is still
statistically significant, and slightly larger compared to the preferred model (-.085 versus -.05).26
Implicit in our IV design is the notion that there is some “usual” way that new drugs are
approved and sold within a country. Consistent with this assumption we find that the adoption
lags across the OECD countries in our sample for our four instrument drugs are all highly
26 With the simpler linear instrument the second-stage estimates are also sometimes more sensitive to changes in the sample or model specification. For instance if we drop controls for population age structure from the model with the linear instrument setup the size of the second-stage point estimate for SSRI sales is hardly affected (-.076 versus -.085), but the standard error increases substantially (from -.034 to -.056) and so the second-stage estimate is no longer statistically significant.
27

correlated (between +.8 and +.9). If we regress actual sales values for our instrument drugs
against one another using our panel of country-level data the R-squared values are usually on the
order of .5 to .6. Another way to see this is by constructing new versions of our instruments that
use separately each of the four instrument drugs (Statins, CCBs, ACEs and PPIs). The first
column of Table 5 shows that in our full sample the estimates using Statins, ACEs, and PPIs
range from -.03 to -.045, close to our preferred IV estimate of -.05. The outlier comes from
using CCBs alone to construct our instruments, which seems to be driven in part by the fact that
CCBs were a smash success in Japan, with CCB sales levels that are much higher than in any
other country (and also much higher than those of our other drugs in Japan for that matter). CCB
sales will thus have more limited power to explain growth in SSRI sales because Japan has
unusually high CCB sales but unusually low SSRI sales (given its late adopter status). When we
restrict our sample to just OECD countries (column 2 of Table 5), the Japan effect in distorting
the first stage with the CCB instruments is even more pronounced.
D. Additional Specification Tests
Perhaps the main concern with our IV estimates is the possibility that countries where
new drug sales generally increase more rapidly also experience more pronounced improvements
in other health services or health characteristics compared to slow-drug-sales countries. One
way we try to address this concern is to include in our baseline specification both country fixed
effects and country-specific linear trends, but this may be an imperfect fix.
One way to address this general concern is to examine whether our IV design suggests a
relationship between predicted SSRI sales and other causes of death that should not be causally
affected by SSRI treatment. This sort of falsification test might be more informative still if we
focus on causes of death that should also not be substantially affected by drug treatments of any
28

type, since our basic IV design comes from comparing countries with relatively high and low
rates of growth in new drugs more generally. One natural candidate is accidents, which are
substantially affected by changes in individual behavior and non-medical technologies
(automotive and transport safety, workplace safety) rather than changes in drug treatments. The
estimated coefficient for the “effect” of SSRI sales on the log of accident mortality rates is equal
to -.0108 (se=.0269), which is not statistically significant and much smaller in absolute value
than our estimate for the effect of SSRIs on suicide.
Another falsification check for the validity of our IV design is to examine whether
countries that are predicted to have high- versus low rates of growth in SSRI sales experience
different suicide trends before SSRI use became widespread in the 1990s. The top panel of
Figure 6 shows there is almost no relationship between the predicted growth in SSRI sales for
our countries during the period 1990-95 when SSRI use became common with the rate of change
in log suicide rates during the previous period from 1980-90 (the slope of the regression line is
equal to -.005). In contrast there is a pronounced negative relationship between the change in log
suicide rates from 1990-95 with the predicted change in SSRI sales over this period (the slope is
-.04, quite close to our formal IV estimate, and significant at the usual cutoff).27
While these two falsification checks provide at least some reassurance that our IV
estimates are not being driven by differences across countries in general improvements to their
health systems, a more subtle concern arises from the possibility of confounding with trends in
sales of other anti-depressant drugs besides SSRIs. Specifically TCA anti-depressant drugs were
on the market in most countries for decades before the introduction of SSRIs. In addition in the
mid to late 1990s another class of anti-depressants was introduced, the serotonin-norepinephrine
27 If we regress change in log suicide rates 1980-85 against change predicted SSRI sales 1990-95 the coefficient is equal to -.012, while using as the dependent variable the 1985-90 change in log suicide rates the coefficient is +.009.
29

reuptake inhibitors (SNRIs), which as their name suggests act on two neurotransmitters
(serotonin and norepinephrine) rather than just one as with SSRIs.
There are several reasons to believe that our IV estimates are not confounding the effects
of SSRI sales with those of either TCAs or SNRIs. First, Figure 7 shows that SSRI sales account
for most of the global increase in anti-depressant sales over the period from 1995 (the first year
for which we could obtain global antidepressant sales figures) to 2004. Ludwig and Marcotte
[2005] show that TCA sales were relatively flat in the U.S., and the same appears to be true
worldwide given little trend in non-SSRI anti-depressant sales in Figure 7 until the late 1990s
when SNRI sales began to increase. Changes in SNRI sales are unlikely to be driving our IV
estimates for the effects of SSRIs in part because they do not represent a major technological
change in the treatment of depression compared to SSRIs. But more importantly Figure 7 shows
that SNRI sales did not begin to substantially increase until the late 1990s, while Table 5 shows
that our IV estimates for the effects of SSRIs on suicide are not much affected by using data only
through 1997. Another way to see this comes from re-estimating our model dropping country-
year observations in which SSRIs accounted for less than 90 percent of total anti-depressant
sales.28 The point estimate and standard error (-.0514, 0.190) are similar to our baseline model.
E. Extensions
Much of the concern about SSRI use by government regulators has focused on age
heterogeneity in drug impacts, since the initial UK and US warnings focused on pediatric use of
these drugs. Unfortunately we cannot obtain country-level data on SSRI sales for demographic
subgroups defined by either gender or age. However we can at least measure suicide rates
separately for these subgroups. Regressing country-level SSRI sales against age-specific suicide
28 On average for the countries in our sample SSRIs accounted for 96.5 percent of antidepressant sales even after 2000. A small number of countries saw the market share of SSRIs fall below 90 percent, to 86 percent by 2001 (the U.S., the U.K., Norway, Spain, Mexico, Japan, and Australia).
30
mortality rates will identify the age-specific impacts under the perhaps strong assumption that
the relative trends across countries in SSRI sales are similar for all age groups and by gender.
This assumption may not hold in practice, so our sub-group estimates should be taken as only
suggestive. Nevertheless given the limitations of RCTs in their ability to identify SSRI impacts
on suicide mortality we think even these exploratory results might be of some policy value.
With these important caveats in mind, Table 6 shows that the IV point estimates are
larger in proportional terms for females than males, although since the baseline suicide mortality
rate in our data is about three times as high for males as for females (Table 1) the estimated
association between SSRIs and suicide in absolute terms (deaths per 100,000) will be somewhat
larger for males than females. When we disaggregate the suicide data by age, we find the
estimated relationship between SSRI sales and suicide mortality is largest in both proportional
and absolute terms for people ages 15-24, consistent with evidence that the largest increase in
antidepressant prescriptions at least in the U.S. has been among adolescents and young people
[Zito et al., 2003; American Academy of Adolescent and Child Psychiatry, 2001].
VI. CONCLUSIONS
Understanding the effects of SSRI antidepressants on suicide is important for government
regulators as well as for doctors, patients, and the family and friends of those suffering from
severe depression. It is unlikely that randomized clinical trials (RCTs) will ever be able to
identify the effects of SSRIs on suicide mortality, both because of small samples and because
these samples exclude those at highest risk for suicide. Previous clinical trials instead focus on
measures of non-lethal “suicidal behavior,” but the association between these indicators and
actual suicide mortality remains unclear. Moreover the conditions under which subjects in RCTs
31

use SSRI drugs (for example level of physician monitoring) may differ from the usual
community standard of care.
In light of these practical and ethical constraints, we must turn to population-based
observational studies to adequately identify the effects of SSRIs on suicide completion rates. We
believe our study represents a substantial improvement over previous research by using
population-level data together with a plausibly exogenous source of identifying variation in SSRI
use. Specifically we use just the variation in SSRI sales across countries over time that can be
explained by how quickly these countries adopt new drugs in general, and the rate at which sales
increase for these new drugs once they are on the market.
Our results are consistent with the hypothesis that the net effect of the introduction and
subsequent sales of SSRIs is to reduce death by suicide. We find that increase in SSRI sales of 1
pill per capita per year (about a 12% increase over 2000 sales levels) is associated with a decline
in suicide mortality of around 5%. This IV estimate is about twice as large in absolute value as
OLS estimates, consistent with our general concern that both the timing of SSRI approval and
the rate at which SSRI sales increase over time may be endogenous to what is happening with
mental health and suicide within countries. We also demonstrate that that we estimate no
relationship between SSRI sales and accident deaths, which should not be affected by SSRI use,
and that there is little relationship between trends across countries in log suicide rates over the
course of the 1980s and predicted SSRI sales growth in the 1990s.
Note that the impact we estimate here is the average effect from expanding SSRI sales in
our sample of countries during the years after these drugs were first introduced to the public. If
SSRI treatment went first to those who would benefit the most, or if markets are now becoming
saturated, additional expansions of SSRI sales may have somewhat smaller impacts on suicide
32

mortality than our IV estimates would suggest. However it is possible the difference between the
average effect implied by our estimates and the effects arising from further expansions in SSRI
use might be modest, given the relatively low rates of current mental health treatment even in
very wealthy countries like the U.S.
Our estimates suggest that on balance SSRIs may be a very cost-effective means for
saving lives, which is important in part because data from the National Comorbidity Survey from
2001-3 suggest that only around 40 percent of people with severe mental health disorders were
receiving any treatment [Kessler, Demler et al., 2005]. Commonly used SSRIs can currently be
obtained in the United States for around $0.10 per pill. Our estimates thus imply that each
additional $20,000 spent on SSRIs will avert one suicide completion, far below the cost per life
saved from most other public health, regulatory, or other forms of government intervention. But
using this estimate in a more formal benefit-cost analysis raises difficult conceptual and
normative questions about the appropriate way to value the life of someone who subjectively
prefers death (at least at the time of the intervention). If SSRIs reduce the risk of suicide by
reducing access to a method of self harm, then the suicidal person may or may not experience a
switch to SSRIs as a net benefit, depending on the transience or permanence of their state of
pain. On the other hand if SSRIs reduce the risk of suicide by improving the subjective utility of
life, then persons at risk for suicide and their loved ones may have a considerable willingness to
pay for such an intervention.29 Of course SSRIs also generate other benefits beyond their net
effects on mortality that should be counted in this calculus, including improvements in mood,
health status, functioning, and productivity.
29 Another complication arises from the possibility that those effectively treated this year may attempt suicide at some point in the future. While the data here are not as strong as we would like there is some suggestion in the literature that many persons treated for an episode of major depression do not have recurring episodes.
33

One important limitation of our study is that we are estimating the average effect of
expansions in SSRI use on overall suicide mortality rates. Previous medical studies have raised
special concerns about drug impacts on certain patient sub-groups. We provide suggestive
evidence that the effects of SSRI use on suicide mortality might have, if anything, even more
beneficial impacts for younger people (15-24), the age group that has been a particular focus of
recent government warnings in the U.S. and U.K. However this finding should be qualified by
the observation that we can measure suicide mortality separately for specific age groups but we
cannot disaggregate by age country-level sales of SSRIs. Moreover our data are not at all
informative about sub-group effects on patients by pre-existing mental health status, which is
important in light of the view by some researchers that any effect of SSRIs to worsen mood
might be particularly pronounced among some patients – for example, those with undiagnosed
bipolar disorder. Understanding more about heterogeneity in SSRI effects on different types of
patients remains arguably the top priority for future research in this area.
34
REFERENCES
Akerlof, George A., William T. Dickens, and George L. Perry. 2000. “Near-rational wage and price setting and the long-run Phillips curve.” Brookings Papers on Economic Activity. 1: 1-60.
American Academy of Child and Adolescent Psychiatry. 2001. Practice parameter for the assessment and treatment of children and adolescents with suicidal behavior, Journal of the American Academy of Child and Adolescent Psychiatry. 40(suppl7):24S-51S.
Anderson, RN, AM Minino, DL Hoyert, HM Rosenberg. 2001. Comparability of Cause of Death Between ICD-9 and ICD-10: Preliminary Estimates. National Vital Statistics Reports, 49(2), May 18, 2001. Atlanta, GA: U.S. Department of Health and Human Services, Centers for Disease Control and Prevention.
Baldessarini, Ross J. 2005. Drug therapy of depression and anxiety disorders. In Goodman and Gilman’s The Pharmacological Basis of Therapeutics, 111th Ed.. Edited by LL Brunton, JSLazo, and KL Parker. NY: McGraw-Hill. Pp. 429-459.
Baldessarini, Ross J., Maurizio Pompili, and Leonardo Tondo. 2006a. Suicidal Risk in Antidepressant Drug Trials. Archives of General Psychiatry. 63: 246-8.
Baldessarini Ross J, Maurizio Pompili, and Leonardo Tondo .2006b. Suicide in bipolar disorder: Risks and Management. CNS Spectr. 11(6): 465-71.
Barbui C, Campomori A, D’Avanzo B, Negri E, Garattini S. 1999. Antidepressant drug use in Italy since the introduction of SSRIs: national trends, regional differences and impact on suicide rates. Soc Psychiatry Psychiatr Epidemiol. 34: 152-156.
Beasley CM, Dornseif BE, Bosomworth JC, Sayler ME, Rampey AH, Heiligenstein JH, Thompson VL, Murphy DJ, Masica DN. 1991. Fluoxetine and suicide: a meta-analysis of controlled trials of treatment for depression. British Medical Journal. 303: 685-692.
Berndt, Ernst R., Adrian H.B. Gottschalk, Tomas J. Philipson, and Matthew W. Strobeck. 2005. Industry Funding of the FDA: Effects of PDUFA on Approval Times and Withdrawal Rates. Nature Reviews, Drug Discovery. 4: 545-554.
Bertand, M, E. Duflo, and S. Mullainathan. 2004. How Much Should We Trust Differences-in-Differences Estimates? Quarterly Journal of Economics. 119(1): 249-275.
Carey, Benedict. 2006. “Panel to debate antidepressant warning. New York Times. December 13. p. A26.
Carpenter, Daniel P. 2002. “Groups, the Media, Agency Waiting Costs, and FDA Drug Approval.” American Journal of Political Science. 46(3): 490-505.
Cook, Philip J. and Jens Ludwig. 1996. Guns in America: Results of a Comprehensive National Survey on Firearm Ownership and Use. Washington, DC: Police Foundation.
Cook, Philip J. and Jens Ludwig, 2000. Gun Violence: The Real Costs. NY: Oxford University Press.
Currie, J. and M. Stabile, 2004. Child Mental Health and Human Capital Accumulation: The Case of ADHD. NBER Working Paper 10435.
Currie, J. and M. Neidell. 2005. Air pollution and infant health: what can we learn from California’s recent experience? Quarterly Journal of Economics. 120(3), pp. 1003-1030.
Currie, W.J. 1993. Drug development and registration in Japan: Threshold of transition. Journal of Clinical Pharmacology. 33(2), pp. 100-108.
35

Cutler, David, Edward L. Glaeser, and Karen Norberg. 2001. Explaining the rise in youth suicide, in J. Gruber, ed., Risky Behavior Among Youths: An Economic Analysis, Chicago: University of Chicago Press, pp. 219-269.
Dahlberg, M., and K. Lundin. 2005. Antidepressants and the suicide rate: Is there really a connection? Upsulla University (Sweden) Economics Department, Working Paper 2005:4.
Desapriya, E.B.R., and I. Nobutada. 2002. Stigma of mental illness in Japan. The Lancet. 359(9320): 1866.
Deyo, Richard A. 2004. Gaps, Tensions, and Conflicts in the FDA Approval Process: Implications for Clinical Practice. JABFP. 17(2): 142-149.
Dranove, David and David Meltzer, 1994. Do Important Drugs Reach the Market Sooner? RAND Journal of Economics. 25(3): 402-423.
Duggan, Mark. 2003. Guns and suicide. In Evaluating Gun Policy, Ed. Jens Ludwig and Philip J. Cook. Washington, DC: Brookings Institution Press. pp. 41-73.
Fergusson, D., S Doucette, KC Glass, S Shapiro, D Healy, P Hebert, and B Hutton, 2005. Association between suicide attempts and selective serotonin reuptake inhibitors: systematic review of randomized controlled trials. British Medical Journal. 330: 396-402.
Flechtner KM, Wolf T, and Priebe S. 1995. The feasibility of suicide rates as an evaluation criterion in community psychiatry: Methodological problems. J. Psychiatr. Res. 29(6): 481-6.
Food and Drug Administration, 2003. FDA Statement Regarding the Anti-Depressant Paxil for Pediatric Population. FDA Talk Paper T03-43, June 19, 2003. www.fda.gov/bbs/topics/ANSWERS/2003/ANS01230.html
Food and Drug Administration, 2004. FDA Public Health Advisory: Worsening Depression and Suicidality in Patients Being Treated with Antidepressant. www.fda.gov/cder/drug/antidepressants/AntidepressanstPHA.htm
Food and Drug Administration, 2005. FDA Public Health Advisory: Suicidality in Adults Being Treated with Antidepressant Medications. http://www.fda.gov/cder/drug/advisory/SSRI200507.htm
Food and Drug Administration, 2006. Memorandum for December 13 Meeting of Psychopharmacologic Drugs Advisory Committee.
http://www.fda.gov/ohrms/dockets/ac/06/briefing/2006-4272b1-01-FDA.pdf Frank, Richard G. and Thomas G. McGuire, 2000. Economics and Mental Health. Handbook of
Health Economics. Joseph P. Newhouse and A. Cuyler, Eds. Amsterdam: North Holland.
Gibbons, RD, K Hur, DK Bhaumik, and JJ Mann. 2005. The relationship between antidepressant medication use and rate of suicide. Archives of General Psychiatry. 62 (Feb): 165-172.
Gibbons, RD, K Hur, DK Bhaumik, JJ Mann. 2006. The relationship between antidepressant prescription rates and rate of early adolescent suicide. American Journal of Psychiatry. 163(11): 1-7.
Gleitman, Henry. 1996. Basic Psychology. Norton. Goldsmith SK, Pellmar TC, Kleinman AM, Bunney WE. 2002. Reducing Suicide: A National
Imperative. Washington, DC: National Academies Press. Goode, E. 2003. British Warning on Antidepressant Use for Youth. The New York Times.
December 11, 2003. p. A1.
36

Green B. 2003. Focus on paroxetine. Curr Med Res Opin. 19(1): 13-21. Guze BH. 1996. Selective serotonin reuptake inhibitors: Assessment for formulary inclusion.
Pharmacoeconomics. 9: 430-442. Hahn, Jinyong and Jerry Hausman. 2002. A new specification test for the validity of instrumental
variables. Econometrica. 70(1): 163-189. Hall, WD, Mant, A. Mitchell, PB, Rendle V.A., Hickie, IB, and McManus, P, 2003. Association
Between Antidepressant Prescribing and Suicide in Australia, 1991-2000: Trend Analysis. British Medical Journal. 326: 1008-1013.
Hamermesh, D.S., and N.M. Soss. 1974. An Economic Theory of Suicide, Journal of Political Economy, pp. 83-98.
Hammad, Tarek A., Thomas Laughren, and Judith Racoosin, 2006. Suicidality in Pediatric Patients Treated with Antidepressant Drugs. Archives of General Psychiatry. 63: 332-9.
Hansen, Christian B. (2006) Generalized least squares inference in panel and multilevel models with serial correlation and fixed effects. Working Paper, University of Chicago Graduate School of Business.
Hansen, Christian B., Jerry Hausman, and Whitney Newey, 2005. Estimation with Many Instrumental Variables. Working Paper, University of Chicago Graduate School of Business.
Hansen V, Jacobsen BK, and Arnesen E. 2001. Cause-specific mortality in psychiatric patients after deinstitutionalization. British Journal of Psychiatry. 179: 438-43.
Hausman, J. 1978. Specification tests in econometrics. Econometrica. 46: 1251-71. IMS Health, National Prescription AuditTM Plus, 1/2006 http://www.imshealth.com Isacsson, G. 2000. Suicide prevention – a medical breakthrough? Acta Psychiatr Scand. 102:
113-117. Joyce PR, Mulder RT, Luty SE, McKenzie JM, Rae AM, 2003. A differential response to
nortriptylkine and fluoxetine in melancholic depression: The importance of age and gender. Acta Psychiatrica Scandinavica. 108(1): 20-3.
Jureidini, JN, CJ Doecke, PR Mansfield, MM Haby, DB Menkes, and AL Tonkin, 2004. Efficacy and safety of antidepressants for children and adolescents. British Medical Journal, 328: 879-83.
Jurrlink, David N., Muhammad M. Mamdani, Alexander Kopp, Donald A. Redelmeier. 2006. The risk of suicide with selective serotonin reuptake inhibitors in the elderly. American Journal of Psychiatry. 163(5): 813-821.
Kahneman, Daniel and Amos Tversky. 1979. “Prospect theory: An analysis of decision under risk.” Econometrica. 47(2): 263-92.
Kaitin, KI, NR Phelan, D Raiford, and B Morris, 1991. Therapeutic Ratings and End-of-Phase II Conferences: Initiatives to Accelerate the Availability of Important New Drugs. Journal of Clinical Pharmacology. 31: 17-24.
Kessler, Ronald C., Patricia Berglund, Olga Demler, Robert Jin, Kathleen R. Merikangas, and Ellen E. Walters, 2005. Lifetime Prevalence and Age-of-Onset Distributions of DSM-IV Disorders in the National Comorbidity Survey Replication. Archives of General Psychiatry. 62: 593-604.
Kessler, Ronald C., Olga Demler, Richard G. Frank, Mark Olfson, Harold Alan Pincus, Ellen E. Walters, Philip Wang, Kenneth B. Wells and Alan M. Zaslavsky, 2005. Prevalence and Treatment of Mental Disorders, 1990 to 2003. New England Journal of Medicine. 352(24): 2515-23.
37

Khan A, Khan SR, Leventhal RM, Brown WA. 2001. Symptom reduction and suicide risk in patients treated with placebo in antidepressant clinical trials: A replication analysis of the Food and Drug Administration database. International Journal of Neuropsychopharmocology. 4(2): 113-118.
Khan A, Warner HA, Brown WA. 2000. Symptom reduction and suicide risk in patients treated with placebo in antidepressant clinical trials: An analysis of the Food and Drug Administration database. Archives of General Psychiatry. 57(4): 311-317.
Klein DF 2000. Flawed meta-analysis comparing psychotherapy with pharmacotherapy. American Journal of Psychiatry. 157(8): 1204-11.
Koo, J, and W.M. Cox. 2006. An economic interpretation of suicide cycles in Japan. Federal Reserve Bank of Dallas, forthcoming in Contemporary Economic Policy.
Kreitman, N. 1976. The coal gas story. British Journal of Preventative Social Medicine. 30: 86-93.
Kubota, C. 1997. US presses Japan to “cure” ailing health care system. Journal of Commerce. Sept.22. p. 4A.
Kunreuther, Howard. 1978. Disaster insurance protection: Public policy lessons. Wiley. Lawrenson RA, Tyrer F, Newson RB, Farmer RD. 2000. The treatment of depression in UK
general practice: Selective serotonin reuptake inhibitors and tricylic antidepressants compared. Journal of Affective Disorders. 59(2): 149-157.
Ludwig, J, Cook PJ. 2000. Homicide and Suicide Rates Associated with Implementation of the Brady Handgun Violence Prevention Act. JAMA. 284(5): 585-591.
Ludwig, J. and D. Marcotte. 2005. Anti-depressants, Suicide and Drug Regulation. Journal of Policy Analysis and Management. 24: 249-72.
Mallick R, Chen J, Entsuah AR, Schatzberg AF. 2003. Depression-free days as a summary measure of the temporal pattern of response and remission in the treatment of major depression: a comparison of venlafaxine, selective serotonin reuptake inhibitors, and placebo. Journal of Clinical Psychiatry. 64(3): 321-30.
March J, Silva S, Petrycki S, Curry J; Wells K, Fairbank J, Burns B, Domino M, McNulty S; Vitiello B, and Severe J. 2004. Fluoxetine, cognitive-behavioral therapy, and their combination for adolescents with depression: Treatment for Adolescents With Depression Study (TADS) randomized controlled trial. JAMA, 292: 807-20.
Marcotte, DE. 2003. The economics of suicide, revisited, Southern Economic Journal. 69(3): 628-643.
Marcotte, DE, and V. Wilcox-Gök. 2001. The employment and earnings costs of mental illness: recent developments in the United States. Social Science and Medicine 53(1): 21-27.
Ohberg A, Vuori E, Klaukka T, Lonnqvsit J. 1998. Antidepressants and suicide mortality. Journal of Affective Disorders. 50: 225-233.
Pearson, JL., B. Stanley, C. King, and C. Fisher. 2001. Issues to consider in intervention research with persons at high risk for suicidality, National Institute for Mental Health. http://www.nimh.nih.gov/SuicideResearch/highrisksuicide.cfm (Accessed Dec 15, 2005).
Peltzman, Sam. 1975. “The effects of automobile safety regulation.” Journal of Political Economy. 83(4): 677-726.
Rihmer, Z, Belso N, Kalmar S. 2001. Antidepressants and suicide prevention in Hungary. Acta Psychiatr Scand. 103: 238-239.
38

Robinson, WS. 1950. Ecological correlations and the behavior of individuals. American Sociological Review. 15(3): 351-357.
Rosenthal, Robert W. 1993. Suicide attempts and signaling games. Mathematical Social Sciences. 26(1): 25-33.
Ryan, ND. 2003. Medication treatment for depression in children and adolescents. CNS Spectr. 8(4): 283-7.
Salzer MS, Kaplan K, Atay J. 2006. State psychiatric hospital census after the 1999 Olmstead decision: Evidence of decelerating deinstitutionalization. Psychiatric Services. 57(10): 1501-4.
Skinner J. and Staiger, D. 2005. Technology Adoption from Hybrid Corn to Beta Blockers. NBER working paper #11251. National Bureau of Economic Research, Cambridge, MA
Smith, G.S., J.A. Langlois, and I.R.H. Rockett. 1995. International comparisons of injury mortality. Current Problems in Producing Comparable International Mortality and Morbidity Statistics. (Altanta, GA: U.S. CDC).
Thorpe K.E., C.S. Florence, and P. Joski (2004). “Which Medical Conditions Account For The Rise In Health Care Spending?” Health Affairs. DOI 10.1377/hlthaff.W4.437
Trindade E., Menon D., Topfer L., and Coloma C. 1998. Adverse effects associated with selective serotonin reuptake inhibitors and tricyclic antidepressants: a meta-analysis. CMAJ. 159:1245-52
United Kingdom Department of Health. 2003. “Seroxat Must Not Be Used for the Treatment of Children with Depression.” Press Release 2003/0223, June 20th. www.info.doh.gov.uk/doh/intpress.nsf/page/2003-0223?OpenDocument accessed August 13, 2003.
U.S. Department of Health and Human Services: National health expenditures aggregate amounts and average annual percent change, by type of expenditure: selected calendar years 1960-2002. Accessed March 20, 2006. Web Page. Available at: http://www.cms.hhs.gov/NationalHealthExpendData/
Vaswani M, Linda FK, Ramesh S, 2003. Role of selective reuptake inhibitors in psychiatric disorders: a comprehensive review. Prog Neuropsychopharmacol Biol Psychiatry. 27(1): 85-102.
Viscusi, W. Kip (1984) “The lulling effect: The impact of child-resistant packaging on aspirin and analgesic ingestions.” American Economic Review. 74(2): 324-327.
Viscusi, W. Kip (1985) “Consumer behavior and the safety effects of product safety regulation.” Journal of Law and Economics. 28(3): 527-553.
Webb, Charles P.M., Evelyn J. Bromet, Semyon Gluzman, Nathan L. Tintle, Joseph E. Schwartz, Stanislav Kostyuchenko, and Johan M. Havenaar, 2005. “Epidemiology of heavy alcohol use in Ukraine: Findings from the World Mental Health Survey.” Alcohol and Alcoholism. 40(4): 327-335.
Wolfers, Justin. 2006. Did unilateral divorce laws raise divorce rates? A reconciliation and new results. American Economic Review. 96(5): 1802-1820.
World Bank. 2006. World Development Indicators, 2006. Available online: http://devdata.worldbank.org/wdi2006/contents/cover.htm
Zimmerman M, Mattia JI, and Posternak MA, 2002. Are subjects in pharmacological treatment trials of depression representative of patient in routine clinical practice? Am J Psychiatry 159(3): 469-4.
39

Zito J. Safer D, dosReis S, et al. 2003. Psychotropic practice patterns for youth; a 10-year perspective. Archives Pediatric and Adolescent Medicine.157:17-25.
40
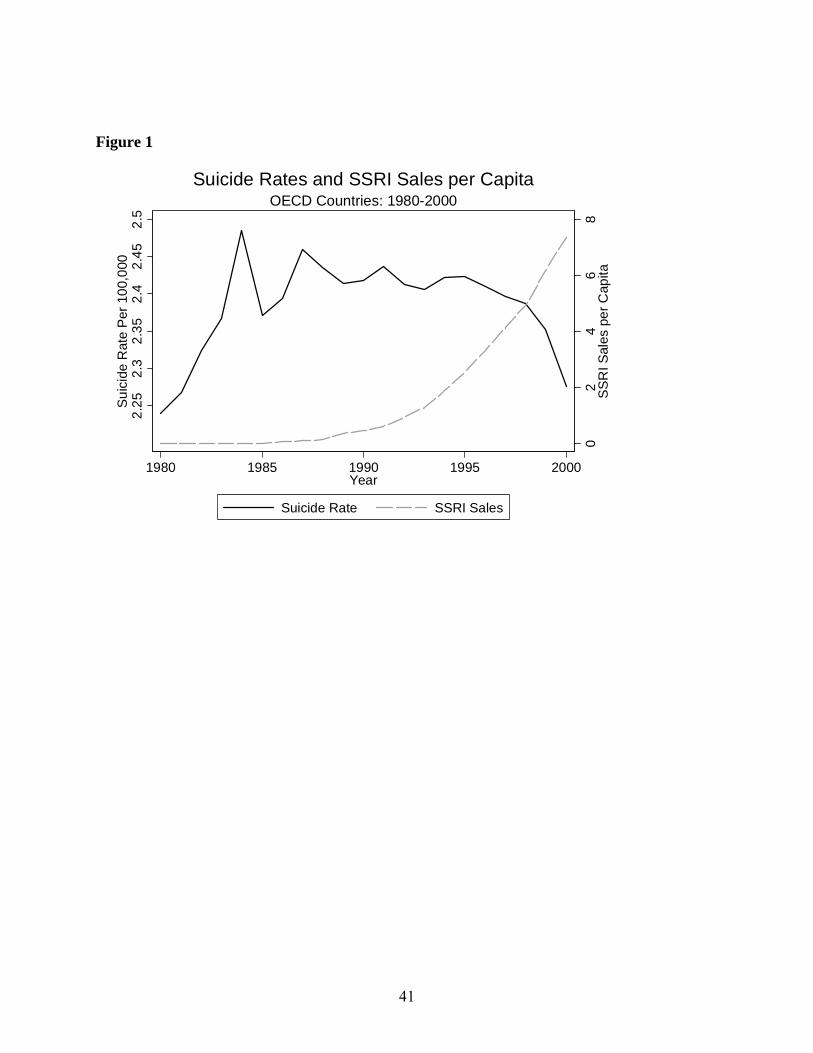
Figure 1
02
46
8S
SR
I Sal
es p
er C
apita
2.25
2.3
2.35
2.4
2.45
2.5
Sui
cide
Rat
e P
er 1
00,0
00
1980 1985 1990 1995 2000Year
Suicide Rate SSRI Sales
OECD Countries: 1980-2000Suicide Rates and SSRI Sales per Capita
41

Figure 2: Changes in log suicide rates, 1980-95, vs. changes in SSRI sales
US
Argent
Brazil
Can
Chile
Ecuador
Mexico
Israel
Japan
Aust
Belg
FranceGreece
Ire
Italy
Lux
NethNor
Port
Spain
UK
Austrl
New_Zeal
-.20
.2.4
.6.8
ln s
uici
de 9
5 - l
n su
icid
e 80
0 2 4 6SSRI doses / capita 1995 - 1980
42
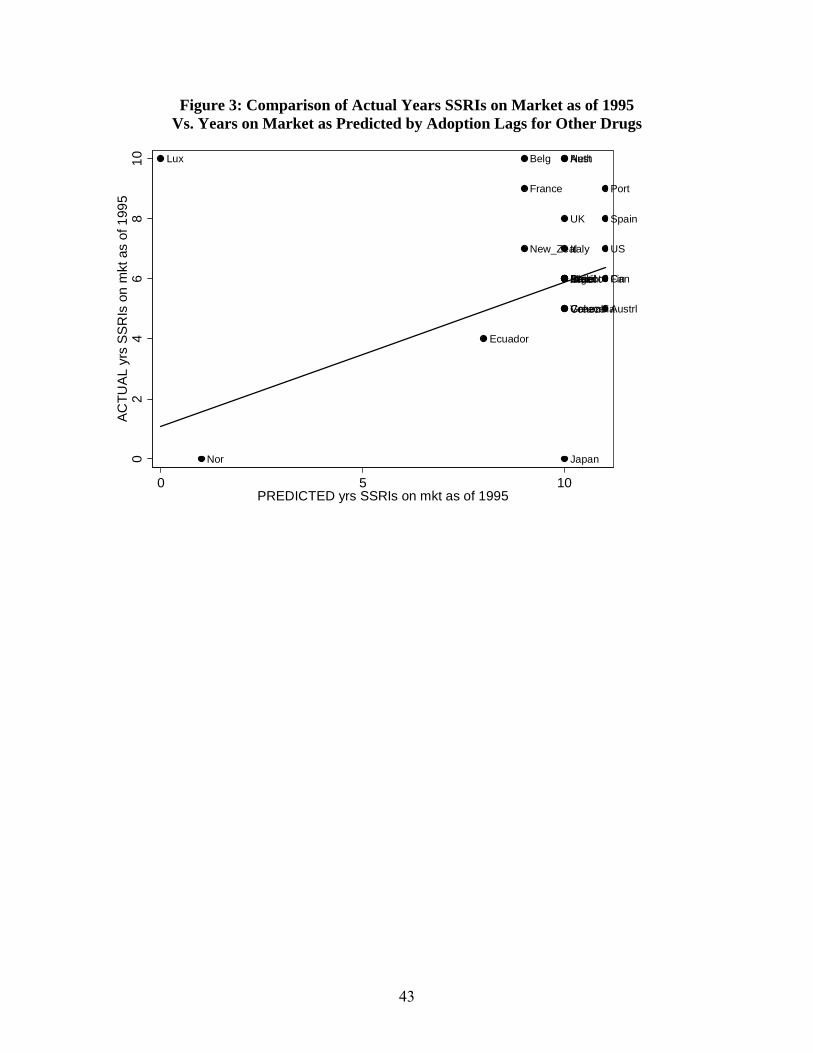
Figure 3: Comparison of Actual Years SSRIs on Market as of 1995 Vs. Years on Market as Predicted by Adoption Lags for Other Drugs
US
ArgentBrazil CanChile
Columbia
Ecuador
Mexico
Venez
Israel
Japan
AustBelg
Fin
France
Greece
Ire
Italy
Lux Neth
Nor
Port
SpainUK
Austrl
New_Zeal
02
46
810
AC
TUA
L yr
s SS
RIs
on
mkt
as
of 1
995
0 5 10PREDICTED yrs SSRIs on mkt as of 1995
43

Figure 4: Actual SSRI sales vs. Instruments and Predicted Sales, Selected Countries
United States
0
2
4
6
8
10
12
14
16
18
20
80 81 82 83 84 85 86 87 88 89 90 91 92 93 94 95 96 97 98 99
InstrumentsSSRI_salesPredicted_sales
Japan
0
2
4
6
8
10
12
14
16
18
20
80 81 82 83 84 85 86 87 88 89 90 91 92 93 94 95 96 97 98 99
InstrumentsSSRI_salesPredicted_sales
NOTES: Y-axis presents drug sales (doses per capita), while x-axis shows year. White bars in each graph show instruments from preferred IV model, gray bars show actual SSRI sales, and dark lines show predicted SSRI sales values from a simplified version of our first-stage equation that regresses actual SSRI sales against the instruments but without the country and year fixed effects, country-specific linear trends and other covariates that are included in the actual 2SLS estimation that is used in calculating our preferred IV estimates below. We show predicted values from this simplified first stage equation simply to help illustrate the intuition behind our research design.
44

45
Figure 5: Predicted Change SSRI Sales from Preferred IV Model vs. Change Log Suicide Rates, 1980-95
US
Argent
Brazil
Can
Chile
Ecuador
Mexico
Israel
Japan
Aust
FranceGreece
Ire
Italy
Lux
Nor
Port
Spain
UK
Austrl
New_Zeal
-.20
.2.4
.6.8
ln s
uici
de 9
5 - l
n su
icid
e 80
0 2 4 6PREDICTED chg SSRI sales 1995 - 1980

Figure 6: Falsification Check, Changes in Suicides Pre and Post SSRI Changes
Panel A: Change suicides 1980-90 vs predicted change SSRIs 1990-95
US
Argent
Brazil
Can
Chile
Ecuador
Mexico
Israel
Japan Aust
FranceGreece
Ire
Italy
Lux
Nor
Port
Spain
UK
Austrl
New_Zeal
-.20
.2.4
.6ln
sui
cide
90
- ln
suic
ide
80
0 1 2 3 4 5PREDICTED chg SSRI sales 1995 - 1990
Panel B: Change suicides 1990-95 vs predicted change SSRIs 1990-95
USArgent
Brazil
Can
Chile
Columbia
Ecuador
Mexico
Israel
Japan
Aust
Fin
FranceGreece
Ire
Italy
Lux
Nor
Port
Spain
UKAustrl
New_Zeal
-.2-.1
0.1
.2.3
ln s
uici
de 9
5 - l
n su
icid
e 90
0 1 2 3 4 5PREDICTED chg SSRI sales 1995 - 1990
46

Figure 7:
Global Anti-Depressant Sales: 1995-2004
0
2000
4000
6000
8000
10000
12000
1995 1996 1997 1998 1999 2000 2001 2002 2003 2004
Year
Dos
es (i
n m
illio
ns)
SSRIsOthers
47

48
Table 1: Descriptive Statistics for Full Sample of Country-Level Panel Dataset Variable Mean Standard Deviation Full sample (1980-2000) SSRI doses per capita Suicide rates per 100,000 Total Male Female Age 15-24 Age 25-34 Age 35-44 Age 45-54 Age 55-64 Age 65 and over % population in age group: 15-24 25-34 35-44 45-54 55-64 65 and over Real GDP per capitaa Unemployment rate Suicide data coded using ICD10
2.1290 10.1419 15.4149 5.1935 8.2268 11.1920 12.2534 14.1380 14.5407 18.5482 16.4555 15.4560 13.2939 10.5985 8.4401 10.5681 16,747 7.1428 .1993
4.0924 5.9929 8.5891 5.1935 4.0046 5.5708 6.8066 8.7442 8.9454 11.9183 2.7964 1.3395 1.9874 2.4970 2.5647 4.3550 8,118 3.8937 .3999
1980 Suicides per 100,000 SSRI doses capita
9.3718 0
5.9366 0
1985 Suicides per 100,000 SSRI doses per capita
10.3165 .0015
6.5327 .0126
1990 Suicides per 100,000 SSRI doses per capita
9.7190 .3675
5.7663 .4292
1995 Suicides per 100,000 SSRI doses per capita
9.9122 2.5327
5.5527 2.6395
2000 Suicides per 100,000 SSRI doses per capita
9.617 5.6454
6.4063 5.4700
NOTES: Authors’ calculations from WHO mortality and SSRI sales data for sample countries (see text). Calculations are weighted by country population. a = GDP per capita adjusted for changes over time across countries in currency exchange rates.

49
Table 2: Information on SSRIs and other Top Selling Pharmaceutical Classes Drug class Drug purpose Year first sold Country first sold Selective serotonin reuptake inhibitors Anti-depressant 1984 Germany Statins Cholesterol
regulation 1987 US
Proton pump inhibitors Ulcers 1988 Netherlands Calcium channel blockers Hypertension 1982 US, Spain, Italy,
Finland, Australia, Canada and Ireland
ACE inhibitors Hypertension 1982 Canada, Portugal, Australia and France

50
Table 3 OLS Regression Estimates with Country-Level Panel Data 1980 to 2000
Outcome measure =
log(suicides/100,000) Outcome measure = log(suicides/100,000)
Outcome measure = log(suicides/100,000)
Outcome measure = log(suicides/100,000)
SSRI doses sold per capita -.0350 (.0074)** -.0258 (.0011)** -.0198 (.0102)* -.0204 (.0094)**
Population age distribution % pop 15-24 .0305 (.0254) .0007 (.0221) .0006 (.0203) % pop 25-34 .0297 (.0187) .0275 (.0224) .0218 (.0201) % pop 35-44 .0287 (.0143)** .0087 (.0212) -.0061 (.0184) % pop 45-54 .0025 (.0291) -.0298 (.0251) -.0159 (.0218) % pop 55-64 .0072 (.0231) .0535 (.0242)** .0556 (.0217)** % pop 65 and over .0059 (.0214) .0130 (.0259) .0268 (.0254) ICD-10 system used to classify mortality codes
-.0079 (.0422) -.0417 (.0252) -.0279 (.0238)
Indicators for Years Before SSRIs on the market:
1 year before -.0309 (.0194) 2 years before -.0625 (.0416) 3 years before -.0846 (.0443)* 4 years before -.0994 (.0410)** 5 years before -.0867 (.0353)** Model specification Year indicators? Yes Yes Yes Yes Country indicators? Yes Yes Yes Yes Country-specific linear trends? No No Yes Yes N R-squared
541 .977
531 .981
531 .991
531 .992
NOTES: Table reports least squares regression coefficients. Standard errors in parentheses. Regression models also include a constant intercept term and in the last three columns binary indicators for whether GDP, divorce and unemployment rate variables are missing and set equal to zero. Country populations used as weights. For more details on estimation approach see text. * = p<.10 ** = p<.05
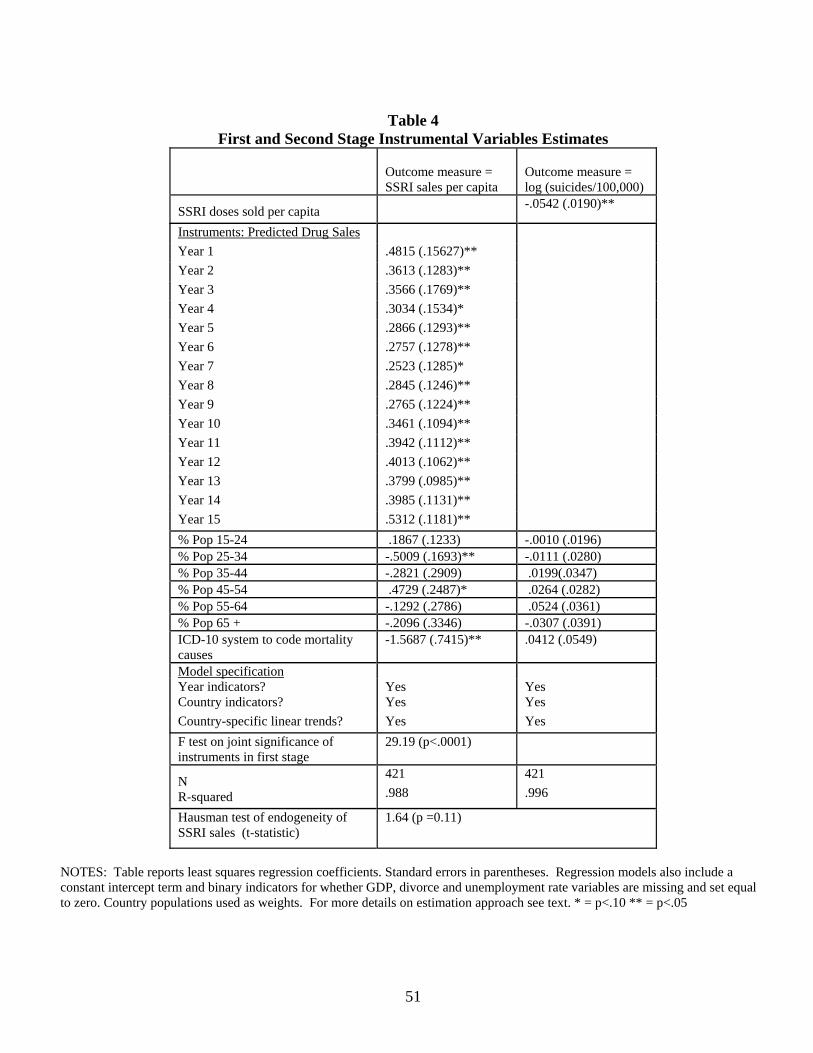
51
Table 4
First and Second Stage Instrumental Variables Estimates
Outcome measure = SSRI sales per capita
Outcome measure = log (suicides/100,000)
SSRI doses sold per capita -.0542 (.0190)**
Instruments: Predicted Drug Sales Year 1 .4815 (.15627)** Year 2 .3613 (.1283)** Year 3 .3566 (.1769)** Year 4 .3034 (.1534)* Year 5 .2866 (.1293)** Year 6 .2757 (.1278)** Year 7 .2523 (.1285)* Year 8 .2845 (.1246)** Year 9 .2765 (.1224)** Year 10 .3461 (.1094)** Year 11 .3942 (.1112)** Year 12 .4013 (.1062)** Year 13 .3799 (.0985)** Year 14 .3985 (.1131)** Year 15 .5312 (.1181)** % Pop 15-24 .1867 (.1233) -.0010 (.0196) % Pop 25-34 -.5009 (.1693)** -.0111 (.0280) % Pop 35-44 -.2821 (.2909) .0199(.0347) % Pop 45-54 .4729 (.2487)* .0264 (.0282) % Pop 55-64 -.1292 (.2786) .0524 (.0361) % Pop 65 + -.2096 (.3346) -.0307 (.0391) ICD-10 system to code mortality causes
-1.5687 (.7415)** .0412 (.0549)
Model specification Year indicators? Yes Yes Country indicators? Yes Yes Country-specific linear trends? Yes Yes F test on joint significance of instruments in first stage
29.19 (p<.0001)
N R-squared
421 .988
421 .996
Hausman test of endogeneity of SSRI sales (t-statistic)
1.64 (p =0.11)
NOTES: Table reports least squares regression coefficients. Standard errors in parentheses. Regression models also include a constant intercept term and binary indicators for whether GDP, divorce and unemployment rate variables are missing and set equal to zero. Country populations used as weights. For more details on estimation approach see text. * = p<.10 ** = p<.05

Table 5: Sensitivity Analyses Model Specification Full sample OECD countries only Baseline specification -.0542 (.0190)** -.0499 (.0178)** Drop US -.0975 (.0383)** -.0665 (.0252)** Drop Mexico -.0745 (.0238)** -.0770 (.0227)** Drop US and Mexico -.1475 (.0473)** -.0917 (.0580) Drop Japan and Mexico -.0601 (.0190)** .0191 (.0184) Drop obs with imputed sales -.0503 (.0168)** -.0496 (.0176)** No time-varying covariates -.0408 (.0161)** -.0319 (.0112)** Control for unemployment rate -.0509 (.0191)** -.0521 (.0182)** Control for real per capita GDPa -.0513 (.0173)** -.0318 (.0171)** Control for unemployment and real per capita GDPa
-.0515 (.0167)** -.0353 (.0177)**
Restrict sample to ≤ 1997 -.0464 (.0173)** -.0353 (.0210)* Unweighted -.0442 (.0269) -.0307 (.0273) Not logged -.2404 (.2070) -.2973 (.3001) Use single linear version of drug sales instrument (using 4-drug bundle)
-.0854 (0.0341)**
-.0672 (.0293)**
Just use Statin sales data to construct instrument
-.0454 (.0142)** -.0303 (.0197)
Just use CCB sales data to construct instrument
.0100 (.0264) .0494 (.0273)*
Just use ACE sales data to construct instrument
-.0300 (.0212) -.0078 (.0186)
Just use PPI sales data to construct instrument
-.0337 (.0184)** -.0077 (.0268)
NOTES: a = Figures for real per capita GDP adjusted for exchange rate variation over time. Each cell includes the coefficient for predicted SSRI sales values by applying the basic IV estimation approach as in Table 4 (from equations 4 and 5 in the text) to the analytic sample described at the top of the column, with deviations from the basic model setup described at left for each row. Robust standard errors are in parentheses, clustered at the country level to account for serial correlation. * = p<.1, ** = p<.05
52

Table 6: IV Results for the Estimated Effect of SSRI Sales on Suicide Mortality for Population Sub-Groups
Dependent variable Full sample OECD countries only Log suicide, females -.0775 (.0174)** -.0937 (.0184)** Log suicide, males -.0539 (.0215)** -.0483 (.0214)* Log suicide, age 15-24 -.0978 (.0275)** -.0849 (.0556) Log suicide, age 25-34 -.0525 (.0226)** -.0326 (.0341) Log suicide, age 35-44 .0000 (.0303) .0223 (.0306) Log suicide, age 45-54 -.0171 (.0305) -.0249 (.0251) Log suicide, age 55-64 -.0398 (.0318) -.0228 (.0317) Log suicide, age 65 + -.0253 (.0394) -.0145 (.0335) NOTES: Each cell includes the coefficient for predicted SSRI sales values by applying the basic IV estimation approach as in Table 4 (from equations 4 and 5 in the text) to the analytic sample described at the top of the column, with the dependent variable of interest described at left for each row. Robust standard errors are in parentheses, clustered at the country level to account for serial correlation. * = p<.1, ** = p<.05
53