Embed Size (px)
Citation preview
Glob Change Biol. 2021;27:1431–1442. wileyonlinelibrary.com/journal/gcb | 1431© 2020 John Wiley & Sons Ltd
1 | INTRODUC TION
Pelagic ecosystems have been strongly influenced by climatic change, most noticeably with the increase in ocean temperature (Richardson, 2008), but also through changes in other important environmental
conditions such as salinity, mixed-layer depth, and chlorophyll concentration (Curry et al., 2003). Ocean warming has been im-plicated in changes to the distribution of species across all tro-phic levels including plankton (Barton et al., 2016; Thomas et al., 2012), marine fish (Pinsky et al., 2013), and marine mammals
Received: 29 July 2020 | Revised: 9 November 2020 | Accepted: 8 December 2020
DOI: 10.1111/gcb.15499
P R I M A R Y R E S E A R C H A R T I C L E
Anthropogenic climate change impacts on copepod trait biogeography
Niall McGinty1 | Andrew D. Barton2 | Nicholas R. Record3 | Zoe V. Finkel1 | David G. Johns4 | Charles A. Stock5 | Andrew J. Irwin1,6
1Department of Oceanography, Dalhousie University, Halifax, NS, Canada2Scripps Institution of Oceanography and Section of Ecology, Behavior and Evolution, University of California, San Diego, CA, USA3Bigelow Laboratory for Ocean Sciences, East Boothbay, ME, USA4CPR Survey, Marine Biological Association, Plymouth, UK5Geophysical Fluid Dynamics Laboratory, National Oceanic and Atmospheric Administration, Princeton University, Princeton, NJ, USA6Department of Mathematics and Statistics, Dalhousie University, Halifax, NS, Canada
CorrespondenceNiall McGinty, Department of Oceanography, Dalhousie University, Halifax, NS, Canada.Email: [email protected]
Funding informationSimons Collaboration on Computational Biogeochemical Modeling of Marine Ecosystems, Grant/Award Number: 549935; NASA, Grant/Award Number: NNX16AG59G; Simons Foundation
AbstractCopepods are among the most abundant marine metazoans and form a key link be-tween marine primary producers, higher trophic levels, and carbon sequestration pathways. Climate change is projected to change surface ocean temperature by up to 4°C in the North Atlantic with many associated changes including slowing of the overturning circulation, areas of regional freshening, and increased salinity and reduc-tions in nutrients available in the euphotic zone over the next century. These changes will lead to a restructuring of phytoplankton and zooplankton communities with cas-cading effects throughout the food web. Here we employ observations of copepods, projected changes in ocean climate, and species distribution models to show how climate change may affect the distribution of copepod species in the North Atlantic. On average species move northeast at a rate of 14.1 km decade−1. Species turno-ver in copepod communities will range from 5% to 75% with the highest turnover rates concentrated in regions of pronounced temperature increase and decrease. The changes in species range vary according to copepod traits with the largest effects found to occur in the cooling, freshening area in the subpolar North Atlantic south of Greenland and in an area of significant warming along the Scotian shelf. Large dia-pausing copepods (>2.5 mm) which are higher in lipids and a crucial food source for whales, may have an advantage in the cooling waters due to their life-history strategy that facilitates their survival in the arctic environment. Carnivorous copepods show a basin wide increase in species richness and show significant habitat area increases when their distribution moves poleward while herbivores see significant habitat area losses. The trait-specific effects highlight the complex consequences of climate change for the marine food web.
K E Y W O R D Sbody size, climate change, Continuous Plankton Recorder, copepods, diapause, diet, diversity, trait biogeography
1432 | MCGINTY eT al.
(Hazen et al., 2013; Record et al., 2019). Zooplankton play key roles in the pelagic ecosystem, acting as the link between primary produc-ers and higher level consumers in marine food webs. As an important food source for many commercial fish species during key stages of their life cycle, changes to zooplankton annual abundance and sea-sonal dynamics can have significant effects on global fisheries. For example, successful cod recruitment in the North Sea is linked to years with high abundance of key plankton prey species for cod lar-vae (e.g., Calanus finmarchicus; Beaugrand et al., 2003; Beaugrand & Kirby, 2010; Olsen et al., 2011).
Due to the short generation times and fecundity of zooplank-ton, their populations can rapidly respond (<1 year) to changes in the marine environment (Richardson, 2008) including to changes induced by anthropogenic pressures (Bedford et al., 2020). As a result, past changes in zooplankton dynamics have been used as ecosystem indicators to inform marine policy and ecosystem man-agement (McQuatters-Gollop et al., 2015). We focus on copepods as they typically account for between 70% and 90% of mesozooplank-ton abundance, are pivotal in many pelagic food webs (Steinberg & Landry, 2017), and are major contributors to carbon sequestration in the deep oceans via vertical migration and the lipid pump, with lower bound estimates around 0.25 Pg C year−1 (Record et al., 2018), and species-specific analyses suggesting that the number is likely even higher (Jónasdóttir et al., 2019). Copepods have been shown to shift their distribution, phenology, or both in response to the displace-ment of their optimal thermal habitat (Edwards & Richardson, 2004; Poloczanska et al., 2013). Changes in timing across trophic levels can vary significantly leading to large-scale ecosystem alterations and the break-down of established food webs caused by trophic mis-match (Edwards & Richardson, 2004). Previous efforts to model the potential climate impacts on zooplankton abundance and distribu-tion have primarily focused on modeling of ecologically important copepods, but one drawback of this approach is the challenge of generalizing the analysis of one species to others or whole commu-nities. Here we shift focus from species to three functional traits to assess the functional biogeography of copepods in the North Atlantic. Specifically we consider body size, dietary strategy, and diapause that mediate growth, reproduction, and survival (Litchman et al., 2013).
Zooplankton traits including body size, dietary strategy, and diapause are known to structure realized niches of copepods in the present ocean (Benedetti et al., 2016; Brun et al., 2017; McGinty et al., 2018). Body size is considered a master trait for all plank-tonic organisms as it constrains many other traits including feeding behavior (Prowe et al., 2019) and diapause (McGinty et al., 2018). Body size has a defined biogeography adhering to Bergmann's tem-perature-size rule with the larger individuals found in the colder higher latitudes (Brun et al., 2016; McGinty et al., 2018) and can vary seasonally depending on the community composition (Evans et al., 2020). Dietary strategy appears to have a strong effect on species biogeography with significant niche differentiation of car-nivorous copepods that tend to dominate warmer waters with lower chl-a biomass and herbivorous copepods which are found in cooler
waters with higher chl-a biomass (McGinty et al., 2018). Herbivorous strategies also tend to favor species that can adapt to extreme tem-perature changes and food availability through lipid storing and by employing diapausing strategies (McGinty et al., 2018). The strength of these trait-derived niche–environmental relationships highlights the importance of using traits to anticipate the potential effects of future climate change (Barton et al., 2013). Using a niche characteri-zation for phytoplankton (Irwin et al., 2012), a basin wide community change and community reorganization has been projected for the next century with a median northward movement of 12.9 km de-cade−1 (Barton et al., 2016). Changes in phytoplankton communities will affect copepods, likely affecting spatial distribution of herbi-vores which depend directly on primary producers and carnivores which are secondary consumers. Similarly, biogeographic changes in herbivorous zooplankton will affect phytoplankton communities, although we do not explore that feedback here.
We use species distribution models (SDMs) to identify the rela-tionship between patterns of biogeography for each species and the local environmental conditions (Elith et al., 2006; Elith & Leathwick, 2009). SDMs have revealed taxonomic structure in phytoplankton realized niches (Brun et al., 2015; Irwin et al., 2012) and trait-based differences in the realized niches of zooplankton (McGinty et al., 2018). SDMs have been used to project potential changes future climatic change may have on the biogeographical distribution and movement of species using projected oceanic conditions as the en-vironmental predictors of the future habitat. Individual species pro-jections have shown that poleward movements of up to 23 km year−1 over may occur for C. finmarchicus (Beaugrand et al., 2008). A mean poleward shift of 8.7 km decade−1 was detected for 14 of the most abundant zooplankton species of the North Atlantic (Villarino et al., 2015) using SDM techniques. Climate projections based on cope-pod niches have largely been investigated using small collections of species and generally do not consider the potential community re-sponses (e.g., changes in species richness) or trait structure (but see Benedetti et al., 2018 for the Mediterranean).
We quantify projected changes to copepod communities in the North Atlantic over 100 years between the late 20th and late 21st centuries and categorize these changes using copepod functional traits of body size, dietary mode, and diapause strategy. We develop SDMs for a set of 62 copepod species using observations from the Continuous Plankton Recorder (CPR) collected between 1958 and 2000. Insights into the potential future changes of zooplankton dy-namics in the pelagic ecosystem are developed by combining cou-pled ocean-climate model projections of future ocean conditions with statistical analysis of historical biogeography of zooplankton. Environmental variables used for developing the SDMs are derived from the Geophysical Fluid Dynamics Laboratory's Earth System Model GOLD (ESM2G) under a “business as usual” approach to greenhouse gas emissions (RCP8.5). Environmental change is not ex-pected to be uniform across the North Atlantic, with areas of warm-ing and cooling expected (Bopp et al., 2013). As a consequence, we anticipate hotspots where the greatest changes in copepod commu-nity structure are likely to occur and seek to identify the key traits
| 1433MCGINTY eT al.
associated with these changes. By focusing on functional traits rather than species we aim to provide a unifying view of the conse-quences of climate change across all copepods in the North Atlantic linking body size, dietary strategy, and diapause to key ecological and biochemical consequences of food quality, food web structure, and carbon trophic transfer and export efficiency.
2 | METHODS
2.1 | Study area and biotic and abiotic data
Our study region comprised the North Atlantic and shelf sea regions between 35° and 70° N. Species were selected from the CPR sur-vey spanning more than 60 years (Richardson et al., 2006). The CPR survey is unrivalled in temporal and spatial coverage, but depth sam-pling is restricted as the CPR device is towed at ~7 m depth behind ships of opportunity (Richardson et al., 2006). Most copepod species undergo large diel vertical migrations with larger near-surface abun-dances found at night than during the day (Hays, 2003). Our study aggregates samples across large swathes of space and time (1° and 1 month) combining nearby samples throughout the day ameliorat-ing the problem of surface sampling. The process of diel vertical mi-gration aids in providing a picture of depth-integrated zooplankton communities (Hosie et al., 2003) with surface CPR samples found to correlate with abundance estimates of C. finmarchicus down to 100 m (Helaouët & Beaugrand, 2009).
While the use of abundance estimates have been advocated for distribution modeling, we chose to reduce the data into aggregated 1° monthly grids and convert the species into a presence-only data-set. Abundance data can provide further information on changes within a community, however, the processes that govern abundance operate at finer resolutions than those investigated here (Boulangeat et al., 2012). Our interest was in modeling the realized niches of spe-cies and identifying the biogeographical distributions a species could maintain given its physiological constraints which can be identified using a presence–absence dataset (Chase & Leibold, 2003). Our ap-proach allowed us to compare the changes of both common and rare species on a similar scale as we focus on logistic probabilities (0–1) of occurrence and biogeographies as opposed to biomass or abundance (Barton et al., 2016). Taxa found in at least 30 of these monthly grids were retained for modeling, resulting in a set of 62 copepod species or genera (Table S1). For our analysis, we used seven environmental parameters known to directly indirectly zooplankton biogeography. These variables were (1) sea surface temperature (SST), (2) sea sur-face salinity, (3) mixed layer depth (MLD), (4) Chlorophyll-a (Chl-a), (5, 6) u and v current vectors from the (ESM2G) model (Dunne et al., 2012), and (7) Bathymetric Depth which was taken from the GEBCO 1 arc-second resolution dataset (Hall, 2006). Temperature affects the physiological and metabolic processes of the individual such that sustained changes to the ocean temperature will lead to changes at the population level. While others can alter the vertical and hor-izontal transport of an individual (MLD—water column stability; u
and v vectors—eddy mediated transport; Keister et al., 2011). These data were aggregated into the same 1° monthly grids as the CPR to allow for direct matching of the environmental variables according to the location (grids) and time (month) when applicable. We used environmental variables from the GFDL ESM2G model averaged into monthly grid values for both historical (1951–2000) and future time periods (2051–2100) for training on historical values and for spatial projection of species biogeographies in the future. Full details on data aggregation and model selection can be found in McGinty et al. (2018).
2.2 | Species distribution models and validation
Species distribution models were developed for each of the 62 spe-cies using multiple model techniques to create an ensemble forecast of species distributions. For this effort we used BIOMOD which offers a framework to combine the various statistical techniques used in spe-cies distribution modeling using the ‘biomod2’ package in R (Thuiller et al., 2009). We chose two machine learning algorithms (random for-est—RF and maximum entropy) and two linear regression (generalized linear models—GLM, generalized additive models) approaches which cover a large range of model flexibility from linear model relationships (GLM) to highly non-linear (RF). All modeling parameters remained fixed across species to maintain consistency and to prevent model overfitting. Model accuracy was evaluated using the area under the curve (AUC) and the true skill statistic (TSS). A weighted average of the models were generated using BIOMOD for each species where models with the highest AUC and TSS were given the greatest weight-ing to produce an ensemble model projection for the historical and fu-ture periods across the spatial domain of the North Atlantic. We used the ensemble model to generate an estimate of the logistic probability for each species in each 1° cell of the North Atlantic for the historical (1951—2000) and future (2051—2100) periods.
2.3 | Projected changes in species movement and community organization
Our analysis of species biogeography and total community charac-teristics between the historical and future periods followed a similar procedure outlined by Barton et al. (2016) for phytoplankton across the same spatial domain. The species' core biogeographical range was defined using the procedure outlined within BIOMOD, where a cell is considered to be part of a species' core range when the lo-gistic probability of the species being present is above a threshold defined by the TSS for each model. The number of 1° cells above the specified TSS was considered the core range of the species and was converted to an area (km2) by calculating the grid cell areas as they vary with latitude.
Core range movement was calculated for each species by measur-ing the changes in the central position for each month between the historical and future periods. The central position was calculated by
1434 | MCGINTY eT al.
finding the average location of all grid cells defined within the core range, weighted by the grid cell areas. The central position of each spe-cies was calculated for each month of the year and the change in the core position was calculated by finding the difference in the central po-sition for the historical and future periods. An annual measure of me-dian range shift was calculated with the total distance travelled (km), rate of change (km decade−1) and the bearing (−180° to 180°) reported.
The Bray–Curtis similarity index was used to estimate the similarity of the copepod community within each 1° grid cell between the future and historical periods. The estimated logistic probability of a species being present was used to compare the changes within the commu-nity. The smaller the Bray–Curtis index the less similar the community is between the two periods indicating a potential change to the co-pepod community through the gain and loss of the biogeographical range of the constituent species due to the changing environment.
We explored these patterns in more detail by assessing the changes to each species' habitat area and species turnover within a community. We converted the logistic probabilities for each species to a projected presence or absence using probability thresholds de-fined by maximizing the TSS from each model. The total habitat area for each species was calculated by summing the area associated with each projected presence location in both the historical and future pe-riods. For each grid square we also calculated the species richness, species loss due to local extinction (A), retained species (B) and species gain due to local colonization (C) between the future and historical pe-riods with the percentage turnover defined as 100 (A + C)/(A + B + C).
We estimated the timing of the seasonal peak for each species using the monthly logistic probability for each species within each 1° grid. The seasonal peak was calculated as the weighted mean of the month (Jan = 1, Feb = 2, etc.) and the logistic probability as the weights (Edwards & Richardson, 2004). For each 1° grid, the median seasonal peak for all species was calculated for both the historical and future periods with the difference providing a spatial reference for how timing of the community changes across the region.
2.4 | Projected changes in trait structuring
Species were classified into trait categories for (1) total body length (0–2.4 and >2.5 mm), (2) diapause behavior (diapause, non-diapause), and (3) dietary strategy (Carnivore, Herbivore) which were derived from the comprehensive copepod trait database compiled by Brun et al. (2017). These traits were found to structure present day cope-pod niches in both the Atlantic and Southern Oceans (McGinty et al., 2018). The mean niche values across each environmental gradient were found by calculating the weighted mean, using the logistic prob-ability as the weight function. We assessed the changes in the logistic probability from historic to future periods within each of the four size categories by calculating the difference in the historical and future median logistic probability of each size class within each 1° grid.
Changes in the distribution of the three trait strategies were ex-amined by calculating the changes in the ratio of trait categories between the historical and future periods. Species were defined as
present or absent in each grid cell based on the TSS thresholds of the logistic probabilities derived from the BIOMOD model. Ratios of diapause–non-diapause, small sized (<2 mm)–large sized (>2.5 mm), and carnivore–herbivore species were calculated for both periods. Differences in the ratios between both periods indicate how the spatial trait structure is expected to change over time.
3 | RESULTS
3.1 | Changes to environment
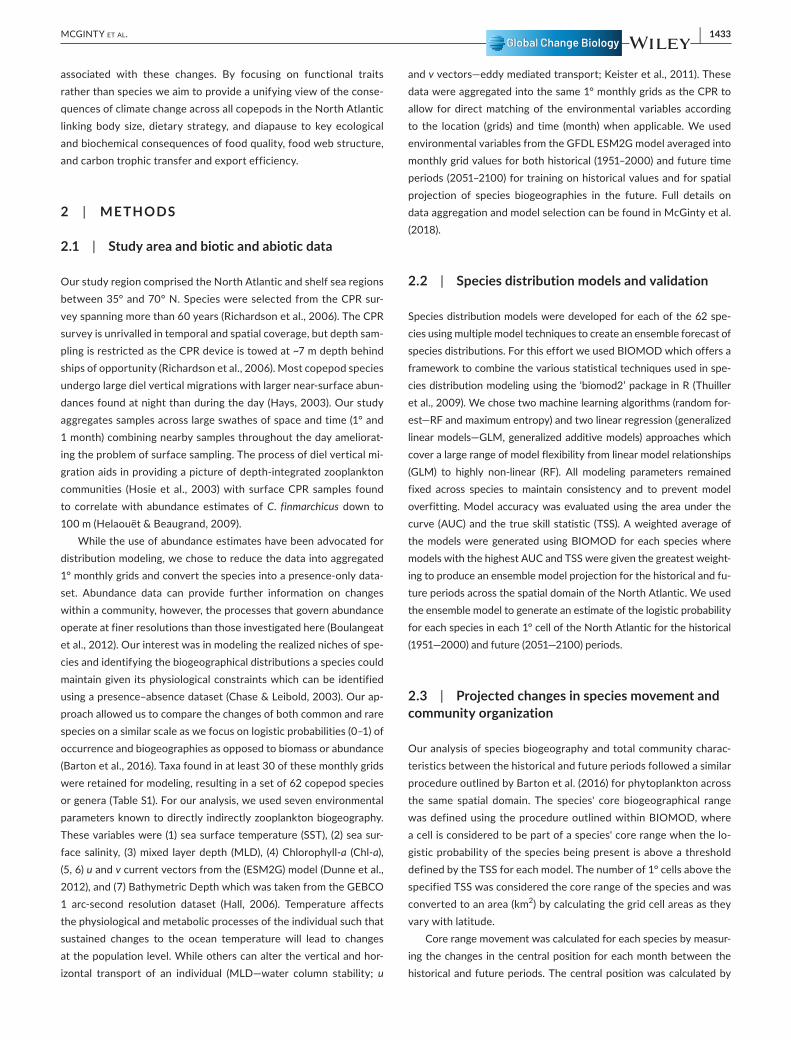
Mean temperature increases of 1.25°C are expected across the North Atlantic, with peak temperature increases of almost 4°C found on the NW Atlantic Shelf in a region ~500 km east of Newfoundland with cooling of similar magnitude expected in the subpolar area south of Greenland. This results in almost 8°C increase in the temperature differential between these regions of the North Atlantic (Figure 1a). Salinities show a strengthening of the latitudinal salinity gradient with a freshening of the ocean occurring in the subpolar and Arctic regions and increase in surface salinity occurring in the subtropical and tropical regions (Figure S1b). MLD decreases throughout much of the North Atlantic (Figure S1c). Chl-a concentration decreases most in the lower latitudes and increases most significantly in upwelling and subpolar regions (Figure S1d). The u and v velocity vectors (that is, East–West and North–South, respectively) show bordering areas of increases and decreases in the mid-Atlantic oriented along the longi-tudinal and latitudinal gradients (Figure S1e,f).
3.2 | Model performance and niche characteristics
Area under the curve values varied between 0.67 and 0.97 with a mean of 0.86 while TSS values varied between 0.24 and 0.87 with a mean of 0.67 (Figure S2a,b). There were no significant differences in the over-all performance of each of the four SDM methods averaged across all species. For all species we were able to find at least one model that satisfied our lower limit criteria of an AUC > 0.7 and TSS > 0.5.
Mean niche values for the historic period varied according to trait groups (Table 1). For example, mean SST niches differed be-tween the three trait category groups with herbivorous, diapaus-ing, and larger body sized copepods occupying colder niches than their carnivorous, non-diapausing, and smaller bodied counter-parts. The historical distribution showed differences in the mean historical latitude of the trait groups with diapausing, herbivorous and larger (>2.5 mm) body sized copepods appearing between 4° and 6° of latitude further north than their opposing counterparts.
3.3 | Species movements and changes to habitat
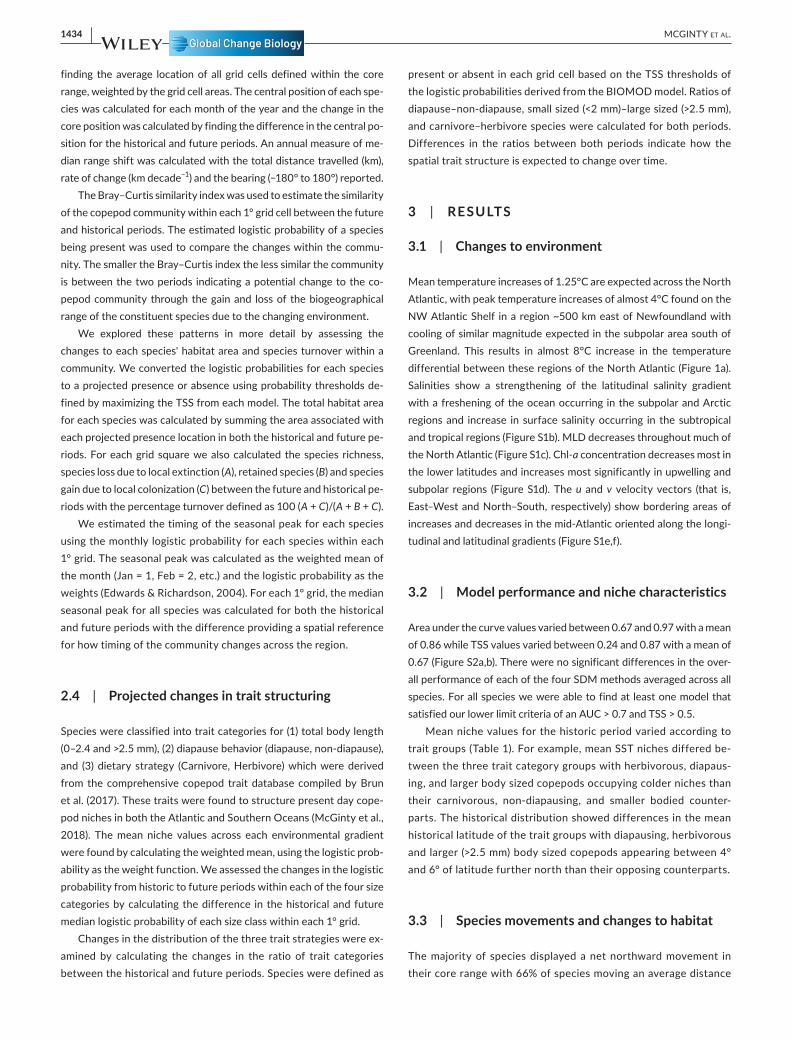
The majority of species displayed a net northward movement in their core range with 66% of species moving an average distance
| 1435MCGINTY eT al.
of 18.9 km decade−1 northward while the southward moving species travelled a distance of 9.1 km decade−1. The greatest movement occurred in species with historical core ranges in the mid-latitudes >42°N, moving on average 7.2 km decade−1 more than species in the tropical and subtropical region (Figure 2a).
Almost 75% of species were projected to move in an eastward trajectory regardless of their movement latitudinally (Figure 2b). The central position of carnivore habitats moved 0.49 km dec-ade−1 faster than herbivores. Carnivores showed an average of ~5% increase in core habitat area compared with a ~5% decrease
F I G U R E 1 (a) The projected change in sea-surface temperature (SST, °C) between the future and historical period, (b) the Bray–Curtis similarity between the projected future and historical communities at each grid box, (c) the relationship between Bray–Curtis similarity and the corresponding difference in the projected future and historical annual mean ocean temperature, and (d) the projected change in the species richness of the copepod communities between the future and historical period. Warmer colors indicate areas with the largest increases in SST (a), areas with the highest Bray–Curtis similarity (b) and the largest increases in species richness (d). A vertical dashed line on panel (c) corresponds to locations with no mean temperature change between the historical and future periods. Dashed lines on panel (d) indicate the 50% contour for species richness change. Projected changes in additional environmental conditions are shown in Figure S1 [Colour figure can be viewed at wileyonlinelibrary.com]
TA B L E 1 The mean niche values (meanSE) of the five most important environmental parameters for each biological trait (1) Diapause behavior—Yes/No, (2) Dietary strategy—Carn (Carnivore), Herb (Herbivore), and (3) Body size—<2.5 and >2.5 mm for historical (1951–2000) data. Also shown are the mean biogeographical parameters for each trait group. Estimates of the total habitat area (Area km2) and the central position of the core range (Hist lat) are shown for the historical period (1951–2000). The projected changes to the total habitat area expressed as a % of the historical area (Fut/Hist %), and the rate of species movement per decade (Movement, km decade−1) between the future and historical period is also shown. For bearing see Figure 2b
Niche values Species range
SST SSS Chl-a MLD Bathymetry Area km2 Hist lat Fut/Hist % km decade−1
Diapause
Yes 11.151.9 32.481.6 0.58<0.1 9.172.6 105.218.1 6.2 × 10⁻³ 50.25 −4.97 6.96
No 15.451.2 34.521.3 0.41<0.1 15.292.1 92.9214.4 8.7 × 10⁻³ 42.17 2.16 4.71
Dietary strategy
Carnivore 16.121.1 35.50.8 0.32<0.1 16.242.8 93.5117.8 8.6 × 10⁻³ 40.85 4.86 6.06
Herbivore 13.251.7 32.881.8 0.45<0.1 12.082.1 94.4312.6 7.6 × 10⁻³ 46.48 −4.93 5.43
Body size
<2.5 mm 15.411.2 34.111.7 0.42<0.1 15.142.2 87.4215.7 8.6 × 10⁻³ 42.06 0.82 5.07
>2.5 mm 13.621.8 34.281.7 0.41<0.1 12.952.6 104.615.1 7.8 × 10⁻³ 46.06 0.73 5.24
1436 | MCGINTY eT al.
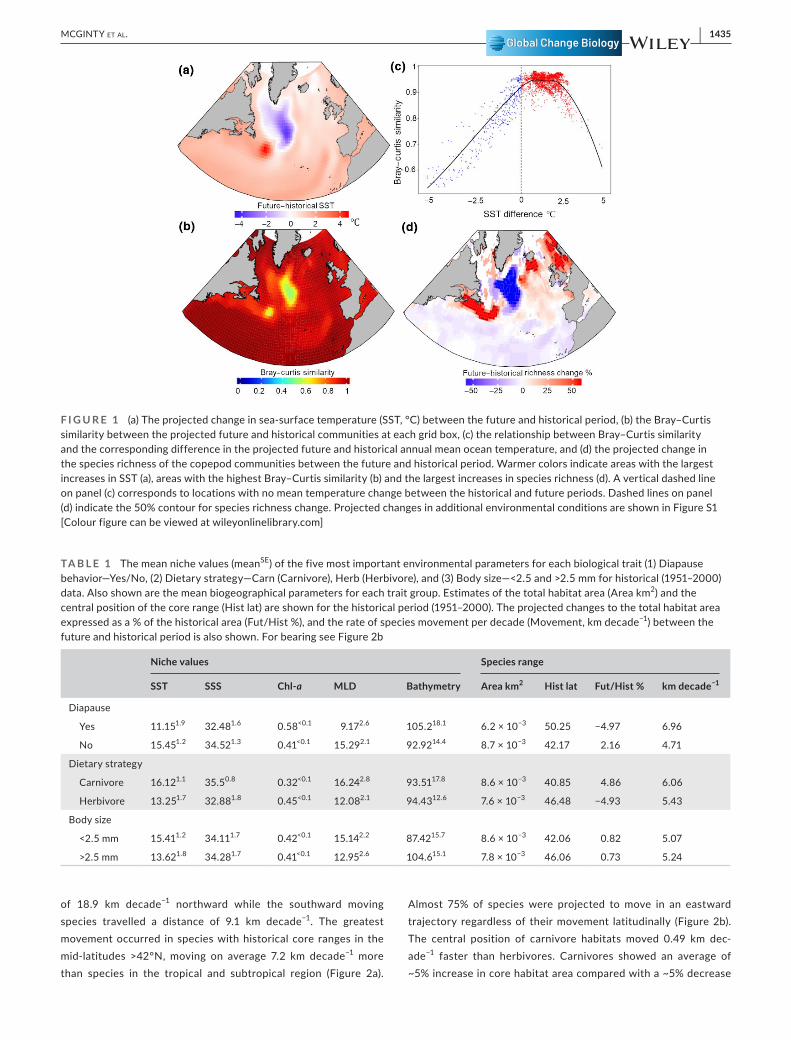
for herbivores. Diapausing copepods moved 2.2 km decade−1 faster than non-diapausing copepods with a ~5% decrease in core habitat area. Differences in the core range movement and changes in core habitat area were minimal for both body size categories. Differences in species movement between the two groups were less than 0.2 km decade−1 while both size categories showed <1% increase in core habitat area (Table 1). Examining the species-spe-cific changes in habitat for both trait groups we found that 75% of all carnivorous species showed a net positive increase in habitat area in contrast to 44% of herbivorous copepods. There was a sig-nificant positive relationship between the change in habitat and the change of the central latitude position for carnivores while a contrasting significant negative relationship was found for herbi-vores (Figure 3a).
3.4 | Phenology
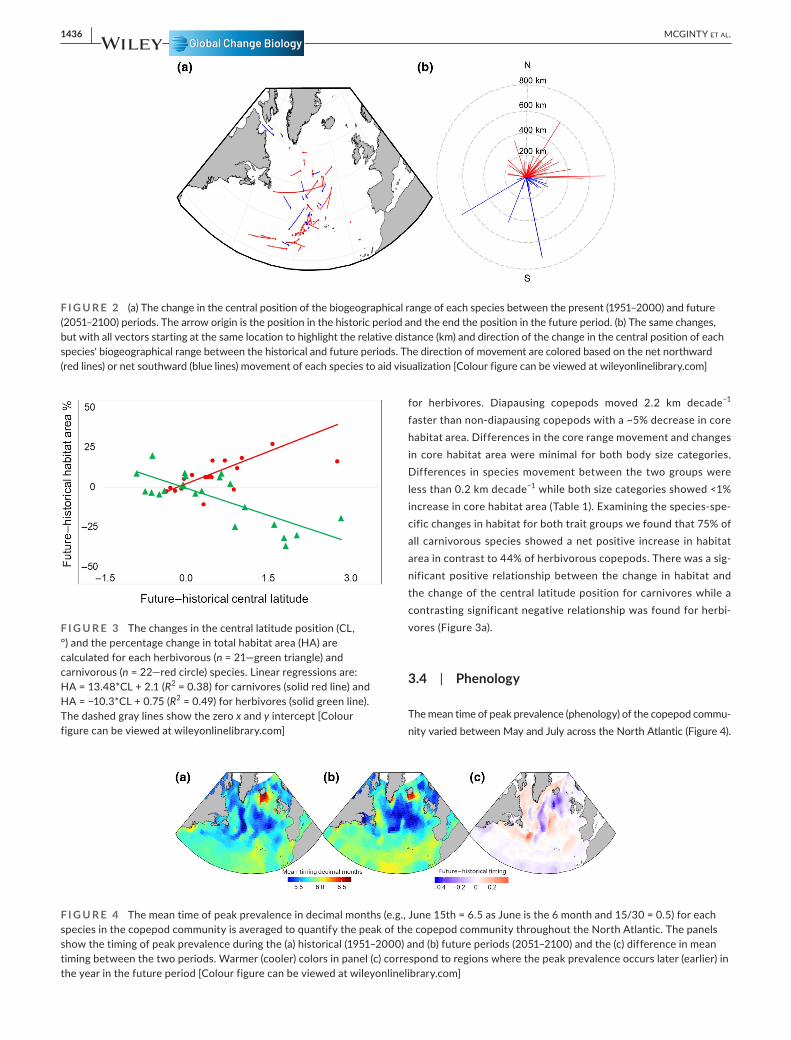
The mean time of peak prevalence (phenology) of the copepod commu-nity varied between May and July across the North Atlantic (Figure 4).
F I G U R E 2 (a) The change in the central position of the biogeographical range of each species between the present (1951–2000) and future (2051–2100) periods. The arrow origin is the position in the historic period and the end the position in the future period. (b) The same changes, but with all vectors starting at the same location to highlight the relative distance (km) and direction of the change in the central position of each species' biogeographical range between the historical and future periods. The direction of movement are colored based on the net northward (red lines) or net southward (blue lines) movement of each species to aid visualization [Colour figure can be viewed at wileyonlinelibrary.com]
F I G U R E 3 The changes in the central latitude position (CL, °) and the percentage change in total habitat area (HA) are calculated for each herbivorous (n = 21—green triangle) and carnivorous (n = 22—red circle) species. Linear regressions are: HA = 13.48*CL + 2.1 (R2 = 0.38) for carnivores (solid red line) and HA = −10.3*CL + 0.75 (R2 = 0.49) for herbivores (solid green line). The dashed gray lines show the zero x and y intercept [Colour figure can be viewed at wileyonlinelibrary.com]
F I G U R E 4 The mean time of peak prevalence in decimal months (e.g., June 15th = 6.5 as June is the 6 month and 15/30 = 0.5) for each species in the copepod community is averaged to quantify the peak of the copepod community throughout the North Atlantic. The panels show the timing of peak prevalence during the (a) historical (1951–2000) and (b) future periods (2051–2100) and the (c) difference in mean timing between the two periods. Warmer (cooler) colors in panel (c) correspond to regions where the peak prevalence occurs later (earlier) in the year in the future period [Colour figure can be viewed at wileyonlinelibrary.com]
| 1437MCGINTY eT al.
Historically, the earliest timing occurred in the North Sea and mid-Atlantic with the latest peak time occurring in an area off Iceland's south coast. South of 40°N we found that peak timing was expected to occur marginally earlier in the future. North of 40°N we found an east–west pattern with peak time occurring later along the coast and in the Labrador Sea by an average of 0.2 months (~6 days) and in the mid-Atlantic peak time occurs earlier by an average of 0.35 months (~10 days).
3.5 | Changes in community similarity
Overall, community similarity between the historical and future pe-riods was high, implying that for many regions the change in com-munity structure was not dramatic (Figure 1b). However, for the NW Atlantic shelf and Atlantic subpolar regions, large changes in community structure were projected. The projected changes in Bray–Curtis similarity were linearly related to the projected changes in the environment, particularly SST. The greater the magnitude in temperature change expected the less similar two communi-ties become (Figure 1c). While there was an immediate decline in Bray–Curtis similarity for temperature differences <0°C, there was a plateau in Bray–Curtis similarity for temperature increases up to 1.7°C. The patterns in Bray–Curtis similarity were reflected in the patterns of species richness change with significant loss (~48%) ex-perienced in the subpolar region and increases >50% in species rich-ness of the NW Atlantic Shelf (Figure 1d). While much of the tropical and subtropical areas showed widespread loss of species richness ~10%, areas south of Iceland and in the North Sea showed further areas of significant species richness increase that was not apparent with the Bray–Curtis similarity distribution. Similar patterns were observed for species turnover, with turnover rates of up to 80% found in the same areas with the greatest change in Bray–Curtis similarity (Figure S3).
3.6 | Changes in trait distribution
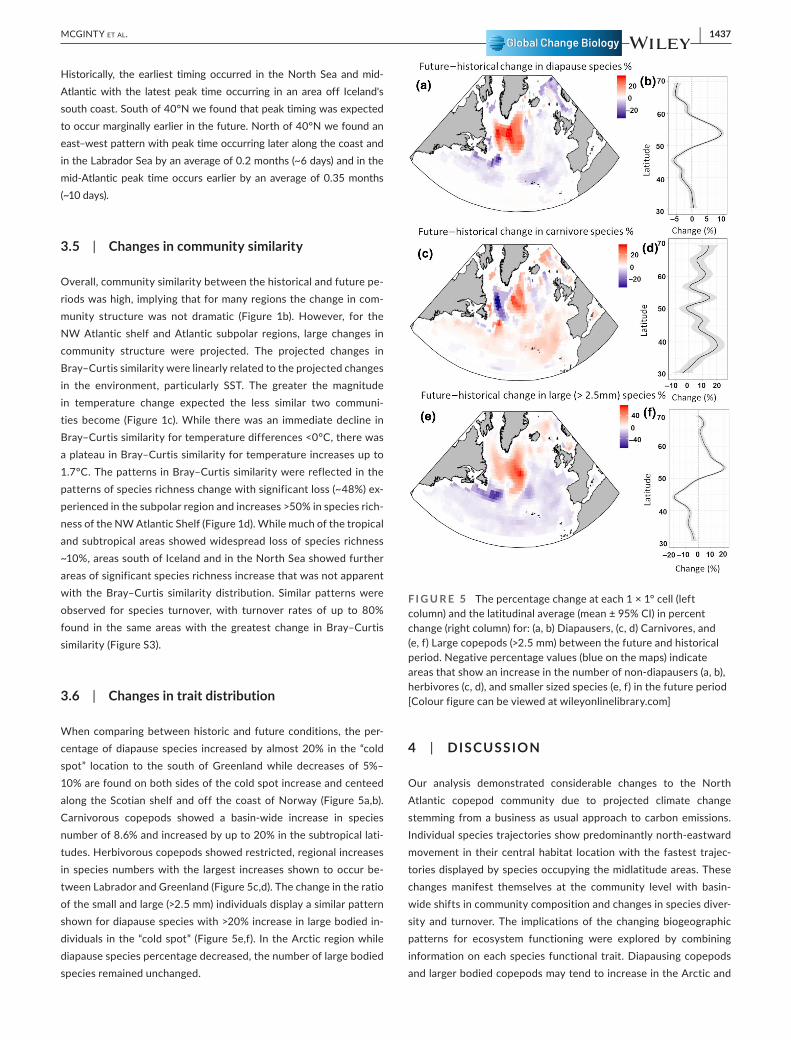
When comparing between historic and future conditions, the per-centage of diapause species increased by almost 20% in the “cold spot” location to the south of Greenland while decreases of 5%–10% are found on both sides of the cold spot increase and centeed along the Scotian shelf and off the coast of Norway (Figure 5a,b). Carnivorous copepods showed a basin-wide increase in species number of 8.6% and increased by up to 20% in the subtropical lati-tudes. Herbivorous copepods showed restricted, regional increases in species numbers with the largest increases shown to occur be-tween Labrador and Greenland (Figure 5c,d). The change in the ratio of the small and large (>2.5 mm) individuals display a similar pattern shown for diapause species with >20% increase in large bodied in-dividuals in the “cold spot” (Figure 5e,f). In the Arctic region while diapause species percentage decreased, the number of large bodied species remained unchanged.
4 | DISCUSSION
Our analysis demonstrated considerable changes to the North Atlantic copepod community due to projected climate change stemming from a business as usual approach to carbon emissions. Individual species trajectories show predominantly north-eastward movement in their central habitat location with the fastest trajec-tories displayed by species occupying the midlatitude areas. These changes manifest themselves at the community level with basin-wide shifts in community composition and changes in species diver-sity and turnover. The implications of the changing biogeographic patterns for ecosystem functioning were explored by combining information on each species functional trait. Diapausing copepods and larger bodied copepods may tend to increase in the Arctic and
F I G U R E 5 The percentage change at each 1 × 1° cell (left column) and the latitudinal average (mean ± 95% CI) in percent change (right column) for: (a, b) Diapausers, (c, d) Carnivores, and (e, f) Large copepods (>2.5 mm) between the future and historical period. Negative percentage values (blue on the maps) indicate areas that show an increase in the number of non-diapausers (a, b), herbivores (c, d), and smaller sized species (e, f) in the future period [Colour figure can be viewed at wileyonlinelibrary.com]
1438 | MCGINTY eT al.
sub-Arctic while smaller bodied species will increase across the sub-tropics. One of the most notable findings is the contrasting responses of carnivorous and herbivorous copepods to the projected poleward shifts in species habitat. We find basin-wide increases in the number of carnivore species within a community, with carnivores increasing in overall habitat area as they move northward while herbivores will notably decrease. The anticipated changes to the oceanic conditions within the next century are expected benefit carnivorous copepods at the expense of herbivores which has the potential to alter trophic links and ecosystem functioning for the North Atlantic.
4.1 | Shifts in species distribution
The rates of zooplankton species shift observed here are broadly simi-lar to the historical poleward shifts observed by Villarino et al. (2015) for 14 copepod species in the North Atlantic (Villarino—8.7 km dec-ade−1; this study—10.8 km decade−1). A comparison between the rates of change in central position measured across both studies shows strong correlation (r = 0.66, p < 0.001) when the two Arctic species C. glacialis and C. hyperboreus are removed. The discrepancy is likely in response to a significant cooling in the subpolar gyreregion, which is thought to be due to a decline in the overturning circulation of the sub-polar gyre (Yang et al., 2016). As a result, we propose that Arctic spe-cies may counterintuitively shift southward in response to a potential thermal refuge instead of continuing tracking conditions northward. The historical rate of change for the subarctic species C. finmarchicus was found to be moving northward at a rate of up to ~111 km dec-ade−1 (Helouet & Beaugrand, 2009). With the projected cooling ex-pected, our study finds a much less dramatic rate of direction change of −0.37 km decade−1.
Historical changes in zooplankton biogeographies over the last 50–75 years often show much faster rates of change than our results that compare the average historical distribution with a projected dis-tribution derived from the anticipated changes to the marine envi-ronment. Collective estimates of marine range shifts observed rates varying between 1.4 and 28 km decade−1 for fish and invertebrates (Cheung et al., 2009) while a meta-analysis of 129 marine species show an average rate of 19 km year−1 (Sorte et al., 2010). Copepods are expected to move northward at a similar rate as phytoplankton. A study of the future changes on the North Atlantic phytoplankton com-munity showed that species move northward at a rate of 12.9 km de-cade−1 (Barton et al., 2016) which is similar to the 10.8 km decade−1 demonstrated in our study for copepods. However, phytoplankton may move eastward at a faster rate (phytoplankton—42.7 km de-cade−1; copepods —21.3 km decade−1), possibly leading to increasing mismatches in the distribution of the two groups (Asch et al., 2019). Even the presence of small mismatches between phytoplankton- copepods, in terms of abundance, distribution, or timing can have large effects on ecosystem functioning (Thackeray, 2012). The ex-pected cooling of the subpolar region during this time rapidly slows and in some cases reverses the predictions of rapid poleward move-ment that has been observed historically.
Other metrics of species movement have been reported for spe-cies, such as the distributional ranges of a species distribution known as the leading (or trailing) edge (Poloczanska et al., 2013). These are usually seen as more dynamic with species movements tending to move much faster than the distributional center due to an increased adaptability of individuals at the environmental extremes (Robinson et al., 2015). Several plankton species have shown that individuals at the extreme thermal ranges undergo local adaptation to the envi-ronment which may not be representative of the whole population (Sasaki & Dam, 2019) The choice of the distributional center as a metric for species distribution is expected to give a more conserva-tive and robust estimate of any changes to a species biogeography. Nevertheless it is important to acknowledge the broader definitions of a species range as several meta-analytical studies that focused on edge changes are influential and frequently cited (Poloczanska et al., 2013). For example, Poloczanska et al. (2013) found that zooplank-ton had some of the fastest leading edge expansions of 142.1 km de-cade−1 which is an order of magnitude larger than any measured changes of the distributional center.
4.2 | Phenology
Regional studies of copepod phenology have demonstrated a con-sistent shift toward earlier bloom times in response to warming ocean temperatures (Greve et al., 2004; Mackas & Beaugrand, 2010). The change in the distribution and prevalence of diapausing copep-ods may have an effect on the changes observed in the phenological landscape of the North Atlantic. In our projections, the mean timing of copepod seasonal peaks changes by up to ±0.5 months, appearing later in the higher latitudes and earlier in the subtropics suggesting that it may be too simple to state that copepod phenology shifts earlier in a warming climate. Based on the geographical patterns, the phenological changes appear to integrate elements of the effects based on diapause strategy, diet preference, and body size. Some of the largest temperature increases coincide with species occurring both earlier and later in the season. At ocean basin scales, we find that the link between phenology and the changing environment is ob-scured due to the regional variability of individual species responses to environmental conditions (McGinty et al., 2011). Modeling stud-ies have shown the importance of diapause timing to the phenology of several species (Maps et al., 2011) which can produce knock-on ecological effects to non-diapause species in the ecosystem such as introducing competition with species that traditionally did not over-lap in their timing (Zhang et al., 2007). Temperature niches vary ac-cording to dietary preference, so we anticipate temperature changes will have differential effects on the phenology of herbivores and carnivores (McGinty et al., 2018). Phenological changes will likely cascade through trophic levels and create timing mismatches be-tween copepods and developmental stages of several commercially important fish species (Mollman et al., 2005; Staudinger et al., 2019). Our findings suggest that climate-mediated changes in zooplank-ton phenology may be more complicated than previously imagined
| 1439MCGINTY eT al.
and involved interactions across multiple traits that future research should be investigated further.
4.3 | Changes in community similarity and trait distribution
We identify several key areas where the greatest change in the com-munities is likely to occur. As the results are not sensitive to changes to abundance, the results emphasize areas where a high number of species have gained or lost their fundamental habitat niche. The greatest change in Bray–Curtis similarity tends to occur in areas with the greatest environmental change, however, changes in species diversity reveal a more varied pattern of change across the whole North Atlantic. When viewed in the context of the underlying en-vironment conditions we find that these changes occur when mean ocean temperatures vary around 9°C–12°C. This has been identified a critical thermal boundary for copepods in the North Atlantic and is identified as transitional region between temperate and sub-Arctic biomes (Beaugrand et al., 2008; Beaugrand & Kirby, 2018).
Model projections anticipate that body sizes will shrink among lower trophic level groups (Cheung et al., 2013), particularly in the mid-latitude regions, but with little change in the Arctic (Lefort et al., 2015). Similarly, this phenomenon has also been detected in field studies (Daufresne et al., 2009). Our results suggest that larger spe-cies will be lost at the expense of the smaller sized species, partic-ularly in the tropical and subtropical areas. However, between 50° and 60°N there is an increase in the presence of large-sized spe-cies in the subpolar region where significant cooling is expected. Increasing temperatures impose greater metabolic demands on an individual with greater pressure placed on larger individuals to in-crease energy intake to maintain a suitable basal or active metabolic rate (Claireaux & Lefrancois, 2007). The community response to in-creasing temperatures appears to be either a reduction in the overall length (Garzke et al., 2016) or an overall reduction in the larger spe-cies from an area. As a result of the warmer temperatures and de-creases in the larger species, there is the potential to alter the food web structure and the potential of less energy and carbon transfer between trophic levels (Lewandowska & Sommer, 2010).
We project that as a result of climate-induced changes, the North Atlantic ecosystem will become more favorable to carnivorous cope-pods in the next century while in contrast the prevalence of herbiv-orous copepods will diminish. In general we find that the probability of presence of carnivore species will tend to increase among copepod communities throughout much of the North Atlantic with the excep-tion of the cooling region which shows a shift toward further herbivore dominance. Most significantly, we find that the poleward movement in a species biogeographical distribution will lead to increases in the overall habitat area for carnivores and decreases for herbivores. Over larger scales, it has been demonstrated that on average carnivorous copepods tend to have niches that in areas with higher temperatures and lower Chl-a biomass in contrast to herbivorous copepods (McGinty et al., 2018). Recent evidence has also shown that despite a decline in
overall copepod abundance in UK shelf waters due to phytoplankton community changes, several carnivorous copepods have been shown to be increasing (Schmidt et al., 2020). Herbivore-dominated copepod communities are typically simpler with more efficient carbon flow between primary productivity to the higher trophic levels (Castellani et al., 2008). Carnivore dominated systems often occur in tropical and oligotrophic regions where trophic interactions are more complex and tend to be dominated by top-down as opposed to bottom-up processes (Hébert et al., 2017). The projected increases in ocean temperature point to a decrease in the appearance of the largest-sized copepod spe-cies and an overall shift in the community to copepods with a preferred carnivorous dietary strategy. Together with the shifts in phenology and distribution of diapausing species, there will be significant changes to the functional biogeography of the copepod community within the next century. Combined with a loss in accessible energy through a reduction in the larger lipid-rich species and effective phytoplank-ton–copepod food web links, the effects of the copepod community restructuring will undoubtedly reverberate throughout the ecosystem with significant knock-on effects to the upper trophic levels.
Marine management policy has been shifting from a sec-toral-based to ecosystem-based management system in recent de-cades and for the Northeast Atlantic, this has been driven largely by initiatives outlined by the Marine Strategy Framework Directive. Plankton have been outlined as important indicators for pelagic eco-system health due to their rapid responses to changes in climate change and water quality (Garmendia et al., 2013). Indices built on changing ratios of plankton functional types have been implemented for the North Atlantic region that provide simple measures of ecosys-tem resilience to anthropogenic pressures (McQuatters-Gollop et al., 2019). Our trait based ratios are designed on a similar framework that can be used as indicators of changes in energy flow (dietary strategy) and food web structure (body size) within the pelagic ecosystem.
4.4 | Caveats
We must note that there are limitations and uncertainties with any projection model. We included many potential environmental predictors that will change in the next century while others were omitted. Ocean acidification is likely to be a major threat for several calcifying planktonic organisms (e.g., pelagic gastropods; Limacina spp.). Studies on copepods have demonstrated that ocean acidifica-tion is expected to be of minor effect relative to temperature change (Garzke et al., 2016) and as a result was not included here.
Studies have repeatedly shown that the prevailing response of copepod communities to changing environmental conditions is to alter their distribution or timing of life-history events in line with these changes. However, some evidence has pointed to the poten-tial for some species to adapt to localized conditions with a rapid genetic response (Dam, 2013). Adaptations of life history traits in response to changing temperatures and thermal extremes have been found for estuarine and coastal copepod species across their geographical ranges (Lonsdale & Levinton, 1985; Willett, 2010).
1440 | MCGINTY eT al.
With regard to more widely distributed species, adaptation to local conditions have been found for isolated popaulations of C. helgo-landicus in the Mediterraanean (Yebra et al., 2011), however, no vari-ation was found for its congener C. finmarchicus across the North Atlantic. Comparing both species in the open ocean, Hinder et al. (2014) found no evidence of thermal adaptation of either species. We assume that while thermal adaptation is possible the more likely results are for zooplankton species to track their thermal niche.
With the changes expected in the distribution of copepod spe-cies among the trait groups, it is likely that changing species interac-tions (i.e., competition, predator–prey relationships) will occur in the future (Pearson & Dawson, 2003). Future studies should attempt to disentangle the effects of competitive interactions in the copepod community. Finally, we note that the CPR survey, while extraordi-nary in its spatial and temporal extent, takes all its samples from surface waters. As a result, we have only explored the responses in the surface of the ocean and did not consider the potential changes in the vertical distribution or migration behavior of each species in response to changing climate (Pinsky et al., 2013).
5 | CONCLUSIONS
Our results demonstrate that the projected environmental changes in the North Atlantic may lead to profound changes to the copepod community in the latter half of this century with significant geo-graphic shifts expected for most species. We use traits to describe the effects of environmental change across many variables to pro-vide descriptions of the effects of climate change for many species. The analysis of whole communities of copepods and analysis of the response according to three key traits (diapause, dietary strategy, and body size) enable robust estimates about the likely changes in copepod biogeography grounded in known physiological mecha-nisms. The emphasis on traits enables us to average over many spe-cies to gain insights for likely changes in phenology and community composition that form the basis for inferences of the consequences to food webs and biogeochemistry over the next century.
ACKNOWLEDG EMENTSWe thank Charles Stock and Jessica Luo from the National Oceanic and Atmospheric Administration's (NOAA) Geophysical Fluid Dynamics Laboratory for the ESM2G data. We also thank David Johns of the Sir Alister Hardy Foundation for Ocean Science (SAHFOS) for initially pro-viding Continuous Plankton Recorder data and also for his personal con-tribution to the manuscript. N.M.G., A.J.I., and Z.V.F. were supported by the Simons Collaboration on Computational Biogeochemical Modeling of Marine Ecosystems (CBIOMES; grant ID: 549935 Irwin/Dal). N.R.R. was supported by NASA grant no. NNX16AG59G. A.D.B. was sup-ported by the Simons Foundation.
DATA AVAIL ABILIT Y S TATEMENTThe data that support the findings of this study are available from the corresponding author upon reasonable request.
ORCIDNiall McGinty https://orcid.org/0000-0002-2505-2531
R E FE R E N C E SAsch, R. G., Stock, C. A., & Sarmiento, J. L. (2019). Climate change impacts
on mismatches between phytoplankton blooms and fish spawning phenology. Global Change Biology, 25(8), 2544–2559. https://doi.org/10.1111/gcb.14650
Barton, A. D., Irwin, A. J., Finkel, Z. V., & Stock, C. A. (2016). Anthropogenic climate change drives shift and shuffle in North Atlantic phytoplankton communities. Proceedings of the National Academy of Sciences of the United States of America, 113(11), 2964–2969. https://doi.org/10.1073/pnas.15190 80113
Barton, A. D., Pershing, A. J., Litchman, E., Record, N. R., Edwards, K. F., Finkel, Z. V., Kiørboe, T., & Ward, B. A. (2013). The biogeography of marine plankton traits. Ecology Letters, 16(4), 522–534.
Beaugrand, G., Brander, K. M., Lindley, J. A., Souissi, S., & Reid, P. C. (2003). Plankton effect on cod recruitment in the North Sea. Nature, 426, 661–664. https://doi.org/10.1038/natur e02164
Beaugrand, G., Edwards, M., Brander, K., Luczak, C., & Ibanez, F. (2008). Causes and projections of abrupt climate-driven ecosystem shifts in the North Atlantic. Ecology Letters, 11(11), 1157–1168. https://doi.org/10.1111/j.1461-0248.2008.01218.x
Beaugrand, G., & Kirby, R. R. (2010). Climate, plankton and cod. Global Change Biology, 16, 1268–1280. https://doi.org/10.1111/j.1365-2486.2009. 02063.x
Beaugrand, G., & Kirby, R. R. (2018). How do marine pelagic species re-spond to climate change? Theories and observations. Annual Review of Marine Science, 10, 169–197. https://doi.org/10.1146/annur ev-marin e-12191 6-063304
Bedford, J., Ostle, C., Johns, D. G., Atkinson, A., Best, M., Bresnan, E., Machairopoulou, M., Graves, C. A., Devlin, M., Milligan, A., Pitois, S., Mellor, A., Tett, P., & McQuatters-Gollop, A. (2020). Lifeform in-dicators reveal large-scale shifts in plankton across the North-West European shelf. Global Change Biology, 26(6), 3482–3497. https://doi.org/10.1111/gcb.15066
Benedetti, F., Gasparini, S., & Ayata, S. D. (2016). Identifying copepod functional groups from species functional traits. Journal of Plankton Research, 38(1), 159–166. https://doi.org/10.1093/plank t/fbv096
Benedetti, F., Vogt, M., Righetti, D., Guilhaumon, F., & Ayata, S. D. (2018). Do functional groups of planktonic copepods differ in their eco-logical niches? Journal of Biogeography, 45(3), 604–616. https://doi.org/10.1111/jbi.13166
Bopp, L., Resplandy, L., Orr, J. C., Doney, S. C., Dunne, J. P., Gehlen, M., Halloran, P., Heinze, C., Ilyina, T., Séférian, R., Tjiputra, J., & Vichi, M. (2013). Multiple stressors of ocean ecosystems in the 21st cen-tury: Projections with CMIP5 models. Biogeosciences, 10, 6225–6245. https://doi.org/10.5194/bg-10-6225-2013
Boulangeat, I., Gravel, D., & Thuiller, W. (2012). Accounting for dispersal and biotic interactions to disentangle the drivers of species dis-tributions and their abundances. Ecology Letters, 15(6), 584–593. https://doi.org/10.1111/j.1461-0248.2012.01772.x
Brun, P., Payne, M. R., & Kiørboe, T. (2016). Trait biogeography of ma-rine copepods – An analysis across scales. Ecology Letters, 19(12), 1403–1413. https://doi.org/10.1111/ele.12688
Brun, P. G., Payne, M., & Kiørboe, T. (2017). A trait database for marine copepods. Earth System Science Data, 9(1), 99–113. https://doi.org/10.5194/essd-9-99-2017
Brun, P., Vogt, M., Payne, M. R., Gruber, N., O'Brien, C. J., Buitenhuis, E. T., Le Quéré, C., Leblanc, K., & Luo, Y.-W. (2015). Ecological niches of open ocean phytoplankton taxa. Limnology and Oceanography, 60(3), 1020–1038. https://doi.org/10.1002/lno.10074
Castellani, C., Irigoien, X., Mayor, D. J., Harris, R. P., & Wilson, D. (2008). Feeding of Calanus finmarchicus and Oithona similis on microplankton
| 1441MCGINTY eT al.
assemblage in the Irminger Sea, North Atlantic. Journal of Plankton Research, 30, 1095–1116. https://doi.org/10.1093/plank t/fbn074
Chase, J. M., & Leibold, M. A. (2003). Ecological niches: Linking classical and contemporary approaches. University of Chicago Press.
Cheung, W. W. L., Lam, V. W. Y., Sarmiento, J. L., Kearney, K., Watson, R., & Pauly, D. (2009). Projecting global marine biodiversity impacts under climate change scenarios. Fish and Fisheries, 10, 235–251. https://doi.org/10.1111/j.1467-2979.2008.00315.x
Cheung, W. W., Sarmiento, J. L., Dunne, J., Frölicher, T. L., Lam, V. W., Palomares, M. D., Watson, R., & Pauly, D. (2013). Shrinking of fishes exacerbates impacts of global ocean changes on marine ecosystems. Nature Climate Change, 3(3), 254–258. https://doi.org/10.1038/nclim ate1691
Claireaux, G., & Lefrançois, C. (2007). Linking environmental variability and fish performance: Integration through the concept of scope for activity. Philosophical Transactions of the Royal Society B: Biological Sciences, 362(1487), 2031–2041.
Curry, R., Dickson, B., & Yashayaev, I. (2003). A change in the freshwater balance of the Atlantic Ocean over the past four decades. Nature, 426(6968), 826–829. https://doi.org/10.1038/natur e02206
Dam, H. G. (2013). Evolutionary adaptation of marine zooplankton to global change. Annual Review of Marine Science, 5, 349–370. https://doi.org/10.1146/annur ev-marin e-12121 1-172229
Daufresne, M., Lengfellner, K., & Sommer, U. (2009). Global warming benefits the small in aquatic ecosystems. Proceedings of the National Academy of Science of the United State of America, 106, 12788–12793. https://doi.org/10.1073/pnas.09020 80106
Dunne, J. P., John, J. G., Adcroft, A. J., Griffies, S. M., Hallberg, R. W., Shevliakova, E., Stouffer, R. J., Cooke, W., Dunne, K. A., Harrison, M. J., & Krasting, J. P. (2012). GFDL's ESM2 global coupled cli-mate–carbon earth system models. Part I: Physical formulation and baseline simulation characteristics. Journal of Climate, 25(19), 6646–6665. https://doi.org/10.1175/jcli-d-11-00560.1
Edwards, M., & Richardson, A. J. (2004). Impact of climate change on ma-rine pelagic phenology and trophic mismatch. Nature, 430(7002), 881–884. https://doi.org/10.1038/natur e02808
Elith, J., H. Graham, C., P. Anderson, R., Dudík, M., Ferrier, S., Guisan, A., J. Hijmans, R., Huettmann, F., R. Leathwick, J., Lehmann, A., Li, J., G. Lohmann, L., A. Loiselle, B., Manion, G., Moritz, C., Nakamura, M., Nakazawa, Y., McC. M. Overton, J., Townsend Peterson, A., … E. Zimmermann, N. (2006). Novel methods improve prediction of spe-cies' distributions from occurrence data. Ecography, 29(2), 129–151. https://doi.org/10.1111/j.2006.0906-7590.04596.x
Elith, J., & Leathwick, J. R. (2009). Species distribution models: Ecological explanation and prediction across space and time. Annual Review of Ecology, Evolution, and Systematics, 40, 677–697. https://doi.org/10.1146/annur ev.ecols ys.110308.120159
Evans, L. E., Hirst, A. G., Kratina, P., & Beaugrand, G. (2020). Temperature-mediated changes in zooplankton body size: Large scale temporal and spatial analysis. Ecography, 43(4), 581–590.
Garmendia, M., Borja, Á., Franco, J., & Revilla, M. (2013). Phytoplankton composition indicators for the assessment of eutrophication in marine waters: Present state and challenges within the European directives. Marine Pollution Bulletin, 66(1–2), 7–16. https://doi.org/ 10.1016/j.marpo lbul.2012.10.005
Garzke, J., Hansen, T., Ismar, S. M., & Sommer, U. (2016). Combined ef-fects of ocean warming and acidification on copepod abundance, body size and fatty acid content. PLoS One, 11(5), e0155952. https://doi.org/10.1371/journ al.pone.0155952
Greve, W., Reiners, F., Nast, J., & Hoffmann, S. (2004). Helgoland Roads meso- and macrozooplankton time-series 1974 to 2004: Lessons from 30 years of single spot, high frequency sampling at the only off-shore island of the North Sea. Helgoland Marine Research, 58(4), 274–288. https://doi.org/10.1007/s1015 2-004-0191-5
Hall, J. K. (2006). GEBCO centennial special issue – Charting the secret world of the ocean floor: The GEBCO Project 1903–2003. Marine
Geophysical Researches, 27(1), 1–5. https://doi.org/10.1007/s1100 1-006-8181-4
Hays, G. C. (2003). A review of the adaptive significance and ecosystem consequences of zooplankton diel vertical migrations. Migrations and dispersal of marine organisms (pp. 163–170). Springer.
Hazen, E. L., Jorgensen, S., Rykaczewski, R. R., Bograd, S. J., Foley, D. G., Jonsen, I. D., Shaffer, S. A., Dunne, J. P., Costa, D. P., Crowder, L. B., & Block, B. A. (2013). Predicted habitat shifts of Pacific top pred-ators in a changing climate. Nature Climate Change, 3(3), 234–238. https://doi.org/10.1038/nclim ate1686
Hébert, M. P., Beisner, B. E., & Maranger, R. (2017). Linking zooplank-ton communities to ecosystem functioning: Toward an effect-trait framework. Journal of Plankton Research, 39, 3–12. https://doi.org/10.1093/plank t/fbw068
Helaouët, P., & Beaugrand, G. (2009). Physiology, ecological niches and species distribution. Ecosystems, 12(8), 1235–1245. https://doi.org/10.1007/s1002 1-009-9261-5
Hinder, S. L., Gravenor, M. B., Edwards, M., Ostle, C., Bodger, O. G., Lee, P. L., Walne, A. W., & Hays, G. C. (2014). Multi-decadal range changes vs. thermal adaptation for north east Atlantic oceanic co-pepods in the face of climate change. Global Change Biology, 20(1), 140–146. https://doi.org/10.1111/gcb.12387
Hosie, G. W., Fukuchi, M., & Kawaguchi, S. (2003). Development of the Southern Ocean continuous plankton recorder survey. Progress in Oceanography, 58(2–4), 263–283. https://doi.org/10.1016/j.pocean.2003.08.007
Irwin, A. J., Nelles, A. M., & Finkel, Z. V. (2012). Phytoplankton niches estimated from field data. Limnology and Oceanography, 57(3), 787–797. https://doi.org/10.4319/lo.2012.57.3.0787
Jónasdóttir, S. H., Wilson, R. J., Gislason, A., & Heath, M. R. (2019). Lipid content in overwintering Calanus finmarchicus across the subpolar eastern North Atlantic Ocean. Limnology and Oceanography, 64(5), 2029–2043. https://doi.org/10.1002/lno.11167
Keister, J. E., Di Lorenzo, E., Morgan, C. A., Combes, V., & Peterson, W. T. (2011). Zooplankton species composi-tion is linked to ocean transport in the Northern California Current. Global Change Biology, 17(7), 2498–2511. https://doi.org/10.1111/j.1365-2486.2010.02383.x
Lefort, S., Aumont, O., Bopp, L., Arsouze, T., Gehlen, M., & Maury, O. (2015). Spatial and body-size dependent response of marine pelagic communities to projected global climate change. Global Change Biology, 21(1), 154–164. https://doi.org/10.1111/gcb.12679
Lewandowska, A., & Sommer, U. (2010). Climate change and the spring bloom: A mesocosm study on the influence of light and tempera-ture on phytoplankton and mesozooplankton. Marine Ecology Progress Series, 405, 101–111.
Litchman, E., Ohman, M. D., & Kiørboe, T. (2013). Trait-based approaches to zooplankton communities. Journal of Plankton Research, 35(3), 473–484.
Lonsdale, D. J., & Levinton, J. S. (1985). Latitudinal differentiation in co-pepod growth: An adaptation to temperature. Ecology, 66(5), 1397–1407. https://doi.org/10.2307/1938002
Mackas, D. L., & Beaugrand, G. (2010). Comparisons of zooplankton time series. Journal of Marine Systems, 79(3–4), 286–304. https://doi.org/10.1016/j.jmars ys.2008.11.030
Maps, F., Runge, J. A., Leising, A., Pershing, A. J., Record, N. R., Plourde, S., & Pierson, J. J. (2011). Modelling the timing and duration of dor-mancy in populations of Calanus finmarchicus from the Northwest Atlantic shelf. Journal of Plankton Research, 34(1), 36–54. https://doi.org/10.1093/plank t/fbr088
McGinty, N., Barton, A. D., Record, N. R., Finkel, Z. V., & Irwin, A. J. (2018). Traits structure copepod niches in the North Atlantic and Southern Ocean. Marine Ecology Progress Series, 601, 109–126. https://doi.org/10.3354/meps1 2660
McGinty, N., Power, A. M., & Johnson, M. P. (2011). Variation among northeast Atlantic regions in the responses of zooplankton to
1442 | MCGINTY eT al.
climate change: Not all areas follow the same path. Journal of Experimental Marine Biology and Ecology, 400(1–2), 120–131. https://doi.org/10.1016/j.jembe.2011.02.013
McQuatters-Gollop, A., Atkinson, A., Aubert, A., Bedford, J., Best, M., Bresnan, E., Cook, K., Devlin, M., Gowen, R., Johns, D. G., Machairopoulou, M., McKinney, A., Mellor, A., Ostle, C., Scherer, C., & Tett, P. (2019). Plankton lifeforms as a biodiversity indica-tor for regional-scale assessment of pelagic habitats for policy. Ecological Indicators, 101, 913–925. https://doi.org/10.1016/j.ecoli nd.2019.02.010
McQuatters-Gollop, A., Edwards, M., Helaouët, P., Johns, D. G., Owens, N. J., Raitsos, D. E., Schroeder, D., Skinner, J., & Stern, R. F. (2015). The Continuous Plankton Recorder survey: How can long-term phytoplankton datasets contribute to the assessment of Good Environmental Status?. Estuarine, Coastal and Shelf Science, 162, 88–97.
Möllmann, C., Kornilovs, G., Fetter, M., & Köster, F. W. (2005). Climate, zooplankton, and pelagic fish growth in the central Baltic Sea. ICES Journal of Marine Science, 62(7), 1270–1280. https://doi.org/10.1016/j.icesj ms.2005.04.021
Olsen, E. M., Ottersen, G., Llope, M., Chan, K. S., Beaugrand, G., & Stenseth, N. C. (2011). Spawning stock and recruitment in North Sea cod shaped by food and climate. Proceedings of the Royal Society B: Biological Sciences, 278(1705), 504–510. https://doi.org/10.1098/rspb.2010.1465
Pearson, R. G., & Dawson, T. P. (2003). Predicting the impacts of climate change on the distribution of species: Are bioclimate envelope models useful? Global Ecology and Biogeography, 12(5), 361–371. https://doi.org/10.1046/j.1466-822X.2003.00042.x
Pinsky, M. L., Worm, B., Fogarty, M. J., Sarmiento, J. L., & Levin, S. A. (2013). Marine taxa track local climate velocities. Science, 341(6151), 1239–1242. https://doi.org/10.1126/scien ce.1239352
Poloczanska, E. S., Brown, C. J., Sydeman, W. J., Kiessling, W., Schoeman, D. S., Moore, P. J., Brander, K., Bruno, J. F., Buckley, L. B., Burrows, M. T., Duarte, C. M., Halpern, B. S., Holding, J., Kappel, C. V., O'Connor, M. I., Pandolfi, J. M., Parmesan, C., Schwing, F., Thompson, S. A., & Richardson, A. J. (2013). Global imprint of cli-mate change on marine life. Nature Climate Change, 3(10), 919–925. https://doi.org/10.1038/nclim ate1958
Prowe, A. F., Visser, A. W., Andersen, K. H., Chiba, S., & Kiørboe, T. (2019). Biogeography of zooplankton feeding strategy. Limnology and Oceanography, 64(2), 661–678. https://doi.org/10.1002/lno.11067
Record, N. R., Ji, R., Maps, F., Varpe, Ø., Runge, J. A., Petrik, C. M., & Johns, D. (2018). Copepod diapause and the biogeography of the marine lipidscape. Journal of Biogeography, 45(10), 2238–2251. https://doi.org/10.1111/jbi.13414
Record, N., Runge, J., Pendleton, D., Balch, W., Davies, K., Pershing, A., Johnson, C., Stamieszkin, K., Ji, R., Feng, Z., Kraus, S., Kenney, R., Hudak, C., Mayo, C., Chen, C., Salisbury, J., & Thompson, C. (2019). Rapid climate-driven circulation changes threaten conservation of endangered North Atlantic right whales. Oceanography, 32(2), 162–169. https://doi.org/10.5670/ocean og.2019.201
Richardson, A. J. (2008). In hot water: Zooplankton and climate change. ICES Journal of Marine Science, 65(3), 279–295.
Richardson, A. J., Walne, A. W., John, A. W. G., Jonas, T. D., Lindley, J. A., Sims, D. W., Stevens, D., & Witt, M. (2006). Using continuous plank-ton recorder data. Progress in Oceanography, 68(1), 27–74. https://doi.org/10.1016/j.pocean.2005.09.011
Robinson, L. M., Hobday, A. J., Possingham, H. P., & Richardson, A. J. (2015). Trailing edges projected to move faster than leading edges for large pelagic fish habitats under climate change. Deep Sea Research Part II: Topical Studies in Oceanography, 113, 225–234. https://doi.org/10.1016/j.dsr2.2014.04.007
Sasaki, M. C., & Dam, H. G. (2019). Integrating patterns of thermal toler-ance and phenotypic plasticity with population genetics to improve understanding of vulnerability to warming in a widespread cope-pod. Global Change Biology, 25(12), 4147–4164.
Schmidt, K., Birchill, A. J., Atkinson, A., Brewin, R. J. W., Clark, J. R., Hickman, A. E., Johns, D. G., Lohan, M. C., Milne, A., Pardo, S., Polimene, L., Smyth, T. J., Tarran, G. A., Widdicombe, C. E., Woodward, E. M. S., & Ussher, S. J. (2020). Increasing picocyano-bacteria success in shelf waters contributes to long-term food web degradation. Global Change Biology, 26(10), 5574–5587. https://doi.org/10.1111/gcb.15161
Sorte, C. J. B., Williams, S. L., & Carlton, J. T. (2010). Marine range shifts and species introductions: Comparative spread rates and commu-nity impacts. Global Ecology and Biogeography, 19, 303–316. https://doi.org/10.1111/j.1466-8238.2009.00519.x
Staudinger, M. D., Mills, K. E., Stamieszkin, K., Record, N. R., Hudak, C. A., Allyn, A., Diamond, A., Friedland, K. D., Golet, W., Henderson, M. E., Hernandez, C. M., Huntington, T. G., Ji, R., Johnson, C. L., Johnson, D. S., Jordaan, A., Kocik, J., Li, Y., Liebman, M., … Yakola, K. (2019). It's about time: A synthesis of changing phenology in the Gulf of Maine ecosystem. Fisheries Oceanography, 28(5), 532–566. https://doi.org/10.1111/fog.12429
Steinberg, D. K., & Landry, M. R. (2017). Zooplankton and the ocean car-bon cycle. Annual Review of Marine Science, 9, 413–444.
Thackeray, S. J. (2012). Mismatch revisited: What is trophic mismatch-ing from the perspective of the plankton? Journal of Plankton Research, 34(12), 1001–1010. https://doi.org/10.1093/plank t/fbs066
Thomas, M. K., Kremer, C. T., Klausmeier, C. A., & Litchman, E. (2012). A global pattern of thermal adaptation in marine phytoplank-ton. Science, 338, 1085–1089. https://doi.org/10.1126/scien ce. 1224836
Thuiller, W., Lafourcade, B., Engler, R., & Araújo, M. B. (2009). BIOMOD – A platform for ensemble forecasting of species distributions. Ecography, 32(3), 369–373. https://doi.org/10.1111/j.1600-0587. 2008.05742.x
Villarino, E., Chust, G., Licandro, P., Butenschön, M., Ibaibarriaga, L., Larrañaga, A., & Irigoien, X. (2015). Modelling the future biogeogra-phy of North Atlantic zooplankton communities in response to cli-mate change. Marine Ecology Progress Series, 531, 121–142. https://doi.org/10.3354/meps1 1299
Willett, C. S. (2010). Potential fitness trade-offs for thermal tolerance in the intertidal copepod Tigriopus californicus. Evolution, 64(9), 2521–2534. https://doi.org/10.1111/j.1558-5646.2010.01008.x
Yang, Q., Dixon, T. H., Myers, P. G., Bonin, J., Chambers, D., Van Den Broeke, M. R., Ribergaard, M. H., & Mortensen, J. (2016). Recent increases in Arctic freshwater flux affects Labrador Sea convec-tion and Atlantic overturning circulation. Nature Communications, 7, 10525. https://doi.org/10.1038/ncomm s10525
Yebra, L., Bonnet, D., Harris, R. P., Lindeque, P. K., & Peijnenburg, K. T. (2011). Barriers in the pelagic: Population structuring of Calanus helgolandicus and C. euxinus in European waters. Marine Ecology Progress Series, 428, 135–149. https://doi.org/10.3354/meps0 9056
Zhang, X., Tarpley, D., & Sullivan, J. T. (2007). Diverse responses of vegetation phenology to a warming climate. Geophysical Research Letters, 34(19), L19405.
SUPPORTING INFORMATIONAdditional supporting information may be found online in the Supporting Information section.
How to cite this article: McGinty N, Barton AD, Record NR, et al. Anthropogenic climate change impacts on copepod trait biogeography. Glob Change Biol. 2021;27:1431–1442. https://doi.org/10.1111/gcb.15499