Embed Size (px)
Citation preview

Anthrax:
Evolutionary approaches for
genetic-based investigative tools
W. Ryan Easterday

© W. Ryan Easterday, 2011 Series of dissertations submitted to the Faculty of Mathematics and Natural Sciences, University of Oslo No. 1132 ISSN 1501-7710 All rights reserved. No part of this publication may be reproduced or transmitted, in any form or by any means, without permission. Cover: Inger Sandved Anfinsen. Printed in Norway: AIT Oslo AS. Produced in co-operation with Unipub. The thesis is produced by Unipub merely in connection with the thesis defence. Kindly direct all inquiries regarding the thesis to the copyright holder or the unit which grants the doctorate.


2
Table of Contents
Forward ......................................................................................... 4
Preface .......................................................................................... 5
Introduction .................................................................................. 6
Chapter 1
Use of Single Nucleotide Polymorphisms in the plcR Gene for Specific
Identification of Bacillus anthracis. 2004 (Easterday WR, Van Ert MN,
Simonson TS, Wagner DM, Kenefic LJ, Allender CJ, and Keim P) ....... 42
Chapter 2
Specific detection of Bacillus anthracis using a TaqMan® mismatch
amplification mutation assay. 2005 (Easterday WR, Van Ert MN, Zanecki
SR, Keim P) ................................................................................. 47
Chapter 3
Strain-specific single-nucleotide polymorphism assays for the Bacillus
anthracis Ames strain. 2006 (Van Ert MN, Easterday WR, Simonson TS,
U'Ren JM, Pearson T, Kenefic LJ, Busch JD, Huynh LY, Dukerich M, Trim
CB, Beaudry J, Welty-Bernard A, Read T, Fraser CM, Ravel J, and Keim
P) .............................................................................................. 54
Chapter 4
Global Genetic Population Structure of Bacillus anthracis. 2007 (Van Ert
MN, Easterday WR, Huynh LY, Okinaka RT, Hugh-Jones ME, Ravel J,
Zanecki SR, Pearson T, Simonson TS, U'Ren JM, Kachur SM, Leadem-
Dougherty RR, Rhoton SD, Zinser G, Farlow J, Coker PR, Smith
KL, Wang B, Kenefic LJ, Fraser-Liggett CM, Wagner DM and Keim P) ... 63

3
Chapter 5
Historical Distribution and Molecular Diversity of Bacillus anthracis in
Kazakhstan. 2010 (Aikembayev AM, Lukhnova L, Temiraliyeva G, Meka-
Mechenko T, Pazylov Y, Zakaryan S, Denissov G, Easterday WR, Van Ert
MN, Keim P, Francesconi SC, Blackburn JK, Hugh-Jones M and Hadfield
T) .............................................................................................. 73
Chapter 6
Bacillus anthracis in China and its relationship to worldwide
Lineages. 2009 (Simonson TS, Okinaka RT, Wang B, Easterday WR,
Huynh LY, U'Ren JM, Dukerich M, Zanecki SR, Kenefic LJ, Beaudry J,
Schupp JM, Pearson T, Wagner DM, Hoffmaster A, Ravel J and
Keim P) ...................................................................................... 82

4
Forward
Hot or Not?
The 2001 anthrax letter attacks demonstrated that Bacillus anthracis
spores can heavily contaminate a facility before anyone becomes aware of a
problem. Ideally, any future anthrax attack would first show up as a positive test
from routine air monitoring, not as a crisis days later when seriously ill patients
start appearing in emergency rooms. Unfortunately, researchers haven’t found it
easy to develop an accurate anthrax test, particularly when dealing with complex
environmental samples. One big problem is that B. anthracis is highly similar to
common spore-forming bacteria such a Bacillus cereus and Bacillus
thuringiensis. The specter of multiple false alarms and consequent public apathy
gives serious cause for concern. Easterday et al. (p. 731) now provide some
hope for developing specific and sensitive anthrax detection methods. In
previous work, they showed that a single nucleotide change corresponding to a
nonsense mutation in the plcR gene, though present in 89 different B. anthracis
isolates, is absent in the bacteria’s genetic near-neighbors. In this report, the
researchers describe the validation of a real-time PCR-based mismatch
amplification mutation assay for specific quantitative detection of B. anthracis
DNA. The assay successfully amplifies as little as 25 fg B. anthracis DNA, even in
the presence of air filter extracts containing a 20,000-fold excess of DNA
differing in sequence only at the SNP position. The task of homeland defense
initiatives remains enormous, but advances such as this should help front-line
personnel determine more rapidly whether a sample contains a hot agent.
Unknown author
BioTechniques (Vol. 38, No. 5 (2005) pg 667)

5
Preface
As humans it seems we have always been developing ideas and
methods to describe the world around us in a context we can understand.
From fairy tales to religious texts it has been our attempt to describe
causation and order or in simpler terms the ‘how.’ Through the
development of Logic and Science the how is on its way to be answered.
Where the end is we don’t know, and we can only guess at the possible
infinity. In man there is a continuum of thought stretching from these
minds that first sparked the ideas that would lead to science as we know
it today. These are the moral scientists who stood up for truth and would
accept nothing less. Today we still have an obligation to produce honest
work. We are responsible for our future.
None of this work would have been possible without the support of
my friends and colleagues. I would first like to thank my colleague and
friend Matt Van Ert whose enthusiasm, encouragement and guidance
solidified who I am as a scientist. I would also like to thank my colleagues
Zack Jay, Jana U’Ren, Tatum Simonson, Leo Kenefic and Shaylan Zanecki.
I would also like to express my gratitude to Nils C. Stenseth for
supporting me in compiling this thesis.
Most of the work presented here was done in Paul Keim’s Genetic
Laboratory at Northern Arizona University. The focus of his lab has
enabled the development and accomplishment of these projects. This
work was funded largely by the U.S. Departments of Energy and
Homeland Security, National Institutes of Health, the U.S. Federal Bureau
of Investigation, General Medical Sciences, the Cowden Endowment at
Northern Arizona University, and the Defense Threat Reduction Agency.
This thesis was compiled at the Centre for Ecological and Evolutionary
Synthesis (CEES), Biological Sciences at the University of Oslo, Norway
for the degree of Doctor Philos.

6
Introduction
While many researchers see increasing incongruity in the biological
sciences due to increasing specialization others see opportunity through
collaboration creating synergy. This synergy will be created when we as
researchers are able to span the gaps between the different disciplines in
biology. Indeed here at the Centre for Ecological and Evolutionary
Synthesis at the University of Oslo, Norway we are already beginning to
see efforts to bridge different disciplines within biology together. Where
genetics and molecular biology had been disciplines unto their own, they
are now being practiced in many fields within biology including population
biology, ecology and paleontology. The genetics and now genomics
revolution has been infiltrating all parts of biology.
This thesis is a compilation of works done on a specific bacterial
pathogen, Bacillus anthracis, and even more specifically on the
evolutionary genetics of this organism with respect to its geography.
Here, through the introduction I will be explaining my own personal views
of how biology is naturally structured and interconnected. Given the
present state of research, how will the future of biology naturally evolve?
Although we cannot see extremely far into the future we can see the next
logical steps in this progression by examining the tools and methods we
have today and given the rate of development, we can imagine what the
near future holds in store for biology. It continues into the introduction of
the chapters and the considerations, such as evolution, ecology
(epidemiology), biological warfare and forensics that have bearing this
work.
Causation- event and outcome
After working for nearly a decade in biology in a diverse set of fields
within biology I began to see the natural connectivity between these
fields. Not so much in the fact that they dealt with life but that they all
dealt with evolution and hence studied change. Change is what everything

7
in biology, and the universe for that matter, centers around. In biology,
broadly speaking, we try to take a measurement of something physical
and then after some duration we measure it again and that difference is
its rate of change. In experimental biology we try to fix all the
components that can change naturally by controlling the variability
through consistency across replicated experiments. Once we are able to
control the variability in a system we have a null to compare against,
after we have added some effecter. Here we can directly measure the
change from this null to the aftermath of the experiment. The final
differences between the null/control experiment and experiment with
variables are the measure of the net effect the variation has on the
outcome.
This type of process is used throughout biology to first fix the
components that we want to measure to create a null or negative control
then introduce a change or let it occur naturally. We then use these data
of change to predict what will occur in the future for similar circumstances
or systems given previous rates of change by a known effecter. This is
true across all levels in biology throughout Central Dogma up to
Landscape Ecology. In practice we must understand causation, or
correlation where causation cannot be teased out from a number of
possible effectors, to begin to learn from that which we study.
Biology and the processes that occur within this study are ruled by
the laws of physics. It is therefore quite helpful to understand some of
these physical laws of the universe, especially causation. Causation is a
central law of the Universe where real matter, which makes up the
Universe, is involved. Nothing in the Universe is static; specifically
everything in the Universe is made up of matter which has energy or
velocity. All matter is moving and at this specific moment in time all
matter is at a finite distance from all other matter. Many of these
distances will change at the very next moment, yet this change is ruled

8
by laws where matter with a velocity cannot skip space through time, but
it must occur at the adjacent space in the next future segment of time.
Take for instance a ball being thrown from one person (A) to
another person (B) in outer space. The ball will travel the distance (10
meters) from person A to person B in 10 seconds. When the ball is
released by person A, a velocity of 1 meter per second is imparted unto
the ball. Velocity, direction and speed, determines the path of the object,
the path is made up of continuous time, over 10 seconds, and discrete
space. Think of this space-time as a 3 dimensional object. To help
illustrate this if you as an observer had a camera set-up with a 10 second
exposure and took a picture of the path of the ball, in the picture you
would see a 3-dimensional rod between person A and person B. This rod
is really a 4-dimensional object (3 dimensions of the ball plus one
dimension of time). We can then break up this 4 dimensional rod into
discrete segments of time. If we break up the duration of the path into 1
second segments (10-1 second exposures), in sequential order they
would make up the path of the ball. Let’s number these segments 1
through 10 respectively from A to person B. In space (uniform gravity)
the velocity of the object will be unchanged therefore the 10 space-time
objects (10- ‘ball through space’ for 1 second) will look exactly the same
except for the relative position of the objects between person A and B.
Given these conditions of position and velocity (speed and direction) an
earlier section will solely determine the shape of next 4-d section. This
prediction is possible in this type environment because we know the
velocity (cause) will affect the subsequent event. Here we have one
attribute (velocity) of one object causing the next subsequent event in
time, an effect.
This is causation in a most simple form and this is what we must
first understand and identify in all sciences including biology. In biology to
truly understand what we are studying we must first identify and
understand the natural course of the biological elements without influence

9
from extrinsic sources. Let’s go back to the ball in space, since we have
this understanding of how the object will travel with respect to space and
time with no forces involved, other than inertia of the ball we can predict
its path in both directions of time, future and past. Yet if the outcome is
different from what we predict, for instance that the ball doesn’t reach
person B we know that there must be other forces acting upon the ball
changing the result. If we bring this example from space to earth where
person A and B are now playing catch in a vacuum we will see new
effectors on the path and outcome of the object. From our null example in
space we predict that the ball will leave person A’s hand at time 0 and
follow a direct path to person B’s hand in exactly 10 seconds. On earth
given no previous understanding of gravity we expect the same outcome.
Yet when we see a different outcome, the ball colliding with the ground,
we can conclude that being on earth (the only variation in conditions) has
a direct measurable and consistent (in the sense that it is reproducible)
effect on the ball.
We can then measure this difference from our null in outer space
from the ball on earth to calculate the affect of gravity on the ball. After
we know this variable and its effect on the change of our 1 meter per
second velocity, we can now determine the path of the ball in both
directions of time given any position in its path between person A and the
ground.
X
Y
X X
Y
X

10
Figure 1: Simple diagram showing causation through space (compressed
to 2-d: X, Y) and time Z.
To better illustrate causation there are two figures above (fig. 1).
Within each of the two figures there are three sequential planes along the
Z-axis (time) the further plane is the past, the nearest is the future.
These X, Y planes represent a two-dimensional space which is some
measurable quality or quantity. Along the Z- axis is time, time and
sequence are not often actively thought about as we often take time for
granted because it is a natural process that has bearing on everything we
do.
At the beginning of the model on the left a force is applied to the
dark blue square into the lower figure which creates change in velocity
(directional), indicated by an arrow (fig. 1). We are able to recognize and
measure this change because we are able to subtract that from the null
control on the left side.
This very simple diagram showing causation is illustrative for nearly
every process that belongs to the universe including biology, where
everything has a sequential path through space and time. In static
conditions, where there is a null effect from the surrounding environment,
the path is straight through space over time. Yet where there is an effect
from the surrounding environment the object’s path is affected leading to
a different than predicted (null) outcome.
Biology
The individual organism is something we can identify with because
we are all individuals. The individual is the biological entity which interacts
with the world (biotic and abiotic) proximate to it. Every organism looks
the way it does for two reasons: 1) the heritable traits of the genome
contained within and 2) the development of the organism that is driven
by the interaction of the genome and the environment. If you look at

11
biological history from the present to the beginning of life it divides into a
history of converging lineages or paths going back through time. These
can be broken into smaller pieces down to the life of individual organisms
which are small segments of any given lineage, similar to the ball in space
discussed earlier which starts at one point and ends at another occupying
the 4-dimensions of space and time. The life of individual organisms can
be further simplified into a series of events or effecters (like gravity
although its effects are constant). Each event has an outcome that is
predicated upon the natural laws in physics which bears directly on
development, development on fitness and fitness on evolution. Evolution
is the addition of these small physical events (feeding, reproduction,
agility, etc.) where sometimes luck but ultimately fitness (these small
differences in phenotype that make the difference) determines the
outcome: perpetuation of life. Each event will have an outcome and every
outcome influences the next event. This event and outcome is just
causation which is a theme that runs through all disciplines in biology and
it is the mechanism of evolution.
In biology there are often outcomes caused by culmination of small
events, we see their subsequent effects on higher orders of complexity
such as within Central Dogma. Central Dogma is useful to help
understand biology and evolution. Central Dogma is structured in a way
that the smaller things create and make-up the bigger things. This starts
at the level of genes where the genes are responsible for the coding of
proteins. These proteins are the machinery and building blocks of cells.
Cells together (in multi-cellular organisms) create tissues which serve
specific functions. These create organs and structure which serve as
machinery (organs) for the organism. Although not typically talked about
as being part of Central Dogma we can continue to extrapolate: the
organism is a single member of a population, the population is part of an
ecosystem and the ecosystem is part of the biome.

12
Now think of the above structure as a linear progression from genes
to organism to population to ecosystem to biome. Everything biological is
built by this process. It is difficult to identify all the factors contributing to
or changing the expression of genes without removing the effecters. How
do we study and learn the true effects of the external proximate
environment on the outcome of phenotype; and how does this phenotype
interact with the world around it?
The Null Organism
There are a couple ways to study the genotype-phenotype
relationship, one way can be done in the natural environment (Gilbert
2004) which I will discuss later, the other is in a lab and until recently has
been our only real option. An organism whose developmental needs are
not limiting in a completely controlled environment is a good model to
start with. To do this you’d need to strip away all the extrinsic factors that
influence the development of an organism and not limit the necessary
resources for growth and development. Our goal will be to see the true
translation of genotype to phenotype. One of the best example of this,
was work that was done in the MIR space station, even though this is not
what they were intending to study directly (NASA 2006), it provides a
very good example of how small influences shape the development of life.
On MIR research teams have been growing soybeans (Glycine max)
in microgravity to develop processes for growing food using aeroponics to
supply long distance space missions, such as a mission to Mars. As a
biologist some of the small anecdotes they mentioned fascinated me.
Growth rates of the soybeans (on earth) using aeroponics was much
higher than those grown in soil (aeroponics is a growing system where
roots are not planted but suspended by a trellis in the open air and
misting system supplies water and nutrients directly to the roots). In
addition to this, soybeans grown using aeroponics on MIR in the
microgravity of space had an even faster growth rate than those grown

13
aeroponically on earth. In space we have a plant close to a ‘null’ in terms
of development. If we go from space to earth the effect of gravity is
added to the outcome of the plant, which is seen in the reduced growth
rate as there is now energy being spent to overcome gravity.
The more influences or constraints we put on the organism as it
develops we can begin to measure the effects the proximate environment
has on the phenotype. These induced phenotypes sould provide
advantages to the organisms which express them (i.e. reduced predation
as seen in Daphnia and carp, increased maturation rate like in the
development of spade-footed toad tadpoles) with some cost or trade-off
(i.e. slower speed/less efficient locomotion or smaller size at maturation).
The Null Plus
Since null organisms do not occur in natural settings they are a null
plus the net effect of environmental influences. The expression of genes
under the conditions of the specific proximate environment is responsible
for the phenotype. This phenotype is the organism that interacts with the
environment and other organisms around it. However small or
insignificant these interactions with the environment seem to impact an
organism, their sum can have great influences on that organism’s life. For
instance the European map butterflys’, Araschnia levana, development of
wing patterns is changed by differential expression of genes driven by
climate (temperature). During the cooler spring the outcome is a more
reticulated pattern and during the warmer summer a darker less
reticulated pattern (Gilbert 2004).
If the interaction is an event which is ubiquitous across a habitat
such as an unusual temperature or precipitation fluctuation the event can
affect the development impacting overall fitness of a population having a
ripple effect in the evolution or success of the lineage. If we had a series
of warmer springs and began having summer morphs in the spring, how
would this affect the success of: these individuals? the population? These

14
are things we are not certain of because we do not understand the degree
of phenotypic plasticity that is achievable determined by the influences of
environment. Nor do we understand how ‘fit’ this phenotype will be to its
environment, although we do have examples with Daphnia (Agrawal et al
1999) and carp, Carassius carassius (Brönmark et al 1994)
Biology’s Future
-Yesterday
When thinking of evolution, which elements play an applied role to
diversifying species? More specifically which physical elements
mechanically drive evolution and explain why differences within and
among species exist? Evolution of life on earth can be thought of as
similar to Newtonian Gravity with respect to its relativity. This description
of relativity is the strength (gravity) of the relationship between two
objects, with respect to size (mass) of and the distance between the two
objects. Many of the physical mechanisms driving selection and evolution
have a higher effect with higher relativity (proximity between two or more
organisms in space and time and the strength of the relationship(s)). We
see these types of relationships from the very small gene networks (Tong
et al 2004) to the large ecological networks. Where and when an
organism exists in space and time is its occurrence. Occurrence
determines the context of the object or organism and its proximity to
other real matter. This context is a compilation of physical factors, biotic
and abiotic which make up the real earth we know.
This context is the measure, quantification and qualification of the
physical environment, the data can be organized and related using space
and time. Context and the change of context have a profound effect on
the development, survival, adaptation and evolution of organisms. The
variety of organisms and their genes within are directly linked to their
occurrence. The genes and the influence of environment create the
phenotype which is adapted to specific environments. This was a lesson

15
learned by Darwin nearly one hundred and eighty years ago and became
a foundation in evolutionary thought.
It was at first not apparent to the young researcher that part of
what defined a species was its occurrence, as adaptation to these
environments has guided the species’ evolution. “I have not as yet
noticed by far the most remarkable feature in the natural history of this
archipelago; it is, that the different islands to a considerable extent are
inhabited by a different set of beings. My attention was first called to this
fact by the Vice-Governor, Mr. Lawson, declaring that the tortoises
differed from the different islands, and that he could with certainty tell
from which island any one was brought. I did not for some time pay
sufficient attention to this statement, and I had already partially mingled
together the collections from two of the islands (Darwin 1845).”
Due to Lawson’s statement, Darwin realized that there was a link
between the specific physical habitat and the types of organisms
inhabiting it. The occurrence of a species depends on its ability to exploit
the resources of the specific environment and this environment has
shaped the evolution of the species. The physical environment is in many
ways primarily responsible for the genes that exist with it, their
expression into phenotypes and the evolutionary pressures which
maintain stasis or force/allow change/drift.
-Tomorrow
As biologists we stand on the verge of whole genome sequencing
becoming a tool that is available to all institutes and all budgets. Single-
molecule whole-genome sequencing will dramatically lower costs in both
the technology and the data analysis (Venter 2010). This capability will
produce vast amounts of genetic data. How we manage, couple or
integrate these data will not only directly impact the value of the parts
but will dramatically impact the value as a whole.

16
When collecting organisms and sequencing their genomes we are
describing these organisms in a most detailed way. However, as was
mentioned earlier this genome or genotype does not necessarily
correspond to a phenotype. There are many other factors that influence
the expression of genes and their influence on the development and
plasticity of the organism’s traits. These factors are the components of its
context of existence. This existence occupies a discrete dimension
consisting of both real-world space and time. Along this flux of existence
biotic and abiotic factors are literally helping shape the organism by
extrinsic pressures. Intrinsic and extrinsic biotic and abiotic factors (diet,
competition, climate, etc.) drive how an organism’s genes are expressed
and ultimately resulting into a phenotype. This phenotype interacts with
the world around it and the fitness of this phenotype to the environment
directly impacts the survivability of the organism, its genes and the
perpetuation of its lineage. The genotype/phenotype and their applied
fitness to their environment have been honed by the normalities of the
environment and impacted severely by dramatic events that have
occurred to the lineage. This is what truly worries many biologists about
dramatic climate change. If a climatic event is too extreme for a key
species or many species, will the overall system be able to cope and
function without completely collapsing.
The genome harbored within an organism is truly rare as it exists
once in discrete time and space. The continuation of any lineage must
occur from one individual to the next, between the parent and the
progeny. Here there must be a mechanical movement of genes from one
organism to the next. Genes are passed and linked directly through time
and space, creating an unbroken four-dimensional continuation between
parent and offspring. This coupling between parent and progeny is one
physical link in the chain or lineage which occupies space through time, it
stretches from the present back to the origins of life. Along any lineage

17
are the forces external to it, the proximate environment, which have
guided its evolution and direction in real space through time.
Increasingly larger data sets are now and have been the trend in
biology. Larger data sets over longer time series gives more insights into
the natural variation that occurs within populations and help reveal how
selection and environment shape the evolution and distribution of species.
Increased data sets will also help shed light on atypical patterns of
occurrence and variation. In the future, genomic and other possibly
heritable data from an individual and data of its occurrence will naturally
allude to the connections between each scale in central dogma from DNA
to organism to population. Although from a different point of view.
Currently RNA transcription libraries are created to determine how
variations of one gene are being expressed under controlled or defined
expression parameters. In the future we will be able to measure
variations in the genome that account for these phenotypic differences.
We can find these differences by subtracting likeness between to sets of
genomic data, whether it is between two organisms or an organism and a
population or two populations of a species etc., we can identify genetic
differences responsible for phenotypic differences between groups. In fact
this type of approach has been used to identify new pathogens specifically
viruses that have become cryptic by embedding themselves within their
host’s genome (MacConaill et al 2008). In short large genetic data sets
alone can be very powerful tools for everything from evolution to public
health as seen in the 1000 human genomes project (Consortium 2010).
Yet there will be instances where genetic or other heritable data will
not provide answers for observations in terms of phenotype. In lieu of
these genetic differences the data would suggest external factors that are
responsible for differences in phenotypes. Specifically data associated
with the context of that organism. These data include all of the
environmental data associated with the organism’s habitat throughout its
development. These factors can also be teased out by subtraction. Subtle
18
differences within one habitat can have large impacts on the phenotype of
organisms. Larger data sets combined with environmental data Central
dogma with the impact of the environment that translates into a
phenotype
Why these genes are the way they are and function the way they
function is because of where they have originated. This is something that
has largely been taken for granted or ignored by many geneticists and
biologists. Yet, very recently ecologists and population biologists are
beginning to use genetics as tools to explain phenotype. Even though
unifying these disciplines is still a ways off, what will be next?
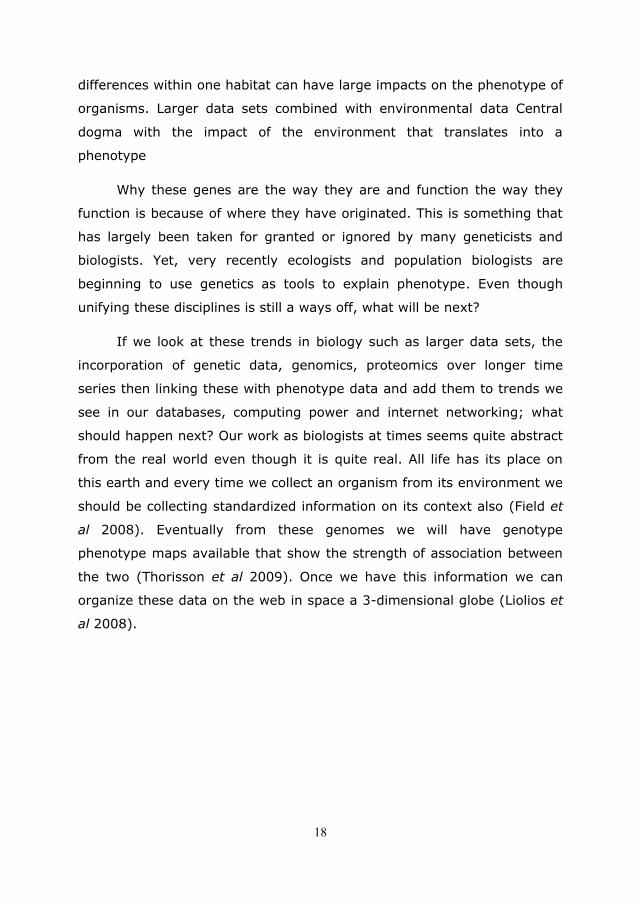
If we look at these trends in biology such as larger data sets, the
incorporation of genetic data, genomics, proteomics over longer time
series then linking these with phenotype data and add them to trends we
see in our databases, computing power and internet networking; what
should happen next? Our work as biologists at times seems quite abstract
from the real world even though it is quite real. All life has its place on
this earth and every time we collect an organism from its environment we
should be collecting standardized information on its context also (Field et
al 2008). Eventually from these genomes we will have genotype
phenotype maps available that show the strength of association between
the two (Thorisson et al 2009). Once we have this information we can
organize these data on the web in space a 3-dimensional globe (Liolios et
al 2008).

19
Figure 2: Biology’s future interactive database to visualize genetic and
environmental information with occurrence/migration patterns. The user
will upload genome data along with MIGS (Field et al 2008) that will
eventually include phenotype data (Houle et al 2010), long-term GPS data
for animals capable of movement along with progeny data where
available. The user can build phylogenies in space-time according to a
specific gene or multiple genes, species, genera, phenotypic traits, etc.
The user can also use the database to build 4-D models of ecological
niches and run evolutionary simulations.
We can even go one step further and plot these data in time within
the globe. To visualize this take the earth and cut it into equal halves (Fig

20
2). At its center will be time zero for life, some 3.5 billion years, at its
crust will be the present. In order to fit everything into this globe the
visual data would need to be compressed logarithmically as data moves
from the ‘crust’ to its core. As we are able to collect more and more
information on individuals such as movement and migration patterns
using GPS tracking, we can incorporate these data to build a 4-
dimensional existence of an individual. Collecting these types of data over
multiple members within a population over generations we can build
digital reconstructions of real world phylogenies. The user will also be able
to build models changing environmental variables to see their impact on
species or systems.
With the data accompanying these phylogenies we can begin to see
how individuals and populations interact with the changing environment.
Over longer periods of time we can begin to quantify and qualify
properties of the environment that are selecting for the fit types from a
population over time. We will be able to watch genes change with the
environment or migrating to avoid environmental changes. We can see
specific environmental ques that are responsible for phenotypes. The
larger this database becomes the more powerful it will be to answer the
finer peculiarities from the biological world.
For biology to answer bigger questions we need bigger tools the
earth through time is the all encompassing (assuming they won’t find life
on Mars) context for life. It relates all life through space and time with
respect to the abiotic environment. We can use a tool like this to study
the life histories of organisms including pathogens and their hosts.
Pathogens
I have always found pathogens interesting, especially the semi-
obligate pathogens because they seem to have one foot in each door:
unable to walk away from their existence as a pathogen and also not able
to make the complete jump to an organism that solely relies on its host.

21
Pathogens are really no different than other forms of life. They require
extrinsic energy to live and to proliferate. Although they have specialized
to parasitize other life to acquire their energy. Having an ability to
transmit between hosts and exploit its resources is the simple reason for
their existence. The evolution of pathogens and their virulence (ability to
exploit the host) largely depends on the specific type of relationship
between the pathogen and its host. These relationships have been
classically divided into three groups: obligate, opportunistic and
accidental pathogens. Although these classifications describe the
necessity of the host for the pathogen to proliferate they do not always
take into account the necessity of the host for the pathogen’s persistence
and the evolutionary pressures that persistence plays in virulence.
For instance two bacterial pathogens Mycobacterium tuberculosis
and Bacillus anthracis would both be put into the ‘obligate’ pathogen
category. Yet there is a big difference between the two in terms of
disease pathogenesis and mortality. M. tuberculosis is transmitted directly
from one host to the next and causes a chronic pulmonary infection.
Whereas B. anthracis causes an acute and fatal infection. The
evolutionary pressure on virulence (strategy of exploiting the host) lies in
the transmission from one host to the next. For M. tuberculosis a chronic
infection lengthens the time and increases the opportunity for
transmission. For B. anthracis transmission only occurs after the death of
the host, leaving no immediate selective pressure to lower virulence. This
specific relationship between this pathogen and its host create the
selective pressures which determine the morbidity caused by the
pathogen to the host.
Managing infectious diseases that effect livestock, crops, wildlife
and human health requires the ability to predict, detect, and effectively
curtail naturally occurring infectious disease epidemics and epizootics.
Central to this is the development of tools that allow us to monitor the
environment and hosts for selected pathogens, as well as detect and track

22
the progression of pathogens through an outbreak. Following the 2001
anthrax attacks in the United States, it became apparent that the same
tools used in epidemiological and evolutionary studies of infectious
disease are very relevant in law enforcement and intelligence
applications.
Since biocrimes and bioterrorists attacks are typically by design
covert, prevention is unlikely. Instead, a retrospective microbial forensic
investigation of the event is a more probable outcome, followed by
attribution and, if possible, apprehension. The microbial forensic
investigation and attribution relies on methods and tools to precisely
identify the attack strain that was released and the ability to link
biological evidence among crime scenes, and ultimately to a source and a
responsible person or party. Considering the paucity of physical
characteristics available to uniquely identify and differentiate microbial
evidence, genetic signatures are of central importance in any
investigation.
Introduction of the Chapters
This dissertation describes the development of highly precise and
sensitive molecular detection and typing tools for the pathogen Bacillus
anthracis, and the application of these tools for forensic and
epidemiological analyses. The chapters herein represent a top down
approach to genetically describing B. anthracis isolates in the context of
their world population using both Single Nucleotide Polymorphisms (SNPs)
and Multiple Locus Variable Number of Tandem Repeat Analysis (MLVA),
although much of my contributions to chapters 4, 5 and 6 specifically
focus on the application of SNP data. It begins at chapter 1 ‘Use of Single
Nucleotide Polymorphisms in the plcR Gene for Specific Identification of
Bacillus anthracis in which we define the species as compared to its
nearest known genetic relatives. At this division there is a distinct
phenotypic dimorphism caused by this nonsense mutation in the plcR

23
gene. A single nonsense mutation in this gene shuts off the downstream
genes that it is responsible to regulate. Shutting these genes off is a
necessary trade-off to allow B. anthracis to sporulate after killing its host,
which is a central step in the ecology and persistence of this pathogen.
Using a ubiquitous and specific SNP allows fast and clear typing between
typical B. anthracis strains and their nearest relatives.
Chapter 2 continues with the use of this same mutation ‘Specific
detection of Bacillus anthracis using a TaqMan® mismatch amplification
mutation assay (taqMAMA)’ which only allows the polymerase to extend
off the specific nonsense mutation in B. anthracis. This allows the
researcher or investigator to detect B. anthracis by specifically ‘fishing’ it
out of a pool of genetic templates that may only differ by a single SNP
without cross reactivity (false positives). Although not published this
same type of assay, taqMAMA, was designed and used for some of the
SNP markers in chapter 3 to specifically detect the Ames strain.
The use of this method was extremely important to forensic
investigators during the Amerithrax investigation. Because the goal of this
case was to identify a suspect then trial that person using evidence
collected during the investigation. In order for the evidence to hold up in
court much forethought was put into the analysis of materials collected,
especially in instances where there was no B. anthracis that was
culturable in environmental type samples. The risk of false positives was
quite high using traditional PCR- based detection assays because of their
ability to cross-react with the DNA found in close relatives of B. anthracis
in the Bacillus cereus group, a very common environmental bacterial
group. This method allowed very sensitive detection of B. anthracis even
the presence of near neighbors and extracts that could inhibit or create
false positives using PCR.
Where this method really differs from most real-time PCR assays
used for detecting pathogens is that it uses a small yet significant marker
that has true biological significance for this pathogen (Easterday et al

24
2005, Mignot et al 2001). In contrast up to this point many markers were
either developed by using genes that were assumed to be unique or by
BLAST at a time when the genetic databases were quite small, to identify
unique regions in the pathogen of interest. After designing makers in
these unique regions they were often tested against a variety of lab type
strains within the species of interest and among other species.
Chapter 3 ‘Strain-specific single-nucleotide polymorphism assays for
the Bacillus anthracis Ames strain’ demonstrates the ability to rapidly
detect a specific strain of B. anthracis, in this case Ames, the classic
laboratory and infamous 2001 letter attack strain, by using SNPs and the
dramatic advantages this approach allows. Any one of these 6 SNPs are
quite specific to Ames. In fact 5 of the 6 SNPs can differentiate Ames from
the known diversity of this pathogen including its closest genetic relatives
isolated from neighboring counties in Texas, USA. Most importantly this
chapter illustrates the dramatic advantages this approach allows. This is
similar to chapter 1 in the sense that the SNPs define specific lineages,
although they differ from one another as the plcR SNP is most basal in B.
anthracis phylogeny, whereas the Ames SNPs are much more derived in
recent evolutionary history. This approach that utilizes SNPs can be used
to define species, clades or isolates is continued in the following chapter.
This method as well as many of these others were developed from
the combination of demand and curiosity. There was a specific need for
these types of tools to aid in the Amerithrax investigation. Typically it
would take days to DNA fingerprint a hundred samples to forensic
standards. In contrast with this method that combined smarter markers
with faster scoring methods an investigator could now identify process
thousands samples to identify the presence of the Ames strain to forensic
standards in a single day.
Chapter 4 is the most complete description of the world population
of B. anthracis in the literature to date. ‘Global Genetic Population
Structure of Bacillus anthracis’ is a description of genetic groups and
types as defined by SNPs and MLVA. The geographic distribution of many

25
of these groups has revealed trends of occurrence for anthrax. This in
turn has led to further more focused investigations into the dispersal of B.
anthracis such as chapter 6, as well as Kenefic et al’s research into the
origins of anthrax in North America (Kenefic et al 2009). Despite being a
highly monomorphic species, the evolutionary history of B. anthracis
proves to be interesting as it is a good example to understand the
evolution of pathogens routinely going through population bottlenecks
(Handel et al 2008) and how they spread and evolve in the absence of
horizontal gene transfer and genetic recombination which is common in
many other pathogens, Burkholderia spp. and Bartonella spp.
Many of these B. anthracis strains were provided by Dr. Hugh-Jones
who has spent a life time amassing this collection.
Chapters 5 and 6 are more focused reviews of anthrax in two Asian
countries, Kazakhstan and China respectively. Kazakhstan is a unique
data set, and in fact is the first genetic description of naturally occurring
B. anthracis strains from any part of the former Soviet Union: ‘Historical
Distribution and Molecular Diversity of Bacillus anthracis in Kazakhstan,’
Chapter 6, ‘Bacillus anthracis in China and its relationship to worldwide
lineages’ describes interesting trends of diversity within China and the
relationship between some Chinese strains with North American strains.
These trends were first recognized by M. Van Ert during the preparation of
chapters 3 and 4.
Both Kazakhstan and China have problems with anthrax killing
livestock and humans. In these countries where often much of a family’s
wealth is invested into their livestock, the untimely death of these animals
can have huge impacts on the family. It is then decided whether to
destroy the carcass and suffer the loss or try to salvage some of the
wealth by butchering and selling the meat. Occasionally the animal dies
from an infectious disease sometimes it is anthrax. This contaminated
meat is then sold, becoming a public health problem. DNA fingerprinting
tools are helpful to investigate outbreaks. Building baseline data such as

26
in chapters 5 and 6 give investigators tools to find the source of infection
and route of transmission.
Prior to these chapters, I present background on B. anthracis since
understanding the challenges associated with molecular forensics and
epidemiology of this pathogen requires a discussion of; 1) the role of B.
anthracis as a bioweapon, 2) the ecology and evolution of the pathogen,
3) the identification of genomic variation and genetic markers between B.
anthracis and genetic near-neighbors and within the species; and 4) the
forensic considerations when leveraging assays and global genetic data
for forensic applications. First, however, it is of benefit to examine the
significance of B. anthracis as a bioweapon.
B. anthracis as a Biological Warfare Agent
The communicability of disease has been known by humans for
centuries and this knowledge has been leveraged to disseminate diseases
creating morbidity, mortality and fear. Some of the first accounts of the
use of biological weapons date back to 400 BC, when Assyrian archers
used a blood/manure mixture on their arrows to promote wound infection.
Even more notably, at the beginning of the Black Death in 1344, plague
victims’ bodies were catapulted into the besieged city of Caffa by the
Tartars in an attempt to spread the Plague, caused by the bacterium
Yersinia pestis. Eventually the besieged Genoese fled back to Italy
bringing with them this disease and starting the Medieval Plague in
Europe (Handysides 2009). In more recent history, after germ theory
became fact and a working discipline, this type of warfare has been
increasingly researched and refined.
In the 20th and 21st centuries, considerable state-sponsored
research and funding has gone into selecting effective organisms for
biological warfare and a diversity of bacterial and viral agents have been
weaponized, including; B. anthracis (Anthrax), Brucella spp. (Brucellosis),
Fransicella tularensis (Tularemia) and variola major (smallpox)

27
(Kortepeter et al 1999). Among the bacterial biothreat agents, B.
anthracis represents a particularly attractive choice as a bioweapon for a
number of reasons. The ease of cultivation and high virulence of B.
anthracis likely contributes to its attractiveness as a weapon. However,
the ability of the bacteria to form highly stable, environmentally resistant,
infectious spores is a central reason for its weaponization by many
countries during the 20th century including the Soviet Union, the U.S.A.,
Great Britain and Japan (Handysides 2009). The pathogen has gained
further notoriety in recent history as a weapon of biological terrorism in
Japan in 1993 (Kortepeter et al 1999) and the U.S.A. in the 2001 letter
attacks (Inglesby et al 2002). It was the latter attack that spawned one of
the largest and most expensive criminal investigations in U. S. history,
and illustrated the real-world efficacy of B. anthracis as an agent of
bioterror.
Not surprisingly, the fields of biosecurity and bioforensics grew
immensely following the 2001 letter attacks as governments started
pouring huge sums of money into the development of tools for pathogen
detection and monitoring (Bohannon 2003). To focus regulatory and
research efforts, a select group of disease agents that were thought to
represent the greatest threat to the public were identified. These select
agents were identified based on several criteria, including availability,
ease of weaponizing, morbidity/mortality and persistence in the
environment. In 2002 these select agents were divided into categories by
the U.S. Center for Disease Control and Prevention (CDC) A, B and C, in
the order of perceived threat; B. anthracis was classified as an A category
pathogen at the top of the list.
Ecology and Evolution of B. anthracis
B. anthracis belongs to the Bacillus cereus group, which consists of
three genetically and phenotypically similar species; Bacillus cereus,
Bacillus thuringiensis and B. anthracis. The group is alike with all being

28
gram positive, soil emanating, and spore-forming bacteria. Pathogenic
members are found in all three species; B. cereus toxins are known to
cause food poisoning (Granum et al 1997), B. thuringiensis is a known
insect pathogen and B. anthracis, the causative agent of anthrax, is a
mammalian disease that primarily infects herbivores. Despite the
differences in pathogenesis, the core chromosome of the three species
shows a high degree of genetic similarity (Helgason et al 2000) and
among these three ‘species’ is likely a continuum of organisms found in
the environment that span these gaps between defined species. Indeed
environmental isolates have been described that genotype with one
species and share a phenotype with another. For instance, an
environmental isolate was found that is genetically and phenotypically
more like B. cereus, yet was capable of producing anthrax-like pneumonia
using many of the same virulence factors (Hoffmaster et al 2004). The
existence of these previously unknown near neighbors present unique
problems and complicate the design of genetic-based species detection
assays.
B. anthracis is generally considered an obligate pathogen since
evidence of common soil propagation remains scarce (Hugh-Jones et al
2009). As a result, understanding its transmission dynamics is critical for
understanding its evolution. Anthrax has three clinical manifestations:
cutaneous, caused by infection through a break in the epidermis;
pulmonary, inhalation of spores into the lungs; and gastrointestinal
caused by ingestion of spores. It is the latter, gastrointestinal route which
is typical of anthrax transmission in wildlife. In this case, herbivores
ingest spores which, aided by internal abrasions, are phagocytized by
macrophages in the mucosa and transferred to lymph nodes where the
spore germinates into a vegetative cell and a subsequent systemic
infection proliferates. [In gastrointestinal anthrax, if the spore is not
taken in by this process it will not germinate and will be passed through
the feces (Hugh-Jones 2010).] Following infection, spores germinate and

29
undergo rapid proliferation killing the host; sporulation begins, as decay,
aided by scavengers reintroduces the pathogen back into the soil.
Importantly, the transmission cycle of B. anthracis slows the
genome’s evolution relative to other pathogens as there is a brief period
of infection and replication, through which mutations can occur, is
followed by long periods of dormancy, potentially for decades (Graham-
Smith 1941)during which time genetic mutations are paused. This ‘stop’
for long periods (years) and ‘go’ for short periods (days) greatly reduces
the number of generations from its first emergence as a pathogen to the
present. Here the number of generations is relatively low compared to
other bacteria that exhibit continual growth and replication. For instance
Escherichia coli is estimated to undergo 300 generations per year
(Guttman et al 1994), whereas B. anthracis is estimated at a magnitude
less with only 20 to 40 generations per year . The small number of
generations greatly reduces the number of genetic mutations among
members within the population.
Although mutation is likely the primary diversifying force in B.
anthracis, selection, drift and recombination may all potentially affect
allelic distributions in B. anthracis (Keim et al 2004). For example, the
manifestations of the disease likely exert a distinct evolutionary selective
pressure on the virulence of this pathogen. In the anthrax cycle, spores
persist in the soil until they are ingested, inhaled or come into contact
(through skin lesions) with a host and cause their respected pathology as
described above. In lieu of an unknown alternate path in the transmission
cycle or long-term chronic infection (which there is no evidence for in the
literature), failure to cause mortality from any form of infection becomes
a dead end for the pathogen. Specifically strains that infect and are
unable to cause mortality of the host will not be selected for and will be
literally aberuncated from the population. In all the manifestations of the
disease the core mechanism of transmission to a host is through the soil,
this transmission step to the soil is only accomplished by killing the host.

30
Necessity of mortality of the host in the B. anthracis transmission cycle
creates evolutionary pressure to maintain or increase virulence and as
long as there is not a trade-off in the transmission (spore) phase (Moran
2002). The selective mechanism behind maintenance or increase in
virulence is sheer numbers. If mutations arise creating faster division in a
certain subpopulation within a host, those strains in greater numbers
should eventually dominate the population through many generations
(Levin et al 1994). Although B. anthracis may already be quite optimized
to this habitat within the host which if true may act as a constraint on an
already optimized genome and its expression allowing little divergence
from this fit genotype/phenotype, preserving the genetic homogeneity of
this species.
As a result of the transmission cycle, and potentially other
processes, there exists very little molecular variation among globally,
geographically widespread B. anthracis isolates. It is because of the low
levels of intra-species genetic diversity that B. anthracis is generally
considered a ‘recently emerged pathogen’; although the ecology of the
pathogen, and the stochastic nature of the spore phase, complicates
molecular clock determinations (see chapter 4). The monomorphic nature
of the B. anthracis genome and its extremely close genetic relationship
with its environmentally common near-neighbors complicates efforts to
develop molecular tools for its precise identification. However, use of
genomic and evolutionary analyses was used to develop species and
strain specific assays for B. anthracis.
Genomics of B. anthracis and Genetic Markers
The use of new genetic tools for pathogen work, in many ways,
greatly surpasses the traditional ‘gold standards’ of classical microbiology.
Frequently prior to 2001 and to some extent now, B. anthracis
identification (now confirmation) is accomplished through classical
microbiological methods; using techniques to isolate and phenotype the

31
microbe biochemically and morphologically. This process is laborious, time
consuming and potentially yields inconclusive results; it also suffers from
a limited number of diagnostics. In the case of forensic science, human
genetic data have been used extensively to attribute crimes to
perpetrators (Pena et al 1993). However these types of data had not been
used to their potential in microbial forensics prior the 2001 attacks and
the co-occurring genomics revolution, when there was a push to use
genetics to identify and subtype pathogens, here B. anthracis, in forensic
and clinical settings (Popovic et al 2003, Swaminathan et al 2001).
To meet the needs of forensic and epidemiological investigations of
anthrax outbreaks, new genetic markers and tools needed to be
developed for more definitive and precise identification. Having these
types of tools in place in the event of an intentional release can produce
key data for investigators. For example, in the circumstance of a release
the speed and throughput of identifying a pathogen and mobilizing the
appropriate response could have a significant effect on number of deaths
within a population. In criminal justice the use of these tools give
investigators the ability to rapidly include and exclude biological material
and, by association, suspects.
Prior to the anthrax attacks, certain Polymerase Chain Reaction
(PCR) – based methods were already available for the identification of B.
anthracis as well as resolving genetic groups within the species (Keim et
al 2000, Qi et al 2001). However the existing research methods suffered
from limits in through-put and strain discrimination, limiting the
application to the epidemiological and forensic investigation. The 2001
anthrax letters forced a change in the development and use of these
systems from research applications to investigative applications and is the
focus of this thesis: developing high-throughput, trace-level detection of
pathogens used in biocrimes; smart tools and markers to detect specific
pathogens and specific strains, in this case for the pathogen B. anthracis.

32
Although mutations are rare within B. anthracis, examination of
genomic sequences permitted the identification of Variable Number of
Tandem Repeat loci. These were some of the first polymorphisms found
between isolates of B. anthracis and were the first tools to give insight
into the genetic and geographic history of the pathogen (Keim et al
2000). Afterwards, more exhaustive, comparative genomic surveys,
allowed for the discovery of Single Nucleotide Polymorphisms (SNPs) for
the identification of the species, as well as clonal groups or even a specific
strains within the species.
To effectively find SNPs a phylogeny was built using a 15 marker
Multi-Locus Variable Number of Tandem Repeat Analysis (MLVA) system.
This method was applied to DNA ‘fingerprint’ over one thousand
geographically diverse isolates of B. anthracis. An evolutionary hypothesis
was constructed with Unweighted Pair Group Method with Arithmetic
Mean (UPGMA), using these markers (chapter 4). From this phylogeny a
total of five genetically diverse isolates were selected for whole genome
sequencing which includes the Ames strain. A comparison between these
genomes revealed around 3500 SNPs among these strains. These SNPs
were then screened against a diverse set of 27 isolates that were
representative of B. anthracis phylogeny. SNPs were then mapped on a
phylogeny (Pearson et al 2004) and SNPs that defined major clonal
lineages were identified. Twelve SNPs were used as binary markers to
define subgroups within the species (figure 1) and real-time assays were
designed to these markers to screen a large population of 1000+ globally
diverse isolates.

33
Figure 1 Representation of the location of Canonical SNPs on a simple B.
anthracis phylogeny based upon seven diverse strains. The plcR SNP
(nonsense mutation) occurs between B. anthracis species and other
members of the B. cereus group. Also, two Ames strain specific SNPs are
shown at the Ames terminus.
Genetic tools, assays and databases for forensics
In contrast to a natural outbreak, where the public health sector
responds to and manages the outbreak, the bioterrorist attack of 2001
required the participation of both public health and law enforcement
agencies. The amount of work in biodefense that needed to be
accomplished to have information gathering systems in place was quite
large, especially for the detection and fingerprinting B. anthracis and
other pathogens. Hence a symbiosis has been formed between law
enforcement and the public health sector and joint efforts between the
two disciplines to structure research into developing new and more
efficient tools is underway (Goodman et al 2003).

34
The 2001 anthrax letter attacks exposed the gaps in forensic
capabilities for the specific detection and identification of B. anthracis and
other pathogens. Furthermore there was no established standard method
or protocol for strain identification and the need for precise, sensitive,
high-throughput tools for the identification of B. anthracis strains became
apparent. In the 2001 Amerithrax case, the strain of interest was Ames,
and the tools to specifically identify this strain for the purposes of
including and excluding evidence required development and validation.
Major challenges in examining evidence arise from inherent limitations of
the PCR method. Even so the benefits of using PCR outweigh the
limitations of this method. Although other PCR based methods are used
for the identification of genetic markers (Van Ert et al 2004), here for the
detection of SNPs we specifically used real-time PCR.
Some of these limitations are intrinsic to the method itself including
inhibition of PCR due to environmental contaminates, such as humic acids
(Tebbe et al 1993) and the limit of detection which is the lowest copy
number of a given template yielding a positive result (figure 2). Similarly,
yet not inherent to PCR, are the problems which may arise where
sequences which have a similar composition cross-react with the primers
and probes of the assay used. Given the right conditions this can yield
false positives and may occur in the negative controls if a combination of
cycling conditions, chemistry and the design of the oligos allow.

35
Figure 2 Representation of the parameters of detection for a pathogen
signature in an environmental sample. As the amount of target DNA
sequence decreases, the larger the impact that PCR inhibitors have on
any particular assay to the threshold of causing false negatives. The
cross-reactive sequences also can cause false results. As the amount of
cross-reactive sequence is increased within a sample the murkier the
results may become, to the point of creating false positives or negatives.
Although academic laboratories are known for pioneering research
in molecular biology, many researchers have developed ritual habits that
are based on taught and or learned procedures from incorrect
interpretation of data due to a lack of appropriate controls. In practice
many researchers will throw out data after 40 cycles of this process, real-
time PCR, because the validity is in question due to the de novo
fabrication of PCR products which allow for the binding and cleavage of

36
probes creating a fluorescent signal in controls (personal correspondents).
This is the case when one or more parameters are not optimized to
prevent these false positives and where appropriate controls were not run
creating inaccurate conclusions or ambiguous results. In the case of the
research herein tightly controlled experiments were run with exhaustive
controls to nullify this notion.
When samples are taken as evidence for forensic analyses the
quality cannot always be controlled for. There is the possibility for a range
of quality when it comes to samples taken as evidence. Obviously the first
step is to attempt to culture B. anthracis when isolated and grown creates
a situation where the resource is not finite. Yet culturing the organism is
often not possible. In these instances confirmation for the presence of the
organism relies on genetic methods. Here the danger of cross-reactive
sequences in any sample is always possible and can be likely.
Genetic/Geographic Databases
One of the most important tools in epidemiology and criminal
justice are databases. Databases can be used to quickly query data once
it is gathered. The likeness of the match, if not perfect, enables
investigators to focus and structure their investigation to more likely
sources while excluding or lowering the priority of less like matches.
Genetic, spatial and temporal data allow epidemiologists and investigators
to attribute a particular case to a likely source.
For instance in Hong Kong 2003 Cheung et al. documents a fatal
case of anthrax in a boy. Anthrax in Hong Kong is an extremely rare
disease, with only three cases in the last 20 years (Cheung et al 2005).
Their ability to closely genetically match the isolate to other isolates from
Guangxi an adjacent province enabled the epidemiologists to attribute the
bacterium’s presence to probable contamination of a food product.

37
Figure 3 A screenshot from the ‘Bacillus anthracis Dynamic Database.’
The database allows the user to enter any combination of genetic data [1,
2] (SNPs, MLVA, and single nucleotide repeats) and spatial data [3] and
query these data [4]. The information within the database is secured with
registered usernames and passwords [6]; each database user is given a
specific level of access.
These types of investigations became possible for the following
reasons. The first was amassing a large enough collection of isolates to
represent the genetic diversity in a global (spatial) context. The second
was developing genetic tools that create a fine enough resolution of the
isolates which allows discrimination of similar isolates from adjacent
locations. These data then need to be collected into a database. The
database should be intuitive and easy to query (figure 3). This allows the
user to query specific data and have specific clear data returned. In turn
it helps guide investigators to a probable source of the pathogen. Despite
having a database some of the biggest challenges in these types of
investigations are actually capturing these data. The following chapters
present the data and the methods to access these data, even from some
of the most challenging samples.

38
Cited Literature
Agrawal AA, Laforsch C, Tollrian R (1999). Transgenerational induction of defences in animals and plants. Nature 401: 60-63. Bohannon J (2003). ANTHRAX: From Bioweapons Backwater to Main Attraction. Science 300: 414-415. Brönmark C, Pettersson LB (1994). Chemical Cues from Piscivores Induce a Change in Morphology in Crucian Carp. Oikos 70: 396-402. Cheung DTL, Kam KM, Hau KL, Au TK, Marston CK, Gee JE, Popovic T, Van Ert MN, Kenefic L, Keim P, Hoffmaster AR (2005). Characterization of a Bacillus anthracis Isolate Causing a Rare Case of Fatal Anthrax in a 2-Year-Old Boy from Hong Kong. J Clin Microbiol 43: 1992-1994. Consortium TGP (2010). A map of human genome variation from population-scale sequencing. Nature 467: 1061-1073. Darwin CR (1845). Journal of researches into the natural history and geology of the countries visited during the voyage of H.M.S. Beagle round the world, under the Command of Capt. Fitz Roy, R.N. 2nd Edition.: London. Easterday W, Van Ert M, Simonson T, Wagner D, Kenefic L, Allender C, Keim P (2005). Use of single nucleotide polymorphisms in the plcR gene for specific identification of Bacillus anthracis. J Clin Microbiol 43: 1995 - 1997. Field D, Garrity G, Gray T, Morrison N, Selengut J, Sterk P, Tatusova T, Thomson N, Allen MJ, Angiuoli SV, Ashburner M, Axelrod N, Baldauf S, Ballard S, Boore J, Cochrane G, Cole J, Dawyndt P, De Vos P, dePamphilis C, Edwards R, Faruque N, Feldman R, Gilbert J, Gilna P, Glockner FO, Goldstein P, Guralnick R, Haft D, Hancock D, Hermjakob H, Hertz-Fowler C, Hugenholtz P, Joint I, Kagan L, Kane M, Kennedy J, Kowalchuk G, Kottmann R, Kolker E, Kravitz S, Kyrpides N, Leebens-Mack J, Lewis SE, Li K, Lister AL, Lord P, Maltsev N, Markowitz V, Martiny J, Methe B, Mizrachi I, Moxon R, Nelson K, Parkhill J, Proctor L, White O, Sansone S-A, Spiers A, Stevens R, Swift P, Taylor C, Tateno Y, Tett A, Turner S, Ussery D, Vaughan B, Ward N, Whetzel T, San Gil I, Wilson G, Wipat A (2008). The minimum information about a genome sequence (MIGS) specification. Nat Biotech 26: 541-547. Gilbert SF (2004). Ecological Developmental Biology: Developmental Biology Meets the Real World. Russian Journal of Developmental Biology 35: 346-357.

39
Goodman RA, Munson JW, Dammers K, Lazzarini Z (2003). Forensic Epidemiology: Law at the Intersection of Public Health and Criminal Investigations. JL Med & Ethics 31. Graham-Smith GS (1941). Further Observations on the Longevity of Dry Spores of B. anthracis. The Journal of Hygiene 41: 496. Granum PE, Lund T (1997). Bacillus cereus and its food poisoning toxins. FEMS Microbiology Letters 157: 223-228. Guttman D, Dykhuizen D (1994). Clonal divergence in Escherichia coli as a result of recombination, not mutation. Science 266: 1380-1383. Handel A, Bennett MR (2008). Surviving the Bottleneck: Transmission Mutants and the Evolution of Microbial Populations. Genetics 180: 2193-2200. Handysides S (2009). The History of Bioterrorism: Old Idea, New Word, Continuing Taboo. Beyond Anthrax. pp 1-15. Helgason E, Okstad OA, Caugant DA, Johansen HA, Fouet A, Mock M, Hegna I, Kolsto A-B (2000). Bacillus anthracis, Bacillus cereus, and Bacillus thuringiensis---One Species on the Basis of Genetic Evidence. Appl Environ Microbiol 66: 2627-2630. Hoffmaster AR, Ravel J, Rasko DA, Chapman GD, Chute MD, Marston CK, De BK, Sacchi CT, Fitzgerald C, Mayer LW, Maiden MCJ, Priest FG, Barker M, Jiang L, Cer RZ, Rilstone J, Peterson SN, Weyant RS, Galloway DR, Read TD, Popovic T, Fraser CM (2004). Identification of anthrax toxin genes in a Bacillus cereus associated with an illness resembling inhalation anthrax. Proceedings of the National Academy of Sciences of the United States of America 101: 8449-8454. Houle D, Govindaraju DR, Omholt S (2010). Phenomics: the next challenge. Nat Rev Genet 11: 855-866. Hugh-Jones M, Blackburn J (2009). The ecology of Bacillus anthracis. Molecular Aspects of Medicine 30: 356-367. Hugh-Jones ME (2010). Personal Communication, Director of the World Health Organization (WHO) Collaborating Center for Remote Sensing and Geographic Information Systems for Public Health Inglesby TV, O'Toole T, Henderson DA, Bartlett JG, Ascher MS, Eitzen E, Friedlander AM, Gerberding J, Hauer J, Hughes J, McDade J, Osterholm MT, Parker G, Perl TM, Russell PK, Tonat K, for the Working Group on

40
Civilian Biodefense (2002). Anthrax as a Biological Weapon, 2002: Updated Recommendations for Management. JAMA 287: 2236-2252. Keim P, Price LB, Klevytska AM, Smith KL, Schupp JM, Okinaka R, Jackson PJ, Hugh-Jones ME (2000). Multiple-Locus Variable-Number Tandem Repeat Analysis Reveals Genetic Relationships within Bacillus anthracis. J Bacteriol 182: 6862-. Keim P, Van Ert MN, Pearson T, Vogler AJ, Huynh LY, Wagner DM (2004). Anthrax molecular epidemiology and forensics: using the appropriate marker for different evolutionary scales. Infection, Genetics and Evolution 4: 205-213. Kenefic L, Pearson T, Okinaka R, Schupp J, Wagner D, Ravel J, Hoffmaster A, Trim C, Chung W, Beaudry J (2009). Pre-columbian origins for north american anthrax. PLoS ONE 4: e4813. Kortepeter MG, Parker GW (1999). Potential Biological Weapons Threats. Emerg Infect Dis 5: 523-527. Levin BR, Bull JJ (1994). Short-sighted evolution and the virulence of pathogenic microorganisms. Trends in Microbiology 2: 76-81. Liolios K, Mavromatis K, Tavernarakis N, Kyrpides NC (2008). The Genomes On Line Database (GOLD) in 2007: status of genomic and metagenomic projects and their associated metadata. Nucleic acids research 36. MacConaill L, Meyerson M (2008). Adding pathogens by genomic subtraction. Nat Genet 40: 380-382. Mignot T, Mock M, Robichon D, Landier A, Lereclus D, Fouet A (2001). The incompatibility between the PlcR- and AtxA-controlled regulons may have selected a nonsense mutation in Bacillus anthracis. Mol Microbiol 42: 1189 - 1198. Moran NA (2002). Microbial Minimalism: Genome Reduction in Bacterial Pathogens. Cell 108: 583-586. NASA (2006). Mission Report: NASA 6 / Mir Space Station Subject: Anti-fungal properties of ODC. University of Colorado: Boulder. Pearson T, Busch JD, Ravel J, Read TD, Rhoton SD, U'Ren JM, Simonson TS, Kachur SM, Leadem RR, Cardon ML, Van Ert MN, Huynh LY, Fraser CM, Keim P (2004). Phylogenetic discovery bias in Bacillus anthracis using single-nucleotide polymorphisms from whole-genome sequencing.

41
Proceedings of the National Academy of Sciences of the United States of America 101: 13536-13541. Pena SDJ, Chakraborty R, Epplen JT, Jeffereys AJ (eds) (1993) DNA Fingerprinting: State of the Science. Birkhäuser Verlag: Boston, 466 pp. Popovic T, Glass M (2003). Laboratory Aspects of Bioterrorism-related Anthrax – from Identification to Molecular Subtyping to Microbial Forensics. Croatian Medical Journal 44: 336-341. Qi Y, Patra G, Liang X, Williams LE, Rose S, Redkar RJ, DelVecchio VG (2001). Utilization of the rpoB Gene as a Specific Chromosomal Marker for Real-Time PCR Detection of Bacillus anthracis. Appl Environ Microbiol 67: 3720-3727. Swaminathan B, Barrett TJ, Hunter SB, Tauxe RV (2001). PulseNet: The Molecular Subtyping Network for Foodborne Bacterial Disease Surveillance, United States. Emerg Infect Dis 7. Tebbe CC, Vahjen W (1993). Interference of humic acids and DNA extracted directly from soil in detection and transformation of recombinant DNA from bacteria and a yeast. Appl Environ Microbiol 59: 2657-2665. Thorisson GA, Muilu J, Brookes AJ (2009). Genotype-phenotype databases: challenges and solutions for the post-genomic era. Nat Rev Genet 10: 9-18. Tong AHY, Lesage G, Bader GD, Ding H, Xu H, Xin X, Young J, Berriz GF, Brost RL, Chang M, Chen Y, Cheng X, Chua G, Friesen H, Goldberg DS, Haynes J, Humphries C, He G, Hussein S, Ke L, Krogan N, Li Z, Levinson JN, Lu H, Ménard P, Munyana C, Parsons AB, Ryan O, Tonikian R, Roberts T, Sdicu A-M, Shapiro J, Sheikh B, Suter B, Wong SL, Zhang LV, Zhu H, Burd CG, Munro S, Sander C, Rine J, Greenblatt J, Peter M, Bretscher A, Bell G, Roth FP, Brown GW, Andrews B, Bussey H, Boone C (2004). Global Mapping of the Yeast Genetic Interaction Network. Science 303: 808-813. Van Ert MN, Hofstadler SA, Jiang Y, Busch JD, Wagner DM, Drader JJ, Ecker DJ, Hannis JC, Huynh LY, Schupp JM, Simonson TS, Keim P (2004). Mass spectrometry provides accurate characterization of two genetic marker types in Bacillus anthracis. Biotechniques 37: 642-651. Venter JC (2010). Multiple personal genomes await. Nature 464: 676-677.


Chapter 1


Chapter 2


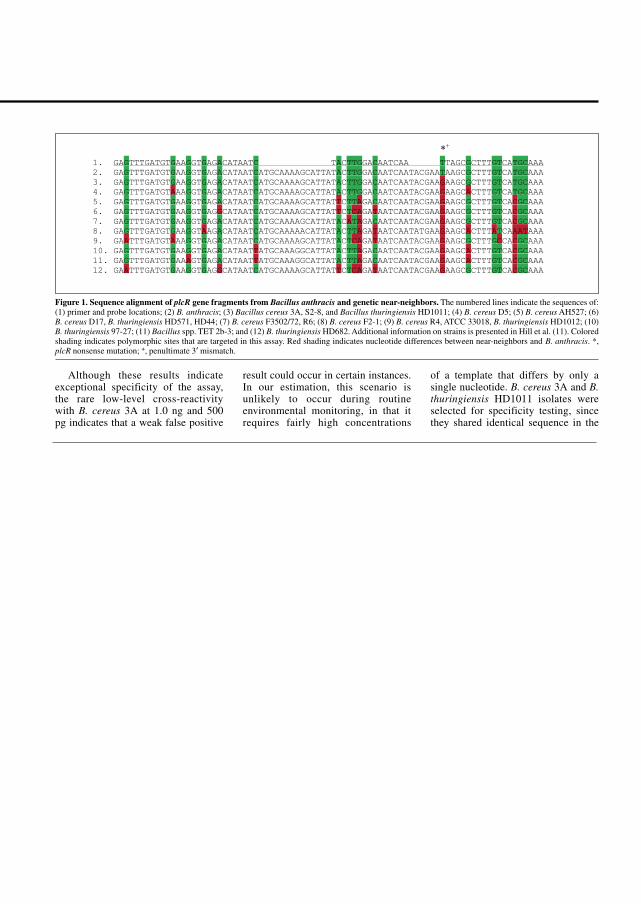
1. GAGTTTGATGTGAAGGTGAGACATAATC TACTTGGACAATCAA TTAGCGCTTTGTCATGCAAA 2. GAGTTTGATGTGAAGGTGAGACATAATCATGCAAAAGCATTATACTTGGACAATCAATACGAATAAGCGCTTTGTCATGCAAA 3. GAGTTTGATGTGAAGGTGAGACATAATCATGCAAAAGCATTATACTTGGACAATCAATACGAAGAAGCGCTTTGTCATGCAAA 4. GAGTTTGATGTAAAGGTGAGACATAATCATGCAAAAGCATTATACTTGGACAATCAATACGAAGAAGCACTTTGTCATGCAAA 5. GAGTTTGATGTGAAGGTGAGACATAATCATGCAAAAGCATTATTCTTAGACAATCAATACGAAGAAGCGCTTTGTCACGCAAA6. GAGTTTGATGTGAAGGTGAGGCATAATCATGCAAAAGCATTATTCTCAGATAATCAATACGAAGAAGCGCTTTGTCACGCAAA 7. GAGTTTGATGTGAAGGTGAGACATAATCATGCAAAAGCATTATACATAGACAATCAATACGAAGAAGCGCTTTGTCACGCAAA 8. GAGTTTGATGTGAAGGTAAGACATAATCATGCAAAAACATTATACTTAGATAATCAATATGAAGAAGCACTTTATCAAATAAA 9. GAATTTGATGTAAAGGTGAGACATAATCATGCAAAAGCATTATACTCAGATAATCAATACGAAGAAGCGCTTTGCCACGCAAA 10. GAGTTTGATGTGAAGGTGAGACATAATTATGCAAAGGCATTATACTTAGACAATCAATACGAAGAAGCACTTTGTCACGCAAA 11. GAGTTTGATGTGAAAGTGAGACATAATTATGCAAAGGCATTATACTTAGACAATCAATACGAAGAAGCACTTTGTCACGCAAA 12. GAATTTGATGTGAAGGTGAGGCATAATCATGCAAAAGCATTATTCTCAGATAATCAATACGAAGAAGCGCTTTGTCACGCAAA


Chapter 3


Chapter 4


Global Genetic Population Structure of Bacillus anthracisMatthew N. Van Ert1¤a, W. Ryan Easterday1, Lynn Y. Huynh1¤b, Richard T. Okinaka1,2, Martin E. Hugh-Jones3, Jacques Ravel4, Shaylan R. Zanecki1,Talima Pearson1, Tatum S. Simonson1, Jana M. U’Ren1, Sergey M. Kachur1, Rebecca R. Leadem-Dougherty1, Shane D. Rhoton1, GuenevierZinser1, Jason Farlow1¤c, Pamala R. Coker3¤d, Kimothy L. Smith1¤e, Bingxiang Wang5, Leo J. Kenefic1, Claire M. Fraser-Liggett4, David M.Wagner1, Paul Keim1,2,6*
1Department of Biological Sciences, Northern Arizona University, Flagstaff, Arizona, United States of America, 2 Biosciences, Los Alamos NationalLaboratory, Los Alamos, New Mexico, United States of America, 3Department of Environmental Studies, Louisiana State University, Baton Rouge,Louisiana, United States of America, 4 The Institute for Genomic Research, Rockville, Maryland, United States of America, 5 Lanzhou Institute ofBiological Products, Lanzhou, China, 6 Pathogen Genomics Division, Translational Genomics Research Institute, Phoenix, Arizona, United States ofAmerica
Anthrax, caused by the bacterium Bacillus anthracis, is a disease of historical and current importance that is found throughoutthe world. The basis of its historical transmission is anecdotal and its true global population structure has remained largelycryptic. Seven diverse B. anthracis strains were whole-genome sequenced to identify rare single nucleotide polymorphisms(SNPs), followed by phylogenetic reconstruction of these characters onto an evolutionary model. This analysis identified SNPsthat define the major clonal lineages within the species. These SNPs, in concert with 15 variable number tandem repeat (VNTR)markers, were used to subtype a collection of 1,033 B. anthracis isolates from 42 countries to create an extensive genotypedata set. These analyses subdivided the isolates into three previously recognized major lineages (A, B, and C), with furthersubdivision into 12 clonal sub-lineages or sub-groups and, finally, 221 unique MLVA15 genotypes. This rare genomic variationwas used to document the evolutionary progression of B. anthracis and to establish global patterns of diversity. Isolates in theA lineage are widely dispersed globally, whereas the B and C lineages occur on more restricted spatial scales. Molecular clockmodels based upon genome-wide synonymous substitutions indicate there was a massive radiation of the A lineage thatoccurred in the mid-Holocene (3,064–6,127 ybp). On more recent temporal scales, the global population structure of B.anthracis reflects colonial-era importation of specific genotypes from the Old World into the New World, as well as therepeated industrial importation of diverse genotypes into developed countries via spore-contaminated animal products. Thesefindings indicate humans have played an important role in the evolution of anthrax by increasing the proliferation anddispersal of this now global disease. Finally, the value of global genotypic analysis for investigating bioterrorist-mediatedoutbreaks of anthrax is demonstrated.
Citation: Van Ert MN, Easterday WR, Huynh LY, Okinaka RT, Hugh-Jones ME, et al (2007) Global Genetic Population Structure of Bacillus anthracis. PLoSONE 2(5): e461. doi:10.1371/journal.pone.0000461
INTRODUCTIONAnthrax, caused by the bacterium Bacillus anthracis, is a disease with
a natural transmission cycle involving wildlife, livestock, and,
occasionally, humans. Recently B. anthracis received notoriety for
its use as an agent of bioterrorism in the 2001 letter attacks in the
United States [1], and an unsuccessful aerosol attack in Japan in
1993 [2]. Prior to its use as a bioterrorism agent, B. anthracis was
developed as a biological weapon by the governments of several
countries, including the United States, the United Kingdom, and
the former Soviet Union [3]. Despite the emphasis on its role as an
agent of bioterrorism or biological warfare, anthrax has been and
continues to be an important global disease of wildlife and
livestock. Global dispersal of spores via commodities has been
prevalent, such that there are currently endemic anthrax foci on all
continents except Antarctica (http://www.vetmed.lsu.edu/
whocc/). In the environment, B. anthracis primarily exists as
a dormant, highly stable spore, which is central to the ecology,
evolution, and contemporary weaponization of this pathogen.
During the spore phase, which may persist for decades, evolution
is static or at least greatly reduced in rate, which limits the amount
of genetic diversity found among isolates of this species.
In the past the genetic homogeneity of B. anthracis severely
compromised efforts to reconstruct its evolutionary history. Two
molecular approaches, multiple locus variable number tandem
repeat analysis (MLVA) and whole genome single nucleotide
polymorphism (SNP) discovery and analysis, have greatly
enhanced the identification of genetic markers that help to
establish the phylogenetic relationships among B. anthracis isolates
[4,5]. For example, Keim et al. [4] used eight variable number
tandem repeat (VNTR) markers to examine a worldwide
collection of over 400 B. anthracis isolates and described two major
clonal lineages (A and B) and 89 unique MLVA8 genotypes. This
Academic Editor: Joseph Petrosino, Baylor College of Medicine, United States ofAmerica
Received February 28, 2007; Accepted March 20, 2007; Published May 23, 2007
Copyright: � 2007 van ert et al. This is an open-access article distributed underthe terms of the Creative Commons Attribution License, which permitsunrestricted use, distribution, and reproduction in any medium, provided theoriginal author and source are credited.
Funding: Funding for this work was provided by the National Institutes of Health,General Medical Sciences and the U.S. Departments of Energy and HomelandSecurity.
Competing Interests: The authors have declared that no competing interestsexist.
* To whom correspondence should be addressed. E-mail: [email protected]
¤a Current address: Midwest Research Institute, Palm Bay, Florida, United Statesof America¤b Current address: Graduate Division of Biological and Biomedical Sciences,Emory University, Atlanta, Georgia, United States of America¤c Current address: Biodesign Institute, Arizona State University, Phoenix,Arizona, United States of America¤d Current address: Pathogen Research & Consulting, Shreveport, Louisiana,United States of America¤e Current address: Office of Research and Development, Science andTechnology Directorate, Department of Homeland Security, Washington, D. C.,United States of America
PLoS ONE | www.plosone.org 1 May 2007 | Issue 5 | e461

same VNTR typing scheme also has been used to examine the
diversity of B. anthracis in France, [6] Poland, [7], Italy [8], and
countries in southern [9] and northern Africa [10]. This process
has now been expanded to 15 marker-loci, MLVA15 [11].
Although individual SNPs have limited resolving power relative
to MLVA, researchers have used phylogenetic approaches to
identify SNPs that efficiently partition bacterial strains into genetic
groups consistent with their recognized population structure
[3,11,12]. Recent whole genome sequencing efforts discovered
approximately 3,500 SNPs among five strains of B. anthracis [5,13]
(J. Ravel, unpublished). Pearson et al. [5] mapped nearly 1,000 of
these SNPs across 27 diverse isolates and proposed an extremely
robust and conserved phylogenetic model for Bacillus anthracis. The
conserved distribution of SNPs within the B. anthracis phylogenetic
tree was reflected in the observation that only a single character
conflict (homoplasy) was detected from .25,000 data points.
These results indicated that that a select number of SNPs
representative of specific branches and nodes in the B. anthracis
SNP-derived tree would be sufficient to accurately determine the
current phylogenetic position of any B. anthracis isolate. A working
hypothesis was formulated [3] where a small number of canonical
SNPs (canSNPs) located at key phylogenetic junctions along the B.
anthracis SNP tree could replace a tedious genome-wide SNP
analysis. This strategy is analogous to the TagSNP concept that
has been suggested by the International HapMap Consortium for
the human genome[14] that ‘‘only a minority of sites need to be
examined’’ to fully capture the genotype information in various
conserved regions throughout the genome. CanSNPs in B. anthracis
represent an extreme example of the TagSNP concept where
a single SNP can represent the entire genome of an isolate.
In this study, the canSNP hypothesis for Bacillus anthracis was
tested against a diverse global collection containing .1,000
isolates. An initial set of 12 canSNPs representing different points
in the evolutionary history of Bacillus anthracis were queried against
DNA preparations from this entire collection. These experiments
demonstrate that all of the B. anthracis isolates can be placed into
one of 12 conserved groups or lineages. The slowly evolving
canSNP data set was then coupled to the more rapidly evolving
MLVA15 marker set to greatly enhance the resolution beyond the
original 89 B. anthracis genotypes [4]. The analysis of slowly
evolving canSNPs allowed the definition of major clonal lineages
in B. anthracis, whereas the more rapidly evolving MLVA15
markers elucidated younger population-level structure in the
species. We also utilized molecular clock models, based upon
simple assumptions and exhaustive whole genome synonymous
SNP surveys of representative strains, to estimate the age of major
events in the evolution of B. anthracis. Collectively, our phyloge-
netic and molecular clock analyses, as well as information on
isolate frequencies and global geographic distribution, facilitate the
most comprehensive description to date of the global diversity and
historical transmission patterns of this pathogen.
RESULTS
Canonical SNP analysisCanSNP analysis subdivided all of the B. anthracis isolates into
three previously recognized major lineages (A, B and C), with
further subdivisions into one of 12 distinct sub-lineages (Figure 1,
stars) or sub-groups (circles). Seven completed whole genome
sequences (C.USA.A1055, KrugerB, CNEVA.9066, Ames, Aus-
Figure 1. The relationship between canSNPs, sub-lineages and/or sub-groups: The stars in this dendrogram represent specific lineages that aredefined by one of the seven sequenced genomes of B. anthracis. The circles represent branch points along the lineages that contain specificsubgroups of isolates. These sub-groups are named after the canSNPs that flank these positions. Indicated in red are the positions and names foreach of the canSNPs (also see Table 1).doi:10.1371/journal.pone.0000461.g001
B. anthracis Population
PLoS ONE | www.plosone.org 2 May 2007 | Issue 5 | e461

tralia94, Vollum, Western North America, see Table 1) defined
endpoints (stars) that describe 7 distinct sub-lineages within the
canonical SNP tree. These seven strains were picked to represent
previously recognized diversity within B. anthracis [4,5]. In addition
to the 7 lineages the canSNP analysis identified 5 sub-groups
labelled as positions along the branches in the canSNP tree. The
positions of each of the canSNPs are illustrated in Figure 1 and the
canSNP genotype for each of the 7 sub-lineages and the 5 sub-
groups is shown in Table 1. It is important to note that all of the
1,033 isolates in this B. anthracis collection fell into one of these 12
subdivisions and that the specific sequenced lineage isolates are
only representative of a cluster of related isolates within that
lineage.
MLVA15 analysisUPGMA cluster analysis of the MLVA15 data alone clearly
identifies the three major genetic lineages (A, B, and C; Figure 2).
The longer B and C branch lengths (Figure 1) are underestimated
in this analysis (Figure 2) due to mutational saturation of the
rapidly evolving MLVA markers. This dataset also increased the
number of unique B. anthracis MLVA genotypes from 89 (MLVA8,
[3]) to 221 owing to both a larger subset of isolates and the
expanded resolving power of the MLVA15 marker set (Figure 2,
Tables S1 and S2). The MLVA15 tree (Figure 2) illustrates that
the majority of isolates are located in shallow branches within the
A lineage whereas the B and C lineages have rarer genotypes and
fewer isolates. The MLVA15 dataset indicates that 89.6% (198)
MLVA genotypes are from the A branch, 10% (22 MLVA
genotypes) are from the B branch, and only 0.4% (1 MLVA
genotype) are from the C branch.
Geographical distribution of clonal sub-lineages and
sub-groupsFigures 2 and 3A graphically depict the distribution of the 1,033
isolates into the 12 canSNP sub-lineages and/or sub-groups
(Column N in Fig. 2 and 3A) and also indicates the number of
unique MLVA15 genotypes that were found in each of the 12
canSNP groupings (Figure 3A, column G; also see Table S1 in the
Supplemental Section). The canSNP sub-lineages and sub-groups
in Figure 3A also were assigned unique color codes to assist in
establishing correlations between these 12 canSNP groupings and
the geographic origins of each isolate. These data are presented in
Figure 3B as color-coded pie charts for various geographic regions.
Each pie chart illustrates the proportion of each canSNP grouping
and the total number of isolates that originated from a particular
geographic region. North America, Europe, China and parts of
Africa are very well represented in these studies, whereas South
America and Australia have reasonable representation. Countries
from the Middle East and the former Soviet Union are under-
represented. These sample biases are important considerations but
do not appear to mitigate major genetic and geographic trends in
this data set.
There are distinct differences in the global distributions of the
major B. anthracis clonal lineages (A, B, and C). The A lineage
isolates are widely distributed and are found in all countries
included in this study. In contrast, the geographic distributions of
the B and C lineage isolates are restricted, for example, the B
lineage is primarily found in South Africa [B.Br.Kruger B sub-
lineage and B.Br.001/002 sub-group [9] and portions of Europe
[B.CNEVA-9006 sub-lineage; [4,6,7] with geographical differen-
tiation at the sub-group level. Examples of these sub-lineages are
rarely found outside of these regions.
Table
1.CANONICALSN
Ps.
.......................................................................................................................................................................................................
Lineage/Group
TypeStrain.
Sequence
A.Br.001
A.Br.002
A.Br.003
A.Br.004
A.Br.006
A.Br.007
A.Br.008
A.Br.009
B.Br.001
B.Br.002
B.Br.003
B.Br.004
A/B.Br.001
C.Br.A1055
C.A1055
C.USA
.A1055
TG
AT
CT
TA
TG
GT
G
B.Br.KrugerB
B1.A0442
KrugerB
TG
AT
CT
TA
CT
AT
A
B.Br.001/002
B1.A0102
TG
AT
CT
TA
TT
AT
A
B.Br.CNEVA
B2.A0402
CNEV
A.9066
TG
AT
CT
TA
TG
AC
A
A.Br.Ames
A2.A0462
Ames
CA
GC
AT
TA
TG
GT
A
A.Br.001/002
A2.A0034
TA
GC
AT
TA
TG
GT
A
A.Br.Aust94
A1.A0039
Australia94
TG
GC
AT
TA
TG
GT
A
A.Br.003/004
A2.A0489
TG
AC
AT
TA
TG
GT
A
A.Br.Vollum
A1.A0488
Vollu
mT
GA
TA
CT
AT
GG
TA
A.Br.005/006
A1.A0158
TG
AT
AT
TA
TG
GT
A
A.Br.008/009
A1.A0293
TG
AT
AT
GA
TG
GT
A
A.Br.WNA
A1.A0193
W.N.America
TG
AT
AT
GG
TG
GT
A
Can
SNPsan
dprofilesforthelin
eag
es/groups:Thistablelistseachofthe12lin
eag
esan
dgroupsan
dindicatesthecanonicalSN
Psthat
help
todefineeachofthesub-lineag
esan
dsub-groups(can
SNPsthat
defineaparticularsub-
lineag
eorsub-groupareindicatedin
yello
w).Each
lineag
eisnam
edafterthewhole
genomesequence
that
ispositionedas
anendpointin
abranch
createdbyacomparisonofthat
particulargenomesequence
to6other
genomes(starsin
Figures1an
d3).Asendpointsallb
utoneofthelin
eag
esaredefinedbyasinglecanSN
P(seeprofilesin
yello
wforB.Br.Kruger,B
.Br.CNEV
A,A
.Br.Vollu
m,A
.Br.Amesan
dA.Br.WNA.A
lthoughAust94isan
endpoint
thecanSN
Psthat
definethislin
eag
ewere
developedbefore
thedraftsequence
andas
aresulttw
ocanSN
PsA.Br.002an
dA.Br.003definethebranch
pointwhere
thisisolate
islocated.Sim
ilarly,thegroupsarepositionsthat
define
branch
points
[5,35]alongthedifferentlin
eag
es(Circlesin
Fig.1
and3).Theycarrythegroupnam
edesignationscorrespondingto
thecanSN
Psthat
flan
kthese
positionsan
dareindicatedin
bluein
thistable
(e.g.A
.Br.001/002).
Note
that
thesub-groupneedat
leasttw
ocanSN
Ps(oneSN
Poneithersideofthenode)to
assignacorrect
sub-group.Su
b-groupA.Br.005/006requiresthreecanSN
Psto
assignan
exact
genotypebecause
acanSN
PforA.Br.005
has
notyetbeentested.Thewhole
genomesequencesforBacillusan
thracisstrainsA0155,AmesAncestor,CNEV
A-9066,KrugerB,Vollu
m,Western
NorthAmerica
(WNA)an
dAustralia
94canbefoundin
theNCBImicrobial
genomewebsite
athttp://w
ww.ncb
i.nlm
.nih.gov
doi:10.1371/journal.pone.0000461.t001
.................................................................................
B. anthracis Population
PLoS ONE | www.plosone.org 3 May 2007 | Issue 5 | e461

Figure 2. UPGMA dendrogram of VNTR data from worldwide B. anthracis isolates: Fifteen VNTR loci and UPGMA cluster analysis were used toestablish genetic relationships among the 1,033 B. anthracis isolates. In this UPGMA dendrogram, which was created using MEGA software [39],groups of genetically similar isolates are collapsed into black triangles that are sized in proportion to the number of isolates in that particular lineage.VNTR loci mutate at faster rates than SNPs and, hence, provide greater resolution for terminal branches. Longer branches, such as the B and Clineages, have length underestimation in this analysis due to mutational saturation. The scale bar indicates genetic distance. Also illustrated on thisfigure is the distribution of the canonical SNP groups relative to the MLVA phylogeny (right columns). The number of isolates (N) associated with eachcanSNP group is shown in the second column. The correlation between the phylogenetic clusters identified by the canSNP and MLVA analysis withregards to the world wide geographic distribution of these clusters can be seen in Figure 3.doi:10.1371/journal.pone.0000461.g002
B. anthracis Population
PLoS ONE | www.plosone.org 4 May 2007 | Issue 5 | e461

Although A branch genotypes appear to be scattered through-
out the world, there are distinct subgroup geographic compositions
for many regions. The dominant genotypes in Southern Africa, for
example, belong to the A.Br.Vollum sub-lineage, whereas in
Europe isolates from A.Br.008/009 sub-group are dominant.
Although central Asia is poorly represented in our collection, the
genetic diversity in Eurasia appears to change along a longitudinal
axis. Isolate collections from the west (Europe) are dominated by
A.Br.008/009 sub-group isolates, and collections from western
and south-central Asia (Turkey, India) and western China are
dominated by genotypes belonging to A.Br.Aust94 sub-Lineage,
(regional data not shown). Further into central and eastern China
the genotypes are dominated by isolates belonging to the
A.Br001/002 sub-group and A.Br.Ames sub-lineage (regional
data not shown). Distinctive genotype compositions are also
observed in the western hemisphere, which is dominated by
unique clonal lineages that are not observed in the eastern
hemisphere. Within the Americas, North and South America
contain different genetic groups of B. anthracis: North American
genotypes belong mainly to the A.Br.WNA sub-lineage and South
American genotypes belong mainly to A.Br.003/004 sub-group.
A striking feature of isolate collections from the Americas is that
the dominant clonal groups are rarely observed outside of these
regions. These collections also exhibit low genetic diversity even
when analyzed using high-resolution MLVA markers (Figure 2).
For instance, in South America isolates from the A.Br.003/004
sub-group (mean within-group VNTR distance = 0.08; Fig. 3A)
comprise more than 80% of the total isolates from this region yet
are rarely observed elsewhere in the world. A similar trend is
observed in the more extensive isolate collection from North
America, which is dominated (70%) by a single group (sub-lineage
A.Br.WNA; mean within-group VNTR distance= 0.06; Fig. 3A)
that is not observed outside of North America. In contrast, the
dominant sub-lineages in Europe, Asia, and Africa exhibit greater
within-group genetic distances [Europe=A.Br.008/009 sub-
group, mean within-group genetic distance = 0.17; South Asia
(India, Turkey) =A.Br.Aust94 sub-lineage, mean within-group
genetic distance = 0.22; East Asia (China) =A.Br.001/002 sub-
group, mean within-group genetic distance = 0.14; Southern
Africa =A.Br.Vollum sub-lineage, mean within-group genetic
distance = 0.19]. In more industrialized regions, such as Western
Europe and the United States, we observe dominant clonal
lineages but also the co-occurrence of greatly differing genetic
types. Important ‘‘donor’’ regions can be identified and differen-
tiated from ‘‘recipient’’ regions based upon their strain diversity
and the positions of these strains in phylogenetic models.
Figure 3. Worldwide distribution of B. anthracis clonal lineages:Phylogenetic and geographic relationships among 1,033 B. anthracis isolates.(A) Population structure based upon analysis of data from 12 canSNP (Protocol S1). The numbers of isolates (N) and associated MLVA genotypes (G)within each sub-lineage are indicated as well as the average Hamming distance (D) as estimated from VNTR data. The major lineages (A, B, C) arelabelled, as are the derived sub-lineages (1–12), which are also color-coded. (B) Frequency and geographic distribution of the B. anthracis sub-lineages. The colors represented in the pie charts correspond to the sub-lineage color designations in panel A.doi:10.1371/journal.pone.0000461.g003
B. anthracis Population
PLoS ONE | www.plosone.org 5 May 2007 | Issue 5 | e461

Molecular Clock EstimatesOur models, based upon simple assumptions and whole genome
synonymous SNP surveys, allowed us to generate age estimates for
the major events in the evolutionary history of B. anthracis (Methods).
The divergence of the rare C branch isolates from the lineage
containing the A and B branches appears to have occurred
approximately 12,857 to 25,714 ybp. The more recent divergence
of the A and B branch from a common ancestor occurred
approximately 8,746 to 17,493 ybp. On a more recent time scale,
we estimate that the primary A-radiation in B. anthracis, which is
clearly evident in Figures 2 and 3A, occurred approximately 3,277 to
6,555 ybp, or in the mid-Holocene (Table 2).
DISCUSSIONB. anthracis is thought to have diverged from a B. cereus ancestor by
the evolutionary acquisition of two virulence plasmids (pX01 and
pX02) and several important chromosomal mutations, such as the
nonsense mutation in plcR [15–18]. Subsequent evolution within
this pathogen is evidenced by differences in the global distribution
and abundance of isolates from the major clonal lineages (A, B,
and C). In B. anthracis, the more common genotypes and the majority
of isolates are located in shallow branches within the A lineage
(Figures 2, 3A); whereas the B and C lineages are associated with
rarer genotypes and fewer isolates. If isolate abundance is used as
a fitness estimator, with rare genotypes considered less fit than
common types, genotypes from the C branch and, to a lesser extent,
the B branch appear to have very low fitness relative to the A branch
genotypes (Figures 2, 3). Indeed, the C branch has significantly
slower evolutionary rates than the A branch ([5]; Figure 2),
suggestive of fewer infective cycles in nature.
The A branch of B. anthracis has experienced a recent and
massive radiation (Figures 2 and 3A) that was clearly a very
important event in the evolution of anthrax. Evidence for this
event includes the great success of the A branch and its clonal
derivatives, the involvement of A genotypes in most of the recent
anthrax outbreaks around the world, and short phylogenetic
branch lengths within this group. This last point is best illustrated
in the dendrogram generated from the MLVA data alone
(Figure 2), which capitalizes upon the rapid evolution of VNTR
loci to depict the recently-derived radiative lineages within the A
branch. The domination of A branch genotypes on a global scale is
indicative of great reproductive success (hence, fitness) and
considerable long-distance dispersal (Figure 3B). In the absence
of the A-lineage expansion, anthrax likely would be a highly
restricted and rare disease.
There are several possible explanations for the differences in
global distribution and abundance observed among the major
lineages of B. anthracis. One explanation is adaptive genetic
differences that affect survival and propagation in either the
environment or hosts. A comparison of A vs. B isolates from
Kruger National Park, South Africa indicated that A strains were
adapted to more diverse environments than B strains, which were
restricted to more narrow environmental conditions [9]. This
trend is also reflected on a global scale, where the B and C types
may be successful locally or regionally but, unlike the A strains, are
not a dominant presence worldwide. The limited abundance and
geographic distribution of these rarer lineages may arise from
fitness costs associated with niche specialization [9,19].
In addition to possible adaptive differences among lineages,
stochastic processes such as human-mediated dispersal may
explain the greater success of particular genetic groups. The
global genetic population structure of B. anthracis suggests human
activities have played a role in the proliferation and dispersal of
this now global disease and we see evidence for these human
impacts on several time scales. For example, models based upon
simple assumptions and whole genome synonymous SNP surveys
suggest the primary A-radiation in B. anthracis occurred approx-
imately 3,277 to 6,555 ybp, or in the mid-Holocene (Table 2).
These age estimates coincide with periods of increased human
activities in animal domestication and domesticate population
expansion [20–24]. Although the importance of the development
of human civilization and animal domestication in the natural
history of anthrax has been recognized [20,21], our study presents
genetic evidence that it dramatically influenced the global
population structure of B. anthracis.
As an important disease of livestock, it seems logical that major
evolutionary events in anthrax, such as the A radiation, coincide
with human developments in agriculture, animal domestication,
and Old World trade routes. Animal husbandry and farming
Table 2. Molecular clock estimates of separation times among B. anthracis sub-lineages.. . . . . . . . . . . . . . . . . . . . . . . . . . . . . . . . . . . . . . . . . . . . . . . . . . . . . . . . . . . . . . . . . . . . . . . . . . . . . . . . . . . . . . . . . . . . . . . . . . . . . . . . . . . . . . . . . . . . . . . . . . . . . . . . . . . . . . . . . . . . . . . . . .
Compared lineagesaMajorgroupings
Total synonymoussitesb
ObservedsSNPs
sSNP substitutionfrequency
1 death per yearmodel (ybp62 STD)c
0.5 death per yearmodel (ybp62 STD)c
dVollum /eAmes A vs. A 899,987 153 1.7E-04 3,8016123 7,6036174
dVollum /fWNA A vs. A 899,957 129 1.4E-04 3,2056113 6,4116160
eAmes/fWNA A vs. A 902,239 114 1.3E-04 2,8256106 5,6516150
Average among A branch divergence times = 3,2776114 6,5556162
gCNEVA/eAmes B vs. A 901,936 322 3.6E-04 7,9836179 15,9666253
hKrugerB vs eAmes B vs. A 902,983 384 4.3E-04 9,5096195 19,0196276
Average B branch/A branch divergence times = 8,7466187 17,4936264
gCNEVA/hKrugerB B vs. B 901,935 188 2.1E-04 4,6616137 9,3226193
iC.A1055/ gCNEVA C vs. B 901,783 484 5.4E-04 12,0026219 24,0036310
iC.A1055/eAmes C vs. A 901,791 553 6.1E-04 13,7136234 27,4256331
a Sub-lineages according to Fig. 1, bTotal Syn Sites = The total sites for synonymous substitutions were determined separately for each pair-wise comparison. c Themodel for sSNP substitution rate is particularly sensitive to number of death cycles per year. Therefore, two possible scenarios (1 and 0.5 deaths per year) were modelled(see supporting methods on the PNAS website for more details). STD = The standard deviation for observed sSNPs, calculated as the square root of the time estimate.Thus, 2 STD represents ,95% confidence interval based upon fluctuation in this parameter of the model. d Sequence from the Vollum strain, The Institute for GenomeResearch (TIGR). e Sequence from the ‘Ames Ancestor’ strain, GenBank Reference Sequence NC 007530. f Sequence from the Western North America USA 6153, TIGR.gSequence from the CNEVA-9066, TIGR. h Sequence from the Kruger B strain, TIGR. I Sequence from A1055, TIGRdoi:10.1371/journal.pone.0000461.t002..
.....................................................................
B. anthracis Population
PLoS ONE | www.plosone.org 6 May 2007 | Issue 5 | e461

practices, which forced animals into confined areas, are likely to
have increased B. anthracis infection and evolutionary rates, which
would rapidly increase genotypic diversification. Similarly, the
population expansion of large mammal domesticates from the
centers of domestication in Eurasia and North Africa would
function to disperse B. anthracis genotypes. Molecular clock models
suggest that African and Eurasian cattle populations expanded
9,000 ybp and 5,000 ybp, respectively [24]; a time period that
roughly corresponds to the A lineage radiation (3,277 to
6,555 ybp) and the divergence of the two major B branches from
a common ancestor (4,661–9,322 ybp).
Independent domestication and domesticate expansion events
may provide an explanation for the different assortments of A and
B lineages on these two continents. For example, the two major B
lineages are spatially separated, one is found in southern Africa
(B.Br.001/002 sub-group and B.Br.KrugerB sub-lineage) and the
other (B.Br.CNEVA-9066 sub-lineage) is found in portions of
Europe, suggesting that after diverging from a common ancestor,
these two groups experienced independent evolutionary histories.
The divergence of the B.Br.CNEVA and B.Br.Kruger sub-lineages
are similar inmolecular clock estimates to the A radiation and, again,
could represent human influences on this pathogen. Taken together,
human-mediated events in the mid-Holocene provide plausible
explanations for both the dramatic events in B. anthracis evolution
observed during this time period and the diversity among and within
clonal lineages on the African and Eurasian landmasses.
The dispersal of B. anthracis to the western hemisphere was
probably via intercontinental transport of animal products during
European colonization [25,26]. Evidence for this includes isolate
collections from the western hemisphere that are dominated by
clonal groups that are rarely observed outside of these regions and
exhibit low genetic diversity when analyzed using high-resolution
markers. These patterns are consistent with single, relatively recent
introductions followed by widespread dispersal, ecological estab-
lishment, and local differentiation. The close derived genetic
relationship between the North American sub-lineage A.Br.WNA
and the dominant European sub-group A.Br.008/009 is consistent
with an introduction to North America from Europe, possibly via
French or Spanish colonization [25,26].
More recent human activities in commerce and industrialization
also appear to have impacted the global population structure of B.anthracis. For instance, in addition to a single dominant genetic
type, North America also contains a cosmopolitan assortment of
rarer B. anthracis genotypes that are likely a consequence of
international industrial trade (e.g., wool, skins, bone meal, shaving
brushes). A similar phenomenon is observed in other industrialized
regions, such as Western Europe, where we observe the co-
occurrence of greatly differing genetic types. The dispersal of these
genotypes to industrialized regions has been tied to the trade of
spore-infected items [25,27]. For instance, in the United Kingdom,
the presence of minor genetic types that are dominant in portions of
southern and eastern Asia (sub-lineages A.Br.Aust94, A.Br.001/002,
A.Br.Ames; Figure 3) is consistent with reports tracing anthrax
infections to imported animal products from these regions during the
19th and early 20th century [28–31]. Certainly, the highly-stable B.
anthracis spore plays an important role in the importation of diverse
genotypes into industrialized countries via transport and trade of
contaminated commodities across large distances.
Trade also seems the likely source of B. anthracis in Australia. It
has been hypothesized that anthrax was first introduced to
Australia in 1847 via contaminated bone meal-based fertilizer
shipped from India. Following this initial introduction at Sydney,
the disease is thought to have spread along stock routes to the
interior of the country [32]. Our genetic data provide some
support for this hypothesis. All ten of the isolates we examined
from India were assigned to sub-lineage A.Br.Aust94, which also
appears as the dominant sub-lineage in Australia. It must be noted
that the preponderance of isolates from A.Br.Aust94 lineage in
Australia stems in part from a collection that is dominated by
isolates from a single anthrax outbreak. Our genetic data, in fact,
indicates separate introductions into Australia of isolates that
belong to the A.Br.005/006 and A.Br.001/002 sub-groups; sub-
groups that are more commonly found in Southern Africa and
Eastern Asia, respectively.
B. anthracis has been developed as a biological weapon by several
nations and terrorists groups and this has greatly increased the
value of genotyping analysis for applications that attempt to
differentiate between natural and bioterrorist-mediated outbreaks
of anthrax. This is illustrated in the identification of the Ames
strain as the source for the weaponized material from the 2001
anthrax letter attacks in the USA [1,3,13]. We found that the
Ames strain genotype, which was originally obtained from a dead
cow in Texas in 1981, is unique in this isolate collection and,
hence, apparently rare in nature. North America is well
represented in this study with 273 isolates spanning 44 MLVA
genotypes (A.Br.WNA plus isolates from other sub-lineages,
Figure 3B). However, the Ames genotype was present only once
(although genetically similar isolates to the Ames strain were also
identified in Texas, USA). The rarity of the Ames genotype in
nature, coupled with its widespread use as a laboratory strain,
makes it unlikely that the source material utilized in the 2001
bioterrorist attack was acquired directly from nature. These findings
further highlight the importance of large genetic-geographic
databases for distinguishing between intentional and environment-
acquired infections caused by organisms that are both potential
biological weapons and widespread in the environment [8,33,34].
In summary, our analyses of both canSNP and MLVA data
provide a description of the global diversity and historical trans-
mission patterns of B. anthracis. Our data suggest that although B.
anthracis is a naturally occurring pathogen, human activities have
dramatically influenced its current distribution and occurrence.
We observe the effects of human activities at three levels: 1) the
massive radiation of the A-branch in the mid-Holocene, 2) the
more recent colonial-era importation of specific B. anthracis
genotypes from the Old World into the New World, which lead
to their ecological establishment, and 3) the repeated industrial
importation of rare diverse genotypes into developed countries
through animal products (e.g. wool, hides, and bone meal). The
genetic population structure of B. anthracis is indicative of these
long distance transmission events and illustrates its ability to
become ecologically established in new locations. Fortunately,
natural outbreaks of anthrax can be managed effectively through
vaccination and public health efforts. However, due to actual and
potential nefarious use of the pathogen, anthrax will likely remain
of great social and scientific importance.
MATERIALS AND METHODS
NomenclatureThe tree in Figure 1 is based upon an analysis of .1,000 SNPs
discovered amongst seven complete or draft genomes of B.
anthracis, which yielded a branched phylogeny containing seven
lineages corresponding to the sequenced ‘‘discovery’’ genomes [5].
In a strictly clonal species, like B. anthracis, these genomes will be
situated at the end of each branch. These terminal lineages are
depicted as stars Figure 1 and each of these lineages is named after
the sequenced isolate (e.g. Ames, KrugerB, Vollum, etc.). The
canSNPs are named after one of the three main clades (e.g. A, B,
B. anthracis Population
PLoS ONE | www.plosone.org 7 May 2007 | Issue 5 | e461

or C) followed by a three digit number (A.Br.001, A.Br.002,
A.Br.003). Where possible, we have tried to be systematic in
naming the canSNPs. For example, the first canSNP in the A
branch was proximal to the Ames genome sequence (or the lineage
terminus) and is named A.Br.001 (red labels in Figure 1). The
second canSNP position defines a position between canSNP
A.Br.001 and the circled position called A.Br.001/002. Such
a systematic naming scheme for canSNPs may be compromised by
future studies that define additional lineages and branches (i.e. the
order of the canSNPs from the terminus will be inconsistent with
their names). Hence, this should only be considered an arbitrary
numbering system, but it will function effectively as new phylgenetic
discoveries are made. The circles in the dendrogram represent
branches or branch points defined by flanking characters (canSNPs).
The branch points and the ends of lineages (the circles and stars in
Fig 1) encompass all 1,033 B. anthracis isolates (ranging from 2 isolates
in the C lineage (C.Br.A1055) to 228 isolates in the Western North
American lineage (A.Br.WNA). Branch points also have been
defined and named by their flanking canSNPs (e.g. B.Br.001/002).
The near total absence of homoplasy (character conflicts in the tree),
coupled with character discovery bias, has caused ‘‘branch collapse’’
in this clonally propagating pathogen [5,35]. A collapsed branch is
still defined by its flanking canSNP characters.
B. anthracis isolatesWe examined a global collection of 1,033 B. anthracis isolates.
Table S3 contains information on the numbers and distribution of
strains used in this study. These isolates were obtained from known
anthrax cases, environmental sources, or other materials associ-
ated with the disease. Our isolate collection is biased toward
anthrax outbreaks that occurred in the last several decades and
towards countries actively engaged in the international exchange
of scientific material. It is important to note that all of the isolates
analyzed in this study were shown to possess the plcR inactivating
mutation as detected by the PCR assay described in Easterday et
al. [16]. This nonsense mutation is considered essential for
maintenance of virulence plasmids and represents a definitive
character of B. anthracis [16,36].
DNA isolationA 1.0 ml inoculating loop was used to transfer B. anthracis colony
material into 200 ml of Brain-Heart Infusion broth (Hardy
Diagnostics, Santa Maria, CA) within the wells of a sterile,
untreated polycarbonate 96-well culture plate (Costar Corning
Inc., Acton, MA). The plate was then covered with an adhesive
plastic film, placed in a secondary containment device, and
incubated overnight at 37uC without shaking. Following in-
cubation, 10.0 ml of broth was transferred to a MicrosealTM
Polypropylene Microplate (MJ Research, Waltham, MA). The
samples were then flash-frozen in 96-well cold block (280uC) for15 s and then immediately thawed in a 96-well heat block (96uC)for 15 s. This freeze-thaw cycle was repeated two additional times.
The cell lysates were then transferred into a 96-well GV 0.2 mMDurapore Multiscreen Plate (Millipore, Billarica, MA) containing
100 ml of TE (10 mM Tris-HCl [pH 8.0], 1.0 mM EDTA) per
well. Cellular debris and spores were removed from the 96-well
filter plate by vacuum filtration using a MultiScreen Separations
System Manifold (Millipore, Bedford, MA). The filtrate was
collected into a 96-well plate and used to support PCR for
downstream SNP and MLVA genotyping. The sterility of each
sample was confirmed by plating 1.0 ml of each filtrate onto a TSA
II 5% Sheep Blood prepared media plate (Becton Dickinson and
Company, Cockeysville, MD) and incubating at 37uC for 48 hr.
Genetic MarkersTwo types of genetic markers were used to analyze the B. anthracis
collection: canonical single nucleotide polymorphisms (canSNPs)
and variable number tandem repeats (VNTRs). We used data
from the Pearson et al. [5] and unpublished genomic sequence data
(Ravel et al., unpublished data) to identify canSNPs that can be used
for identifying a particular phylogenetic point in the evolutionary
history of B. anthracis. In total, 2 B. anthracis specific SNPs and 12
canSNPs to analyze DNA from the 1,033 B. anthracis isolates.
CanSNP alleles were determined using TaqManTM -Minor Groove
Binding (MGB) allelic discrimination assays. TaqManTM MGB
probes and primers for the canSNPs were designed using ABI
Primer Express software and guidelines, with the exception that
allele-specific probe lengths were manually adjusted to match
melting temperatures [37]. The genomic location for each of the
canSNPs can be found in Table S4 while the probe and primer
sequences for each are listed in Table S5. Each 10.0 ml reactioncontained 16ABI Universal Master Mix, 250 nM of each probe,
and 600 nM each of forward and reverse primers and 1.0 ml ofapproximately 350 pg/ml template DNA. For all assays, thermal
cycling parameters were 50u C for 2 min., 95u C for 10 min.,
followed by 40–50 cycles of 95u C for 15 sec and 60u C for 1 min.
Endpoint fluorescent data were measured on the ABI 7900.
DNA from the isolates was also analyzed using 15 VNTR loci;
eight of these VNTRs are described by Keim et al. [4] MLVA8
and the additional 7 markers are described by Zinser [38]. These
markers were compiled together into a multiple-locus VNTR
analysis (MLVA15) subtyping system (see Protocol S1, Table S6
for details on the markers and methods).
Phylogenetic analysesTwo basic approaches were used to analyze genetic relationships
among the 1,033 B. anthracis isolates. First, canSNP and VNTR data
were used in a hierarchical approach to analyze phylogenetic
relationships: data from the slowly evolving canSNPs loci were used
to categorize the isolates into clonal lineages and followed by the use
of data from the 15 rapidly-evolving VNTR loci to measure diversity
and determine the number of genotypes within each of these clonal
categories. This system allowed us to effectively analyze both older
phylogenetic relationships and younger population-level structure
[3]. Second, we used UPGMA cluster analyses of the MLVA15 data
alone to illustrate the global population genetic structure in an
unbiased manner. All phylogenetic analyses were conducted using
MEGA3 software [39].
Geographic distribution of clonal lineagesTo examine genetic-geographic patterns in B. anthracis, we mapped
the worldwide distribution of the clonal lineages that were
identified by the analysis of the canSNP data.
Age EstimatesTo estimate the age of several events in the evolutionary history of
B. anthracis, we performed whole genome synonymous SNP
comparisons of strains that represent major clonal lineages. We
utilized the following equation to estimate the time since pairs of
strains last shared a common ancestor:
Age~sSNPs
MR|sSites|generations|2½ � ,
where sSNPs is the total number of synonymous SNPs between two
strains as determined by whole-genome comparisons, MR is the
B. anthracis Population
PLoS ONE | www.plosone.org 8 May 2007 | Issue 5 | e461

per site synonymous mutation rate in B. anthracis (5.2610210
mutations/generation; [40], sSites is the number of synonymous sites
in common between the two strains, and generations is the estimated
number of generations undergone by a given lineage in each year
(estimated as 43 per transmission cycle). The number of generations
per year is based upon an ungulate transmission model and the
number of infection/death cycles per year (see detailed descriptions
below). The age estimates are particularly sensitive to the number of
infection/death cycles per year. As such, we calculated the estimates
using both 1 (43 generations/year) and 0.5 (21.5 generations/year)
infection/death cycles per year (Table 2).
Details of the Age EstimatesThe use of sSNPs for the substitution rate restricts these estimates to
nearly neutral evolutionary characters. While all SNPs are relatively
infrequent among B. anthracis isolates, the use of whole genome
analysis has identified many sSNPs (Table 1) and resulted in highly
robust estimates of relationships among isolates [5]. sSNP occurrence
between two strains is modeled well by the Poisson probability
distribution. The relative large number of observations makes the
error in this estimate small. When the expected number is high, the
Poisson become fairly symmetrical with a standard deviation equal to
the square root of the expected number. Thus, two standard devia-
tions from the maxima are very close to the 95% confidence interval.
The mutations rates for single nucleotide changes have been
reported in B. anthracis based upon selection for antibiotic
resistance (Rif) and are very similar to the rates observed for
other well-studied bacteria (2). In this case, Vogler et al. [40]
estimated the rate using the Luria-Delbruck fluctuation test and
then partitioned the phenotypic mutation rate (1.55E-09 mutants
per generation) to different nucleotide positions in the rpoB gene by
sequencing this gene in the mutants. Hence, we have a per site
mutation rate (5.2E-10 mutations per generation) instead of
merely a phenotypic rate.
While Drake [41,42] has argued for a universal substitution rate
for microbial genomes, the extremely episodic nature of anthrax
transmission makes this hard to justify among the clonal lineage of
B. anthracis. Indeed, this is clearly the most sensitive aspect of the
substitution rate model with certain parameters highly influential
in the final estimates.
Ungulate transmission modelThe number of Bacillus anthracis generations (G) in a single infected
ungulate was determined using the following equation:
G~ log2 t7ið Þ½ �,
where t= terminal number of B. anthracis organisms in a 100 kg
ungulate (100 kg 6 d), i= initial number of B. anthracis organisms
in the ungulate as obtained from an environmental source (10
organisms), and d= terminal density of B. anthracis organisms per
unit body weight in a mammal (108.8 organisms per kg) [43].
Based on these parameters, it was estimated that G=43.1, which
was rounded to 43. The model is not particularly sensitive to this
particular parameter. Changing the size of the animal and, hence,
the final B. anthracis population size is mitigated by the log2transformation. The number of generations is altered only by 3.3
for every 10-fold increase in population size. This has a minimal
affect upon the final number of generations.
Infection/death cycles per yearEstimating the number of infection/death cycles per year is
difficult for anthrax. While hundreds or even thousands of
individual animals might die in a single outbreak, it is unlikely
that these multiple victims are sequential infection/death cycles.
Rather, these clusters are likely to be from a single source, or
due to environmental induction of the outbreak. For this reason,
we believe that the average annual number of death/infection
cycles will be one or less, even in the most endemic regions. B.
anthracis spores are known to survive long periods of time; though
very long-term spore survival is unlike to be important in the
overall evolutionary rates as the viability does drop with time. In
this study, we are primarily interested in the most highly fit
branch of B. anthracis (A). Its worldwide distribution and fitness
argues for a higher rate of transmission, probably close to one
infection/death cycle per year. Because this is one of the most
sensitive parameters in the model, we have modeled the
molecular clock estimates using both 1 and 0.5 deaths per year.
These values translate into 43 or 21.5 generations per year when
combined with the population size estimates from a typical host
(see above).
SUPPORTING INFORMATION
Table S1 The 221 MLVA Genotypes and Associated Can
SNPs. The 221 genotypes (1–221, Column A) are organized
according to their Keim Genetics Lab ID Designation (‘‘A’’
number - Column B), prior designations when available (‘‘K’’
numbers - Column C), their original MLVA8 GenoTyping
designation (‘‘GT’’ numbers: 1–89 - Column D) from Keim et
al., (2000) and the alternative strain designations and original
source codes for each isolate (Column E). This is followed by the
isolate’s canSNP lineage/group (Column F, also see Fig 1), two B.
anthracis specific SNPs (Columns G and H), the13 canSNP scores
(Columns I–U) and the 15 marker MLVA profile for that isolate
(Columns W–AK). The first two SNPs (Column G and H) are
Bacillus anthracis specific SNPs originally identified in the plcR
and gyrA loci and are not part of the canSNP profile. There are
221 unique MLVA genotypes listed in this table.
Found at: doi:10.1371/journal.pone.0000461.s001 (0.15 MB
XLS)
Table S2 The MLVA Sizing Code. The VNTR alleles for each
MLVA marker in Supplemental Table S1 are letter coded
according to size to allow these data sets to be utilized by various
tree drawing programs. Apparent MLVA fragment sizes vary from
instrument to instrument and even with various size standards.
Allele codes provide a common designation in the face of this
variation. Table S2 provides a code that describes the fragment
sizes for these alleles based on analysis on an ABI 3100 Genetic
Analyzer (see Protocol S3), a custom made LIZH-labeled internal
size standard (5), and subsequent analysis using Genotyper. The
numeral 1 appears as a code when a fragment failed to amplify;
eg., an isolate lacking the pXO1 plasmid would not be able to
amplify the pXO1.1AAT VNTR marker.
Found at: doi:10.1371/journal.pone.0000461.s002 (0.02 MB
XLS)
Table S3 Geographical Composition of B. anthracis isolates
used in this study
Found at: doi:10.1371/journal.pone.0000461.s003 (0.06 MB
DOC)
Table S4 CanSNPs Description and Chromosomal Location
Found at: doi:10.1371/journal.pone.0000461.s004 (0.03 MB
DOC)
Table S5 Canonical SNP Primers/Probes used in molecular
typing of B. anthracis
B. anthracis Population
PLoS ONE | www.plosone.org 9 May 2007 | Issue 5 | e461

Found at: doi:10.1371/journal.pone.0000461.s005 (0.03 MB
DOC)
Table S6 15 VNTR loci in the B. anthracis 15 VNTR MLVA
system.
Found at: doi:10.1371/journal.pone.0000461.s006 (0.04 MB
DOC)
ACKNOWLEDGMENTS
Author Contributions
Conceived and designed the experiments: PK TP Mv DW WE LH TS JU
SK KS LK. Performed the experiments: Mv WE LH SZ TS JU SK SR
GZ LK RL. Analyzed the data: JR PK TP Mv DW WE LH. Contributed
reagents/materials/analysis tools: CF JR TP Mv DW WE LH JF PC KS
BW MH. Wrote the paper: PK Mv DW RO.
REFERENCES1. Hoffmaster AR, Fitzgerald CC, Ribot E, Mayer LW, Popovic T (2002)
Molecular subtyping of Bacillus anthracis and the 2001 bioterrorism-associated
anthrax outbreak, United States. Emerg Infect Dis 8: 1111–1116.2. Keim P, Smith KL, Keys C, Takahashi H, Kurata T, et al. (2001) Molecular
investigation of the Aum Shinrikyo anthrax release in Kameido, Japan. J Clin
Microbiol 39: 4566–4567.3. Keim P, Van Ert MN, Pearson T, Vogler AJ, Huynh LY, et al. (2004) Anthrax
molecular epidemiology and forensics: using the appropriate marker for differentevolutionary scales. Infect Genet Evol 4: 205–213.
4. Keim P, Price LB, Klevytska AM, Smith KL, Schupp JM, et al. (2000) Multiple-locus variable-number tandem repeat analysis reveals genetic relationships
within Bacillus anthracis. J Bacteriol 182: 2928–2936.
5. Pearson T, Busch JD, Ravel J, Read TD, Rhoton SD, et al. (2004) Phylogeneticdiscovery bias in Bacillus anthracis using single-nucleotide polymorphisms from
whole-genome sequencing. Proc Natl Acad Sci U S A 101: 13536–13541.6. Fouet A, Smith KL, Keys C, Vaissaire J, Le Doujet C, et al. (2002) Diversity
among French Bacillus anthracis isolates. J Clin Microbiol 40: 4732–4734.
7. Gierczynski R, Kaluzewski S, Rakin A, Jagielski M, Zasada A, et al. (2004)Intriguing diversity of Bacillus anthracis in eastern Poland–the molecular echoes
of the past outbreaks. FEMS Microbiol Lett 239: 235–240.8. Fasanella A, Van Ert M, Altamura SA, Garofolo G, Buonavoglia C, et al. (2005)
Molecular diversity of Bacillus anthracis in Italy. J Clin Microbiol 43:3398–3401.
9. Smith KL, DeVos V, Bryden H, Price LB, Hugh-Jones ME, et al. (2000) Bacillus
anthracis diversity in Kruger National Park. J Clin Microbiol 38: 3780–3784.10. Maho A, Rossano A, Hachler H, Holzer A, Schelling E, et al. (2006) Antibiotic
susceptibility and molecular diversity of Bacillus anthracis strains in Chad:detection of a new phylogenetic subgroup. J Clin Microbiol 44: 3422–3425.
11. Van Ert MN, Easterday WR, Simonson TS, U’Ren JM, Pearson T, et al. (2007)
Strain-Specific Single-Nucleotide Polymorphism Assays for the Bacillusanthracis Ames Strain. J Clin Microbiol 45: 47–53.
12. Stephens AJ, Huygens F, Inman-Bamber J, Price EP, Nimmo GR, et al. (2006)Methicillin-resistant Staphylococcus aureus genotyping using a small set of
polymorphisms. J Med Microbiol 55: 43–51.13. Read TD, Salzberg SL, Pop M, Shumway M, Umayam L, et al. (2002)
Comparative genome sequencing for discovery of novel polymorphisms in
Bacillus anthracis. Science 296: 2028–2033.14. Altshuler D, Brooks LD, Chakravarti A, Collins FS, Daly MJ, et al. (2005) The
International HapMap Consortium: A haplotype map of the human genome.Nature 437: 1299–1320.
15. Slamti L, Perchat S, Gominet M, Vilas-Boas G, Fouet A, et al. (2004) Distinct
mutations in PlcR explain why some strains of the Bacillus cereus group arenonhemolytic. J Bacteriol 186: 3531–3538.
16. Easterday WR, Van Ert MN, Simonson TS, Wagner DM, Kenefic LJ, et al.(2005) Use of single nucleotide polymorphisms in the plcR gene for specific
identification of Bacillus anthracis. J Clin Microbiol 43: 1995–1997.17. Okinaka RT, Pearson T, Keim PS (2006) Anthrax but not Bacillus anthracis?
PLoS-Pathogens 2: 1025–1027.
18. Keim PS, Pearson T, Okinaka RT (2007) Evolution of Bacillus anthracis,causative agent of anthrax. In: Cassell GH, Baquero F, Nombela C, Gutierrez-
Fuentes JA, eds (2007) Introduction to Evolutionary Biology of Bacterial andFungal Pathogens;in press..
19. Kassen R, Llewellyn M, Rainey PB (2004) Ecological constraints on
diversification in a model adaptive radiation. Nature 431: 984–988.
20. Klemm DM, Klemm WR (1959) A History of Anthrax. J Am Vet Med Assoc135: 458–462.
21. Kolonin GV (1971) Evolution of anthrax, report II: History of the spread of thedisease. Zhurnal Mikrobiol Epidemiol 48: 118–122.
22. Diamond J (1997) Guns, Germs and Steel. New York: W.W. Norton andCompany.
23. Diamond J (2002) Evolution, consequences and future of plant and animal
domestication. Nature 418: 700.
24. Bradley DG, MacHugh DE, Cunningham P, Loftus RT (1996) Mitochodrial
diversity and the origins of African and European cattle. PNAS 93: 5131–5135.
25. Van Ness GB (1971) Ecology of anthrax. Science 172: 1303–1307.
26. Hanson RP (1959) The earliest account of anthrax in man and animals in NorthAmerica. J Am Vet Mde Assoc 135.
27. Dragon DC, Elkin BT, Nishi JS, Ellsworth TR (1999) A review of anthrax in
Canada and implications for research on the disease in northern bison. J ApplMicrobiol 87: 208–213.
28. Legge TM (1905) Milroy Lectures on industrial anthrax. Lancet 165: 842.
29. Doig AT, Gemmill JS (1951) Epidemiology of a small outbreak of anthrax.
Lancet 1: 1011–1012.
30. Jamieson WM, Green DM (1955) Anthrax and bone-meal fertiliser. Lancet 268:
560.
31. Green DM, Jamieson WM (1958) Anthrax and bone-meal fertiliser. Lancet 2:153–154.
32. Geering W (1997) Anthrax in Australia. Kathmandu, Nepal.
33. Lowell JL, Wagner DM, Atshabar B, Antolin MF, Vogler AJ, et al. (2005)
Identifying sources of human exposure to plague. J Clin Microbiol 43: 650–656.
34. Cheung DT, Kam KM, Hau KL, Au TK, Marston CK, et al. (2005)Characterization of a Bacillus anthracis isolate causing a rare case of fatal
anthrax in a 2-year-old boy from Hong Kong. J Clin Microbiol 43: 1992–1994.
35. Worobey M (2005) Anthrax and the art of war (against ascertainment bias).
Heredity 94: 459–460.
36. Mignot T, Mock M, Robichon D, Landier A, Lereclus D, et al. (2001) The
incompatibility between the PlcR- and AtxA-controlled regulons may have
selected a nonsense mutation in Bacillus anthracis. Mol Microbiol 42:1189–1198.
37. Morin PA, Saiz R, Monjazeb A (1999) High-throughput single nucleotidepolymorphism genotyping by fluorescent 59 exonuclease activity. Biotechniques
27: 538–552.
38. Zinser G (2002) Evolutionary relationships and mutation rate estimates in
Bacillus anthracis. Flagstaff: Northern Arizona University. 34 p.
39. Kumar S, Tamura K, Nei M (2004) MEGA3: Integrated software for MolecularEvolutionary Genetics Analysis and sequence alignment. Brief Bioinform 5:
150–163.
40. Vogler AJ, Busch JD, Percy-Fine S, Tipton-Hunton C, Smith KL, et al. (2002)
Molecular analysis of rifampin resistance in Bacillus anthracis and Bacillus
cereus. Antimicrob Agents Chemother 46: 511–513.
41. Drake JW (1999) The distribution of rates of spontaneous mutation over viruses,
prokaryotes, and eukaryotes. Ann N Y Acad Sci 870: 100–107.
42. Drake JW, Charlesworth B, Charlesworth D, Crow JF (1998) Rates of
Spontaneous Mutation. Genetics 148: 1667–1686.
43. Jones WI Jr, Klein F, Walker JS, Mahlandt BG, Dobbs JP, et al. (1967) In vivo
growth and distribution of anthrax bacilli in resistant, susceptible, and
immunized hosts. J Bacteriol 94: 600–608.
B. anthracis Population
PLoS ONE | www.plosone.org 10 May 2007 | Issue 5 | e461

Chapter 5


To map the distribution of anthrax outbreaks and strain subtypes in Kazakhstan during 1937–2005, we combined geographic information system technology and genetic analysis by using archived cultures and data. Biochemical and genetic tests confi rmed the identity of 93 archived cul-tures in the Kazakhstan National Culture Collection as Ba-cillus anthracis. Multilocus variable number tandem repeat analysis genotyping identifi ed 12 genotypes. Cluster analy-sis comparing these genotypes with previously published genotypes indicated that most (n = 78) isolates belonged to the previously described A1.a genetic cluster, 6 isolates belonged to the A3.b cluster, and 2 belonged to the A4 clus-ter. Two genotypes in the collection appeared to represent novel genetic sublineages; 1 of these isolates was from Kry-gystan. Our data provide a description of the historical, geo-graphic, and genetic diversity of B. anthracis in this Central Asian region.
Anthrax is a globally widespread disease of livestock and wildlife that occasionally infects humans. Ac-
cording to of� cial estimates, the number of human anthrax cases worldwide ranges from 2,000 to 20,000 annually (1).
Bacillus anthracis, the etiologic agent of anthrax, persists in the environment as a dormant, highly stable spore. The prolonged periods of dormancy during the spore phase slows evolution of this species, resulting in high levels of interstrain genetic homogeneity, which complicates efforts to subtype the pathogen. The availability of whole-genome nucleotide sequences of B. anthracis for single-nucleotide polymorphism (SNP) elucidation and the discovery of polymorphic markers such as variable number tandem re-peat (VNTR) sequences (2,3) have enabled identi� cation of unique subtypes within this species. Keim et al. (4) used 8 VNTRs to describe 89 unique genotypes in a global col-lection of over 400 B. anthracis isolates. Later studies used VNTRs to examine B. anthracis diversity in different glob-al regions, including France (5), Italy (6), Poland (7), Chad (8), and South Africa (9). More recently, SNPs that de� ne major clonal lineages in B. anthracis have been identi� ed and applied to describe global and regional patterns of B.anthracis diversity (10).
In the central Asian republic of Kazakhstan, anthrax is enzootic and still represents a human public health concern. A recent publication examined risk factors associated with 73 human anthrax cases in Kazakhstan over a 2-year period (11) and concluded that most cases were cutaneous and had resulted from the handling of infected livestock and contaminated animal products. Gastrointestinal anthrax in Kazakhstan has also been reported but is less common. De-spite the widespread nature of the disease in this region, the historical incidence, distribution, and genetic diversity of
Historical Distribution and Molecular Diversity of Bacillus anthracis,
KazakhstanAlim M. Aikembayev,1 Larissa Lukhnova, Gulnara Temiraliyeva, Tatyana Meka-Mechenko,
Yerlan Pazylov, Sarkis Zakaryan, Georgiy Denissov, W. Ryan Easterday, Matthew N. Van Ert,2
Paul Keim, Stephen C. Francesconi, Jason K. Blackburn,3 Martin Hugh-Jones, and Ted Hadfi eld
Emerging Infectious Diseases • www.cdc.gov/eid • Vol. 16, No. 5, May 2010 789
Author affi liations: Kazakhstan Scientifi c Center for Quarantine and Zoonotic Diseases, Almaty, Kazakhstan (A.M. Aikembayev, L. Lukhnova, G. Temiraliyeva, T. Meka-Mechenko, Y. Pazylov, S. Zakaryan, G. Denissov); Northern Arizona University, Flagstaff, Arizona, USA (W.R. Easterday, P. Keim); Midwest Research Insti-tute, Palm Bay, Florida, USA (M.N. Van Ert, T. Hadfi eld); The Trans-lational Genomics Research Institute, Phoenix, Arizona, USA (P. Keim); Naval Medical Research Center, Silver Spring, Maryland, USA (S.C. Francesconi); California State University, Fullerton, Cali-fornia, USA (J.K. Blackburn); and Louisiana State University, Baton Rouge, Louisiana, USA (M. Hugh-Jones)
DOI: 10.3201/eid1605.091427
1Current affi liation: Republican Sanitary Epidemiologic Station, Almaty, Kasakhstan.2Current affi liation: VEN Consulting, LLC, Melbourne, Florida, USA.3Current affi liation: University of Florida, Gainesville, Florida, USA.

RESEARCH
B. anthracis in central Asia, and Kazakhstan in particular, has remained cryptic.
We mapped the historical distribution of anthrax in Kazakhstan over a 68-year period. Archived cultures from a subset of these outbreaks collected from 10 oblasts (provinces) over a 53-year period were analyzed by using genetic and biochemical tests. Multilocus variable num-ber tandem repeat analysis (MLVA) and canonical single nucleotide polymorphism genotyping (10) of this collec-tion enabled us to examine strain dynamics among and within these outbreaks and to understand the diversity of B. anthracis isolates from Kazakhstan on a local, region-al, and global scale.
Materials and Methods
Mapping Historical Anthrax OutbreaksTo map the historical distribution of anthrax outbreaks
and B. anthracis strain types across Kazakhstan, we con-structed a geographic information system (GIS) database within ArcGIS 9.1 (www.esri.com). This database used archival data collected through the antiplague stations established by the Union of Soviet Socialist Republics. This system of stations remains in place under the current government, and Kazakhstan maintains a multiagency re-porting protocol to update, document, and respond to the distribution of outbreaks. These data are archived at the Kazakhstan Scienti� c Center for Quarantine and Zoonotic Diseases. Outbreaks and strain locations were geolocated to the nearest village by using GIS data layers produced by the Kazakh Institute of Geography. Historical outbreaks were mapped for 1937 through 2005. To illustrate differ-ences in the distributions of outbreaks in cattle and sheep, the 2 most affected livestock species, a kernel density esti-mation was performed by using the Spatial Analyst Exten-sion in ArcGIS. We mapped outputs by using the standard deviation of density values to illustrate areas of greatest outbreak concentration by species (12).
Isolation of B. anthracisSamples collected from anthrax outbreaks in Kazakh-
stan (with the exception of 2 isolates from the Kyrgyzstan border region) and cultures spanning a 53-year period were archived in the Kazakhstan National B. anthracis Collec-tion. Most isolates were from human patients, some from blood or organs of ruminants (mainly sheep and cows), and a few from soil or other inanimate objects contaminated by contact with blood or tissues of infected animals. Ar-chived cultures were con� rmed as B. anthracis on the basis of colony morphologic appearance; absence of hemolysis and catalase, lipase, phosphatase and protease activity; and susceptibility to B. anthracis–speci� c � phage.
DNA PreparationB. anthracis cultures from the Kazakhstan National
Collection were grown on Hottinger blood agar. A colo-ny from each sample was harvested from the agar plates and dispersed in Tris-EDTA buffer for DNA extraction. A QIAamp DNA Mini Kit (QIAGEN, Valencia, CA, USA) was used to extract genomic and plasmid DNA by using the manufacturer’s protocol. A total of 1.0 mL of DNA was collected from each of the isolates in the collection.
MLVA GenotypingEight VNTR (MLVA-8) markers were ampli� ed by
PCR by using primer pairs vrrA-f1 and vrrA-r1, vrrB1-f1 and vrrB1-r1, vrrB2-f1 and vrrB2-r1, vrrC1-f1 and vrrC1-r1, vrrC2-f1 and vrrC2-r1, CG3-f1 and CG3-r1, pXO1-AAT-f3 and pXO1-AAT-r3, and pXO2-AT-f1 and pXO2-AT-r1 (4). One microliter containing �1 ng of template DNA was added to each PCR.
Electrophoresis of ampli� ed products was performed on an ABI 310 genetic analyzer (Applied Biosystems, Inc., Foster City, CA, USA). Data were analyzed by using Gen-eMapper software V4.0 (Applied Biosystems, Inc.). To ensure comparability and accuracy of raw VNTR scores from the strains from Kazakhstan with the genotypes pub-lished by Keim et al. 2000 (4), we performed electrophore-sis on ampli� ed fragments from 4 control DNAs (A0462-Ames, A0488-Vollum; A0071-Western North America and A0402; and French B2) in parallel with the isolates from Kazakhstan. In addition, DNA molecular size refer-ence markers (Applied Biosystems, Inc) were included in each sample to accurately size the 8 VNTR fragments. Raw VNTR sizes were normalized to the sizes reported by Keim et al., 2000 (4) for genotypic comparisons.
Unweighted Pair Group Method with Arithmetic Mean Cluster Analysis of Genotypes
Unweighted pair group method with arithmetic mean (UPGMA) cluster analysis of VNTR data from 92 con-� rmed B. anthracis isolates and the diverse 89 genotypes described by Keim et al. 2000 (4) were used to establish genetic relationships. Distance matrices were generated in PAUP 4.0 (Sinauer Associates, Inc., Sunderland, MA, USA) and imported into MEGA 3.1 (13) for tree-building purposes.
Spatial Patterns of Genetic RelationshipsThe strain database was constructed from museum
records and contemporary epidemiologic investigations. This database was synchronized with the bacterial culture collection to geolocate the culture by using the GIS. To map strain diversity, we categorized culture collection locations by strain identi� cations based on the MLVA genotyping results.
790 Emerging Infectious Diseases • www.cdc.gov/eid • Vol. 16, No. 5, May 2010

Diversity of B. anthracis, Kazakhstan
SNP Typing of B. anthracis Isolates Representative cultures from each Kazakh MLVA
genotype plus the STI vaccine strain from Russia were genotyped by using previously described canonical SNPs discovered by whole-genome sequencing (10,14). SNPs were interrogated by using the Roche Light Cycler II real-time PCR instrument (Roche Diagnostics, Indianapolis, IN, USA). Allelic discrimination assays initially devel-oped on the ABI 7900 real-time platform (10) were adapt-ed for use on the Light Cycler II. The assay ampli� es a fragment of DNA sequence containing the SNP site. Two probes complementing the 2 potential SNP states were used as real time markers. Each probe had a distinct � uo-rescent label; i.e., probe 1 was labeled with 6-carboxy-� uorescein, and the alternate probe was labeled with VIC (Applied Biosystems, Inc.). The probe complementary to the sequence in the sample amplicon will hybridize over the SNP and surrounding sequence during the ampli� ca-tion process to generate a signal. It is possible for the in-correct probe to generate some signal but not enough to be confused as a positive reaction. The Light Cycler II dis-criminated which probe was the complementary sequence on the basis of the differential intensity of the reaction. Controls for each run included template DNA with both SNP states of interest.
Results
Historical Incidence and Geographic Distribution of Anthrax in Kazakhstan
A total of 1,037 human outbreaks were reported, rep-resenting 1,765 human cases. The outbreaks occurred in 665 locations; 198 of those locations reported repeat out-breaks throughout the study period (Figure 1; Table 1). Additional review of historical data at the Kazakhstan Sci-enti� c Center for Quarantine and Zoonotic Diseases iden-ti� ed 3,947 outbreak events reported for animal species and were entered into GIS. The outbreaks occurred over 1,790 locations; 805 of those reported repeated outbreaks.
Cattle and sheep were the primary livestock species af-fected during the study period; fewer outbreaks occurred among swine, and rarer, sporadic outbreaks occurred on mink farms and among foxes, and camels (Table 2). Cat-tle outbreaks were most common in northern Kazakhstan; several outbreaks occurred in the southernmost oblasts bordering Uzbekistan and Kyrgyzstan (Figure 2, panel A). Sheep outbreaks were prominent throughout eastern and southern Kazakhstan (Figure 2, panel B). The largest cattle outbreak (n = 174 cattle) in the dataset occurred in 1957 in the northernmost region of the Karaganda oblast in north central Kazakhstan. The largest sheep outbreak affected 851 sheep and occurred in the southern oblast of Zhambyl in 1971.
Biochemical Tests All cultures except 1 (isolate no. 49) were biochemi-
cally and morphologically consistent for B. anthracis; 3 cultures (isolate nos. 65, 76, and 77) were consistent with B. anthracis but did not exhibit capsule formation. With the exception of culture no. 49, isolates were nonhemolytic; nonmotile; phosphatase and lecithinase negative; protease, oxidase, and catalase positive; and, with 3 exceptions, formed a capsule.
MLVA GenotypingOf the 92 B. anthracis isolates, 88 isolates yielded
complete data for the 8 marker MLVA; 3 isolates were missing the pX02 marker (isolate nos. 65, 76, and 77), and 1 was missing the pX01 plasmid marker (isolate no. 7). Af-ter we coded the raw VNTR fragment sizes, the Kazakh B. anthracis genotypes were analyzed by using PAUP 4.0
Emerging Infectious Diseases • www.cdc.gov/eid • Vol. 16, No. 5, May 2010 791
Figure 1. Anthrax outbreaks in Kazakhstan, 1937–2005. Each dot represents an outbreak; red dots indicate that cultures were isolated and analyzed from these outbreaks.
Table 1. Outcomes for 1,765 human patients in mapped anthrax outbreak areas, Kazakhstan, 1937–2005 Status Number Recovered 1,541 Deceased 75Lost contact 17No data/unknown 132

RESEARCH
and MEGA 3.1 phylogenetic software programs. UPGMA cluster analysis of the Kazakh isolates with complete ML-VA-8 data (4) identi� ed 12 unique MLVA subtypes.
UPGMA cluster analysis of the 12 Kazak MLVA genotypes (Gkz) with the diverse 89 genotypes reported by Keim et al. (4) showed that most isolates (n = 78) belonged to the previously described A1.a genetic cluster; 6 isolates belonged to the A3.b cluster; and 2 isolates belonged to the A4 cluster. More than half of the A1.a isolates be-
long to previously described genotypes (38/74; excluding samples with missing pX01, pX02 data), including the previously described MLVA genotypes 3 (n = 15), 6 (n = 2) and 13 (n = 21). Most of the novel genotypes reported from the Kazakhstan National collection represent slight variants of previously described genotypes that can be ex-plained by the insertion or deletion of >1 tandem repeats at a particular locus, usually in pX01 or pX02 (Table 3). However, 2 of the genotypes from Kazakhstan (Gkz -9 and -11) appear to represent new sublineages on the basis of newly described allele combinations and distance-based clustering with the diverse 89 genotypes. In addition, the pX01 allele sizing at position 138 appears novel (Gkz -5); we have not seen this size reported in previous MLVA-8 studies (Table 3).
Geographic Distribution of MLVA Genotypes The geographic distribution of MLVA types in
Kazakhstan indicated that A1.a genotypes were widely distributed (Figure 3). For example, the most common Kazakh genotype (Gkz -1; n = 21) clusters on the Georgia–Kazakhstan border and on the southern border near Kyr-gyzstan and Uzbekistan. The A1.a Gkz -4 (n = 17) is also widely dispersed across Kazakhstan; cases have occurred in the western, southern, and eastern regions and into Kyrgyzstan. Speci� c genotypes within the Kazakh A1.a group appear to exhibit geographic clustering, re� ecting temporally linked outbreaks.
792 Emerging Infectious Diseases • www.cdc.gov/eid • Vol. 16, No. 5, May 2010
Table 2. Anthrax outbreaks, number of animal deaths per outbreak by species affected, and miscellaneous anthrax-positive samples, Kazakhstan, 1937–2005
Animal species No. outbreaks/
samplesDeaths/
outbreak* Total no. deaths
Sheep 1,735 0–851 16,080 Cattle 1,678 0–84 3825 Equine 304 0–28 634Swine 192 0–78 832Camel 5 1–2 7Mink 3 28–37 95Goat 1 1 1Fox 1 1 1Dog 2 1 2Arctic fox 2 5 6Unidentified 6 – 15Miscellaneous anthrax-positive samples† Soil samples 17 – – Wool 1 – –*0 indicates animals that recovered from infection. †Bacillus anthracis spores were recovered, but there were no infections.
Figure 2. Kernel density estimates of anthrax outbreaks in cattle (A) and sheep (B), Kazakhstan, 1937–2005. Color shading represents SD values relative to density values from the kernel density estimate analysis for each species.

Diversity of B. anthracis, Kazakhstan
The KZ genotypes 9–12 (Gkz -9–12) also appear to be more geographically con� ned, although this apparent con-� nement is likely a re� ection of sample size. For example, isolates with Gkz-12 (n = 6; Figure 3) are exclusively found in the border region of the East Kazakhstan oblast, whereas the group 9 isolates (n = 5) are found in the Shymkent oblast in the south-central portion of the country. MLVA Gkz-11 (n = 1), which appears to represent a previously unreported genetic lineage, was isolated just south of Kazakhstan in Kyrgyzstan.
SNP TypingRepresentative cultures from each of the Kazakh
MLVA genotypes plus the Russian STI vaccine were SNP genotyped by using allelic discrimination probes and the Light Cycler II instrument. The SNP results were compared (Table 4) with the SNP pro� les of Van Ert et al. (10), al-lowing assignment of the isolates to 1 of 12 sublineages. As with MLVA typing, all isolates tested with SNPs had genotypes characteristic of the A branches.
Representatives of MVLA genotypes 1–9 were as-signed to A.Br.008/009, KZ genotype 10 to the A.Br.Vol-lum subgroup, and genotype 11 and 12 to the A.Br.Ames subgroup. The SNP data indicated that all representative A1.a Kazakh isolates belonged to the European branch of this group. The assignment of MLVA Gkz-10 to the A.Br.Vollum group is consistent with B. anthracis found glob-ally in areas such as Pakistan and western China (10). Like-wise, the assignment of Kazakh MLVA genotypes 11 and 12 to the A.Br.Ames genotype is consistent with the pres-ence of this lineage in China (10).
DiscussionThe historical occurrence and geographic distribution
of anthrax outbreaks in Kazakhstan suggest anthrax foci are heavily concentrated in the southern region and broadly
distributed across the northern portions of the country but are less common in the central regions. This may re� ect regional differences in soil composition, availability of wa-ter and livestock and even case reporting. For example, the central region of Kazakhstan is dominated by desert, which likely has poor soils for long-term spore survival, whereas in the southern, northern, and eastern oblasts, the soils are more alkaline with higher organic matter and likely sup-port spore survival (15–17). From a temporal perspective, outbreaks (or outbreak reports) have decreased in severity (number of animals infected), frequency (number of report-ed outbreaks), and have been associated with smaller geo-graphic areas affected. However, the spatial distribution of the disease appeared to be relatively stable in the northern and southern Kazakh oblasts during the study period.
From a genetic perspective, B. anthracis in Kazakh-stan was dominated by isolates clustering in the MLVA A1.a group, which is consistent with reports of the A1.a group being widely distributed globally (4,5,6). The wide-spread occurrence and apparent ecologic establishment of these VNTR genotypes in Kazakhstan supports the hypoth-esis that the A1.a group represents a very � t strain complex (6). Of the 8 A1.a genotypes in Kazakhstan, 5 were novel (Gkz-2, -3, -4, -5, and -8) and exhibited a previously unde-scribed pX01 allele (Gkz-5), which is not unexpected con-sidering that this region has been underrepresented in prior MLVA-8 B. anthracis studies (4–8).
SNP typing of representative isolates from the A1.a Kazakh MLVA genotypes assigns these isolates to the A.Br.008/009 SNP lineage, which is widely distributed throughout Europe and has been reported in western China (10,18). Notably, the SNP data differentiate the Kazakh genotypes from the related North American genotypes, which are not effectively differentiated by MLVA alone. Since the representative Kazakh isolates in this SNP study were cultured from outbreaks spanning a 50-year
Emerging Infectious Diseases • www.cdc.gov/eid • Vol. 16, No. 5, May 2010 793
Table 3. Variable number tandem repeat sizes for Bacillus anthracis isolates, Kazakhstan* Kazakhstangenotype no.
MLVAgroup† MLVA genotype vrrA vrrB1 vrrB2 vrrC1 vrrC2 CG-3 pX01 pX02
1 A1.a Gt-13 (4) 313 229 162 613 604 153 132 1372 A1.a Novel 313 229 162 613 604 153 135 1373 A1.a Novel 313 229 162 613 604 153 129 1394 A1.a Novel 313 229 162 613 604 153 129 1375 A1.a Novel 313 229 162 613 604 153 138 1376 A1.a Gt-6 (4) 301 229 162 613 604 153 126 1377 A1.a Gt-3 (4) 313 229 162 613 604 153 126 1378 A1.a Novel 313 229 162 613 604 153 132 1399 Novel Novel 325 229 162 613 604 158 132 13710 A4 Novel 313 229 162 538 604 158 126 13711 Novel Novel 313 229 162 583 532 153 129 14112 A3b Novel 313 229 162 583 532 158 126 139*Raw allele sizes were determined by electrophoresis on the ABI 310 (Applied Biosystems, Inc., Foster City, CA, USA); sizes were compared to control variable number tandem repeats and corrected to the sizes reported by Keim et al. (4).†MLVA, multilocus variable number tandem repeat. MLVA group determined by unweighted pair group method arithmetic mean clustering with the diverse 89 genotypes described by Keim et al. (4).

RESEARCH
period (1952–2002), our data not only expand the under-standing of the geographic range of this Eurasian lineage (A.Br.008/009) but also provide insights into its historical incidence and persistence in the country. Because of sam-pling limitations, the extent to which this dominant lineage is represented in the northern sections of Kazakhstan, and further into Russia, is unknown. However, in a recent study B. anthracis DNA from persons affected by the Sverdlovsk accident was assigned to the A.Br.008/009 SNP subgroup (19). Our data and the report that the Sverdlovsk strain was initially isolated in the 1950s in Kirov, Russia (19), under-scores the need to genotype additional samples in north-
ern Kazakhstan oblasts and Russia to measure the northern range of this apparently highly successful lineage.
The assignment of Kazakh isolates to the A3.b and A4 MLVA clades and the A.Br.Ames and A.Br.Vollum SNP groups is not surprising considering these MLVA and SNP types are also found in Middle Eastern countries, such as Pakistan and China (10). As � rst reported by Van Ert et al. (10), and later detailed by Simonson et al. (18), the A.Br.001/002 is common in China, whereas the closely re-lated A.Br.Ames SNP lineage is more restricted geographi-cally. The � nding that the Kazakh isolates from the eastern border were assigned to A.Br.Ames SNP group is notable considering that the A.Br.Ames isolates that can be geolo-cated are found exclusively in Inner Mongolia. These geno-typic similarities may re� ect historical trade and nomadic routes linking those regions.
The absence of B lineage genotypes in Kazakhstan, as indicated by both MLVA and SNP data, is consistent with the lack of these genotypes in China, including the western province of Xinjiang (10,18), and supports the hypothesis that these lineages are restricted to narrow environmental conditions and, therefore, are more restricted in their glob-al distribution (9). On a more local level, our MLVA data permit strain-level analysis of samples isolated during out-breaks. In several instances we were able to link strains col-lected from human anthrax patients to the infection source. For example, we identi� ed the same strain in 10 cultures collected from an outbreak in western Kazakhstan that oc-curred from July–August 2005. The samples included cul-tures isolated from livestock, contaminated meat, human victims, and contaminated soil. The MLVA data linked the cultures and provided a mechanism for retrospective epide-miologic trace-back.
Sampling biases and limitations are important consid-erations in any study. For example, the distribution of cul-tures available for this study does not represent a balanced sampling of the entire country. There is an ongoing effort in Kazakhstan to expand the culture collection and to in-clude a wider geographic sampling of the country, includ-ing the northern oblasts, which is underrepresented in the current culture collection but has a long historical record of anthrax. It would be worthwhile to revisit livestock burial sites and to isolate and analyze cultures from this region. In addition, the application of more comprehensive genetic analysis of Kazakh isolates would provide greater insight into the uniqueness of B. anthracis diversity in this region. For example, although canonical SNPs provide a powerful tool for assigning isolates into major clonal lineages, their resolution is limited by the use of relatively few represen-tative SNPs and the diversity of the genomes used in the initial discovery process.
In summary, our work describes the historical inci-dence, distribution, and biochemical and genetic diversity
794 Emerging Infectious Diseases • www.cdc.gov/eid • Vol. 16, No. 5, May 2010
Figure 3. Geographic distribution of genotypes of Bacillus anthracisstrains in Kazakhstan (A), with a closer view of outbreaks within eastern and southern Kazakhstan (B). Different genotypes are represented by different shapes and color coding refl ecting major genetic affi liations (C). * and † indicate novel subgroups. Scale bar indicates genetic difference.

Diversity of B. anthracis, Kazakhstan
of B. anthracis isolates in the central Asian republic of Ka-zakhstan. Our discovery of novel genotypes in this region contributes to the understanding of the global diversity of the pathogen and emphasizes the need for future studies in this geographic region. In addition, this study provides useful baseline data for future epidemiologic studies in Ka-zakhstan and for guiding future disease control programs
The project research was made possible by support provided by the US Defense Threat Reduction Agency under project KZ-1 and was administered by US Civilian Research and Development Foundation.
Dr Aikembayev is the director of the Infection Control Training Centre, Republican Sanitary Epidemiologic State, Al-maty, Kazakhstan. His research interests include B. anthracis and Yersinia pestis.
References
1. Hugh-Jones M. 1996–97. Global anthrax report. J Appl Microbiol. 1999;87:189–91. DOI: 10.1046/j.1365-2672.1999.00867.x
2. Smith KL, De Vos V, Bryden HB, Hugh-Jones ME, Klevytska A, Price LB, et al. Meso-scale ecology of anthrax in southern Af-rica: a pilot study of diversity and clustering. J Appl Microbiol. 1999;87:204–7. DOI: 10.1046/j.1365-2672.1999.00871.x
3. Andersen GL, Simchock JM, Wilson KH. Identi� cation of a region of genetic variability among Bacillus anthracis strains and related species. J Bacteriol. 1996;178:377–84.
4. Keim P, Price LB, Klevytska AM, Smith KL, Schupp JM, Okinawa R, et al. Multiple-locus variable-number tandem repeat analysis re-veals genetic relationships within Bacillus anthracis. J Bacteriol. 2000;182:2928–36. DOI: 10.1128/JB.182.10.2928-2936.2000
5. Fouet A, Smith KL, Keys C, Vaissaire J, Le Doujet C, Levy M, et al. Diversity among French Bacillus anthracis isolates. J Clin Micro-biol. 2002;40:4732–4. DOI: 10.1128/JCM.40.12.4732-4734.2002
6. Fasanella A, Van Ert M, Altamura SA, Garofolo G, Buonavoglia C, Leori G, et al. Molecular diversity of Bacillus anthracis in Italy. J Clin Microbiol. 2005;43:3398–401. DOI: 10.1128/JCM.43.7.3398-3401.2005
7. Gierczynski R, Kaluzewski S, Rakin A, Jagielski M, Zasada A, Jakubczak A, et al. Intriguing diversity of Bacillus anthracis in east-ern Poland—the molecular echoes of the past outbreaks. FEMS Mi-crobiol Lett. 2004;239:235–40. DOI: 10.1016/j.femsle.2004.08.038
8. Maho A, Rossano A, Hachler H, Holzer A, Schelling E, Zinsstag J, et al. Antibiotic susceptibility and molecular diversity of Bacillusanthracis strains in Chad: detection of a new phylogenetic subgroup. J Clin Microbiol. 2006;44:3422–5. DOI: 10.1128/JCM.01269-06
9. Smith KL, DeVos V, Bryden H, Price LB, Hugh-Jones ME, Keim P. Bacillus anthracis diversity in Kruger National Park. J Clin Micro-biol. 2000;38:3780–4.
10. Van Ert MN, Easterday WR, Huynh LY, Okinaka RT, Hugh-Jones ME, Ravel J, et al. Global genetic population structure of Bacil-lus anthracis. PLoS One. 2007;2:e461. DOI: 10.1371/journal.pone.0000461
11. Woods CW, Ospanov K, Myrzabekov A, Favorov M, Plikaytis B, Ashford D. Risk factors for human anthrax among contacts of anthrax-infected livestock in Kazakhstan. Am J Trop Med Hyg. 2004;71:48–52.
12. Curtis AC. Blackburn.JK, Sansyzbayev Y. Using a geographic infor-mation system to spatially investigate infectious disease. In: Tibay-renc M, editor. Encyclopedia of infectious diseases: modern method-ologies. New York: Wiley and Sons Publishing; 2007. p. 405–424.
13. Kumar S, Tamura K, Nei M. MEGA3. Integrated Software for Mo-lecular Evolutionary Genetics Analysis and Sequence Alignment. Brief Bioinform. 2004;5:150–63. DOI: 10.1093/bib/5.2.150
14. Pearson T, Busch JD, Ravel J, Read TD, Rhoton SD. U’Ren JM, et al. Phylogenetic discovery bias in Bacillus anthracis using sin-gle-nucleotide polymorphisms from whole-genome sequencing. Proc Natl Acad Sci U S A. 2004;101:13536–41. DOI: 10.1073/pnas.0403844101
15. Food and Agriculture Organization of the United Nations. 1970–78, soil map of the world, scale 1:5,000,000, volumes I–X. Paris: United Nations Educational, Scienti� c, and Cultural Organization; 1978.
16. Van Ness G, Stein CD. Soils of the United States favorable for an-thrax. J Am Vet Med Assoc. 1956;128:7–9.
17. Van Ness GB. Ecology of anthrax. Science. 1971;172:1303–7. DOI: 10.1126/science.172.3990.1303
Emerging Infectious Diseases • www.cdc.gov/eid • Vol. 16, No. 5, May 2010 795
Table 4. Bacillus anthracis SNPs, Kazakhstan*
IsolateKZ MLVA genotype SNP group
SNPsA branch B branch
001 002 003 004 006 007 008 009 001 002 003 004KZ 6 1 A.Br.008/009 T G A T A T G A T G G TKZ 60 2 A.Br.008/009 T G A T A T G A T G G TKZ 52 3 A.Br.008/009 T G A T A T G A T G G TKZ 3 4 A.Br.008/009 T G A T A T G A T G G TKZ 44 4 A.Br.008/009 T G A T A T G A T G G TKZ 1 5 A.Br.008/009 T G A T A T G A T G G TKZ 74 6 A.Br.008/009 T G A T A T G A T G G TKZ 25 7 A.Br.008/009 T G A T A T G A T G G TKZ 55 7 A.Br.008/009 T G A T A T G A T G G TKZ 8 8 A.Br.008/009 T G A T A T G A T G G TKZ 13 9 A.Br.008/009 T G A T A T G A T G G TKZ 11 10 A.Br.Vollum T G A T A C T A T G G TKZ 42 11 A.Br.Ames C A G C A T T A T G G TKZ 66 12 A.Br.Ames C A G C A T T A T G G TKZ ST1 NA A.Br.008/009 T G A T A T G A T G G T*SNP, single nucleotide polymorphism; KZ, Kazakhstan; MLVA, multilocus variable number tandem repeats; NA, not applicable. SNP changes are shaded. SNP groups as described in Van Ert et al. (10).

RESEARCH
18. Simonson TS, Okinaka RT, Wang B, Easterday WR, Huynh L. U’Ren JM, et al. Bacillus anthracis and its relationship to world-wide lineages. BMC Microbiol. 2009;9:71 10.1186/1471-2180-9-71. DOI: 10.1186/1471-2180-9-71
19. Okinaka RT, Henrie M, Hill KK, Lowery KS, Van Ert MN, Pearson T, et al. Single nucleotide polymorphism typing of Bacillus anthra-cis from Sverdlovsk tissue. Emerg Infect Dis. 2008;14:653–6. DOI: 10.3201/eid1404.070984
Address for correspondence: Martin Hugh-Jones, Department of Environmental Sciences, School of the Coast & Environment, Rm 2279, Energy, Coast & Environment Building, Louisiana State University, Baton Rouge, LA 70803-5703, USA; email: [email protected]
796 Emerging Infectious Diseases • www.cdc.gov/eid • Vol. 16, No. 5, May 2010

Chapter 6


BioMed Central
Page 1 of 11(page number not for citation purposes)
BMC Microbiology
Open AccessResearch articleBacillus anthracis in China and its relationship to worldwide lineagesTatum S Simonson1, Richard T Okinaka1,2, Bingxiang Wang3, W Ryan Easterday1, Lynn Huynh1, Jana M U'Ren1, Meghan Dukerich1, Shaylan R Zanecki1, Leo J Kenefic1, Jodi Beaudry1, James M Schupp1, Talima Pearson1, David M Wagner1, Alex Hoffmaster4, Jacques Ravel5 and Paul Keim*1,2,6
Address: 1Department of Biological Sciences, Northern Arizona University, Flagstaff, AZ 86011-5640, USA, 2Bioscience Division, Los Alamos National Laboratory, Los Alamos New Mexico, 87545, USA, 3Lanzhou Institute of Biological Product, Lanzhou, PR China, 4Epidemiologic Investigations Laboratory, Center for Disease Control and Prevention, Atlanta, GA 30333, USA, 5The J Craig Venter Institute, Rockville, Maryland, USA and 6Pathogen Genomics Division, Translational Genomics Research Institute, Pathogen Genomics Division, 445 N Fifth Street, Phoenix, AZ 85004, USA
Email: Tatum S Simonson - [email protected]; Richard T Okinaka - [email protected]; Bingxiang Wang - [email protected]; W Ryan Easterday - [email protected]; Lynn Huynh - [email protected]; Jana M U'Ren - [email protected]; Meghan Dukerich - [email protected]; Shaylan R Zanecki - [email protected]; Leo J Kenefic - [email protected]; Jodi Beaudry - [email protected]; James M Schupp - [email protected]; Talima Pearson - [email protected]; David M Wagner - [email protected]; Alex Hoffmaster - [email protected]; Jacques Ravel - [email protected]; Paul Keim* - [email protected]
* Corresponding author
AbstractBackground: The global pattern of distribution of 1033 B. anthracis isolates has previously beendefined by a set of 12 conserved canonical single nucleotide polymorphisms (canSNP). Thesestudies reinforced the presence of three major lineages and 12 sub-lineages and sub-groups of thisanthrax-causing pathogen. Isolates that form the A lineage (unlike the B and C lineages) havebecome widely dispersed throughout the world and form the basis for the geographical dispositionof "modern" anthrax. An archival collection of 191 different B. anthracis isolates from Chinaprovides a glimpse into the possible role of Chinese trade and commerce in the spread of certainsub-lineages of this pathogen. Canonical single nucleotide polymorphism (canSNP) and multiplelocus VNTR analysis (MLVA) typing has been used to examine this archival collection of isolates.
Results: The canSNP study indicates that there are 5 different sub-lineages/sub-groups in Chinaout of 12 previously described world-wide canSNP genotypes. Three of these canSNP genotypeswere only found in the western-most province of China, Xinjiang. These genotypes were A.Br.008/009, a sub-group that is spread across most of Europe and Asia; A.Br.Aust 94, a sub-lineage that ispresent in Europe and India, and A.Br.Vollum, a lineage that is also present in Europe. Theremaining two canSNP genotypes are spread across the whole of China and belong to sub-groupA.Br.001/002 and the A.Br.Ames sub-lineage, two closely related genotypes. MLVA typing addsresolution to the isolates in each canSNP genotype and diversity indices for the A.Br.008/009 andA.Br.001/002 sub-groups suggest that these represent older and established clades in China.
Published: 15 April 2009
BMC Microbiology 2009, 9:71 doi:10.1186/1471-2180-9-71
Received: 21 November 2008Accepted: 15 April 2009
This article is available from: http://www.biomedcentral.com/1471-2180/9/71
© 2009 Simonson et al; licensee BioMed Central Ltd. This is an Open Access article distributed under the terms of the Creative Commons Attribution License (http://creativecommons.org/licenses/by/2.0), which permits unrestricted use, distribution, and reproduction in any medium, provided the original work is properly cited.

BMC Microbiology 2009, 9:71 http://www.biomedcentral.com/1471-2180/9/71
Page 2 of 11(page number not for citation purposes)
Conclusion: B. anthracis isolates were recovered from three canSNP sub-groups (A.Br.008/009,A.Br.Aust94, and A.Br.Vollum) in the western most portion of the large Chinese province ofXinjiang. The city of Kashi in this province appears to have served as a crossroads for not only tradebut the movement of diseases such as anthrax along the ancient "silk road". Phylogenetic inferencealso suggests that the A.Br.Ames sub-lineage, first identified in the original Ames strain isolatedfrom Jim Hogg County, TX, is descended from the A.Br.001/002 sub-group that has a majorpresence in most of China. These results suggest a genetic discontinuity between the youngerAmes sub-lineage in Texas and the large Western North American sub-lineage spread acrosscentral Canada and the Dakotas.
BackgroundAncient Chinese medical books suggest that an anthrax-likedisease has been present in China for more than 5,000 yearsand that by 500–600 A.D. the epidemiology and symptomsof anthrax had been described [1]. A 1995 report from Chinadescribed the results of an anthrax surveillance and controlproject in 10 provinces in China between 1990–1994 [2].Stations in these 10 provinces (Sichuan, Tibet, Inner Mongo-lia, Xinjiang, Qinghai, Gansu, Guangxi, Guihou, Yunnanand Hunan) reported 72 outbreaks and 8,988 human casesof anthrax. These results, which are indicative of a long his-tory and significant levels of contamination in these specificareas, are the reason for concern by the Chinese Institute ofEpidemiology and Microbiology [2].
The population structure of Bacillus anthracis has onlyrecently begun to be resolved with specific geographicalpatterns spread across areas mostly inhabited by man andhis animals. Higher genetic resolution within B. anthracishas resulted from two molecular typing approaches: Anongoing comparative, single nucleotide polymorphism(SNP) analysis of diverse isolates that describes a con-served, clonally derived basal tree, [3] and a multiplelocus variable number tandem repeat analysis (MLVA)system that provides improved resolution among individ-ual isolates [4-7]. This process for molecular typing hasnow been applied to the study of isolates from China.
An archival collection of 191 B. anthracis isolates fromChina [collection dates from 1947–1983, except isolatesA0034 (1993) and A0038 (1997)] was obtained and usedin this study (see Methods and Additional file 1). This col-lection contained an unusual subset of 122 B. anthracisisolates recovered from soil, including 107 isolates col-lected between 1981/1982 in Xinjiang province. Thisprovince is located in the western most tip of China andwas one of the 10 regions surveyed in the study conductedfrom 1990–1994. The remaining isolates originated frommany regions across the whole of China. This reportfocuses on the molecular genotyping of these 191 isolates.Our goal was to determine the nature and distribution ofgenotypes found in China and to establish phylogeneticrelationships between these isolates and those found else-where in the world.
Canonical SNP analysisThe original comparative analysis of 5 B. anthracis wholegenome sequences examined the status of ~1,000 singlenucleotide polymorphisms (SNPs) in 26 diverse isolates[3]. This study revealed an extremely conserved phyloge-netic tree with only one homoplastic character in ~26,000measurements. These results prompted the hypothesisthat a few strategically placed "canonical SNPs" couldreplace the 1,000 assays and still describe an accurate SNPbased tree. This idea was confirmed in a study using 13canonical SNPs (canSNP) to examine 1,000 world-wideisolates of B. anthracis [5]. Figure 1 illustrates this originalcanSNP tree and is used here to define important nomen-clature and terminology.
The basic tree is now defined by 7 sequenced genomesthat form 7 sub-branches or sub-lineages ending in "stars"in Figure 1. Each of these sub-lineages is designated by thenomenclature from the whole genome sequence site inGenbank, e.g. A.Br Ames, A.Br.WNA (for western NorthAmerica), and A.Br.Vollum. The relative position of eachcanSNP is indicated by vertical script and a small arrowand is arbitrarily defined, e.g., as A.Br.001 where A refersto the major subgroup and 001 is the first canSNP (see theA.Br.Ames sub-lineage in Figure 1, also [5]). In this casethe derived A.Br.001 SNP defines all isolates that are onthe same branch as the sequenced Ames strain. In addi-tion to these 7 sub-lineages the analysis of 26 diverse iso-lates uncovered 5 nodes or sub-groups along the branchesof this tree. Four of these nodes are in the major A Branchand one is in the B Branch (see "circles" in Figure 1). Thesenodes are defined by the two canSNPs on either side of thenode position, e.g. A.Br.001/002 or A.Br.008/009. All ofthe initial 1,000 isolates in the Van Ert study [5] wereplaced into one and only one of these 12 sub-lineages orsub-groups.
ResultsCanSNP analysis of isolates from ChinaThe 191 B. anthracis isolates from China were distributedinto only five of these 12 canSNP sub-lineages/sub-groupsdescribed by Van Ert et al. [5]. These canSNP groups wereA.Br.Vollum, A.Br.Aust.94, A.Br.001/002, A.Br.Ames, andA.Br.008/009 (Figures 1 and 2). Four of the sub-lineages/

BMC Microbiology 2009, 9:71 http://www.biomedcentral.com/1471-2180/9/71
Page 3 of 11(page number not for citation purposes)
sub-groups (A.Br.Vollum, A.Br.Aust.94, A.Br.008/009 andA.Br.001/002) were found in the western province ofChina, Xinjiang (Figure 2). But only isolates from A.Br.001/002 sub-group and the close relative A.Br.Ames sub-lineagewere found scattered throughout the other regions of Chinafrom east to west. These findings clearly suggest 4 or 5 sep-arate introductions of B. anthracis into or out of China, with3 possibly involving the routes defined as the Silk Road.
The A.Br.008/009 sub-group is a cluster that predomi-nates throughout Europe, the Middle East and China. Xin-jiang province had 49 of the worldwide total of 156A.Br.008/009 isolates (Table insert in Figure 1 and [5]).This province also had 44 of 188 worldwide isolates of theA.Br.Aust94 isolates. This is a sub-group that is also wellrepresented in neighboring Turkey and India. A smallersubset of the A.Br.Vollum sub-lineage (also found inEurope and Africa) accounts for 16 Xinjiang samples out
of a worldwide set that totals 48 isolates (Table insert inFigure 1).
The remainder of China is dominated by the A.Br.001/002 subgroup. Chinese isolates represent 74 of the 106isolates from our worldwide collection of A.Br.001/002sub-group isolates (Figure 1 and [5]). Only 9 of these iso-lates are from Xinjiang province to the west. Similarlythere are 8 isolates out of 19 worldwide isolates in theA.Br.Ames sub-lineage in the main parts of China.
MLVA Analysis of A.Br.008/009, A.Br.Aust94 and A.Br.VollumCanSNP typing of these isolates has already indicated thatthere were 49 total Chinese isolates from the A.Br.008/009subgroup, 44 from the A.Br.Aust94 sub-lineage and 15from the A.Br.Vollum (Figure 1). Additional sub-typingusing 15 MLVA markers indicates that there were only 3
The twelve canSNP subgroups and sub-lineages of B. anthracisFigure 1The twelve canSNP subgroups and sub-lineages of B. anthracis. Determined by the analysis of 14 canSNP sites described by Van Ert et al[5]. The five canSNP groups represented in China are indicated in larger and bold fonts in this Neigh-bor Joining Tree. The number of isolates (N), genotypes (G), and Nei's Diversity Index [8] within groups (D) are illustrated in the table in the lower left. Neighbor-joining trees based upon additional MLVA genotypes within each of these 5 canSNP groups are illustrated in Figures 3 and 5.
C.Br.A1055
Root
B.Br.CNEVA
B.Br.Kruger
B.Br.001/002
A.Br.005/006A.Br.Vollum
A.Br.WNA
A.Br.008/009
A.Br.001/002
A.Br.Ames
A.Br.Aust.94
A.Br.003/004
N G DA.Br.Vollum 16 3 0.038A.Br.Aust.94 44 3 0.031A.Br.001/002 74 32 0.108A.Br.Ames 8 3 0.079A.Br.008/009 49 14 0.143Total 191 55
A.B
r.0
09
A.B
r.0
01
A.B
r.0
02
A.B
r.0
03
A.B
r.0
04
A.B
r.0
07
A.B
r.0
08
B.B
r.0
03
A\B
.Br.
00
1
A.B
r.0
06
B.B
r.0
01
B.B
r.0
02
B.B
r.0
04
A.B
r.0
05

BMC Microbiology 2009, 9:71 http://www.biomedcentral.com/1471-2180/9/71
Page 4 of 11(page number not for citation purposes)
MLVA genotypes within both the A.Br.Vollum (Nei Diver-sity Index = 0.038 [8]) and A.Br.Aust94 (Nei's DiversityIndex = 0.031) sub-lineages but 14 MLVA genotypes withinA.Br.008/009 (Nei's Diversity Index = 0.143, Figures 1, 3a,3b, and 3c). These results suggest repeated infections andoutbreaks for each of these sub-groups of B. anthracis. Theidentification of 14 genotypes for the A.Br.008/009 sub-groups is an indication of a combination of possiblyrepeated introductions and infections and a significantlylonger history for this particular clade in this region.
Branch collapse and ongoing SNP analysisOne of the more remarkable findings from the wholegenome SNP analysis of 5 diverse isolates by Pearson et al.[3] was a nearly total lack of homoplastic SNP markers ina query of the status of nearly 1,000 SNP positions in 26diverse isolates. This finding uncovered a phenomenon
called "branch collapse" that resulted in a tree that had nobranching except for those created by 7 sequenced refer-ence genomes. The remaining 26 isolates were then eitherpart of one of these seven "sub-lineages" or part of 5 non-branching nodes ("sub-groups") on one of the 7branches. While the canSNP tree is highly accurate in thetyping of 1033 isolates, it lacks resolution because itreflects the results of only 13 of nearly 1,000 SNPs.
Improved resolution between two points was demon-strated by an extensive analysis of the Ames specificbranch [9,10] when the status of 29 SNPs that define thisbranch were determined for the original 12 Ames-like iso-lates. These analyses have a direct bearing on the isolatesfrom China that are either Ames-like or part of theA.Br.001/002 sub-group (Fig. 1 and 4). The extendedanalysis of the SNPs on the Ames branch indicate that
Geographical distribution of B. anthracis isolates in ChinaFigure 2Geographical distribution of B. anthracis isolates in China. This distribution is based on 12 canSNP genotypes described in Figure 1 and the analysis of 191 isolates from China; also see [5]. The red routes include the western city of Kashi in Xinjiang Province, the main crossroads into China and around the Taklimakan Desert leading into the eastern Chinese provinces.
n=115Kashi
Xinjiang ProvinceInner Mongolia
n=8Gansu
Liaoning
n=10
n=10
n=26
n=18Unknown Location
canSNP Genotypes
A.Br.Vollum
A.Br.008/009
A.Br.Aust94
A.Br.001/002
A.Br.Ames
Sichuann=1
n=1
n=2
Jiangxi
Henan
Hebei

BMC Microbiology 2009, 9:71 http://www.biomedcentral.com/1471-2180/9/71
Page 5 of 11(page number not for citation purposes)
there are 74 Chinese isolates in the A.Br.001/002 sub-group and 8 additional Chinese isolates (see the tableinsert in Figure 1) that form three new nodes or collapsedbranch points between A.Br.001/002 and the Ames isolate(Figure 4). In addition, there is a fourth node closest to theAmes strain that contains 10 Ames-like isolates fromTexas, one goat and 4 bovine isolates [9] shown in Figure4 and an additional 5 Ames-like isolates from the CDC(Brachman collection, see Methods and Materials). Theprecise location for the recovery of these latter isolates isunknown except that they originated in Texas. These 19isolates (8 Chinese, 10 Texas) and the Ames strain repre-sent a highly resolved, SNP based A.Br.Ames sub-lineage.These results indicate that the original Ames strain and asubset of 10 Texas isolates are decendents of a rare lineagethat is otherwise only found in China.
MLVA: A.Br.001/002The 15 marker MLVA analysis (MLVA15) of the 74 isolatesbelonging to the A.Br.001/002 sub-group yielded 32 dif-ferent genotypes (Nei Diversity Index = 0.108, Figures 1,5a). This high diversity index is an indication that thissub-group, spread throughout the whole of China (Figure2), is another sub-group of B. anthracis with a long andextensive evolutionary presence in China.
DiscussionHuman anthrax has been an old and continuous problemin many rural regions in China where as much as six per-cent of environmental samples have been found to be con-taminated with B. anthracis [2,2]. An archival collection of191 B. anthracis isolates was obtained from China andcanonical SNP typing indicated that only 5 of the 12 world-
MLVA15 Analysis of Chinese isolates belonging to the A.Br.Vollum, A.BrAust94 and A.Br.008/009 canSNP sub-lineges/sub-groupsFigure 3MLVA15 Analysis of Chinese isolates belonging to the A.Br.Vollum, A.BrAust94 and A.Br.008/009 canSNP sub-lineges/sub-groups. Representatives of these three sub-groups were only found in isolates recovered in Xinjiang Prov-ince, or in unknown locations within China (n = 2). All of these isolates were recovered from soil samples in this province.
� � � � � � � � � � � � � � � � � � �
� � � � � � � � � � � � � � � � � � � � �
� � � � � � � � � � � � � � � � � � � � � � � � � � � � � � �
� � � � � � � � � � �
� � � � � � � � � � � � � � � � � � � � � � � � � � � � � � �
� � � � � � � � � � � � � � � � � � � �
� � � � � � � � � � � � � � � � � � � � � � � � � � � �
� � � � � � � � � � � � � � � � � � � �
� � � � � � � � � � � � � � � � � � � �
� � � � � � � � � � � � � � � � � � � �
� � � � � � � � � � � � � � � � � � � �
� � � � � � � � � �
a: A.Br.Vollum
b: A.Br.Aust94

BMC Microbiology 2009, 9:71 http://www.biomedcentral.com/1471-2180/9/71
Page 6 of 11(page number not for citation purposes)
wide sub-lineages/sub-groups of this pathogen were repre-sented in this collection. One striking feature of thedistribution of these B. anthracis isolates within this countrywas the discovery that three of the five canSNPs sub-line-ages/groups (A.Br008/009, A.BrAust.94, and A.Br.Vollum)are predominantly found in the western most Chineseprovince of Xinjiang. The previous observation [5] thatthese three sub-lineages/sub-groups are prominent geno-types in India, Pakistan, Turkey and most of Europe suggesta likely transmission pattern for anthrax along the ancienttrade route known as the Silk Road [11] that extended fromEurope, the Middle East, portions of Asia and into Xinjiangprovince and the whole of China, Figure 2.
More specifically, 107 isolates were recovered from "soilsamples" between 1981–1982 from unspecified sites rela-tively close to the city of Kashi in this province. Kashi (alsoKashgar, Kaxgar, Kxkr) was a major "oasis" crossroads cityalong the ancient Silk Road and dates back more than2,000 years [11]. Consistent with the idea that the life
cycle of B. anthracis can be maintained by viable spores inpreviously contaminated areas, the later 1990–1994 sur-veillance project in China described three regions in Xin-jiang Province where severe anthrax outbreaks hadpreviously occurred [2]. Two of these towns, Zepu andAtushi, are located approximately 144 and 33 kilometersrespectively from the city of Kashi. In the 1990–1994study, Zepu recorded 24 villages with 202 human infec-tions and Atushi recorded 4 villages with 81 human infec-tions.
Despite a clear correlation between canSNP genotypesfrom the A radiation and the spectrum of isolates foundacross the Trans-Eurasian continents, there is one set ofgenotypes in Europe that are clearly missing in China.These are representatives from the B branch that appear tobe prevalent in several European states including at least27 B2 isolates from France and isolates identified in boththe B2 and B1 branches from Croatia, Germany, Poland,Italy, Norway and Slovakia [5,6,12]. It is not obvious why
The Ames branch of B. anthracisFigure 4The Ames branch of B. anthracis. This figure shows the relationship between the Ames strain and its closest relatives in a worldwide collection [5]. Twenty-nine of 31 original [5] SNPs are defined by their positions in the Ames genome (NC_003997) and their positions along the Ames branch. Ames has the derived state for all 29 SNPs and the 4 SNPs between Ames and the Texas Goat are specific for the Ames strain alone [5]. A0728 was isolated in China in 1957 but the specific loca-tion/source of this isolate is unknown.
813 4
The Ames Branch
Texas Goat
A1115
A1117
Texas2006
Texas2007A0728 Chi
A0585 Chi
A0584 Chi
A0576 Chi
A0580 Chi
A0720 Chi
A0724 Chi
A0729 Chi
A.B
r.00
1/0
02
Br1
.7 (4
33
,27
7)
Br1
.26
(4,6
24
,,13
2)
Br1
.28
(4,9
29
,18
6)
Br1
.31
(2,7
49
,54
3)
Br1
.8 (6
44
,62
5)
Br1
.15
(1,6
31
,81
8)
Br1
.16
(2,0
26
,60
9)
Br1
.18
(3,1
63
,73
1)
Br1
.22
(4,1
47
,24
9)
Br1
.23
(4,2
21
,31
8)
Br1
.27
(4,8
67
,24
9)
Br1
.30
(2,0
45
,58
8)
Br1
.6 (3
37
,24
1)
Br1
.9 (7
32
,17
2)
Br1
.10
(78
9.2
97
)
Br1
.11
(1,2
23
,19
8)
Br1
.12
(1,3
01
,63
9)
Br1
.13
(1,3
03
,08
7)
Br1
.14
(1,5
72
,84
2)
Br1
.17
(2,6
68
,83
8)
Br1
.19
(3,3
06
,29
6)
Br1
.20
(4,1
34
,54
0)
Br1
.24
(4,4
88
,26
8)
Br1
.25
(4,5
19
,30
6)
Br1
.29
(5,0
77
,64
5)
Br1
.5 (2
43
,86
7 )
Br1
.21
( 4,1
45
,17
2)
Br1
.2 (1
82
,10
6)
Br1
.4 (2
00
,73
1)
Ames
22

BMC Microbiology 2009, 9:71 http://www.biomedcentral.com/1471-2180/9/71
Page 7 of 11(page number not for citation purposes)
examples of the B branch are limited mostly to Africa, thisregion of Europe and a small location in California, USA.Aside from sampling issues the B branch does not appearto have participated in the world-wide, dynamic radiationthat has characterized the A branch [5].
Additional analyses with the rapidly evolving MLVAmarkers suggest that establishment in China of two of
these sub-groups/sub-lineages, A.Br.Aust94 and A.Br.Vol-lum, resulted from relatively recent events (Figure 3a and3b). In both of these instances, a sizeable number of iso-lates (44 and 15, respectively) are clustered into only threedifferent MLVA15 genotypes (Nei's Diversity Indices =0.031 and 0.038 respectively, Figure 2). Although theseresults may reflect a certain sampling bias, the MLVA com-parison to other worldwide isolates from this branch indi-
MLVA 15 Analysis of A.Br.001/002 and A.Br.Ames sub-group and sub-lineage respectivelyFigure 5MLVA 15 Analysis of A.Br.001/002 and A.Br.Ames sub-group and sub-lineage respectively. The A.Br.001/002 sub-group has a relatively large diversity index (See Figure 2) and suggests that this sub-group has a long history in China with repeated outbreaks and eventual spread throughout much of the country.
� � � � � � � � � � � � �
� � � � � � � �� � � � � � � � � � � � � � � � � � � � � � � � �� � � � � � � � � � � � � � � �� � � � � � � � � � � � � � � � � � � �
� � � � � � � � � � �� � � � � � � � � � � � � � � � � �� � � � � � � ! � � � � �� � � � � � � � �� � � � � � � �
� � � � � � � � � � �
� � � � � � � " �� � � � � � � ! � � � � �# � � $ % � � �
� � � � � � � �� � � � � � � � �# � � $ % � � �� � � � � � � � � " �
# � � $ % � � � � � � � � � " �# � � $ % � � �
� � � � � � � � � " �� � � � � � � ! � � � � �# � � $ % � � �& � ' ( % � � � � � � � � � � � � � � � � � � � � �
� � � � � � � �# � � $ % � � � ) � � � � * � � � �
� � � � � � � � � � � � � � � � � � � � � � � � �
+ � � � � � � � � � � � � � � � � �+ � � � � � � � � , � � � � � � � � ! � � � � �
� � � � � � � �- . - - � ' ( � � � � $
/ � � � � � � � 0 1 2 � � � � � � � ! � � � " �� � � � � � � ! � � � � � � � � � � � " � � � � � � � � �
- . - � ' ( � � � � $

BMC Microbiology 2009, 9:71 http://www.biomedcentral.com/1471-2180/9/71
Page 8 of 11(page number not for citation purposes)
cates that the A.Br.Aust94 sub-lineage in China is mostclosely related to isolates recovered from the large 1997outbreak in Victoria, Australia (data not shown). The pre-cise origin and time-scale for this exchange is not certainbut relatively recent exchanges between the Far East andAustralia appear to have originated from India [13],which could represent a common ancestor or an interme-diate step in the transmission route.
By direct contrast the MLVA analysis of 49 isolates belong-ing to the A.Br.008/009 sub-group revealed a more com-plex pattern with 14 different MLVA15 genotypes (NeiDiversity Index = 0.143, Figures 1 and 3c). This is aremarkable finding because it indicates that a variety ofMLVA genotypes are persisting in the different soils fromwhich the A.Br.008/009 isolates were recovered. Theseresults are an indication that A.Br.008/009, a major sub-group in Europe and Asia [5], has had an extensive historyin China. It is difficult to determine the precise origins ofthe A.Br.008/009 subgroup (e.g. China versus Europe) atthis point because rapidly evolving MLVA markers aresubject to homoplasy and potentially inaccurate phyloge-netic reconstructions. These issues can eventually beresolved using additional whole genome sequencing andphylogenetic inference to more accurately predict the ori-gins of the A.Br.008/009 sub-group.
The Ames sub-lineage appears to have descended from theA.Br.001/002 sub-group, a sub-group that has 106 isolatesin our worldwide collection [5]. Seventy-four of theseaccessions were isolated from outbreaks in China and theremaining 32 isolates were recovered in the UK, other partsof Europe, North America and other parts of Asia. The largenumber of MLVA15 genotypes (n = 32) among the 74 Chi-nese isolates and a wide distribution throughout the coun-try indicates that the A.Br.001/002 sub-group is a majorpart of the B. anthracis population structure in this region(Figure 5a). This sub-group also appears to be basal to theAmes sub-lineage, indicating that 8 isolates from Chinaand 11 isolates from Texas may share common ancestorsthat originated in China (Figure 5b and [10]).
How then did the Ames lineage come to Texas and why isthis lineage not found in Europe? This is still not knownand subject to considerable speculation. By severalaccounts, it is believed that anthrax was introduced intothe Gulf Coast states (Louisiana and Texas) by early set-tlers from Europe. Stein [14,15] indicates that the firstrecorded episodes of anthrax in livestock in Louisianaoccurred in 1835, 1851 and 1884; and in Texas in 1860and 1880. By 1916, when a first national survey was con-ducted to obtain nation-wide information on the inci-dence of anthrax, Texas already had 41 counties reportinginfections. A composite of outbreaks compiled after the4th National Survey by the U.S. Department of Agriculturebetween 1916–1944 (Figure 6) indicates three major out-
break pockets: one in California, one in the Dakotas/Nebraska and the third along the coastal regions of Texasand Louisiana [15].
An important feature of the outbreaks in Texas is that the"modern" outbreaks have occurred repeatedly in many ofthe same counties depicted in this historical map (Figure6 and USDA Report: Epizootiology and Ecology ofAnthrax: http://www.aphis.usda.gov/vs/ceah/cei/taf/emerginganimalhealthissues_files/anthrax.pdf). A cul-ture-confirmed study between 1974–2000 indicated that179 isolates were spread across 39 Texas counties (coun-ties outlined in yellow) that are in general agreement withthe dispersal patterns observed in the early national sur-veys depicted in Figure 6. The one significant difference isa shift from the historical outbreaks in the coastal regionsto counties more central and southwesterly in "modern"times. Similarly, culture-confirmed isolates from a 2001outbreak in Val Verde, Edwards, Real, Kinney and Uvaldecounties in southwest Texas are similar to outbreaks in2006 and 2007 when 4 Ames-like isolates were recoveredfrom Real, Kinney, and Uvalde county [9].
It appears that B. anthracis was introduced into the GulfCoast, probably by early European settlers or tradersthrough New Orleans and/or Galveston during the earlyto mid 1800s. The disease became established along thecoastal regions and then became endemic to the regionsof Texas where cattle and other susceptible animals arecurrently farmed. Are these B. anthracis, Ames-like geno-types from the Big Bend region (Real, Kinney, Uvaldecounties) of Texas representative of the ancestral isolatesbrought to the Gulf Coast? Van Ert et al. [5] used synony-mous SNP surveys to estimate the divergence timesbetween the major groups of B. anthracis and these esti-mates suggest that the Western North American and theAmes lineages shared common ancestors between 2,825and 5,651 years ago. Extrapolating to the much shorterSNP distances between the most recent Chinese isolate(A0728) and the recent Texas isolates on the Ames sub-lineage would approximate that these two shared a com-mon ancestor between 145 to 290 years ago. These esti-mates would be consistent with the hypothesis that anAmes-like isolate was introduced into the Galveston and/or New Orleans area in the early to middle 1800s.
This relatively recent expansion is in direct contrast toanalyses of the Western North American (WNA) sub-line-age that appears to have an ancient and significantlylonger evolutionary presence in North America; thisgroup stretches from the central regions of Canada andinto North and South Dakota (Figure 6; [16]). Phyloge-netic reconstruction of > 250 Western North Americanisolates indicates that the more ancestral isolates of thissub-lineage are found in the upper reaches of central Can-ada and portrays a migration pattern where the youngest

BMC Microbiology 2009, 9:71 http://www.biomedcentral.com/1471-2180/9/71
Page 9 of 11(page number not for citation purposes)
isolates are found in cattle outbreaks in North/SouthDakota and Nebraska. Kenefic, Pearson et al. [16] suggestthat the ancestral isolates may have entered the NorthAmerican continent via the Beringian straights 13,000years ago.
A recent ecological niche model suggests that naturalanthrax outbreaks are "concentrated in a narrow corridorfrom southwest Texas northward into the Dakotas andMinnesota" [17]. This model indicates that conditionslike vegetation, precipitation and altitude along this corri-
dor are suited for maintaining naturally occurring anthraxoutbreaks in livestock and wildlife. Although historicalrecords provide evidence that validate this model, there isa molecular and genotyping anomaly: there does notappear to be a direct epidemiological link between the"younger" Ames-like cluster and the Western North Amer-ican lineage. Despite nearly 100 years of monitoring sincethe first national outbreak tabulations [15], there is still aclear physical division between the Ames-like isolates tothe south and the Western North American lineage to thenorth (Figure 6). This gap is not obvious until the spatialpatterns are examined in hindsight of the genetic discon-tinuity. These observations probably reflect the awarenessand controls that were being observed for anthrax out-breaks as the US entered the 20th century.
Limited sample analysis of isolates from the Texas/Louisi-ana coastline prevents any conclusions about the overalldominance of the Ames sub-lineage in this area and wealso cannot exclude the possibility that there are othersub-groups/sub-lineages that might have been importedand even become transiently established along the Texas/Louisiana Gulf region during this same time frame.
ConclusionDespite containing only 5 of the initial 12 canSNP geno-types used to define a collection of world-wide isolates[5], the analysis of 191 Chinese B. anthracis isolatesreveals an interesting impact on global distribution. Themajor diversity in these isolates is concentrated in thewestern province of Xinjiang and especially the city ofKashi, the hub of the Silk Road around the TaklimakanDesert into and out of China. These results reinforce theidea that this Silk Road region was central to the spread ofanthrax between the trans-Eurasian continents.
In addition to the three distinct sub-groups found in thewestern Xinjiang province, the central and eastern regionsof China are dominated by a different, highly diverse, can-SNP sub-group, A.Br.001/002. This sub-group is a majorpresence in relationship to our world-wide collectionsince 70% of all the isolates and most of the diversity forthis sub-group were in this Chinese collection. Theseresults suggest that the A.Br.001/002 cluster may haveoriginated in China. Finally, the Ames and Ames-likestrains in Texas are descended from common ancestors inInner Mongolia in China as an extension of this sub-group. It is curious that this lineage would become estab-lished in Texas, and perhaps Louisiana, and not in Europe.This leaves behind a missing historical gap within thephylogeography of the Ames lineage.
MethodsB. anthracis isolatesThe 191 B. anthracis isolates from China used in this studywere previously isolated from a variety of sources and prov-
Historical Anthrax Incidences between 1915–1944 in Texas/Louisiana and The Dakotas/Nebraska/IowaFigure 6Historical Anthrax Incidences between 1915–1944 in Texas/Louisiana and The Dakotas/Nebraska/Iowa. Adapted from Stein (1945, [15]). Darker colors represent severe outbreaks and the lighter colors represent sporadic outbreaks. The blue and green colors were used to illustrate that two distinct genotypes (Western North America (WNA) and the Ames sub-lineage) have been indentified in "modern" isolates from these two regions. The counties bor-dered in yellow in Texas indicate counties where docu-mented incidents of anthrax have occurred between 1974 and 2000. The numbers 1–4 indicate the counties in which the original Ames strain, 2 bovine samples and a goat sample have been analyzed by current genotyping methods as belonging to the Ames sub-lineage. The molecular analysis of more than 200 isolates from North and South Dakota indi-cates a pre-dominance of the sub-lineage WNA in this region. The gray colors indicate moderate to sparse out-breaks in the states adjoining the Dakotas and Texas.

BMC Microbiology 2009, 9:71 http://www.biomedcentral.com/1471-2180/9/71
Page 10 of 11(page number not for citation purposes)
inces in China (see Additional file 1). One hundred and fif-teen isolates were from Xinjiang Province in western Chinaincluding 107 isolates from soil samples. The remainder ofthe isolates were recovered from the following provinceswith the number of isolates in parenthesis: Hebei (10),Gansu (8), Henan (2), Inner Mongolia (10), Jiangxi (1),Liaoning (26), Sichuan (1) and 18 isolates where the prov-ince of origin was not known. In addition to the 107 soilsamples from Xinjiang Province isolates were obtainedfrom the following sources: soil (15 additional), air (4),bovine (3), buffalo (1) fur (2), human (25), laboratory (1),marmot (1), sheep (3), swine (3) and unknown sources(26). In addition to the Chinese isolates there are 6 isolatesthat were used to describe Figure 4[9,10] and an additional5 isolates that were obtained from the CDC as part of the"Brachman Collection" (CDC ID # 34064, 34279, 402,482, 490). All 11 of these isolates belong to the Ames sub-lineage and all were isolated in Texas between 1959–2007.This analysis also includes the original Ames strain that wasisolated in 1981 from bovine in Jim Hogg County.
All isolates were initially genotyped for a B. anthracis spe-cies-specific plcR nonsense mutation that has been sug-gested as being necessary for stabilization of the virulenceplasmids [18]. This single nucleotide polymorphismappears to be diagnostic for B. anthracis [19]. In this studythe ancestral state for this marker was used to root the B.anthracis SNP tree to the older and more diverse B. cereus/B. thuringiensis tree. DNA was isolated from each of the191 isolates as previously described [5].
CanSNP GenotypingTaqMan™ -Minor Groove Binding (MGB) allelic discrimi-nation assays were designed for each of 13 canSNPs andhave been described in great detail by Van Ert et al. [5].The genomic positions for each canSNP and the primersequences and probes for each site can be found in Sup-plemental Tables 4 and 5 in the Van Ert et al. [5].
MLVA GenotypingMultiple Locus Variable Number Tandem Repeat (VNTR)Analysis (MLVA) was used to determine the overall diver-sity of the isolates within each sub-group and sub-lineage.The first 8 marker set used in this analysis were initiallydescribed by Keim et al., [4] and a second set of 7 addi-tional markers were described by Zinser [20]. This 15marker, high-resolution, MLVA system is described indetail by Van Ert et al. [5] with the genomic positions andprimer sets for these assays described in SupplementalTables 2 and 6 of this reference.
Phylogenetic InferenceThe genetic relationships among the Chinese isolates wereestablished using a hierarchical approach where theslowly evolving, highly conserved, canSNP markers werefirst used to place each isolate into its appropriate clonallineage. The 15 more rapidly evolving, VNTR loci, were
then used to measure the genetic diversity and to deter-mine the number of specific genotypes within each ofthese clonal lineages. Neighbor joining phylogenetic treeswere constructed for both the canSNP and MLVA datasetsusing PAUP (Phylogenetic Analysis Using Parsimony)[21]; and the MEGA 3 software package [22] was used tocalculate average within group distances for each of thefive canSNP sub-groups/sub-lineages.
Authors' contributionsTSS: Conception, acquisition and analysis of data, interpreta-tion of data, drafting of manuscript, approved final draft.RTO: Analysis and interpretation of data, drafting of manu-script, approved final draft, BW: Acquisition and interpreta-tion of isolate data, approved final draft, RE: Acquisition andinterpretation of DNA signature data, approved final draft,LYH: Acquisition and interpretation of DNA signature data,approved final draft, JMUR: Acquisition and interpretationof DNA signaturedata, approved final draft, MD: Acquisitionand interpretation of DNA signature data, approved finaldraft, SRZ: Acquisition and interpretation of DNA signaturedata, approved final draft, LJK: Provide insight for relation-ship between worldwide and Chinese isolates, approvedfinal draft, JB: Acquisition and interpretation of data,approved final draft, JMS: Acquisition and interpretation ofdata, approved final draft, TP: Input on phylogenetic analysisof datasets, draft manuscript, approved final draft, DMW:Provide insight into geographical relationships betweenworldwide isolates, draft manuscript, approved final draft,AH: Provide data and genotyping information for new Texasisolates belonging to Ames sub-lineage, approved final draft,JR: Initial sequencing, assembly and analysis of genomes,approved final draft.
PK: Responsible for concepts, vision and direction for theentire project, draft manuscript, approved final draft.
Additional material
AcknowledgementsWe wish to acknowledge the contributions of Matthew N. Van Ert for pro-viding conceptual and analytical insights for this project. This work was funded in part by the Department of Homeland Security Science and Tech-nology Directorate under contract numbers: NBCH2070001 and HSHQDC-08-C00158.
Additional file 1List and description of isolates including the canSNP and MLVA Gen-otypes for each isolate. This table contains: The Keim Laboratory ID # for each isolate, the year of isolation, the source, the canSNP ID, and the originating province. This information is followed by the Keim Genetics Laboratory 15 MLVA genotypes for each isolate, see supplemental mate-rial from Van Ert et al., [5].Click here for file[http://www.biomedcentral.com/content/supplementary/1471-2180-9-71-S1.doc]

Publish with BioMed Central and every scientist can read your work free of charge
"BioMed Central will be the most significant development for disseminating the results of biomedical research in our lifetime."
Sir Paul Nurse, Cancer Research UK
Your research papers will be:
available free of charge to the entire biomedical community
peer reviewed and published immediately upon acceptance
cited in PubMed and archived on PubMed Central
yours — you keep the copyright
Submit your manuscript here:http://www.biomedcentral.com/info/publishing_adv.asp
BioMedcentral
BMC Microbiology 2009, 9:71 http://www.biomedcentral.com/1471-2180/9/71
Page 11 of 11(page number not for citation purposes)
References1. Dong SL: Progress in the control and research of anthrax in
China. In International Workshop on Anthrax: 1989; Winchester, UKSalisbury Medical Bulletin, Salisbury Printing Co., Ltd, Salisbury, UK;1989.
2. Liang X, Ma F, Li A: Anthrax surveillance and control in China.In International Workshop on Anthrax: 1995; Winchester, UK SalisburyMedical Bulletin, Salisbury Printing Co., Ltd; Salisbury, UK;1995:16-18.
3. Pearson T, Busch JD, Ravel J, Read TD, Rhoton SD, U'Ren JM,Simonson TS, Kachur SM, Leadem RR, Cardon ML, et al.: Phyloge-netic discovery bias in Bacillus anthracis using single-nucle-otide polymorphisms from whole-genome sequencing. ProcNatl Acad Sci USA 2004, 101(37):13536-13541.
4. Keim P, Price LB, Klevytska AM, Smith KL, Schupp JM, Okinaka R,Jackson PJ, Hugh-Jones ME: Multiple-locus variable-number tan-dem repeat analysis reveals genetic relationships withinBacillus anthracis. J Bacteriol 2000, 182(10):2928-2936.
5. Van Ert MN, Easterday WR, Huynh LY, Okinaka RT, Hugh-Jones ME,Ravel J, Zanecki SR, Pearson T, Simonson TS, U'Ren JM, et al.: Globalgenetic population structure of Bacillus anthracis. PLoS ONE2007, 2(5):e461.
6. Le Fleche P, Hauck Y, Onteniente L, Prieur A, Denoeud F, Ramisse V,Sylvestre P, Benson G, Ramisse F, Vergnaud G: A tandem repeatsdatabase for bacterial genomes: application to the genotyp-ing of Yersinia pestis and Bacillus anthracis. BMC Microbiol2001, 1:2.
7. Lista F, Faggioni G, Valjevac S, Ciammaruconi A, Vaissaire J, le DoujetC, Gorge O, De Santis R, Carattoli A, Ciervo A, et al.: Genotypingof Bacillus anthracis strains based on automated capillary 25-loci multiple locus variable-number tandem repeats analysis.BMC Microbiol 2006, 6:33.
8. Nei M: Analysis of gene diversity in subdivided populations.Proc Natl Acad Sci USA 1973, 70(12):3321-3323.
9. Kenefic LJ, Pearson T, Okinaka RT, Chung WK, Max T, Trim CP,Beaudry JA, Schupp JM, Van Ert MN, Marston CK, et al.: Texas iso-lates closely related to Bacillus anthracis Ames. Emerg InfectDis 2008, 14(9):1494-1496.
10. Van Ert MN, Easterday WR, Simonson TS, U'Ren JM, Pearson T, Ken-efic LJ, Busch JD, Huynh LY, Dukerich M, Trim CB, et al.: Strain-spe-cific single-nucleotide polymorphism assays for the Bacillusanthracis Ames strain. J Clin Microbiol 2007, 45(1):47-53.
11. Wood F: The Silk Road: Two thousand years in the heart ofAsia. Berkeley and Los Angeles, CA: University of California Press;2002.
12. Fouet A, Smith KL, Keys C, Vaissaire J, Le Doujet C, Levy M, Mock M,Keim P: Diversity among French Bacillus anthracis isolates. JClin Microbiol 2002, 40(12):4732-4734.
13. Geering WA: Anthrax in Australia. UN-WHO Inter-regional AnthraxWorkshop. Kathmandu, Nepal 1997.
14. Stein CD: Anthrax in animals and its relationship to the dis-ease in man. Tex Rep Biol Med 1953, 11(3):534-546.
15. Stein CD: The History and distribution of anthrax in livestockin the United States. Vet Med 1945, 40:340-349.
16. Kenefic LJ, Pearson T, Okinaka RT, Schupp JM, Wagner DM, Ravel J,Hoffmaster AR, Trim CP, Chung WK, Beaudry JA, et al.: Pre-colum-bian origins for north american anthrax. PLoS ONE 2009,4(3):e4813.
17. Blackburn JK, McNyset KM, Curtis A, Hugh-Jones ME: Modeling thegeographic distribution of Bacillus anthracis, the causativeagent of anthrax disease, for the contiguous United Statesusing predictive ecological [corrected] niche modeling. Am JTrop Med Hyg 2007, 77(6):1103-1110.
18. Mignot T, Mock M, Robichon D, Landier A, Lereclus D, Fouet A: Theincompatibility between the PlcR- and AtxA-controlled reg-ulons may have selected a nonsense mutation in Bacillusanthracis. Mol Microbiol 2001, 42(5):1189-1198.
19. Easterday WR, Van Ert MN, Simonson TS, Wagner DM, Kenefic LJ,Allender CJ, Keim P: Use of single nucleotide polymorphisms inthe plcR gene for specific identification of Bacillus anthracis.J Clin Microbiol 2005, 43(4):1995-1997.
20. Zinser G: Evolutionary relationships and mutation rate esti-mates in Bacillus anthracis. Flagstaff: Northern Arizona Univer-sity; 2002.
21. Swofford DL: PAUP: Phylogenetic analysis using parsimony(and other methods), Version 4. Sunderland, MA: Sinauer Asso-ciates; 1998.
22. Kumar S, Tamura K, Nei M: MEGA3: Integrated Software forMolecular Evolutionary Genetics Analysis and SequenceAlighnent. Briefings in Bioinformatics 1994, 5:150-163.