Embed Size (px)
Citation preview
89
Section 2
ANSWERS TO OBJECTIVE TEST QUESTIONS
A: MANAGING THE COSTS OF CREATING VALUE
1 B
E F G Total
Budgeted number of batches to be produced: 75,000/200 120,000/60 60,000/30
= 375 = 2,000 = 2,000
Machine set‐ups per batch: 5 3 9
Total machine set‐ups 1,875 6,000 18,000 25,875
So budgeted cost per set‐up: $180,000/25,875 = $6.96 per set‐up
Therefore the budgeted machine set‐up cost per unit of F produced is:
($6.96 × 3)/60 = $0.35 per unit or $6.96 × 6,000/120,000 = $0.35 per unit
2 B, C AND E
Traditional costing systems assume that products consume activities in proportion to their production volumes, which means that high‐volume products absorb too much overhead and low‐volume products too little. ABC remedies this by absorbing overheads based on the actual use each product makes of the overhead activities. ABC still provides historic information on product costs but it can be viewed as the best estimate of longer term product costs as in the long term all costs are variable. It therefore supports longer‐term strategic decision making in areas such as product pricing, product range and mix, and new product development.
3 A
Since all of the activities listed are directly related to the goods that are sold in the supermarket, DPP (based on ABC) requires that all of the costs should be included in the calculation.
SUBJECT P2: ADVANCED MANAGEMENT ACCOUNTING
90
4 B
Pareto analysis is a cumulative analysis, taking the items in descending order of size. Here, the products should be in descending order of total sales revenue earned.
Product Sales revenue
$
D 100,000
A 50,000
B 40,000
C 30,000
E 20,000
–––––––
240,000
–––––––
5 (i) Set ups
1 for every 10 units of A, 1 for every 10 units of B, 1 per day for C = 50 + 40 + 20 = 110 Charge out rate = $2,200/110 = $20 per driver
Total charge to C = 20 × $20 = $400
Cost per unit for Gamma = $400/20 = $20
(ii) Inspections
Ratio is 1:1:2 = 500 + 400 + 40 = 940
Charge out rate = $2,820/940 = $3 per driver
Total charge to Gamma = 40 × $3 = $120
Cost per unit for Gamma = $120/20 = $6
So total cost per unit for Gamma = $26.00
6 B
7 All statements apply.
First, the results are rearranged in descending order of contribution and a cumulative contribution figure calculated.
Product Contribution Cumulative contribution Cumulative
$(000) $(000) %
White loaves 94 94 25
Individual cakes 83 177 46
Brown loaves 67 244 64
Family‐sized cakes 53 297 78
Plain rolls 42 339 89
Filled rolls 26 365 96
Pasties and pies 16 381 100
–––––
381
–––––
ANSWERS TO OBJECTIVE TEST QUESTIONS : SECTION 2
91
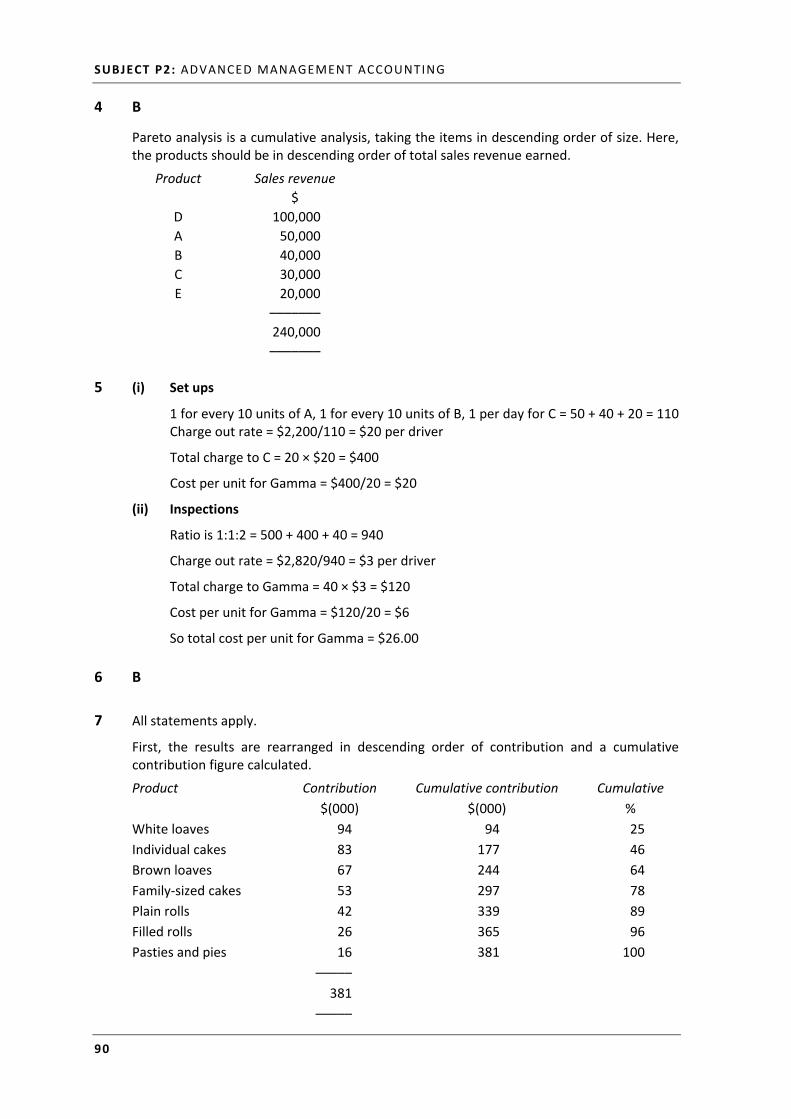
The cumulative data can now be used to produce the required Pareto chart showing product contribution:
It is clear from the diagram that four of the product lines make up nearly 80% of the contribution for the bakery firm.
The most popular products are bread and cakes and with white loaves outselling all other products. Management attention should be focused on these areas.
8 A cost driver is any factor that causes a change in the cost of an activity, so the most important factor when selecting a cost driver is to identify a causal relationship between the cost driver and the costs. Such a relationship may arise because of some physical relationship or because of the logic of the situation.
For example, quality inspection costs are caused by the action of carrying out an inspection to ensure quality standards are being achieved, so the appropriate cost driver would be the number of inspections carried out. Some activities may have multiple cost drivers associated with them; in such a situation it is best if the costs can be analysed into separate cost pools for each of which a single driver can be identified.
0
20
40
60
80
100
120Cumulative %
SUBJECT P2: ADVANCED MANAGEMENT ACCOUNTING
92
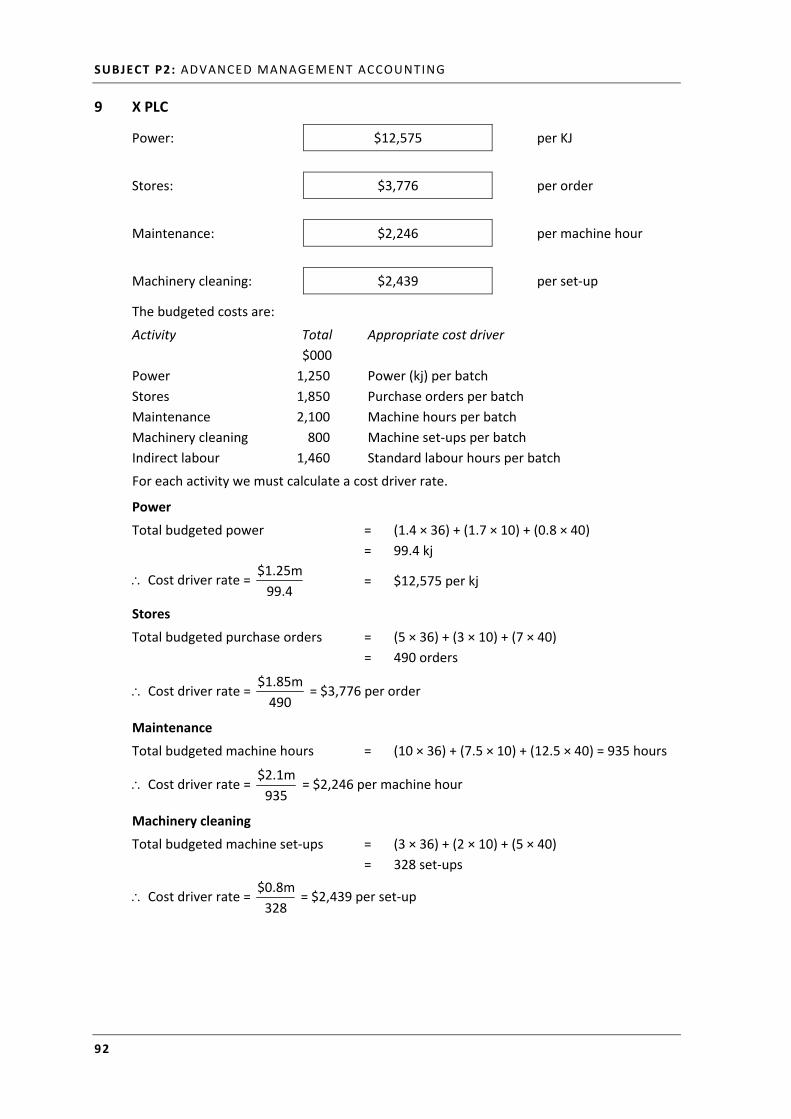
9 X PLC
Power: $12,575 per KJ
Stores: $3,776 per order
Maintenance: $2,246 per machine hour
Machinery cleaning: $2,439 per set‐up
The budgeted costs are:
Activity Total Appropriate cost driver
$000
Power 1,250 Power (kj) per batch
Stores 1,850 Purchase orders per batch
Maintenance 2,100 Machine hours per batch
Machinery cleaning 800 Machine set‐ups per batch
Indirect labour 1,460 Standard labour hours per batch
For each activity we must calculate a cost driver rate.
Power
Total budgeted power = (1.4 × 36) + (1.7 × 10) + (0.8 × 40)
= 99.4 kj
Cost driver rate = 99.4
$1.25m = $12,575 per kj
Stores
Total budgeted purchase orders = (5 × 36) + (3 × 10) + (7 × 40)
= 490 orders
Cost driver rate = 490
$1.85m = $3,776 per order
Maintenance
Total budgeted machine hours = (10 × 36) + (7.5 × 10) + (12.5 × 40) = 935 hours
Cost driver rate = 935
$2.1m = $2,246 per machine hour
Machinery cleaning
Total budgeted machine set‐ups = (3 × 36) + (2 × 10) + (5 × 40)
= 328 set‐ups
Cost driver rate = 328
$0.8m = $2,439 per set‐up
ANSWERS TO OBJECTIVE TEST QUESTIONS : SECTION 2
93
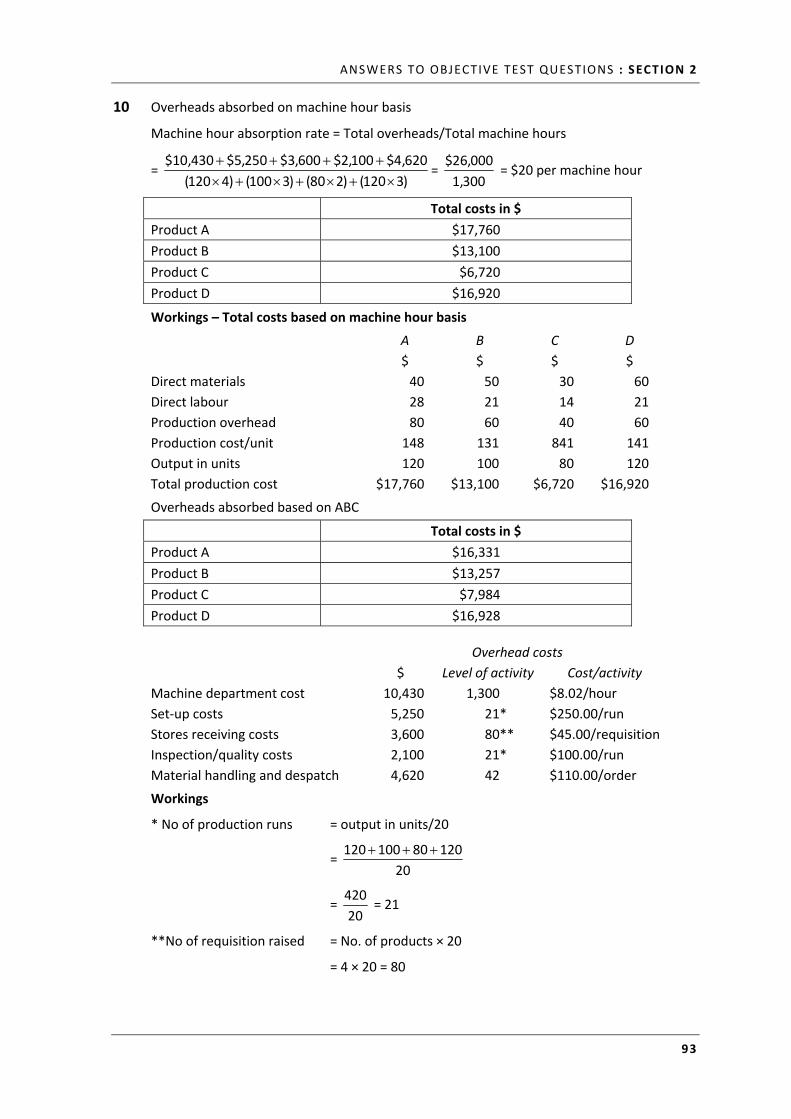
10 Overheads absorbed on machine hour basis
Machine hour absorption rate = Total overheads/Total machine hours
= )3120()280()3100()4120(
620,4$100,2$600,3$250,5$430,10$
= 300,1
000,26$ = $20 per machine hour
Total costs in $
Product A $17,760
Product B $13,100
Product C $6,720
Product D $16,920
Workings – Total costs based on machine hour basis
A B C D
$ $ $ $
Direct materials 40 50 30 60
Direct labour 28 21 14 21
Production overhead 80 60 40 60
Production cost/unit 148 131 841 141
Output in units 120 100 80 120
Total production cost $17,760 $13,100 $6,720 $16,920
Overheads absorbed based on ABC
Total costs in $
Product A $16,331
Product B $13,257
Product C $7,984
Product D $16,928
Overhead costs
$ Level of activity Cost/activity
Machine department cost 10,430 1,300 $8.02/hour
Set‐up costs 5,250 21* $250.00/run
Stores receiving costs 3,600 80** $45.00/requisition
Inspection/quality costs 2,100 21* $100.00/run
Material handling and despatch 4,620 42 $110.00/order
Workings
* No of production runs = output in units/20
= 20
12080100120
= 20
420 = 21
**No of requisition raised = No. of products × 20
= 4 × 20 = 80
SUBJECT P2: ADVANCED MANAGEMENT ACCOUNTING
94
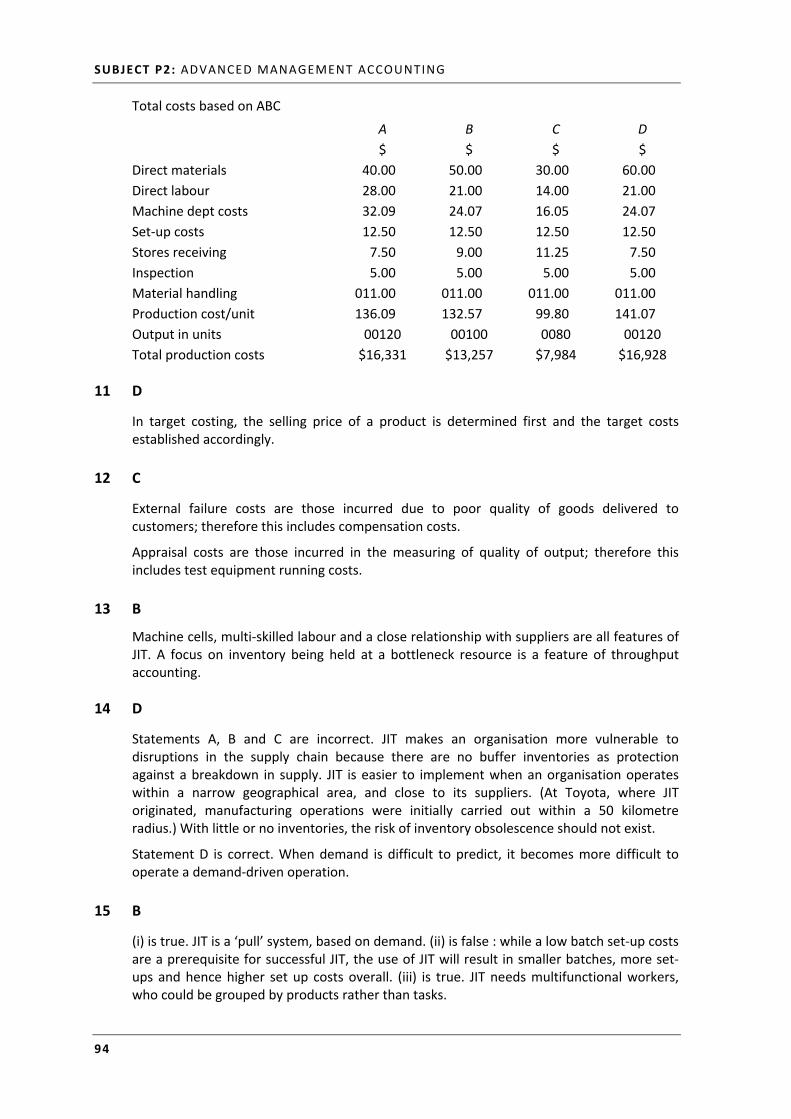
Total costs based on ABC
A B C D
$ $ $ $
Direct materials 40.00 50.00 30.00 60.00
Direct labour 28.00 21.00 14.00 21.00
Machine dept costs 32.09 24.07 16.05 24.07
Set‐up costs 12.50 12.50 12.50 12.50
Stores receiving 7.50 9.00 11.25 7.50
Inspection 5.00 5.00 5.00 5.00
Material handling 011.00 011.00 011.00 011.00
Production cost/unit 136.09 132.57 99.80 141.07
Output in units 00120 00100 0080 00120
Total production costs $16,331 $13,257 $7,984 $16,928
11 D
In target costing, the selling price of a product is determined first and the target costs established accordingly.
12 C
External failure costs are those incurred due to poor quality of goods delivered to customers; therefore this includes compensation costs.
Appraisal costs are those incurred in the measuring of quality of output; therefore this includes test equipment running costs.
13 B
Machine cells, multi‐skilled labour and a close relationship with suppliers are all features of JIT. A focus on inventory being held at a bottleneck resource is a feature of throughput accounting.
14 D
Statements A, B and C are incorrect. JIT makes an organisation more vulnerable to disruptions in the supply chain because there are no buffer inventories as protection against a breakdown in supply. JIT is easier to implement when an organisation operates within a narrow geographical area, and close to its suppliers. (At Toyota, where JIT originated, manufacturing operations were initially carried out within a 50 kilometre radius.) With little or no inventories, the risk of inventory obsolescence should not exist.
Statement D is correct. When demand is difficult to predict, it becomes more difficult to operate a demand‐driven operation.
15 B
(i) is true. JIT is a ‘pull’ system, based on demand. (ii) is false : while a low batch set‐up costs are a prerequisite for successful JIT, the use of JIT will result in smaller batches, more set‐ups and hence higher set up costs overall. (iii) is true. JIT needs multifunctional workers, who could be grouped by products rather than tasks.
ANSWERS TO OBJECTIVE TEST QUESTIONS : SECTION 2
95
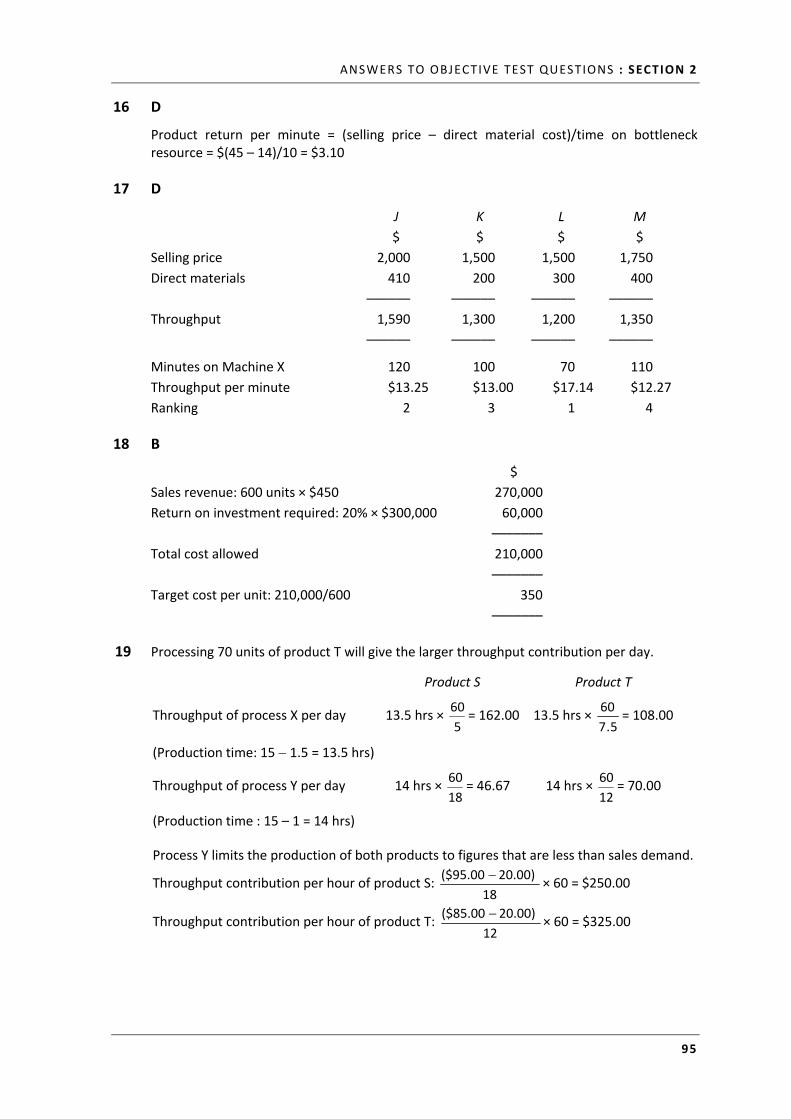
16 D
Product return per minute = (selling price – direct material cost)/time on bottleneck resource = $(45 – 14)/10 = $3.10
17 D
J
$
K
$
L
$
M
$
Selling price 2,000 1,500 1,500 1,750
Direct materials 410 200 300 400
–––––– –––––– –––––– ––––––
Throughput 1,590 1,300 1,200 1,350
–––––– –––––– –––––– ––––––
Minutes on Machine X 120 100 70 110
Throughput per minute $13.25 $13.00 $17.14 $12.27
Ranking 2 3 1 4
18 B
$
Sales revenue: 600 units × $450 270,000
Return on investment required: 20% × $300,000 60,000
–––––––
Total cost allowed 210,000
–––––––
Target cost per unit: 210,000/600 350
–––––––
19 Processing 70 units of product T will give the larger throughput contribution per day.
Product S Product T
Throughput of process X per day 13.5 hrs × 5
60= 162.00 13.5 hrs ×
5.7
60= 108.00
(Production time: 15 1.5 = 13.5 hrs)
Throughput of process Y per day 14 hrs × 18
60= 46.67 14 hrs ×
12
60= 70.00
(Production time : 15 – 1 = 14 hrs)
Process Y limits the production of both products to figures that are less than sales demand.
Throughput contribution per hour of product S: 18
20.00) ($95.00 × 60 = $250.00
Throughput contribution per hour of product T: 12
20.00) ($85.00 × 60 = $325.00
SUBJECT P2: ADVANCED MANAGEMENT ACCOUNTING
96
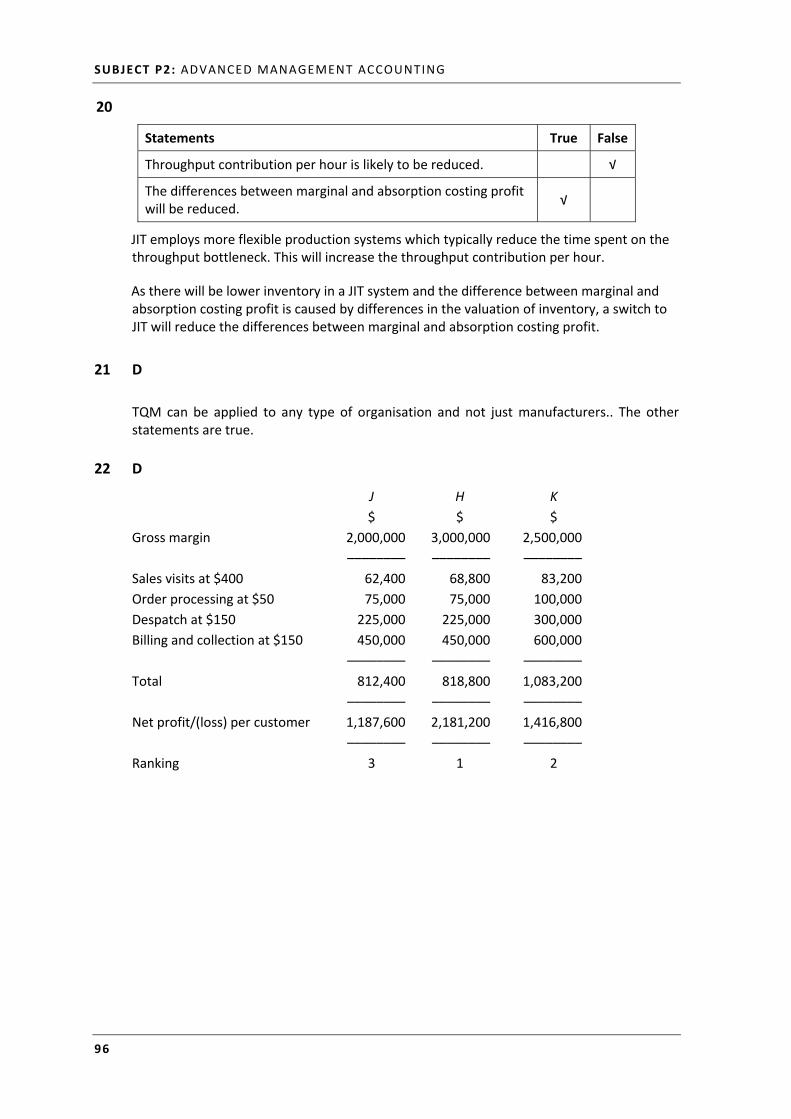
20
Statements True False
Throughput contribution per hour is likely to be reduced. √
The differences between marginal and absorption costing profit will be reduced.
√
JIT employs more flexible production systems which typically reduce the time spent on the throughput bottleneck. This will increase the throughput contribution per hour.
As there will be lower inventory in a JIT system and the difference between marginal and absorption costing profit is caused by differences in the valuation of inventory, a switch to JIT will reduce the differences between marginal and absorption costing profit.
21 D
TQM can be applied to any type of organisation and not just manufacturers.. The other statements are true.
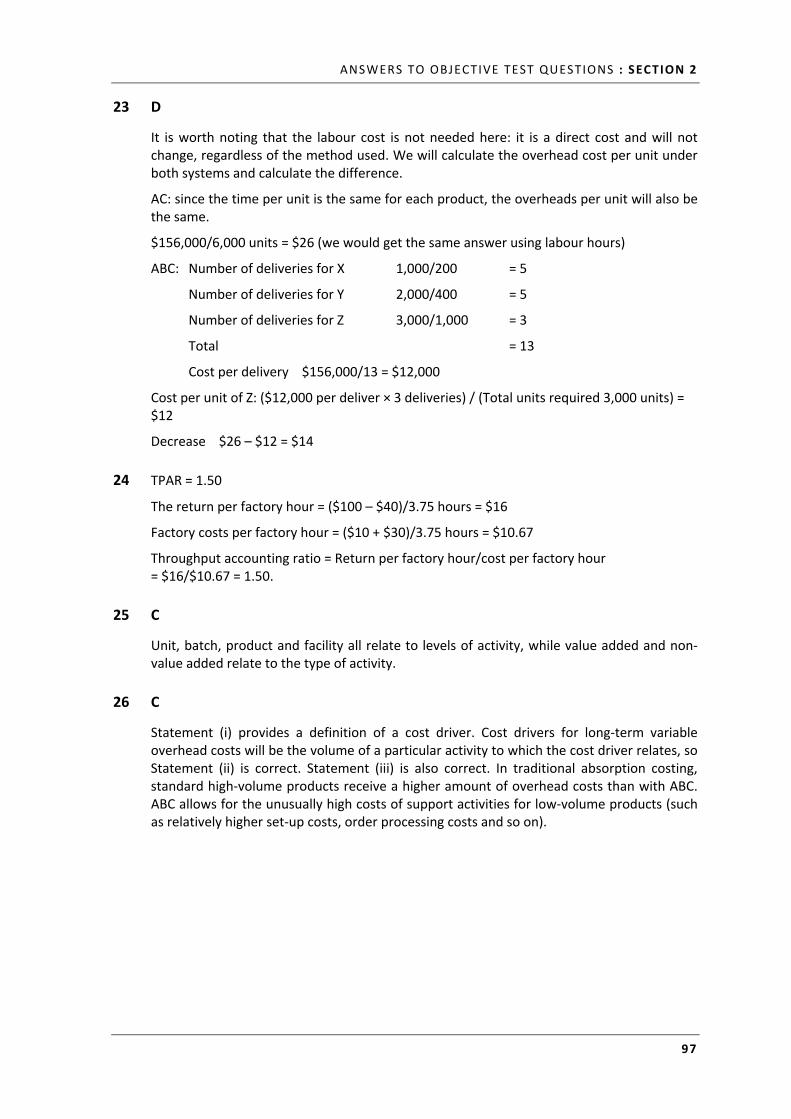
22 D
J H K
$ $ $
Gross margin 2,000,000 3,000,000 2,500,000
–––––––– –––––––– ––––––––
Sales visits at $400 62,400 68,800 83,200
Order processing at $50 75,000 75,000 100,000
Despatch at $150 225,000 225,000 300,000
Billing and collection at $150 450,000 450,000 600,000
–––––––– –––––––– ––––––––
Total 812,400 818,800 1,083,200
–––––––– –––––––– ––––––––
Net profit/(loss) per customer 1,187,600 2,181,200 1,416,800
–––––––– –––––––– ––––––––
Ranking 3 1 2
ANSWERS TO OBJECTIVE TEST QUESTIONS : SECTION 2
97
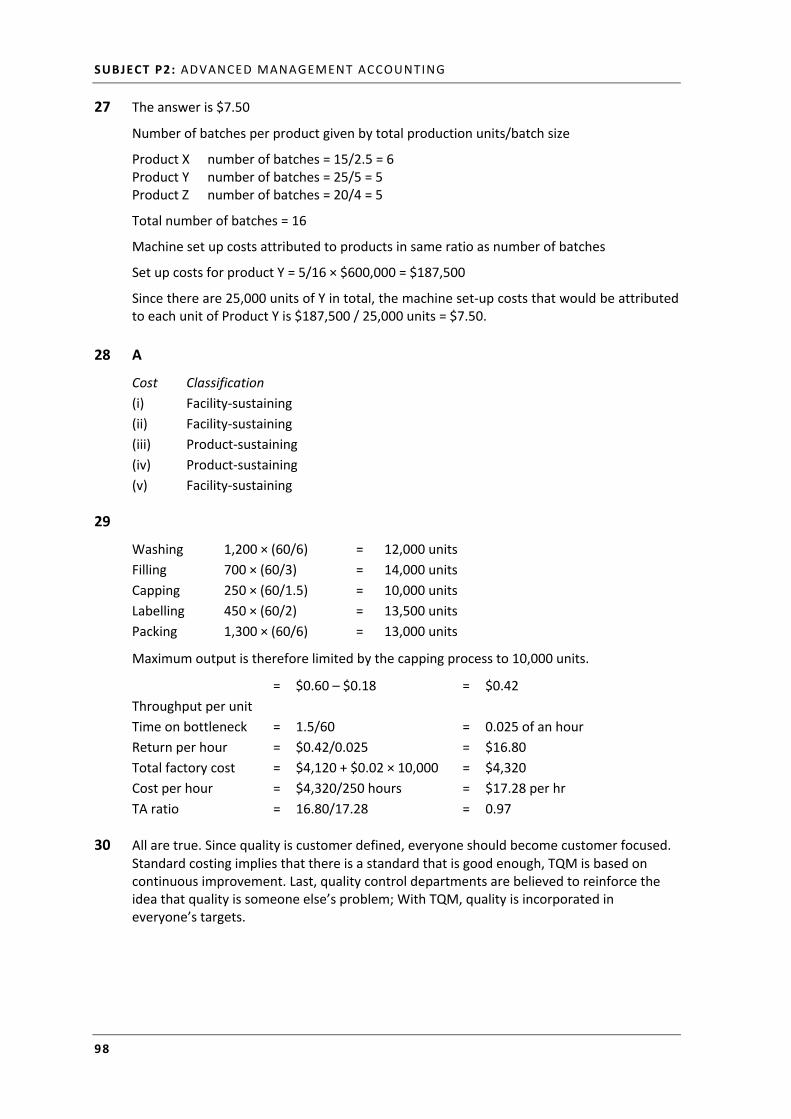
23 D
It is worth noting that the labour cost is not needed here: it is a direct cost and will not change, regardless of the method used. We will calculate the overhead cost per unit under both systems and calculate the difference.
AC: since the time per unit is the same for each product, the overheads per unit will also be the same.
$156,000/6,000 units = $26 (we would get the same answer using labour hours)
ABC: Number of deliveries for X 1,000/200 = 5
Number of deliveries for Y 2,000/400 = 5
Number of deliveries for Z 3,000/1,000 = 3
Total = 13
Cost per delivery $156,000/13 = $12,000
Cost per unit of Z: ($12,000 per deliver × 3 deliveries) / (Total units required 3,000 units) = $12
Decrease $26 – $12 = $14
24 TPAR = 1.50
The return per factory hour = ($100 – $40)/3.75 hours = $16
Factory costs per factory hour = ($10 + $30)/3.75 hours = $10.67
Throughput accounting ratio = Return per factory hour/cost per factory hour = $16/$10.67 = 1.50.
25 C
Unit, batch, product and facility all relate to levels of activity, while value added and non‐value added relate to the type of activity.
26 C
Statement (i) provides a definition of a cost driver. Cost drivers for long‐term variable overhead costs will be the volume of a particular activity to which the cost driver relates, so Statement (ii) is correct. Statement (iii) is also correct. In traditional absorption costing, standard high‐volume products receive a higher amount of overhead costs than with ABC. ABC allows for the unusually high costs of support activities for low‐volume products (such as relatively higher set‐up costs, order processing costs and so on).
SUBJECT P2: ADVANCED MANAGEMENT ACCOUNTING
98
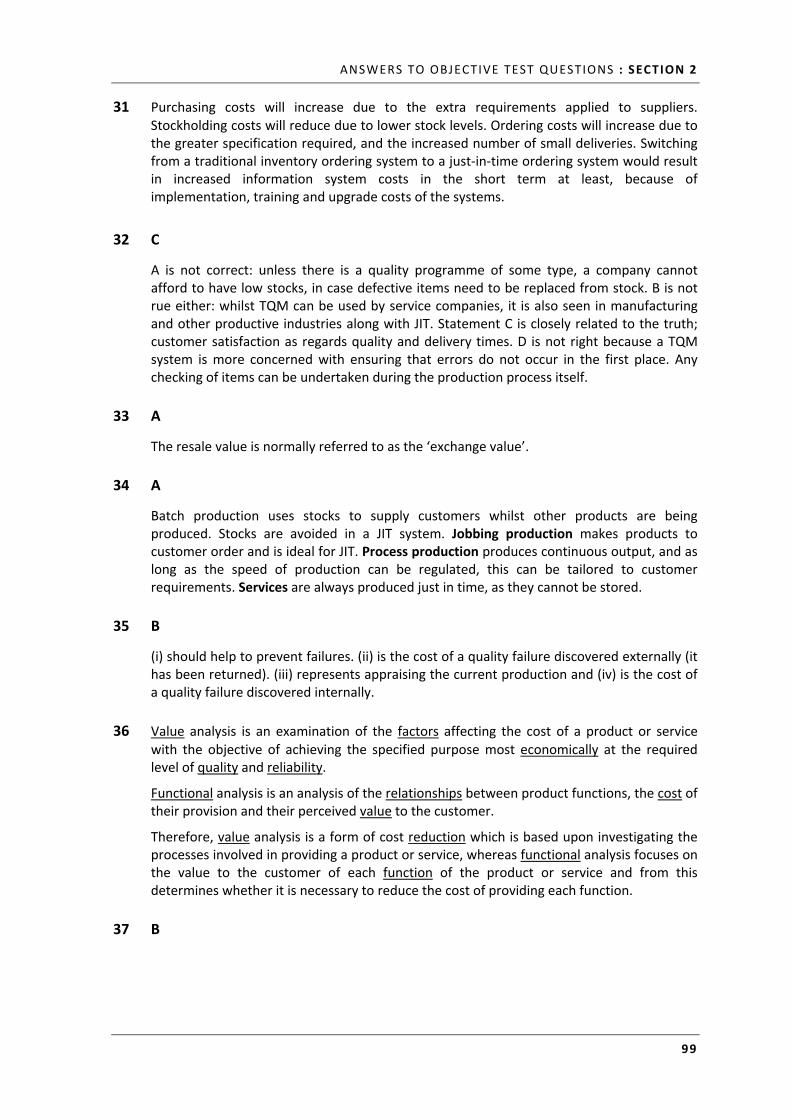
27 The answer is $7.50
Number of batches per product given by total production units/batch size
Product X number of batches = 15/2.5 = 6 Product Y number of batches = 25/5 = 5 Product Z number of batches = 20/4 = 5
Total number of batches = 16
Machine set up costs attributed to products in same ratio as number of batches
Set up costs for product Y = 5/16 × $600,000 = $187,500
Since there are 25,000 units of Y in total, the machine set‐up costs that would be attributed to each unit of Product Y is $187,500 / 25,000 units = $7.50.
28 A
Cost Classification
(i) Facility‐sustaining
(ii) Facility‐sustaining
(iii) Product‐sustaining
(iv) Product‐sustaining
(v) Facility‐sustaining
29
Washing 1,200 × (60/6) = 12,000 units
Filling 700 × (60/3) = 14,000 units
Capping 250 × (60/1.5) = 10,000 units
Labelling 450 × (60/2) = 13,500 units
Packing 1,300 × (60/6) = 13,000 units
Maximum output is therefore limited by the capping process to 10,000 units.
Throughput per unit
= $0.60 – $0.18 = $0.42
Time on bottleneck = 1.5/60 = 0.025 of an hour
Return per hour = $0.42/0.025 = $16.80
Total factory cost = $4,120 + $0.02 × 10,000 = $4,320
Cost per hour = $4,320/250 hours = $17.28 per hr
TA ratio = 16.80/17.28 = 0.97
30 All are true. Since quality is customer defined, everyone should become customer focused. Standard costing implies that there is a standard that is good enough, TQM is based on continuous improvement. Last, quality control departments are believed to reinforce the idea that quality is someone else’s problem; With TQM, quality is incorporated in everyone’s targets.
ANSWERS TO OBJECTIVE TEST QUESTIONS : SECTION 2
99
31 Purchasing costs will increase due to the extra requirements applied to suppliers. Stockholding costs will reduce due to lower stock levels. Ordering costs will increase due to the greater specification required, and the increased number of small deliveries. Switching from a traditional inventory ordering system to a just‐in‐time ordering system would result in increased information system costs in the short term at least, because of implementation, training and upgrade costs of the systems.
32 C
A is not correct: unless there is a quality programme of some type, a company cannot afford to have low stocks, in case defective items need to be replaced from stock. B is not rue either: whilst TQM can be used by service companies, it is also seen in manufacturing and other productive industries along with JIT. Statement C is closely related to the truth; customer satisfaction as regards quality and delivery times. D is not right because a TQM system is more concerned with ensuring that errors do not occur in the first place. Any checking of items can be undertaken during the production process itself.
33 A
The resale value is normally referred to as the ‘exchange value’.
34 A
Batch production uses stocks to supply customers whilst other products are being produced. Stocks are avoided in a JIT system. Jobbing production makes products to customer order and is ideal for JIT. Process production produces continuous output, and as long as the speed of production can be regulated, this can be tailored to customer requirements. Services are always produced just in time, as they cannot be stored.
35 B
(i) should help to prevent failures. (ii) is the cost of a quality failure discovered externally (it has been returned). (iii) represents appraising the current production and (iv) is the cost of a quality failure discovered internally.
36 Value analysis is an examination of the factors affecting the cost of a product or service with the objective of achieving the specified purpose most economically at the required level of quality and reliability.
Functional analysis is an analysis of the relationships between product functions, the cost of their provision and their perceived value to the customer.
Therefore, value analysis is a form of cost reduction which is based upon investigating the processes involved in providing a product or service, whereas functional analysis focuses on the value to the customer of each function of the product or service and from this determines whether it is necessary to reduce the cost of providing each function.
37 B
SUBJECT P2: ADVANCED MANAGEMENT ACCOUNTING
100
38 D
JIT typically requires changes in how materials are requisitioned for production and a change in production in staffing to make them more flexible. But finished goods will likely be delivered in the same way (though the timing and quantity may change).
39 Just‐in‐Time, like so many modern management techniques, places great importance on the ‘continuous improvement’ ethos. Cost containment will often aim to achieve a pre‐determined target, but this target may often remain static over a long period of time. With modern techniques, the target is regularly updated and made more stringent.
Continual cost reduction can be seen in many areas of JIT:
Reduction in stock levels – large amounts of capital is tied up in high stock levels. Reducing stock levels releases this cash, so that it can be better used elsewhere in the business. Ideally, zero stock should be held.
Reduction in manufacturing times and customer lead times – the demand based manufacturing of JIT, together with cellular manufacturing enables production times to be greatly reduced. This will improve customer satisfaction and hopefully lead to increased business volume.
Cross‐training of staff: new production methods necessitate staff being competent in several tasks. This may lead to fewer staff being required hence costs are reduced.
40
Costs associated with stopping the output of products which fail to conform to the specifications. Prevention costs.
Costs of materials or products that fail to meet specifications. Internal failure costs.
Costs arising when poor quality products are delivered to customers. External failure costs.
Costs associated with ensuring that production meets standards. Appraisal costs.
41 TPAR = 1.3
The throughput accounting ratio is defined as throughput/total factory costs. Throughput accounting aims to discourage inventory building, so the ratios do not take account of inventory movements.
Throughput = sales – all material costs =$35 × 800 – $13,000 = $15,000
(Note that we use materials purchased instead of materials used.)
Total factory costs = all other production costs = $6,900 + $4,650 = $11,550
TA ratio = $15,000/$11,550 = 1.30.
42 D
ANSWERS TO OBJECTIVE TEST QUESTIONS : SECTION 2
101
43 The extended value chain includes both internal and external factors whereas the value chain includes only the internal factors. The value chain is the sequence of business factors that add value to the organisation’s products and services and comprises the following:
Research and Development (R&D)
Design
Production
Marketing
Distribution
Customer service
The extended value chain adds suppliers to the left hand side and customers to the right hand side and recognises the importance of the relationships that the organisation has with these external parties in the overall process of adding value.
44 B
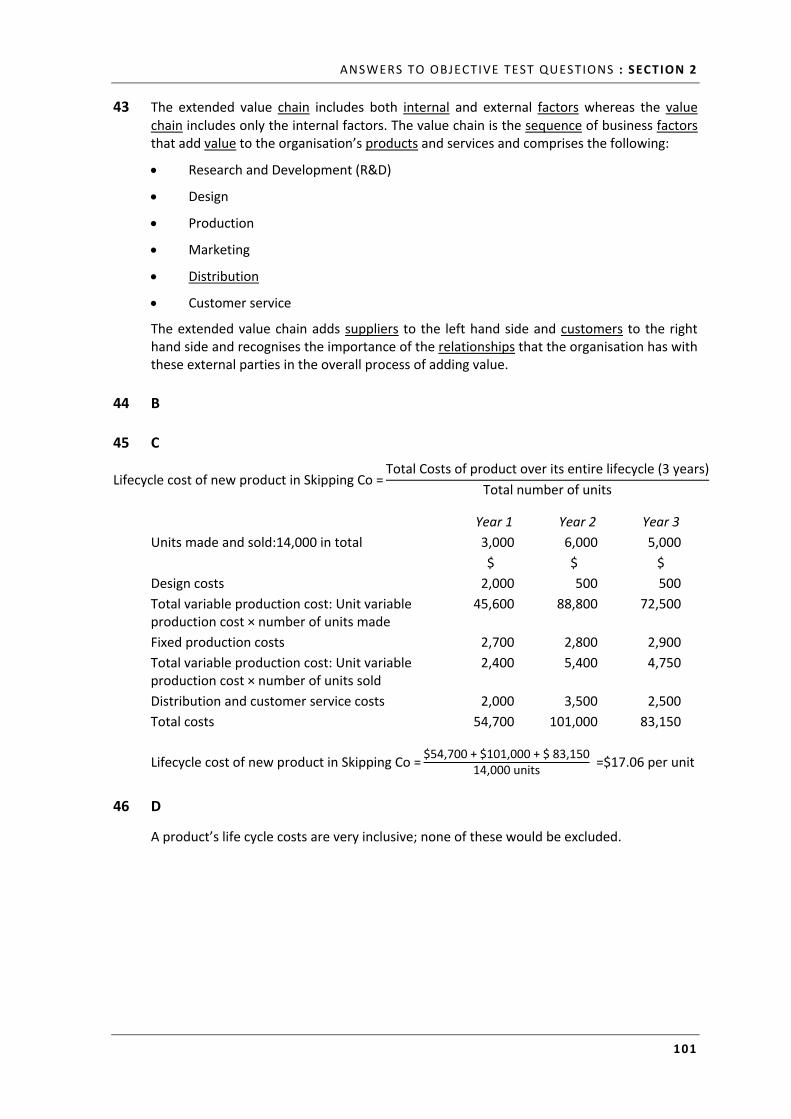
45 C
Lifecycle cost of new product in Skipping Co =Total Costs of product over its entire lifecycle (3 years)
Total number of units
Year 1 Year 2 Year 3
Units made and sold:14,000 in total 3,000 6,000 5,000
$ $ $
Design costs 2,000 500 500
Total variable production cost: Unit variable production cost × number of units made
45,600 88,800 72,500
Fixed production costs 2,700 2,800 2,900
Total variable production cost: Unit variable production cost × number of units sold
2,400 5,400 4,750
Distribution and customer service costs 2,000 3,500 2,500
Total costs 54,700 101,000 83,150
Lifecycle cost of new product in Skipping Co =$54,700+$101,000+$ 83,150
14,000 units =$17.06 per unit
46 D
A product’s life cycle costs are very inclusive; none of these would be excluded.
SUBJECT P2: ADVANCED MANAGEMENT ACCOUNTING
102
B: CAPITAL INVESTMENT DECISION MAKING
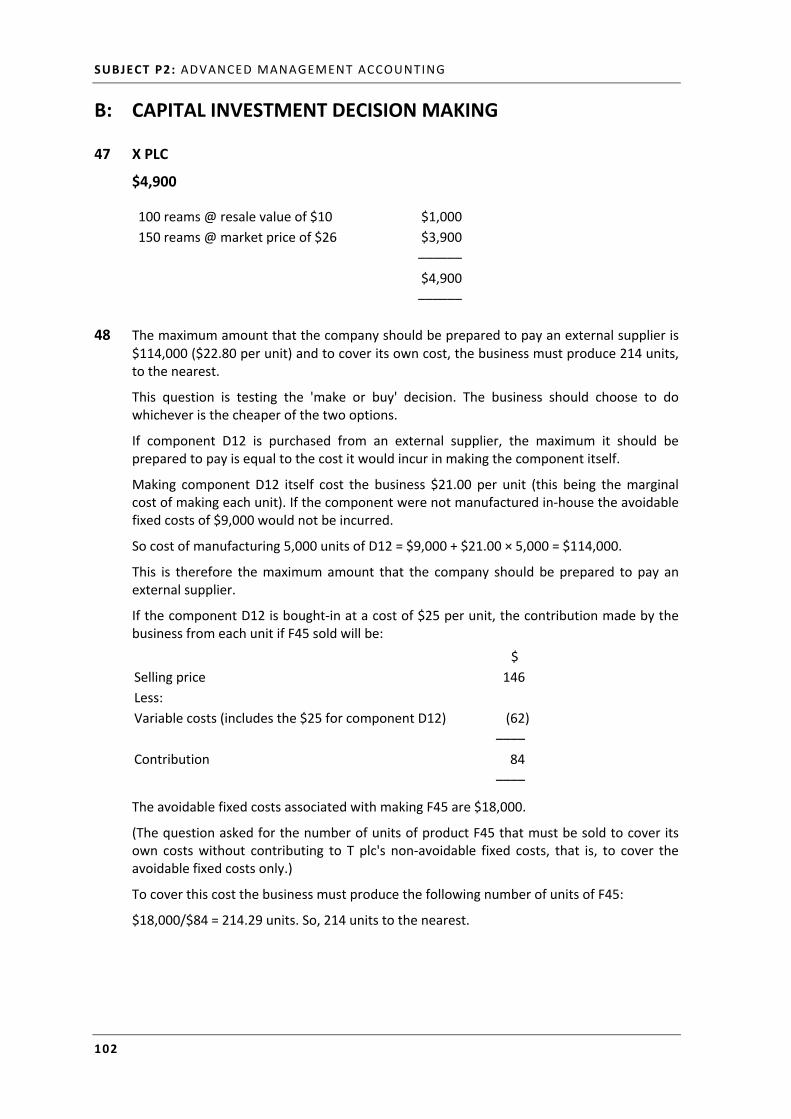
47 X PLC
$4,900
100 reams @ resale value of $10 $1,000
150 reams @ market price of $26 $3,900
––––––
$4,900
––––––
48 The maximum amount that the company should be prepared to pay an external supplier is $114,000 ($22.80 per unit) and to cover its own cost, the business must produce 214 units, to the nearest.
This question is testing the 'make or buy' decision. The business should choose to do whichever is the cheaper of the two options.
If component D12 is purchased from an external supplier, the maximum it should be prepared to pay is equal to the cost it would incur in making the component itself.
Making component D12 itself cost the business $21.00 per unit (this being the marginal cost of making each unit). If the component were not manufactured in‐house the avoidable fixed costs of $9,000 would not be incurred.
So cost of manufacturing 5,000 units of D12 = $9,000 + $21.00 × 5,000 = $114,000.
This is therefore the maximum amount that the company should be prepared to pay an external supplier.
If the component D12 is bought‐in at a cost of $25 per unit, the contribution made by the business from each unit if F45 sold will be:
$
Selling price 146
Less:
Variable costs (includes the $25 for component D12) (62)
––––
Contribution 84
––––
The avoidable fixed costs associated with making F45 are $18,000.
(The question asked for the number of units of product F45 that must be sold to cover its own costs without contributing to T plc's non‐avoidable fixed costs, that is, to cover the avoidable fixed costs only.)
To cover this cost the business must produce the following number of units of F45:
$18,000/$84 = 214.29 units. So, 214 units to the nearest.
ANSWERS TO OBJECTIVE TEST QUESTIONS : SECTION 2
103
49 E
By setting up your own business you will be giving up the opportunity to earn $25,000 per annum. The salary is therefore an opportunity cost. By taking on the rent of the business unit you will be increasing your cost base – so the rent is an incremental cost.
A committed cost is a cost which the new business is already obliged to pay (perhaps for contractual reasons). Sunk costs are past costs. Irrelevant costs are those that have no bearing on the decision to be taken.
50 RIGHTLIGHT LTD
If the contract were to go ahead, five new employees will have to be recruited at an
incremental cost of 5 $45,000 = $225,000 per annum.
This cost would only be for six months.
So cost to the contract would be: $225,000 × 0.5 = $112,500
The cost of the project manager is irrelevant since he already works for Rightlight Ltd. His salary is therefore a committed cost – even the 30% of time he will spend on the contract!
The 'Environmental Awareness' training programme would cost:
5 employees × $3,000 × 80% = $12,000
So total relevant cost if Rightlight Ltd were to run the campaign would be:
$112,500 + $12,000 = $124,500
Instead, Rightlight Ltd could subcontract the work at a cost of $135,000.
The cheaper option is to employ and train the five new employees. Hence, relevant cost of labour for the contract is $124,500.
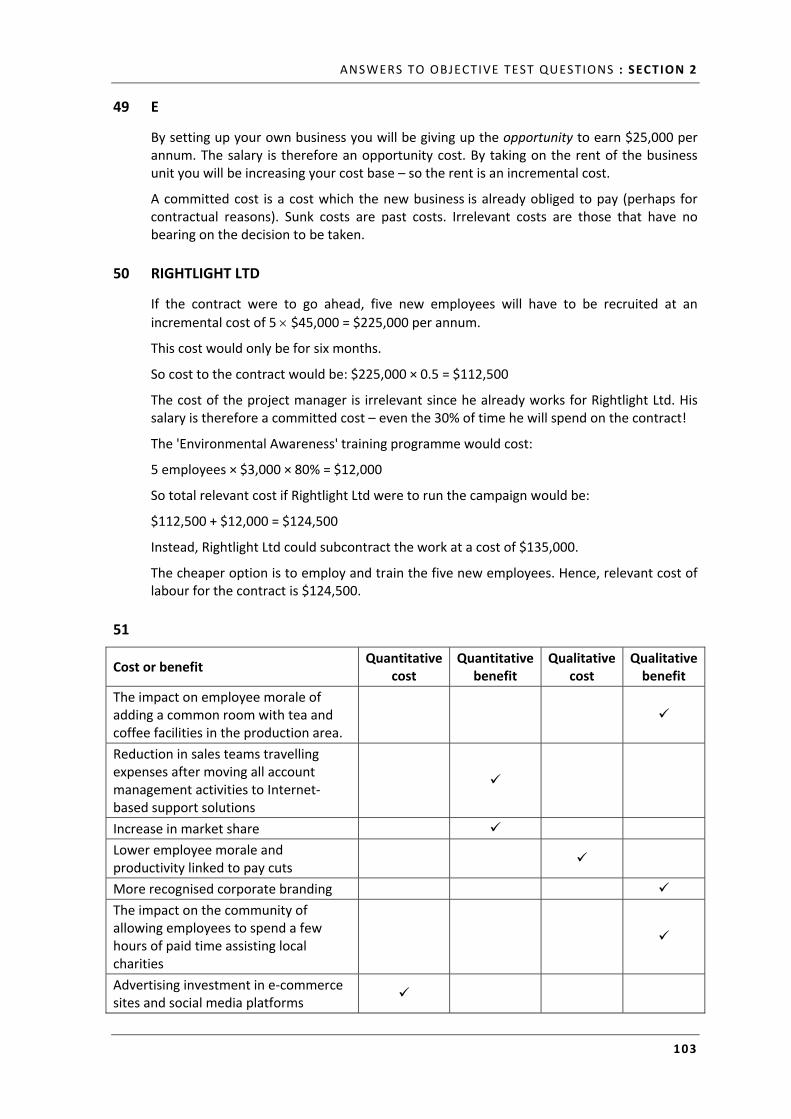
51
Cost or benefit Quantitative
cost Quantitative
benefit Qualitative
cost Qualitative benefit
The impact on employee morale of adding a common room with tea and coffee facilities in the production area.
Reduction in sales teams travelling expenses after moving all account management activities to Internet‐based support solutions
Increase in market share
Lower employee morale and productivity linked to pay cuts
More recognised corporate branding
The impact on the community of allowing employees to spend a few hours of paid time assisting local charities
Advertising investment in e‐commerce sites and social media platforms
SUBJECT P2: ADVANCED MANAGEMENT ACCOUNTING
104
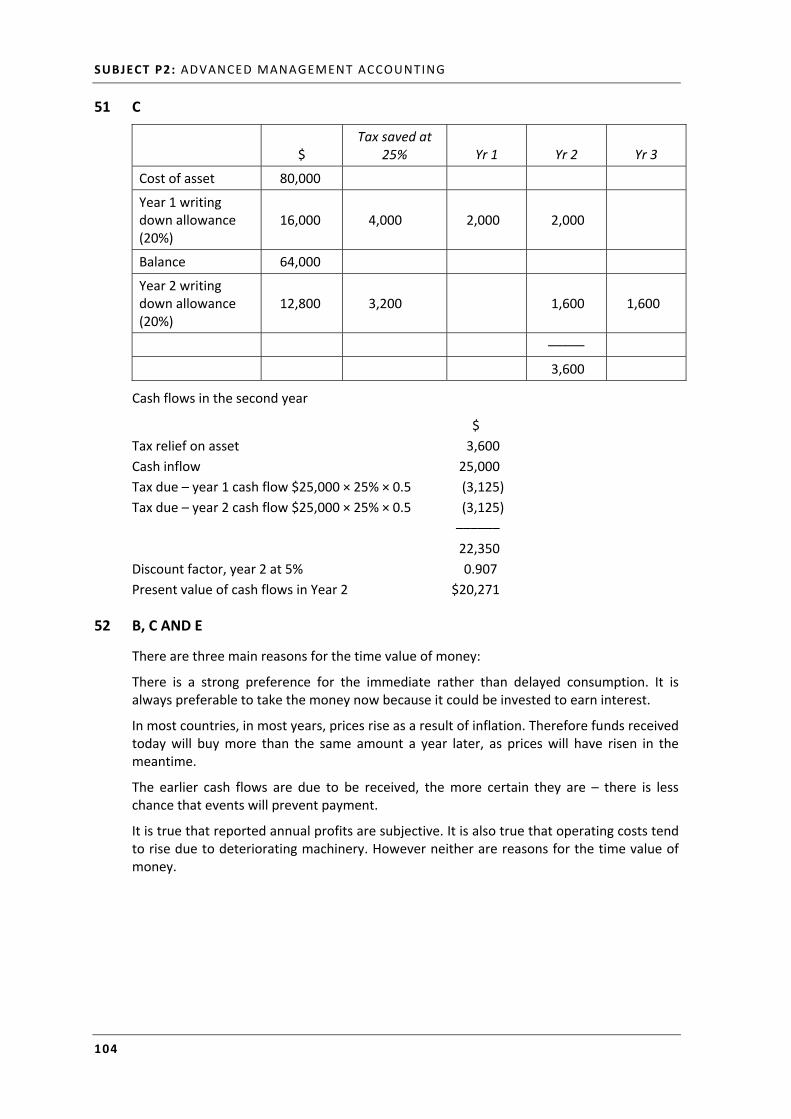
51 C
$
Tax saved at 25% Yr 1 Yr 2 Yr 3
Cost of asset 80,000
Year 1 writing down allowance (20%)
16,000 4,000 2,000 2,000
Balance 64,000
Year 2 writing down allowance (20%)
12,800 3,200 1,600 1,600
–––––
3,600
Cash flows in the second year
$
Tax relief on asset 3,600
Cash inflow 25,000
Tax due – year 1 cash flow $25,000 × 25% × 0.5 (3,125)
Tax due – year 2 cash flow $25,000 × 25% × 0.5 (3,125)
––––––
22,350
Discount factor, year 2 at 5% 0.907
Present value of cash flows in Year 2 $20,271
52 B, C AND E
There are three main reasons for the time value of money:
There is a strong preference for the immediate rather than delayed consumption. It is always preferable to take the money now because it could be invested to earn interest.
In most countries, in most years, prices rise as a result of inflation. Therefore funds received today will buy more than the same amount a year later, as prices will have risen in the meantime.
The earlier cash flows are due to be received, the more certain they are – there is less chance that events will prevent payment.
It is true that reported annual profits are subjective. It is also true that operating costs tend to rise due to deteriorating machinery. However neither are reasons for the time value of money.
ANSWERS TO OBJECTIVE TEST QUESTIONS : SECTION 2
105
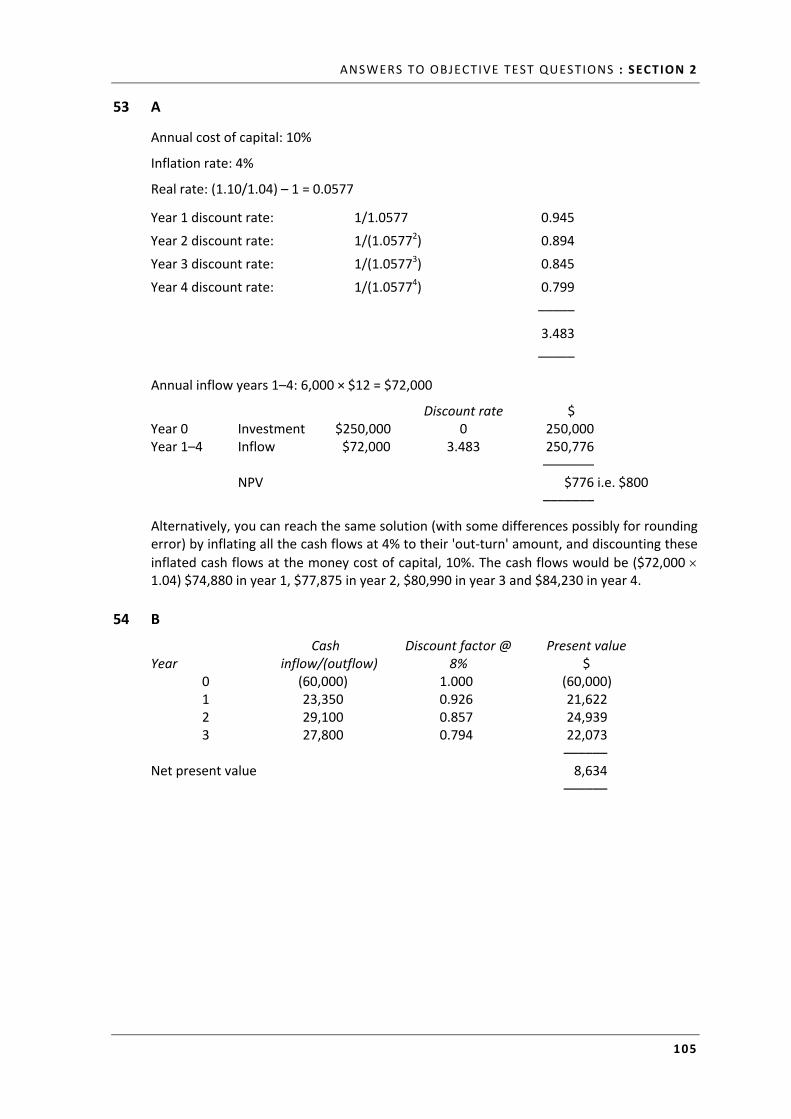
53 A
Annual cost of capital: 10%
Inflation rate: 4%
Real rate: (1.10/1.04) – 1 = 0.0577
Year 1 discount rate: 1/1.0577 0.945
Year 2 discount rate: 1/(1.05772) 0.894
Year 3 discount rate: 1/(1.05773) 0.845
Year 4 discount rate: 1/(1.05774) 0.799
–––––
3.483
–––––
Annual inflow years 1–4: 6,000 × $12 = $72,000
Discount rate $ Year 0 Investment $250,000 0 250,000 Year 1–4 Inflow $72,000 3.483 250,776 ––––––– NPV $776 i.e. $800 –––––––
Alternatively, you can reach the same solution (with some differences possibly for rounding error) by inflating all the cash flows at 4% to their 'out‐turn' amount, and discounting these
inflated cash flows at the money cost of capital, 10%. The cash flows would be ($72,000 1.04) $74,880 in year 1, $77,875 in year 2, $80,990 in year 3 and $84,230 in year 4.
54 B
Year Cash
inflow/(outflow) Discount factor @
8% Present value
$ 0 (60,000) 1.000 (60,000) 1 23,350 0.926 21,622 2 29,100 0.857 24,939 3 27,800 0.794 22,073
–––––– Net present value 8,634 ––––––
SUBJECT P2: ADVANCED MANAGEMENT ACCOUNTING
106
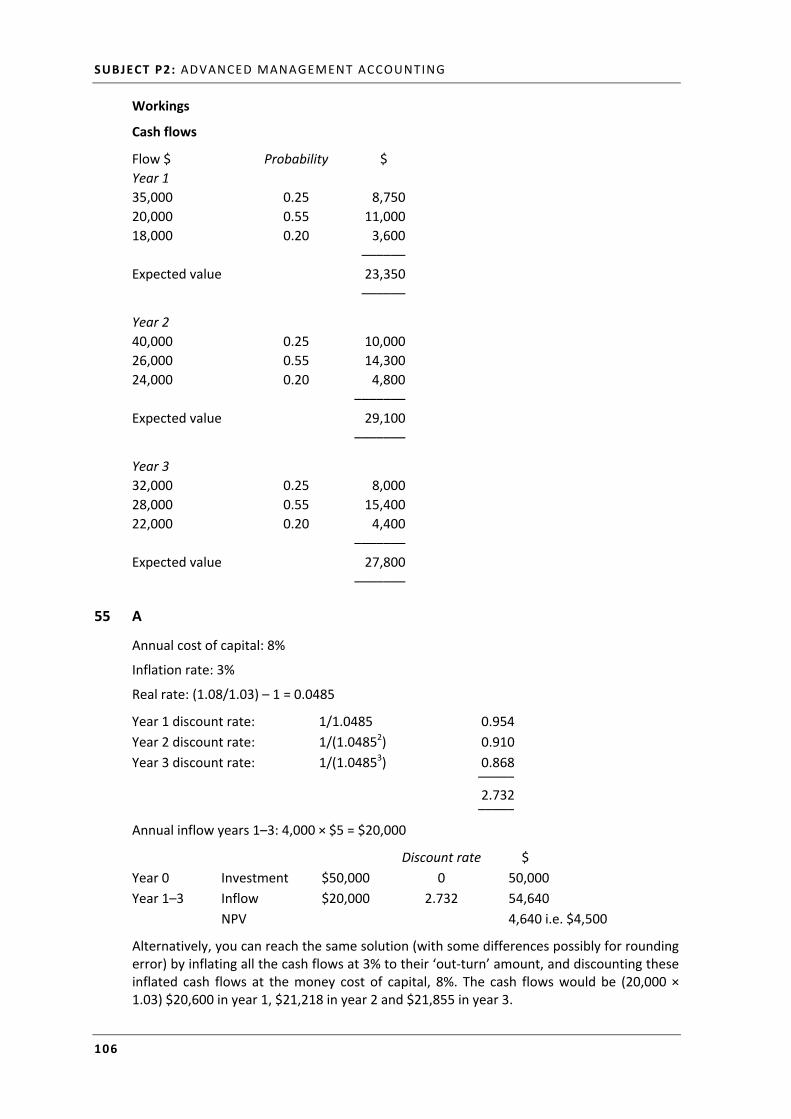
Workings
Cash flows
Flow $ Probability $
Year 1
35,000 0.25 8,750
20,000 0.55 11,000
18,000 0.20 3,600
––––––
Expected value 23,350
––––––
Year 2
40,000 0.25 10,000
26,000 0.55 14,300
24,000 0.20 4,800
–––––––
Expected value 29,100
–––––––
Year 3
32,000 0.25 8,000
28,000 0.55 15,400
22,000 0.20 4,400
–––––––
Expected value 27,800
–––––––
55 A
Annual cost of capital: 8%
Inflation rate: 3%
Real rate: (1.08/1.03) – 1 = 0.0485
Year 1 discount rate: 1/1.0485 0.954
Year 2 discount rate: 1/(1.04852) 0.910
Year 3 discount rate: 1/(1.04853) 0.868 –––––
2.732 –––––
Annual inflow years 1–3: 4,000 × $5 = $20,000
Discount rate $
Year 0 Investment $50,000 0 50,000
Year 1–3 Inflow $20,000 2.732 54,640
NPV 4,640 i.e. $4,500
Alternatively, you can reach the same solution (with some differences possibly for rounding error) by inflating all the cash flows at 3% to their ‘out‐turn’ amount, and discounting these inflated cash flows at the money cost of capital, 8%. The cash flows would be (20,000 × 1.03) $20,600 in year 1, $21,218 in year 2 and $21,855 in year 3.
ANSWERS TO OBJECTIVE TEST QUESTIONS : SECTION 2
107
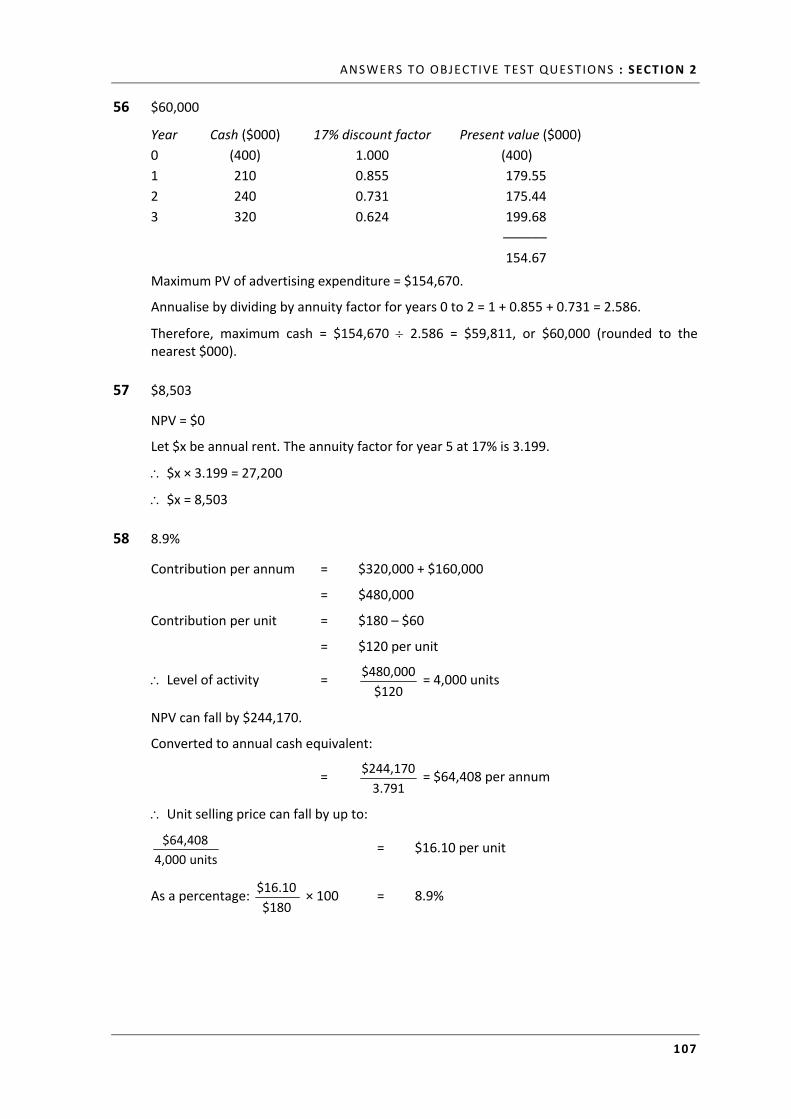
56 $60,000
Year Cash ($000) 17% discount factor Present value ($000)
0 (400) 1.000 (400)
1 210 0.855 179.55
2 240 0.731 175.44
3 320 0.624 199.68
––––––
154.67
Maximum PV of advertising expenditure = $154,670.
Annualise by dividing by annuity factor for years 0 to 2 = 1 + 0.855 + 0.731 = 2.586.
Therefore, maximum cash = $154,670 2.586 = $59,811, or $60,000 (rounded to the nearest $000).
57 $8,503
NPV = $0
Let $x be annual rent. The annuity factor for year 5 at 17% is 3.199.
$x × 3.199 = 27,200
$x = 8,503
58 8.9%
Contribution per annum = $320,000 + $160,000
= $480,000
Contribution per unit = $180 – $60
= $120 per unit
Level of activity = $120
$480,000 = 4,000 units
NPV can fall by $244,170.
Converted to annual cash equivalent:
= 3.791
$244,170 = $64,408 per annum
Unit selling price can fall by up to:
units4,000
$64,408 = $16.10 per unit
As a percentage: $180
$16.10 × 100 = 8.9%
SUBJECT P2: ADVANCED MANAGEMENT ACCOUNTING
108
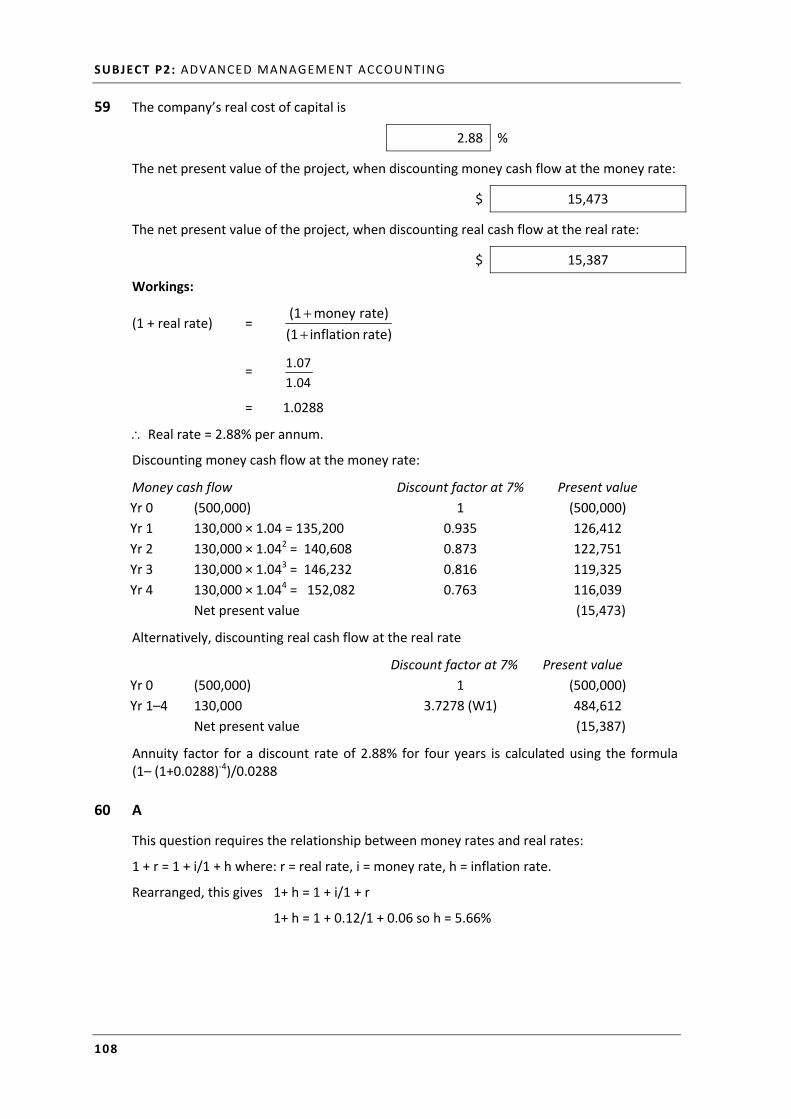
59 The company’s real cost of capital is
2.88 %
The net present value of the project, when discounting money cash flow at the money rate:
$ 15,473
The net present value of the project, when discounting real cash flow at the real rate:
$ 15,387
Workings:
(1 + real rate) = rate) inflation(1
rate) money(1
= 04.1
07.1
= 1.0288
Real rate = 2.88% per annum.
Discounting money cash flow at the money rate:
Money cash flow Discount factor at 7% Present value
Yr 0 (500,000) 1 (500,000)
Yr 1 130,000 × 1.04 = 135,200 0.935 126,412
Yr 2 130,000 × 1.042 = 140,608 0.873 122,751
Yr 3 130,000 × 1.043 = 146,232 0.816 119,325
Yr 4 130,000 × 1.044 = 152,082 0.763 116,039
Net present value (15,473)
Alternatively, discounting real cash flow at the real rate
Discount factor at 7% Present value
Yr 0 (500,000) 1 (500,000)
Yr 1–4 130,000 3.7278 (W1) 484,612
Net present value (15,387)
Annuity factor for a discount rate of 2.88% for four years is calculated using the formula (1– (1+0.0288)-4)/0.0288
60 A
This question requires the relationship between money rates and real rates:
1 + r = 1 + i/1 + h where: r = real rate, i = money rate, h = inflation rate.
Rearranged, this gives 1+ h = 1 + i/1 + r
1+ h = 1 + 0.12/1 + 0.06 so h = 5.66%
ANSWERS TO OBJECTIVE TEST QUESTIONS : SECTION 2
109
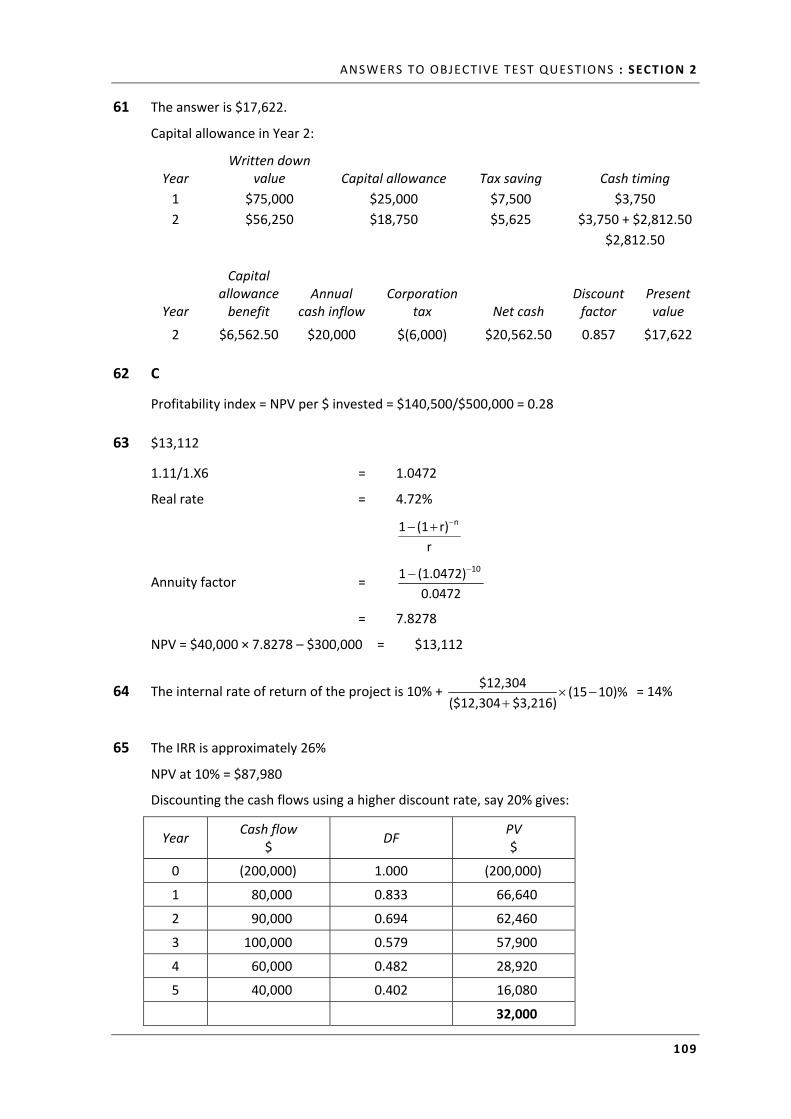
61 The answer is $17,622.
Capital allowance in Year 2:
Year Written down
value Capital allowance Tax saving Cash timing
1 $75,000 $25,000 $7,500 $3,750
2 $56,250 $18,750 $5,625 $3,750 + $2,812.50
$2,812.50
Year
Capital allowance benefit
Annual cash inflow
Corporation tax Net cash
Discount factor
Present value
2 $6,562.50 $20,000 $(6,000) $20,562.50 0.857 $17,622
62 C
Profitability index = NPV per $ invested = $140,500/$500,000 = 0.28
63 $13,112
1.11/1.X6 = 1.0472
Real rate = 4.72%
r
r)(11 n
Annuity factor = 0.0472
(1.0472)1 10
= 7.8278
NPV = $40,000 × 7.8278 – $300,000 = $13,112
64 The internal rate of return of the project is 10% + 10)%(15$3,216)($12,304
$12,304
= 14%
65 The IRR is approximately 26%
NPV at 10% = $87,980
Discounting the cash flows using a higher discount rate, say 20% gives:
Year Cash flow
$ DF
PV $
0 (200,000) 1.000 (200,000)
1 80,000 0.833 66,640
2 90,000 0.694 62,460
3 100,000 0.579 57,900
4 60,000 0.482 28,920
5 40,000 0.402 16,080
32,000
SUBJECT P2: ADVANCED MANAGEMENT ACCOUNTING
110
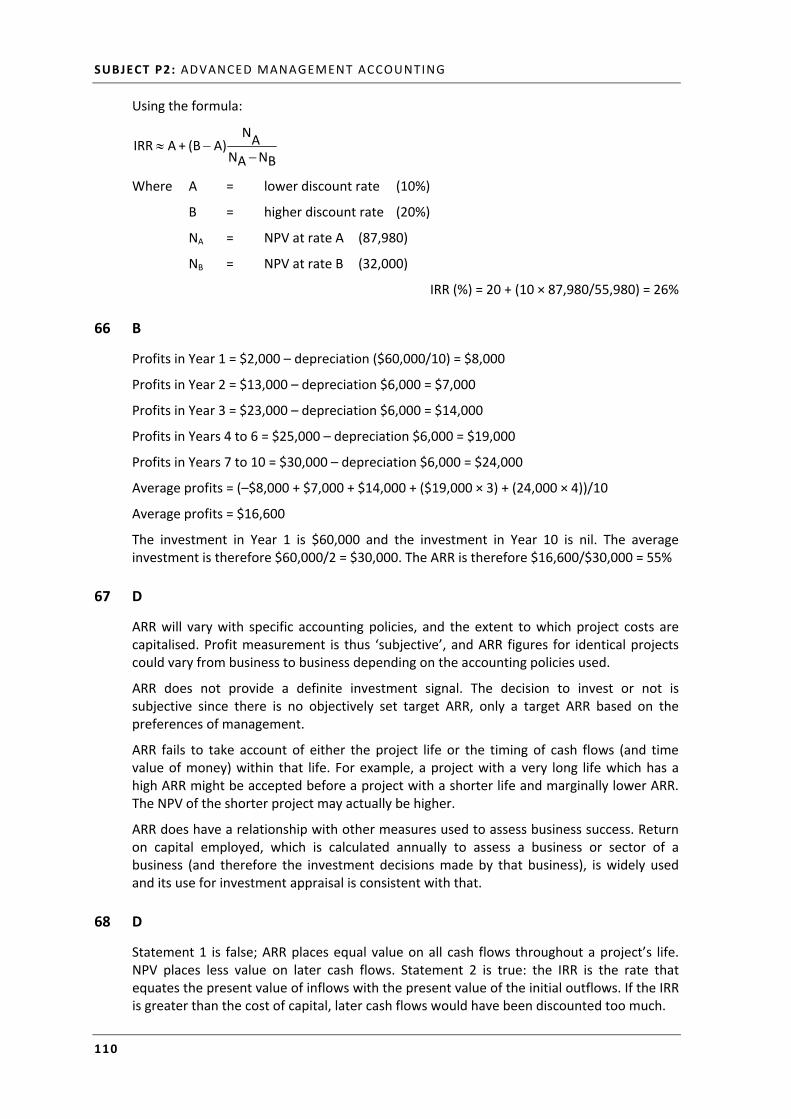
Using the formula:
BNANA
NA)(B+AIRR
Where A = lower discount rate (10%)
B = higher discount rate (20%)
NA = NPV at rate A (87,980)
NB = NPV at rate B (32,000)
IRR (%) = 20 + (10 × 87,980/55,980) = 26%
66 B
Profits in Year 1 = $2,000 – depreciation ($60,000/10) = $8,000
Profits in Year 2 = $13,000 – depreciation $6,000 = $7,000
Profits in Year 3 = $23,000 – depreciation $6,000 = $14,000
Profits in Years 4 to 6 = $25,000 – depreciation $6,000 = $19,000
Profits in Years 7 to 10 = $30,000 – depreciation $6,000 = $24,000
Average profits = (–$8,000 + $7,000 + $14,000 + ($19,000 × 3) + (24,000 × 4))/10
Average profits = $16,600
The investment in Year 1 is $60,000 and the investment in Year 10 is nil. The average investment is therefore $60,000/2 = $30,000. The ARR is therefore $16,600/$30,000 = 55%
67 D
ARR will vary with specific accounting policies, and the extent to which project costs are capitalised. Profit measurement is thus ‘subjective’, and ARR figures for identical projects could vary from business to business depending on the accounting policies used.
ARR does not provide a definite investment signal. The decision to invest or not is subjective since there is no objectively set target ARR, only a target ARR based on the preferences of management.
ARR fails to take account of either the project life or the timing of cash flows (and time value of money) within that life. For example, a project with a very long life which has a high ARR might be accepted before a project with a shorter life and marginally lower ARR. The NPV of the shorter project may actually be higher.
ARR does have a relationship with other measures used to assess business success. Return on capital employed, which is calculated annually to assess a business or sector of a business (and therefore the investment decisions made by that business), is widely used and its use for investment appraisal is consistent with that.
68 D
Statement 1 is false; ARR places equal value on all cash flows throughout a project’s life. NPV places less value on later cash flows. Statement 2 is true: the IRR is the rate that equates the present value of inflows with the present value of the initial outflows. If the IRR is greater than the cost of capital, later cash flows would have been discounted too much.
ANSWERS TO OBJECTIVE TEST QUESTIONS : SECTION 2
111
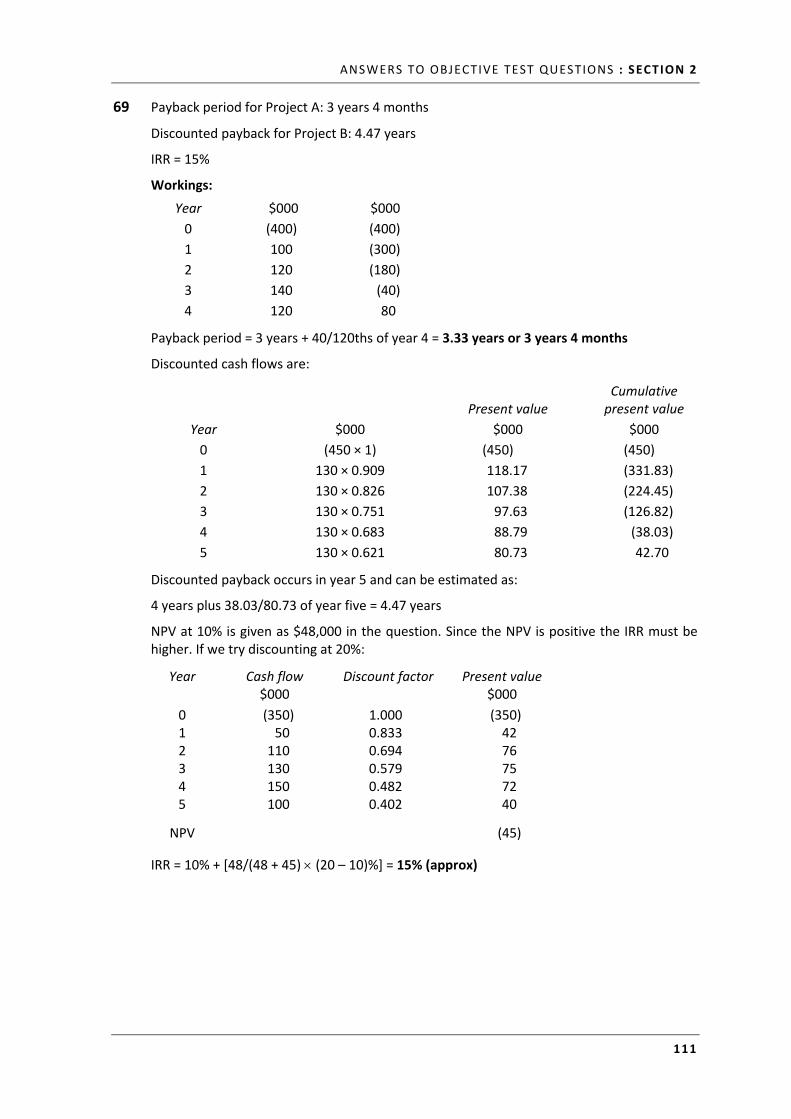
69 Payback period for Project A: 3 years 4 months
Discounted payback for Project B: 4.47 years
IRR = 15%
Workings:
Year $000 $000
0 (400) (400)
1 100 (300)
2 120 (180)
3 140 (40)
4 120 80
Payback period = 3 years + 40/120ths of year 4 = 3.33 years or 3 years 4 months
Discounted cash flows are:
Year $000
Present value
$000
Cumulative present value
$000
0 (450 × 1) (450) (450)
1 130 × 0.909 118.17 (331.83)
2 130 × 0.826 107.38 (224.45)
3 130 × 0.751 97.63 (126.82)
4 130 × 0.683 88.79 (38.03)
5 130 × 0.621 80.73 42.70
Discounted payback occurs in year 5 and can be estimated as:
4 years plus 38.03/80.73 of year five = 4.47 years
NPV at 10% is given as $48,000 in the question. Since the NPV is positive the IRR must be higher. If we try discounting at 20%:
Year Cash flow $000
Discount factor Present value $000
0 (350) 1.000 (350) 1 50 0.833 42 2 110 0.694 76 3 130 0.579 75 4 150 0.482 72 5 100 0.402 40
NPV (45)
IRR = 10% + [48/(48 + 45) (20 – 10)%] = 15% (approx)
SUBJECT P2: ADVANCED MANAGEMENT ACCOUNTING
112
70 C
Investment J K L M N
$000 $000 $000 $000 $000
Initial investment 400 350 450 500 600
Net present value (NPV) 125 105 140 160 190
Profitability index (NPV per $ invested) 0.3125 0.30 0.3111 0.32 0.3166
Ranking 3 4 1 2
J would be chosen before L and, as they are mutually exclusive, L can be disregarded.
The optimum investment plan is $500,000 in M and the remaining $500,000 in N.
71 B
Project EV $000 Workings
L 500 (500 × 0.2) + (470 × 0.5) + (550 × 0.3) M 526 (400 × 0.2) + (550 × 0.5) + (570 × 0.3) N 432.5 (450 × 0.2) + (400 × 0.5) + (475 × 0.3) O 398 P 497.5
Project M will maximise expected cash.
72 1.5 years payback period.
Tutorial note
One of the advantages of the payback technique is that it uses cash flows, not subjective accounting profits. You must remember to add the non‐cash depreciation to your annual profits when calculating your yearly cash flows.
Depreciation is not a cash flow so needs to be added back to profit to calculate cash flows.
Depreciation on straight line basis = ($400,000 $50,000)/5 = $70,000 per year
Year Profit ($) Cash flow ($) Cumulative cash flow ($)
0 (400,000) (400,000)
1 175,000 245,000 (155,000)
2 225,000 295,000 140,000
Payback period = 1 + 155/295 years = 1.5 years to nearest 0.1 years
73 B
74 The present value of a $1 perpetuity is 1/r; The present value of the rental income is $80,000/0.08 = $1,000,000. Therefore, the NPV of the investment is $1,000,000 – $850,000 = $150,000.
ANSWERS TO OBJECTIVE TEST QUESTIONS : SECTION 2
113
75 HURON
A
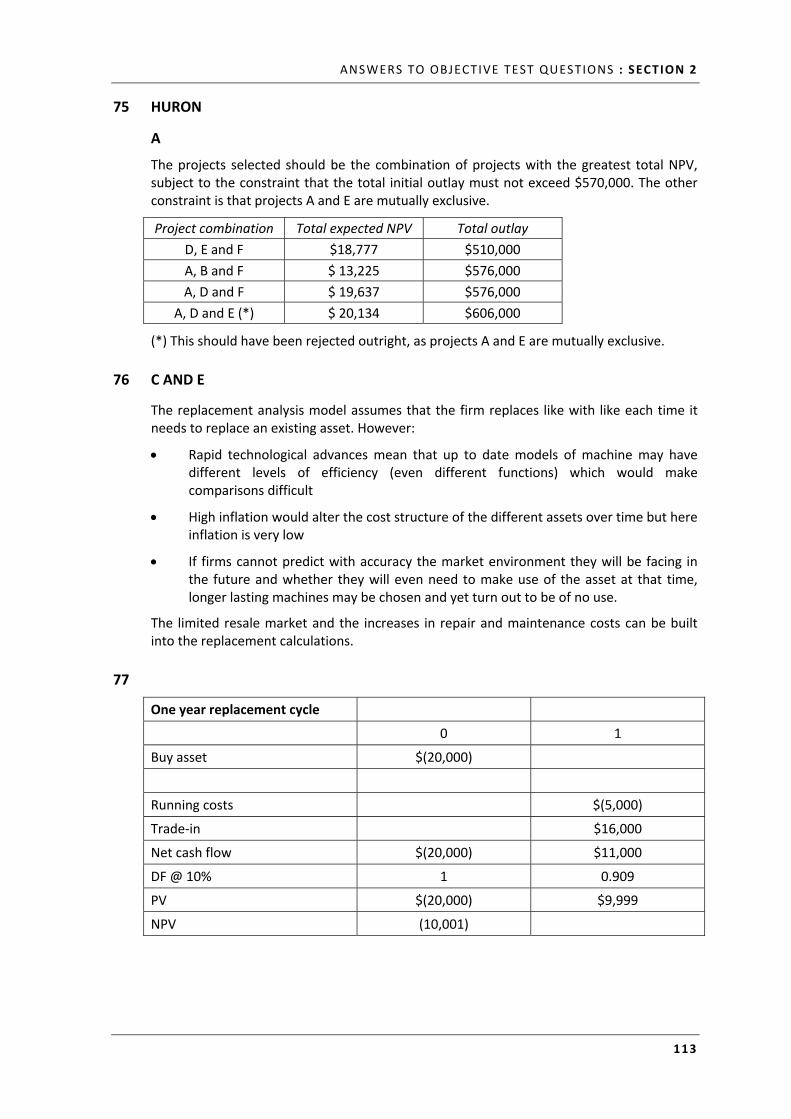
The projects selected should be the combination of projects with the greatest total NPV, subject to the constraint that the total initial outlay must not exceed $570,000. The other constraint is that projects A and E are mutually exclusive.
Project combination Total expected NPV Total outlay
D, E and F $18,777 $510,000
A, B and F $ 13,225 $576,000
A, D and F $ 19,637 $576,000
A, D and E (*) $ 20,134 $606,000
(*) This should have been rejected outright, as projects A and E are mutually exclusive.
76 C AND E
The replacement analysis model assumes that the firm replaces like with like each time it needs to replace an existing asset. However:
Rapid technological advances mean that up to date models of machine may have different levels of efficiency (even different functions) which would make comparisons difficult
High inflation would alter the cost structure of the different assets over time but here inflation is very low
If firms cannot predict with accuracy the market environment they will be facing in the future and whether they will even need to make use of the asset at that time, longer lasting machines may be chosen and yet turn out to be of no use.
The limited resale market and the increases in repair and maintenance costs can be built into the replacement calculations.
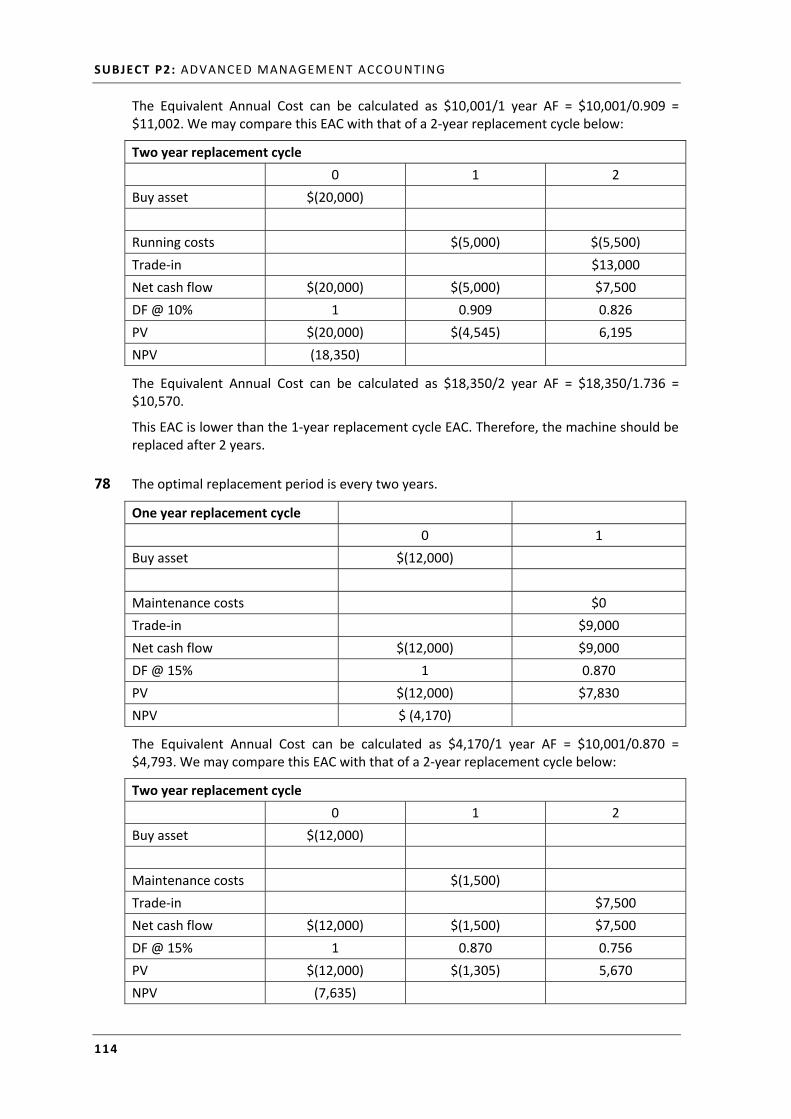
77
One year replacement cycle
0 1
Buy asset $(20,000)
Running costs $(5,000)
Trade‐in $16,000
Net cash flow $(20,000) $11,000
DF @ 10% 1 0.909
PV $(20,000) $9,999
NPV (10,001)
SUBJECT P2: ADVANCED MANAGEMENT ACCOUNTING
114
The Equivalent Annual Cost can be calculated as $10,001/1 year AF = $10,001/0.909 = $11,002. We may compare this EAC with that of a 2‐year replacement cycle below:
Two year replacement cycle
0 1 2
Buy asset $(20,000)
Running costs $(5,000) $(5,500)
Trade‐in $13,000
Net cash flow $(20,000) $(5,000) $7,500
DF @ 10% 1 0.909 0.826
PV $(20,000) $(4,545) 6,195
NPV (18,350)
The Equivalent Annual Cost can be calculated as $18,350/2 year AF = $18,350/1.736 = $10,570.
This EAC is lower than the 1‐year replacement cycle EAC. Therefore, the machine should be replaced after 2 years.
78 The optimal replacement period is every two years.
One year replacement cycle
0 1
Buy asset $(12,000)
Maintenance costs $0
Trade‐in $9,000
Net cash flow $(12,000) $9,000
DF @ 15% 1 0.870
PV $(12,000) $7,830
NPV $ (4,170)
The Equivalent Annual Cost can be calculated as $4,170/1 year AF = $10,001/0.870 = $4,793. We may compare this EAC with that of a 2‐year replacement cycle below:
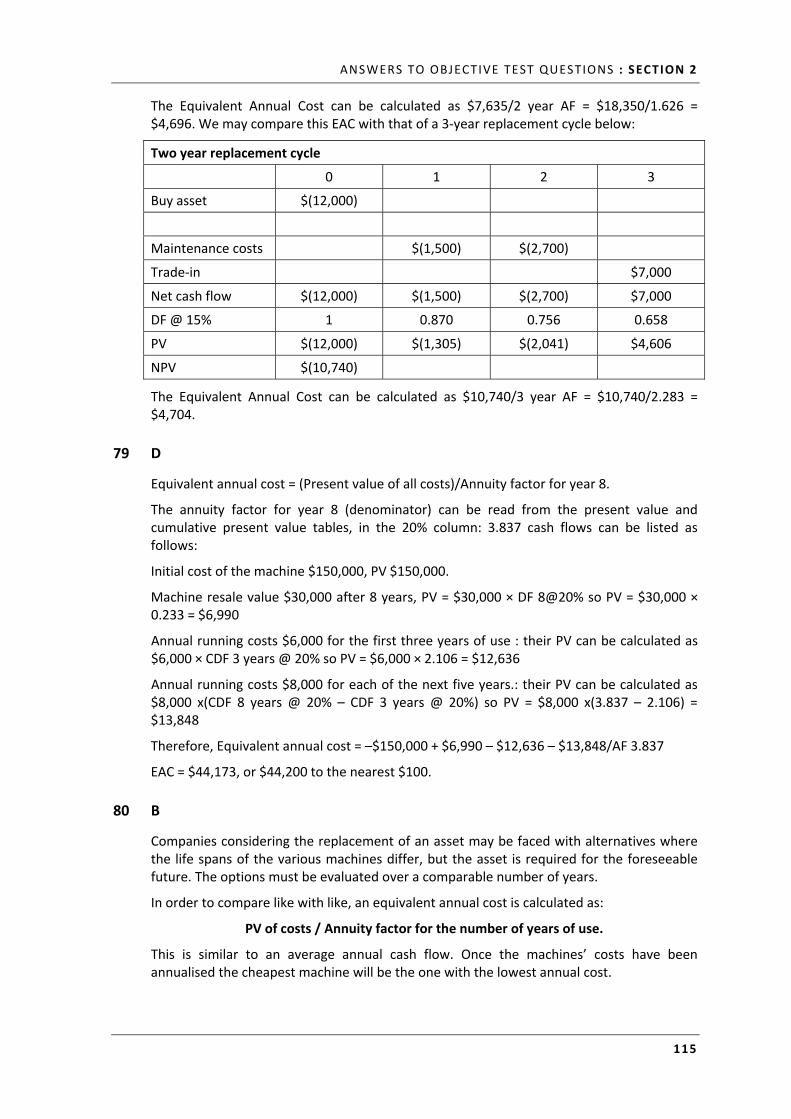
Two year replacement cycle
0 1 2
Buy asset $(12,000)
Maintenance costs $(1,500)
Trade‐in $7,500
Net cash flow $(12,000) $(1,500) $7,500
DF @ 15% 1 0.870 0.756
PV $(12,000) $(1,305) 5,670
NPV (7,635)
ANSWERS TO OBJECTIVE TEST QUESTIONS : SECTION 2
115
The Equivalent Annual Cost can be calculated as $7,635/2 year AF = $18,350/1.626 = $4,696. We may compare this EAC with that of a 3‐year replacement cycle below:
Two year replacement cycle
0 1 2 3
Buy asset $(12,000)
Maintenance costs $(1,500) $(2,700)
Trade‐in $7,000
Net cash flow $(12,000) $(1,500) $(2,700) $7,000
DF @ 15% 1 0.870 0.756 0.658
PV $(12,000) $(1,305) $(2,041) $4,606
NPV $(10,740)
The Equivalent Annual Cost can be calculated as $10,740/3 year AF = $10,740/2.283 = $4,704.
79 D
Equivalent annual cost = (Present value of all costs)/Annuity factor for year 8.
The annuity factor for year 8 (denominator) can be read from the present value and cumulative present value tables, in the 20% column: 3.837 cash flows can be listed as follows:
Initial cost of the machine $150,000, PV $150,000.
Machine resale value $30,000 after 8 years, PV = $30,000 × DF 8@20% so PV = $30,000 × 0.233 = $6,990
Annual running costs $6,000 for the first three years of use : their PV can be calculated as $6,000 × CDF 3 years @ 20% so PV = $6,000 × 2.106 = $12,636
Annual running costs $8,000 for each of the next five years.: their PV can be calculated as $8,000 x(CDF 8 years @ 20% – CDF 3 years @ 20%) so PV = $8,000 x(3.837 – 2.106) = $13,848
Therefore, Equivalent annual cost = –$150,000 + $6,990 – $12,636 – $13,848/AF 3.837
EAC = $44,173, or $44,200 to the nearest $100.
80 B
Companies considering the replacement of an asset may be faced with alternatives where the life spans of the various machines differ, but the asset is required for the foreseeable future. The options must be evaluated over a comparable number of years.
In order to compare like with like, an equivalent annual cost is calculated as:
PV of costs / Annuity factor for the number of years of use.
This is similar to an average annual cash flow. Once the machines’ costs have been annualised the cheapest machine will be the one with the lowest annual cost.
SUBJECT P2: ADVANCED MANAGEMENT ACCOUNTING
116
81 A
Depreciation must be added back to the annual profit figures to derive the annual cash flows. Annual depreciation = $(110,400 − 9,600)/4 years = $25,200
Adding $25,200 to each year's profit figure produces the following cash flows:
Cash flow $
Cumulative cash flows $
Initial investment (110,400) (110,400)
Year 1 64,800 (45,600)
Year 2 44,800 (800)
Year 3 47,600 43,800
Payback period = 2 years + (800/47,600) = 2.01 years
Tutorial note
If you selected a payback period of 3.89 years you based your calculations on the accounting profits after the deduction of depreciation. The calculation of the payback period should be based on cash flows.
Accounting rate of return (ARR)
Average profit = $(39,600 + 19,600 + 22,400 + 32,400)/4 = $28,500
Average investment = $(110,400 + 9,600)/2 = $60,000
ARR = $(28,500/60,000) × 100% = 47.5%
Tutorial note
If you selected an ARR of 25.8% you calculated the ARR using the opening investment rather than the average investment.
ANSWERS TO OBJECTIVE TEST QUESTIONS : SECTION 2
117
82 D
Net Present Value
Discount Present Year Cash flow factor value
$ 15% $
0 (12,000) 1.000 (12,000)
1 (4,800) 0.870 (4,176)
2 16,800 0.756 12,701
3 14,400 0.658 9,475
––––––
Net Present Value (NPV) 6,000
––––––
Tutorial note
If you selected an NPV of $4,440 you treated the $12,000 cash flow as occurring in year 1 and discounted it. Cash flows occurring ‘now’ should not be discounted.
Present Cumulative Year value (PV) PV
$ $ 0 (12,000) (12,000) 1 (4,176) (16,176) 2 12,701 (3,475) 3 9,475 6,000
DPP = 2 years + ((3,475/9,475) × 1 year) = 2.36 years
Tutorial note
If you selected 2.0 years you calculated the non‐discounted payback period.
83 D
For a standard project, where the IRR is greater than the company’s cost of capital, the project will have a positive NPV which means it will increase (rather than maintain) shareholders’ wealth (this is not the same thing as earning a profit – profit is an accounting term and does not reflect the impact on cash flows). The IRR indicates the actual return earned by a project and if it is higher than the company’s target rate (cost of capital) then it is worth undertaking. IRR gives no indication of speed of payback.
SUBJECT P2: ADVANCED MANAGEMENT ACCOUNTING
118
84 A
If money is invested in an account, it will earn interest. However, inflation will have the effect of reducing the value of the return. By deflating the future cash (money) we can find the real return required from the investment, i.e. the required return at today’s prices.
85 A
The calculation finds the IRR where a cash outflow is followed by annual cash inflows in perpetuity using the following equation:
The present value of an investment = (Annual cash inflow / discount rate) – Initial investment
Where the discount rate is the IRR, the present value of the investment is zero, leading to the following: 0 = (Annual cash inflow / IRR) – Initial investment
Initial investment = Annual cash inflow / IRR
IRR = Annual cash inflow / Initial investment
86 C
IRR is based on discounted cash flow principles. It therefore considers all of the cash flows in a project (A), does not include notional accounting costs such as depreciation (B) and it considers the time value of money (D). It is not an absolute measure of return, however, as IRR is expressed as a percentage. Two projects can have the same IRR, but very different cash flows.
87 A AND C
MIRR measures the economic yield of an investment under the assumption that any cash surpluses are reinvested at the firm’s current cost of capital.
MIRR, like IRR, cannot replace net present value as the principle evaluation technique although it does give a measure of the maximum cost of finance that the firm could sustain and allow the project to remain worthwhile.
It does offer some advantages over the standard IRR. Unlike IRR, there will only be one unique MIRR and it does give a measure of the return from a project.
However, the decision criterion requires knowledge of the company’s cost of capital as projects should be accepted only when the MIRR (project return) exceeds the company’s cost of capital. MIRR does not provide a measure of liquidity and risk, that is one of the advantages of using payback.
88 The first statement is not true and describes the IRR, not the MIRR; The MIRR measures the economic yield of an investment under the assumption that any cash surpluses are reinvested at the firm’s current cost of capital.
ANSWERS TO OBJECTIVE TEST QUESTIONS : SECTION 2
119
89 ONTARIO
D
T0 T1 T2 T3 T4
($22,500) $7,500 $7,500 $7,400 $7,300
DF @ 7% 1 0.935 0.873 0.816 0.763
PV of cash flows ($22,500) $7,009 $6,551 $6,041 $5,569
Present Value of cash flows from Year 1 to Year 4, or ‘PVR’ = $25,169.88
Present Value of the ‘Investment Phase’ of the project, or ‘PVI’ = $22,500
MIRR = [PVR/PVI]1/n × (1+re) –1, where re = the firm's cost of capital.
Here, MIRR = [$25,169.88/$22,500]1/4 × (1+7%) –1
MIRR = 10.04%
90 A
T0 T1 T2 T3 T4
($67,000) $20,000 $19,500 $19,000 $19,000
DF @ 9% 1 0.917 0.842 0.772 0.708
PV of cash flows ($67,000) $18,349 $16,413 $14,671 $13,460
Present Value of cash flows from Year 1 to Year 4, or ‘PVR’ = $62,892.95
Present Value of the ‘Investment Phase’ of the project, or ‘PVI’ = $67,000
MIRR = [PVR/PVI]1/n × (1+re) –1, where re = the firm's cost of capital.
Here, MIRR = [$62,892.95/$67,000]1/4 × (1+9%) –1
MIRR = 7.29%
91 A
T0 T1 T2 T3 T4
($120,000) $45,000 $35,000 $35,000 $30,000
DF @ 6% 1 0.943 0.890 0.840 0.792
PV of cash flows ($120,000) $42,453 $31,150 $29,387 $23,763
Present Value of cash flows from Year 1 to Year 4, or ‘PVR’ = $126,152.19
Present Value of the ‘Investment Phase’ of the project, or ‘PVI’ = $120,000
MIRR = [PVR/PVI]1/n × (1+re) –1, where re = the firm's cost of capital.
Here, MIRR = [$126,152.19/$120,000]1/4 × (1+6%) –1
MIRR = 7.46%
92 A
SUBJECT P2: ADVANCED MANAGEMENT ACCOUNTING
120
93 D
The company uses NPV to evaluate its projects and thus the fact that Project B has a higher IRR is not relevant. Additionally, one of the assumptions underlying NPV is that sufficient funds are available to undertake all profitable investments – the company can therefore appraise both projects on their own merits and does not need to reject Project A just because it is expected to perform less well than Project B. It is true that Project A will not increase shareholder wealth – but it will earn their required return of 10% and it should therefore be accepted.
94 $5,193.75
$ Salary costs: Senior consultant 75 hours × $45 3,375.00 Junior consultant 30 hours × $26 780.00 Marginal cost 4,155.00 Mark‐up (25%) 1,038.75 –––––––– Price to charge client 5,193.75 ––––––––
95 All items apply, except for the cost of making other unrelated products.
96 B, D AND E
A If demand is very elastic, high market share and a market presence could be achieved quickly by charging a low‐penetration pricing.
B Here market skimming would be more appropriate. A high price could be charged to the 'opinion leaders' who want to be seen to have the new product and are prepared to pay a high price.
C It is difficult to charge a low price for a product where there are few opportunities for economies of scale since cost per unit will still be high irrespective of production volume.
D If demand is inelastic, charging a low price will not have a beneficial effect upon sales volume and profit.
E If there is little competition and high barriers to entry, such as in the pharmaceutical industry, there is no incentive for companies to charge a low price.
97 B
At first inspection all four appear to be methods of arriving at selling price.
However, target costing is a method to arrive at the cost at which a product should be produced for having worked backwards from the price already set for the product.
It is a method to arrive at product cost not product selling price.
98 A
ANSWERS TO OBJECTIVE TEST QUESTIONS : SECTION 2
121
99 MALTOV
$70
To maximise profit Maltov must produce where MC = MR (MC is Marginal Cost, MR is Marginal Revenue)
MC = $20 MR = $120 – Q
So to maximise profit, $20 = $120 – Q
Therefore, Q = $100.
To calculate the price that must be sold, Price = $120 – 0.5 × quantity
So, Price = $120 – 0.5 × $100 = $120 – $50 = $70
100 C
$40,000
If components are purchased outside:
Contribution earned elsewhere $25,000
Variable cost saving $15,000
Maximum price to pay $40,000
101 C
The trust is discriminating on the grounds of market segment (segmenting using occupation).
102 Marginal cost (MC) = $14
Price (P) = $35 – 0.01q
Marginal Revenue (MR) = $35 – 0.02q
So if MC = MR then:
14 = 35 – 0.02q
0.02q = 21
Q = 1,050
Price = $35 – (0.01 × 1,050) = $24.50. ––––––––
103 $300.
To solve this, we have to derive an equation as follows:
P = price and let X = demand in units
Then
50p = 50,000 – X
p = 50
X000,50
p = 1,000 – 0.02X
We are told that the profit maximising level of sales is 35,000 units, so this is X.
Therefore,
p = 1,000 – 0.02 × 35,000 = 1,000 – 700 = $300
SUBJECT P2: ADVANCED MANAGEMENT ACCOUNTING
122
104 SAMSINGING LTD
The price to set which will maximise profit for 'Samsinging Ltd.' can be found by using a table to calculate the profit resulting for the given price and related sales volumes.
Table for sales levels per month
Sales quantity
(000 units) 50 100 150 200 250 300 350 400
Price per unit ($) 400 375 350 325 300 275 250 225
Revenue ($m) 20 37.5 52.5 65 75 82.5 87.5 90
–––– ––––– ––––– –––– –––– ––––– ––––– ––––
Variable production 240 240 240 240 240 210 210 210
cost per unit ($)
Variable production 12 24 36 48 60 63 73.5 84
costs ($m)
Fixed production 4 4 4 4 4 4.5 4.5 4.5
costs ($m)
Variable selling 35 35 35 40 40 40 40 40
cost per unit ($)
Variable selling 1.75 3.5 5.25 8 10 12 14 16
costs ($m) –––– ––––– ––––– –––– –––– ––––– ––––– ––––
Profit ($m) 2.25 6.0 7.25 5.0 1.0 3.0 (4.5) (14.5)
–––– ––––– ––––– –––– –––– ––––– ––––– ––––
The maximum profit is $7.25 million if 150,000 units are sold at a price of $350 per unit.
So the company should set a selling price of $350 per unit.
105 STALY PLC
Brompton price: Given that the price and volume of sales has been presented as a table, it makes sense to calculate the profit for each piece and quantity combination also using a tabular approach and then select the price at which the level of profit is maximised.
Brompton Ltd wishes to determine the price at which the new toy should be sold in order to maximise profit. A tabular approach can be used as follows:
Price ($) 5 10 15 20 25 30 35 40
Quantity of units (000) 200 180 160 135 120 100 75 50
Sales $000 1,000 1,800 2,400 2,700 3,000 3,000 2,625 2,000
Variable costs 1,200 1,080 960 810 720 600 450 300
($6 no. of units) $000
Fixed costs $000 450 450 450 400 400 400 400 400
–––– –––– –––– ––––– ––––– ––––– ––––– –––––
Profit/(Loss) (650) 270 990 1,490 1,880 2,000 1,775 1,300
–––– –––– –––– –––– ––––– ––––– ––––– –––––
Profit is maximised when the price is set at $30 per unit. This is therefore the price that should be set by Brompton Ltd.
In order for Electrics Ltd to maximise profit it should produce where MC = MR
Since Marginal Cost is the addition to cost of making one more unit, this will be the total variable cost of $600 per unit.
ANSWERS TO OBJECTIVE TEST QUESTIONS : SECTION 2
123
MR is given as MR = 2,000 – 0.02Q, So setting MC = MR gives 600 = 2,000 – 0.02Q
2,000 – 600 = 0.02Q
1,400 = 0.02Q
1,400/0.02 = Q
Therefore, Q = 70,000 units
So in order to maximise profit, Electrics Ltd should produce and sell 70,000 units per annum. The selling price should be:
P = 2,000 – 0.01Q
P = 2,000 – 0.01 × 70,000 = 2,000 – 700 = $1,300
So the selling price in order to maximise profit should be $1,300 per computer.
In order for Electrics Ltd to maximise revenue it should produce where MR = 0
That is, 2,000 – 0.02Q = 0
So 2,000 = 0.02Q
2,000/0.02 = Q
Q = 100,000 units
At a price of P = 2,000 – 0.01Q
P = 2,000 – 0.01 × 100,000
P = 2,000 – 1,000 = $1,000
In order to maximise revenue, Electrics Ltd should produce and sell 100,000 computers at a price of $1,000 per computer.
106 AVX LTD
$1,096.36
The marginal cost and selling price per batch are as follows:
Marginal cost = $672.72
Demand at price of $1,200 = 16 batches and demand increases by 1 unit for every $20 reduction in selling price.
Therefore, Price = $1,520 – 20q Marginal Revenue = $1,520 – 40q
Equating marginal cost and marginal revenue:
672.72 = 1,520 – 40q 40q = 847.28
q = 21.182 Price = $1,520 – (20 × 21.182) = $1,096.36 –––––––––
107 MtF
A
First find X using MC=MR. Marginal Cost is 25 and the Marginal Revenue function is found from MR =a‐2bX or MR=85–0.1X
MC=MR; 25=85‐0.1X Rearrange equation: 0.1X = 85 – 25; 0.1X = 60 so X = 60/0.1 = 600
Revert to demand function P = 85 – (0.05 × 600), so P = 85 – 30 i.e. P= 55
SUBJECT P2: ADVANCED MANAGEMENT ACCOUNTING
124
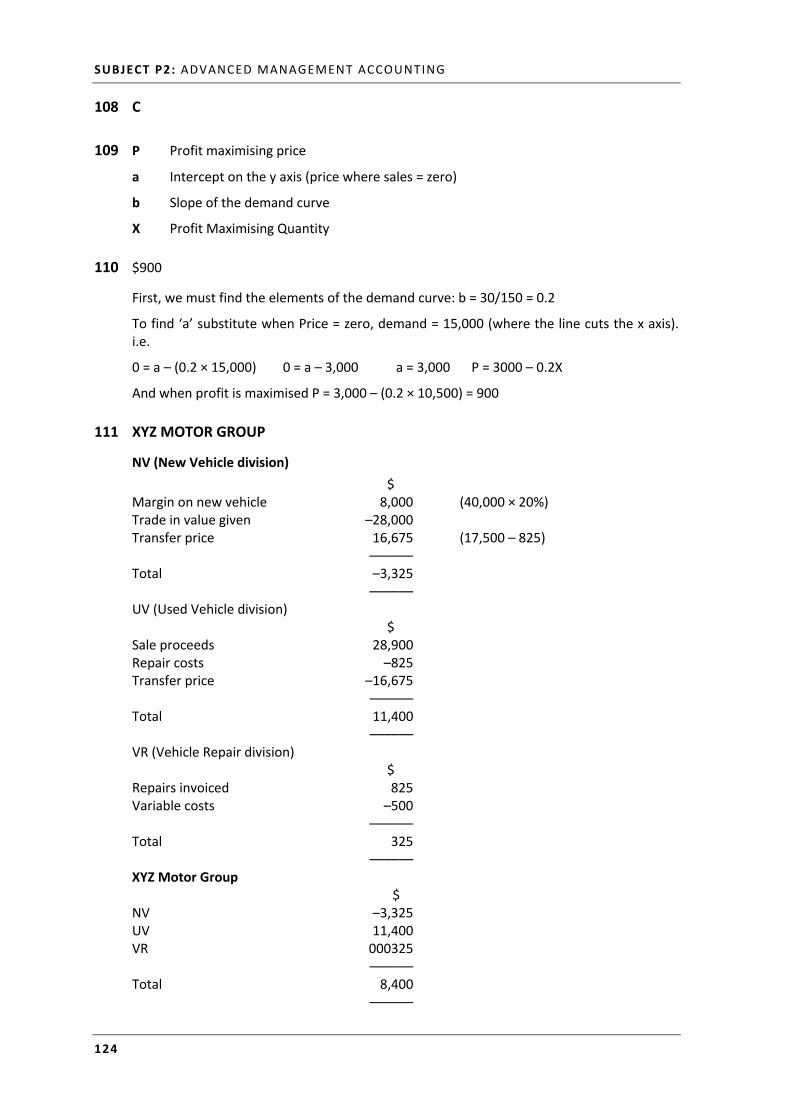
108 C
109 P Profit maximising price
a Intercept on the y axis (price where sales = zero)
b Slope of the demand curve
X Profit Maximising Quantity
110 $900
First, we must find the elements of the demand curve: b = 30/150 = 0.2
To find ‘a’ substitute when Price = zero, demand = 15,000 (where the line cuts the x axis). i.e.
0 = a – (0.2 × 15,000) 0 = a – 3,000 a = 3,000 P = 3000 – 0.2X
And when profit is maximised P = 3,000 – (0.2 × 10,500) = 900
111 XYZ MOTOR GROUP
NV (New Vehicle division)
$ Margin on new vehicle 8,000 (40,000 × 20%) Trade in value given –28,000 Transfer price 16,675 (17,500 – 825) –––––– Total –3,325 –––––– UV (Used Vehicle division) $ Sale proceeds 28,900 Repair costs –825 Transfer price –16,675 –––––– Total 11,400 –––––– VR (Vehicle Repair division) $ Repairs invoiced 825 Variable costs –500 –––––– Total 325 –––––– XYZ Motor Group $ NV –3,325 UV 11,400 VR 000325 –––––– Total 8,400 ––––––
ANSWERS TO OBJECTIVE TEST QUESTIONS : SECTION 2
125
C: MANAGING AND CONTROLLING THE PERFORMANCE OF ORGANISATIONAL UNITS
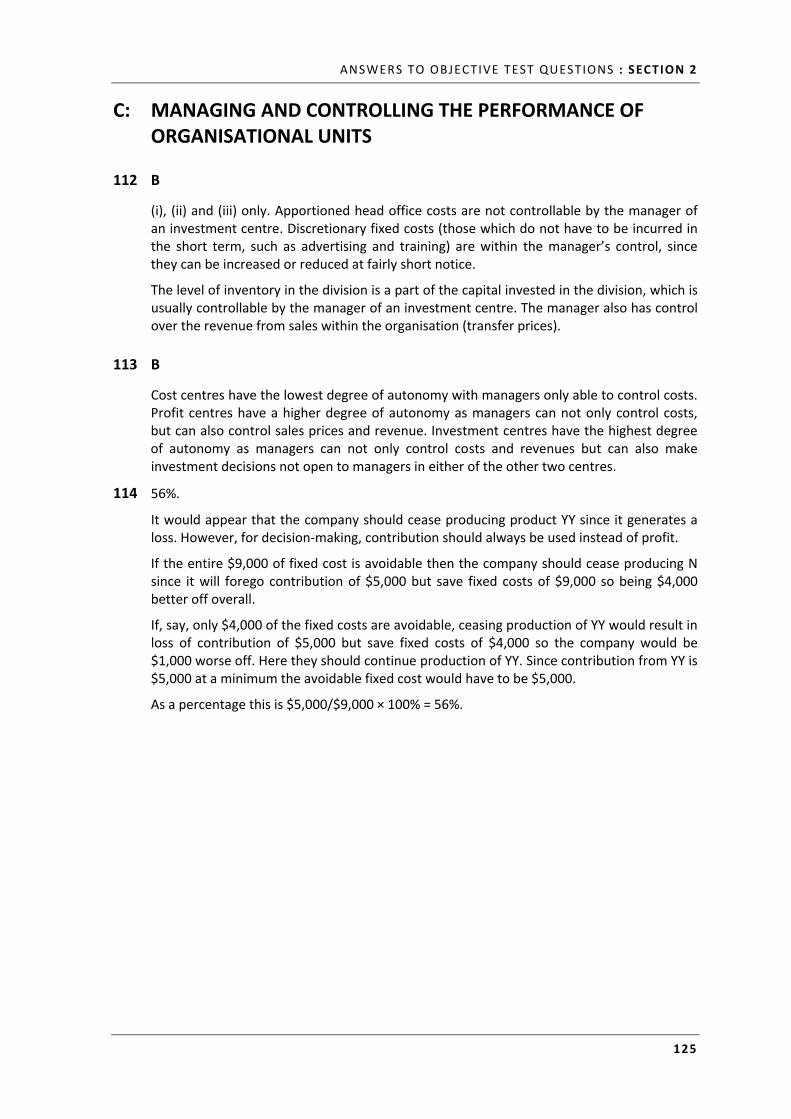
112 B
(i), (ii) and (iii) only. Apportioned head office costs are not controllable by the manager of an investment centre. Discretionary fixed costs (those which do not have to be incurred in the short term, such as advertising and training) are within the manager’s control, since they can be increased or reduced at fairly short notice.
The level of inventory in the division is a part of the capital invested in the division, which is usually controllable by the manager of an investment centre. The manager also has control over the revenue from sales within the organisation (transfer prices).
113 B
Cost centres have the lowest degree of autonomy with managers only able to control costs. Profit centres have a higher degree of autonomy as managers can not only control costs, but can also control sales prices and revenue. Investment centres have the highest degree of autonomy as managers can not only control costs and revenues but can also make investment decisions not open to managers in either of the other two centres.
114 56%.
It would appear that the company should cease producing product YY since it generates a loss. However, for decision‐making, contribution should always be used instead of profit.
If the entire $9,000 of fixed cost is avoidable then the company should cease producing N since it will forego contribution of $5,000 but save fixed costs of $9,000 so being $4,000 better off overall.
If, say, only $4,000 of the fixed costs are avoidable, ceasing production of YY would result in loss of contribution of $5,000 but save fixed costs of $4,000 so the company would be $1,000 worse off. Here they should continue production of YY. Since contribution from YY is $5,000 at a minimum the avoidable fixed cost would have to be $5,000.
As a percentage this is $5,000/$9,000 × 100% = 56%.
SUBJECT P2: ADVANCED MANAGEMENT ACCOUNTING
126
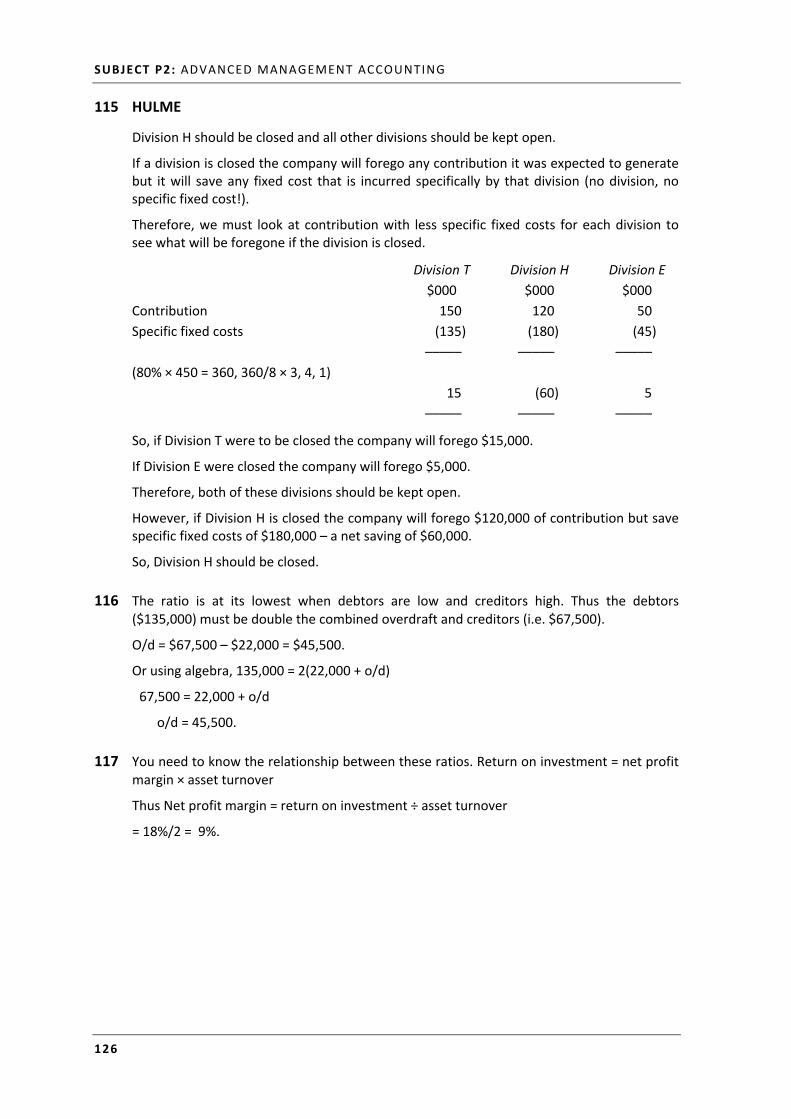
115 HULME
Division H should be closed and all other divisions should be kept open.
If a division is closed the company will forego any contribution it was expected to generate but it will save any fixed cost that is incurred specifically by that division (no division, no specific fixed cost!).
Therefore, we must look at contribution with less specific fixed costs for each division to see what will be foregone if the division is closed.
Division T Division H Division E
$000 $000 $000
Contribution 150 120 50
Specific fixed costs (135) (180) (45)
––––– ––––– –––––
(80% × 450 = 360, 360/8 × 3, 4, 1)
15 (60) 5
––––– ––––– –––––
So, if Division T were to be closed the company will forego $15,000.
If Division E were closed the company will forego $5,000.
Therefore, both of these divisions should be kept open.
However, if Division H is closed the company will forego $120,000 of contribution but save specific fixed costs of $180,000 – a net saving of $60,000.
So, Division H should be closed.
116 The ratio is at its lowest when debtors are low and creditors high. Thus the debtors ($135,000) must be double the combined overdraft and creditors (i.e. $67,500).
O/d = $67,500 – $22,000 = $45,500.
Or using algebra, 135,000 = 2(22,000 + o/d)
67,500 = 22,000 + o/d
o/d = 45,500.
117 You need to know the relationship between these ratios. Return on investment = net profit margin × asset turnover
Thus Net profit margin = return on investment ÷ asset turnover
= 18%/2 = 9%.
ANSWERS TO OBJECTIVE TEST QUESTIONS : SECTION 2
127
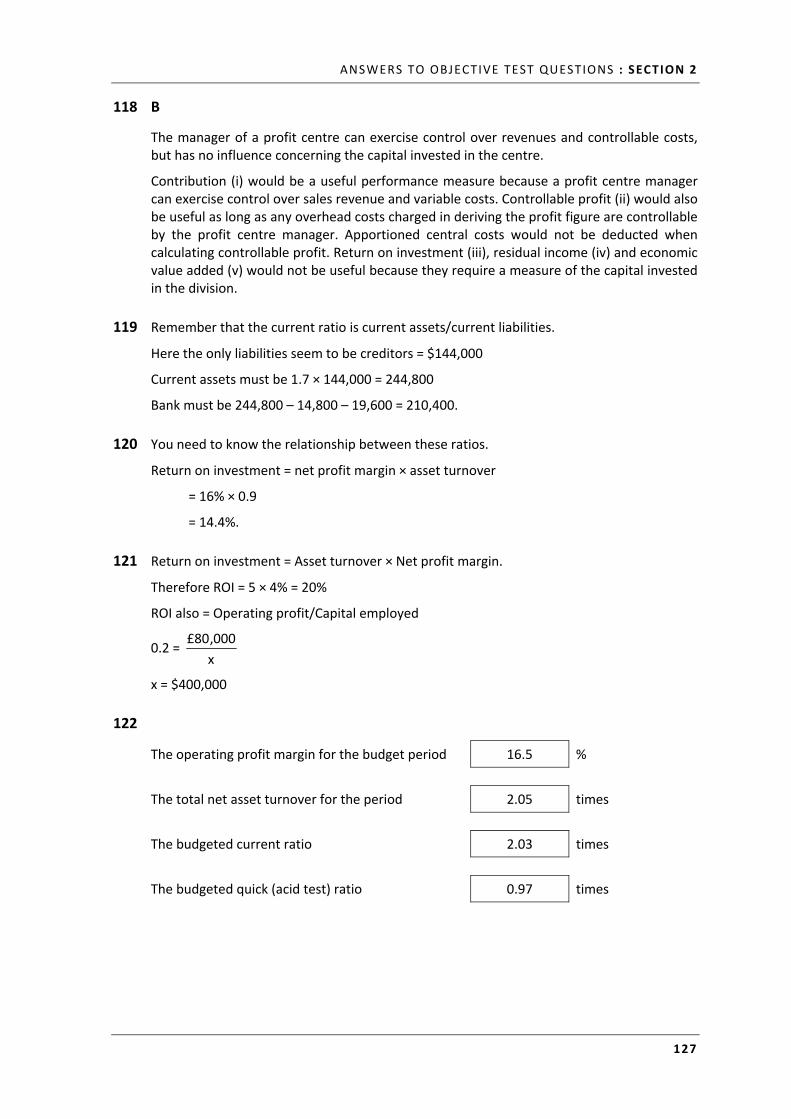
118 B
The manager of a profit centre can exercise control over revenues and controllable costs, but has no influence concerning the capital invested in the centre.
Contribution (i) would be a useful performance measure because a profit centre manager can exercise control over sales revenue and variable costs. Controllable profit (ii) would also be useful as long as any overhead costs charged in deriving the profit figure are controllable by the profit centre manager. Apportioned central costs would not be deducted when calculating controllable profit. Return on investment (iii), residual income (iv) and economic value added (v) would not be useful because they require a measure of the capital invested in the division.
119 Remember that the current ratio is current assets/current liabilities.
Here the only liabilities seem to be creditors = $144,000
Current assets must be 1.7 × 144,000 = 244,800
Bank must be 244,800 – 14,800 – 19,600 = 210,400.
120 You need to know the relationship between these ratios.
Return on investment = net profit margin × asset turnover
= 16% × 0.9
= 14.4%.
121 Return on investment = Asset turnover × Net profit margin.
Therefore ROI = 5 × 4% = 20%
ROI also = Operating profit/Capital employed
0.2 = x
000,80£
x = $400,000
122
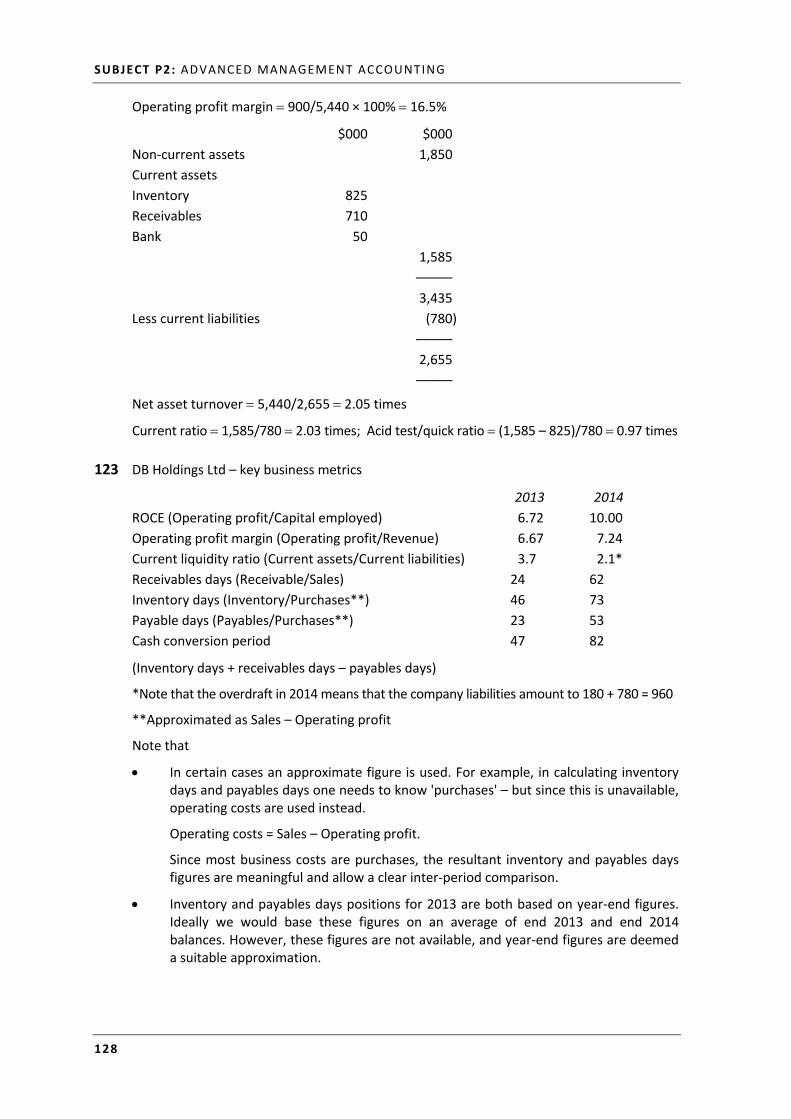
The operating profit margin for the budget period 16.5 %
The total net asset turnover for the period 2.05 times
The budgeted current ratio 2.03 times
The budgeted quick (acid test) ratio 0.97 times
SUBJECT P2: ADVANCED MANAGEMENT ACCOUNTING
128
Operating profit margin 900/5,440 × 100% 16.5%
$000 $000
Non‐current assets 1,850
Current assets
Inventory 825
Receivables 710
Bank 50
1,585
–––––
3,435
Less current liabilities (780)
–––––
2,655
–––––
Net asset turnover 5,440/2,655 2.05 times
Current ratio 1,585/780 2.03 times; Acid test/quick ratio (1,585 – 825)/780 0.97 times
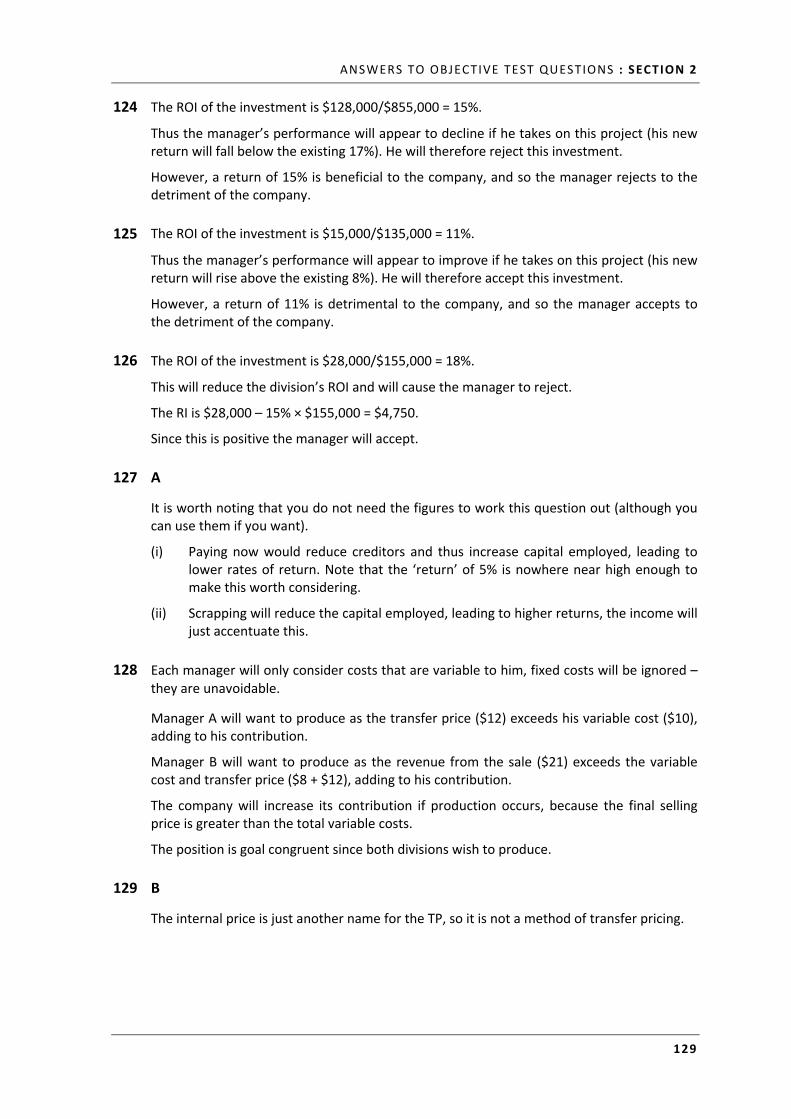
123 DB Holdings Ltd – key business metrics
2013 2014
ROCE (Operating profit/Capital employed) 6.72 10.00
Operating profit margin (Operating profit/Revenue) 6.67 7.24
Current liquidity ratio (Current assets/Current liabilities) 3.7 2.1*
Receivables days (Receivable/Sales) 24 62
Inventory days (Inventory/Purchases**) 46 73
Payable days (Payables/Purchases**) 23 53
Cash conversion period 47 82
(Inventory days + receivables days – payables days)
*Note that the overdraft in 2014 means that the company liabilities amount to 180 + 780 = 960
**Approximated as Sales – Operating profit
Note that
In certain cases an approximate figure is used. For example, in calculating inventory days and payables days one needs to know 'purchases' – but since this is unavailable, operating costs are used instead.
Operating costs = Sales – Operating profit.
Since most business costs are purchases, the resultant inventory and payables days figures are meaningful and allow a clear inter‐period comparison.
Inventory and payables days positions for 2013 are both based on year‐end figures. Ideally we would base these figures on an average of end 2013 and end 2014 balances. However, these figures are not available, and year‐end figures are deemed a suitable approximation.
ANSWERS TO OBJECTIVE TEST QUESTIONS : SECTION 2
129
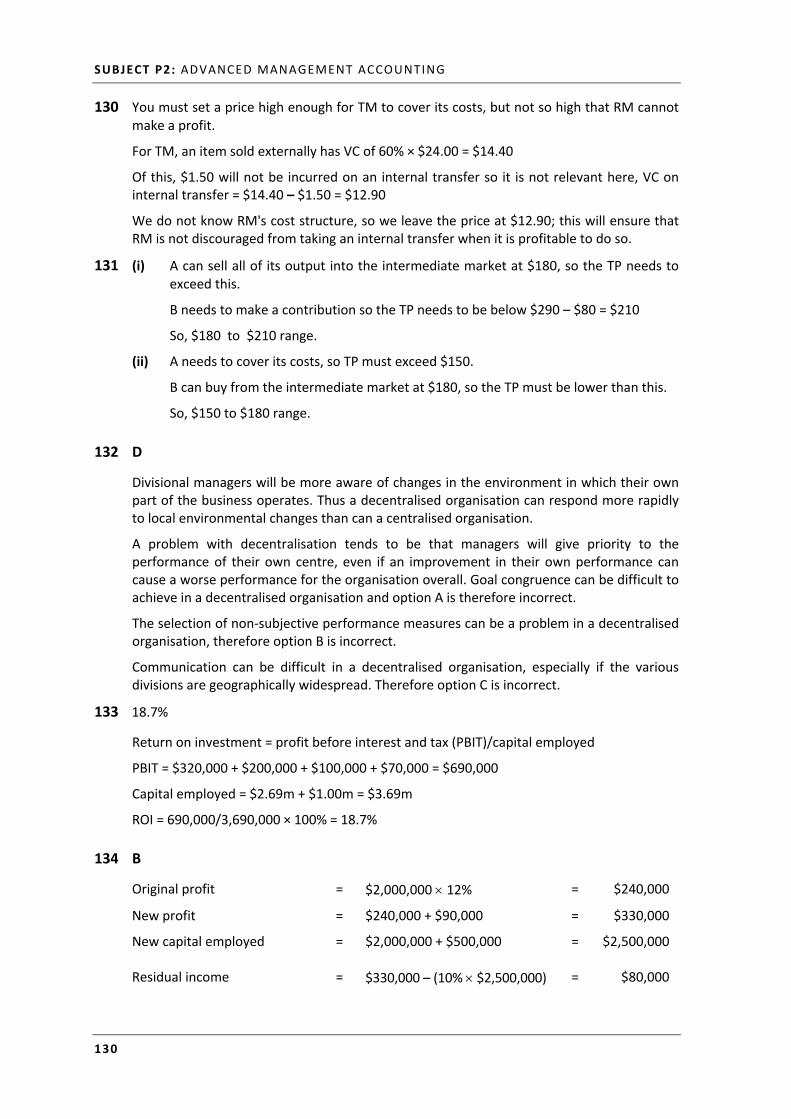
124 The ROI of the investment is $128,000/$855,000 = 15%.
Thus the manager’s performance will appear to decline if he takes on this project (his new return will fall below the existing 17%). He will therefore reject this investment.
However, a return of 15% is beneficial to the company, and so the manager rejects to the detriment of the company.
125 The ROI of the investment is $15,000/$135,000 = 11%.
Thus the manager’s performance will appear to improve if he takes on this project (his new return will rise above the existing 8%). He will therefore accept this investment.
However, a return of 11% is detrimental to the company, and so the manager accepts to the detriment of the company.
126 The ROI of the investment is $28,000/$155,000 = 18%.
This will reduce the division’s ROI and will cause the manager to reject.
The RI is $28,000 – 15% × $155,000 = $4,750.
Since this is positive the manager will accept.
127 A
It is worth noting that you do not need the figures to work this question out (although you can use them if you want).
(i) Paying now would reduce creditors and thus increase capital employed, leading to lower rates of return. Note that the ‘return’ of 5% is nowhere near high enough to make this worth considering.
(ii) Scrapping will reduce the capital employed, leading to higher returns, the income will just accentuate this.
128 Each manager will only consider costs that are variable to him, fixed costs will be ignored – they are unavoidable.
Manager A will want to produce as the transfer price ($12) exceeds his variable cost ($10), adding to his contribution.
Manager B will want to produce as the revenue from the sale ($21) exceeds the variable cost and transfer price ($8 + $12), adding to his contribution.
The company will increase its contribution if production occurs, because the final selling price is greater than the total variable costs.
The position is goal congruent since both divisions wish to produce.
129 B
The internal price is just another name for the TP, so it is not a method of transfer pricing.
SUBJECT P2: ADVANCED MANAGEMENT ACCOUNTING
130
130 You must set a price high enough for TM to cover its costs, but not so high that RM cannot make a profit.
For TM, an item sold externally has VC of 60% × $24.00 = $14.40
Of this, $1.50 will not be incurred on an internal transfer so it is not relevant here, VC on internal transfer = $14.40 – $1.50 = $12.90
We do not know RM's cost structure, so we leave the price at $12.90; this will ensure that RM is not discouraged from taking an internal transfer when it is profitable to do so.
131 (i) A can sell all of its output into the intermediate market at $180, so the TP needs to exceed this.
B needs to make a contribution so the TP needs to be below $290 – $80 = $210
So, $180 to $210 range.
(ii) A needs to cover its costs, so TP must exceed $150.
B can buy from the intermediate market at $180, so the TP must be lower than this.
So, $150 to $180 range.
132 D
Divisional managers will be more aware of changes in the environment in which their own part of the business operates. Thus a decentralised organisation can respond more rapidly to local environmental changes than can a centralised organisation.
A problem with decentralisation tends to be that managers will give priority to the performance of their own centre, even if an improvement in their own performance can cause a worse performance for the organisation overall. Goal congruence can be difficult to achieve in a decentralised organisation and option A is therefore incorrect.
The selection of non‐subjective performance measures can be a problem in a decentralised organisation, therefore option B is incorrect.
Communication can be difficult in a decentralised organisation, especially if the various divisions are geographically widespread. Therefore option C is incorrect.
133 18.7%
Return on investment = profit before interest and tax (PBIT)/capital employed
PBIT = $320,000 + $200,000 + $100,000 + $70,000 = $690,000
Capital employed = $2.69m + $1.00m = $3.69m
ROI = 690,000/3,690,000 × 100% = 18.7%
134 B
Original profit = $2,000,000 12% = $240,000
New profit = $240,000 + $90,000 = $330,000
New capital employed = $2,000,000 + $500,000 = $2,500,000
Residual income = $330,000 – (10% $2,500,000) = $80,000
ANSWERS TO OBJECTIVE TEST QUESTIONS : SECTION 2
131
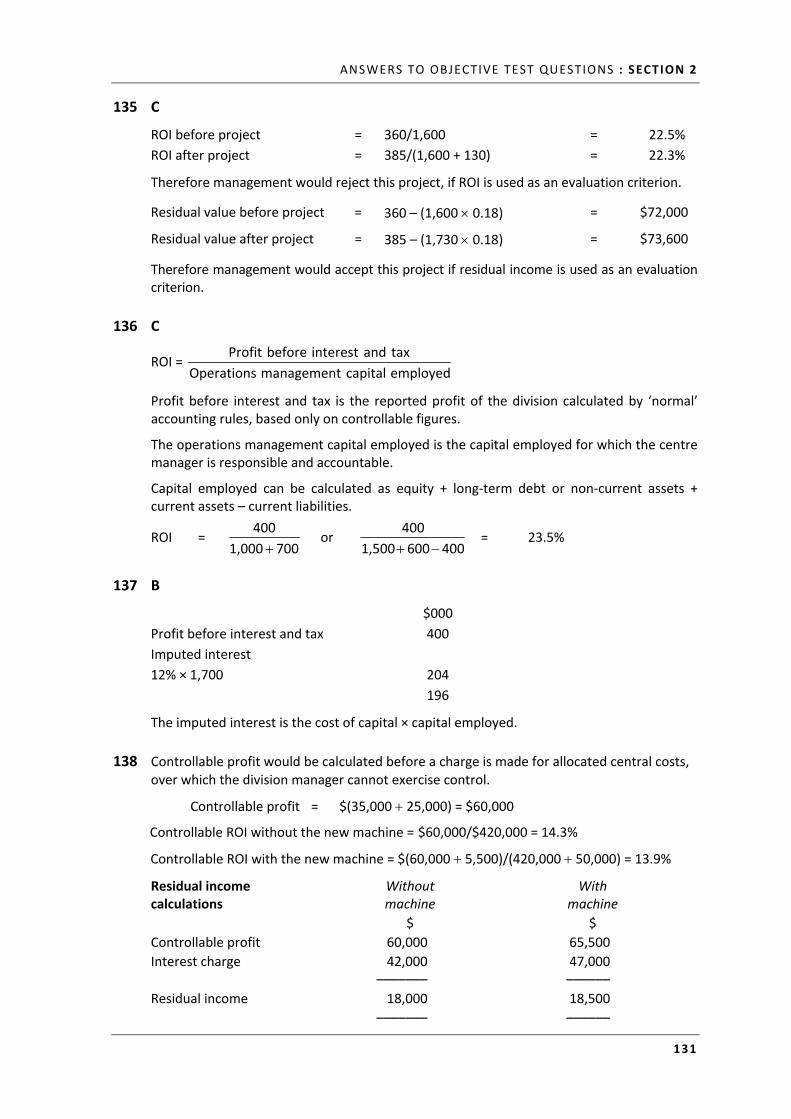
135 C
ROI before project = 360/1,600 = 22.5%
ROI after project = 385/(1,600 + 130) = 22.3%
Therefore management would reject this project, if ROI is used as an evaluation criterion.
Residual value before project = 360 – (1,600 0.18) = $72,000
Residual value after project = 385 – (1,730 0.18) = $73,600
Therefore management would accept this project if residual income is used as an evaluation criterion.
136 C
ROI = employed capital management Operations
tax and interest before Profit
Profit before interest and tax is the reported profit of the division calculated by ‘normal’ accounting rules, based only on controllable figures.
The operations management capital employed is the capital employed for which the centre manager is responsible and accountable.
Capital employed can be calculated as equity + long‐term debt or non‐current assets + current assets – current liabilities.
ROI = 700 1,000
400
or
400 600 1,500
400
= 23.5%
137 B
$000
Profit before interest and tax 400
Imputed interest
12% × 1,700 204
196
The imputed interest is the cost of capital × capital employed.
138 Controllable profit would be calculated before a charge is made for allocated central costs, over which the division manager cannot exercise control.
Controllable profit = $(35,000 25,000) = $60,000
Controllable ROI without the new machine = $60,000/$420,000 = 14.3%
Controllable ROI with the new machine = $(60,000 5,500)/(420,000 50,000) = 13.9%
Residual income calculations
Without machine
With machine
$ $
Controllable profit 60,000 65,500
Interest charge 42,000 47,000 ––––––– ––––––
Residual income 18,000 18,500
––––––– ––––––
SUBJECT P2: ADVANCED MANAGEMENT ACCOUNTING
132
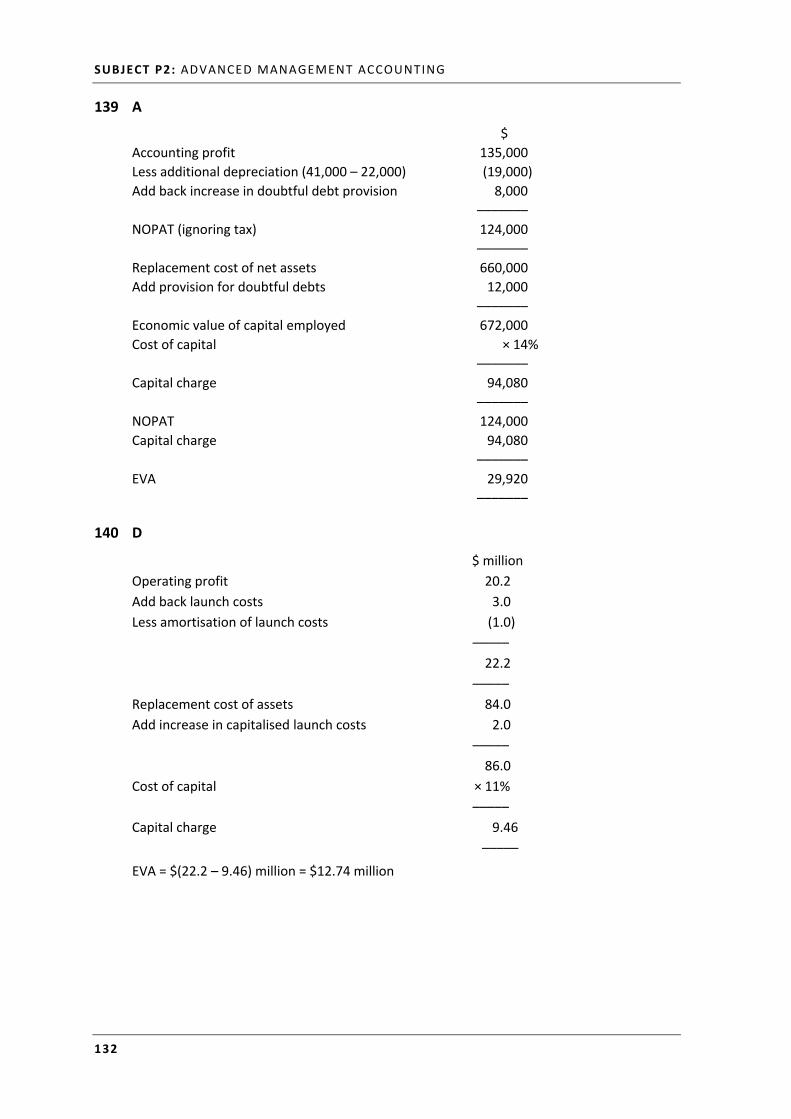
139 A
$
Accounting profit 135,000
Less additional depreciation (41,000 – 22,000) (19,000)
Add back increase in doubtful debt provision 8,000
–––––––
NOPAT (ignoring tax) 124,000
–––––––
Replacement cost of net assets 660,000
Add provision for doubtful debts 12,000
–––––––
Economic value of capital employed 672,000
Cost of capital × 14%
–––––––
Capital charge 94,080
–––––––
NOPAT 124,000
Capital charge 94,080
–––––––
EVA 29,920
–––––––
140 D
$ million
Operating profit 20.2
Add back launch costs 3.0
Less amortisation of launch costs (1.0)
–––––
22.2
–––––
Replacement cost of assets 84.0
Add increase in capitalised launch costs 2.0
–––––
86.0
Cost of capital × 11%
–––––
Capital charge 9.46
–––––
EVA = $(22.2 – 9.46) million = $12.74 million
ANSWERS TO OBJECTIVE TEST QUESTIONS : SECTION 2
133
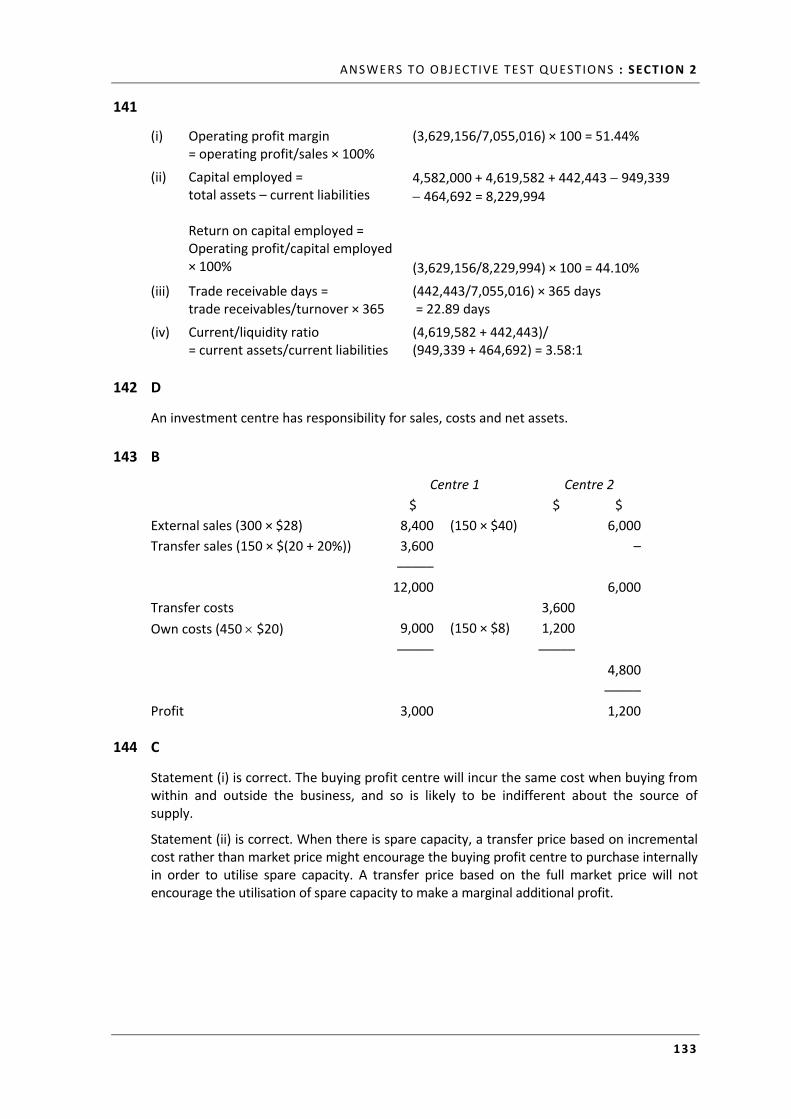
141
(i) Operating profit margin = operating profit/sales × 100%
(3,629,156/7,055,016) × 100 = 51.44%
(ii) Capital employed = total assets – current liabilities Return on capital employed = Operating profit/capital employed × 100%
4,582,000 + 4,619,582 + 442,443 949,339 464,692 = 8,229,994 (3,629,156/8,229,994) × 100 = 44.10%
(iii) Trade receivable days = trade receivables/turnover × 365
(442,443/7,055,016) × 365 days = 22.89 days
(iv) Current/liquidity ratio = current assets/current liabilities
(4,619,582 + 442,443)/ (949,339 + 464,692) = 3.58:1
142 D
An investment centre has responsibility for sales, costs and net assets.
143 B
Centre 1 Centre 2
$ $ $
External sales (300 × $28) 8,400 (150 × $40) 6,000
Transfer sales (150 × $(20 + 20%)) 3,600 –
–––––
12,000 6,000
Transfer costs 3,600
Own costs (450 $20) 9,000 (150 × $8) 1,200
––––– –––––
4,800
–––––
Profit 3,000 1,200
144 C
Statement (i) is correct. The buying profit centre will incur the same cost when buying from within and outside the business, and so is likely to be indifferent about the source of supply.
Statement (ii) is correct. When there is spare capacity, a transfer price based on incremental cost rather than market price might encourage the buying profit centre to purchase internally in order to utilise spare capacity. A transfer price based on the full market price will not encourage the utilisation of spare capacity to make a marginal additional profit.
SUBJECT P2: ADVANCED MANAGEMENT ACCOUNTING
134
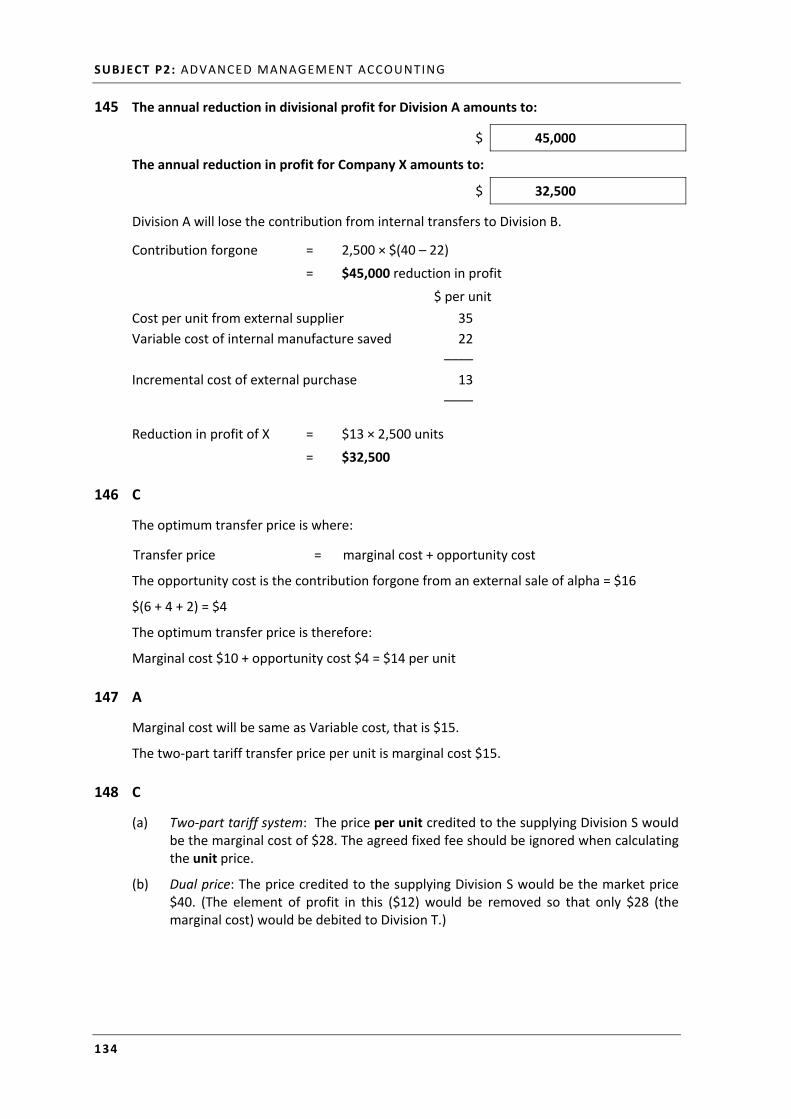
145 The annual reduction in divisional profit for Division A amounts to:
$ 45,000
The annual reduction in profit for Company X amounts to:
$ 32,500
Division A will lose the contribution from internal transfers to Division B.
Contribution forgone = 2,500 × $(40 – 22)
= $45,000 reduction in profit
$ per unit
Cost per unit from external supplier 35
Variable cost of internal manufacture saved 22
––––
Incremental cost of external purchase 13
––––
Reduction in profit of X = $13 × 2,500 units
= $32,500
146 C
The optimum transfer price is where:
Transfer price = marginal cost + opportunity cost
The opportunity cost is the contribution forgone from an external sale of alpha = $16
$(6 + 4 + 2) = $4
The optimum transfer price is therefore:
Marginal cost $10 + opportunity cost $4 = $14 per unit
147 A
Marginal cost will be same as Variable cost, that is $15.
The two‐part tariff transfer price per unit is marginal cost $15.
148 C
(a) Two‐part tariff system: The price per unit credited to the supplying Division S would be the marginal cost of $28. The agreed fixed fee should be ignored when calculating the unit price.
(b) Dual price: The price credited to the supplying Division S would be the market price $40. (The element of profit in this ($12) would be removed so that only $28 (the marginal cost) would be debited to Division T.)
ANSWERS TO OBJECTIVE TEST QUESTIONS : SECTION 2
135
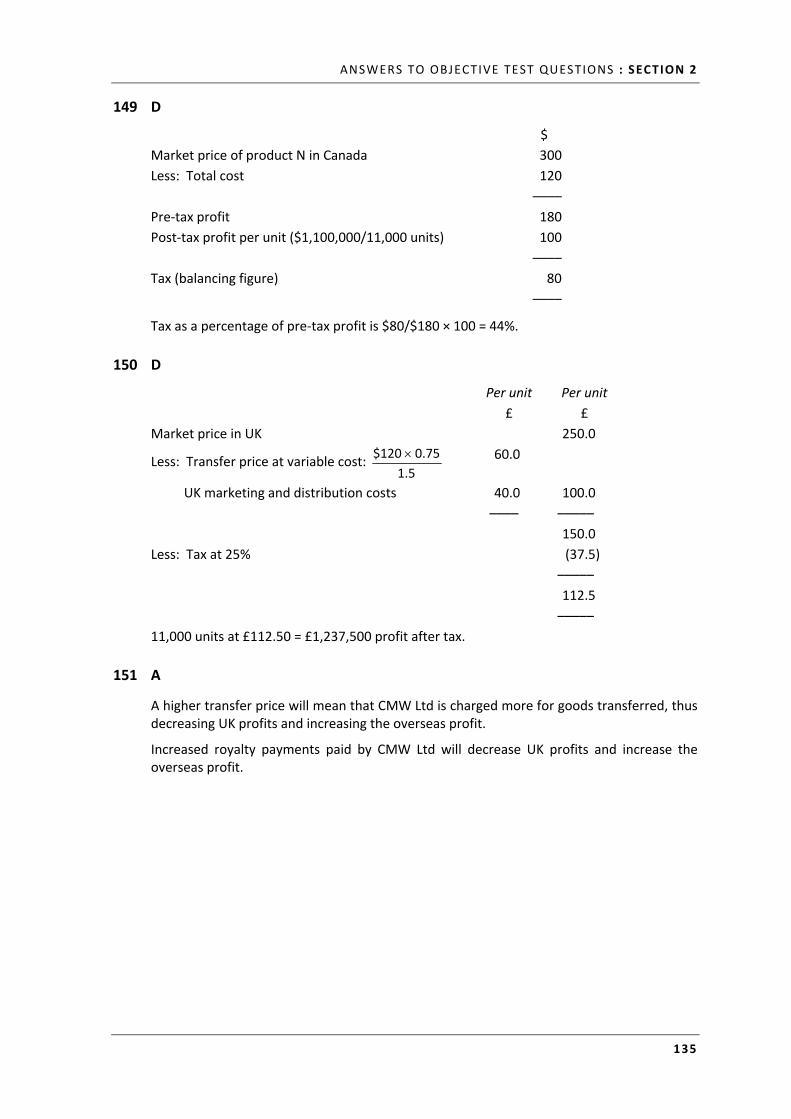
149 D
$
Market price of product N in Canada 300
Less: Total cost 120
––––
Pre‐tax profit 180
Post‐tax profit per unit ($1,100,000/11,000 units) 100
––––
Tax (balancing figure) 80
––––
Tax as a percentage of pre‐tax profit is $80/$180 × 100 = 44%.
150 D
Per unit Per unit
£ £
Market price in UK 250.0
Less: Transfer price at variable cost: 1.5
0.75$120 60.0
UK marketing and distribution costs 40.0 100.0
–––– –––––
150.0
Less: Tax at 25% (37.5)
–––––
112.5
–––––
11,000 units at £112.50 = £1,237,500 profit after tax.
151 A
A higher transfer price will mean that CMW Ltd is charged more for goods transferred, thus decreasing UK profits and increasing the overseas profit.
Increased royalty payments paid by CMW Ltd will decrease UK profits and increase the overseas profit.
SUBJECT P2: ADVANCED MANAGEMENT ACCOUNTING
136
152 (i) Loss is $1,000,000:
Marginal (variable) cost = 70 + 20 + 10 = $100
External selling price = 150 × 1.3333 = $200
Sales $000 Internal 60,000 × $100 6,000
External 40,000 × $200 8,000
––––––
14,000
Variable cost 100,000 × $100 10,000
––––––
Contribution 4,000
Fixed costs
Production 100,000 × $40 4,000
Administration 100,000 × $10 1,000
––––––
Loss (1,000)
––––––
(ii) Profit is $1,400,000.
The total production cost = $140 (not $150 as this includes selling and administration overhead). This means that sales revenue increases by $40 × 60,000 = $2,400,000 and costs stay the same. Profit is now (1,000,000) + 2,400,000 = $1,400,000.
153 The level of sales that would maximise the profit from this service for the Legal Division is 2,000 hours and its contribution would be $30,000.
The level of sales that would maximise the profit from L&S for the KL Company as a whole is 3,000 hours and the contribution would be $75,000.
We are trying to maximise the profit from the service from the Legal Division’s point of view. As far as the Legal Division is concerned its variable costs are $65 ($25 + $40).
Hours sold Price per hour Variable cost per hour
Contribution per hour
Total contribution
0 100 65 35 0
1,000 90 65 25 25,000
2,000 80 65 15 30,000
3,000 70 65 5 15,000
4,000 60 65 (5) (20,000)
5,000 50 65 (15) (75,000)
The level of sales that would maximise the contribution for the Legal Division is 2,000 hours and its contribution would be $30,000.
ANSWERS TO OBJECTIVE TEST QUESTIONS : SECTION 2
137
We are trying to maximise the profit from the service from the group point of view. As far as the group is concerned the variable cost of the service is $45 ($20 + $25).
Hours sold Price per hour Variable cost per hour
Contribution per hour
Total contribution
0 100 45 55 0
1,000 90 45 45 45,000
2,000 80 45 35 70,000
3,000 70 45 25 75,000
4,000 60 45 15 60,000
5,000 50 45 5 25,000
The level of sales that would maximise the contribution for the whole company is 3,000 hours and the contribution would be $75,000.
This answer assumes that the Secretarial Division has spare capacity.
154 A
ROI = Net income/Net assets = 300,000/6,750,000 × 100% = 4.44%
155 D
$300,000 – 13% × $6,750,000 = ($577,000)
156 A
EVA = NOPAT – Economic value of assets × Cost of capital
NOPAT $m
Operating profit 89.2
Add back development costs +9.6
Less amortisation of development costs –3.2
Add back accounting depreciation +24
Less economic depreciation –33.6
–––––
86
–––––
Economic value of assets $m
Replacement cost of assets 168
Less economic depreciation –33.6
Add net increase in development costs +6.4
Add working capital +27.2
168
EVA = 86 – 13% × 168 = $64.16m
SUBJECT P2: ADVANCED MANAGEMENT ACCOUNTING
138
157 The post‐tax profit for X is $483,000 and the post‐tax profit for Y is $669,200.
The variable cost of the component = $600 × 0.6 = $360
Transfer price = $360 × 1.7 = $612
$000 X Y
Sales: External (W1) 8,000 14,400
Internal (W2) 7,344
––––––
15,344 14,400
Variable cost (W3) (7,920) (12,144)
Fixed production cost (W4) (5,280)
Fixed non‐production cost (1,500) (1,300)
–––––– ––––––––
Profit before tax 644 956
Tax (161) (286.8)
–––––– ––––––––
Profit after tax 483 669.2
Workings
(W1) $800 × 10,000 = $8,000,000
$1,200 × 12,000 = $14,400,000
(W2) 12,000 × $612 = $7,344,000
(W3) $360 × 22,000 = $7,920,000
Variable cost for product W = $400 + $612 = $1,012 per unit
$1,012 × 12,000 = $12,144,000
(W4) $240 × 22,000 = $5,280,000
158 The two correct statements are Option 2 ‘It is commonly used and understood’ and option 6 ‘It can be used to compare projects of different sizes’.
Option 1 is not correct – it is a percentage not an absolute value. Option 3 is not correct – profits are subjective not objective, depending on the accounting policies used. Option 4 is not correct – it is not linked to the overall company cost of capital, so can give non goal congruent decisions and option 5 is not correct– it uses profits, which can be manipulated to change the ROI.
159 The answer is 10.25%. We need to add back the non‐controllable head office depreciation and the non‐controllable financing costs but not the controllable depreciation on X's assets to get the profit figure.
160 Only statement (iv) is correct.
Statement (i) is not correct: projects with a positive NPV should always be accepted (ignoring risk); Statement (ii) is not correct ; profit centres will not be in control of their investment of capital so shouldn’t be evaluated on its use; Statement (iii) is not correct: Tax is not controllable so shouldn’t be included in the calculation of ROI.
ANSWERS TO OBJECTIVE TEST QUESTIONS : SECTION 2
139
161 D
Project ROI: Average annual profits = revenue – variable costs – depreciation
Revenue = $20,000*12 = $240,000
Variable costs = $5,000*12 = $60,000
Depreciation = ($600,000 – $100,000)/5 = $100,000
Annual profit = $240,000 – $60,000 – $100,000 = $80,000
Initial investment less 1 year’s depreciation = $600,000 – $100,000 = $500,000
ROI = $80,000/$500,000*100 = 16%
Dilutes the existing ROI so would not be accepted.
ROI is not related to cost of capital for evaluation. Plus the cost of capital isn’t given, so we couldn’t evaluate on that basis.
Evaluating the ROI without the depreciation figure (i.e. using cash flows instead of profits) would give an answer of 36% (or 30% if depreciation isn’t deducted from capital to get NBV) which is incorrect as we need to use profits, not cash flows.
162 22%
Profits = annual cash flows – depreciation
Here, depreciation = ($50,000 – $5,000)/5 years = $9,000 per annum.
Annual profits = $20,000 – $9,000 = $11,000
ROI = Annual profits / Capital employed
ROI = ($11,000 / $50,000) × 100%
ROI = 22%
Tutorial note
Note that we assume that the ‘Capital Employed’ at the start of the year (i.e. before depreciation is deducted) is the one that was used to generate the profits at the end of the year. Therefore, the opening capital employed is generally used in OT calculations, unless the question directs you otherwise.
163 Options ‘A’ and ‘D’ are correct. Profits are subjective rather than objective (as they depend on the accounting policies used) and can be manipulated. As an absolute measure, Residual Income can’t be used to compare different sized investments.
SUBJECT P2: ADVANCED MANAGEMENT ACCOUNTING
140
164 B
Current profit can be calculated as 0.2 × $1.2 m = $240,000
Current profit + Project A (highest ROI > 20%): ROI = (240 + 100)/(1,200 + 300) = 22.66%
Current profit + Projects A and B (ROI > 22.66%):
ROI = (240 + 100 + 210)/(1,200 + 300 + 700) = 25%
Current profit + Projects A, B and C (ROI > 25%):
ROI = (240 + 100 + 210 + 130)/(1,200 + 300 + 700 + 500) = 25.2%, so we shouldn’t add D as ROI < 25.2%
165 C
166 B
Net monthly cash = $7,500 – $4,900 = $2,600
Net annual cash flow = $2,600 × 12 months = $31,200
Annual depreciation = ($100,000 – $10,000)/5 years = $18,000
Annual profit = $31,200 – $18,000 = $13,200
Notional interest charge = $100,000 × 12% = $12,000
Residual income = $13,200 – $12,000 = $1,200
RI is positive so accept.
Bonus is based on RI so irrelevant whether project makes profit or not. ROI is irrelevant.
167 Statements (i) and (iv) apply.
Statements (ii) and (iii) do not apply: ROI does not relate profitability to the cost of capital, and RI is an absolute measure so is distorted by divisional size.
168 The answer is $250,000.
Controllable profits amount to $650,000. Admin recharge and depreciation are not controllable, so we must exclude them. Controllable capital employed $2,000,000; the allocated floor in head office is not a controllable asset, so is excluded.
Controllable RI = $650,000 – ($2,000,000*0.2) = $250,000.
169 C
Project A
incremental contribution $20,000
incremental depreciation $12,500
incremental profit $7,500
project RI = $7,500 – $50,000*13% = $1,000. RI is positive so accept.
ANSWERS TO OBJECTIVE TEST QUESTIONS : SECTION 2
141
Project B
incremental contribution $200,000
incremental depreciation $30,000
incremental profit $170,000
project RI = $170,000 – $1,500,000*13% = $–25,000. RI is negative so reject.
170 B
171 The balanced scorecard approach is a way of providing information to management which involves the inclusion of non‐financial information alongside financial information.
It emphasises the need to provide the user with a set of information which addresses all relevant areas of performance in an objective and unbiased fashion.
Although the specific measures used may vary, a scorecard would normally include the following measures
profitability – the financial perspective
customer satisfaction – the customer perspective
innovation – the innovation and learning perspective
internal efficiency – the internal business perspective.
By providing all this information in a single report, management is able to assess the impact of particular actions on all perspectives of the company’s activities. Under each perspective, a company should state its aims and specify measures of performance.
For example:
Aims Measure
1 Financial perspective Survival Current ratio
2 Customer perspective Satisfaction Returning customers
3 Internal business perspective Efficiency Throughput rates
4 Innovation and learning New products Income from new products
172 C
173 Statement (ii) only is true: the RI will increase, because the additional imputed interest charge will be lower than the additional profit generated.
Statement (i) is false, as the ROI and Residual Income might be used as one of the measures within the financial perspective. Statement (iii) is also false, as the internal business perspective monitors what the business must be good at in order to succeed, for example, the average setup time or the speed with which interdepartmental queries are handled. Statement (iv) is false as a disadvantage of residual income is that it does not facilitate comparisons between investment centres. The same absolute value of RI might be earned by two investment centres but it is much easier for a larger investment centre to generate a given level of RI than it is for a smaller investment centre.
SUBJECT P2: ADVANCED MANAGEMENT ACCOUNTING
142
174 C
For every unit of Product B not sold internally, Division A would sell an equally profitable Product A externally, so there would be no change in the profits of Division A. The company as a whole would gain ($176 – $140) = $36 per unit on every unit of product A and pay ($152 – $140) = $12 per unit more on every unit of Product B, so gains overall.
175 U PLC
B
To get a constant ROI, both profits and capital should be constant. Reducing balance depreciation would increase profits over the life. Net book value would decrease the capital figure.
176 MCG PLC
All statements apply.
177 C
Value for money relates to economy (value for money on inputs to the organisation), efficiency (vfm on converting inputs to outputs) and effectiveness (vfm on the outputs). Economy relates to keeping costs down without sacrificing quality, efficiency is about effective resource utilisation (such as decreasing waste levels) and effectiveness relates to the overall objectives of the organisation being achieved.
ANSWERS TO OBJECTIVE TEST QUESTIONS : SECTION 2
143
D: RISK AND CONTROL
178
Statements True False
Only risk seekers will invest in risky projects.
If an investment has a 60% chance of earning $100 and a 40% chance of losing $20, a risk neutral investor would be willing to pay $52 to make that investment.
If an investment has a 60% chance of earning $100 and a 40% chance of losing $20, a risk averse investor would be willing to pay $52 to make that investment.
179 B
Inventing a simple project which fulfils the criteria, for example t0 (1,000), t1 1,100; and revising the t1 cash flow to include 9% inflation rather than 4%, the project becomes:
t0 (1,000), t1 1,153 being (1,100/1.04) × 1.09.
The new internal rate of return is 15.3%.
Tutorial note
Alternatively, you could say the IRR of 10% is a money rate, so our 'real' IRR is 1.10/1.04 – 1 = 5.8%. if inflation changes to 9% then our new money IRR is 1.058 × 1.09 – 1 = 15.3%..
180 D
Year Cash 15% PV
$ $
0 (75,000) (75,000)
1 – 5 25,000 3.352 83,800
––––––
8,800
––––––
Try 20%
Year Cash 20% PV
$ $
0 (75,000) (75,000)
1 – 5 25,000 2.991 74,775
––––––
(225)
––––––
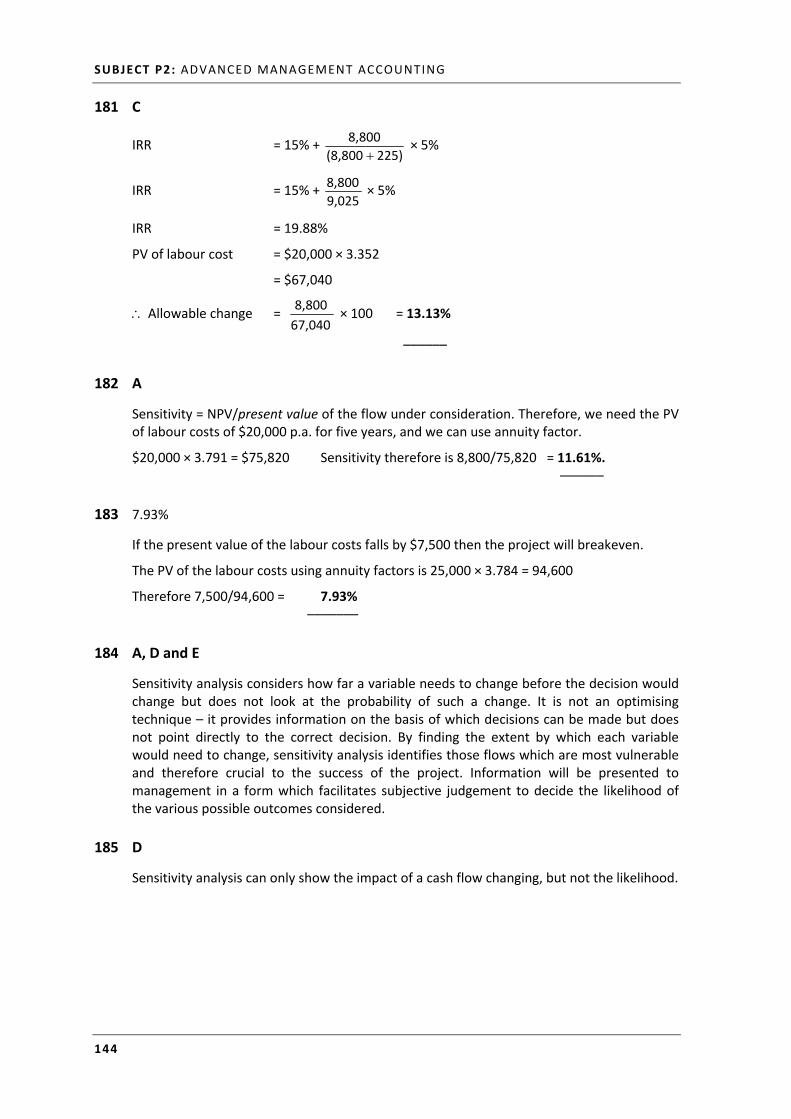
SUBJECT P2: ADVANCED MANAGEMENT ACCOUNTING
144
181 C
IRR = 15% + 225)(8,800
8,800
× 5%
IRR = 15% + 9,025
8,800 × 5%
IRR = 19.88%
PV of labour cost = $20,000 × 3.352
= $67,040
Allowable change = 67,040
8,800 × 100 = 13.13%
––––––
182 A
Sensitivity = NPV/present value of the flow under consideration. Therefore, we need the PV of labour costs of $20,000 p.a. for five years, and we can use annuity factor.
$20,000 × 3.791 = $75,820 Sensitivity therefore is 8,800/75,820 = 11.61%. ––––––
183 7.93%
If the present value of the labour costs falls by $7,500 then the project will breakeven.
The PV of the labour costs using annuity factors is 25,000 × 3.784 = 94,600
Therefore 7,500/94,600 = 7.93% –––––––
184 A, D and E
Sensitivity analysis considers how far a variable needs to change before the decision would change but does not look at the probability of such a change. It is not an optimising technique – it provides information on the basis of which decisions can be made but does not point directly to the correct decision. By finding the extent by which each variable would need to change, sensitivity analysis identifies those flows which are most vulnerable and therefore crucial to the success of the project. Information will be presented to management in a form which facilitates subjective judgement to decide the likelihood of the various possible outcomes considered.
185 D
Sensitivity analysis can only show the impact of a cash flow changing, but not the likelihood.
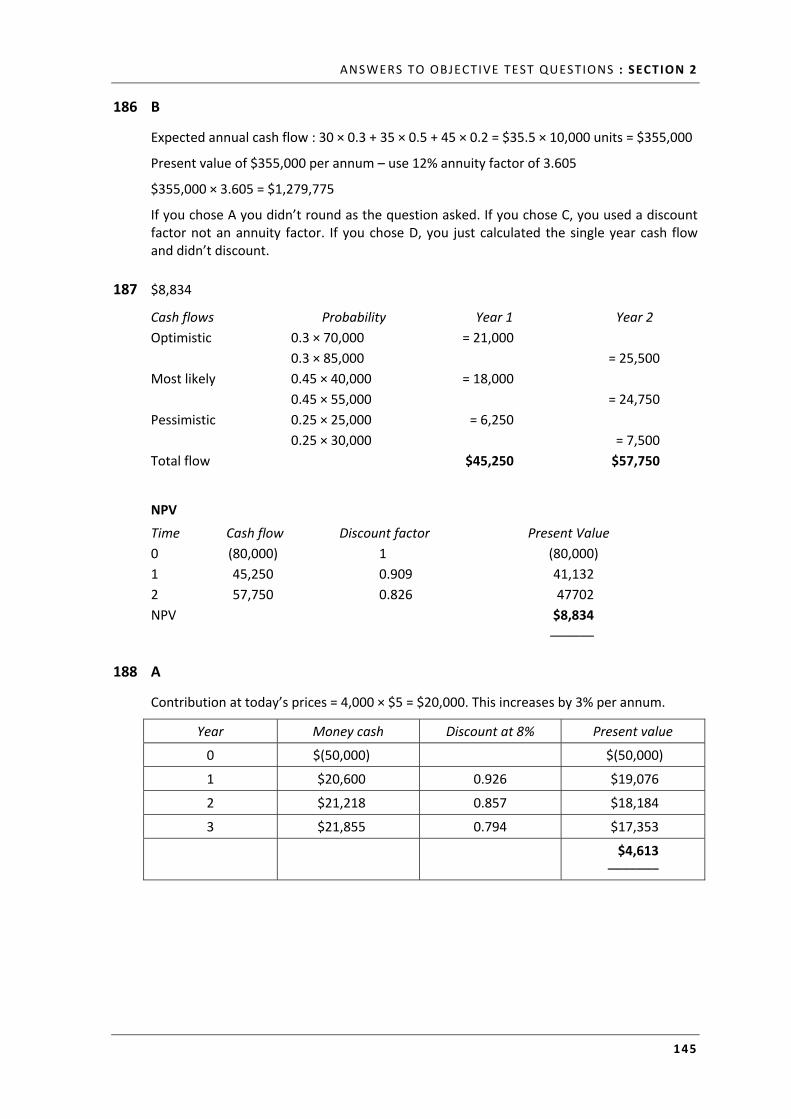
ANSWERS TO OBJECTIVE TEST QUESTIONS : SECTION 2
145
186 B
Expected annual cash flow : 30 × 0.3 + 35 × 0.5 + 45 × 0.2 = $35.5 × 10,000 units = $355,000
Present value of $355,000 per annum – use 12% annuity factor of 3.605
$355,000 × 3.605 = $1,279,775
If you chose A you didn’t round as the question asked. If you chose C, you used a discount factor not an annuity factor. If you chose D, you just calculated the single year cash flow and didn’t discount.
187 $8,834
Cash flows Probability Year 1 Year 2
Optimistic 0.3 × 70,000 = 21,000
0.3 × 85,000 = 25,500
Most likely 0.45 × 40,000 = 18,000
0.45 × 55,000 = 24,750
Pessimistic 0.25 × 25,000 = 6,250
0.25 × 30,000 = 7,500
Total flow $45,250 $57,750
NPV
Time Cash flow Discount factor Present Value
0 (80,000) 1 (80,000)
1 45,250 0.909 41,132
2 57,750 0.826 47702
NPV $8,834
––––––
188 A
Contribution at today’s prices = 4,000 × $5 = $20,000. This increases by 3% per annum.
Year Money cash Discount at 8% Present value
0 $(50,000) $(50,000)
1 $20,600 0.926 $19,076
2 $21,218 0.857 $18,184
3 $21,855 0.794 $17,353
$4,613 –––––––
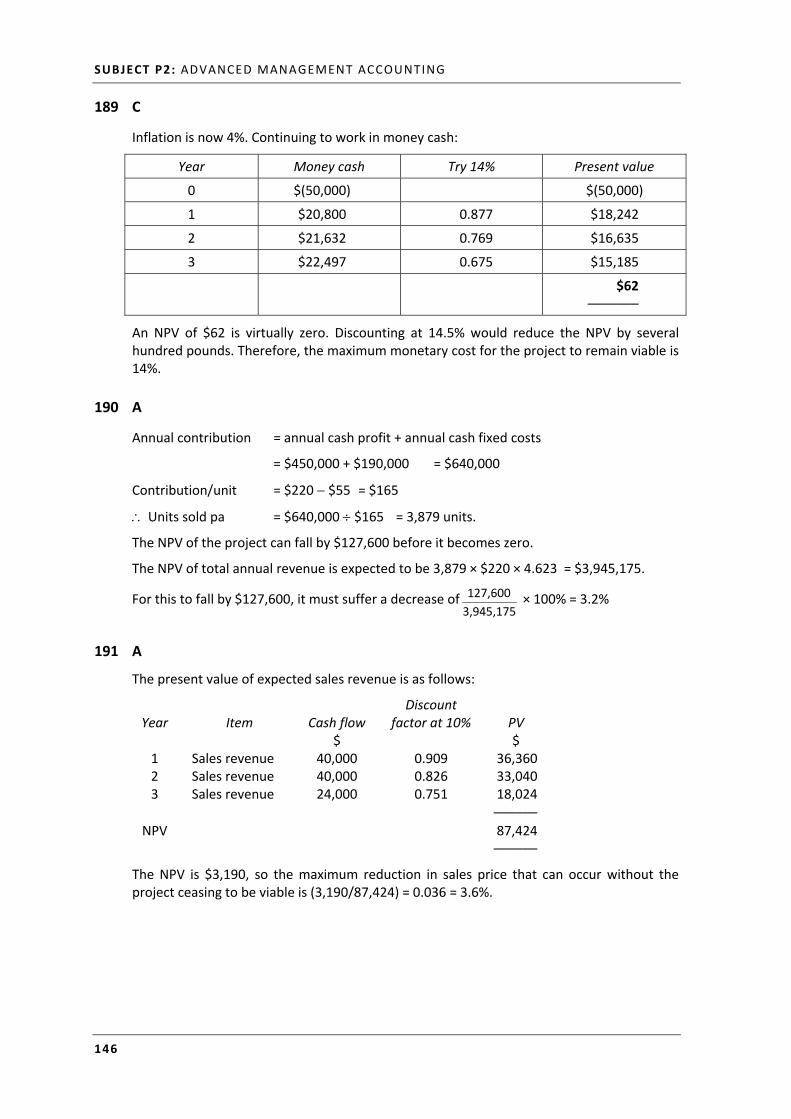
SUBJECT P2: ADVANCED MANAGEMENT ACCOUNTING
146
189 C
Inflation is now 4%. Continuing to work in money cash:
Year Money cash Try 14% Present value
0 $(50,000) $(50,000)
1 $20,800 0.877 $18,242
2 $21,632 0.769 $16,635
3 $22,497 0.675 $15,185
$62 –––––––
An NPV of $62 is virtually zero. Discounting at 14.5% would reduce the NPV by several hundred pounds. Therefore, the maximum monetary cost for the project to remain viable is 14%.
190 A
Annual contribution = annual cash profit + annual cash fixed costs
= $450,000 + $190,000 = $640,000
Contribution/unit = $220 $55 = $165
Units sold pa = $640,000 $165 = 3,879 units.
The NPV of the project can fall by $127,600 before it becomes zero.
The NPV of total annual revenue is expected to be 3,879 × $220 × 4.623 = $3,945,175.
For this to fall by $127,600, it must suffer a decrease of3,945,175
127,600 × 100% = 3.2%
191 A
The present value of expected sales revenue is as follows:
Year Item Cash flow Discount
factor at 10% PV $ $ 1 Sales revenue 40,000 0.909 36,360 2 Sales revenue 40,000 0.826 33,040 3 Sales revenue 24,000 0.751 18,024 ––––––
NPV 87,424 ––––––
The NPV is $3,190, so the maximum reduction in sales price that can occur without the project ceasing to be viable is (3,190/87,424) = 0.036 = 3.6%.
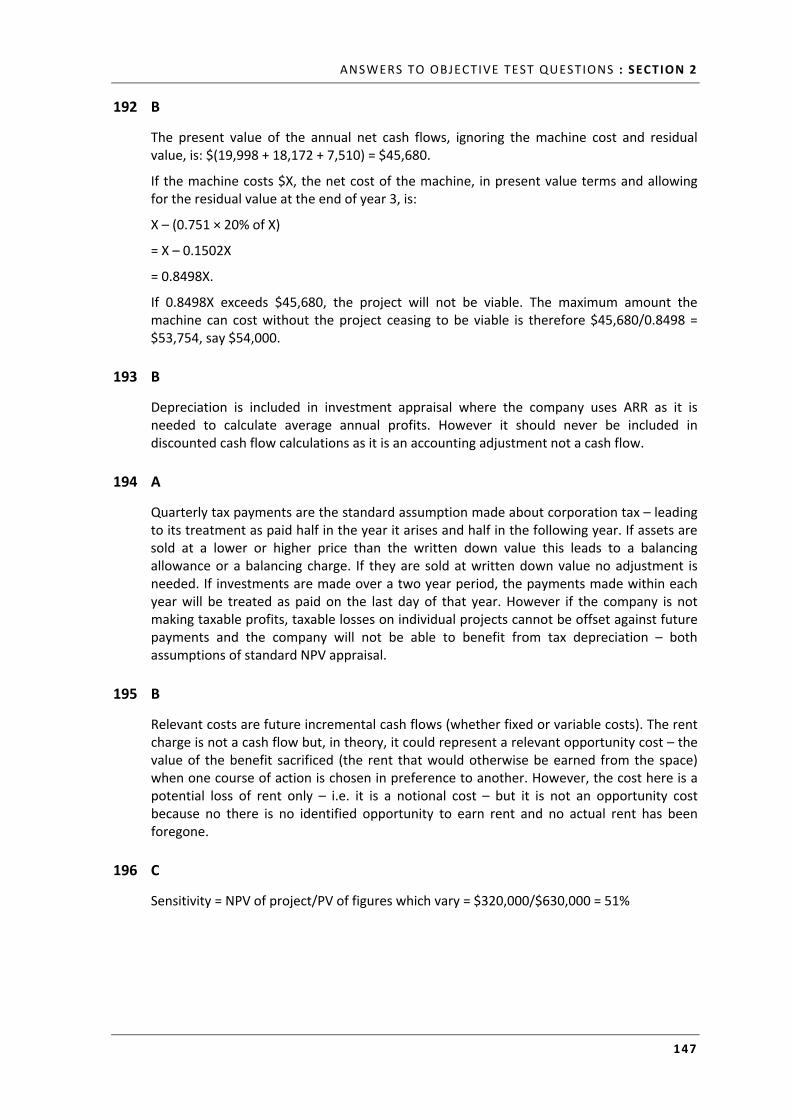
ANSWERS TO OBJECTIVE TEST QUESTIONS : SECTION 2
147
192 B
The present value of the annual net cash flows, ignoring the machine cost and residual value, is: $(19,998 + 18,172 + 7,510) = $45,680.
If the machine costs $X, the net cost of the machine, in present value terms and allowing for the residual value at the end of year 3, is:
X – (0.751 × 20% of X)
= X – 0.1502X
= 0.8498X.
If 0.8498X exceeds $45,680, the project will not be viable. The maximum amount the machine can cost without the project ceasing to be viable is therefore $45,680/0.8498 = $53,754, say $54,000.
193 B
Depreciation is included in investment appraisal where the company uses ARR as it is needed to calculate average annual profits. However it should never be included in discounted cash flow calculations as it is an accounting adjustment not a cash flow.
194 A
Quarterly tax payments are the standard assumption made about corporation tax – leading to its treatment as paid half in the year it arises and half in the following year. If assets are sold at a lower or higher price than the written down value this leads to a balancing allowance or a balancing charge. If they are sold at written down value no adjustment is needed. If investments are made over a two year period, the payments made within each year will be treated as paid on the last day of that year. However if the company is not making taxable profits, taxable losses on individual projects cannot be offset against future payments and the company will not be able to benefit from tax depreciation – both assumptions of standard NPV appraisal.
195 B
Relevant costs are future incremental cash flows (whether fixed or variable costs). The rent charge is not a cash flow but, in theory, it could represent a relevant opportunity cost – the value of the benefit sacrificed (the rent that would otherwise be earned from the space) when one course of action is chosen in preference to another. However, the cost here is a potential loss of rent only – i.e. it is a notional cost – but it is not an opportunity cost because no there is no identified opportunity to earn rent and no actual rent has been foregone.
196 C
Sensitivity = NPV of project/PV of figures which vary = $320,000/$630,000 = 51%
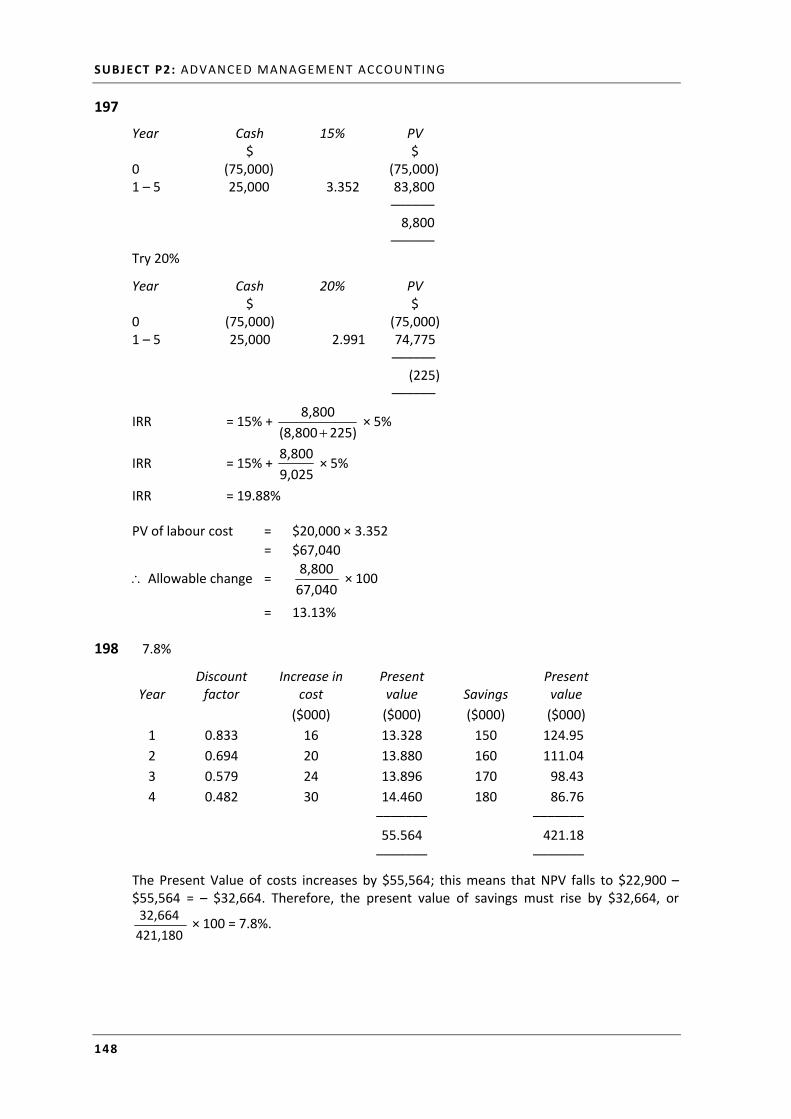
SUBJECT P2: ADVANCED MANAGEMENT ACCOUNTING
148
197
Year Cash 15% PV $ $ 0 (75,000) (75,000) 1 – 5 25,000 3.352 83,800 –––––– 8,800 –––––– Try 20%
Year Cash 20% PV $ $ 0 (75,000) (75,000) 1 – 5 25,000 2.991 74,775 –––––– (225) ––––––
IRR = 15% + 225)(8,800
8,800
× 5%
IRR = 15% + 9,025
8,800 × 5%
IRR = 19.88%
PV of labour cost = $20,000 × 3.352 = $67,040
Allowable change = 67,040
8,800 × 100
= 13.13%
198 7.8%
Year Discount factor
Increase in cost
Present value Savings
Present value
($000) ($000) ($000) ($000)
1 0.833 16 13.328 150 124.95
2 0.694 20 13.880 160 111.04
3 0.579 24 13.896 170 98.43
4 0.482 30 14.460 180 86.76
––––––– –––––––
55.564 421.18
––––––– –––––––
The Present Value of costs increases by $55,564; this means that NPV falls to $22,900 – $55,564 = – $32,664. Therefore, the present value of savings must rise by $32,664, or
421,180
32,664 × 100 = 7.8%.
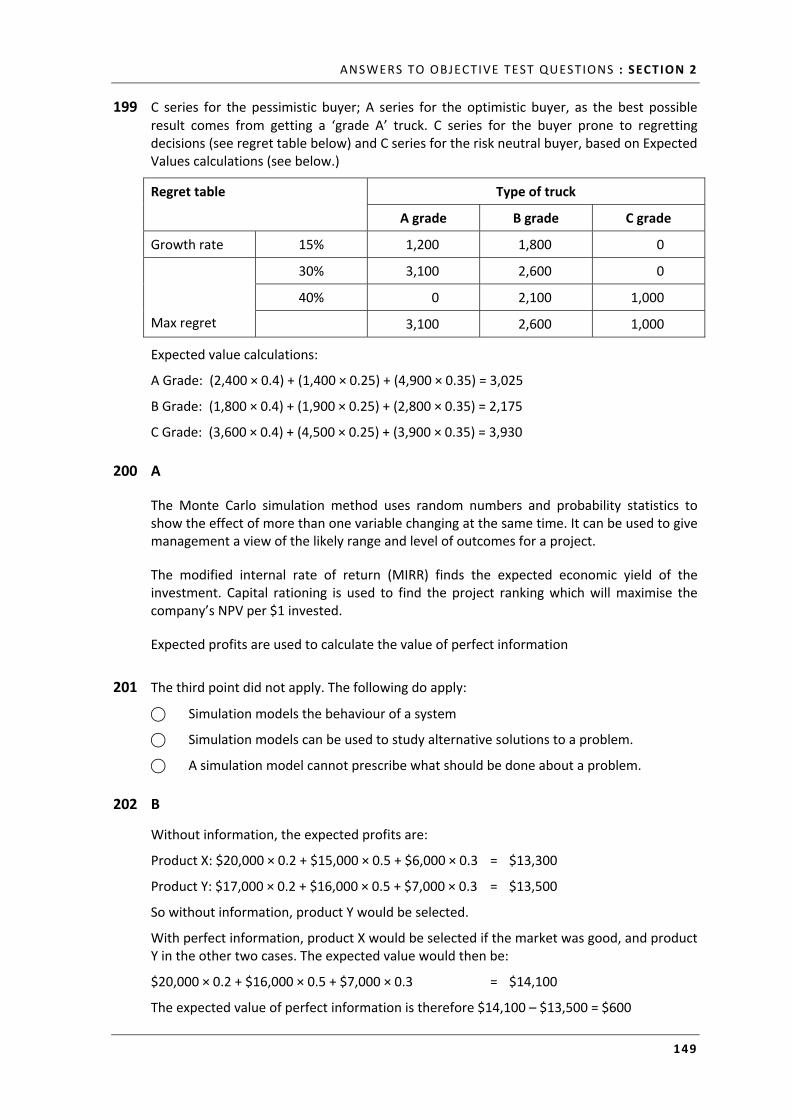
ANSWERS TO OBJECTIVE TEST QUESTIONS : SECTION 2
149
199 C series for the pessimistic buyer; A series for the optimistic buyer, as the best possible result comes from getting a ‘grade A’ truck. C series for the buyer prone to regretting decisions (see regret table below) and C series for the risk neutral buyer, based on Expected Values calculations (see below.)
Regret table Type of truck
A grade B grade C grade
Growth rate 15% 1,200 1,800 0
Max regret
30% 3,100 2,600 0
40% 0 2,100 1,000
3,100 2,600 1,000
Expected value calculations:
A Grade: (2,400 × 0.4) + (1,400 × 0.25) + (4,900 × 0.35) = 3,025
B Grade: (1,800 × 0.4) + (1,900 × 0.25) + (2,800 × 0.35) = 2,175
C Grade: (3,600 × 0.4) + (4,500 × 0.25) + (3,900 × 0.35) = 3,930
200 A
The Monte Carlo simulation method uses random numbers and probability statistics to show the effect of more than one variable changing at the same time. It can be used to give management a view of the likely range and level of outcomes for a project.
The modified internal rate of return (MIRR) finds the expected economic yield of the investment. Capital rationing is used to find the project ranking which will maximise the company’s NPV per $1 invested.
Expected profits are used to calculate the value of perfect information
201 The third point did not apply. The following do apply:
⃝ Simulation models the behaviour of a system
⃝ Simulation models can be used to study alternative solutions to a problem.
⃝ A simulation model cannot prescribe what should be done about a problem.
202 B
Without information, the expected profits are:
Product X: $20,000 × 0.2 + $15,000 × 0.5 + $6,000 × 0.3 = $13,300
Product Y: $17,000 × 0.2 + $16,000 × 0.5 + $7,000 × 0.3 = $13,500
So without information, product Y would be selected.
With perfect information, product X would be selected if the market was good, and product Y in the other two cases. The expected value would then be:
$20,000 × 0.2 + $16,000 × 0.5 + $7,000 × 0.3 = $14,100
The expected value of perfect information is therefore $14,100 – $13,500 = $600
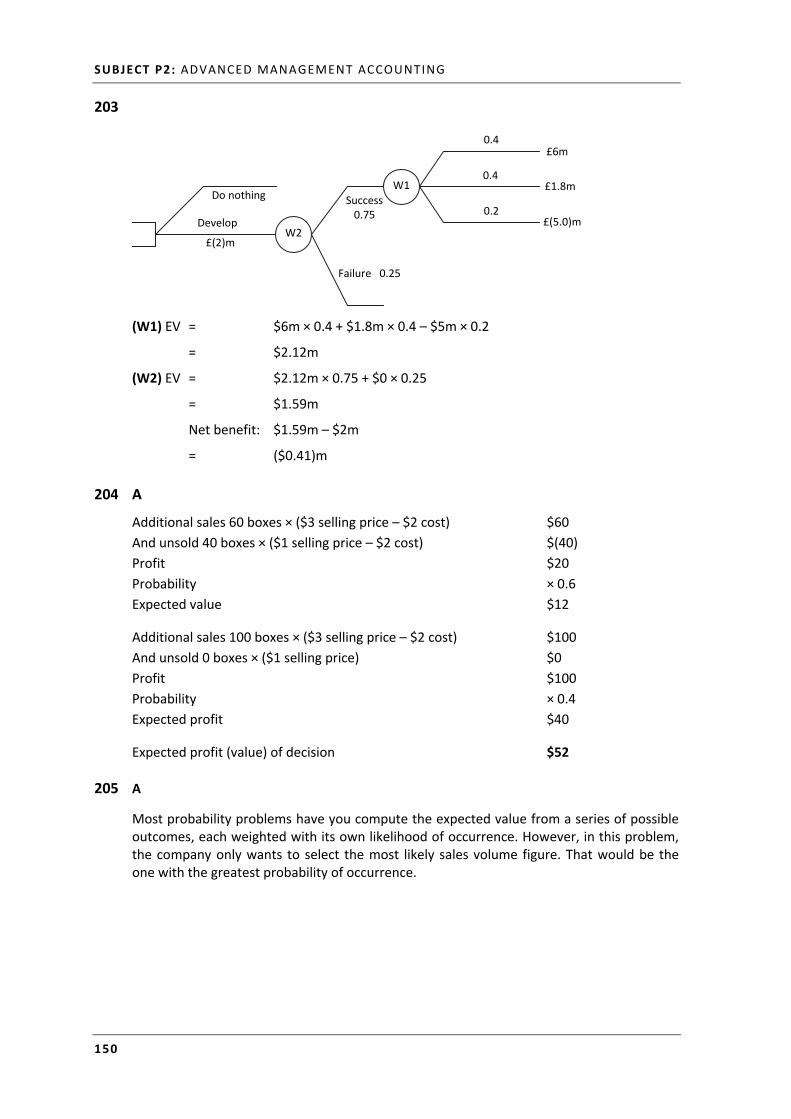
SUBJECT P2: ADVANCED MANAGEMENT ACCOUNTING
150
203
£(2)m
Do nothing
Develop W2
W1
Failure 0.25
Success 0.75
0.4
0.4
0.2
£6m
£1.8m
£(5.0)m
(W1) EV = $6m × 0.4 + $1.8m × 0.4 – $5m × 0.2
= $2.12m
(W2) EV = $2.12m × 0.75 + $0 × 0.25
= $1.59m
Net benefit: $1.59m – $2m
= ($0.41)m
204 A
Additional sales 60 boxes × ($3 selling price – $2 cost) $60
And unsold 40 boxes × ($1 selling price – $2 cost) $(40)
Profit $20
Probability × 0.6
Expected value $12
Additional sales 100 boxes × ($3 selling price – $2 cost) $100
And unsold 0 boxes × ($1 selling price) $0
Profit $100
Probability × 0.4
Expected profit $40
Expected profit (value) of decision $52
205 A
Most probability problems have you compute the expected value from a series of possible outcomes, each weighted with its own likelihood of occurrence. However, in this problem, the company only wants to select the most likely sales volume figure. That would be the one with the greatest probability of occurrence.
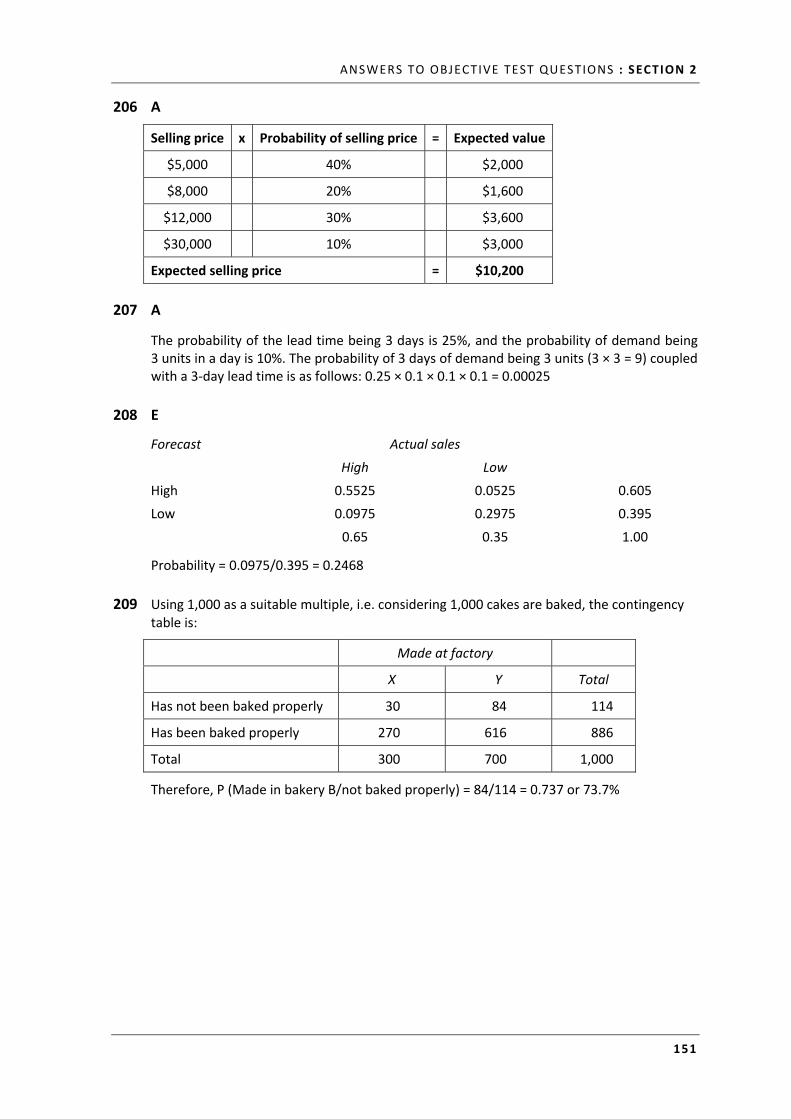
ANSWERS TO OBJECTIVE TEST QUESTIONS : SECTION 2
151
206 A
Selling price x Probability of selling price = Expected value
$5,000 40% $2,000
$8,000 20% $1,600
$12,000 30% $3,600
$30,000 10% $3,000
Expected selling price = $10,200
207 A
The probability of the lead time being 3 days is 25%, and the probability of demand being 3 units in a day is 10%. The probability of 3 days of demand being 3 units (3 × 3 = 9) coupled with a 3‐day lead time is as follows: 0.25 × 0.1 × 0.1 × 0.1 = 0.00025
208 E
Forecast Actual sales
High Low
High 0.5525 0.0525 0.605
Low 0.0975 0.2975 0.395
0.65 0.35 1.00
Probability = 0.0975/0.395 = 0.2468
209 Using 1,000 as a suitable multiple, i.e. considering 1,000 cakes are baked, the contingency table is:
Made at factory
X Y Total
Has not been baked properly 30 84 114
Has been baked properly 270 616 886
Total 300 700 1,000
Therefore, P (Made in bakery B/not baked properly) = 84/114 = 0.737 or 73.7%
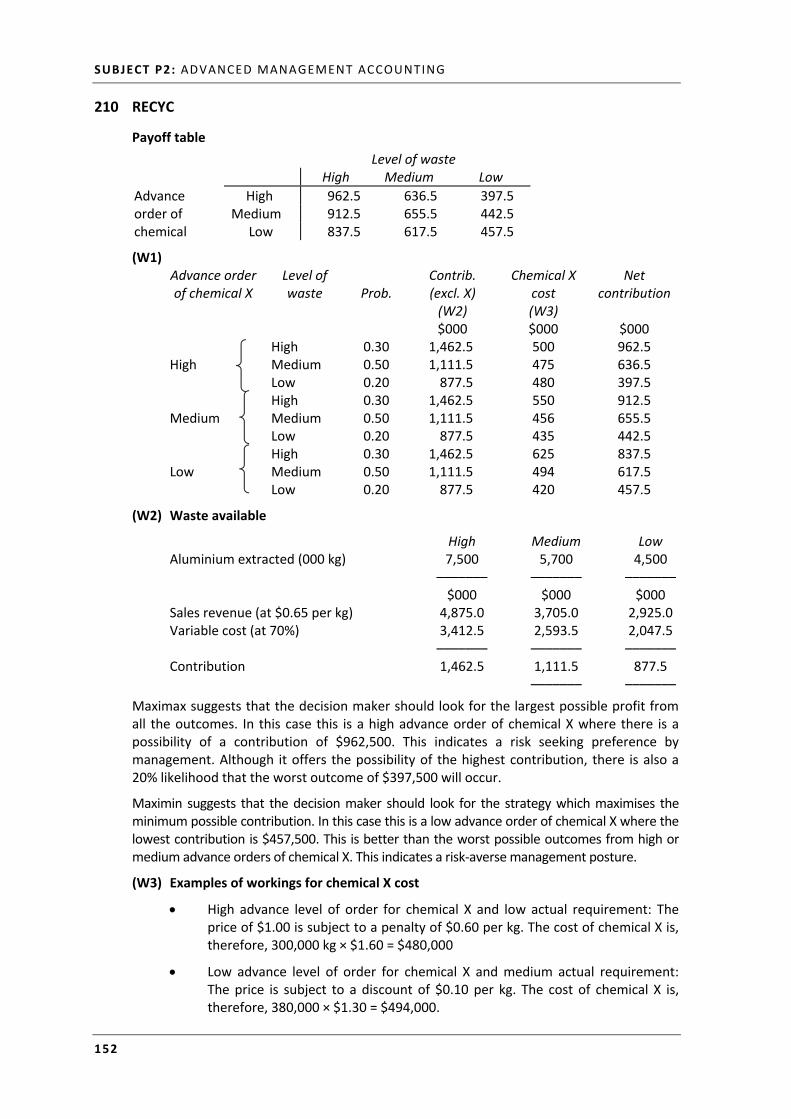
SUBJECT P2: ADVANCED MANAGEMENT ACCOUNTING
152
210 RECYC
Payoff table
Level of waste High Medium Low
Advance High 962.5 636.5 397.5 order of Medium 912.5 655.5 442.5 chemical Low 837.5 617.5 457.5
(W1) Advance order of chemical X
Level of waste Prob.
Contrib. (excl. X)
Chemical X cost
Net contribution
(W2) (W3) $000 $000 $000 High 0.30 1,462.5 500 962.5 High Medium 0.50 1,111.5 475 636.5 Low 0.20 877.5 480 397.5 High 0.30 1,462.5 550 912.5 Medium Medium 0.50 1,111.5 456 655.5 Low 0.20 877.5 435 442.5 High 0.30 1,462.5 625 837.5 Low Medium 0.50 1,111.5 494 617.5 Low 0.20 877.5 420 457.5
(W2) Waste available
High Medium Low Aluminium extracted (000 kg) 7,500 5,700 4,500 ––––––– ––––––– ––––––– $000 $000 $000 Sales revenue (at $0.65 per kg) 4,875.0 3,705.0 2,925.0 Variable cost (at 70%) 3,412.5 2,593.5 2,047.5
–––––––
–––––––
–––––––
Contribution 1,462.5 1,111.5 877.5
–––––––
–––––––
Maximax suggests that the decision maker should look for the largest possible profit from all the outcomes. In this case this is a high advance order of chemical X where there is a possibility of a contribution of $962,500. This indicates a risk seeking preference by management. Although it offers the possibility of the highest contribution, there is also a 20% likelihood that the worst outcome of $397,500 will occur.
Maximin suggests that the decision maker should look for the strategy which maximises the minimum possible contribution. In this case this is a low advance order of chemical X where the lowest contribution is $457,500. This is better than the worst possible outcomes from high or medium advance orders of chemical X. This indicates a risk‐averse management posture.
(W3) Examples of workings for chemical X cost
High advance level of order for chemical X and low actual requirement: The price of $1.00 is subject to a penalty of $0.60 per kg. The cost of chemical X is, therefore, 300,000 kg × $1.60 = $480,000
Low advance level of order for chemical X and medium actual requirement: The price is subject to a discount of $0.10 per kg. The cost of chemical X is, therefore, 380,000 × $1.30 = $494,000.
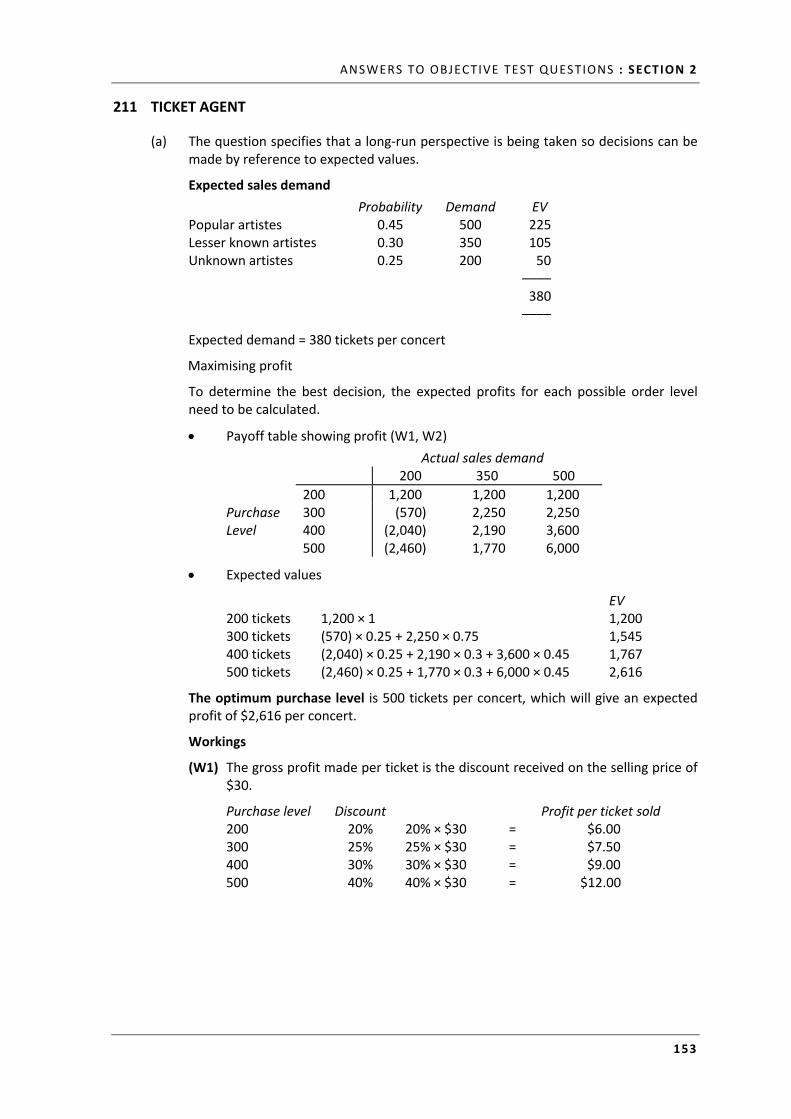
ANSWERS TO OBJECTIVE TEST QUESTIONS : SECTION 2
153
211 TICKET AGENT
(a) The question specifies that a long‐run perspective is being taken so decisions can be made by reference to expected values.
Expected sales demand
Probability Demand EV Popular artistes 0.45 500 225 Lesser known artistes 0.30 350 105 Unknown artistes 0.25 200 50
–––– 380
––––
Expected demand = 380 tickets per concert
Maximising profit
To determine the best decision, the expected profits for each possible order level need to be calculated.
Payoff table showing profit (W1, W2)
Actual sales demand 200 350 500
200 1,200 1,200 1,200 Purchase 300 (570) 2,250 2,250 Level 400 (2,040) 2,190 3,600 500 (2,460) 1,770 6,000
Expected values
EV 200 tickets 1,200 × 1 1,200 300 tickets (570) × 0.25 + 2,250 × 0.75 1,545 400 tickets (2,040) × 0.25 + 2,190 × 0.3 + 3,600 × 0.45 1,767 500 tickets (2,460) × 0.25 + 1,770 × 0.3 + 6,000 × 0.45 2,616
The optimum purchase level is 500 tickets per concert, which will give an expected profit of $2,616 per concert.
Workings
(W1) The gross profit made per ticket is the discount received on the selling price of $30.
Purchase level Discount Profit per ticket sold 200 20% 20% × $30 = $6.00 300 25% 25% × $30 = $7.50 400 30% 30% × $30 = $9.00 500 40% 40% × $30 = $12.00
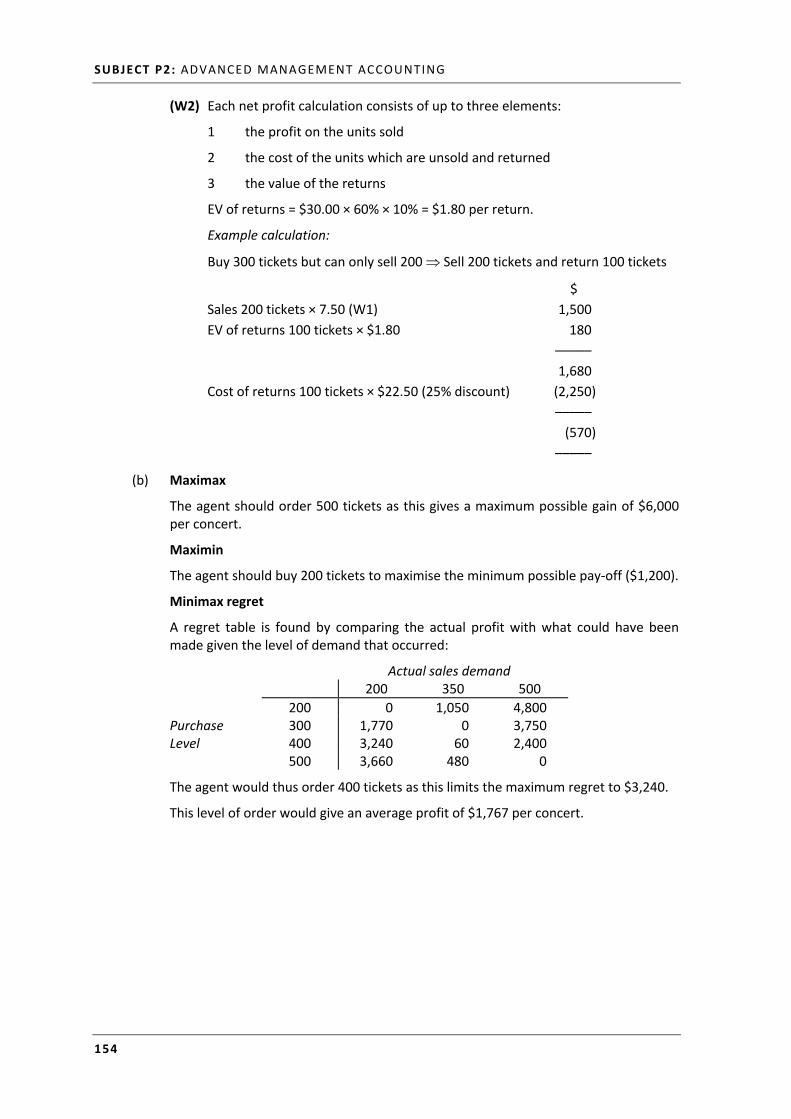
SUBJECT P2: ADVANCED MANAGEMENT ACCOUNTING
154
(W2) Each net profit calculation consists of up to three elements:
1 the profit on the units sold
2 the cost of the units which are unsold and returned
3 the value of the returns
EV of returns = $30.00 × 60% × 10% = $1.80 per return.
Example calculation:
Buy 300 tickets but can only sell 200 Sell 200 tickets and return 100 tickets
$
Sales 200 tickets × 7.50 (W1) 1,500
EV of returns 100 tickets × $1.80 180
–––––
1,680
Cost of returns 100 tickets × $22.50 (25% discount) (2,250)
–––––
(570)
–––––
(b) Maximax
The agent should order 500 tickets as this gives a maximum possible gain of $6,000 per concert.
Maximin
The agent should buy 200 tickets to maximise the minimum possible pay‐off ($1,200).
Minimax regret
A regret table is found by comparing the actual profit with what could have been made given the level of demand that occurred:
Actual sales demand 200 350 500
200 0 1,050 4,800 Purchase 300 1,770 0 3,750 Level 400 3,240 60 2,400 500 3,660 480 0
The agent would thus order 400 tickets as this limits the maximum regret to $3,240.
This level of order would give an average profit of $1,767 per concert.
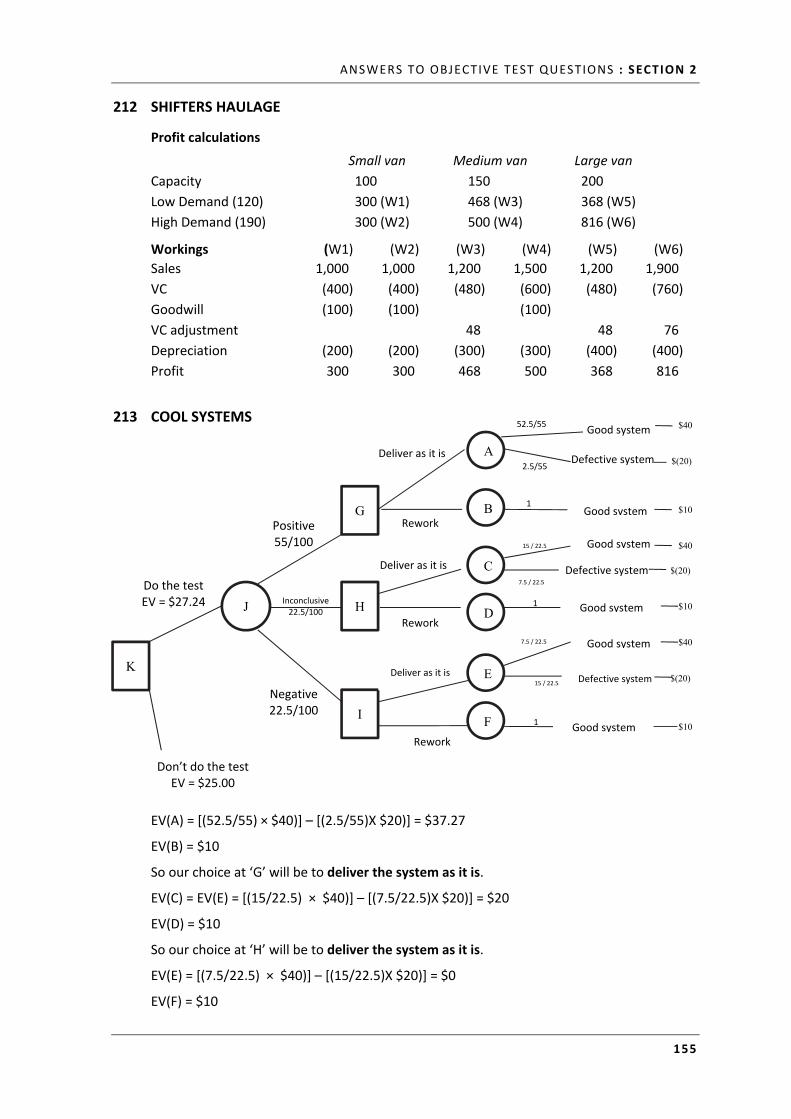
ANSWERS TO OBJECTIVE TEST QUESTIONS : SECTION 2
155
212 SHIFTERS HAULAGE
Profit calculations
Small van Medium van Large van
Capacity 100 150 200
Low Demand (120) 300 (W1) 468 (W3) 368 (W5)
High Demand (190) 300 (W2) 500 (W4) 816 (W6)
Workings (W1) (W2) (W3) (W4) (W5) (W6)
Sales 1,000 1,000 1,200 1,500 1,200 1,900
VC (400) (400) (480) (600) (480) (760)
Goodwill (100) (100) (100)
VC adjustment 48 48 76
Depreciation (200) (200) (300) (300) (400) (400)
Profit 300 300 468 500 368 816
213 COOL SYSTEMS
EV(A) = [(52.5/55) × $40)] – [(2.5/55)X $20)] = $37.27
EV(B) = $10
So our choice at ‘G’ will be to deliver the system as it is.
EV(C) = EV(E) = [(15/22.5) × $40)] – [(7.5/22.5)X $20)] = $20
EV(D) = $10
So our choice at ‘H’ will be to deliver the system as it is.
EV(E) = [(7.5/22.5) × $40)] – [(15/22.5)X $20)] = $0
EV(F) = $10
Do the test EV = $27.24
K
Don’t do the test EV = $25.00
Positive 55/100
Inconclusive 22.5/100 J
Deliver as it is
G
H
I
Negative 22.5/100
Deliver as it is
Rework
A
B
C
Deliver as it is
D
E
15 / 22.5
F
1
52.5/55
1
7.5 / 22.5
1
15 / 22.5
2.5/55
Rework
Good system
Defective system
Good system
Good system
7.5 / 22.5
Defective system
Good system
Good system
Good system
Defective system
$40
$(20)
$10
$40
$(20)
Rework
$10
$40
$(20)
$10
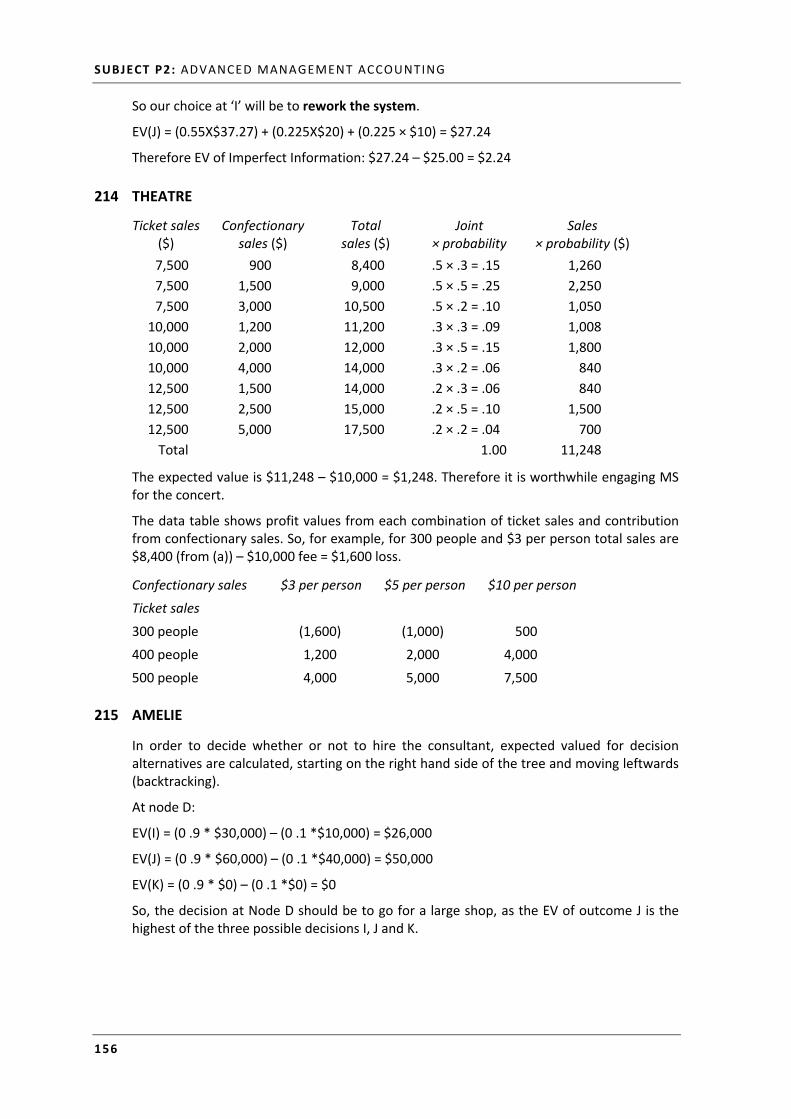
SUBJECT P2: ADVANCED MANAGEMENT ACCOUNTING
156
So our choice at ‘I’ will be to rework the system.
EV(J) = (0.55X$37.27) + (0.225X$20) + (0.225 × $10) = $27.24
Therefore EV of Imperfect Information: $27.24 – $25.00 = $2.24
214 THEATRE
Ticket sales ($)
Confectionary sales ($)
Total sales ($)
Joint × probability
Sales × probability ($)
7,500 900 8,400 .5 × .3 = .15 1,260
7,500 1,500 9,000 .5 × .5 = .25 2,250
7,500 3,000 10,500 .5 × .2 = .10 1,050
10,000 1,200 11,200 .3 × .3 = .09 1,008
10,000 2,000 12,000 .3 × .5 = .15 1,800
10,000 4,000 14,000 .3 × .2 = .06 840
12,500 1,500 14,000 .2 × .3 = .06 840
12,500 2,500 15,000 .2 × .5 = .10 1,500
12,500 5,000 17,500 .2 × .2 = .04 700
Total 1.00 11,248
The expected value is $11,248 – $10,000 = $1,248. Therefore it is worthwhile engaging MS for the concert.
The data table shows profit values from each combination of ticket sales and contribution from confectionary sales. So, for example, for 300 people and $3 per person total sales are $8,400 (from (a)) – $10,000 fee = $1,600 loss.
Confectionary sales
Ticket sales
$3 per person $5 per person $10 per person
300 people (1,600) (1,000) 500
400 people 1,200 2,000 4,000
500 people 4,000 5,000 7,500
215 AMELIE
In order to decide whether or not to hire the consultant, expected valued for decision alternatives are calculated, starting on the right hand side of the tree and moving leftwards (backtracking).
At node D:
EV(I) = (0 .9 * $30,000) – (0 .1 *$10,000) = $26,000
EV(J) = (0 .9 * $60,000) – (0 .1 *$40,000) = $50,000
EV(K) = (0 .9 * $0) – (0 .1 *$0) = $0
So, the decision at Node D should be to go for a large shop, as the EV of outcome J is the highest of the three possible decisions I, J and K.
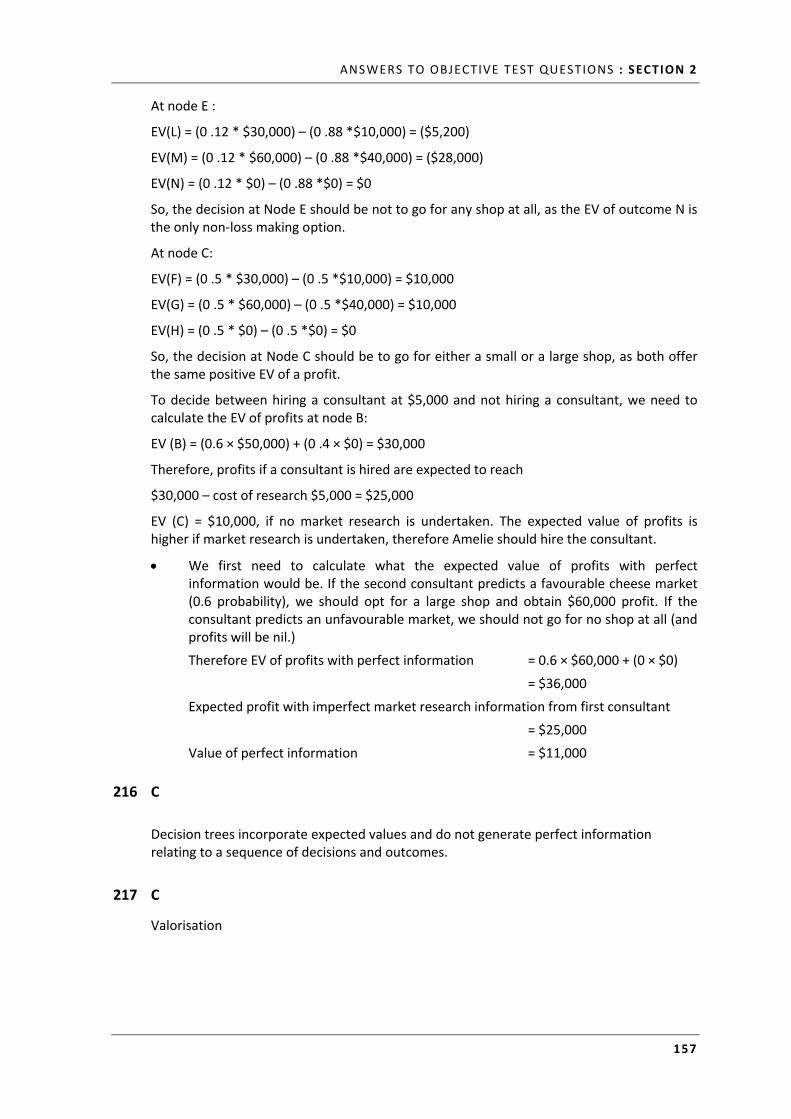
ANSWERS TO OBJECTIVE TEST QUESTIONS : SECTION 2
157
At node E :
EV(L) = (0 .12 * $30,000) – (0 .88 *$10,000) = ($5,200)
EV(M) = (0 .12 * $60,000) – (0 .88 *$40,000) = ($28,000)
EV(N) = (0 .12 * $0) – (0 .88 *$0) = $0
So, the decision at Node E should be not to go for any shop at all, as the EV of outcome N is the only non‐loss making option.
At node C:
EV(F) = (0 .5 * $30,000) – (0 .5 *$10,000) = $10,000
EV(G) = (0 .5 * $60,000) – (0 .5 *$40,000) = $10,000
EV(H) = (0 .5 * $0) – (0 .5 *$0) = $0
So, the decision at Node C should be to go for either a small or a large shop, as both offer the same positive EV of a profit.
To decide between hiring a consultant at $5,000 and not hiring a consultant, we need to calculate the EV of profits at node B:
EV (B) = (0.6 × $50,000) + (0 .4 × $0) = $30,000
Therefore, profits if a consultant is hired are expected to reach
$30,000 – cost of research $5,000 = $25,000
EV (C) = $10,000, if no market research is undertaken. The expected value of profits is higher if market research is undertaken, therefore Amelie should hire the consultant.
We first need to calculate what the expected value of profits with perfect information would be. If the second consultant predicts a favourable cheese market (0.6 probability), we should opt for a large shop and obtain $60,000 profit. If the consultant predicts an unfavourable market, we should not go for no shop at all (and profits will be nil.)
Therefore EV of profits with perfect information = 0.6 × $60,000 + (0 × $0)
= $36,000
Expected profit with imperfect market research information from first consultant
= $25,000
Value of perfect information = $11,000
216 C
Decision trees incorporate expected values and do not generate perfect information relating to a sequence of decisions and outcomes.
217 C
Valorisation
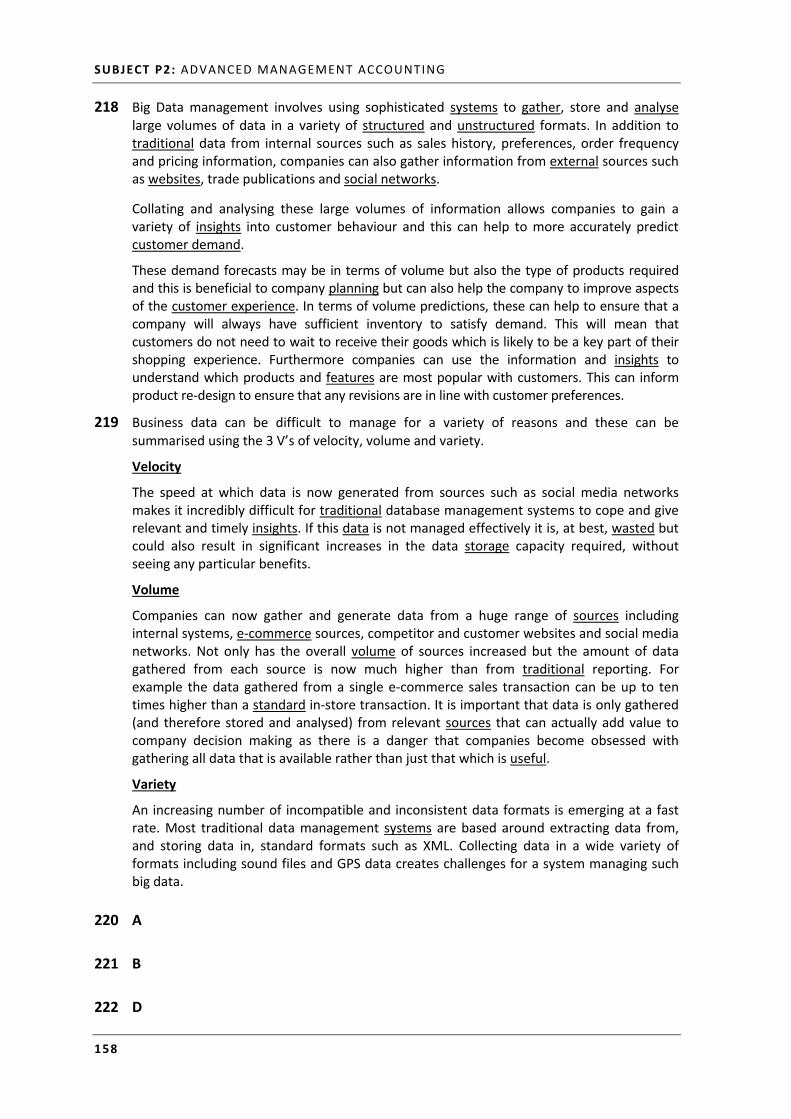
SUBJECT P2: ADVANCED MANAGEMENT ACCOUNTING
158
218 Big Data management involves using sophisticated systems to gather, store and analyse large volumes of data in a variety of structured and unstructured formats. In addition to traditional data from internal sources such as sales history, preferences, order frequency and pricing information, companies can also gather information from external sources such as websites, trade publications and social networks.
Collating and analysing these large volumes of information allows companies to gain a variety of insights into customer behaviour and this can help to more accurately predict customer demand.
These demand forecasts may be in terms of volume but also the type of products required and this is beneficial to company planning but can also help the company to improve aspects of the customer experience. In terms of volume predictions, these can help to ensure that a company will always have sufficient inventory to satisfy demand. This will mean that customers do not need to wait to receive their goods which is likely to be a key part of their shopping experience. Furthermore companies can use the information and insights to understand which products and features are most popular with customers. This can inform product re‐design to ensure that any revisions are in line with customer preferences.
219 Business data can be difficult to manage for a variety of reasons and these can be summarised using the 3 V’s of velocity, volume and variety.
Velocity
The speed at which data is now generated from sources such as social media networks makes it incredibly difficult for traditional database management systems to cope and give relevant and timely insights. If this data is not managed effectively it is, at best, wasted but could also result in significant increases in the data storage capacity required, without seeing any particular benefits.
Volume
Companies can now gather and generate data from a huge range of sources including internal systems, e‐commerce sources, competitor and customer websites and social media networks. Not only has the overall volume of sources increased but the amount of data gathered from each source is now much higher than from traditional reporting. For example the data gathered from a single e‐commerce sales transaction can be up to ten times higher than a standard in‐store transaction. It is important that data is only gathered (and therefore stored and analysed) from relevant sources that can actually add value to company decision making as there is a danger that companies become obsessed with gathering all data that is available rather than just that which is useful.
Variety
An increasing number of incompatible and inconsistent data formats is emerging at a fast rate. Most traditional data management systems are based around extracting data from, and storing data in, standard formats such as XML. Collecting data in a wide variety of formats including sound files and GPS data creates challenges for a system managing such big data.
220 A
221 B
222 D
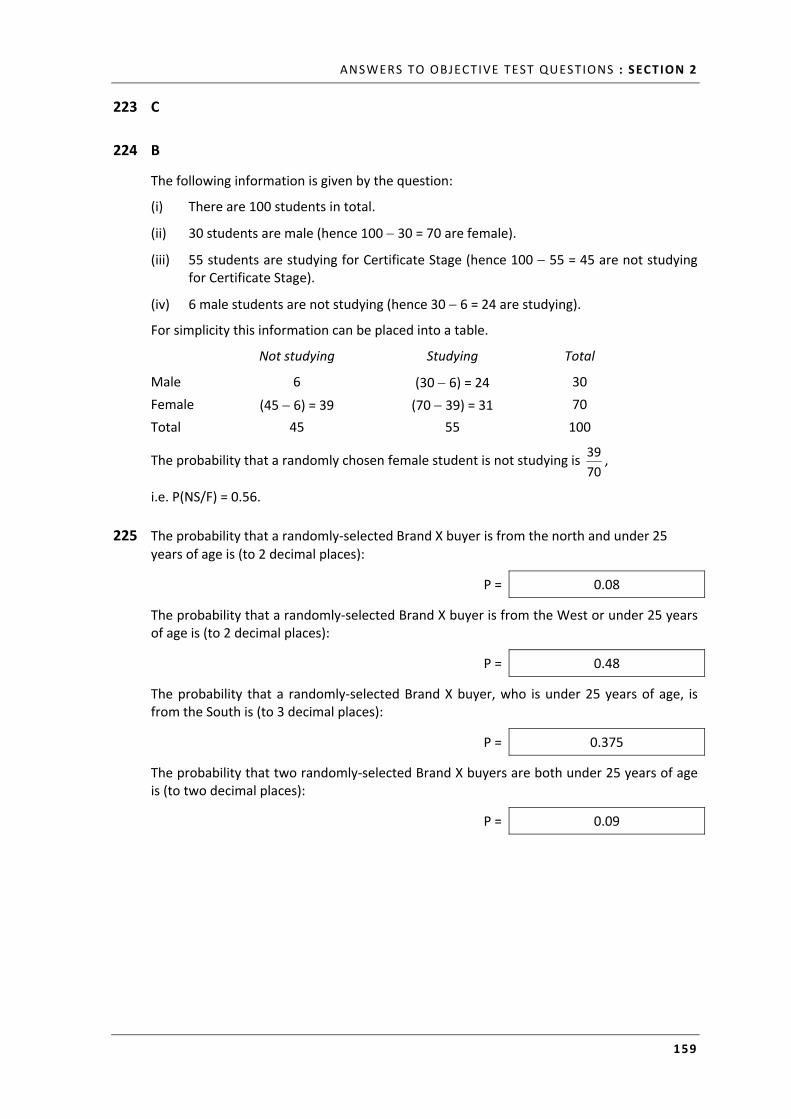
ANSWERS TO OBJECTIVE TEST QUESTIONS : SECTION 2
159
223 C
224 B
The following information is given by the question:
(i) There are 100 students in total.
(ii) 30 students are male (hence 100 30 = 70 are female).
(iii) 55 students are studying for Certificate Stage (hence 100 55 = 45 are not studying for Certificate Stage).
(iv) 6 male students are not studying (hence 30 6 = 24 are studying).
For simplicity this information can be placed into a table.
Not studying Studying Total
Male 6 (30 6) = 24 30
Female (45 6) = 39 (70 39) = 31 70
Total 45 55 100
The probability that a randomly chosen female student is not studying is 70
39,
i.e. P(NS/F) = 0.56.
225 The probability that a randomly‐selected Brand X buyer is from the north and under 25 years of age is (to 2 decimal places):
P = 0.08
The probability that a randomly‐selected Brand X buyer is from the West or under 25 years of age is (to 2 decimal places):
P = 0.48
The probability that a randomly‐selected Brand X buyer, who is under 25 years of age, is from the South is (to 3 decimal places):
P = 0.375
The probability that two randomly‐selected Brand X buyers are both under 25 years of age is (to two decimal places):
P = 0.09
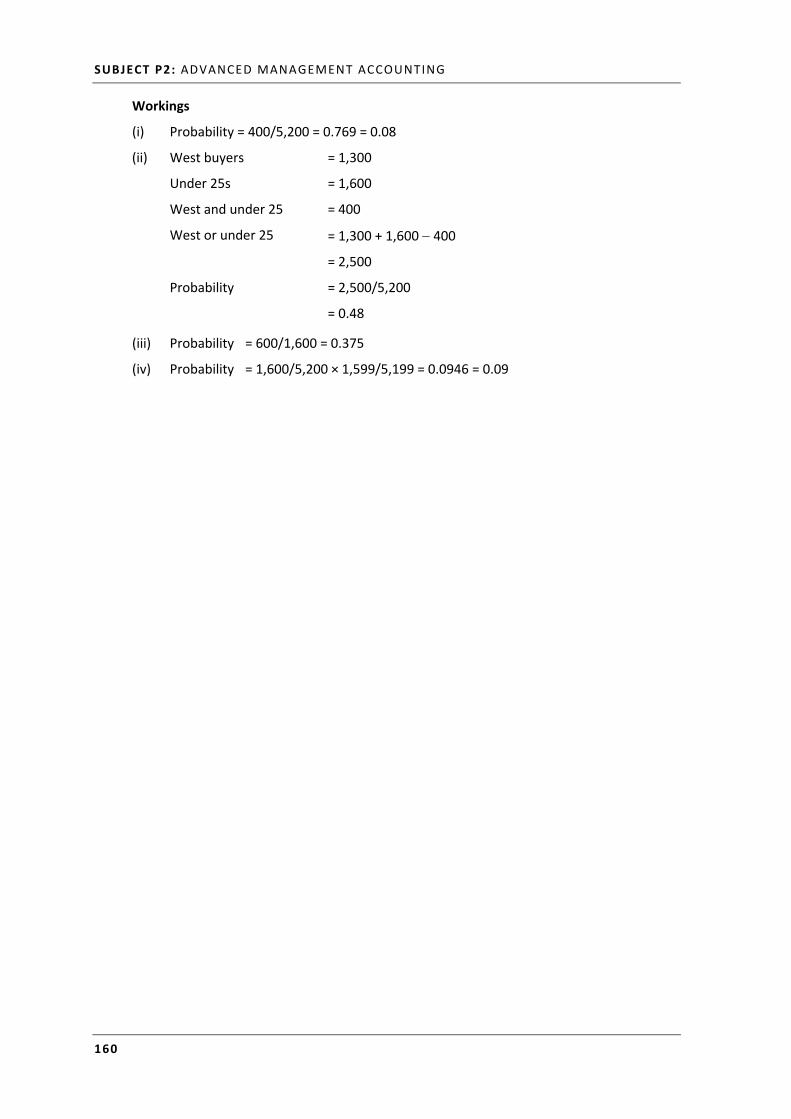
SUBJECT P2: ADVANCED MANAGEMENT ACCOUNTING
160
Workings
(i) Probability = 400/5,200 = 0.769 = 0.08
(ii) West buyers = 1,300
Under 25s = 1,600
West and under 25 = 400
West or under 25 = 1,300 + 1,600 400
= 2,500
Probability = 2,500/5,200
= 0.48
(iii) Probability = 600/1,600 = 0.375
(iv) Probability = 1,600/5,200 × 1,599/5,199 = 0.0946 = 0.09


![Objective IELTS Advanced WB With Answers [Shrunk]](https://img.dokumen.tips/doc/110x75/577ccf901a28ab9e78900c31/objective-ielts-advanced-wb-with-answers-shrunk.jpg)