Embed Size (px)
Citation preview

ANOVA

One-factor ANOVA by example
2
One-factor ANOVA by visual inspection
3
One-factor ANOVA H0
H0: µ1 = µ2 = µ3 = …
HA : not all means are equal
4

One-factor ANOVA but why not t-tests
• t-tests?
• 3+2+1 tests -> multiple comparisons
• The variance is correctly estimated
• We need a method that uses the full dataset
5

One-factor ANOVA the cook book I
• Find the Within groups SS
Fx: 𝑆𝑆1 = 𝑥𝑖 − 𝑥 2
𝑖 = 8.2 − 6 2 +8.2 − 7 2 + 8.2 − 8 2 + 8.2 − 8 2 +8.2 − 9 2 + 8.2 − 11 2 = 14.4
Sum the sum of squares from each group:
SS1+SS2+SS3+SS4 = 14.4+8.8+20.8+13.3
=57.8
df = 20
• Within group variance
• =𝑤𝑖𝑡𝑖𝑛 𝑔𝑟𝑜𝑢𝑝 𝑆𝑆
𝑑𝑓=57.8
20= 2.9
6

One-factor ANOVA the cook book II
• Find the total SS
𝑆𝑆𝑡𝑜𝑡 = 𝑥𝑖 − 𝑥 2
𝑖
= 140.0
df = 23
• Find the between group SS
𝑆𝑆𝑏𝑒𝑡𝑤𝑒𝑒𝑛 = 𝑛 𝑥 − 𝑥 2
𝑚
= 6( 8.2 − 7.5 2 + 5.8 − 7.5 2
+ 10.2 − 7.5 2 + 5.7 − 7.5 2) = 82.1
df = 3
7
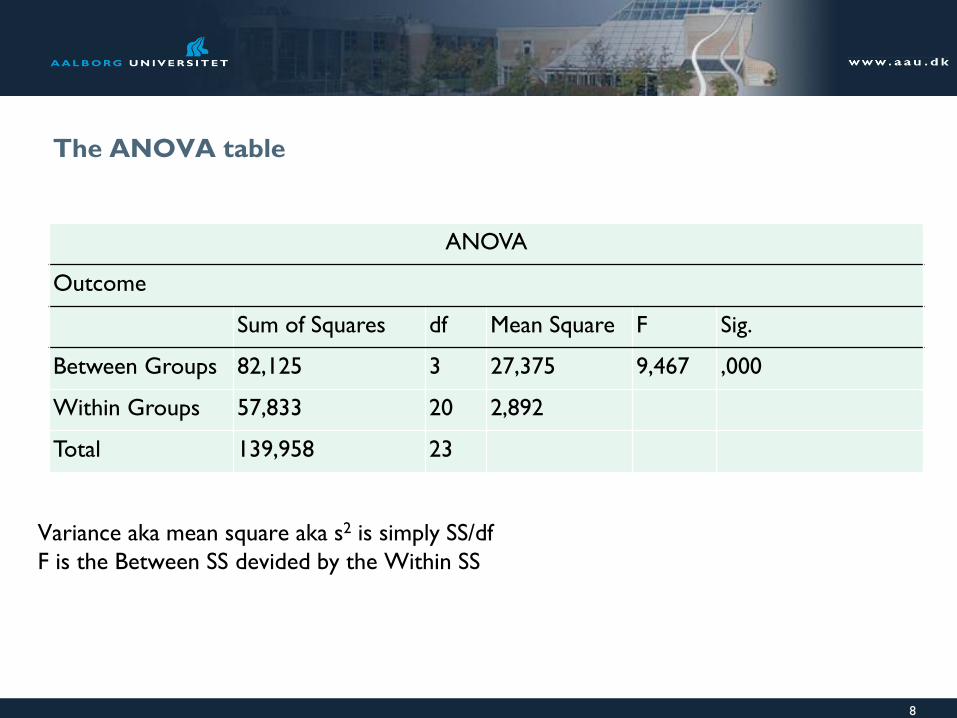
The ANOVA table
ANOVA
Outcome
Sum of Squares df Mean Square F Sig.
Between Groups 82,125 3 27,375 9,467 ,000
Within Groups 57,833 20 2,892
Total 139,958 23
Variance aka mean square aka s2 is simply SS/df
F is the Between SS devided by the Within SS
8
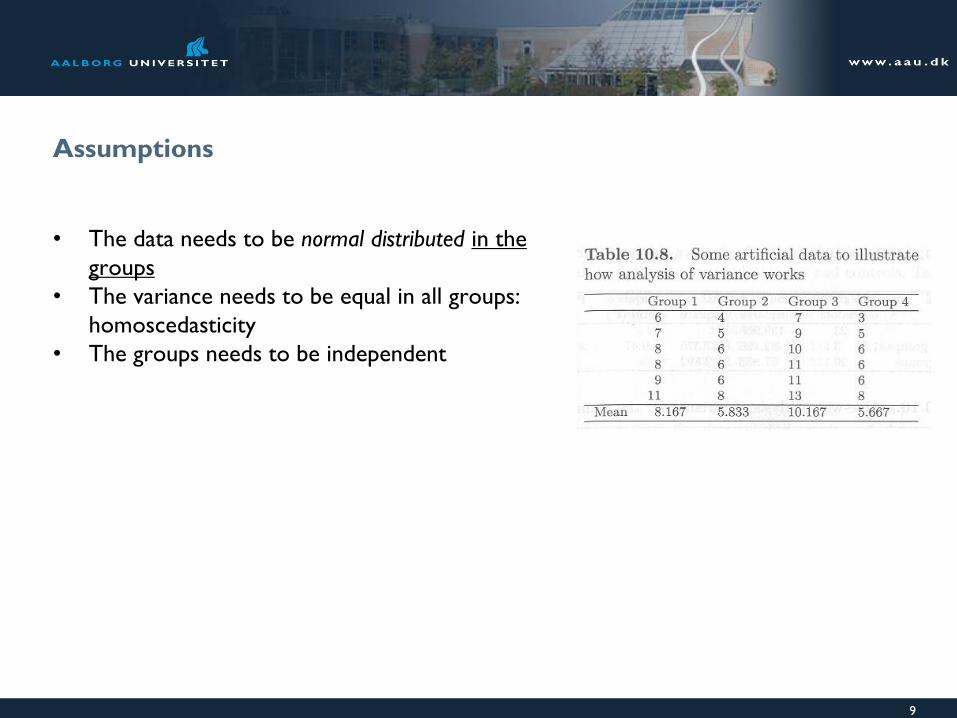
Assumptions
• The data needs to be normal distributed in the
groups
• The variance needs to be equal in all groups:
homoscedasticity
• The groups needs to be independent
9

Multiple comparisons procedures aka post hoc analysis
• Rejecting H0 only states that one or more
pairs of means are different, but not which.
• Tukeys multiple comparisons test as an
example.
10
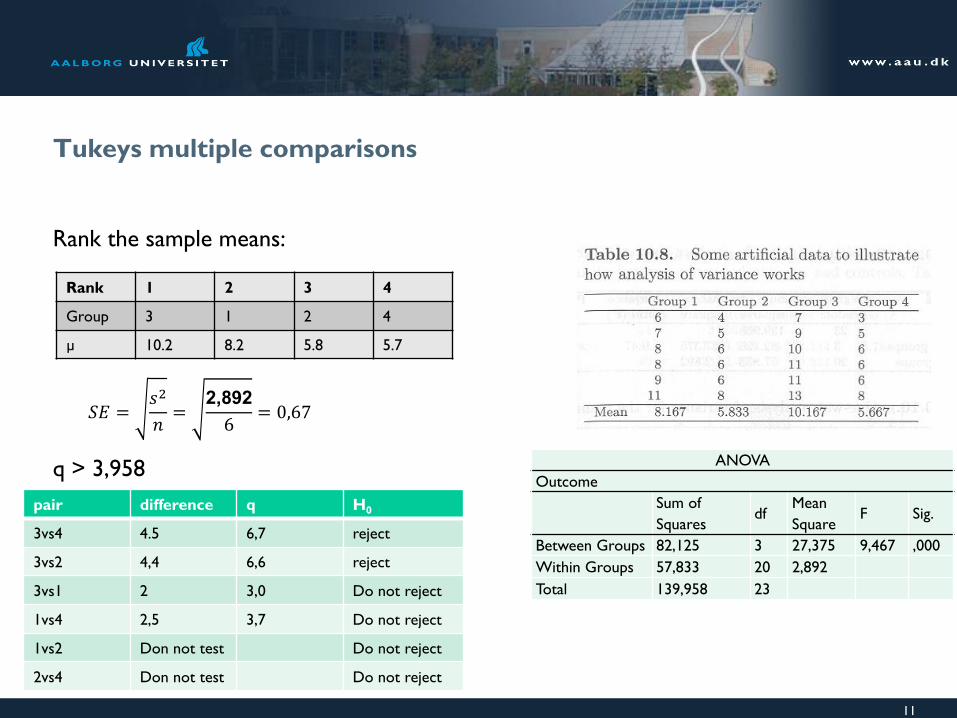
Tukeys multiple comparisons
Rank the sample means:
q > 3,958
11
Rank 1 2 3 4
Group 3 1 2 4
µ 10.2 8.2 5.8 5.7
𝑆𝐸 =𝑠2
𝑛=
2,892
6= 0,67
ANOVA
Outcome
Sum of
Squares df
Mean
Square F Sig.
Between Groups 82,125 3 27,375 9,467 ,000
Within Groups 57,833 20 2,892
Total 139,958 23
pair difference q H0
3vs4 4.5 6,7 reject
3vs2 4,4 6,6 reject
3vs1 2 3,0 Do not reject
1vs4 2,5 3,7 Do not reject
1vs2 Don not test Do not reject
2vs4 Don not test Do not reject

1-way ANOVA in SPSS
12

Comparison between sevreal medians
Kruskal-Wallis test
H0: The distribution of the groups are equal
1-Way ANOVA for non-normal data
13
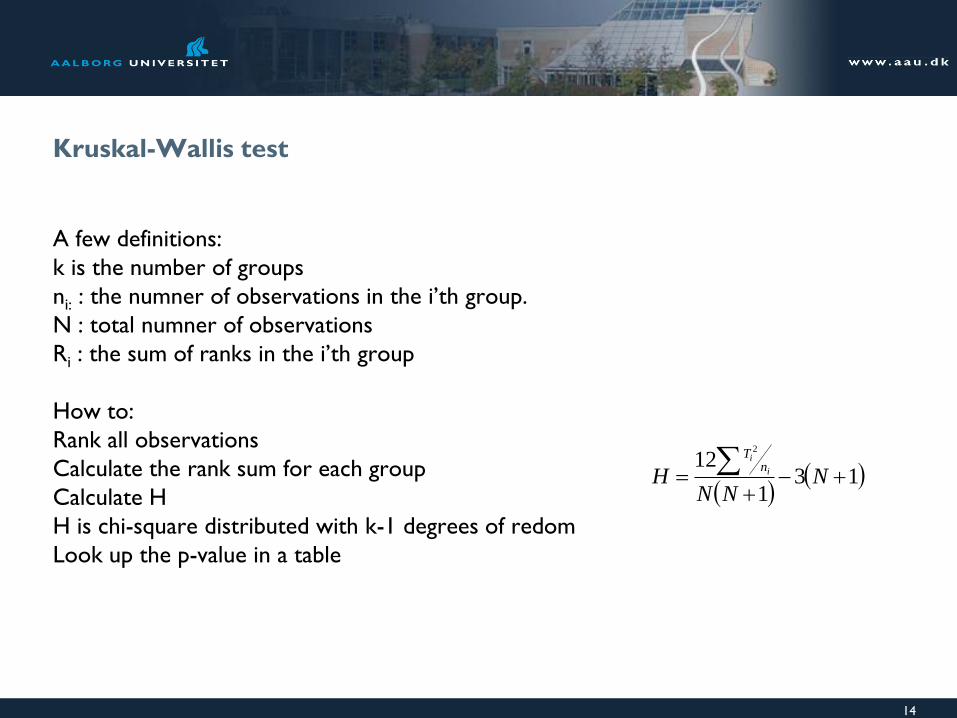
Kruskal-Wallis test
A few definitions:
k is the number of groups
ni: : the numner of observations in the i’th group.
N : total numner of observations
Ri : the sum of ranks in the i’th group
How to:
Rank all observations
Calculate the rank sum for each group
Calculate H
H is chi-square distributed with k-1 degrees of redom
Look up the p-value in a table
14
13
1
122
NNN
H i
in
T

Kruskal-Wallis test – An example
15
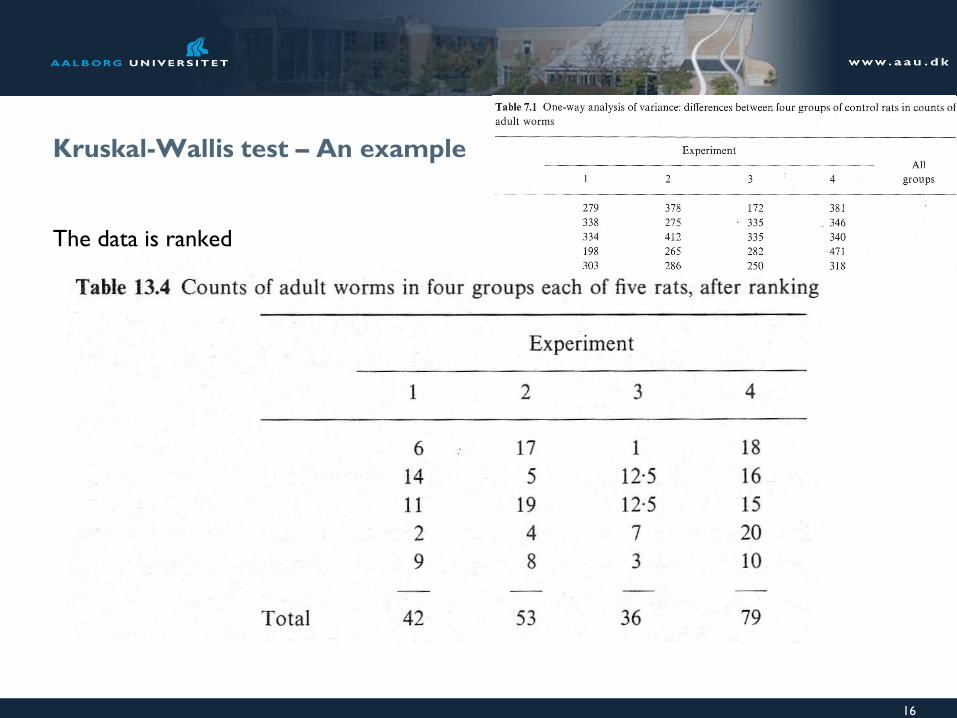
Kruskal-Wallis test – An example
The data is ranked
16
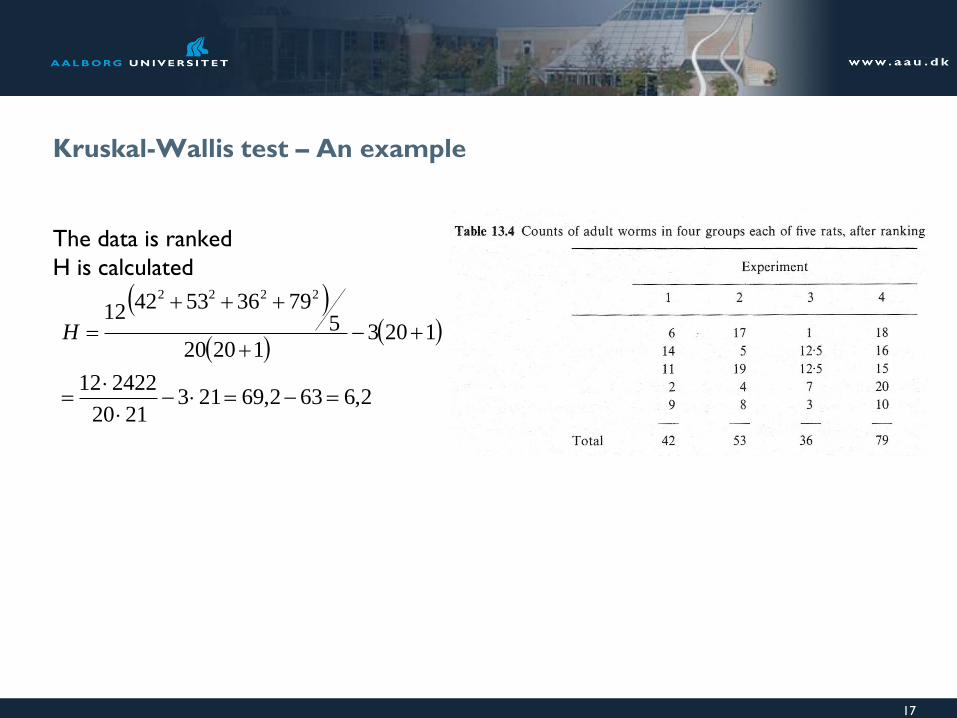
Kruskal-Wallis test – An example
The data is ranked
H is calculated
17
2,6632,692132120
242212
120312020
579365342
122222
H
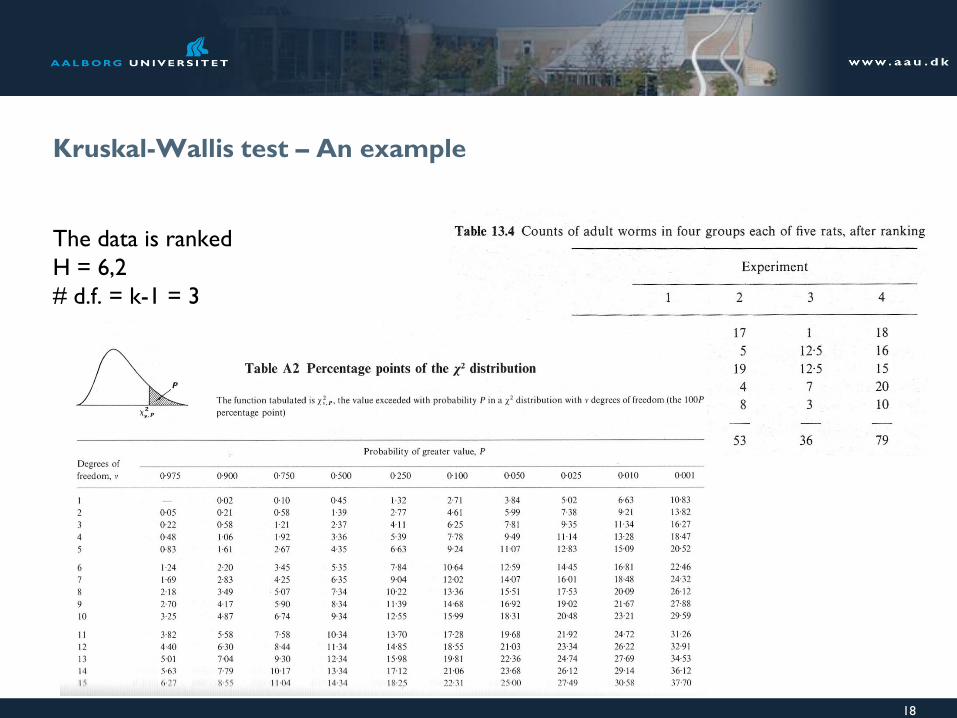
Kruskal-Wallis test – An example
The data is ranked
H = 6,2
# d.f. = k-1 = 3
18

Kruskal-Wallis test – in SPSS
19

Kruskal-Wallis test – i SPSS
20

Kruskal-Wallis test – i SPSS
Ranks
group N Mean Rank
count 1,00 5 8,40
2,00 5 10,60
3,00 5 7,20
4,00 5 15,80
Total 20
21
Test Statisticsa,b
count
Chi-Square 6,205
df 3
Asymp. Sig. ,102
a. Kruskal Wallis Test
b. Grouping Variable:
group

Two-factor ANOVA with equal replications
Experimental design: 2 2 (or 22)
factorial with n = 5 replicate
Total number of observations:
N = 2 2 5 = 20
Equal replications also termed
orthogonality
22

The hypothesis
H0: There is on effect of hormone treatment on the mean plasma concentration
H0: There is on difference in mean plasma concentration between sexes
H0: There is on interaction of sex and hormone treatment on the mean plasma
concentration
Why not just use one-way ANOVA with for levels?
23
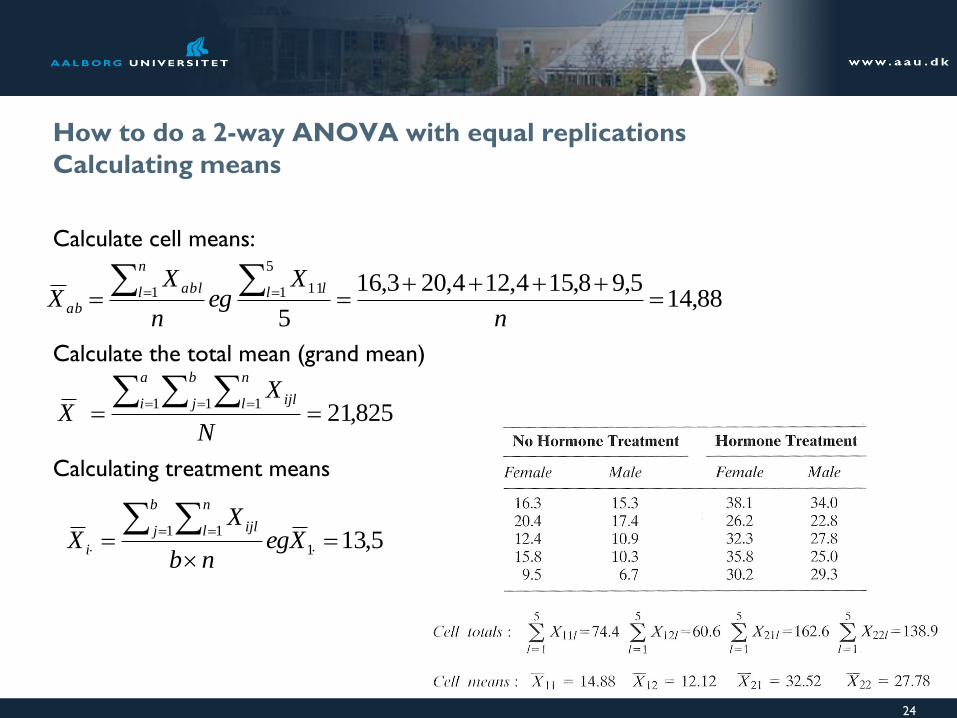
How to do a 2-way ANOVA with equal replications
Calculating means
Calculate cell means:
Calculate the total mean (grand mean)
Calculating treatment means
24
88,145,98,154,124,203,16
5
5
1 111
n
Xeg
n
XX l l
n
l abl
ab
825,211 1 1
N
XX
a
i
b
j
n
l ijl
5,131
1 1
Xeg
nb
XX
b
j
n
l ijl
i
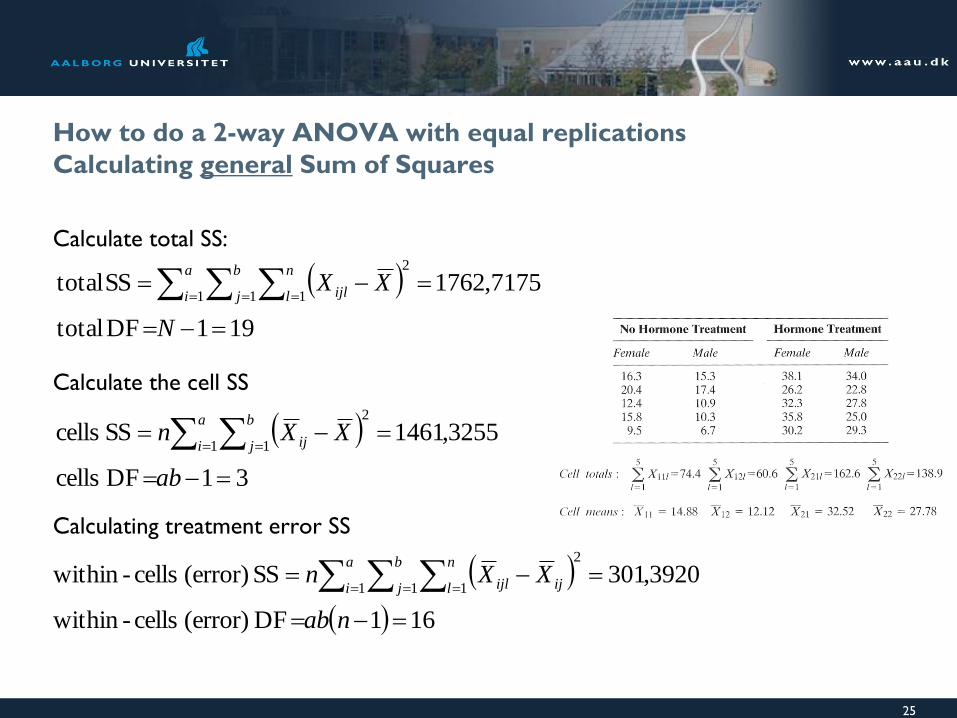
How to do a 2-way ANOVA with equal replications
Calculating general Sum of Squares
Calculate total SS:
Calculate the cell SS
Calculating treatment error SS
25
191DF total
7175,1762SS total2
1 1 1
N
XXa
i
b
j
n
l ijl
31DF cells
3255,1461SS cells2
1 1
ab
XXna
i
b
j ij
161DF (error) cells-within
3920,301SS (error) cells-within2
1 1 1
nab
XXna
i
b
j
n
l ijijl
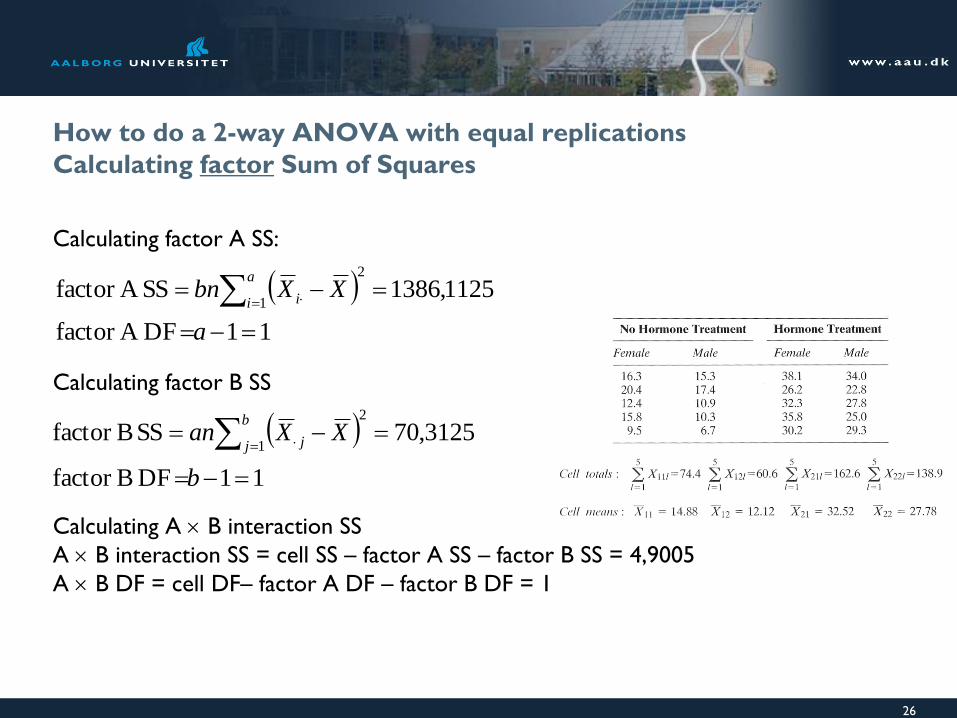
How to do a 2-way ANOVA with equal replications
Calculating factor Sum of Squares
Calculating factor A SS:
Calculating factor B SS
Calculating A B interaction SS
A B interaction SS = cell SS – factor A SS – factor B SS = 4,9005
A B DF = cell DF– factor A DF – factor B DF = 1
26
11DF Bfactor
3125,70SS Bfactor 2
1
b
XXanb
j j
11DFA factor
1125,1386SSA factor 2
1
a
XXbna
i i
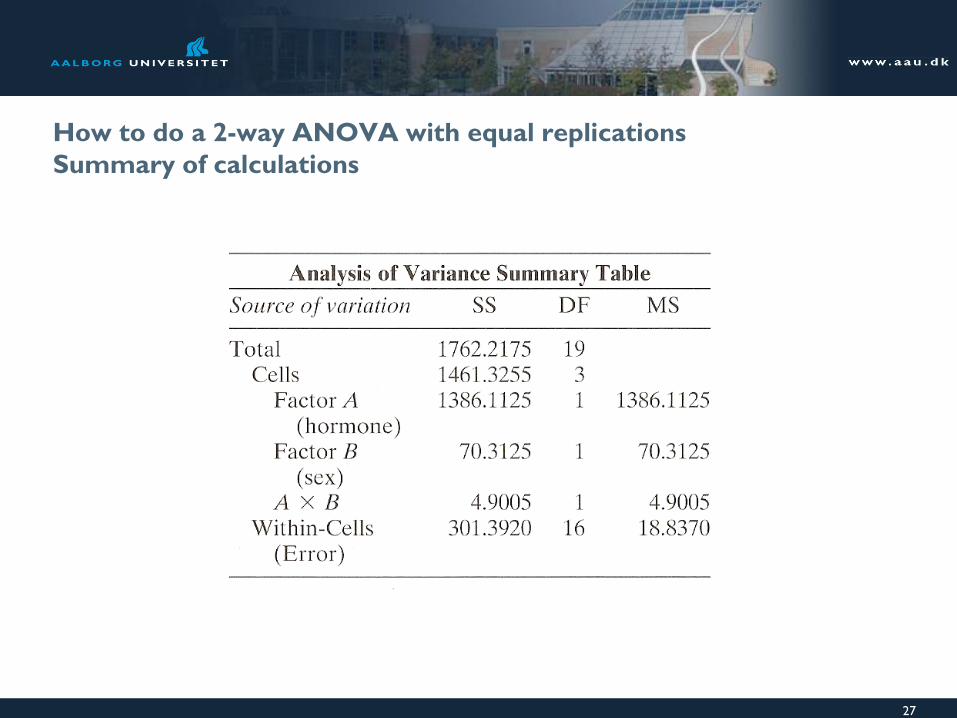
How to do a 2-way ANOVA with equal replications
Summary of calculations
27

How to do a 2-way ANOVA with equal replications
Hypothesis test
H0: There is on effect of hormone treatment on the
mean plasma concentration
F = hormone MS/within-cell MS =
1386,1125/18,8370 = 73,6
F0,05(1),1,16 = 4,49
H0: There is on difference in mean plasma
concentration between sexes
F = sex MS/within-cell MS = 3,73
F0,05(1),1,16 = 4,49
H0: There is on interaction of sex and hormone
treatment on the mean plasma concentration
F = A B MS/within-cell MS = 0,260
F0,05(1),1,16 = 4,49
28

Visualizing 2-way ANOVA
Table 12.2 and Figure 12.1
29
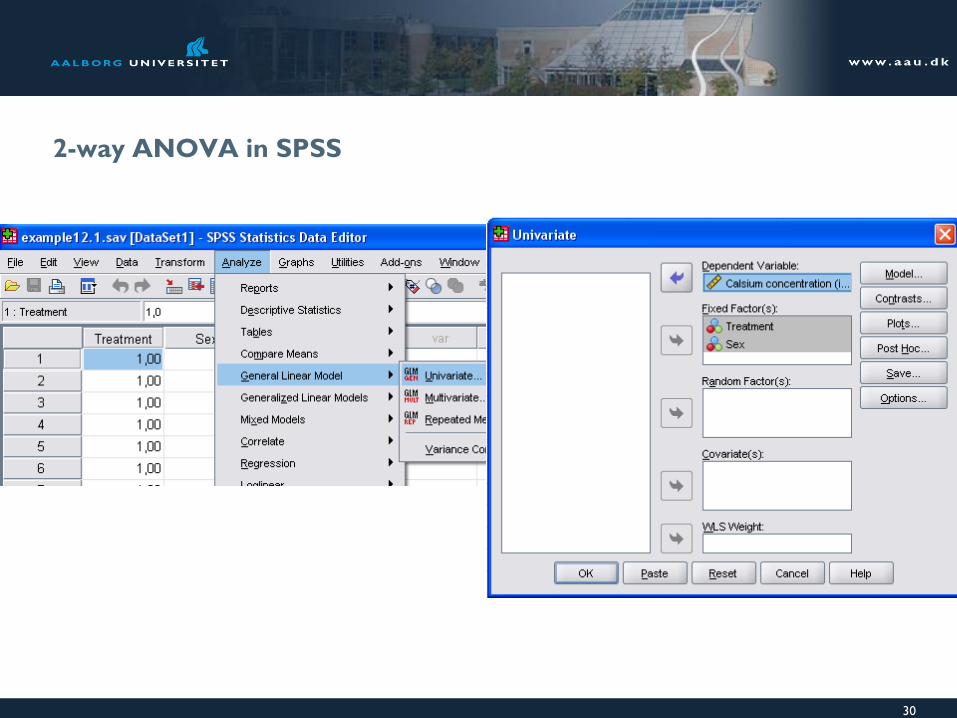
2-way ANOVA in SPSS
30

2-way ANOVA in SPSS
31
Click Add
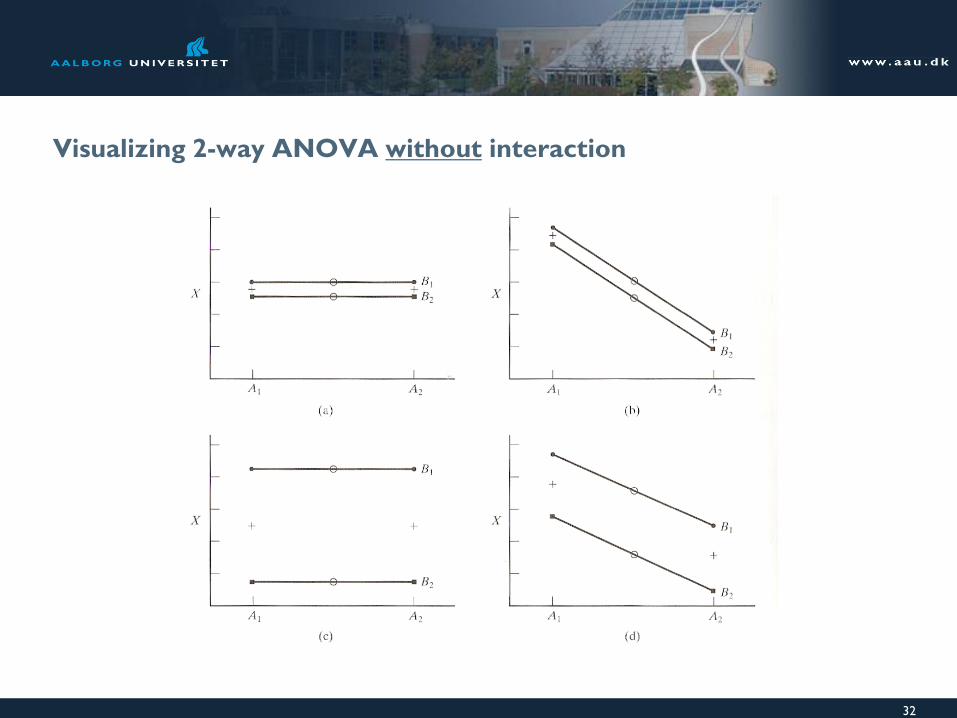
Visualizing 2-way ANOVA without interaction
32
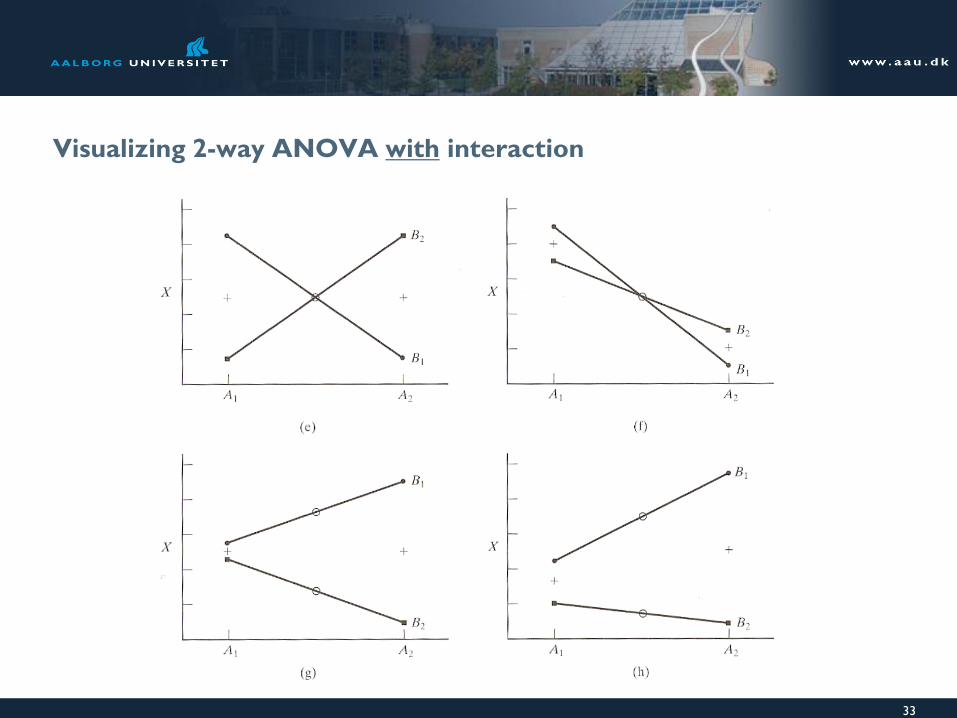
Visualizing 2-way ANOVA with interaction
33

2-way ANOVA
Random or fixed factor
Random factor: Levels are selected at random…
Fixed factor: The ’value’ of each levels are of interest and selected on purpose.
34
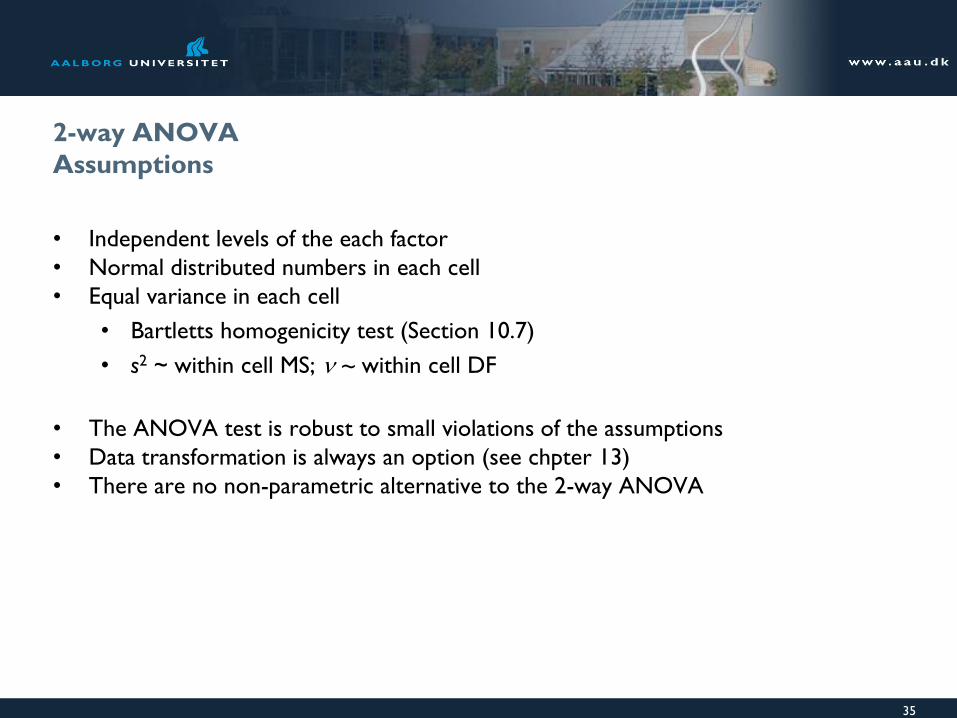
2-way ANOVA
Assumptions
• Independent levels of the each factor
• Normal distributed numbers in each cell
• Equal variance in each cell
• Bartletts homogenicity test (Section 10.7)
• s2 ~ within cell MS; ~ within cell DF
• The ANOVA test is robust to small violations of the assumptions
• Data transformation is always an option (see chpter 13)
• There are no non-parametric alternative to the 2-way ANOVA
35

2-way ANOVA
Multiple Comparisons
Multiple comparesons tests ~ post hoc tests can be used as in one-way ANOVA
Should only be performed if there is a main effect of the factor and no interaction
36
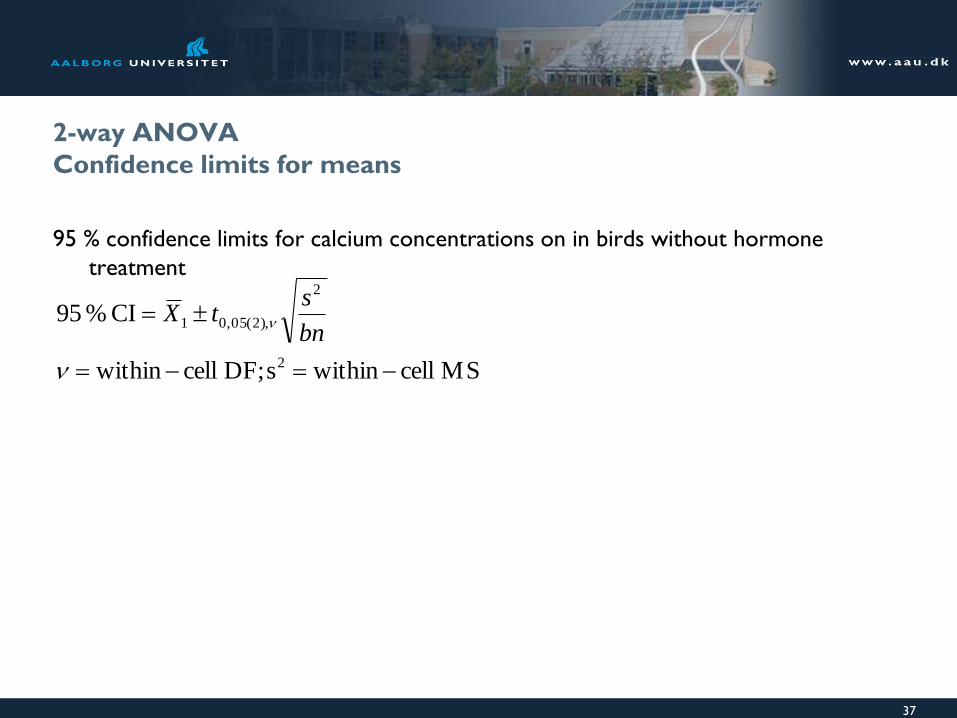
2-way ANOVA
Confidence limits for means
95 % confidence limits for calcium concentrations on in birds without hormone
treatment
37
MS cellwithins DF; cellwithin
CI % 95
2
2
),2(05,01
bn
stX
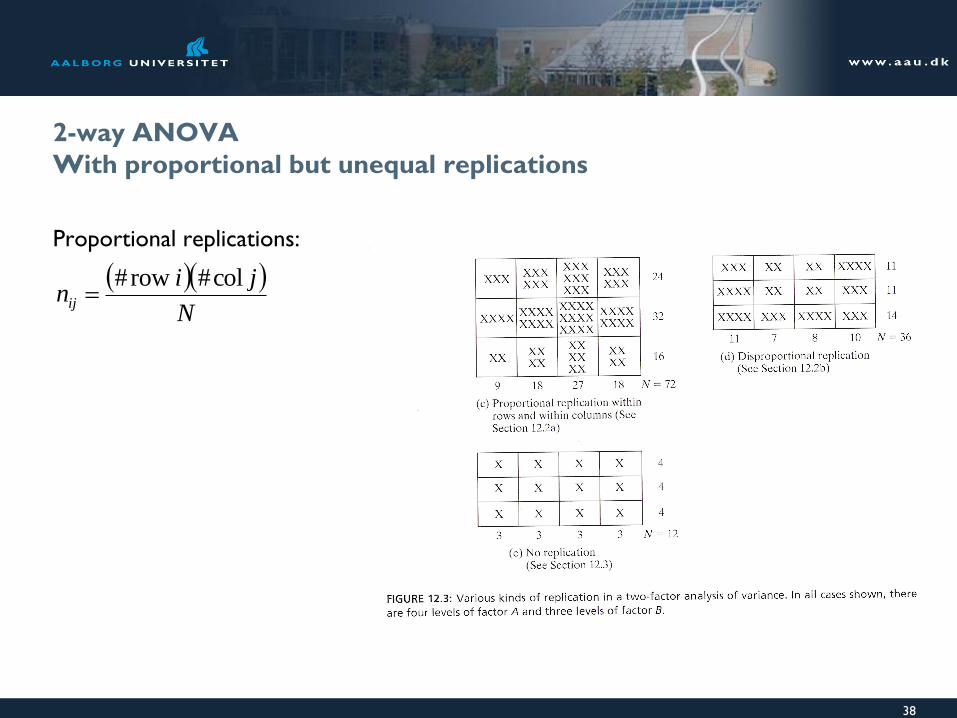
2-way ANOVA
With proportional but unequal replications
Proportional replications:
38
N
jinij
col# row#
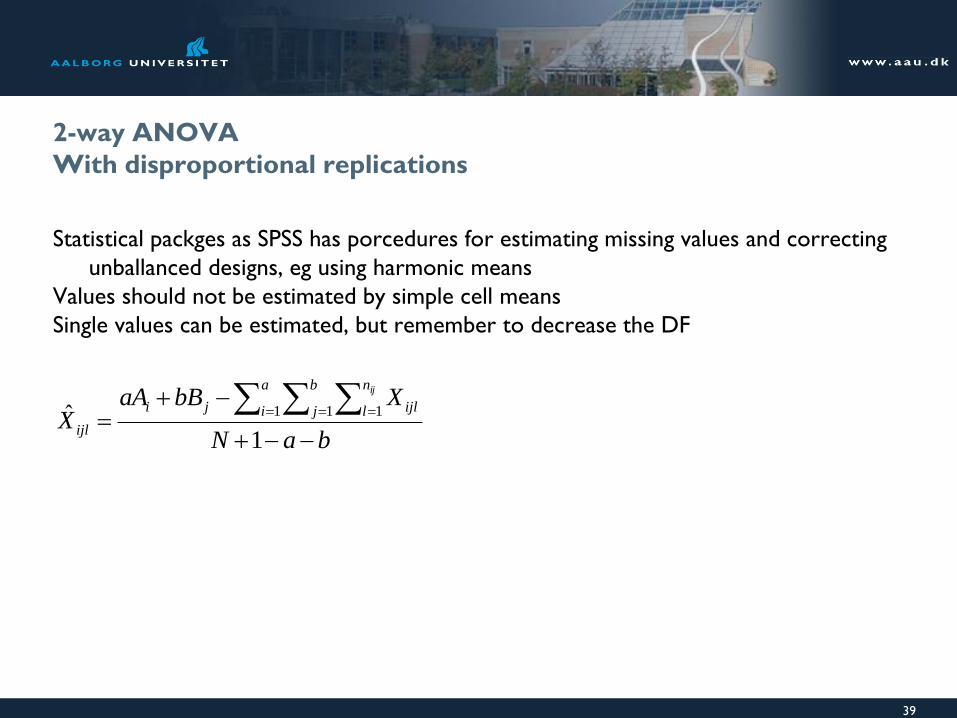
2-way ANOVA
With disproportional replications
Statistical packges as SPSS has porcedures for estimating missing values and correcting
unballanced designs, eg using harmonic means
Values should not be estimated by simple cell means
Single values can be estimated, but remember to decrease the DF
39
baN
XbBaAX
a
i
b
j
n
l ijlji
ijl
ij
1ˆ 1 1 1
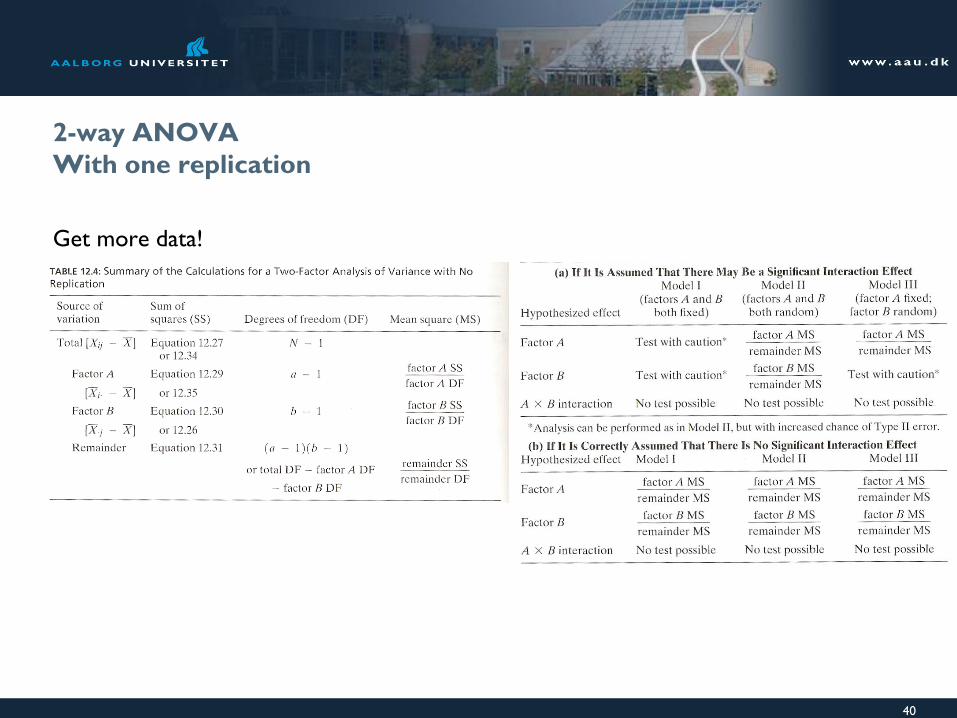
2-way ANOVA
With one replication
Get more data!
40
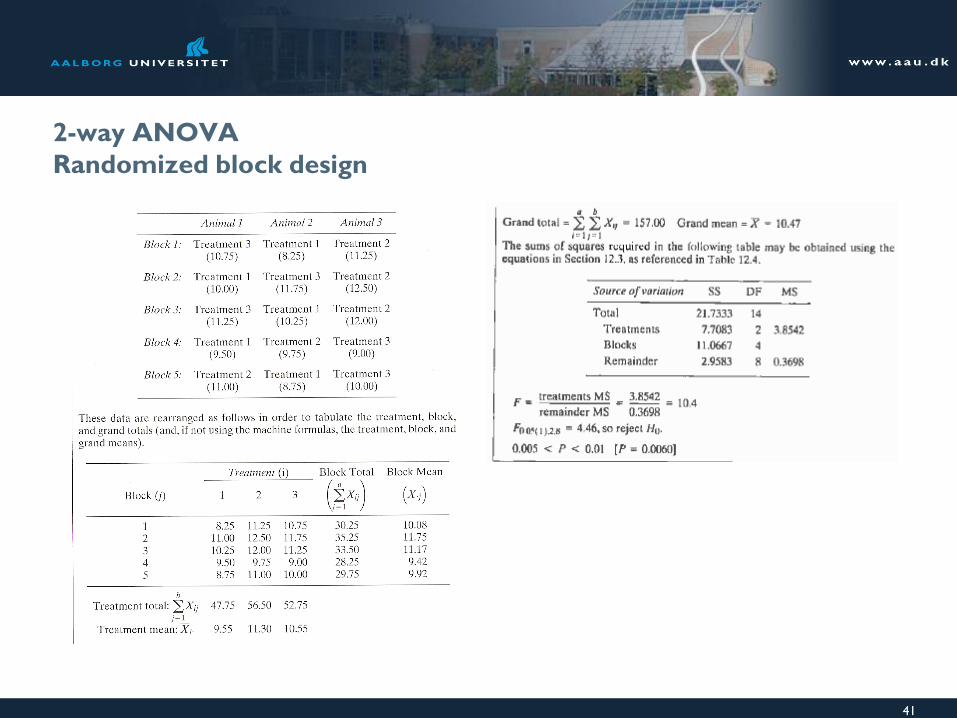
2-way ANOVA
Randomized block design
41

2-way ANOVA
Repeated measures
• Repeating measurements in the same
‘subject’, like a paired t-test
• An additional assumption is that the
correlation between pairs of groups is
equal: compound symmetry
• if this is not the case, try multivariate
ANOVA or linear mixed model
42