Embed Size (px)
Citation preview

SOFTWARE TESTING, VERIFICATION AND RELIABILITYSoftw. Test. Verif. Reliab. (2015)Published online in Wiley Online Library (wileyonlinelibrary.com). DOI: 10.1002/stvr.1573
Anomaly detection in performance regression testing bytransaction profile estimation
Shadi Ghaith1,*,† , Miao Wang1, Philip Perry1, Zhen Ming Jiang2, Pat O’Sullivan3 andJohn Murphy1
1Lero, Performance Engineering Lab, School of Computer Science and Informatics, University College Dublin,Dublin, Ireland
2Department of Electrical Engineering and Computer Science, York University, Toronto, ON, Canada3Systems and Performance Engineering, IBM Dublin, Dublin, Ireland
SUMMARY
As part of the process to test a new release of an application, the performance testing team need to confirmthat the existing functionalities do not perform worse than those in the previous release, a problem known asperformance regression anomaly. Most existing approaches to analyse performance regression testing datavary according to the applied workload, which usually leads to the need for an extra performance testingrun. To ease such lengthy tasks, we propose a new workload-independent, automated technique to detectanomalies in performance regression testing data using the concept known as transaction profile (TP). TheTP is inferred from the performance regression testing data along with the queueing network model of thetesting system. Based on a case study conducted against two web applications, one open source and oneindustrial, we have been able to automatically generate the ‘TP run report’ and verify that it can be used touncover performance regression anomalies caused by software updates. In particular, the report helped us toisolate the real anomaly issues from those caused by workload changes with an average F1 measure of 85%for the open source application and 90% for the industrial application. Such results support our proposal touse the TP as a more efficient technique in identifying performance regression anomalies than the state ofthe art industry and research techniques. Copyright © 2015 John Wiley & Sons, Ltd.
Received 27 November 2013; Revised 11 November 2014; Accepted 14 February 2015
KEY WORDS: software update; performance models; performance regression testing
1. INTRODUCTION
When an enterprise application is tested during development, it is important to not only test itsability to perform desired functions through functional tests but also to assess how well it performsthose functions through performance testing. As part of this performance testing process, testingteams need to perform regression testing on each new release or milestone build of the software tomake sure that the existing functionalities do not perform worse than the previous version [1], sucha problem is known as performance regression anomaly [2].
A performance testing run involves exposing the application to a field-like workload using loadgenerators such as HP LoadRunner [3] and JMeter [4] (open source load generator) for an extendedperiod [5] to simulate normal users interacting with the system. In most cases, testing teams need tocollect a huge amount of performance counters to analyse and compare against previous base-linerelease counters to identify performance regression anomalies.
When interacting with the enterprise application, users initiate software transactions to invokevarious application functions such as the system login and browsing system catalogues. When such
*Correspondence to: Shadi Ghaith, School of Computer Science and Informatics, University College Dublin, Ireland.†E-mail: [email protected]
Copyright © 2015 John Wiley & Sons, Ltd.

S. GHAITH ET AL.
a transaction request is triggered, it propagates through the system tiers and is served by each systemresource such as CPU, disk input/output (I/O) and Network to fulfil the user demand, and a responseis sent back to the user once it is complete [6].
The performance counters that are gathered during the software tests are mainly under thefollowing two categories [7]:
1. Transaction response time (TRT). The total time to process the request using the varioussystem resources [8]. The TRT, along with transactions types and transactions rates, can becollected by most load generators, such as HP LoadRunner and JMeter.
2. Resource utilization (RU) of the computer system resources such as CPU, disk I/O and Net-work [9]. It is produced by monitoring tools (such as Perfmon (the system monitoring tool onWindows platform), NMON [10] and TCPDump [11]) on the various servers.
These counters are then investigated for anomalous behaviours such as an increase in the TRT fora particular transaction, unless it has been redesigned and equivalent functionality is discontinued, oran increase of the RU, such as CPU, for one of the servers [12]. For example, if the TRT of a certaintransaction is increased from 0.25 to 0.28 s, a performance regression anomaly is then flagged, andthe run is considered as a failure, otherwise the run is considered as a pass. Figure 1 shows a highlevel diagram for the software performance regression testing process [12].
Based on the process illustrated in the Figure 1, the following challenges need to be overcome:
1. Workload changes: Runs on new releases usually need to be carried out with a different work-load to account for changing field requirements [13]. The workload changes can happen byeither changing the number of users accessing the system, or by using a new transaction mix,which is defined as the fractions of the users issuing each transaction type. Thus, changes tothe performance counters can be caused by either a change of the workload applied during thetesting run or an anomalous change in the new software release. Traditionally, because of theworkload dependency, an extra run on the new release with a similar workload to the previousrelease workload is conducted, which is time and resource consuming.
2. Manual process: The testing engineer needs to investigate the various performance countersmentioned earlier to look for anomalies in the TRT or RU. However, in a typical project lifecycle performance regression testing is conducted only at later stages, where it is usuallydelayed and leaving very little time to properly run regression tests and manually analyse theresult [1]. Furthermore, as a huge amount of performance counters are collected, manuallycarrying out the data analysis is not viable.
From the preceding text, it can be inferred that the need for a workload-independent, automatedsolution to analyse performance regression testing data is appealing [1, 13, 14]. Accordingly, in[15, 16] we introduced an approach to reduce the lengthy process to detect performance regressionanomalies in software systems caused by a software update and isolate them from those caused byload variations. We do so by applying concepts from queueing networks domain as used for capacitymanagement process of computer systems. This workload-independent, automated approach aims
Figure 1. Performance regression testing process [12].
Copyright © 2015 John Wiley & Sons, Ltd. Softw. Test. Verif. Reliab. (2015)DOI: 10.1002/stvr
A TECHNIQUE TO DETECT PERFORMANCE REGRESSION ANOMALIES
to detect the majority of anomalies and therefore reduce the testing time, the time taken for eachrelease cycle, the costs and the time to market for each release.
We achieve this by introducing a new metric, other than TRT, which is independent of the appliedworkload. This metric is called transaction profile (TP) [17]. We propose to use the output of perfor-mance testing process, mainly the TRT and RU counters, and the queueing network model (QNM)[18] of the testing system to calculate the TP. Conceptually, if the testing system is viewed as aQNM, then the TP is the input and the TRT and RU are the outputs. Given the TRT and RU, theQNM can be reverse-solved to obtain the TP. Because the TP is independent of the workload appliedto the system, it is only sensitive to variations caused by software updates.
The main contributions of this paper are as follows:
1. Introduce a technique to allow applying the TP approach to deployments with complexconfigurations, such as clusters of application and database servers.
2. Compare the TP-based technique with the main existing industrial approach (i.e. manualprocess using TRTs) and the state of the art research approach based on control charts [5].
3. A comprehensive case study on a large-scale industrial application provided by our businesspartner on their testing environment, with a realistic test run size and duration.
The remainder of the paper is structured as follows. First, we discuss the current performancetesting process in Section 2, then we introduce our TP approach in Section 3, followed by a descrip-tion of the QNM of computer systems and solving them in Section 4. Section 5 introduces proposedapproaches to obtain the TP. A case study is presented in Section 6 followed by a discussion of thecurrent limitations and future work in Section 7. Finally, related work and conclusions are coveredin Sections 8 and 9, respectively.
2. PERFORMANCE REGRESSION TESTING PROCESS
In conventional software building process, the performance testing step is usually performed towardsthe end of the release cycle. Performance testing is concerned with the responsiveness (speed)of various transactions when performed concurrently by multiple users. Performance testing doesnot involve any functional verification including those caused by users concurrently accessing thesystem, which is covered in previous phases of the testing process.
The TRTs of various transactions are measured and compared with targeted values, typically spec-ified in the service level agreement (SLA). Additionally, it is important to ensure that transactionsfrom the previous version have not regressed [12, 19].
There is no separate performance regression testing process set; instead, it is usually performedas part of the general performance testing process, which involves at least two runs [12, 20]
1. Primary performance testing run (PPTR) (usually referred to as just performance testing run):This run is performed with new expected field-like workload using the entire transactions set(new and previous). The TRTs are measured and compared with targeted values as per theSLA).
2. Performance regression testing run (PRTR): The TRTs of the PPTR cannot be compared withTRTs from previous release because of different workloads (number of users and the transac-tion mix) [9]. Hence, the PRTR is performed on the new release but with a workload similarto that used in the previous release [19]. This run is compared with previous release run asdepicted in Figure 1.
Each of these two runs takes several hours to execute in addition to various tasks required beforeand after each of them (e.g. reset the database, clean up and collect logs of various measuring tools),which is added to the time required to analyse both runs data to identify anomalies. Table I showsdata obtained from our industrial collaborator about the time taken for a typical performance test.Depending on the development process, each run is repeated many times ranging from 10 to 100times every release.
Following the analysis step, the information about any anomalous behaviours is fed back to thedevelopment team to fix. In addition to the two major challenges mentioned in Section 1, namely
Copyright © 2015 John Wiley & Sons, Ltd. Softw. Test. Verif. Reliab. (2015)DOI: 10.1002/stvr

S. GHAITH ET AL.
Table I. List of activities required to conduct a performance test run and the time required to do each one ofthem (data provided by our industrial collaborator).
Activity Typical time Comment
SUT restore� 38–40 min
SUT start servers 21 min
SUT start and run of1 h 44 min
A number of schedules withperformance workload
2 h 24 mindifferent timings are used.3 h 52 min (most common)
4 h 20 min
SUT collect logs 12–20 min This includes zipping the entireperformance tester workspace
SUT parse result 6 min To produce reports
Initial review of reports A few minutes To see if the run is good
Any more in-depth analysis Variable time
�SUT, system under test (i.e. all the machines making up a test system).
the time constraints and the workload changes, narrowing a regressed transaction in a large complexsystem down to a specific component is an extra considerable challenge.
Moreover, performance testing process in an agile software production process is performed mul-tiple times at the end of each iteration or group of iterations. The time window available to conductsuch performance runs is even tighter than the conventional process putting extra challenges on theperformance testing process. New functionalities are introduced in each iteration in the agile pro-cess and so the transactions mix changes, which lead to different workload levels in each iterationmaking the regression testing process even more time and resources consuming. Hence, improv-ing the process described earlier will be even more substantial for the agile process. Additionally,trends evolving for various performance counters across iterations are important for the decisionmakers participating in the software-building process including requirements engineering, systemarchitects, developers and product management.
In this paper, we modify the performance testing process by eliminating the need for the PRTRand instead utilize the PPTR conducted at the new workload levels. We achieve this by introducinga new variant of the TRT called the TP, which will not change across runs with different workloads.The TP is obtained by analysing the readily available data of the PPTR (with new workload require-ments). The goal is to improve the performance testing step by significantly reducing (up to 50%)the time and resources required to perform performance testing and keeping the process as simpleas possible. Similarly, our modified process provides useful information about the actual resourcescontributing to the performance regression anomaly.
3. NOVEL TRANSACTION PROFILE APPROACH
3.1. What is the transaction profile?
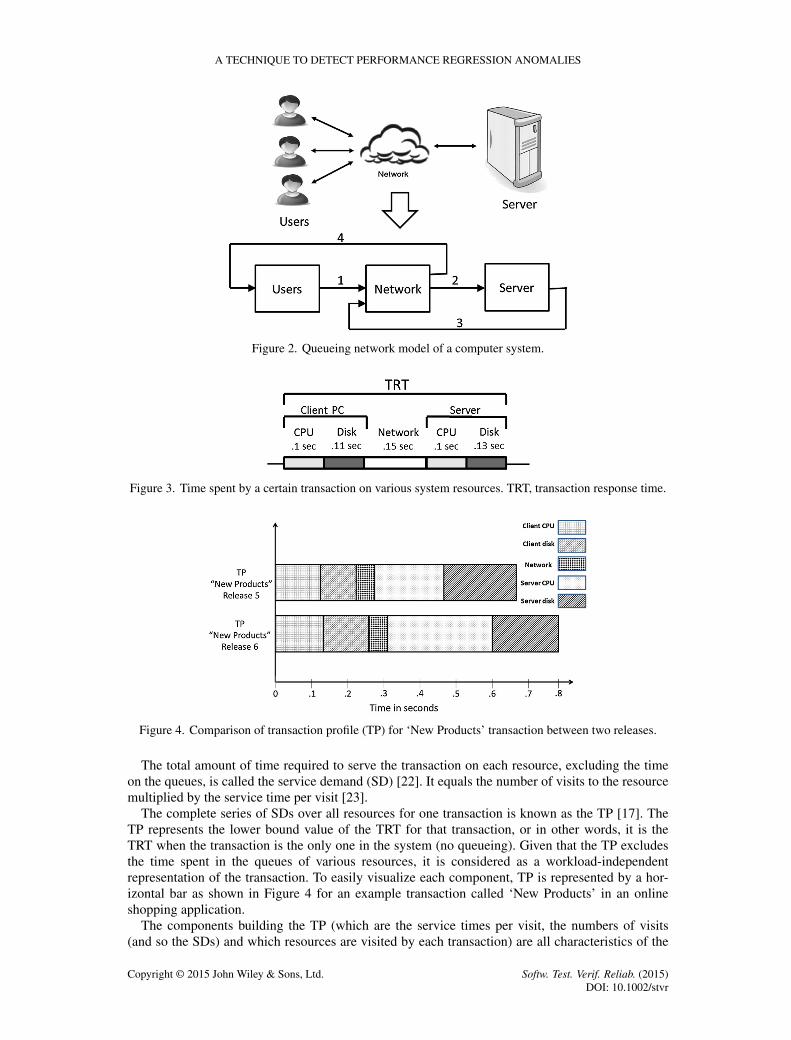
The systems under investigation here are composed of end users connected through a network to asoftware system deployed on one or more servers, which can be represented by a QNM as the oneshown in Figure 2.
Each user initiates one transaction at a time that visits various resources, such as CPU anddisk I/O, to fulfil the user’s request [17, 21]. The distribution of the time required to process acertain transaction, the TRT, is shown in Figure 3. The TRT varies with workload as it includesthe time spent waiting in queues for access to share resource. The queue lengths depend on thenumber of users accessing the system and the mix of transactions being processed at a giventime. The mix of transactions varies according to different usage scenarios. Hence, we lookfor an alternative metric to the TRT that does not depend on workload (i.e. not sensitive toqueueing effect).
Copyright © 2015 John Wiley & Sons, Ltd. Softw. Test. Verif. Reliab. (2015)DOI: 10.1002/stvr
A TECHNIQUE TO DETECT PERFORMANCE REGRESSION ANOMALIES
Figure 2. Queueing network model of a computer system.
Figure 3. Time spent by a certain transaction on various system resources. TRT, transaction response time.
Figure 4. Comparison of transaction profile (TP) for ‘New Products’ transaction between two releases.
The total amount of time required to serve the transaction on each resource, excluding the timeon the queues, is called the service demand (SD) [22]. It equals the number of visits to the resourcemultiplied by the service time per visit [23].
The complete series of SDs over all resources for one transaction is known as the TP [17]. TheTP represents the lower bound value of the TRT for that transaction, or in other words, it is theTRT when the transaction is the only one in the system (no queueing). Given that the TP excludesthe time spent in the queues of various resources, it is considered as a workload-independentrepresentation of the transaction. To easily visualize each component, TP is represented by a hor-izontal bar as shown in Figure 4 for an example transaction called ‘New Products’ in an onlineshopping application.
The components building the TP (which are the service times per visit, the numbers of visits(and so the SDs) and which resources are visited by each transaction) are all characteristics of the
Copyright © 2015 John Wiley & Sons, Ltd. Softw. Test. Verif. Reliab. (2015)DOI: 10.1002/stvr

S. GHAITH ET AL.
software. They only change when the software is updated in a manner that affects its performance.Such changes include things such as requiring more visits to the disk I/O or extra CPU processingas well as requiring service from new resources such as the introduction of a database call to retrievean extra piece of data to fulfil a new functional requirement.
Although an enterprise application may consist of hundreds of transactions, usually only a fewof them are key transactions that are used repeatedly by most users. The set of all TPs for a singleapplication is known as the application profile [17].
It is worth mentioning that the TP does not represent a real working scenario, as it is not realisticto have a single user accessing the system; instead, it is just a hypothetical concept that is used withthe QNM of the system to predict performance under different workload levels as will be explainedin Section 4.
3.2. Applying the transaction profile approach to performance regression testing
Given that the TP reveals some important performance characteristics about the transaction, we pro-pose to use it as a workload-independent indicator of transaction performance in software systems,mainly in performance regression testing. The TP can change only if the software is updated in away that affects its performance (and not by applying a new workload). Such changes may be causedby normal development tasks such as functional bug fixes as well as by adding new functionalitiesor modifying existing ones.
The central premise here is as follows:An automated (or visual) comparison between the TP of the two releases will highlight anomalous
behaviour caused by software update as opposed to those caused by applying a new workload.As shown in Figure 4, a comparison between the TP of two software releases uncovers any per-
formance anomaly caused by a software update rather than higher workloads. If the new TP islonger than the old TP, as the case in Figure 4, then this transaction has regressed in the new release.This regression can be analysed further to uncover the resource whose SD contributes most to theincrease in the TP, which is server CPU in this example.
This approach addresses the two major challenges of regression testing explained in Section 1,namely the workload-dependency and the manual approach.
The key novelty is to calculate the TP from normal regression testing data along with the QNMof the system as will be explained in Section 5.
3.3. Transaction profile run report
After the running of new performance tests, the performance engineer now needs to search forperformance regressions in the captured performance data. One key question the engineer needs toanswer is that ‘whether the new software update has caused any degradation of the TRT of varioustransactions?’ To answer such a question, the engineer needs to distinguish this degradation fromthose caused by the workload changes between current and previous runs.
The TP run report tool presented in this paper can be used to do this. By running it against normalperformance data for both releases (including TRTs, RUs and the workload information), it producesa report as shown in Figure 5 that consists of two parts (i) TP report summary and (ii) detailedTP graph.
3.3.1. Transaction profile report summary. The summary page shown in Figure 5(a) shows thetransactions (named ‘New Products’, ‘Home’ and ‘Best Sellers’) that are flagged because their cur-rent TP increased from previous TP by a percentage that exceeds a preset threshold, which wewill determine in the case study section. Such a report gives a first idea about the performancecharacteristics of each transaction.
3.3.2. Detailed transaction profile graph. After obtaining the information about the TP deviationfor the transactions exceeding the threshold, the engineer can investigate the detailed TP graphshown in Figure 5(b). This graph shows the details of the TP deviation both the total TP time andthe individual components making up the TP such as server and client CPU. In this example, the
Copyright © 2015 John Wiley & Sons, Ltd. Softw. Test. Verif. Reliab. (2015)DOI: 10.1002/stvr

A TECHNIQUE TO DETECT PERFORMANCE REGRESSION ANOMALIES
Figure 5. Transaction profile (TP) run report.
Figure 6. Computer system and its queueing network model.
SD on the server CPU has the main contribution to the increase in the TP of the ‘New Products’transaction. Such a change to the SD is likely caused by a change in the transaction code.
The test engineer will now have enough information about each regression and can open ananomaly report including the information from the TP run report.
4. QUEUEING NETWORK MODEL
4.1. Overview
Similar to many other systems, software systems can be represented as a queuing network [17,23–25] as shown in Figure 6. Each node represents one system resource such as CPU, disk I/O andNetwork. Each one of these nodes is composed of a processing unit and a queue. The processingunit serves each request if it is available, otherwise the request waits in the queue [23].
The users node in Figure 6 models end users performing various requests, known as transactionswith a certain arrival rate. When the request leaves the users node, it goes to the application serverCPU. During processing, the application server CPU may need to visit the application server diskI/O to perform certain actions. After the disk I/O finishes serving the request, it returns to the appli-cation server CPU, which resumes serving the request and might visit the disk I/O again or request a
Copyright © 2015 John Wiley & Sons, Ltd. Softw. Test. Verif. Reliab. (2015)DOI: 10.1002/stvr
S. GHAITH ET AL.
service from the database server. Similar to the application server, the database server CPU invokesits disk I/O and returns to application server CPU upon completion. The application server CPUresumes serving the request and may again visit the application server disk I/O, the database serverCPU or return back to the users node. Then, a response is sent back to the users node, it waits in theusers node for a period called the think time (TT), which is the time the user spends analysing theresponse before issuing the next request.
In queueing networks terminology, nodes are referred to as stations and the request types asclasses, while each request is known as a customer [24]. The time to serve a customer in each nodeis known as service time. The customer may visit each node multiple times, known as visits, andthe total time spent by a customer in each node, during all visits, is known as the SD [24] (as wasdefined in Section 3.1).
The model in Figure 6 models the CPU and the disk I/O and ignores the network. This is a validapproximation given the fast network connections between the various servers. This is verified asgood results are obtained by applying this approximation, which is also adapted widely in the capac-ity management field. For example, this assumption is made in the following capacity managementwork [26] and in this book [17].
4.2. Solving queueing network model to predict system performance
Solving a queueing network requires knowledge of two aspects [27]
1. Workload characterization, which includes [17] the following:
(a) A list of all transaction types (classes).(b) The number of users issuing each transaction.(c) TT spent in the users nodes.
2. Service times and number of visits for each transaction (class) at each resource (station) or theSDs (total service time over all visits).
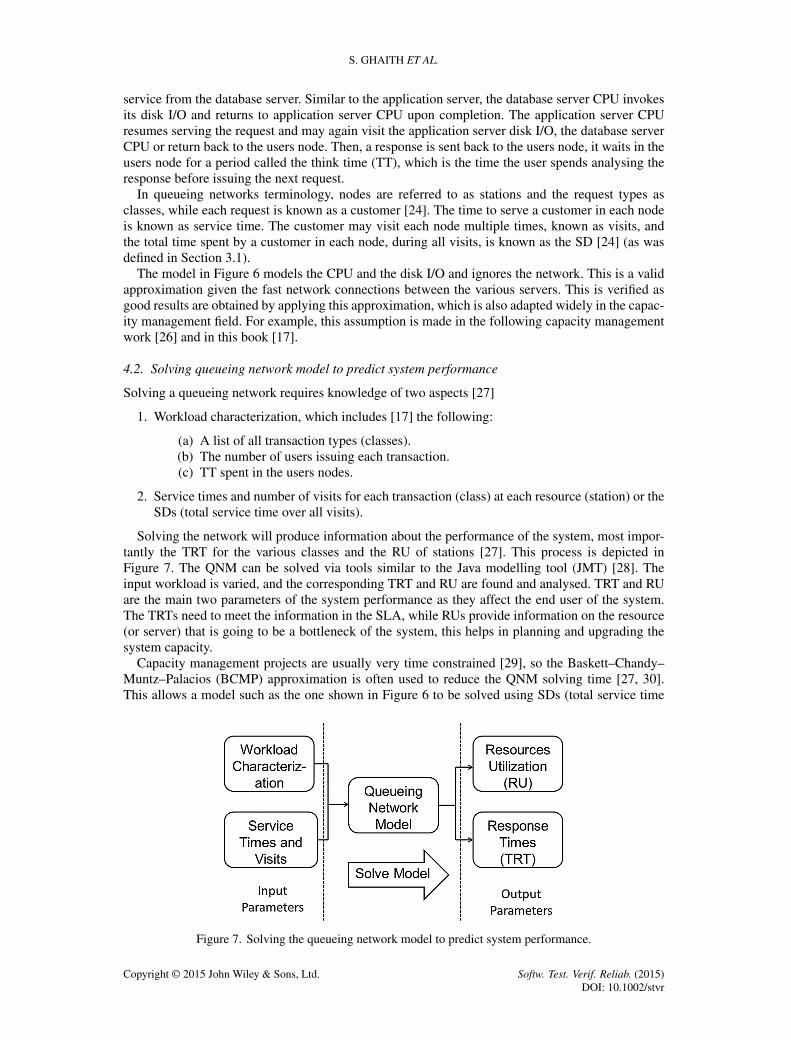
Solving the network will produce information about the performance of the system, most impor-tantly the TRT for the various classes and the RU of stations [27]. This process is depicted inFigure 7. The QNM can be solved via tools similar to the Java modelling tool (JMT) [28]. Theinput workload is varied, and the corresponding TRT and RU are found and analysed. TRT and RUare the main two parameters of the system performance as they affect the end user of the system.The TRTs need to meet the information in the SLA, while RUs provide information on the resource(or server) that is going to be a bottleneck of the system, this helps in planning and upgrading thesystem capacity.
Capacity management projects are usually very time constrained [29], so the Baskett–Chandy–Muntz–Palacios (BCMP) approximation is often used to reduce the QNM solving time [27, 30].This allows a model such as the one shown in Figure 6 to be solved using SDs (total service time
Figure 7. Solving the queueing network model to predict system performance.
Copyright © 2015 John Wiley & Sons, Ltd. Softw. Test. Verif. Reliab. (2015)DOI: 10.1002/stvr
A TECHNIQUE TO DETECT PERFORMANCE REGRESSION ANOMALIES
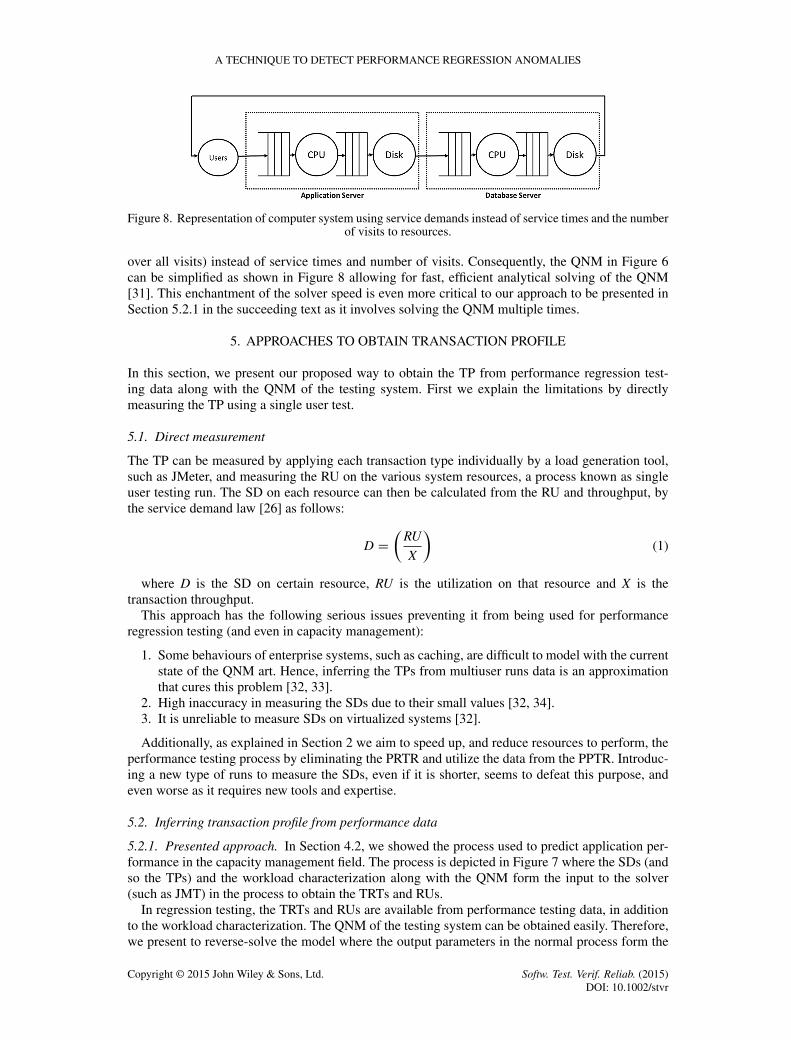
Figure 8. Representation of computer system using service demands instead of service times and the numberof visits to resources.
over all visits) instead of service times and number of visits. Consequently, the QNM in Figure 6can be simplified as shown in Figure 8 allowing for fast, efficient analytical solving of the QNM[31]. This enchantment of the solver speed is even more critical to our approach to be presented inSection 5.2.1 in the succeeding text as it involves solving the QNM multiple times.
5. APPROACHES TO OBTAIN TRANSACTION PROFILE
In this section, we present our proposed way to obtain the TP from performance regression test-ing data along with the QNM of the testing system. First we explain the limitations by directlymeasuring the TP using a single user test.
5.1. Direct measurement
The TP can be measured by applying each transaction type individually by a load generation tool,such as JMeter, and measuring the RU on the various system resources, a process known as singleuser testing run. The SD on each resource can then be calculated from the RU and throughput, bythe service demand law [26] as follows:
D D
�RU
X
�(1)
where D is the SD on certain resource, RU is the utilization on that resource and X is thetransaction throughput.
This approach has the following serious issues preventing it from being used for performanceregression testing (and even in capacity management):
1. Some behaviours of enterprise systems, such as caching, are difficult to model with the currentstate of the QNM art. Hence, inferring the TPs from multiuser runs data is an approximationthat cures this problem [32, 33].
2. High inaccuracy in measuring the SDs due to their small values [32, 34].3. It is unreliable to measure SDs on virtualized systems [32].
Additionally, as explained in Section 2 we aim to speed up, and reduce resources to perform, theperformance testing process by eliminating the PRTR and utilize the data from the PPTR. Introduc-ing a new type of runs to measure the SDs, even if it is shorter, seems to defeat this purpose, andeven worse as it requires new tools and expertise.
5.2. Inferring transaction profile from performance data
5.2.1. Presented approach. In Section 4.2, we showed the process used to predict application per-formance in the capacity management field. The process is depicted in Figure 7 where the SDs (andso the TPs) and the workload characterization along with the QNM form the input to the solver(such as JMT) in the process to obtain the TRTs and RUs.
In regression testing, the TRTs and RUs are available from performance testing data, in additionto the workload characterization. The QNM of the testing system can be obtained easily. Therefore,we present to reverse-solve the model where the output parameters in the normal process form the
Copyright © 2015 John Wiley & Sons, Ltd. Softw. Test. Verif. Reliab. (2015)DOI: 10.1002/stvr

S. GHAITH ET AL.
input for the reverse process. The output now are the SDs (that are used to form the TPs). Thisprocess is depicted in Figure 9.
Novel approach to reverse-solve queueing network model. Looking for an analytical solution toinfer SDs (TPs) from TRTs and RUs is not possible. The equations for closed multiclass QNM arerecursive and cannot be inverted [35]. Yet, estimating SDs from RUs and TRTs has been previouslyexplored in the capacity management domain [32, 34, 36] (more details about these techniques,including their limitations that prevent us from using them in regression testing, are presented inSection 8).
Hence, we present a search-based approach [37] to reverse-solve the QNM using JMT, startingwith an initial TP value, as shown in Figure 10. The initial value can be the TP from the previous runor measured approximately by a single user test. Alternatively, a random value can be used, but thismay increase the time required to converge the search process. The other input, shown in Figure 7,is the workload characterization, which is known and will be fixed across the process so it is notshown in Figure 10.
A relatively standard search-based process is applied, where the local search technique [37] loopsthrough all initial SDs. For each one, it tests the adjacent points by incrementing (decrementing) thatSD with selected steps. The QNM is solved for each of these points, and the outcome is evaluatedusing an EVal Function (which measures the distance between the current and targeted TRTs and
Figure 9. Presented approach to infer transaction profile from performance data (transaction response timeand resource utilization).
Figure 10. Applying a search-based technique to reverse-solve the queueing network model. TRT, transac-tion response time; RU, resource utilization; JMT, Java modelling tool.
Copyright © 2015 John Wiley & Sons, Ltd. Softw. Test. Verif. Reliab. (2015)DOI: 10.1002/stvr

A TECHNIQUE TO DETECT PERFORMANCE REGRESSION ANOMALIES
RUs), and if the best of these neighbour points is better than the current point, the search will moveto that point. The same process is followed for all points in the loop. If the EVal of the proposedsolution generated at the end of the loop is lower than an epsilon value, then the entire search processconcludes with a suitable solution. Otherwise, if the proposed set of TPs yields a result that is betterthan the previous one, but not within the target epsilon, then this is set as a new set of starting TPs,and the loop is restarted. If the proposed solution is not better than the current one (local maximum),then the local search iteration concludes, and a new one is triggered with a new set of starting TPs.
The full details of this approach have been described in a generic way to infer TP from TRTs andRUs (for capacity management purposes) in our recent work [33].
This search-based process involves solving the QNM multiple times before converging to therequired TP. Hence, the performance of the QNM solving process is a key concern for this approach.For simple deployments, such as the one shown in Figure 6, an efficient analytical solution is afford-able. Nevertheless, more complex deployments, mainly those with server clusters, are not readilysolvable by such efficient techniques. In the following subsection, we propose a novel approach toallow for efficient solution for server clusters.
Novel approach to model clusters in queueing network model. Clusters of servers are commonlyused at each tier of most industrial applications. For example, the application may contain clus-ters of web servers, application servers and database servers. This is performed to achieve a betterperformance by utilizing a load balancer to distribute workload between cluster members. In suchcases, the TP contains the SDs from any of the cluster members given that in this paper we assumeall cluster members are identical.
To explain our approach, we present the system shown in Figure 11. A load balancer software,not shown in the figure, distributes the requests between the two application servers in a cluster. Theworkload characterization for this system, Figure 11, is shown in Table II. We assume that the work-load consists of 20 users distributed equally between the two nodes. It contains two transactions,login and search, with SDs of 0.05 and 0.06 s, respectively.
In order to simplify the QNM to one as shown in Figure 12, to be solved analytically, multi-ple transaction groups are introduced; each one corresponds to a member of the application servercluster. Each group contains the same set of the given transactions (i.e. for the search and logintransactions we have search1 and login1 in the transaction group1 that corresponds to AppServer1cluster member and so on). The new workload characterization is shown in Table III.
The total number of users is divided between the various transaction groups, with the SD setto the given value on the corresponding cluster member and zero on the remaining cluster mem-bers. For example, search1 has SD of 0.06 on AppServer1 and zero on AppServer2. For the
Figure 11. Queueing network model of a computer system with a clustered application server. TT, thinktime; App, application; DB, database.
Table II. Service demands for system shown in Figure 11.
Number Users TT AppServer1 AppServer2 DB server CPU DB server diskTransaction of users (s) (s) (s) (s) (s)
Login 20 60 0.05 0.05 0.08 0.09Search 20 60 0.06 0.06 0.08 0.07
TT, think time; App, application; DB, database.
Copyright © 2015 John Wiley & Sons, Ltd. Softw. Test. Verif. Reliab. (2015)DOI: 10.1002/stvr

S. GHAITH ET AL.
Figure 12. Simplification proposed for Figure 11. TT, think time; App, application; DB, database.
Table III. Proposed service demands for system shown in Figure 12.
Number Users TT AppServer1 AppServer2 DB server CPU DB server diskTransaction of users (s) (s) (s) (s) (s)
Login1 10 60 0.05 0.0 0.08 0.09Search1 10 60 0.06 0.0 0.08 0.07Login2 10 60 0.0 0.05 0.08 0.09Search2 10 60 0.0 0.06 0.08 0.07
TT, think time; App, application; DB, database.
Figure 13. Outline of the presented approach. TP, transaction profile; TRT, transaction response time; RU,resource utilization; QNM, queueing network model; JMT, Java modelling tool.
remaining stations (users, database server CPU and disk I/O), the SDs remain the same within alltransaction groups.
The suggested QNM, shown in Figure 12, accompanied with the workload characterization shownin Table III provides similar results to the QNM shown in Figure 11 when both networks are solvedvia the JMT (first one analytically and the second one by simulation). The TRT is the average fromthe various transactions in each group (so TRT of search transaction is the average TRT for search1and search2). These results are obtained given that all nodes are identical, which is a commonassumption in many computer systems. We will ease this condition in our future work.
5.2.2. System overview. Figure 13 shows a high level outline of the presented approach. The dataof the new performance run forms the input to the process, it includes:
1. Log files from load generation tools, such as JMeter, which are parsed to obtain the followinginformation:
(a) Transaction types: The name of the transactions applied during the testing run.(b) Number of users issuing each transaction.(c) Transaction TT: Time required by the user to review the response and to make a
new request.(d) TRT for all transactions. The average TRT over the entire run period.
Copyright © 2015 John Wiley & Sons, Ltd. Softw. Test. Verif. Reliab. (2015)DOI: 10.1002/stvr
A TECHNIQUE TO DETECT PERFORMANCE REGRESSION ANOMALIES
2. Log files from the system monitoring tools (such as Perfmon). One file is available for eachserver in the system that contains the RU for each resource (mainly CPU and disk I/O). Thoseare parsed to obtain the following:
(a) The name of each resource (station) such as database server CPU, DBS and disk I/O.(b) The RU for each of the aforementioned resources. The average RU over the entire
run period.
After parsing the input log files, the QNM is built (in JMT) where the transaction types andresource types are mapped to classes and stations, respectively. This step removes the overheadof manually building the QNM, which is made possible given the BCMP approximation, whichsimplifies such QNMs as explained earlier. But even for more complicated systems, where BCMPmay not be fully applicable, building and validating the QNM will only need to happen once atthe beginning of the first testing cycle and may just need to be updated in the following releases.It is also worth mentioning that QNMs of typical deployment topologies are proposed by capacitymanagement researchers and are applicable to all systems deployed with that topology. This evenapplies to the more complicated QNMs such as those which are software contention aware for threetier systems such as the one introduced in our recent work [29].
Then, as shown in Figure 9, all of the QNM (built in JMT), the TRT and the RU are used toreverse-solve the model as discussed in Section 5.2.1 to obtain the SDs (used to obtain the TP) forall transactions. The first ever run stops at this point and the generated TPs from the TP previousrun(s) for the next run.
Then for all subsequent runs, this set of TPs is compared with the TP previous run(s) to pro-duce the TP run report shown in Figure 5. It marks the transactions whose TPs are higher than thecorresponding TP in the previous runs by the threshold.
All the parts of Figure 13 are automated and require no new procedure from the testing teambeyond running the tool and analyzing the TP run report. Our implementation supports JMeterand Perfmon.
6. CASE STUDY
6.1. Case study design
We have made some assumptions to support the technique presented in this paper. In this section,we investigate whether, and the extent to which, these assumptions are valid by testing them on twoenterprise applications: one open source and one industrial.
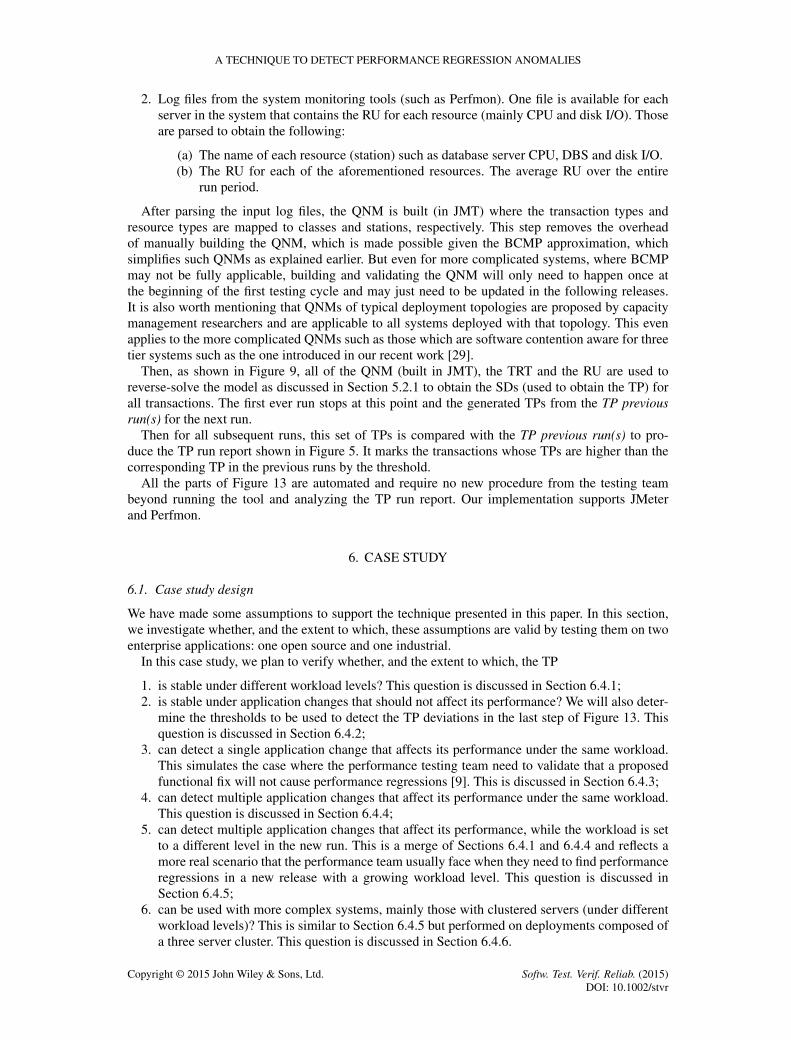
In this case study, we plan to verify whether, and the extent to which, the TP
1. is stable under different workload levels? This question is discussed in Section 6.4.1;2. is stable under application changes that should not affect its performance? We will also deter-
mine the thresholds to be used to detect the TP deviations in the last step of Figure 13. Thisquestion is discussed in Section 6.4.2;
3. can detect a single application change that affects its performance under the same workload.This simulates the case where the performance testing team need to validate that a proposedfunctional fix will not cause performance regressions [9]. This is discussed in Section 6.4.3;
4. can detect multiple application changes that affect its performance under the same workload.This question is discussed in Section 6.4.4;
5. can detect multiple application changes that affect its performance, while the workload is setto a different level in the new run. This is a merge of Sections 6.4.1 and 6.4.4 and reflects amore real scenario that the performance team usually face when they need to find performanceregressions in a new release with a growing workload level. This question is discussed inSection 6.4.5;
6. can be used with more complex systems, mainly those with clustered servers (under differentworkload levels)? This is similar to Section 6.4.5 but performed on deployments composed ofa three server cluster. This question is discussed in Section 6.4.6.
Copyright © 2015 John Wiley & Sons, Ltd. Softw. Test. Verif. Reliab. (2015)DOI: 10.1002/stvr

S. GHAITH ET AL.
In addition, we will analyse the data obtained from various kinds of tests using the existingstatistical process control (SPC) charts approach presented in Section 6.3.2. We will compare theefficiency of the TP and SPC charts-based solutions and show how both approaches are affectedwhen the workload level is varied between runs.
Section 6.2 introduces the two enterprise applications used in the case study. Then in Section 6.3,we present the evaluation approach. Section 6.4 shows the results of the conducted experiments.Finally, in Section 6.5 we discuss the results.
6.2. Description of applications
In our case study, we used the following two enterprise applications:
1. JPetStore 6 application [38], which is an E-Commerce web application that offers varioustypes of pets online. It is a reimplementation of the Sun’s java enterprise edition (JEE)reference implementation PetStore. We evaluate our approach by using the set of transactionsshown in Table IV.
2. An industrial web 2.0 application provided by our industrial collaborator. It is a social network-ing application offering various kinds of services such as contacts, groups and discussions. Weevaluate our approach by using the set of transactions shown in Table V. This application isdesigned to serve a large number of users and transactions, both on premises and in the cloud.In this situation, a regressed transaction type can impact on many transaction instances andtheir users.
Given the small size of the JPetStore application, most of its transaction types were utilized whendesigning the performance runs scenario. While, in the industrial application that includes manytransaction types, we selected a subset of these transaction types from a list of transaction typesclassified by the industrial collaborator as key transaction types. The selected transaction types covervarious categories such as browsing catalogues, searching for items and creating and viewing ofitems. Each of these categories has different performance characteristics (e.g. the search for itemstransaction type is mainly processed by the application server using a file-based search engine,while the browsing catalogues transaction type depends mainly on database queries). Such commoncharacteristics are clearly reflected in the TPs from the same category.
Table IV. JPetStore transactions set.
Transaction name Description
Sign up Registers in the application, this requires providing (among otherinformation) the user name and password
Sign in Signs in to the application using a user name and password and redirectsto the home page (a list of all pets’ categories, such as dogs and birds)
The application is populated with a large number of users and categories
Browse products in a category Shows all products from a certain category, such as Amazon Parrot andFinch in the birds categoryThe application is populated with a large number of products
Browse items in a product Shows all of the advertised items in a productThe application is populated with a large number of Items
View an item Shows the selected item infoAdd an item to cart Adds the item to cartUpdate item quantity Updating the quantity of an item in the cartCheckout items Checks out all items in the cart
Large number of items is added to cart during the run
Open home page A list of all pets’ categories, such as dogs and birdsThe application is populated with a large number of categories
Search for products Search for products by product nameThe application is populated with a large number of products.
Copyright © 2015 John Wiley & Sons, Ltd. Softw. Test. Verif. Reliab. (2015)DOI: 10.1002/stvr
A TECHNIQUE TO DETECT PERFORMANCE REGRESSION ANOMALIES
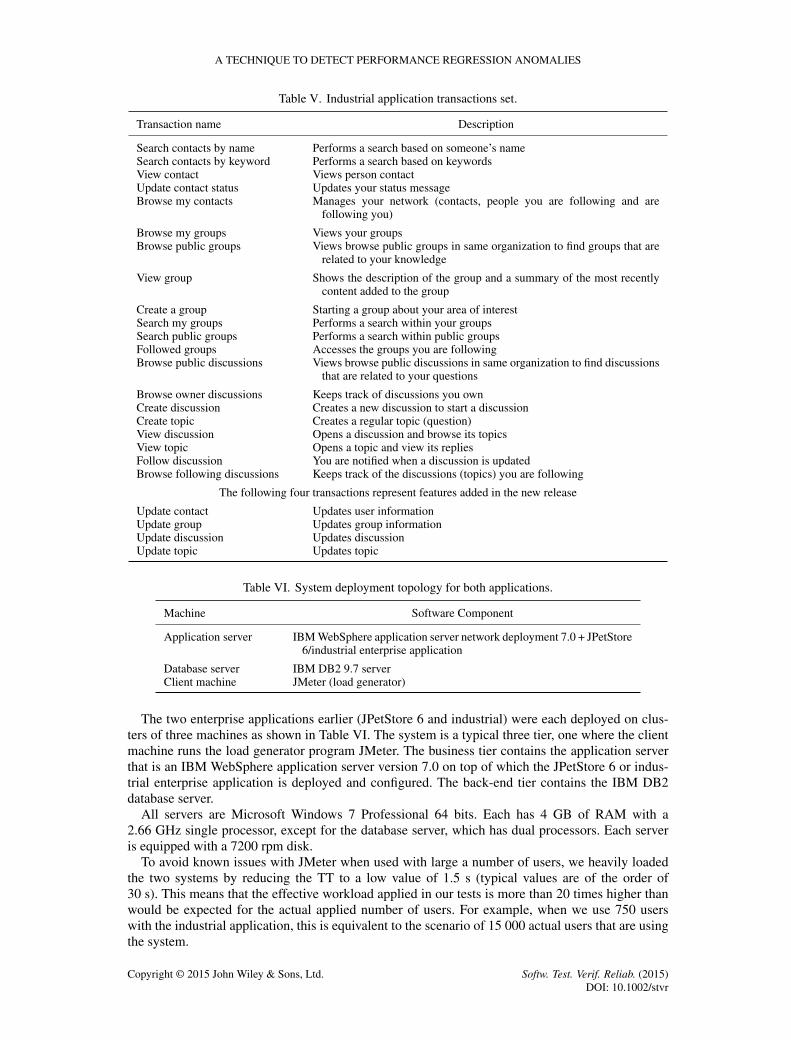
Table V. Industrial application transactions set.
Transaction name Description
Search contacts by name Performs a search based on someone’s nameSearch contacts by keyword Performs a search based on keywordsView contact Views person contactUpdate contact status Updates your status messageBrowse my contacts Manages your network (contacts, people you are following and are
following you)
Browse my groups Views your groupsBrowse public groups Views browse public groups in same organization to find groups that are
related to your knowledge
View group Shows the description of the group and a summary of the most recentlycontent added to the group
Create a group Starting a group about your area of interestSearch my groups Performs a search within your groupsSearch public groups Performs a search within public groupsFollowed groups Accesses the groups you are followingBrowse public discussions Views browse public discussions in same organization to find discussions
that are related to your questions
Browse owner discussions Keeps track of discussions you ownCreate discussion Creates a new discussion to start a discussionCreate topic Creates a regular topic (question)View discussion Opens a discussion and browse its topicsView topic Opens a topic and view its repliesFollow discussion You are notified when a discussion is updatedBrowse following discussions Keeps track of the discussions (topics) you are following
The following four transactions represent features added in the new release
Update contact Updates user informationUpdate group Updates group informationUpdate discussion Updates discussionUpdate topic Updates topic
Table VI. System deployment topology for both applications.
Machine Software Component
Application server IBM WebSphere application server network deployment 7.0 + JPetStore6/industrial enterprise application
Database server IBM DB2 9.7 serverClient machine JMeter (load generator)
The two enterprise applications earlier (JPetStore 6 and industrial) were each deployed on clus-ters of three machines as shown in Table VI. The system is a typical three tier, one where the clientmachine runs the load generator program JMeter. The business tier contains the application serverthat is an IBM WebSphere application server version 7.0 on top of which the JPetStore 6 or indus-trial enterprise application is deployed and configured. The back-end tier contains the IBM DB2database server.
All servers are Microsoft Windows 7 Professional 64 bits. Each has 4 GB of RAM with a2.66 GHz single processor, except for the database server, which has dual processors. Each serveris equipped with a 7200 rpm disk.
To avoid known issues with JMeter when used with large a number of users, we heavily loadedthe two systems by reducing the TT to a low value of 1.5 s (typical values are of the order of30 s). This means that the effective workload applied in our tests is more than 20 times higher thanwould be expected for the actual applied number of users. For example, when we use 750 userswith the industrial application, this is equivalent to the scenario of 15 000 actual users that are usingthe system.
Copyright © 2015 John Wiley & Sons, Ltd. Softw. Test. Verif. Reliab. (2015)DOI: 10.1002/stvr

S. GHAITH ET AL.
Table VII. Common performance defects.
Performance defect (bad practice) Description
No index on key columns that are It is important to place an index to avoid complete table scan forfrequently queried frequently used queries.
Enable logging Logging statements should only be enabled while debugging problemsto collect information for developers. Enabling them will causeperformance degradation.
Not limiting the database query Database queries should not return all rows in the tables; instead, theyshould limit the number of rows returned to what will be displayed inthe user interface.
To demonstrate our approach to detect performance regressions caused by application changes,we injected bad practice defects that are often introduced during the application development pro-cess. Table VII describes these defects, which are similar to those used by Nguyen et al. in theirSPC charts approach [5], which we will be using for comparison. In addition, we consulted a num-ber of performance experts who confirmed that these kinds of defects are among the most commonperformance defects repeatedly introduced by developers in new releases. Finally, the effect ofthese defects is spread across the various system servers (application and database) and resources(CPU and disk I/O); this allows exploring the coverage of the TP technique across various systemcomponents.
For the JPetStore application, we selected four performance defects from Table VII and intro-duced each defect into one of the transactions shown in Table IV. We removed the index fromdatabase tables categories and products; this is expected to inject performance defects to the homeand list products transactions. We also enabled logging of the list items transaction; this is expectedto inject a performance defect in it. We finally removed the limit on the structured query language(SQL) query to make it return all elements in the carts table; this is expected to introduce aperformance defect in the checkout transaction.
Similarly, for the industrial application, we selected 10 performance defects from Table VII andintroduced each defect into one of the transactions shown in Table V. We removed the index fromdatabase tables used by the browse my contacts, browse my groups, browse public discussions andbrowse following discussions transactions. We also individually enabled logging of the search con-tacts by keyword, create a group and follow a discussion transactions. Furthermore, we also removedthe limit on the SQL query to make it return all elements in the tables used by view contact, browsepublic groups and view a discussion transactions.
These defects were either injected individually (one per run) or collectively (all in a single run)based on the test type required.
6.3. Case study evaluation
We selected one version of each application to be the baseline version with no performance anoma-lies. Then to verify the various research questions, we generated new versions of each applicationin which we inject either what is considered as performance safe changes or bad practice defects.The manual approach used by the industrial collaborator was then used to assess each applicationand identify which transaction(s), if any, contained a defect. This provided the reference score foreach experiment. Then, the TP approach and the SPC charts approach are applied, and their resultsare evaluated.
We define some quality metrics in the next subsection before providing an overview of the SPCcharts approach in the following subsection.
6.3.1. Evaluation metrics. In our tests, we define the precision as follows:
Precision D
�N
P
�� 100% (2)
Copyright © 2015 John Wiley & Sons, Ltd. Softw. Test. Verif. Reliab. (2015)DOI: 10.1002/stvr

A TECHNIQUE TO DETECT PERFORMANCE REGRESSION ANOMALIES
N is the number of tests with a defect that has been detected and P is the total number of predicteddefects including false positives.
While we define recall as follows:
Recal l D .N
T/ � 100% (3)
T is the total number of tests with a defect whether detected or not.The precision is the fraction of detected defects that are relevant, while the recall is the fraction of
relevant defects that are detected. While F1 is a measure that combines precision and recall whereboth are evenly weighted.
F1 D 2 �precision � recall
precisionC recall(4)
6.3.2. Statistical process control charts approach. We will compare the results of the TP approachwith widely used statistical techniques, which we will explain in this section. Further research workon the area is presented in Section 8.
Statistical techniques were among the first techniques proposed by researchers to detect per-formance regression anomalies, such as in [5, 13]. They suggest applying SPC charts, which aretypically used to monitor the quality of manufacturing processes, to the analysis of performanceregression testing data. For each performance counter, TRT or RU, data from a previous set of testsare used as a baseline to draw the upper control limits (UCL) and lower control limits (LCL) andthe centre line (CL). Then the new test data is compared with these limits, and a violation ratio iscalculated to represent the number of points that exceeds those limits. If the violation ratio is higherthan a certain predetermined threshold, an anomaly is declared.
A typical choice for the CL is the median value of all sample points in a counter, such as the TRT,during the test period. The UCL and LCL can be determined in two ways, first using CL plus threestandard deviations for UCL and minus three standard deviations for the LCL. The second way is touse the fifth percentile (the counter value below which 5% of samples lie) for the LCL and the 95thpercentile (the counter value below which 95% of samples lie) for the UCL. The violation ratio iscalculated by testing the new data against these control limits, were the number of sample points thatexceed the UCL, or less than the LCL, is divided by the total number of the sample points withinthe entire testing period for that counter.
The thresholds are also calculated from the baseline test(s). So if five previous datasets are avail-able, then four of them will be used to generate the control limits, as described earlier, and the fifthrun is tested against those limits, and the corresponding violation ratio is calculated. The same willbe repeated for each of the five runs (the remaining data in each case are used to generate the con-trol limits). The violation ratio to be used with the new test data is then nominated as the maximumviolation ratio from all five values found here. If the fifth and 95th percentiles are used to calculatethe LCL and UCL, respectively, then the minimum value of the threshold is 10%.
6.4. Experiments
In the JPestStore application, the transaction mix is composed of 10% for signing up and signingin, 25% browsing, 25% searching, 20% viewing (home page and item) and 20% for buying (add tocart, update quantity and checkout). While in the industrial application, for each of the three com-ponents (contacts, groups and discussions), the transaction mix is composed of 25% browsing, 25%searching, 20% viewing, 20% creating and 10% for the remaining transactions (the last four trans-actions in Table V are not applied except in the last two experiments as we will explain later). Eachtest run lasts for 1 h in the case of the JPetStore application and 3 h for the industrial application.
We performed two runs with 300 and 450 users on the JPetStore and industrial applications,respectively, and set them as baselines. These runs were performed on the standard version of eachapplication. The TPs of each dataset are found using the process shown in Figure 13, by ignoringthe last step as no TP previous run is available for it. Then TP run reports of all other runs in the
Copyright © 2015 John Wiley & Sons, Ltd. Softw. Test. Verif. Reliab. (2015)DOI: 10.1002/stvr

S. GHAITH ET AL.
succeeding text are generated using the process shown in Figure 13 where the TPs of the baselinerun are set as the TP previous run. The thresholds are set to zero (in order to record all deviations) inSections 6.4.1 and 6.4.2 and set to the values found in Section 6.4.2 for the following experiments.
6.4.1. Transaction profile stability under different workload levels. As presented in Section 3, theTP is expected to be less sensitive to the workload (number of users) applied to the application.This is unlike the TRT that varies substantially with the applied workload because of queueing. Inthis experiment, we show that the TP is more stable with respect to the applied workload, that is, itvaries much less than TRT under the same workload changes.
In this experiment, we execute performance tests with multiple workloads, on both applications(JPetStore and industrial). The TRT and RU of the various transactions and resources, respectively,are recorded. The tests are performed with 100, 200, 300, 400 and 500 users for the JPetStoreapplication and with 150, 300, 450, 600 and 750 users for the industrial application. These numbersof users cover the entire range of normal operation for the specified hardware characteristics ofthese deployments, the TTs and the large amount of populated data. Increasing the workload overthese limits, 500 and 750 for the JPetStore and industrial applications, respectively, will result tosaturation of the servers RUs, so the TRTs will increase to unacceptable values.
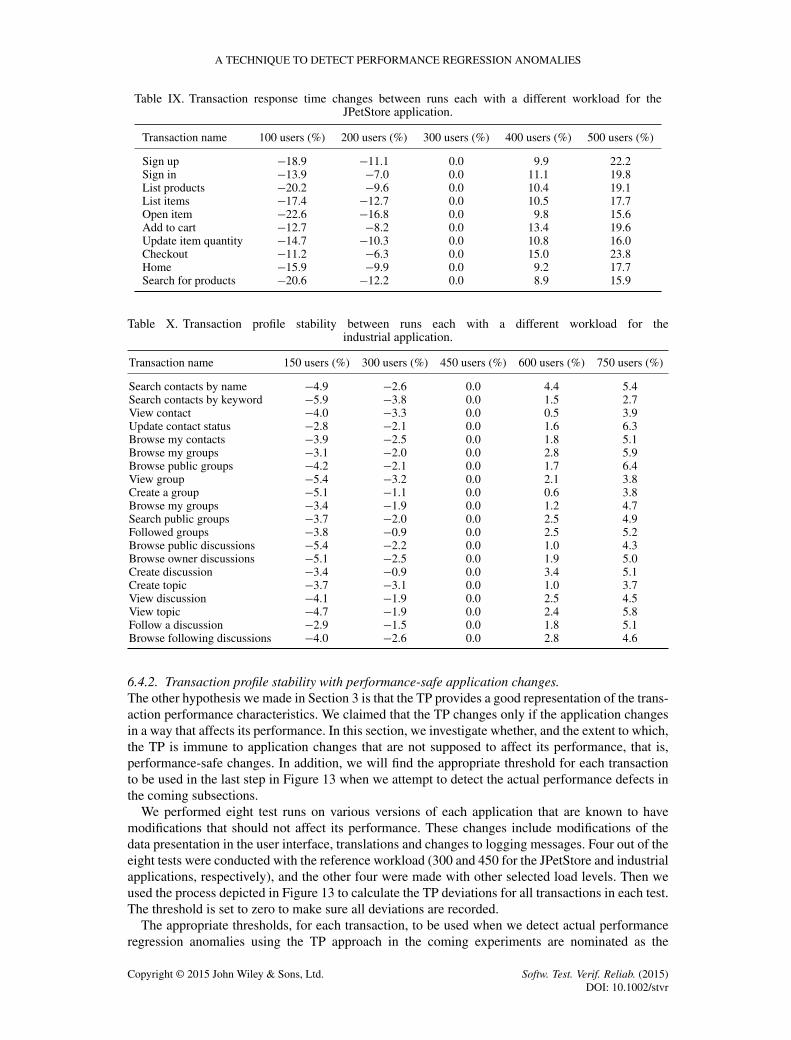
Results. Table VIII shows the TP variations with the change of the workload applied to the JPetStoreapplication. The middle workload, 300 users, is the reference workload, and the deviation of otherworkloads TPs is calculated from it. It can be noticed that the TP is stable under changing workloadlevels. Increasing the workload from 300 to 500 (or decreasing it to 100) has a small impact onthe TP, which is less than 6% in both directions. In this case, 500 users is the highest number ofusers based on the capacity of the deployed system so the maximum TP deviation of the system isaround 6%.
On the contrary, Table IX shows much larger variations in the TRT as workload changes. It canbe noticed that the TRT reaches an increase of around 23% when the workload is increased from300 to 500 and a decrease of around 24% when the workload is reduced from 300 to 100.
Similarly, Table X supports the TP stability under various workload levels for the industrial appli-cation. It can be seen that increasing the workload from 450 to 750 (or decreasing it to 150) has asmall impact on the TP, which is less than 6.5%, slightly higher than the JPetStore application, inboth directions. For this application, 750 users is the highest number of users based on the capacityof the deployed system so the maximum TP deviation of the system is around 6.5%.
Also from Table XI, it can be noticed that the TRT reaches an increase of around 32% when theworkload is increased from 450 to 750 and a decrease of around 29% when the workload is reducedfrom 450 to 150.
From the aforementioned results on the two applications, it is clear that TP is much less suscep-tible to workload level variation when compared with the TRT. This supports our expectation thatTP is close to a workload-independent representation of the transaction performance characteristics.The small deviations recorded in the TP are explained in details in Section 6.5.
Table VIII. Transaction profile stability between runs each with a different workload for theJPetStore application.
Transaction name 100 users (%) 200 users (%) 300 users (%) 400 users (%) 500 users (%)
Sign up �4.8 �2.3 0.0 1.1 5.1Sign in �2.5 �0.4 0.0 2.9 4.6List products �5.0 �1.3 0.0 2.1 4.9List items �3.3 �2.4 0.0 2.5 4.9Open item �5.7 �2.0 0.0 1.3 3.3Add to cart �2.9 �1.5 0.0 3.5 4.6Update item quantity �3.9 �2.4 0.0 2.9 3.9Checkout �2.7 �0.9 0.0 4.1 5.8Home �4.2 �2.4 0.0 1.0 3.8Search for products �5.4 �2.6 0.0 1.4 3.8
Copyright © 2015 John Wiley & Sons, Ltd. Softw. Test. Verif. Reliab. (2015)DOI: 10.1002/stvr
A TECHNIQUE TO DETECT PERFORMANCE REGRESSION ANOMALIES
Table IX. Transaction response time changes between runs each with a different workload for theJPetStore application.
Transaction name 100 users (%) 200 users (%) 300 users (%) 400 users (%) 500 users (%)
Sign up �18.9 �11.1 0.0 9.9 22.2Sign in �13.9 �7.0 0.0 11.1 19.8List products �20.2 �9.6 0.0 10.4 19.1List items �17.4 �12.7 0.0 10.5 17.7Open item �22.6 �16.8 0.0 9.8 15.6Add to cart �12.7 �8.2 0.0 13.4 19.6Update item quantity �14.7 �10.3 0.0 10.8 16.0Checkout �11.2 �6.3 0.0 15.0 23.8Home �15.9 �9.9 0.0 9.2 17.7Search for products �20.6 �12.2 0.0 8.9 15.9
Table X. Transaction profile stability between runs each with a different workload for theindustrial application.
Transaction name 150 users (%) 300 users (%) 450 users (%) 600 users (%) 750 users (%)
Search contacts by name �4.9 �2.6 0.0 4.4 5.4Search contacts by keyword �5.9 �3.8 0.0 1.5 2.7View contact �4.0 �3.3 0.0 0.5 3.9Update contact status �2.8 �2.1 0.0 1.6 6.3Browse my contacts �3.9 �2.5 0.0 1.8 5.1Browse my groups �3.1 �2.0 0.0 2.8 5.9Browse public groups �4.2 �2.1 0.0 1.7 6.4View group �5.4 �3.2 0.0 2.1 3.8Create a group �5.1 �1.1 0.0 0.6 3.8Browse my groups �3.4 �1.9 0.0 1.2 4.7Search public groups �3.7 �2.0 0.0 2.5 4.9Followed groups �3.8 �0.9 0.0 2.5 5.2Browse public discussions �5.4 �2.2 0.0 1.0 4.3Browse owner discussions �5.1 �2.5 0.0 1.9 5.0Create discussion �3.4 �0.9 0.0 3.4 5.1Create topic �3.7 �3.1 0.0 1.0 3.7View discussion �4.1 �1.9 0.0 2.5 4.5View topic �4.7 �1.9 0.0 2.4 5.8Follow a discussion �2.9 �1.5 0.0 1.8 5.1Browse following discussions �4.0 �2.6 0.0 2.8 4.6
6.4.2. Transaction profile stability with performance-safe application changes.The other hypothesis we made in Section 3 is that the TP provides a good representation of the trans-action performance characteristics. We claimed that the TP changes only if the application changesin a way that affects its performance. In this section, we investigate whether, and the extent to which,the TP is immune to application changes that are not supposed to affect its performance, that is,performance-safe changes. In addition, we will find the appropriate threshold for each transactionto be used in the last step in Figure 13 when we attempt to detect the actual performance defects inthe coming subsections.
We performed eight test runs on various versions of each application that are known to havemodifications that should not affect its performance. These changes include modifications of thedata presentation in the user interface, translations and changes to logging messages. Four out of theeight tests were conducted with the reference workload (300 and 450 for the JPetStore and industrialapplications, respectively), and the other four were made with other selected load levels. Then weused the process depicted in Figure 13 to calculate the TP deviations for all transactions in each test.The threshold is set to zero to make sure all deviations are recorded.
The appropriate thresholds, for each transaction, to be used when we detect actual performanceregression anomalies using the TP approach in the coming experiments are nominated as the
Copyright © 2015 John Wiley & Sons, Ltd. Softw. Test. Verif. Reliab. (2015)DOI: 10.1002/stvr

S. GHAITH ET AL.
Table XI. Transaction response time changes between runs each with a different workload for theindustrial application.
Transaction name 150 users (%) 300 users (%) 450 users (%) 600 users (%) 750 users (%)
Search contacts by name �22.6 �11.2 0.0 17.4 24.1Search contacts by keyword �25.8 �13.3 0.0 11.1 17.7View contact �19.7 �11.4 0.0 10.1 21.0Update contact status �17.3 �8.5 0.0 9.6 29.2Browse my contacts �18.1 �10.1 0.0 12.6 25.2Browse my groups �17.6 �12.3 0.0 15.3 27.7Browse public groups �22.9 �13.8 0.0 12.2 23.1View group �27.4 �18.0 0.0 15.9 29.3Create a group �23.4 �11.2 0.0 8.9 18.2Browse my groups �19.7 �9.9 0.0 12.4 23.7Search public groups �16.5 �11.1 0.0 14.7 22.7Followed groups �17.7 �8.7 0.0 15.5 30.2Browse public discussions �28.9 �13.2 0.0 12.1 24.3Browse owner discussions �25.2 �15.9 0.0 14.2 25.2Create discussion �17.2 �6.8 0.0 18.4 31.4Create topic �18.2 �11.2 0.0 10.6 19.0View discussion �22.9 �14.1 0.0 13.9 23.1View topic �23.1 �12.9 0.0 16.5 27.8Follow a discussion �18.6 �9.5 0.0 14.8 25.8Browse following discussions �22.9 �12.0 0.0 13.4 22.2
Table XII. TP deviation when applying performance safe changes to the JPetStoreapplication (used to determine threshold).
Versions with performance safe updates Threshold
Transaction name (TP deviation (%) from baseline build) TP SPC
Sign up 1.4 0.9 2.0 0.3 0.2 0.9 4.0 0.1 3.3 11.2Sign in 0.2 2.0 0.7 1.2 3.8 2.0 4.8 0.9 4.4 13.3List products 1.0 0.5 1.3 2.1 3.0 2.8 4.4 0.7 3.9 13.8List items 2.2 2.3 0.8 1.1 1.2 1.5 3.7 0.3 3.2 8.7Open item 2.6 0.5 1.6 1.5 2.2 1.8 4.3 0.2 3.7 11.9Add to cart 2.6 0.5 0.4 1.5 1.9 0.7 3.8 0.6 3.4 14.1Update item quantity 0.8 2.7 1.1 0.0 1.3 3.8 3.6 0.3 3.7 11.1Checkout 0.5 2.2 3.2 3.1 3.1 0.7 5.5 1.5 4.7 22.1Home 1.5 3.6 4.2 0.0 1.2 1.4 3.8 1.1 4.1 17.2Search for products 0.5 2.0 2.7 1.2 0.7 1.1 4.6 1.8 3.9 13.4
TP, transaction profile; SPC, statistical process control.
95th percentile. This means that our system accepts 5% as false positives rate when detecting TPdeviations. This percentile value is chosen based on the common practice in the industry.
In addition, these runs are used to calculate the thresholds to be used with the SPC charts tech-nique presented in Section 6.3.2. We also used the fifth and 95th percentiles to find the LCL andUCL values, respectively, based on the case study in the paper [5], which aligns with our choice forthe TP thresholds.
Results. The TP deviations found from the workload runs on the JPetStore application versions withperformance-safe changes are shown in Table XII. Each column corresponds to a test performed ona version of JPetStore with a performance-safe change, the TP deviation percentage is calculatedagainst the baseline dataset (no defects injected) TPs. We see that the TP deviates with values up to5.5%. All these variations are false positives and are caused by the inaccuracy of the technique thatis caused by factors such as software contention, network delays SDs and the BCMP approximation.
We used these deviations to calculate the threshold for each transaction that separates the actualdefects from those caused by the inaccuracies of the system. To do so, we calculate the 95th
Copyright © 2015 John Wiley & Sons, Ltd. Softw. Test. Verif. Reliab. (2015)DOI: 10.1002/stvr

A TECHNIQUE TO DETECT PERFORMANCE REGRESSION ANOMALIES
Table XIII. TP deviation when applying performance safe changes to the industrial application(used to determine threshold).
Versions with performance safe updates Threshold
Transaction name (TP Deviation (%) from baseline build) TP SPC
Search contacts by name 2.1 4.1 2.9 4.1 0.5 3.4 3.3 2.6 4.1 17.1Search contacts by keyword 1.0 3.3 3.3 1.8 1.4 2.3 2.7 1.5 3.3 8.9View contact 1.9 3.8 2.5 2.5 2.3 1.2 3.5 1.3 3.7 11.4Update contact status 0.6 3.9 3.0 2.4 1.2 0.2 3.5 0.1 3.8 13.6Browse my contacts 2.9 4.3 3.4 3.8 3.0 3.2 3.0 4.7 4.6 23.1Browse my groups 2.0 4.4 3.9 3.2 1.1 0.8 3.6 2.7 4.2 17.3Browse public groups 3.9 4.5 3.0 2.9 4.1 1.3 2.7 3.0 4.4 18.7View group 1.5 3.7 2.6 1.6 2.1 1.7 2.6 2.1 3.3 14.5Create a group 3.7 2.8 2.5 1.8 0.4 4.0 2.6 4.3 4.2 21.1Browse my groups 3.5 3.3 2.8 2.0 0.5 0.5 2.8 1.7 3.4 17.0Search public groups 2.0 3.0 3.4 2.7 0.5 1.9 3.2 1.9 3.3 14.9Followed groups 0.3 4.3 4.0 2.7 0.3 3.6 3.9 1.9 4.2 22.3Browse public discussions 0.6 3.3 1.7 1.5 1.5 0.0 2.4 3.5 3.4 16.1Browse owner discussions 0.2 3.4 2.6 3.2 2.6 2.3 3.4 1.3 3.4 16.9Create discussion 2.0 4.0 3.9 3.3 3.3 4.5 3.4 2.7 4.3 20.9Create topic 1.4 3.5 2.2 2.3 1.3 1.5 2.2 0.4 3.1 9.7View discussion 2.7 2.9 2.5 2.4 0.6 0.9 3.8 4.7 4.4 19.9View topic 2.8 4.2 2.9 2.1 1.6 4.7 3.4 2.1 4.5 24.8Follow a discussion 0.9 4.7 2.9 3.5 1.4 2.9 3.5 1.4 4.3 22.5Browse following discussions 3.7 4.3 4.2 2.7 0.4 4.3 3.8 3.9 4.3 23.3
TP, transaction profile; SPC, statistical process control.
percentile from all deviations in each row of Table XII. These thresholds (along with the corre-sponding thresholds from the SPC charts-based technique) are shown in the last two columns of thesame table and will be used to detect actual anomalies in the next sections.
Similarly, the TP deviations found from the workload runs on the industrial application versionswith performance-safe changes are shown in Table XIII. Each column corresponds to a run per-formed on a version of the industrial application with a performance-safe change, the TP deviationpercentage is calculated in the same manner as the JPetStore application. We see that the TP devi-ates with values up to 4.7%. All these variations are false positives and caused by the inaccuracydescribed in the JPetStore section earlier. The thresholds for both the TP and SPC charts tech-niques are also calculated in a similar fashion to the JPetStore application. These thresholds areshown in the last two columns of the same table and will be used to detect actual anomalies in thenext sections.
From the results, on both applications, we conclude that the TPs is insensitive to performance-safeapplication changes.
6.4.3. Using transaction profile to detect a single performance defect. In this part, we conductedtests on both web 2.0 applications (JPetStore and industrial) to verify whether, and the extent towhich, the TP run report is effective in detecting defects caused by modifications to the transactionscode that negatively affect their performance.
We performed multiple test runs, on both applications, to compare each of them with the baselinedataset. In each run, we injected a performance defect in one transaction, then we generated theTP run report and observed that the defect was detected by the report because of an increase inthe corresponding transaction TP. Moreover, we investigated the detailed TP graph to see if thechanges in the SDs on the various hardware resources can be justified by the nature of the defectinjected. Then we removed the injected defect and introduced another one, in a different transaction,and performed a new run. All runs, including the baseline run, were performed with the referenceworkload, 300 users for the JPetStore and 450 for the industrial Application. We will ease thiscondition in Sections 6.4.5 and 6.4.6 in the succeeding text.
Copyright © 2015 John Wiley & Sons, Ltd. Softw. Test. Verif. Reliab. (2015)DOI: 10.1002/stvr
S. GHAITH ET AL.
In total, we created four versions of the JPetStore application each with one of the defectsdescribed earlier and performed four test runs. All runs were conducted with 300 users, andthe thresholds, which have been determined in Section 6.4.2, are used when generating the TPrun report.
Similarly, we created 10 versions of the industrial application each with one of the defectsdescribed earlier and consequently performed 10 test runs. All runs were conducted with 450 users,and the thresholds, which have been determined in Section 6.4.2, are used when generating the TPrun report.
All data generated from each test run, in addition to the baseline run, are analysed using both theTP-based approach, presented in this paper, and the SPC charts-based approach by Nguyen et al.[5] described in Section 6.3.2.
Results. After running the tests on the JPetStore application and analysing the corresponding TPrun reports, we found that three of the four injected defects were detected, and the other one wasnot detected and is therefore a false negative. This gives a recall of 75%, and because all defectsdetected were genuine ones, the precision is 100%. No false positives were detected in any of thefour runs. The details of the data for those runs are shown in Table XIV.
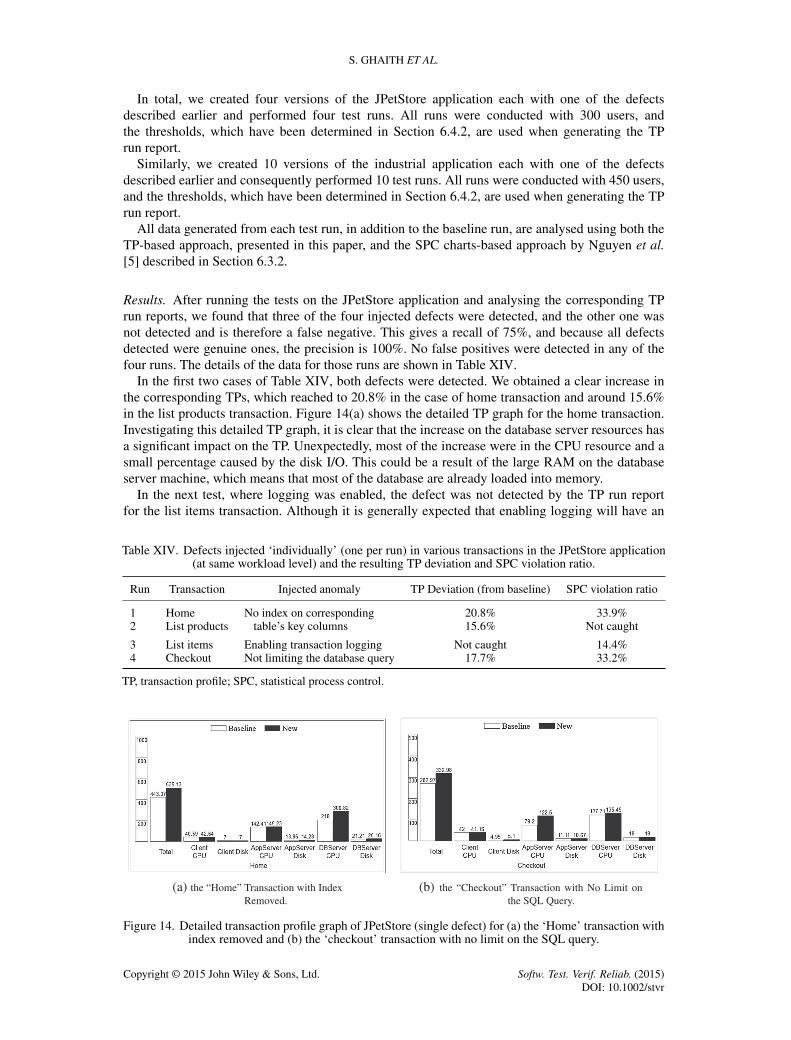
In the first two cases of Table XIV, both defects were detected. We obtained a clear increase inthe corresponding TPs, which reached to 20.8% in the case of home transaction and around 15.6%in the list products transaction. Figure 14(a) shows the detailed TP graph for the home transaction.Investigating this detailed TP graph, it is clear that the increase on the database server resources hasa significant impact on the TP. Unexpectedly, most of the increase were in the CPU resource and asmall percentage caused by the disk I/O. This could be a result of the large RAM on the databaseserver machine, which means that most of the database are already loaded into memory.
In the next test, where logging was enabled, the defect was not detected by the TP run reportfor the list items transaction. Although it is generally expected that enabling logging will have an
Table XIV. Defects injected ‘individually’ (one per run) in various transactions in the JPetStore application(at same workload level) and the resulting TP deviation and SPC violation ratio.
Run Transaction Injected anomaly TP Deviation (from baseline) SPC violation ratio
1 Home No index on corresponding 20.8% 33.9%2 List products table’s key columns 15.6% Not caught
3 List items Enabling transaction logging Not caught 14.4%4 Checkout Not limiting the database query 17.7% 33.2%
TP, transaction profile; SPC, statistical process control.
(a) the “Home” Transaction with IndexRemoved.
(b) the “Checkout” Transaction with No Limit onthe SQL Query.
Figure 14. Detailed transaction profile graph of JPetStore (single defect) for (a) the ‘Home’ transaction withindex removed and (b) the ‘checkout’ transaction with no limit on the SQL query.
Copyright © 2015 John Wiley & Sons, Ltd. Softw. Test. Verif. Reliab. (2015)DOI: 10.1002/stvr

A TECHNIQUE TO DETECT PERFORMANCE REGRESSION ANOMALIES
impact on performance, the limited number of logging statements in this application does not havea major impact on the transaction performance on such powerful machines.
In the last transaction, the defect was detected by the TP run report. The increase was 17.7%.The detailed TP graph for the checkout transaction is shown in Figure 14(b), which shows that theapplication server CPU demand has increased by 55%. This information can be passed back to thedevelopment team to help them find the cause of the regression.
Analysing the same data using the SPC charts technique, we found that three of the four injecteddefects were detected, which is the same as the TP approach.
Similarly, after running the tests on the industrial application and analysing the corresponding TPrun reports, we found that 9 of the 10 injected defects were detected (the other one represents a falsenegative), which gives a recall of 90% and precision of 100%. No false positives were detected inany of the 10 runs. The details of the data are shown in Table XV.
In the first four cases of Table XV, all four defects were detected. In each case, there is a clearincrease in the corresponding TPs, which reached to 39.5% in the case of browse my contactstransaction and 15%, 19.3% and 36.2% in the browse my groups, browse public discussions andbrowse following discussions transactions, respectively. Figure 15 shows the detailed TP graph forthe browse my contacts transaction. Investigating this detailed TP graph, it is clear that the increaseon the database server resources is the main cause of the change in TP. The change is distributedbetween the CPU and disk I/O resources. This is unlike the JPetStore application where most of thechange was due to CPU. The industrial application has much more data in the database, and it is not
Table XV. Defects injected ‘individually’ (one per run) in various transactions in the industrial application(at same workload level) and the resulting TP deviation and SPC violation ratio.
Run Transaction Injected anomaly TP Deviation (from baseline) SPC violation ratio
1 Browse my contacts No index on corresponding 39.5% 34.1%2 Browse my groups table’s key columns 15.0% 22.1%3 Browse public discussions 19.3% 18.2%4 Browse following discussions 36.2% 25.5%
5 Search contacts by keyword Enabling logging on Not caught 14.4%6 Create a group transaction code 16.6% Not caught7 Follow a discussion 28.1% 26.7%
8 View contact Not limiting the database 24.8% 13.4%9 Browse public groups query 11.8% Not caught10 View discussion 25.1% 29.4%
TP, transaction profile; SPC, statistical process control.
Figure 15. Detailed transaction profile graph for the ‘browse my contacts’ transaction of industrialapplication with index removed (single defect).
Copyright © 2015 John Wiley & Sons, Ltd. Softw. Test. Verif. Reliab. (2015)DOI: 10.1002/stvr

S. GHAITH ET AL.
expected to have the entire database loaded in the memory, and consequently, the visits to the diskis expected to increase as well as the CPU usage.
In the following three transactions, where logging was enabled, two defects were detected with adeviation reached to 28.1% for the follow a discussion transaction and 16.6% for the create a grouptransaction. The application server CPU has the largest impact followed by the disk I/O on the sameserver. The TP run report failed to detect the defect in the search contacts by keyword transaction.Looking at the corresponding detailed TP graph, we can see that a reduction of the database serverCPU demands compensated for the increase of the application server CPU caused by enablingthe logging.
In the last three runs, all three injected defects were detected by the TP run report with a TPdeviation of 24.8%, 11.8% and 25.1% for the view contact, browse public groups and browsepublic discussions transactions, respectively. Again, the application server CPU demand has beensubstantially increased by over 35% in all of them.
Analysing the same data using the SPC charts technique, we found that 8 of the 10 injected defectswere detected (the other two represent false negatives), which gives a recall of 80% and a precisionof 100%. These are slightly lower than the corresponding TP-based approach values.
The results from both applications show that the TP run report is capable of detecting performanceregression anomalies caused by individual software updates. This scenario is a common one whenthe performance testing team need to evaluate if a proposed functional fix will negatively impacttransactions’ performance [9].
6.4.4. Detecting multiple defects under the same workload level. In this part, we conducted testson both web 2.0 applications (JPetStore and industrial) to verify whether, and the extent to which,the TP run report is effective in detecting multiple defects caused by multiple modifications to thetransactions code that negatively affect their performance.
We performed a single run on each application to compare with the baseline run. In each run,we injected multiple performance defects in multiple transactions, one per transaction, then wegenerated the TP run report as shown in Figure 13 and ensured that the defects were detectedby the report because of an increase in the corresponding transactions TP. Both runs were exe-cuted with the same workload as the baseline runs (300 users for the JPetStore and 450 for theindustrial application).
The same defects were introduced to the same transactions as described in Section 6.4.3, but inthis case, they were introduced together (i.e. one version of each application with all defects wasbuilt and deployed). One test run is performed on each application (JPetStore and industrial) with 4and 10 defects, respectively. The thresholds, which have been determined in Section 6.4.2, are usedwhen generating the TP run report.
Results. After running this test on the JPetStore application and analysing the corresponding TPrun report, we found that five defects were detected. Four of them correspond to the four defects weinjected and one false positive, which gives a precision of 80%. All injected defects were detected,and this gives a recall of 100%. While, using the SPC charts approach, we found that four defects
Table XVI. Defects injected ‘collectively’ (all in a single run) in various transactions in the JPetStoreapplication (at same workload level) and the resulting TP deviation and SPC violation ratio.
Transaction Injected anomaly TP deviation (from baseline) (%) SPC violation ratio
Home No index on corresponding 24.4 35.1%List products table’s key columns 20.8 14.1%
List items Enabling transaction logging 8.1 Not caughtCheckout Not limiting the database query 18.8 31.3%
Open item No bug introduced 11.9� —Update item quantity — 16.1%�
TP, transaction profile; SPC, statistical process control.�False positive.
Copyright © 2015 John Wiley & Sons, Ltd. Softw. Test. Verif. Reliab. (2015)DOI: 10.1002/stvr
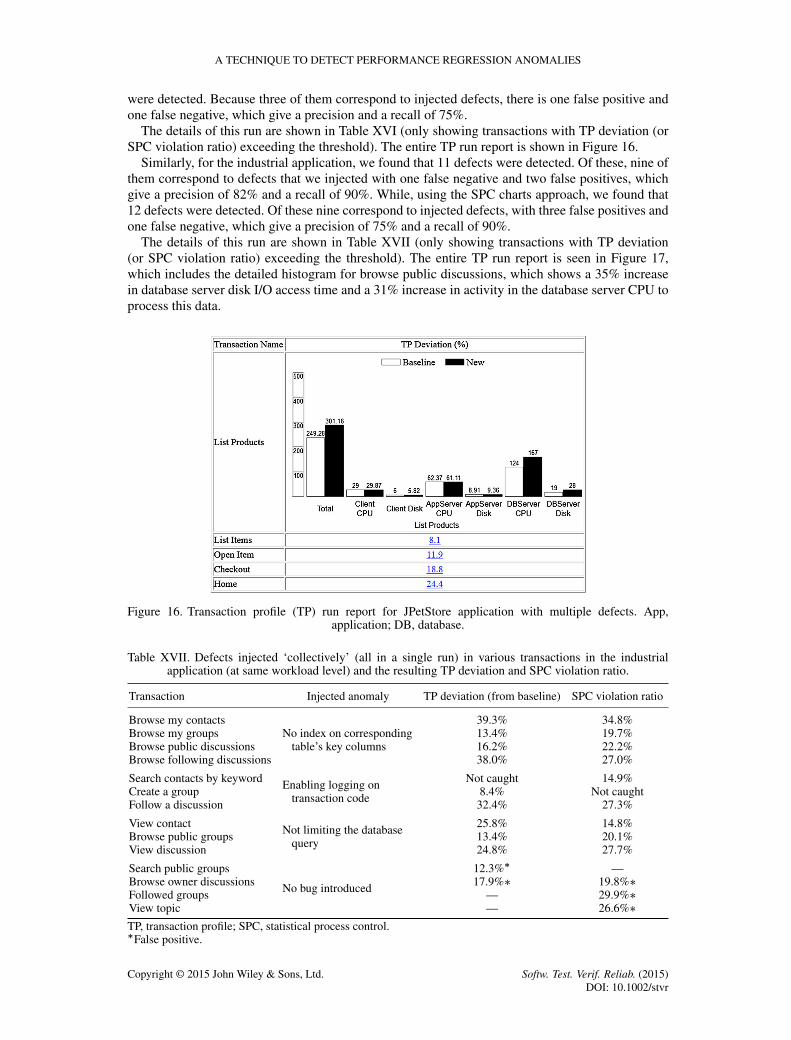
A TECHNIQUE TO DETECT PERFORMANCE REGRESSION ANOMALIES
were detected. Because three of them correspond to injected defects, there is one false positive andone false negative, which give a precision and a recall of 75%.
The details of this run are shown in Table XVI (only showing transactions with TP deviation (orSPC violation ratio) exceeding the threshold). The entire TP run report is shown in Figure 16.
Similarly, for the industrial application, we found that 11 defects were detected. Of these, nine ofthem correspond to defects that we injected with one false negative and two false positives, whichgive a precision of 82% and a recall of 90%. While, using the SPC charts approach, we found that12 defects were detected. Of these nine correspond to injected defects, with three false positives andone false negative, which give a precision of 75% and a recall of 90%.
The details of this run are shown in Table XVII (only showing transactions with TP deviation(or SPC violation ratio) exceeding the threshold). The entire TP run report is seen in Figure 17,which includes the detailed histogram for browse public discussions, which shows a 35% increasein database server disk I/O access time and a 31% increase in activity in the database server CPU toprocess this data.
Figure 16. Transaction profile (TP) run report for JPetStore application with multiple defects. App,application; DB, database.
Table XVII. Defects injected ‘collectively’ (all in a single run) in various transactions in the industrialapplication (at same workload level) and the resulting TP deviation and SPC violation ratio.
Transaction Injected anomaly TP deviation (from baseline) SPC violation ratio
Browse my contactsNo index on corresponding
39.3% 34.8%Browse my groups
table’s key columns13.4% 19.7%
Browse public discussions 16.2% 22.2%Browse following discussions 38.0% 27.0%
Search contacts by keyword Enabling logging on Not caught 14.9%Create a group transaction code 8.4% Not caughtFollow a discussion 32.4% 27.3%
View contact Not limiting the database 25.8% 14.8%Browse public groups query 13.4% 20.1%View discussion 24.8% 27.7%
Search public groups
No bug introduced
12.3%� —Browse owner discussions 17.9%� 19.8%�Followed groups — 29.9%�View topic — 26.6%�
TP, transaction profile; SPC, statistical process control.�False positive.
Copyright © 2015 John Wiley & Sons, Ltd. Softw. Test. Verif. Reliab. (2015)DOI: 10.1002/stvr
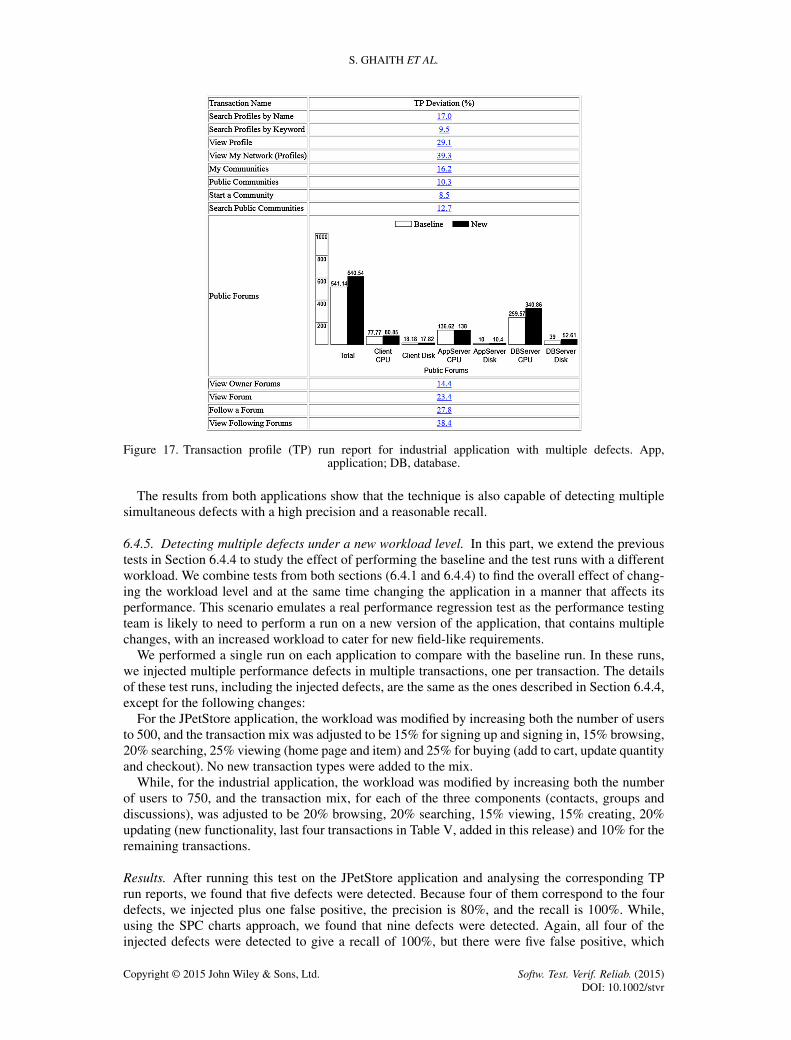
S. GHAITH ET AL.
Figure 17. Transaction profile (TP) run report for industrial application with multiple defects. App,application; DB, database.
The results from both applications show that the technique is also capable of detecting multiplesimultaneous defects with a high precision and a reasonable recall.
6.4.5. Detecting multiple defects under a new workload level. In this part, we extend the previoustests in Section 6.4.4 to study the effect of performing the baseline and the test runs with a differentworkload. We combine tests from both sections (6.4.1 and 6.4.4) to find the overall effect of chang-ing the workload level and at the same time changing the application in a manner that affects itsperformance. This scenario emulates a real performance regression test as the performance testingteam is likely to need to perform a run on a new version of the application, that contains multiplechanges, with an increased workload to cater for new field-like requirements.
We performed a single run on each application to compare with the baseline run. In these runs,we injected multiple performance defects in multiple transactions, one per transaction. The detailsof these test runs, including the injected defects, are the same as the ones described in Section 6.4.4,except for the following changes:
For the JPetStore application, the workload was modified by increasing both the number of usersto 500, and the transaction mix was adjusted to be 15% for signing up and signing in, 15% browsing,20% searching, 25% viewing (home page and item) and 25% for buying (add to cart, update quantityand checkout). No new transaction types were added to the mix.
While, for the industrial application, the workload was modified by increasing both the numberof users to 750, and the transaction mix, for each of the three components (contacts, groups anddiscussions), was adjusted to be 20% browsing, 20% searching, 15% viewing, 15% creating, 20%updating (new functionality, last four transactions in Table V, added in this release) and 10% for theremaining transactions.
Results. After running this test on the JPetStore application and analysing the corresponding TPrun reports, we found that five defects were detected. Because four of them correspond to the fourdefects, we injected plus one false positive, the precision is 80%, and the recall is 100%. While,using the SPC charts approach, we found that nine defects were detected. Again, all four of theinjected defects were detected to give a recall of 100%, but there were five false positive, which
Copyright © 2015 John Wiley & Sons, Ltd. Softw. Test. Verif. Reliab. (2015)DOI: 10.1002/stvr

A TECHNIQUE TO DETECT PERFORMANCE REGRESSION ANOMALIES
gives a precision of 44%, which is explained in the discussion section in the succeeding text. Thedetails of this run are shown in Table XVIII (only showing transactions with TP deviation (or SPCviolation ratio) exceeding the threshold).
Similarly, for the industrial application, we found that 12 defects were detected using the newtechnique. This included all 10 defects that had been injected plus two false positives, which givea precision of 83% and a recall of 100%. While, using the SPC charts approach, we found that18 defects were detected. Again, all 10 of the injected defects were detected, but eight false posi-tives were also flagged, which gives a precision of 56% and a recall of 100%. The details of thisrun are shown in Table XIX (only showing transactions with TP deviation exceeding the thresh-old). Although the new transactions introduced in the new release (i.e. the last four transactions inTable V) are not tested for regressions in this new release as they do not have a previous baselinevalue, their existence is significant to the performance data analysis looking for regressions in oldtransactions as they have demands on various resources, which compete with other transactions, this
Table XVIII. Defects injected ‘collectively’ (all in a single run) in various transactions in the JPetStoreapplication (at a new workload) and the resulting TP deviation and SPC violation ratio.
TP deviation (from baseline) SPC violation ratioTransaction Injected anomaly (%) (%)
Home No index on corresponding 22.3 54.2List products table’s key columns 23.8 28.1
List items Enabling transaction logging 9.1 34.2Checkout Not limiting the database query 20.8 66.8
Open item
No bug introduced
12.4� 33.1�
Sign up — 19.4�
Sign in — 44.4�
Update item quantity — 28.1�
Search for products — 29.9�
TP, transaction profile; SPC, statistical process control.�False positive.
Table XIX. Defects injected ‘collectively’ (all in a single run) in various transactions in the industrialapplication (at a new workload level) and the resulting TP deviation and SPC violation ratio.
TP deviation (from baseline) SPC violation ratioTransaction Injected anomaly (%) (%)
Browse my contactsNo index on corresponding
35.0 66.7Browse my groups
table’s key columns12.0 45.2
Browse public discussions 20.4 33.4Browse following discussions 42.3 67.7
Search contacts by keyword Enabling logging on 6.3 55.4Create a group transaction code 16.3 54.5Follow a discussion 25.7 39.2
View contact Not limiting the database 27.3 32.1Browse public groups query 8.5 29.2View discussion 27.1 55.5
Search contacts by name
No bug introduced
15.5� 43.3�
Browse owner discussions 19.2� 44.0�
Update contact status — 21.1�
Followed groups — 49.1�
View topic — 43.6�
Create discussion — 27.7�
View group — 24.0�
Browse my groups — 32.1�
TP, transaction profile; SPC, statistical process control.�False positive.
Copyright © 2015 John Wiley & Sons, Ltd. Softw. Test. Verif. Reliab. (2015)DOI: 10.1002/stvr

S. GHAITH ET AL.
Table XX. Defects injected ‘collectively’ (all in a single run) in various transactions in the JPetStore appli-cation (at a new workload level) with three application server cluster and the resulting TP deviation and SPC
violation ratio.
Transaction Injected anomaly TP deviation (from baseline) SPC violation ratio
Home No index on corresponding 22.5% 49.2%List products table’s key columns 22.3% 25.5%
List items Enabling transaction logging Not caught Not caughtCheckout Not limiting the database query 12.9% 56.9%
Search for products
No bug introduced
— 30.1%�
Add to cart — 19.2%�
Sign in — 36.3%�
Update item quantity — 27.9%�
Open item — 29.0%�
TP, transaction profile; SPC, statistical process control.�False positive.
results in longer queues and TRTs. Nevertheless, such new transactions are usually compared withprojected baseline values (often from an SLAs) as part of the analysis of the PPTR (Section 2).
The results from both applications show that the technique is also capable of detecting multiplesimultaneous defects with a high precision and a moderate recall under a higher workload in thenew run.
6.4.6. Detecting multiple defects in an application server cluster under a new workload level. Inthis section, we do similar experiments to those in Section 6.4.5 earlier. The only difference is thatwe modified the deployment topology, shown in Table VI, so that it contains a three applicationserver cluster. All cluster members have similar hardware specifications and contain the same soft-ware, which means the SD is the same across all the cluster members. No modifications were madeto the client and database server machines. All other details of the runs are same as in Section 6.4.5earlier.
The goal here is to investigate whether, and the extent to which, the technique presented inthis paper can be used with more complex environments, mainly those with clustered servers. Theapproximation mentioned in Section 5.2.1 allows for efficient analytical solution of such QNMsleading to a solution time comparable with the normal deployments without clustering.
Results. After running this test on the JPetStore application and analysing the corresponding TP runreports, we found that four defects were detected. This included three of the four defects we injectedplus one false positive and one false negative, which give a precision and recall of 75%. While, theSPC charts precision is 38%, and the recall is 75%. The details of this run are shown in Table XX(only showing transactions with TP deviation (or SPC violation ratio) exceeding the threshold).
Similarly, for the industrial application, we found that 13 defects were detected. In this case, 10 ofthem correspond to the 10 defects we injected, which give a precision of 77% and a recall of 100%.While, the SPC charts precision is 53%, and the recall is 100% The details of this run are shownin Table XXI (only showing transactions with TP deviation (or SPC violation ratio) exceeding thethreshold).
It is interesting to note that the time to reverse-solve these test cases was less than 15% more thanthe previous tests (details in the discussion section in the succeeding text). These results, from bothapplications, suggest that the technique is still suitable for the more complicated deployments.
6.5. Case study discussion
The results of the first experiment, Section 6.4.1, show that TP is much more stable than TRT forboth applications. This supports our expectations that the TP can be used as a workload-independentmeasure of application performance. Having said that, Tables VIII and X show that the TP slightlyincreases with increasing the workload. This is also evident in Figure 18(a) and (b).
Copyright © 2015 John Wiley & Sons, Ltd. Softw. Test. Verif. Reliab. (2015)DOI: 10.1002/stvr

A TECHNIQUE TO DETECT PERFORMANCE REGRESSION ANOMALIES
Table XXI. Defects injected ‘collectively’ (all in a single run) in various transactions in the industrial appli-cation (at a new workload level) with three application server cluster and the resulting TP deviation and SPC
violation ratio.
TP deviation SPC violation ratioTransaction Injected Anomaly (from baseline) (%) (%)
Browse my contactsNo index on corresponding
39.3 57.1Browse my groups
table’s key columns16.2 44.4
Browse public discussions 18.4 35.7Browse following discussions 38.4 60.0
Search contacts by keyword Enabling logging on 9.5 51.1Create a group transaction code 8.5 49.8Follow a discussion 27.8 41.1
View contact Not limiting the database query 29.1 32.1Browse public groups 10.3 25.5View discussion 23.4 43.3
Search contacts by name
No bug introduced
17.0� 42.9�
Search public groups 12.7� 23.9�
Browse owner discussions 14.4� 37.6�
Update contact status — 20.3�
Followed groups — 44.9�
View topic — 33.8�
Create discussion — 28.9�
View group — 24.9�
Browse my groups — 34.5�
TP, transaction profile; SPC, statistical process control.�False positive.
(a) “List Products” of JPetStore Application. (b) “View Group” of Industrial Application.
Figure 18. Transaction profile (TP) and transaction response time (TRT) changes with workload forthe transaction.
We noticed that measuring the TP with a single user test, as shown in Section 5.1, provides aslightly lower value compared with when it is calculated using performance testing results. Thisdifference increases slightly as the workload used by the performance tests increases.
When this single user TP is used in the capacity management process depicted in Figure 7, theresulting TRT is approximately 15% lower than the value measured in workload testing. At the sametime, the other parameters such as RU and throughput show less than 5% difference. These findingsare supported by the prior work by Kounev et al. [26]. This can be explained mainly by the softwarecontention effect, such as the number of threads and database connections, which is not modelledby our hardware resources QNM so that the predicted TRTs is lower than that which is measured.This difference in TRT increases as the workload increases because of the increased competitionfor software resources, while the effect of the software contention has a smaller impact on the RUand throughput.
Copyright © 2015 John Wiley & Sons, Ltd. Softw. Test. Verif. Reliab. (2015)DOI: 10.1002/stvr

S. GHAITH ET AL.
It was also noticed that using the measured TRT to calculate the TP as shown in Figures 9 and 10yields a slightly higher TP compared with the TP measured by a single user test. This explains thebehaviour of the slight increase of TP with workload shown in Tables VIII and X. To further studythis phenomenon, we plan to include software contention in the QNM as presented in our recentwork [29], which is expected to reduce the slope of Figure 18(a) and (b) and then investigate itsimpact on the precision and recall of the TP-based approach.
The threshold for each transaction was chosen to be the 95th percentile from the past runs forwhich that transaction was deemed to be good, and they are refreshed after each new run (theentire process can be fully automated). This percentile value was chosen based on common practicein the industry and also to be similar to the SPC charts case study [5]. In Figure 19(a) and (b),we show the variability of the precision, recall and F1 measure with respect to a change of thepercentile value from 50 to 99 for two selected runs, one for each application. These results showthat JPetStore seems particularly sensitive to the threshold and perhaps a value of 93% would yieldbetter results. However, the choice of 95th percentile seems to be satisfactory. A more thoroughthreshold sensitivity analysis across a number of different applications and transactions would berequired to comprehensively characterize the impact of the threshold.
The results from the last four experiments of the case study are shown in Table XXII. We cannote two other interesting phenomena.
First, an obvious drawback of the SPC charts technique appears to be that thresholds and controllimits depend on the workload applied to the system during the baseline run(s). Hence, they cannotbe used if the new test run is conducted with a higher workload to account for new field-like require-ments. For example, in the industrial application, the baseline run is conducted with 500 users, thecontrol limits and thresholds calculated from this workload, 500 users, are not usable with the new
(a) JPetStore Application Run in Section6.4.6. (b) Industrial Application Run in Section6.4.4
Figure 19. Precision, recall and F1 measure variations against percentile value used to calculate thresholds.
Table XXII. Summary of results on JPetStore and industrial applications.
JPetStore application Industrial application
Precision Recall F1 measure Precision Recall F1 measureTest description (%) (%) (%) (%) (%) (%)
Single defect TP 100 75 86 100 90 95SPC 100 75 86 100 80 89
Multiple defects with the TP 80 100 89 82 90 86same workload SPC 75 75 75 75 90 82
Multiple defects with a new TP 80 100 89 83 100 91workload level SPC 44 100 61 56 100 72
Multiple defects in cluster with a new TP 75 75 75 77 100 87workload level SPC 38 75 50 53 100 69
TP, transaction profile; SPC, statistical process control.
Copyright © 2015 John Wiley & Sons, Ltd. Softw. Test. Verif. Reliab. (2015)DOI: 10.1002/stvr

A TECHNIQUE TO DETECT PERFORMANCE REGRESSION ANOMALIES
run, which is conducted with 750 users as the violation ratio is always high not because of a per-formance regression anomaly but due to the higher workload in the new run. Consequently, we cansee that the precision of the SPC charts approach in the last two experiments (with new workload)goes down drastically for both the JPetStore and industrial applications. This result explains why anextra performance testing run with exactly the same workload as previous release (baseline) run isneeded as was discussed in Section 2. On the contrary, the precision of the TP approach maintainsits value even with the new higher workload. Moreover, the precision results of the TP approach areslightly better than the SPC charts approach under the same workload.
Second, introducing one defect each time gives better precision and a lower recall compared withthe multidefect runs. This can be understood by the fact that such applications have overlappingfunctionalities, for example, the group page has a discussion widget installed. This means that whenwe remove the index from the discussion database table, it not only yields a higher TP for thediscussion transaction but also impacts the group transactions. So introducing multiple defects atthe same time is likely to have an accumulated impact on some transactions, which increases thepossibility of false positives that reduces the precision but will increase the recall. This kind of falsepositives therefore may reflect genuine regressions for that transaction caused by functionalitiesother than the core transaction functionality. The TRT is expected to suffer the same effect as can beseen from the SPC chart technique results. It should also be noted that such issues are expected to bepronounced in the traditional development process were the performance testing step is performedtowards the end of the project life cycle. On the contrary, the agile process is expected to suffer lessbecause of the smaller number of changes introduced in each iteration. This finding, as well as othersconcerning the application of the TP technique in the agile process, deserves further investigation.
Finally, the proposed reverse solution of the QNMs for each of the experiments earlier took anaverage of around 6 min for the JPetStore application and 14 min for the industrial application.This represents a fundamental saving when compared with the time needed for a performance rundedicated to find performance regression anomalies as discussed in Section 2. Such a performancerun lasts around 1 h for the JPetStore application and 3 h for the industrial application for thetests performed in this case study. The overheads of such a performance run, such as restoring thedatabase, cleaning/collecting logs and reserving the test environment for the duration of the run inaddition to the time and expertise knowledge required to analyse the results, are added to these runtimes resulting of a potentially considerable time saving when the TP approach is used.
7. CURRENT LIMITATIONS AND FUTURE WORK
7.1. Software contention
The presented technique works well under normal workload levels, while when the system is pushedbeyond normal or peak workload conditions, we noticed that a considerable change in the TP wasfound even when no performance sensitive changes were made to the application code. Our inves-tigation shows that this is due to software resources playing a main role in the QNM at such a highworkload. In our recent work [29], we proposed a way to model software contention, which we planto use in our future work to study its effect on the inferred TP. This includes studying the effect ofthe number of threads and the database connections pool on the model and the calculated TP.
7.2. Testing system evolution
It is possible for the testing system to evolve between the previous, baseline, run and the new run.This is such as adding a new node to the application server cluster or upgrading the database server.In such cases, the individual SDs (making up the TP) will need to be corrected according to thespecification of the new hardware. For example, if the database server CPU SD is 100 ms on a2 GHz CPU, then upgrading the database server hardware to 4 GHz CPU will mean that the SDis reduced to 50 ms. In this way, the TP can be corrected for each new hardware upgrade. Somecapacity management tools, which use the TP as well as implement this and have a database of allthe servers’ specifications, which is used to correct the TP for various hardware options.
Copyright © 2015 John Wiley & Sons, Ltd. Softw. Test. Verif. Reliab. (2015)DOI: 10.1002/stvr

S. GHAITH ET AL.
7.3. Performance of reverse solver
Another area for future enhancement is the reverse solver shown in Figure 10. As the size of thesystem increases, both classes (transactions) and stations (resource), the speed of this solver willbecome a crucial factor. So the need will be to make it more efficient and quicker to converge to asolution. We here refer to our recent related work [33], which discusses this issue in more detail.
7.4. Change of populated data
The amount of data populated in the database can vary in the new run compared with the previousrun (baseline). This is usually happening to account for growing field requirements. This is lessfrequent than the change of the workload applied to the system, but it could happen and shouldbe taken into account. Unlike workload changes, the data changes can have an effect on the TPparticularly on the database server SDs for both CPU and I/O. The change to the other SDs, mainlythe application server CPU, should be minimal as the various queries ought to be limiting the numberof data returned to the amount the user interface can handle (as we explained in the case study).
The effect of the change of populated data on TP is an interesting one that deserves more research.Initially, we suggest two solutions that may be explored more in future work
1. Provide a once-off option to ignore the database server SDs from the TP comparison when achange of populated data happens.
2. Correct the database server SDs by a factor determined with the help of the databasepopulation experts.
8. RELATED WORK
The main approach currently applied in industry to analyse performance regression testing data isthe manual approach. The testing engineer will investigate the performance counters, both RU andTRT by hand. He or she will look for an uptrend in RU, such as CPU utilization, or in TRT and useshis or her judgment to reason about them. A run with workload similar to previous run is needed.
Jiang et al. [1] suggested an automated technique to analyse performance regression testing datausing the readily available application execution log files. Accordingly, this technique does notrequire special instrumentation of the system under test. The approach relies on extracting log eventsby separating the static and dynamic fields of log lines entries. Then event sequences are establishedby combining the events with the same session ID. The occurrences of those event sequences in thelog files are then collected, and the time required to run each event sequence is restored from thetime stamps of the log entries. This is carried out for both previous and new runs, and TRT of eachsequence is compared statistically, and a deviation report is generated. This approach is limited bythe granularity of the log files and also suffers from the same issues as the statistical techniques.
Malik et al. [39] suggested to reduce the number of counters generated by performance regres-sion testing to a manageable number that can be analysed by performance experts and is knownas application signature. The number of 20 was suggested by industrial experts as the amount ofcounters that performance testing teams will be able to analyse out of hundreds of counters gener-ated in a complex environment. This signature is generated by keeping only one from each groupof correlated counters, such as the various CPU utilization counters (e.g. CPU processor user timeand CPU total user time) generated by system monitoring tools. The signature generation task canbe seen as dimension reduction problem. Four techniques were suggested to find the signature,one supervised and three unsupervised. Then the deviation is found in the signature by applyinga control chart approach such as the ones mentioned in [5, 13] to highlight anomalous behaviour.The dimension reduction techniques include some simple techniques such as random sampling andclustering techniques and two more complicated approaches mainly the principal components anal-ysis and the wrapper. The approach was tested against an open source and an industrial applicationand provided a good precision and recall. This approach uses the SPC charts and so will have the
Copyright © 2015 John Wiley & Sons, Ltd. Softw. Test. Verif. Reliab. (2015)DOI: 10.1002/stvr

A TECHNIQUE TO DETECT PERFORMANCE REGRESSION ANOMALIES
same problems of the statistical technique mentioned earlier, mainly the workload sensitivity andthe normal distribution. Also, experts’ intervention is required in various points in the signaturegeneration process.
Inferring the SDs (and so the TP) from the TRT and RU has been studied before. This is carriedout as measuring these counters is much easier than the SDs. Casale et al. [34] proposed to solvea linear regression between the RU and SD. While Kraft et al. [32] proposed a similar approach tocalculate SDs based on TRT instead of RU. Liu et al. [36, 36] proposed a formulation for estimatingthe parameters of queueing networks using a quadratic programming framework. They require theend-to-end parameters TRT, RU and throughput from a set of possibly incompatible runs. The mainlimitation of these approaches is that they assume that the system can be approximated with a singleserver model, while in regression testing, a simple system such as the one shown in Figure 6 iscomposed of multiple nodes (application server CPU and disk I/O and database server CPU and diskI/O). We need to explore multiple tier systems and to cater for multiple resources, such as CPU anddisk I/O. Additionally, all these approaches require multiple runs with different workloads, whichare time consuming to do in regression testing.
Using models to predict the performance of software systems under various workload levels(known as capacity planning) has been covered by [17, 40]. Almeida et al. [40] describe the detailsof modelling of computer systems by a QNM. They provide in detail the theoretical backgroundbehind the queueing models of various computer system resources in addition to use case stud-ies for various systems. Grinshpan [17] mentioned the concept of TP and its use along with theQNM of the computer system and the workload characterization to predict the performance ofthe system under various workload levels. The TP in this case is to be measured by a single usertest (using load generators) to obtain the various SDs of each transaction on each resource. Thenthe queueing model is solved via a various set of tools both commercial and open source. TheJMT is used in the examples provided to solve the model and to obtain TRT and RU of the vari-ous transactions and resources, respectively. In the capacity management approach, it is assumedthat a single user test is carried out to obtain TP of the various transactions. This is unlike per-formance regression testing where the addition of single user test is considered an overload to thetesting team and consequently is not a viable approach to obtain the TP. Apart from that, the mod-elling techniques used in the capacity planning field should work well in the proposed regressiontesting approach.
9. CONCLUSIONS
In this paper, we presented an approach to analyse performance testing data to detect performanceregression anomalies caused by software updates. This approach can replace the lengthy processcurrently used to discover such anomalies, which is usually conducted late in the project lifecycle.We showed how the TP is less prone to changes in the level of the workload applied to the systemthan the TRT that is used by state of the art techniques, which eliminates the need for a specificPRTR as part of the performance testing process. Furthermore, we showed that the TP can be usedas an automated way to discover such performance regression anomalies. Additionally, we proposeda novel way to infer the TP from already available performance data, mainly the RU, TRTs and theQNM of the testing system.
Through a variety of case studies, we showed the effectiveness of this approach, via the ‘TP Runreport’, on two web 2.0 applications: one open source and one industrial. The results showed that itcould detect anomalies with an average F1 measure of around 85% for the open source applicationand 90% for the industrial application. In addition, we showed that the technique is able to handlecomplex systems, particularly those with server clusters.
We expect that this workload-independent, automated approach will help reduce the time andeffort required to detect performance regression anomalies caused by application changes. Thisimproves the testing process and provides better details about the nature of the performance problemto the application developers and designers.
Copyright © 2015 John Wiley & Sons, Ltd. Softw. Test. Verif. Reliab. (2015)DOI: 10.1002/stvr

S. GHAITH ET AL.
ACKNOWLEDGEMENT
This work was supported, in part, by Science Foundation Ireland grant 10/CE/I1855 to Lero – theIrish Software Engineering Research Centre (www.lero.ie).
REFERENCES
1. Jiang ZM. Automated analysis of load testing results. In Proceedings of the 19th International Symposium onSoftware Testing and Analysis. ACM: New York, NY, USA, 2010; 143–146.
2. Kim J, Porter A, Rothermel G. An empirical study of regression test application frequency. Software Testing,Verification and Reliability 2005; 15(4):257–279. DOI:10.1002/stvr.326.
3. Hewlett-Packard. Loadrunner, 2014. Available from: http://www8.hp.com/ie/en/software-solutions/software.html?compURI=1175451#.UQ-2QWfuo-A [last accessed 28 February 2015].
4. Apache. Jmeter, 2014. Available from: http://jmeter.apache.org/ [last accessed 28 February 2015].5. Nguyen THD. Using control charts for detecting and understanding performance regressions in large software. In
Proceedings of the 2012 IEEE Fifth International Conference on Software Testing, Verification and Validation. IEEEComputer Society: Washington, DC, USA, 2012; 491–494.
6. Li J, Zhu H, He J. Specifying and verifying web transactions. Formal Techniques for Networked and DistributedSystems–FORTE 2008 2008; 5048:149–168.
7. Adrion WR, Branstad MA, Cherniavsky JC. Validation, verification, and testing of computer software. ACMComputing Surveys 1982; 14(2):159–192. DOI:10.1145/356876.356879.
8. Jain R. The Art of Computer Systems Performance Analysis, Vol. 182. John Wiley & Sons: New York, 1991.9. Cherkasova L, Ozonat KM, Mi N, Symons J, Smirni E. Anomaly? application change? or workload change? towards
automated detection of application performance anomaly and change. DSN, Anchorage, AK, 2008; 452–461.10. Griffiths N. nmon performance: a free tool to analyze AIX and Linux performance, 2003.11. Jacobson V, Leres C, McCanne S. Tcpdump, 1989. Available via anonymous ftp to ftp.ee.lbl.gov [last accessed 21
September 2013].12. Nguyen THD, Adams B, Jiang ZM, Hassan A, Nasser M, Flora P. Automated detection of performance regressions
using statistical process control techniques. Proceedings of the Third Joint WOSP/SIPEW International Conferenceon Performance Engineering, New York, NY, USA, 2012; 299–310.
13. Bereznay FM. Did something change? using statistical techniques to interpret service and resource metrics.In Proceedings 32nd International Computer Measurement Group Conference, December 3-6, 2006. ComputerMeasurement Group: Reno, Nevada, USA, 2006; 229–242.
14. Gao T, Ge Y, Wu G, Ni J. A reactivity-based framework of automated performance testing for web applications. 2010Ninth International Symposium on Distributed Computing and Applications to Business Engineering and Science(DCABES), Hong Kong, 2010; 593–597.
15. Ghaith S, Wang M, Perry P, Murphy J. Profile-based, load-independent anomaly detection and analysis inperformance regression testing of software systems. 17th European Conference on Software Maintenance andReengineering (CSMR’13), Genova, Italy, 2013; 379–383.
16. Ghaith S, Wang M, Perry P, Murphy J. Automatic, load-independent detection of performance regressions by trans-action profiles. In Proceedings of the 2013 International Workshop on Joining Academia and Industry Contributionsto Testing Automation, JAMAICA 2013. ACM: New York, NY, USA, 2013; 59–64. DOI:10.1145/2489280.2489286.
17. Grinshpan L. Solving Enterprise Applications Performance Puzzles. John Wiley and Sons, Inc.: Hoboken, NewJersey, 2012.
18. Alalfi MH, Cordy JR, Dean TR. Modelling methods for web application verification and testing: state of the art.Software Testing, Verification and Reliability 2009; 19(4):265–296. DOI:10.1002/stvr.401.
19. Huang P, Ma X, Shen D, Zhou Y. Performance regression testing target prioritization via performance risk analysis.Proceedings of the 36th International Conference on Software Engineering, ACM: Hyderabad, India, 2014; 60–71.
20. Foo KC, Jiang ZM, Adams B, Hassan A, Zou Y, Flora P. Mining performance regression testing repositories forautomated performance analysis. In Proceedings of the 2010 10th international conference on quality software. IEEEComputer Society: Washington, DC, USA, 2010; 32–41.
21. Urgaonkar B, Pacifici G, Shenoy P, Spreitzer M, Tantawi A. An analytical model for multi-tier internet services andits applications. SIGMETRICS Perform. Eval. Rev. 2005; 33(1):291–302. DOI:10.1145/1071690.1064252.
22. Menascé D, Almeida V. Capacity Planning for Web Services: Metrics, Models, and Methods. Prentice Hall: PTRUpper Saddle River, 2002.
23. Walrand J. An Introduction to Queueing Networks, Vol. 165. Prentice Hall Englewood Cliffs: NJ, 1988.24. Franks G, Al-Omari T, Woodside M, Das O, Derisavi S. Enhanced modeling and solution of layered queueing
networks. IEEE Transactions on Software Engineering 2009; 35(2):148–161.25. Lazowska E, Zahorjan J, Graham G, Sevcik K. Quantitative System Performance. Prentice-Hall: Englewood Cliffs,
1984.26. Kounev S, Buchmann AP. Performance modeling and evaluation of large-scale J2EE applications. International
CMG Conference, Dallas, TX, 2003; 273–283.27. Baldwin R, Iv ND, Midkiff SF, Kobza J. Queueing network analysis: concepts, terminology, and methods. Journal
of Systems and Software 2003; 66(2):99–117.
Copyright © 2015 John Wiley & Sons, Ltd. Softw. Test. Verif. Reliab. (2015)DOI: 10.1002/stvr

A TECHNIQUE TO DETECT PERFORMANCE REGRESSION ANOMALIES
28. Bertoli M, Casale G, Serazzi G. Java modelling tools: an open source suite for queueing network modellingand workload analysis. In Proceedings of Qest 2006 Conference. IEEE Press: Washington, DC, USA, Sep 2006;119–120.
29. Ghaith S, Wang M, Perry P, Murphy L. Software contention aware queueing network model of three-tier web sys-tems. Proceedings of the 5th ACM/SPEC International Conference on Performance Engineering, ACM, Dublin,Ireland, 2014; 273–276.
30. Baskett F, Chandy KM, Muntz R, Palacios F. Open, closed, and mixed networks of queues with different classes ofcustomers. Journal of the ACM 1975; 22(2):248–260.
31. Serazzi G. Performance evaluation modelling with JMT: learning by examples. Technical Report 366, Politecnico diMilano - DEI, Milano, 2008.
32. Kraft S, Pacheco-Sanchez S, Casale G, Dawson S. Estimating service resource consumption from response time mea-surements. In Proceedings of the Fourth International ICST Conference on Performance Evaluation Methodologiesand Tools. ICST (Institute for Computer Sciences, Social-Informatics and Telecommunications Engineering): ICST,Brussels, Belgium, Belgium, 2009; 48.
33. Ghaith S, Wang M, Perry P, Murphy J. Transaction profile estimation of queueing network models for IT systemsusing a search-based technique. 6th International Symposium, SSBSE, Fortaleza, Brazil, 2014; 234–239.
34. Casale G, Cremonesi P, Turrin R. Robust workload estimation in queueing network performance models. In Proceed-ings of the 16th Euromicro Conference on Parallel, Distributed and Network-Based Processing (PDP 2008). IEEEComputer Society: Washington, DC, USA, 2008; 183–187.
35. Lazowska ED, Sevcik KC. Quantitative System Performance: Computer System Analysis Using Queueing NetworkModels. Prentice-Hall, Inc.: Englewood Cliffs, 1984.
36. Liu Z, Wynter L, Cathy HX, Zhang F. Parameter inference of queueing models for IT systems using end-to-endmeasurements. Performance Evaluation 2006; 63(1):36–60.
37. Clarke J, Dolado JJ, Harman M, Hierons R, Jones B, Lumkin M, Mitchell B, Mancoridis S, Rees K, Roper M,Shepperd M. Reformulating software engineering as a search problem. Software IEE Proceedings 2003; 150(3):161–175.
38. MyBatis. JPetStore 6, 2014. Available from: http://mybatis.github.io/spring/ [last accessed 28 February 2015].39. Malik H, Hemmati H, Hassan A. Automatic detection of performance deviations in the load testing of large scale
systems. 35th International Conference on Software Engineering, Software Engineering in Practice, San Francisco,CA, USA, 2013; 1012–1021.
40. Menasce D, Dowdy L, Almeida V. Performance by Design: Computer Capacity Planning by Example. Prentice HallPTR: Upper Saddle River, NJ, USA, 2004.
ACRONYMS
TP Transaction profile. 1–7, 9–14, 16–33
TRT Transaction response time. 2–6, 8–13, 17, 18, 28–33
RU Resource utilization. 2, 3, 8–13, 17, 18, 29, 32, 33
TT Think time. 8, 11, 12, 15, 18
SD Service demand. 5–13, 20, 21, 28, 31–33
PPTR Primary performance testing run. 3, 4, 9, 28
PRTR Performance regression testing run. 3, 4, 9, 33
SLA Service level agreement. 3, 8, 28
QNM Queueing network model. 3, 4, 6, 8–13, 28–31, 33
BCMP Baskett–Chand–Muntz–Palacios. 8, 13, 20
JMT Java modelling tool. 8–13, 33, 35
SPC Statistical process control. 14, 16, 17, 20–32
Copyright © 2015 John Wiley & Sons, Ltd. Softw. Test. Verif. Reliab. (2015)DOI: 10.1002/stvr
S. GHAITH ET AL.
UCL Upper control limits. 17, 20
CL Centre line. 17
LCL Lower control limits. 17, 20
DBS Database server. 13
JEE Java enterprise edition. 14
SQL Structured query language. 16, 22
Copyright © 2015 John Wiley & Sons, Ltd. Softw. Test. Verif. Reliab. (2015)DOI: 10.1002/stvr