Embed Size (px)
Citation preview

Anomalous change of observed energies in Sandwich Calorimeter
Anomalous change of Anomalous change of observed energies in observed energies in Sandwich CalorimeterSandwich Calorimeter
Koi, TatsumiKoi, TatsumiSLAC/SCCSSLAC/SCCS
Overview• What is an anomalous change?• Range Cut• Step Limit• Summary• Appendix
– EM Packages– Boundary Crossing– Nut-Husk– Configuration– Shower Shape

What is a problem?• Liner Collider Simulation and Reconstruction group at SALC
reported anomalous change of observation energies in Sandwich Calorimeter according to the range cut values.
• Global Linear Collider group also aware this anomalous change independently.
• We SLAC Geant4 team considered this problem was quite important and started investigation with Geant4 EM developers.
• This report provides what we are observed and what efforts are carried out at SLAC, and Michel will report the current status of this problem from EM developers side.
Energy Deposition vs Range Cut
Sandwithc calorimete (Pb 8mm+Scinti 2mm) x 120 layer
70
75
80
85
90
95
100
105
110
0.00001 0.0001 0.001 0.01 0.1 1
RangeCut [mm]
Depo
sit Ener
gy [M
eV]
Eth. of e- in Abssorber (Lead) become 990eV
1μ
Eth. of γ in Abssorber (Lead) become 990eV
Eth. of e- in Gap (Scintilator) become 990eV
Eth. γ in Gap (Scintilator) become 990eV
about 30% increase
Energy Depositions increase until absorber’s production thresholdbecome minimum(990eV).

Simulation overview• Material
– Pb (Lead)-Scinitillator• Thickens
– Pb: 8.0 mm/layer, Sci: 2.0 mm/layer• Layers
– 120 layers– 1 m x 1 m – interaction surface
• Beam– Electon 4 GeV
• Range Cuts– 1 mm to 100nm (4 orders range)
• Geant4 v7.0.p01• This setup is referring to Suzuki et al., NIM A432 1999 p.48
Pb
8mm
2mm
Sci.
・・・・・・・・e-
Energy Deposition vs Range Cut
Sandwithc calorimete (Pb 8mm+Scinti 2mm) x 120 layer
70
75
80
85
90
95
100
105
110
0.00001 0.0001 0.001 0.01 0.1 1
RangeCut [mm]
Depo
sit Ener
gy [M
eV]
Eth. of e- in Abssorber (Lead) become 990eV
1μ
Eth. of γ in Abssorber (Lead) become 990eV
Eth. of e- in Gap (Scintilator) become 990eV
Eth. γ in Gap (Scintilator) become 990eV
about 30% increase
Energy Depositions increase until absorber’s production thresholdbecome minimum(990eV).
Energy Resolution vs Range Cut
Sandwich calorimeter (Lead 8mm+Scinti. 2mm) x 120 layer
0.09
0.095
0.1
0.105
0.11
0.115
0.12
0.125
0.13
0.00001 0.0001 0.001 0.01 0.1 1
RangeCut [mm]
σ/E
Eth. of e- in Abs. (Lead) become 990eV
1μ
Eth. of γ in Abs. (Lead) become 990eV
Eth. of e- in Gap (Scintilator) become 990eV
Eth. γ in Gap (Scintilator) become 990eV
Data
First suggestion is using MaxStepLimit
• Physics List ExN03 + Step Limitter
• Step Limits do not apply forγ• Step Limits apply both Absorber
and Gap

Energy Deposition vsMaxStepLength
Sandwithc calorimete (Pb 8mm+Scinti 2mm) x 120 layer
70
75
80
85
90
95
100
105
110
0.00001 0.0001 0.001 0.01 0.1 1
RangeCutn or MaxStepLength [mm]
Depo
sit Energ
y [M
eV]
No StepLimit
RC 1mm
RC 0.1mm
RC 0.01mm
RC 1μm
RC 0.1μm
1μ
Average Step length vsRange Cut
Average Step Length Absorber LEAD 8mm, Gap Scintillator 2mm
0.01
0.1
1
10
0.00001 0.0001 0.001 0.01 0.1 1
Range Cut [mm]
Ave
rage
Ste
p L
eng
th [m
m]
Absorber
Gap
1μ
Limit byGeometry (transpotation) ~2mm
Limit byProduction threshold
Small Range Cut might correspond to MaxStepLimit of 0.1mm in Gap
and 0.01mm in AbsorberSee next Plot.

Range cut and MaxStepLength
Sandwithc calorimete (Pb 8mm+Scinti 2mm) x 120 layer
70
75
80
85
90
95
100
105
110
0.00001 0.0001 0.001 0.01 0.1 1
RangeCut [mm]
Depo
sit Ene
rgy [M
eV]
1μ
MaxStepLimit 0.1mm in Gap 0.01 mm in Absorber
Differences still remain ~3%However it is same level to uncertainties.
Energy Resolution vsMaxStepLimit
Sandwich calorimeter (Lead 8mm+Scinti. 2mm) x 120 layer
0.09
0.095
0.1
0.105
0.11
0.115
0.12
0.125
0.13
0.00001 0.0001 0.001 0.01 0.1 1
RangeCut or MaxStepLength [mm]
σ/E
No StepLimit
RC 1mm
RC 0.1mm
RC 0.01mm
RC 1μm
RC0. 1μm
1μ
DATA

Computing Speed
1
10
100
1000
0.0001 0.001 0.01 0.1 1
Range Cut or Max Step Length [mm]
Rel
ative
CPU tim
e
[ unit is
Rc
1m
m n
o S
tep
Lim
it]
No Step Limit
1mm
0.1mm
0.01mm
1μm
0.1μm
Range Cut
almost same deposit energyDeference of computing speed factor ~5
Range cut 0.1 mmMax Step Limit 0.01mmis current recommendation values from Michel.
ResultsDeposit energy
• Deposit energy increased about 30% by change of Range Cut from 1mm to 0.1μm.
• This increase stopped at where secondary production limit of absorber became minimum (990eV).
• Limitation of Max Step Limit also increase deposit energy.
• This increase terminated around limitation of 2.5μm without dependence of Range Cut.
• Both end points are same within uncertainties.

Results Cont.Energy resolution (σ/E)
• Although average values of deposit energies are converged, energy resolutions are not converged at all and well scattered distributed with no significant trend.
• The agreement of energy resolutions to data (Suzuki et al.,) is not so bad(????) about 2~3σ level however it seems to incline toward the underestimate side.
Results Cont.• Small Range cut values corresponds to apply small
Max Step Length.• If we uses small Range cut value (<0.01mm) then
we do not need to apply Step Limit to Gaps. This should effect computing speed. (Unfortunately, Absorbers mass is greater than Gaps, so the effect is limited.)
• Applying very small Max Step Length ( less than few μm) is more CPU intense than the minimum range cut.
• For average energy deposition, a result with Range Cut 0.01mm and MaxStepLenght 0.01mm gives almost same value as result with minimum range cut. Former is five time faster than later.
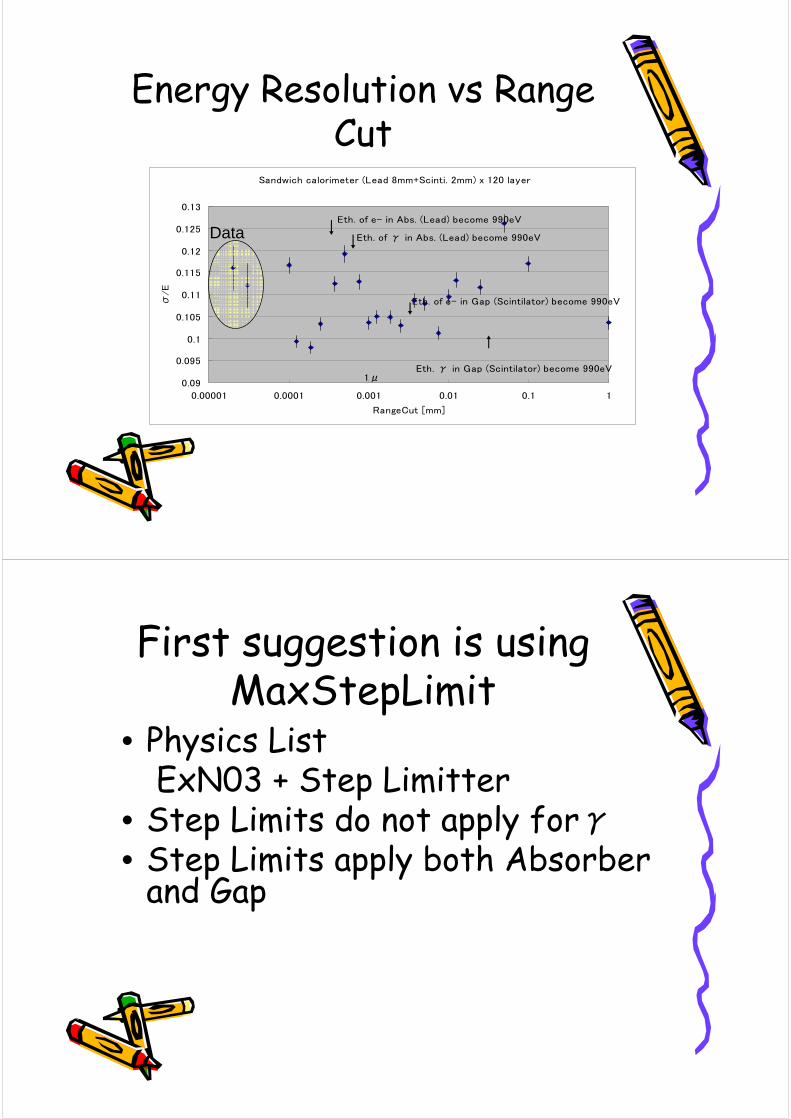
Further investigation • I calculated several sandwich calorimeter,
i.e., changing material (ex. W-Si) and ration between Absorber and Gap. Similar results are gotten.
• I calculated sandwich calorimeter which has same material for absorber and Gap. The feature we discussed here disappeared.
• I also did simulation without Multiple Coulmb Scattering. The results shows very small or no increase on energy depositions.
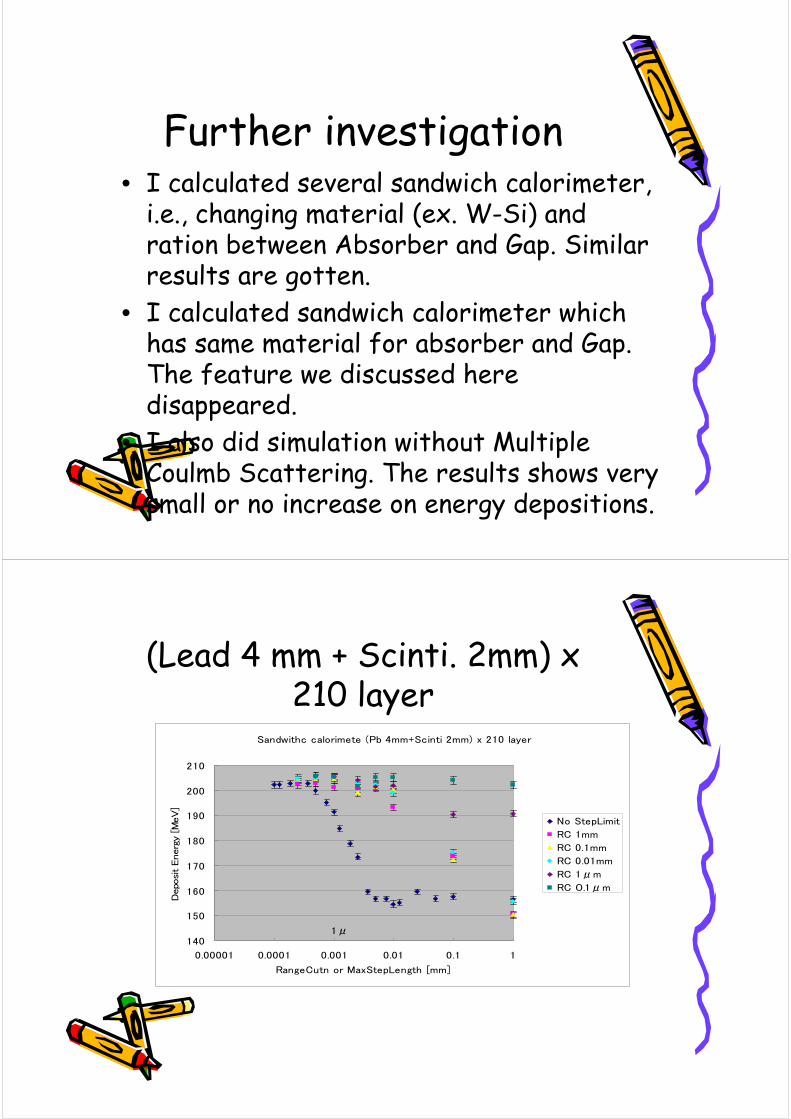
(Lead 4 mm + Scinti. 2mm) x 210 layer
Sandwithc calorimete (Pb 4mm+Scinti 2mm) x 210 layer
140
150
160
170
180
190
200
210
0.00001 0.0001 0.001 0.01 0.1 1
RangeCutn or MaxStepLength [mm]
Depo
sit Energ
y [M
eV]
No StepLimit
RC 1mm
RC 0.1mm
RC 0.01mm
RC 1μm
RC 0.1μm
1μ
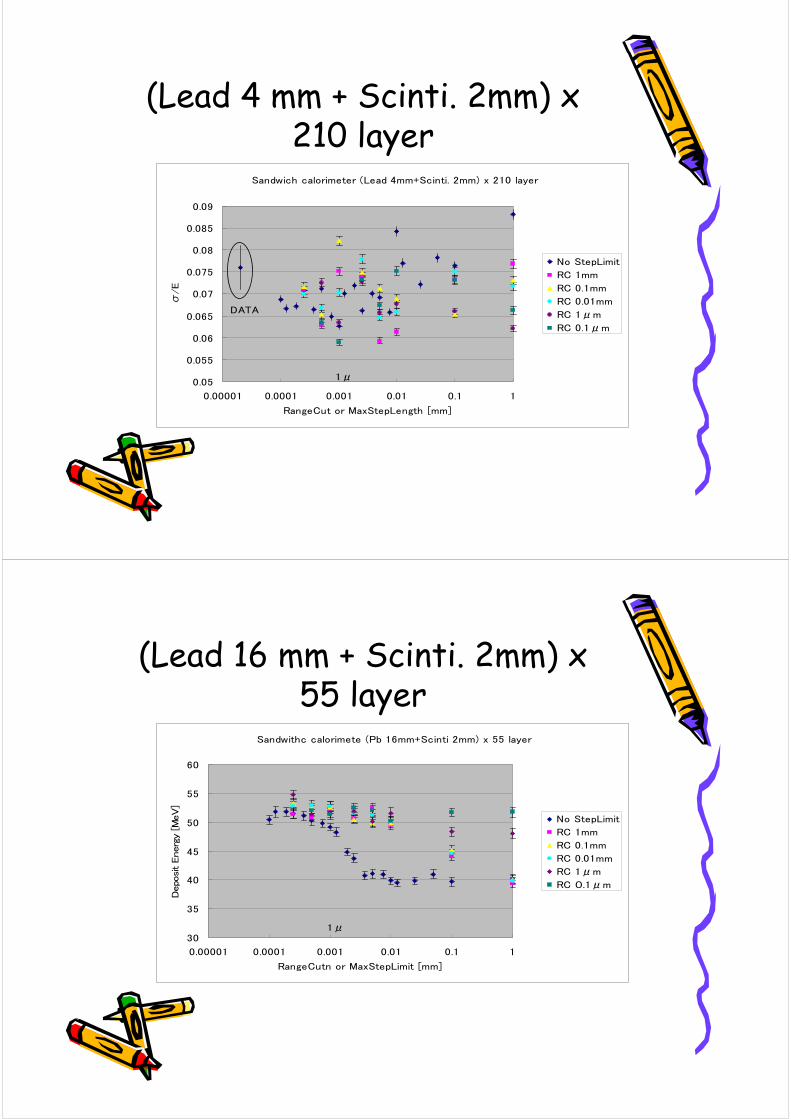
(Lead 4 mm + Scinti. 2mm) x 210 layer
Sandwich calorimeter (Lead 4mm+Scinti. 2mm) x 210 layer
0.05
0.055
0.06
0.065
0.07
0.075
0.08
0.085
0.09
0.00001 0.0001 0.001 0.01 0.1 1
RangeCut or MaxStepLength [mm]
σ/E
No StepLimit
RC 1mm
RC 0.1mm
RC 0.01mm
RC 1μm
RC 0.1μm
1μ
DATA
(Lead 16 mm + Scinti. 2mm) x 55 layer
Sandwithc calorimete (Pb 16mm+Scinti 2mm) x 55 layer
30
35
40
45
50
55
60
0.00001 0.0001 0.001 0.01 0.1 1
RangeCutn or MaxStepLimit [mm]
Depo
sit Energ
y [M
eV]
No StepLimit
RC 1mm
RC 0.1mm
RC 0.01mm
RC 1μm
RC 0.1μm
1μ

(Lead 16 mm + Scinti. 2mm) x 55 layer
Sandwich calorimeter (Lead 16mm+Scinti. 2mm) x 55 layer
0.12
0.13
0.14
0.15
0.16
0.17
0.18
0.19
0.2
0.00001 0.0001 0.001 0.01 0.1 1
RangeCut or MaxStepLength [mm]
σ/E
No StepLimit
RC 1mm
RC 0.1mm
RC 0.01mm
RC 1μm
RC 0.1μm
1μ
DATA
Same material for Absorber and Gap.
Sandwithc calorimete (Pb 8mm+Pb 4mm) x 120 layer
775
780
785
790
795
800
805
810
0.00001 0.0001 0.001 0.01 0.1 1
RangeCutn [mm]
Dep
osit E
nerg
y [M
eV]
1μ
1~2%increase???

Same material for Absorber and Gap.
Sandwich calorimeter (Lead 8mm+Pb 2mm) x 120 layer
0.04
0.045
0.05
0.055
0.06
0.065
0.07
0.075
0.08
0.00001 0.0001 0.001 0.01 0.1 1
RangeCut[mm]
σ/E
1μ
Without Multiple Coulomb Scattering
Sandwithc calorimete (Pb 8mm+Scinti 2mm) x 120 layerWithout MCS
90
95
100
105
110
115
120
125
130
0.00001 0.0001 0.001 0.01 0.1 1
RangeCutn[mm]
Dep
osit Energ
y [M
eV]
1μ

Without Multiple Coulomb Scattering
Sandwich calorimeter (Lead 8mm+Scinti. 2mm) x 120 layerWithout MCS
0
0.02
0.04
0.06
0.08
0.1
0.12
0.14
0.00001 0.0001 0.001 0.01 0.1 1
RangeCut [mm]
σ/E
Eth. of e- in Abs. (Lead) become 990eV
1μ
Eth. of γ in Abs. (Lead) become 990eV
Eth. of e- in Gap (Scintilator) become 990eV
Eth. γ in Gap (Scintilator) become 990eV
DATA
So that, Multiple Coulomb
Scattering is most likely responsible to
this problem.

• Try for understood– EM package dependency– History ( especially for resolution) – Changing Configuration of a layer
• Try for Speed up– Boundary Crossing– Nut-Husk
Comparison among EM packages
Sandwich calorimeter (Pb 8mm+Scinti 2mm) x 120 layer
70
75
80
85
90
95
100
105
110
115
0.0001 0.001 0.01 0.1 1
Range Cut [mm]
Dep
osit Ener
gy [M
eV]
STD
v5.2
LEEM
e- prodction threshold in absorber (lead) become 250 eV
e- prodction threshold in absorber (lead) become 990 eV
gamma prodction threshold in absorber (lead) become 990 eV and also reach 250 eV.

Extend number of samplefrom 100 to 10000 (1000)
Sandwithc calorimeter (Pb 8mm+Scinti 2mm) x 120 layer
75
80
85
90
95
100
105
110
0.0001 0.001 0.01 0.1 1
Rc [mm]
Depo
sit Ener
gy [M
eV]
100
10000
1000
Nut-Husk• Divide Absorber two parts as Nut
and Hask.• Apply different Range Cut values for
Nut and Hask.
Nut
Husk
Thickness of Hask

Nut-HuskPb 8mm Sci 2mm Nut-Husk
75
80
85
90
95
100
105
0 0.5 1 1.5 2 2.5 3 3.5
Husk Thickness [mm]
depo
sit
energ
y [M
eV
]
RC 1mm
RC 0.1mm
RC 0.01mm
RC 0.001mm
Extend number of samplefrom 100 to 10000 (1000)
Sandwithc calorimeter (Pb 8mm+Scinti 2mm) x 120 layer
0.08
0.09
0.1
0.11
0.12
0.13
0.14
0.0001 0.001 0.01 0.1 1
Rc [mm]
σ/E
100
10000
1000

Boundary Crossing limitation.
• If backward scattering of slow electrons from absorber makes increase of energy deposition, we may limit applying MaxStepLegnth only for several series of steps after crossing boundary.
• Check, is PreStepPoint limited by Geometrical Boundary.
• Then, n successive steps after crossing boundaries, MaxStepLength is artificially limited to x.
• The implementation is achieved in G4MultipleScatering.
Bounary
Until nth step,
Step Limit artificially small.
Boundary Crossing Process
70
75
80
85
90
95
100
105
110
0.00001 0.0001 0.001 0.01 0.1 1
Range Cut [mm]
Depo
sition E
nerg
y [M
eV] 100μm 5th
100μm 50th
100μm 500th
100μm 5000th
10μm 5th
10μm 50th
10μm 500th
10μm 5000th
1μm 5th
1μm 50th
1μm 500th
1μm 5000th
Max
StepLength X
Limit
until n

Boundary Crossing Results
• I create Step Limits which only effect n steps after boundary crossing.
• However this limitation gives smaller energy deposition than usual MaxStepLength limitation.
Boundary Crossing Summary
• Both range cut and max step length effects average energy deposition of sandwich calorimeter.
• The amount of increases reaches about 30%.
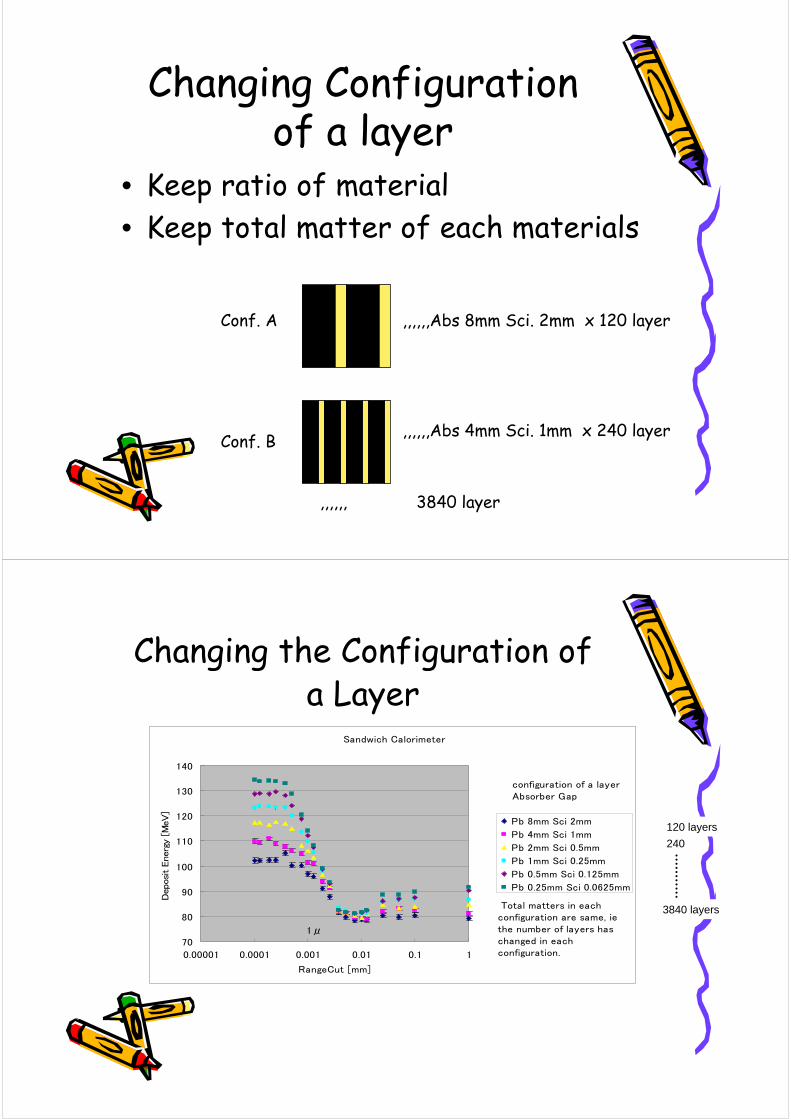
Changing Configuration of a layer
• Keep ratio of material• Keep total matter of each materials
,,,,,,Abs 8mm Sci. 2mm x 120 layer
,,,,,,Abs 4mm Sci. 1mm x 240 layer
Conf. A
Conf. B
,,,,,, 3840 layer
Changing the Configuration of a Layer
Sandwich Calorimeter
70
80
90
100
110
120
130
140
0.00001 0.0001 0.001 0.01 0.1 1
RangeCut [mm]
Depo
sit Ene
rgy [M
eV]
Pb 8mm Sci 2mm
Pb 4mm Sci 1mm
Pb 2mm Sci 0.5mm
Pb 1mm Sci 0.25mm
Pb 0.5mm Sci 0.125mm
Pb 0.25mm Sci 0.0625mm
1μ
configuration of a layerAbsorber Gap
Total matters in eachconfiguration are same, iethe number of layers haschanged in eachconfiguration.
120 layers
240
3840 layers

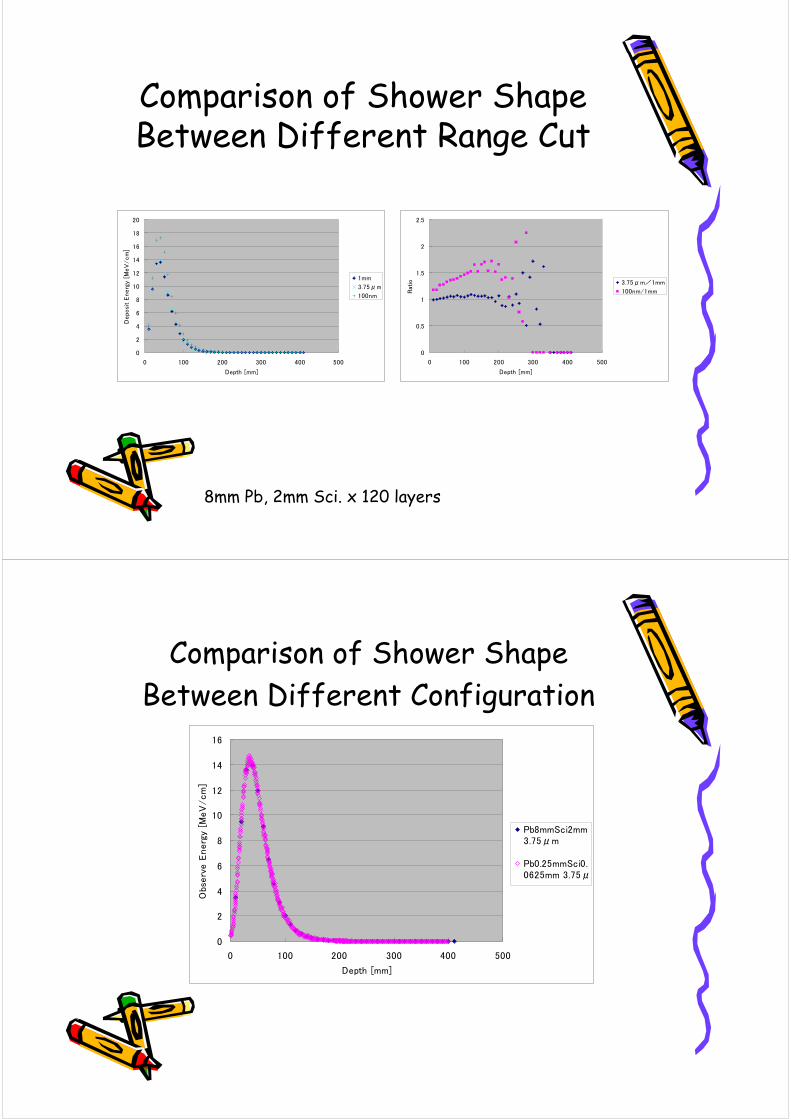
Comparison of Shower ShapeBetween Different Range Cut
0
2
4
6
8
10
12
14
16
18
20
0 100 200 300 400 500
Depth [mm]
Depo
sit
Energ
y [M
eV
/cm
]
1mm
3.75μm
100nm
8mm Pb, 2mm Sci. x 120 layer
Comparison of Shower ShapeBetween Different Range Cut
8mm Pb, 2mm Sci. x 120 layers
0
0.5
1
1.5
2
2.5
0 100 200 300 400 500
Depth [mm]
Rat
io 3.75μm/1mm
100nm/1mm
Comparison of Shower ShapeBetween Different Range Cut
8mm Pb, 2mm Sci. x 120 layers
0
0.5
1
1.5
2
2.5
0 100 200 300 400 500
Depth [mm]
Rat
io 3.75μm/1mm
100nm/1mm
0
2
4
6
8
10
12
14
16
18
20
0 100 200 300 400 500
Depth [mm]
Depo
sit
Energ
y [M
eV
/cm
]
1mm
3.75μm
100nm
Comparison of Shower ShapeBetween Different Configuration
0
2
4
6
8
10
12
14
16
0 100 200 300 400 500
Depth [mm]
Obs
erv
e E
nerg
y [M
eV
/cm
]
Pb8mmSci2mm3.75μm
Pb0.25mmSci0.0625mm 3.75μ

Comment from MichelIn your exercises, of course the global ratio scintillator/lead is unchanged, but however the geometry is changed. The results are not directly comparable. I switch off the msc. We know that in this case, the energy deposit is practically independent of cut or stepmax. But it not the same in the 6 cases you have shown : It ranges from 121 MeV (120 layers) to 137 MeV ( 3840 layers)
Changing the Configuration of a Layer (Cont.)
Sandwich Calorimeter
75
80
85
90
95
100
105
110
115
0.001 0.01
RangeCut [mm]
Depo
sit
Energ
y [M
eV
]
Pb 8mm Sci 2mm
Pb 4mm Sci 1mm
Pb 2mm Sci 0.5mm
Pb 1mm Sci 0.25mm
Pb 0.5mm Sci 0.125mm
Pb 0.25mm Sci 0.0625mm
1μ
configuration of a layer
Absorber Gap
Total matters in each
configuration are same, iethe number of layers haschanged in eachconfiguration.
e- Scinti.

Fin.