Embed Size (px)
Citation preview

0
5
25
75
95
100
0
5
25
75
95
100
0
5
25
75
95
100
0
5
25
75
95
100
Macintosh HD:CURRENT JOBS:HLL_AR-2k5-067-13:HLL AR 2K5 Cover 1-4.psMacintosh HD:CURRENT JOBS:HLL_AR-2k5-067-13:HLL AR 2K5 Cover 1-4.cdrThursday, April 27, 2006 12:39:57 AM
Color profile: DisabledComposite Default screen
0
5
25
75
95
100
0
5
25
75
95
100
0
5
25
75
95
100
0
5
25
75
95
100
Macintosh HD:CURRENT JOBS:HLL_AR-2k5-067-13:HLL AR 2K5 Cover 1-4.psMacintosh HD:CURRENT JOBS:HLL_AR-2k5-067-13:HLL AR 2K5 Cover 1-4.cdrThursday, April 27, 2006 12:40:04 AM
Color profile: DisabledComposite Default screen

Notes and Schedules
47
Report of the Auditors
76
Additional Information - Economic Value Added
80
Consolidated Accounts
81
Statement Pursuant to Section 212
107
Code of Conduct
108
Significant Accounting Policies
43
Profit and Loss Accounts
44
Balance Sheet
45
Cash Flow Statement
46
08
ManagementCommittee
02
09
06
Board ofDirectors
Directors’Report
05
PerformanceTrends 1996-2005
43
Financials
Letter FromThe Chairman
CMYK

2 3 HINDUSTAN LEVER LIMITED
strengthening the brand portfolio and delighting the consumers with better overall
value. Brands are a significant asset of the Company; substantially higher levels of
investment in advertising and promotions behind our brands helped deliver category
growth well ahead of the market. Many of our brands gained shares in an intensely
competitive scenario, supported by high quality innovation crafted jointly by our
marketing and technical teams. Brands like Lux, Clinic All Clear, Brooke Bond Red Label
Nature Care, Surf Excel, Knorr Soups are excellent examples of the power of such
innovation.
Building strong capabilities is an important agenda for your Company. This calls for
continuous revamp of business processes, HR capabilities and leveraging of economies
of scale. 'One HLL' approach in sales and customer development was implemented,
involving consolidation of the function and re-deployment of its resources towards
active demand generation at the Point of Purchase, both in rural and urban markets.
This played a critical role in driving the growth agenda of the Company.
Your Company benefits substantially from linkages to Unilever and access to its
intellectual and human capital. These linkages help the Company to drive innovations,
and bring “best in class” processes in various functions like Finance, IT, HR and Supply
Chain; these help significantly to upgrade organisational capabilities and our
competitiveness in the market place.
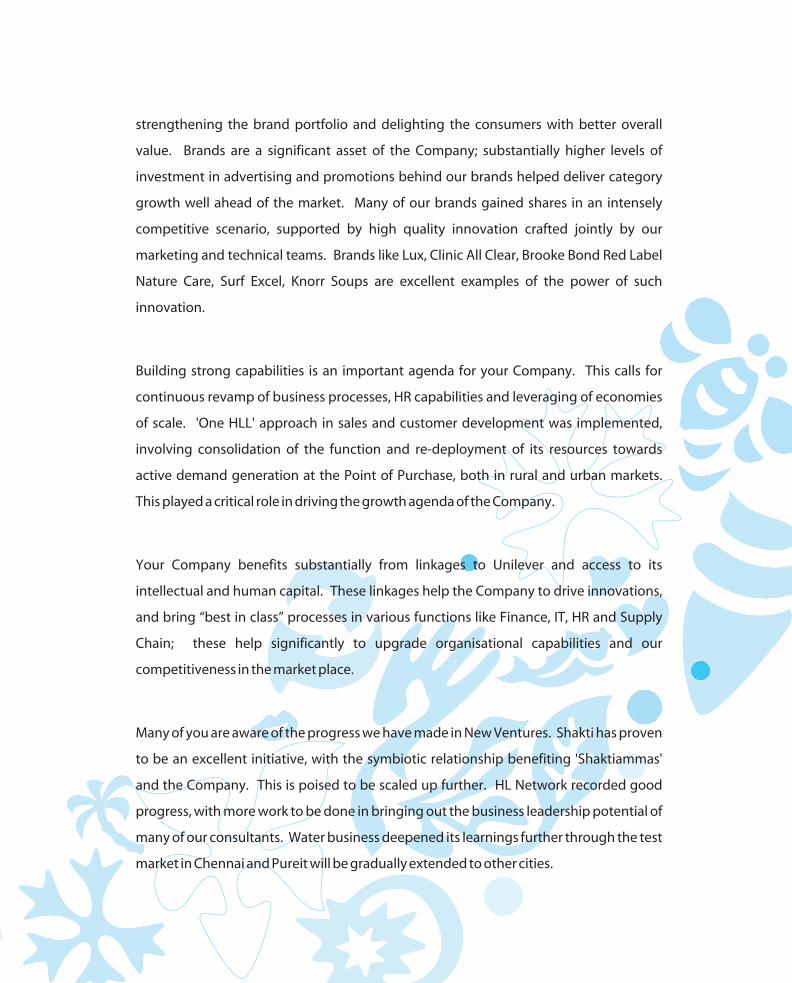
Many of you are aware of the progress we have made in New Ventures. Shakti has proven
to be an excellent initiative, with the symbiotic relationship benefiting 'Shaktiammas'
and the Company. This is poised to be scaled up further. HL Network recorded good
progress, with more work to be done in bringing out the business leadership potential of
many of our consultants. Water business deepened its learnings further through the test
market in Chennai and Pureit will be gradually extended to other cities.
Letter FromThe Chairman
At the outset, I thank all of you for the privilege given to me to serve as the Chairman of
Hindustan Lever Limited. I am also pleased to report a good performance in 2005 by your
Company, returning to robust topline growth after a gap of some years.
Indian economy continued to perform well with real GDP growth of 8% in 2005-06 and
remained one of the fastest growing economies of the world. Many of the economic
parameters remain strong and positive. FMCG segment, which witnessed a scenario of
poor or no growth in the past few years, began to change for the better, with good
growth numbers posted across various categories from the last quarter of 2004 onwards
and throughout 2005. Independent market research numbers put FMCG value growth
for 2005 at 5%.
On the back of a strong revival in FMCG markets, and with active marketing, sales and
innovation inputs, your Company reported a sales growth of 11% in 2005. FMCG
categories performed even better at 13% with both HPC and Foods delivering good
numbers. Your Company continued to sharpen its competitiveness by substantially
Dear Shareholders,
CMYK
2 3 HINDUSTAN LEVER LIMITED
strengthening the brand portfolio and delighting the consumers with better overall
value. Brands are a significant asset of the Company; substantially higher levels of
investment in advertising and promotions behind our brands helped deliver category
growth well ahead of the market. Many of our brands gained shares in an intensely
competitive scenario, supported by high quality innovation crafted jointly by our
marketing and technical teams. Brands like Lux, Clinic All Clear, Brooke Bond Red Label
Nature Care, Surf Excel, Knorr Soups are excellent examples of the power of such
innovation.
Building strong capabilities is an important agenda for your Company. This calls for
continuous revamp of business processes, HR capabilities and leveraging of economies
of scale. 'One HLL' approach in sales and customer development was implemented,
involving consolidation of the function and re-deployment of its resources towards
active demand generation at the Point of Purchase, both in rural and urban markets.
This played a critical role in driving the growth agenda of the Company.
Your Company benefits substantially from linkages to Unilever and access to its
intellectual and human capital. These linkages help the Company to drive innovations,
and bring “best in class” processes in various functions like Finance, IT, HR and Supply
Chain; these help significantly to upgrade organisational capabilities and our
competitiveness in the market place.
Many of you are aware of the progress we have made in New Ventures. Shakti has proven
to be an excellent initiative, with the symbiotic relationship benefiting 'Shaktiammas'
and the Company. This is poised to be scaled up further. HL Network recorded good
progress, with more work to be done in bringing out the business leadership potential of
many of our consultants. Water business deepened its learnings further through the test
market in Chennai and Pureit will be gradually extended to other cities.
Letter FromThe Chairman
At the outset, I thank all of you for the privilege given to me to serve as the Chairman of
Hindustan Lever Limited. I am also pleased to report a good performance in 2005 by your
Company, returning to robust topline growth after a gap of some years.
Indian economy continued to perform well with real GDP growth of 8% in 2005-06 and
remained one of the fastest growing economies of the world. Many of the economic
parameters remain strong and positive. FMCG segment, which witnessed a scenario of
poor or no growth in the past few years, began to change for the better, with good
growth numbers posted across various categories from the last quarter of 2004 onwards
and throughout 2005. Independent market research numbers put FMCG value growth
for 2005 at 5%.
On the back of a strong revival in FMCG markets, and with active marketing, sales and
innovation inputs, your Company reported a sales growth of 11% in 2005. FMCG
categories performed even better at 13% with both HPC and Foods delivering good
numbers. Your Company continued to sharpen its competitiveness by substantially
Dear Shareholders,
CMYK

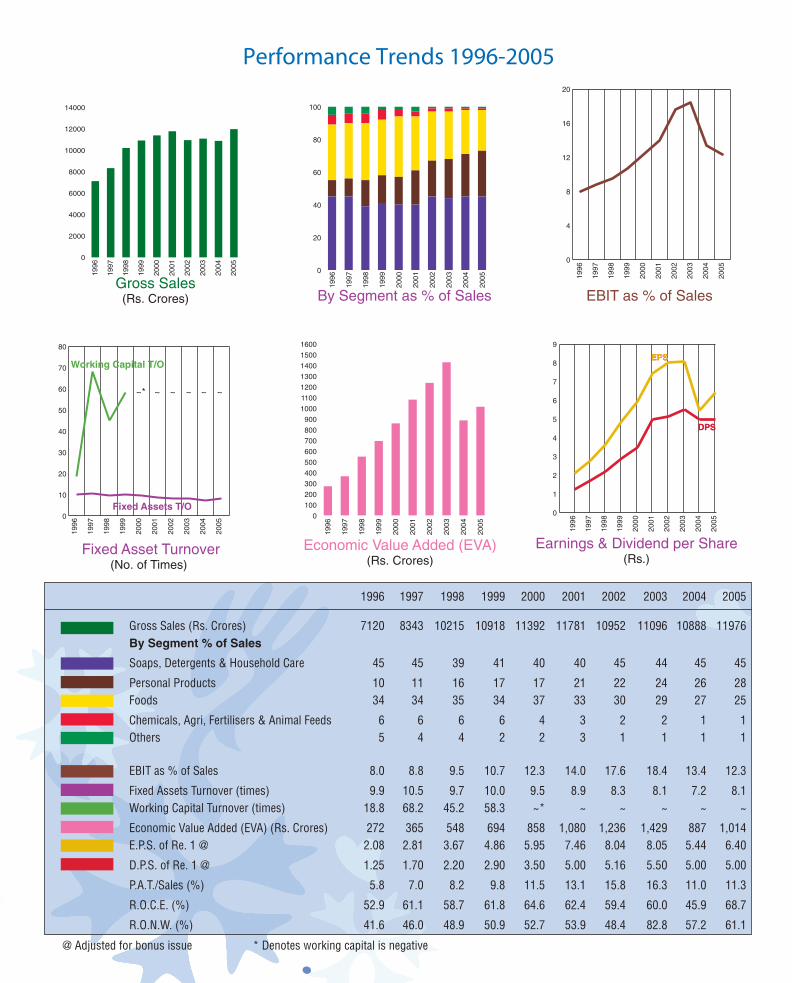
Performance Trends 1996-2005
4 HINDUSTAN LEVER LIMITED5
0
100
200
300
400
500
600
700
800
900
1000
1100
1200
1300
1400
1500
1600
In 2005, Unilever reorganised its business globally, resulting in the creation of a new
Regional and Category structure. Asia Africa (AA) is one of the three regions for which I
am responsible. AA is the home for some three-fourth of World's population with
immense growth potential for the future. HLL is an important part of Unilever's AA
business and is recognized as a key priority for Unilever given the strong growth in the
economy and HLL's pre-eminent position in the market. Your Company has much to
offer to other parts of AA and equally, benefits enormously from being part of this fast
growing Region.
Arising from the new organisational structure for Unilever, HLL has revamped
its top management organisation. Douglas Baillie has taken over as the CEO of your
Company with a reconstituted Management Committee (MC). This MC reflects a mix of
business responsibilities for HPC, Foods and Exports and Functional responsibilities on a
“One HLL” basis for HR/Legal, Finance/IT, Supply Chain and Customer Development. I am
sure that the new MC, under the able and experienced leadership of Douglas Baillie, will
deliver well for all the stakeholders of the Company.
Profitable competitive growth calls for achieving Market Leadership, Cost Leadership
and Thought Leadership to deliver it. Team HLL is determined to drive this agenda and
deliver superior shareholder value.
I thank you all for your continued support to the Company.
With my best wishes to all of you,
Harish Manwani
CMYK

Harish ManwaniChairman
Douglas BaillieChief Executive Officer &Managing Director
M. K. SharmaVice Chairman
Managing DirectorFoods
S. RavindranathDirectorFinance & IT
D. Sundaram
V. NarayananDirector
A. NarayanDirector
S. RamadoraiDirector
C. K. PrahaladDirector
D. S. ParekhDirector
V.P. Legal and Company Secretary
Ashok K. Gupta
Registered Office
Hindustan Lever House,165/166, Backbay ReclamationMumbai - 400 020
SolicitorsCrawford Bayley & Co.
Auditors
Lovelock & Lewes
Bankers
State Bank of India
Standard Chartered Bank
Citibank N. A.
Hongkong & Shanghai
Banking Corporation
Bank of America
Deutsche Bank
ABN-AMRO Bank
Punjab National Bank
Corporation Bank
HDFC Bank
ICICI Bank
Board of Directors
6 HINDUSTAN LEVER LIMITED7
CMYK

Management Committee
8 HINDUSTAN LEVER LIMITED
Douglas BaillieChief Executive Officer &
Managing DirectorM. K. SharmaVice Chairman
DirectorFinance & IT
D. SundaramManaging Director
Foods
S. Ravindranath
Anoop MathurExecutive Director
Speciality Exports
Executive DirectorSupply Chain
Dhaval Buch
Executive DirectorHome & Personal Care
Nitin Paranjpe
Executive DirectorSales & CustomerDevelopment
Sanjay Dube
CMYK

2005
HINDUSTAN LEVER LIMITED
9
Report of the Directors and Management Discussion & Analysis1. PERFORMANCE OF THE COMPANY
1.1 Results
Your Company’s performance during 2005 is summarisedbelow :
Rs. Lakhs
2005 2004
Gross turnover 11975,53 10888,38Turnover, net of excise 11060,55 9926,95Profit before tax 1604,47 1505,32Tax on profits (249,96) (306,05)Exceptional Items 53,60 (1,93)Net profit 1408,11 1197,34Dividend (incl. tax ondistributed profits) (1260,25) (1246,15)Transfer to General Reserve (142,00) (125,00)Profit & Loss Accountbalance carried forward 650,66 644,80
1.2 Key Ratios
The underlying performance can be ascertained from thefollowing key ratios :
2005 2004
Earnings per share (Rs.) 6.40 5.44(per share of (per share ofRe. 1/- each) Re. 1/- each)
Dividend per share (Rs.) 5.00 5.00(per share of (per share ofRe. 1/- each) Re. 1/- each)
Return on Net worth (%) 61.1 57.2
1.3 TurnoverGross turnover for the year increased by 10% and netturnover increased by 11.4% primarily due to higherproduction in fiscal benefit zones. The sales of products indifferent categories, net of excise, appears below:
Rs. Lakhs2005 2004
Sales Others* Sales Others*Soaps, Detergents &Scourers 4928,94 32,77 4447,98 22,76Personal Products 2907,88 44,00 2434,83 37,41Beverages 1277,35 9 1192,89 1,66Foods 313,72 — 285,07 —Ice Creams 97,03 1,11 87,74 1,20Exports 1347,80 — 1249,02 —Others 187,83 55,37 229,42 45,31
Total 11060,55 133,34 9926,95 108,34
* The other revenue represents service income fromoperations, appropriated to the relevant businesses.
1.4 Summarised Profit and Loss AccountRs. Lakhs
For the year ended 2005 2004 Rate of31 December, growth%
Net sales 11060,55 9926,95 11.4
Other income 304,78 318,83 (4.4)
Total income 11365,33 10245,78 10.9
Operating expenses (9617,22) (8489,58) 13.3
PBDIT 1748,11 1756,20 (0.5)
Depreciation (124,45) (120,90) 2.9
PBIT 1623,66 1635,30 (0.7)
Interest (19,19) (129,98) (85.2)
Profit Before Taxation (PBT)and exceptional items 1604,47 1505,32 6.6
Taxation : Current tax (223,00) (266,00) (16.2)
Taxation : Deferred tax (41,00) (54,74) (25.1)
Taxation : Fringe Benefit Tax (30,00) — —
Taxation adjustments of
previous years (net) 44,04 14,69 199.7
Profit After Taxation (PAT)and before exceptional items 1354,51 1199,27 12.9
Exceptional items (net of tax) 53,60 (1,93) (2873.0)
Net profit 1408,11 1197,34 17.6
2. RESPONSIBILITY STATEMENT
The Directors confirm :
a) that in the preparation of the annual accounts, theapplicable accounting standards have been followedand that no material departures have been madefrom the same;
b) that they have selected such accounting policies andapplied them consistently and made judgements andestimates that are reasonable and prudent so as togive a true and fair view of the state of affairs of theCompany at the end of the financial year and of theprofits of the Company for that period;
c) that they have taken proper and sufficient care forthe maintenance of adequate accounting recordsin accordance with the provisions of the CompaniesAct, 1956 for safeguarding the assets of theCompany and for preventing and detecting fraudand other irregularities;
d) that they have prepared the annual accounts on agoing concern basis.

HINDUSTAN LEVER LIMITED
200510
3. CORPORATE GOVERNANCE
Certificate dated April 28, 2006 of the auditors of yourCompany regarding compliance of the conditions ofCorporate Governance as stipulated in Clause 49 of thelisting agreement with stock exchanges, is enclosed.
Your Company has been practicing the principles of goodcorporate governance over the years.
The Board of Directors supports the broad principles ofcorporate governance. In addition to the basic governanceissues, the Board lays strong emphasis on transparency,accountability and integrity.
4. CHANGE IN THE ORGANISATION STRUCTURE
Pursuant to changes in the Unilever operating framework,the organisation structure of your Company was simplifiedduring the year by the appointment of a ManagementCommittee comprising Mr. M.K. Sharma, Mr. D. Sundaram,Mr. S. Ravindranath, Mr. Anoop Mathur, Mr. Sanjay Dube,Mr. Nitin Paranjpe and Mr. Dhaval Buch under theleadership of Mr. Douglas Baillie, as CEO and ManagingDirector of the Company.
The new structure consisting of business and functionalleaders aims at driving the agenda of creating and buildingdedicated consumer and customer resources and is poisedtowards achieving a greater organisational balance between‘Focus’ and ‘Scale’ as a means to tap the marketopportunities in the emerging economic and socialconditions in India.
5. MANAGEMENT DISCUSSION AND ANALYSIS(MD & A)
As in the previous year, this Report includes MD & A asappropriate so that duplication and overlap betweenDirectors' Report and a separate MD & A is avoided andthe entire material is provided in a composite andcomprehensive document.
6. PRODUCT CATEGORIES
This report records the business performance of theCompany in a simplified structure with a sharper focus onpower brands and categories in the combined (i) Homeand Personal Care (HPC) Division and, an integrated(ii) Foods Division, comprising Beverages, Foods, and IceCream businesses. New ventures and Speciality Exportscontinued to operate outside these two Divisions.
6.1 Home and Personal Care Business
HPC markets which returned to growth in second half of2004 sustained their revival and grew by 6.6% in 2005.The market continued to witness intense competitive activityboth from multinational and local players. The business
also faced severe challenges on the cost front due to highercrude oil prices.
In this context your Company’s sales grew by a robust11.4%. The segment profit of the business grew by 6.6%,the profit impacted by cost and higher brand investments.A&P investments behind our brand increased by 20.3% tostrengthen their competitiveness.
6.1.1 Soaps & Detergents
In the Soaps & Detergents segment, your Company salesgrew by 11%. The segment profit however declined by11.8% over 2004.
In fabric wash intense competitive activity continued. Highcrude oil prices resulted in increased raw material coststhereby affecting the margins. In this background Laundrycategory sales grew by a smart 16.3% achieving doubledigit growth for a second year in succession. Significantinvestments were continued to be made in productinnovation and quality. During the year, Rin Advancedcontinued to strengthen its position and gained marketshare. The unique patented ‘zero mineral’ detergent bar“Rin Supreme” continued to grow strongly, backed by greatproduct performance and advertising. Overall Rin portfoliogrew in double digits.
Wheel, your Company’s largest brand, crossed Rs.1,000crores of sales in the current year. It was the fastest growingbrand in HLL's laundry business growing at over 19%.During the year, Wheel was relaunched as “Lemon fresh”and this launch was backed by significant activationprogrammes. With its Active Wheel portfolio, the brandfocused specifically on gaining market shares in Uttar-Pradesh and Madhya-Pradesh. Backed by significantactivation efforts in over 30,000 villages and with focus on“geographic specific strategy” Wheel gained 0.5% sharein the current year.
The Surf Excel Quick Wash test launch in TN and AP in2004 with low foaming properties that enables consumersto wash clothes effectively with substantial reduction inwater usage, was nationally extended in 2005 summer. Thiswas supported with a new advertisement campaign andactivation programmes. During the year, Surf Excel Bluewas strengthened with “Removes stains, not colours”campaign. This was well received by the consumer andthe brand recorded healthy growth. The Surf Franchise alsoreinforced its emotional connect with consumers with thelaunch of new “Daag aache hain” (dirt is good!) campaign.
All these activities in fabric wash paid back well and thecategory reported a gain in market share of 0.3%.
In the Dish Wash category, Vim continued to grow on theback of the consumer relevant ‘polycoat’ innovation, which

2005
HINDUSTAN LEVER LIMITED
11
was launched across the country in October 2005. Thissignificant innovation has received wider acceptance withthis brand recording a double digit growth in the currentyear and enabled the brand to be a strong market leaderdespite competition from regional players.
2005 has been a good year for the toilet soap category.After a consistent decline in the last 2 years the categoryachieved a value growth of 6.6%. However the categorycontinued to witness intense competition from local andregional players. To meet the competition, investment inthis category was significantly stepped up with Advertisingspends increasing by over 32%. This strategy to ploughback money into advertising to build brands, has helpedkick-start growth in the category. Vegetable Oil pricesremained largely stable during the year though prices startedfirming up towards the end of the year.
During the year the No.1 Soap brand Lifebuoy continuedits growth momentum for the third consecutive year. Thebrand successfully leveraged the relaunch of 2004 throughexcellent activation in 2005 by “Health and Hygiene” inurban markets and “Swasth – Chetna” (Health Awareness)programme focused on rural markets. It also launched ‘savethe children campaign’.
During the year Lux was relaunched with a new shape usingsuperior technology. A novel sensory look was introducedwith coloured “Bits” for the first time in the toilet soapcategory, to enhance the appeal and functionality of theproduct. In 2005 the Lux brand celebrated its 75th year ofexistence in India and this occasion was used to launchvarious activation programmes aimed at strengthening thebrand's leadership and consumer intimacy.
This year also marked the turnaround of Hamam andRexona, which was relaunched at the beginning of the year.Both the brands have grown well. Dove, a highly successfulinternational brand, almost doubled its volumes for thesecond year in succession. This was achieved by offering aconsumer attractive value proposition, focused distributionand trial generation programmes.
Breeze and Liril however, declined during the year andactions are in place to restore the growth in these brands.
6.1.2 Personal Products
In the Personal Products segment, sales grew by 19.4%and the segmental profit by 4.7% over 2004.
In the highly competitive category of Hair wash yourCompany achieved a strong growth of 32%. YourCompany has three main brands, viz., Clinic Plus, ClinicAll Clear and Sunsilk and all the brands grew in doubledigits. This growth was achieved by several innovations
and launches. Sunsilk silky strength was relaunched asSunsilk Thick & Strong with proposition of solving theproblem of breakage due to thinning hair. The new productSunsilk 9 to 9 after wash combing lotion was wellreceived by consumers.
In Clinic Plus growth was driven by the successful launchof an innovative shampoo plus oil through sachet pack.Clinic All Clear black variant was introduced with thebenefit of hair fall reduction and dandruff.
It was another good year for the skin care category with astrong all-round performance by Fair & Lovely, Pond’s andVaseline. Fair and Lovely was relaunched with an improvedformulation and packaging. Vaseline’s growth was aidedby successfully driving the usage of this brand in non wintermonths.
It has been a very good year for the talcum category. Aftera continuous decline for the past 4 years, talcum marketgrew this year and the growth was primarily driven byPonds. The thrust on driving penetration in rural marketsthrough Rs. 5 packs was very successful in expanding thiscategory. A new variant of Ponds viz. Ponds Oil Controlwas successfully launched and was well received byconsumers.
The toothpaste market which has been stagnating for morethan two years grew in low single digits in 2005. In a highlycompetitive year, Close Up performed handsomely, growingwell ahead of market with a very strong double digit valuegrowth and increased its market share in its key marketsof South India which contributes to almost half of thebrand's volumes. Pepsodent performed satisfactorily withan NPS value growth of 6%, albeit with flat market sharesfor the year.
Lakme continued on its consistent high growthperformance. During 2005 the Lakme Hair NeXT hairstyling range was a notable extension of the brand in thehair care segment. A premium skin care line speciallydesigned for oily skin, MATT EFFECT, received enthusiasticresponse both from trade and consumers. Lakme BeautySalon business now operates from 88 locations.
Axe’s deos were severely impacted in the past by thepresence of imported “grey” products in the market. YourCompany took a bold step of reducing prices by 25% tocounter the grey products. This has resulted in significantvolume uplift in the current year.
6.1.3 Customer Management
This was a year of transformation in customer managementwith strong focus on winning customers at PoP (Point ofPurchase).

HINDUSTAN LEVER LIMITED
200512
Your Company took several initiatives to delight itscustomers, both distribution and trade. A majorre-organization of sales structure was done with theobjective of achieving excellence in execution at the pointof purchase. Focused efforts are being taken to build salescapabilities by leveraging IT. Roll out of RSnet - the tool forelectronic connectivity - with the distributors has progressedwell and enhanced the speed and accuracy of sales andstock holding information from the distributors. Initiativessuch as continuous replenishment of stock enable bettermanagement of distributor’s investment.
The pro-active initiative of your Company in creatingdedicated channel teams for Modern Trade and Rural hasbeen successful.
6.1.4 Supply Chain
Year 2005 witnessed unprecedented increase in petroleumand petrochemical costs. This contributed to substantialinflationary pressure on raw material, packaging materialand distribution costs. Your Company’s sharp focus on costreduction programmes mitigated this cost pressures to aconsiderable extent. In this your Company continued tobenefit from Unilever’s global and regional strengths, whichled to significant buying cost advantages. Strategic allianceswith many international and local vendors led todevelopment of new technologies, new materials and jointcost reduction programmes, the benefits of which wereshared between your Company and the concerned vendors.
Towards the end of 2004 your Company commissionedtwo new factories at Uttranchal and Himachal at a totalinvestment of Rs. 220 crores to meet the growing demandand to derive supply chain benefits. Production in the newfactories has been successfully scaled up and benefits ofthese locations have been realized as per plans. Severalvendors have also set up supporting ancillary units in thesetwo locations, which has led to significant employmentgeneration, in line with the Government policy of enhancingemployment opportunities in such areas.
6.1.5 Kimberly Clark Lever Pvt. Ltd.
Kimberly Clark Lever Pvt. Ltd. (KCL), the joint venturebetween your Company and Kimberly Clark Corporation,USA, had yet another year of good performance. Turnovergrew by 26% to Rs. 107 crores while volumes grew by21%. This was the second successive year for the JV whereit achieved 25%+ growth. Cumulative losses have beencompletely wiped out and the JV is now poised to paydividends to its shareholders. The JV has also expanded itscapacity for manufacturing diapers, and has also tied upwith a contract manufacturer to manufacture Kotex sanitarynapkins. Huggies continued to be the market leader in
diapers and grew volumes by 31%. A new range of importeddiapers was rolled out as Huggies Ultra-Comfort and metwith good response. In the sanitary napkins category, Kotexfaced severe competition from market leaders but still grewvolumes by 15%. Towards the end of the year, a new rangeof Kotex was launched as Kotex Maxi and Kotex Ultra andreceived encouraging response.
6.2 Foods
The Foods division of your Company (comprising theBeverages, Processed Foods and Ice Creams businesses)recorded an excellent performance during 2005 with adouble digit top line growth and significant improvementin profitability. In its first full year of operations significantoperational efficiencies and cost synergies have beenrealized, thereby making the business fit to accelerate itsgrowth profitably.
The highlights of the individual product categories are givenbelow :
6.2.1 Tea
Our consistent strategy of building Brooke Bond and Liptonas mega brands to consolidate and strengthen yourCompany's leadership in the packet tea market has yieldedpositive results. Brooke Bond and Lipton grew handsomelyfor the third successive year. High impact consumeradvertising and strong activation have strengthened thebrands and significantly expanded its consumer base.During the year, Red Label Natural Care with 5 naturalingredients was launched to strengthen its ‘family care’position, to help the family stay healthy. To tap the hugeopportunity at the bottom of the pyramid, value packs atprice points of Rs. 10/- and Rs. 2/- were aggressively built,particularly in small towns and rural markets. The sustainedfocus on brand building, innovation and aggressivedistribution expansion has helped your Company to gainshare in the overall category and establish Brooke Bond asthe largest brand in the packet tea market.
Lipton continued its aggressive growth by focusing on youthand leveraging HLL’s strong presence in the Out of Homechannel. Lipton has also established its strong presence inthe Modern Trade channel. During the year, Lipton Ice Teawas launched in 14 cities using the Pepsi distributionsystem, under our strategic partnership with them.
The business continued to record sustained profitabilitythrough its focused brand portfolio and streamlined supplychain and cost management.
6.2.2 Coffee
The Coffee business had another excellent year, with stronggrowth both in Instant and Roast and Ground (R&G)

2005
HINDUSTAN LEVER LIMITED
13
categories. Our strategy to strengthen the brand equity ofBru through clutter breaking and highly visiblecommunication, coupled with world-class activation ledto significant share gains, making it the leader in the brandedcoffee market. During the year, exciting formats likeCappuccino were successfully launched to recruit newconsumers and strengthen the Bru’s channel leadershipparticularly in the Modern Trade channel. The satchetsformat continued to aggressively drive category expansion,while contributing significantly to the brand’s growth.
6.2.3 Processed Foods
Processed Foods business delivered a strong performanceduring 2005. As reported last year, a series of steps wereundertaken to streamline the supply chain, includingreduction of pipeline stocks, heightened focus on productfreshness and significantly improved customer service.These have all been successfully implemented. During theyear, Knorr and Annapurna brands were relaunched withimproved mixes. The response in the market place has beenvery encouraging as indicated by the growth numbers. Theprofitability of the business has also improved considerably.Annapurna Atta and Salt were relaunched with significantlyimproved product and contemporary packaging. This,coupled with focused investment in advertising and channelactivation has helped the brand to regain its growthmomentum.
Kissan brand has been comprehensively relaunched witha distinct identity in early 2006. A strong marketing mixincluding aggressive media, high visibility and activationhave been planned to strengthen Kissan’s strong equityamong consumers as the family nutrition brand.
6.2.4 Ice Creams
2005 was a good year for the Ice Cream business with adouble digit top line growth and positive bottom line forthe first time in its history. The business continued its strategyof driving growth by focusing on availability, affordabilityand excitability. Availability was improved by an order ofmagnitude in all channels, viz., the traditional channel,mobile vending channel and parlours. The businesslaunched Cornetto Chocobloc and Bikimax, two newexciting products, to add to its exciting product range. Ahighly noticed media and outdoor communication,supported by a powerful activation platform have helpedin establishing Kwality Walls visible presence across thecountry. Extensive cost re-engineering programmes,particularly in manufacturing, have been implemented toimprove the cost structure of the business includingpurchase of sourcing rights for North Indian markets. Thebusiness is well poised to sustain its good performance of2005 in future.
6.2.5 Modern Food Industries (India) Limited (MFIL)
Modern Food Industries (India) Limited (MFIL) reported anoperating profit in the Bread business (before depreciation,interest and restructuring/exceptional items and excludingprofit on sale of assets of Rs. 221 L in 2005, against a lossof Rs. 74 L in the previous financial year. This is in linewith HLL's strategy to turn around the Company.
Among the key actions during the year 2005 was theclosure of the loss making units in Chandigarh,Ahmedabad and Indore in MQ. Further, the Delhi breadunit, which was the single largest loss-making unit ofModern, was also fully closed in Nov. 2005. Therestructuring was done through peaceful separation of theworkers under appropriate VRS schemes. Post the closureof own manufacturing in these geographies, the breadoperations were handed over to newly appointedfranchisees under a Licence agreement.
Own bread sales in continuing units grew by 6.8% in2005. The Bread business continued to focus on loss-reduction coupled with profitable growth and marginimprovement, in continuing units. On a comparable basis,2005 showed an improvement in Bread gross margin overthe previous year, by 270 basis points. Marginimprovement was aided by closure of the loss makingunits, cost efficiency measures in continuing units -especially in the area of energy saving, reduction in unitoverheads, improvement in manufacturing efficiencies andsupply chain initiatives in wheat procurement, maidacontracting in season and yeast sourcing.
Up-gradation of Quality and Consumer Safety standards,being one of HLL's key priorities, was progressed as perplan in 2005, and Kolkatta and Bangalore bread units wereput up for audits by specialist Unilever quality audit teams;Mumbai and Chennai units had been cleared by audit studyteams in 2004. Quality audits for the remaining 2 units atCochin and Hyderabad are scheduled for 2006.
6.3 Speciality Exports
The Speciality exports business achieved an NPS of Rs. 594crores for the year 2005. The value added portfolio currentlybeing focused grew by 21%. The business incurred asegment loss of 11%.
6.3.1 Castor
Castor business registered a growth of 2% over 2004. TheDerivatives segment, which is the next step in value chain,registered a significant growth of 23% over 2004 in sales.In this segment, Company started to service the customersin the Middle East. The product list was expanded with theaddition of superior grade of HSA/HCO powder.

HINDUSTAN LEVER LIMITED
200514
6.3.2 Marine
Tsunami at the end of the previous year severely affectedthe entire supply chain infrastructure on the east coastthereby reducing fish availability. This along with the antidumping duty in the US on Shrimp exports and thedeclining US dollar impacted the Indian shrimps industryduring 2005.
To address the issues faced by the Marine industry in Indiafor over 2 years now, HLL developed and launched severalvalue added products like Breaded Shrimps, Marinatedshrimps and squids and Seafood mixes in US and EU marketsin 2005. This segment offers better potential and is likely tobe the growth driver in future. The value added products,along with Surimi and Crabsticks business registered a growthof over 50% over 2004.
Several new customers in markets such as Romania andSwitzerland in EU, Russia, Taiwan, Uruguay and Mexicowere developed for the shrimps business, while Italy wasadded in Crabsticks business.
The business was awarded the highest overall exporter ofseafood from India, highest value added seafood exporter’saward as well as an award for special efforts for newproducts and new markets by MPEDA for the year2004-05. This is the 5th consecutive year that HLL has wonthe awards for overall exports and value added products.Besides, the seafood factories at Chorwad and Aroorreceived higher level of British Retailers Consortium ratingand top rating by internal UQCSRM (Unilever quality andconsumer safety norms).
6.3.3 Rice
The Rice brands grew by 11% led by a significant 93%growth in Rozana brand in the popular segment. Thebranded business currently constitutes over 55% of the totalRice Exports business. Strong brand growth has helped thebusiness to put into action its new strategy of focusing onBrands in specific geographies. Strong growth in Rozana,leading position of some of the brands in Kuwait and Omanand Gold Seal Indus Valley Rice activation in North Americawith the new marketing mix have been some of the majorachievements in 2005.
6.3.4 Leather
Ponds Exports Ltd.
Leather Business under Ponds Exports Ltd. (a 100%subsidiary of your Company) maintained its markets inFootwear and Upper business segments.
Europe, our major market was sluggish and the marketgrowth has been slow in Germany. Retailers in Europe aredropping prices to improve sales with China continuing to
dominate the scene. However, HLL maintained its customerlist with Hush Puppies and Gabor as key customers andstrengthened it further with increased business from newcustomers like Primigi and GBB in France and Kiaya inPortugal. An old customer for shoes business, Josef Siebelreturned to India and to HLL.
6.4 New Ventures
6.4.1 Water
Your Company has developed Pureit, the most advancedwater purifier in the world, because it is the only in homewater purifier that gives as safe as boiled water withoutboiling and without needing electricity or continuous tapwater supply. Pureit removes all harmful viruses, bacteria,parasites and pesticides and therefore provides completeprotection from all waterborne diseases like jaundice,diarrhea, typhoid and cholera.
Pureit has been test launched in a few cities of Tamil Naduin 2005 and the response has been encouraging. This hasbeen launched at a price affordable to the common manand the cost of water from Pureit is even cheaper than costof boiling. A unique business model has been establishedfor customer acquisition and sale & distribution of theproduct. This involves consumers going through anexperiential brand interaction in specially created PureitSafe Water Zones, and in consumer homes.
The business is currently building its capability with respectto manufacturing, supply chain, and information technologyas a precursor to a wider geographic rollout.
6.4.2 Hindustan Lever Network
Hindustan Lever Network is a multi-category businessopportunity started in 2003, in the area of networkmarketing. Network marketing has now become a 100 Bln$ business globally, with higher growths in Asian marketsin recent past.
Your Company has given apportunities of self-employmentto 74,000 new members and the base of self-employedentrepreneures in the network business has crossed over4,00,000. A vibrant training organization with a capacityto train 35,000 persons per month is in place providingcustomized training to our members across the country.Hindustan Lever Network is now present in over 220locations across the country servicing over 1400 towns.
Based on superior consumer understanding and Unilever’sworld-class technology, 12 new products were launchedduring the year. This included expanding the Foods range,health range, and personal care range .The rapid pace ofinnovation has ensured maintenance of market shares in2005 in the home and personal care segment in networkmarketing.
2005
HINDUSTAN LEVER LIMITED
15
During 2006, Hindustan Lever Network would further buildthe channel capability. In addition, capabilities in Training,Information Technology, Supply Chain would be furtherupgraded to achieve sustainable competitive advantage.
6.4.3 Project Shakti
70% of Indian population lives in 6,27,000 villages andthese markets with their large population present asignificant opportunity for your Company. Over two thirdsof these villages are not easily accessible due to poorinfrastructure and lack of business viability. ‘Shakti’ is ourunique, win-win programme addressing this opportunity.‘Shakti’ operates through 3 initiatives.
Shakti Ammas provide micro-enterprise opportunities forwomen from Self-help-groups (SHG’s) making themindependent women entrepreneurs as direct-to-homedistributors of your Company. This network of entrepreneurshas doubled your Company's direct rural reach, with18,222 Shakti entrepreneurs covering 71,977 villages intwelve states at the end of 2005. Moreover, Shaktientrepreneurs visit and sell to over two million rural homesevery month, creating a unique, sustained rural direct-to-home channel. Your Company aims to reach 600 millionconsumers in 5,00,000 villages through 1,00,000entrepreneurs by 2010.
Shakti Vani is a communication initiative that seeks toimprove the standard of living in the rural community.Village women are trained as ‘Vanis’ and disseminateinformation on basic hygiene practices, adoption of whichwill dramatically improve the health & hygiene standardsin the villages. Shakti Vani coverage has doubled to 20,000villages across four states in 2005. Shakti Vanis throughcommunication creates awareness for health and hygieneand this helps in developing growth opportunities for suchproducts in the rural India.
IShakti is a rural community portal that provides relevantand valuable information for the rural populace. Informationis available on areas such as agriculture, health and hygiene,education, veterinary, legal, employment, etc. thus filling theinformation gap that exists in the villages and unlocking ruralproductivity and prosperity. The site is completely in locallanguage with text to voice facility enabling even the illiterateto get benefit of information. IShakti is currently available inover 1,000 Kiosks. IShakti makes available information useful/relevant to rural consumers. IShakti also gives platforms foradvertising the products and creating awareness on thebenefits of its use, apart from generating revenue throughselling spaces on the portal to other companies.
‘Shakti’ provides significant benefits for all its participants.For the SHG women, it provides a stable, sustainable source
of income. For villagers, this channel has become a sourceof genuine and correctly priced products. Access to basichealth and hygiene information through Shakti Vani andother relevant information through IShakti is improvingliving standards and unlocking rural prosperity in thevillages. For your Company this initiative providesdiscontinuous increase in rural distribution doubling ourrural coverage.
6.4.4 Consumer Health Care
The Ayush range of Ayurvedic products offer health andbeauty benefits by combining ancient Ayurvedic knowledgewith clinical efficacy of modern science. These uniqueformulations have cleared rigorous test protocols and arebacked by endorsement from the reputed Arya VaidyaPharmacy, Coimbatore. In addition to gaining deepknowledge of Ayurveda, the business has built a strongtechnological foundation for Ayurvedic productdevelopment and safety clearance protocols along withsourcing and testing of herbs. This would be leveraged todevelop Ayush range of products for future.
The business is being developed strongly on two legs - directselling and health and wellness services through a franchiseoperation. Ayush is the first Ayurvedic brand to get intoTherapy Centers. Ayush Therapy Centers show promisingsigns of an independent business opportunity. The revenuefrom centres have more than doubled in 2005. Currently,Ayush Therapy Centers are present across 7 cities ofChennai, Bangalore, Mumbai, Hyderabad, Goa, Pune andDelhi. During 2006, it is planned to double the reachthrough additional centers .
Ayush Spa range which was extended in direct sellingchannel through HL Network in 2004, has receivedexcellent response registering 50% + growth. During theYear, 3 new products were launched under Ayush brand,expanding the health care range.
6.4.5 Sangam Direct
Unilever India Exports Limited (Previously knownas Indexport Limited)
Sangam Direct, the direct to consumer e-tailing initiative,services orders placed by customers on phone or e-mail within24 hours. During the year, Sangam was extended to southMumbai and with this, it now services the whole of Mumbai.Revenues from Sangam have grown by 60% in 2005.
Sangam offers a unique convenience benefit to customerswhich is increasingly relevant in urban areas. Over 1,40,000families have already tried out the convenience offered bySangam. The Company will take a view on this businessmodel bearing in mind relevant considerations such aschannel conflict, scalability and viability of the business tocontribute to the growth of your Company.

HINDUSTAN LEVER LIMITED
200516
7. RESEARCH & DEVELOPMENT AND TECHNOLOGY
Robust technology initiatives are in place to deliversustainably enhanced consumer value through HLL’sbrands. The R&D programmes are aligned to deliver“vitality” to consumers through the entire spectrum of HLL’sproducts. Some of the initiatives have already succeededand several more are in the pipeline.
Contamination in drinking water is a major source ofdiseases in India and many parts of the world. Providingcost-effective and convenient solutions to consumers topurify water in-home is the objective of one of our R&Dprogrammes. This work had resulted in the developmentof a new hybrid technology, which provides consumersfreedom to purify water, irrespective of the source and alsowhether or not they have running tap or electricity. Thisproduct was successfully test marketed in Chennai and otherparts of Tamilnadu. R&D continues to produce newinventions and refinements to enhance the value of thisproduct. Plans are in place to roll this out to other parts ofthe country.
Robust research programmes are in place to derivemaximum consumer value from the rich source oftraditional Ayurvedic knowledge. A framework to assurethe safety of herbal/natural products was developed andthis framework is expected to be the foundation forclearance of herbal products for use anywhere in the world.A series of research programmes have been initiated to offerthe benefits of specific performances of Ayurvedic herbsand formulations through home and personal care, as wellas food products. One of the early examples of the successof this programme is the launch of Brook Bond Nature Caretea. Primary focus in the R&D programmes in the area oftea is to enhance the health benefits of tea. There is also asignificant research programme to offer enhanced nutritionto Kids as well as adults. Several R&D advances are in theinnovation pipeline of foods and HPC. These also includescientific rationalization of Ayurvedic therapy.
Rollout of improved dish-wash bar was extended to manyother parts of India. The polymer coated dish wash barprovides distinctly superior in-use economy toconsumers.
Technology to reduce occurrence of acne was developedand incorporated in a specific variant of Lifebuoy that waslaunched in 2005. A mild soap bar that is especially suitablefor kids was developed. Skin lightening is a key focus areain R&D, seeking herbal and other actives for skin creamswith better control of skin colour.
Role of technology in providing superior consumer valueis well engrained in HLL’s business strategy and your
Company’s R&D is pursuing it with increasing intensity,facilitated by several new initiatives to advance theresearching process. These include Science Monday PM,Guiding Measurements, Cross-functional Scoping ofResearch Projects, and Partnering with Complementors.These processes are serving to provide new directions forareas, such as Laundry, that would be otherwise deemed“mature.”
8. ENVIRONMENT, SAFETY AND ENERGYCONSERVATION
Your Company’s focus and attention continued throughoutthe year on the important key result area of OccupationalSafety and Environment Management. The only acceptablestandard of Safety performance for your Company envisions"zero accidents". The Accident Frequency Rate, already oneof the lowest amongst Unilever Companies worldwide,continued its reducing trend during the year.
The safety journey of your Company with an intensive focuson behavioural aspects of safety, along with continualimprovements in engineering controls and safetymanagement systems, made good progress. The behaviouralsafety training has now covered more than 2500 managersand officers. Clear signs of increased positive safetybehaviour are becoming evident through one-to-one safetycontacts being made by management staff with ouremployees. This is also serving to reinforce theimplementation of Unilever's Framework of Standardsaligned to international standards of ISO 14001 / OHSAS18001 which has significantly progressed as measuredthrough independent periodic audits. During the year,Rajpura factory was certified to ISO 14001 and OHSAS18001standards.
Your Company received the “Good Corporate Citizen”award from Bombay Chamber of Commerce and Industry.Tatapuram and Tindivanam factories received awards forexemplary safety performance from National Safety Council(Kerala Chapter) and the Government of Tamil Nadurespectively.
Your Company's ongoing programmes for continuousreduction of the environmental impact of operations havefurther reduced the environmental load of key parameters.These continue to remain well below the statutoryrequirements, with annual reduction targets for individualmanufacturing sites monitored on a monthly basis. YourCompany has recorded further reduction in specific energyand water consumptions of 10% and 13% over 2004,through productivity improvements, use of alternativesources of energy and recycling / reuse of energy / waterwhere feasible. Further your Company’s new detergentformulation, currently in the market, is helping to

2005
HINDUSTAN LEVER LIMITED
17
significantly reduce consumption of fresh water - a nationalresource in short supply in many parts of the country - byrequiring less water for washing at the consumer's end. Toconserve ground water, your Company has progressedrainwater harvesting projects at the manufacturing sites.Other ongoing sustainability projects such as greening ofbarren land in and around factories, vermi-composting ofwastes into value added fertilizer supplement for cultivationand sustainable agricultural practices in tea plantations havealso progressed well.
9. PERSONNEL
The HR agenda 2005 focussed on delivering distinctivepeople and organizational capabilities, embedding a cultureof seamless team working and enhancing productivity inour manufacturing units through the process of bilateralnegotiations.
To enhance our leadership capabilities, a number ofmanagers in leadership positions were provided withcoaching inputs to imbibe and practice an inclusive styleof leadership. The importance of flawless execution hasbeen driven by the leadership team and initiatives in thisarea have improved the level of strategic clarity and levelof alignment to the vision and annual goals of the business.This has helped build our execution capability. Throughcontinuous communication and engagement, spirit ofco-creation and team bonding events, a culture of vitalityhas been embedded. The culture of working in crossfunctional teams to achieve the priority business goals wasdriven with a lot of passion and commitment. Team buildinginterventions have been carried out for all teams withpositive feedback at evaluation stage and visible shifts inthe quality of team effectiveness.
During 2005, TPM gains were further consolidated and5 sites achieved TPM Consistency Award and 5 sitesachieved TPM Excellence award and with this, 25 sites inHLL have been accredited by JIPM till date. TPM is alsobeing extended in supply chain and modest beginning hasbeen made in our depots at Mumbai branch in 2005.
The Employee Relations in your Company continued tobe positive. During the course of the year, productivitylinked LTS were signed in 6 of our units through a processof bilateral negotiations with the employeerepresentatives.
Your Company has introduced organizational changes inline with the global One Unilever operating frameworkto sharply focus on the ‘Go-to-market’ and Brand Buildingcapabilities. The consequent movement of people and thetransition arrangements have been managed in a smoothand seamless manner ensuring the retention andmotivation of our talent pool.
The Company is alive to its responsibility towards the societyin the area of creating opportunities for Schedule Castes,
Schedule Tribes and Other Backward Communities. TheCompany has taken conscious efforts in giving employmentopportunities within the organization to such classes of oursociety. From the internal audits carried out by the Company,it is evident that 12% of the employees belong to SCs and7% belong to STs. You may be gratified to note that theCompany created upto 55% employment opportunities inthe reserved category, including employment of 36% OBC,without compromising on our principles of meritocracy.
Your Company believes taking affirmative action of trainingmembers of this community so as to enable them to competewith general catergories in seizing opportunities foremployment and entrepreneurship. Society at large willbenefit from such initiatives without impacting cost, qualityor competitiveness of the business.
10. MERGERS/ACQUISITIONS AND DISPOSALS
10.1 Merger of Five subsidiary companies
The Company had several subsidiary companies, whichhad over a period of time come into company’s fold,consequent to the amalgamation of TOMCO, Brooke BondLipton India Limited and Pond’s India Limited. YourCompany had undertaken an exercise to evaluate thecommercial rationale for maintaining each of thesesubsidiaries and it was considered that a consolidation ofthe activities of these subsidiaries would not only simplifythe accounting processes but will also add significant valueto the business by elimination of complexity.Accordingly the Company had sought the approval of theshareholders and the High Court, pursuant to which thefollowing five subsidiaries of the Company mergedwith your Company as of December 30, 2005 with effectfrom the respective Appointed Dates stipulated in theMerger Scheme approved by the High Court ofMumbai.• Lever India Exports Limited• Lipton India Exports Limited• Merryweather Food Products Limited• TOC Disinfectants Limited• International Fisheries Limited
10.2 Merger of Vasishti Detergents Limited withHindustan Lever Limited
Vasishti Detergents Limited (VDL) came into the fold ofyour Company as a result of amalgamation of the Tata OilMills Company Limited (TOMCO). Your Compnay held32.9% shareholding in VDL. VDL was merged with yourCompany on February 28, 2006 pursuant to a Scheme ofArrangement sanctioned by the Hon’ble High Court ofBombay with retrospective effect from July 1, 2005, theAppointed Date. VDL had manufacturing facilities formanufacture of toilet soaps and detergents at Chiplun inMaharashtra and had been engaged in producing goods
HINDUSTAN LEVER LIMITED
200518
for your Company. While the 32.9% shareholding held byyour Company have been cancelled, the remainingshareholders of VDL have been allotted one fully paid equityshare of Re. 1/- each of your Company for every ten equityshares of Rs. 10/- each held by them in the capital of VDL.The Company had fixed March 31, 2006 as the recorddate by reference to which the shares of HLL have beenallotted to the shareholders of VDL. Shareholders of VDLwho have become shareholders of your Company, wouldalso be entitled to receive the interim dividend of Rs. 2.50per share of HLL, which was declared on July 30, 2005.
10.3 Transfer of the Sewri undertaking to Bon Limited
Pursuant to approval of shareholders, the soap and soapintermediate manufacturing facilities at Sewri in Mumbaiwere transferred to Bon Limited on 17th July, 2005 as agoing concern at the net book value of assets plus actualworking capital employed as on that date. The transferentailed inter-alia transfer of all willing employees to therolls of Bon Limited, with continuity of service and fullprotection of their existing terms and conditions of service.For this transfer your Company invested Rs. 10.00 crores ofadditional capital/funds, which enabled Bon Limited toacquire assets worth Rs. 8.33 crores, from the Company aspart of the slump sale, balance being retained in cash. YourCompany has offered fixed commitments both in terms ofreturns as well as orders to Bon Limited apart from anundertaking to pay a minimum guarantee of Rs. 11.50crores per annum for three years in case of shortfall in ordersplaced on Bon Limited.
The Company has thus facilitated Bon Limited to achievea simple organization structure with lesser overheads. TheCompany also has an opportunity to explore relocation ofits activities and/or commence additional business throughother satellite manufacturing units. It is expected that therisks and rewards of the performance of the undertakingwould be fully shared by all the stakeholders viz. theConsumers, Shareholders and the Employees / Workmen.It will enable a fair comparison of the unit as a sourcinglocation for personal wash products / toilet soaps with otheravailable alternatives on the basis of conversion costs. Itwill further bring a sharper focus on the need to reducecosts while encouraging enhancement of productivity toovercome the inherent disadvantages.
However, there have been challenges in making theactivities of Bon Limited competitive in cost, viable andprofitable due to non-cooperation and rigid attitude of theworkers. Bon was expecting that with a lean managementand their desire to revive the Company, workers’ supportwould be forthcoming but due to confrontations on thepart of the workmen, Bon witnessed an erosion in its networth during the year and had to be reported to BIFR as apotentially sick Company with erosion of 50% of its peaknet worth.
The current outlook for the business appears to be dismaland unless the current trends are reversed with activecooperation and collaboration of workforce the Companywill soon become a sick company with full erosion of itsnetworth.
10.4 Disposal of the Functionalised biopolymersbusiness
In December 2004, your Company had obtained approvalof its shareholders through postal ballot for divestment ofits functionalised biopolymer business in line withCompany’s focused business strategy and consequent exitfrom its non-core businesses.
The said business comprised manufacture and marketingof tapioca and corn based specialty modified starchesmainly for the paper industry. The business pioneered theconcept of wet-end starch use in paper making in Indiaand enjoyed a dominant market share in the high-end paperstarch segment.
This business was transferred to Riddhi Siddhi Gluco BiolsLimited (RSGBL), India’s largest integrated corn-wet-millerwith a turnover of Rs. 200 crores on a slump sale / goingconcern including the manufacturing facility at Pondicherrytogether with employees directly relevant to the businesswith continuity of service and full protection to existingterms and conditions of service.
10.5 Scheme of Arrangement for Demerger of thePlantations business of the Company in the Stateof Assam and Tamilnadu to Doom Dooma TeaCompany Limited and Tea Estates India Limitedrespectively
Your Company had undertaken Demerger of its operationsin the area of growing of tea and its processing to CTC ororthodox teas and its sale as garden teas in the State ofAssam and Tamil Nadu, on a going concern basis, intotwo independent and separate Companies, being 100%subsidiaries of the Company, known as Doom Dooma TeaCompany Limited and Tea Estates India Limited,respectively as the Resultant Companies consequent tosuch Demerger.
Following the approval of the shareholders, the Hon’bleHigh Court at Bombay has passed an order datedNovember 23, 2005 approving the Scheme ofArrangement for Demerger and transfer of Tea Divisionsof Assam and Tamil Nadu of your Company to DoomDooma Tea Company Limited and Tea Estates India Limitedrespectively, with effect from April 1, 2005, the appointeddate of the scheme.
10.5.1.Transfer of Doom Dooma Tea Company Limited(DDTCL)
Pursuant to transfer of business as above, in the first quarterof 2006, your Company’s 100% shareholding in Doom

2005
HINDUSTAN LEVER LIMITED
19
Dooma Tea Company Limited was transferred to McLeodRussel India Limited (MRIL), a lead industry player in teaplantations. DDTCL owned seven tea estates spread overapproximately 3,100 hectares and 3 factories for processingof teas in Assam, the average output from which has beenapproximately 6,000 metric tons.
10.5.2. Transfer of Tea Estates India Limited
The Company also transferred in the first quarter of 2006,its entire shareholding in its 100% subsidiary Tea EstatesIndia Limited (TEIL) to Maxwell Golden Tea Private Limited(MGT), a Woodbriar Group company on March 1, 2006.TEIL owns 8 tea estates and 6 factories for processing tea inTamilnadu with an average annual output of approx. 10,500metric tons.
The Company has thus completed its exit from its teaplantations business both in Assam and Tamil Nadu.
10.6 Sale of NIHAR Brand and related intellectualproperty rights to Marico Limited
As a part of Company’s portfolio rationalization strategy, inthe first quarter of 2006, the Company disposed off its“Nihar” trade mark along with related intellectual propertyrights to Marico Limited both for the domestic and a numberof overseas markets for an aggregate consideration ofRs. 216 crores.
Nihar had a current annualized turnover of about Rs. 120crores spread over two segments-filtered coconut oils (ediblegrade) and perfumed hair oils. Your Company will continueto operate in the perfumed and value added hair oil segmentbut has agreed not to compete in the edible coconut oilsegment.
11. EMPLOYEE STOCK OPTION PLAN (ESOP)
Details of the shares issued under ESOP, as also thedisclosures in compliance with clause 12 of the Securitiesand Exchange Board of India (Employee Stock OptionScheme and Employee Stock Purchase Scheme) Guidelines,1999 are set out in the Annexure to this Report.
None of the management employees or wholetime directorshave received options exceeding 5% of the value of theoptions issued for the year ending December 2005.
Likewise, no employee has been issued share options,during the year equal to or exceeding 1% of the issuedcapital (excluding outstanding warrants and conversions)of the Company at the time of grant.
Adoption of the Global Share Performance Scheme in placeof ESOP
On a review of the operating experience of Stock Optionsacting as a measure to reward and motivate employees asalso to attract the talent and retain the key employees andbearing in mind the changes in the global trends onmanagement rewards, it is proposed to change the reward
component in the Stock Option Scheme to a Stock GrantScheme. The Stock Grant Scheme would be triggered inline with the earlier scheme by Unilever’s globalperformance. The Stock Grants would be made in the ratioof 48:52 for HLL and Unilever Plc/NV, as was the practicein the past. The cost of grant of Unilever Plc/NV shares asalso HLL shares would be absorbed by HLL and treated asremuneration of the employees.
Accordingly, it is proposed to formulate a new Scheme forgrant of “Performance Shares” which is the most commonlyused form of long-term incentive other than stock optionsto replace the “2001 HLL Stock Option Plan” to give effectto the Grants to be made in 2006. In the new Plan, grantswill be made of conditional rights to receive shares in HLLat nil cost, at the end of 3-year performance period. Theperformance measures for vesting will be Unilever'sunderlying sales growth and free cash flow.
The performance shares will be issued within the existingapproved limit of 1,50,00,000 equity shares of Re. 1/- each,part of which remain unutilised after grant of options tilldate.
Necessary proposals for approval of the Share PerformanceScheme are being placed before the members at the AnnualGeneral Meeting for adoption by way of Special Resolution.
12. CORPORATE SOCIAL RESPONSIBILITIES
It was a year of initiating a journey for qualitative up-gradation of Corporate Responsibility (CR) at HLL. To beginwith, attempts were made to align CR with the vision atHLL, which is “To earn the love and respect of India, bymaking a real difference to every Indian”. The vision hasthe power to posit CR as a way of conducting businessmuch before it becomes a profit distribution function, as inthis way, real difference could be better achieved. At astrategic level, it also means revisiting the rational for CR atHLL in order to factor in impacts on stakeholders affecteddue to our operations as also the forces unleashed byglobalisation. This way, the Company could enhance itscontribution to national development, an imperative forimproved sustainability and growth of business. At theoperational level, it places a need to perceive CR as strategiclong-term business engagements intrinsic to businessprocesses, thereby infusing a two way accountability, onthe one hand ensuring business processes are responsiblewhile on the other making CR investments accountable tobusiness.
In order to make a better development impact as alsoachieve a sense of satisfaction by playing a role in societyplaces a demand on time of our employees as well. Around9% of our resources for community involvement thus camein the form of employee time. This time ranged from theirinvolvement in Ashadaan – an institution of Missionariesof Charity in Mumbai founded by Mother Teresa, supportedby us right from its inception to supporting children from

HINDUSTAN LEVER LIMITED
200520
the disaster affected Yashodadham village near Bhuj to finda good school for their education including screeningchildren in a pre interview process and supporting themthrough scholarships upon their selection in the schools.
As reported in last year’s Directors Report, your Companyhas handsomely contributed to the Tsunami relief work bydonating Company products carrying a retail value of approx.Rs. 8 crores for free distribution to affected families. TheCompany had planned to spend a further amount of approx.Rs. 3 crores inclusive of contributions made by employeesto restore means of livelihood to affected fishermen. However,Company received a request from State Government thatthere was a more pressing need for providing rehabilitationof Tsunami affected families by provision of housingparticularly in the city of Chennai. Your Companyaccordingly decided to gift a plot of land admeasuring approx.5.76 acres at Tondiarpet at Chennai forming part of its surplusreal estate for this purpose. It is also proposed to make aprovision for setting up of ration shop, community hall anda nursery school for public use on this plot using contributionupto Rs. 50 lakhs made by the Company employees for thispurpose. Your Company was also at the forefront of providingrelief to affected fellow citizens of Mumbai after the torrentialrains and floods in Mumbai and incurred a cost of over Rs. 1crore for this purpose.
13. INFORMATION TECHNOLOGY
Your Company has continued to leverage informationtechnology for business value and to create capabilities forthe future.
Significant progress has been made during the year tostrengthen use of technology for sales and field activities.In the course of the year, we had all our redistributionstockists move to a continuous replenishment system,leveraging the internet. This has enabled us to improvecustomer order fills and the operating efficiencies of ourstockists. We are now in the process of implementing astandard transaction system across all our stockists. We havealso leveraged IT to improve service to the emerging ModernTrade Channels. Process Improvements in Sales andCustomer service, enabled by innovative use of IT willcontinue to be a thrust area in the coming years.
We continue to leverage IT to realise greater value in SupplyChain. End-to-end supply chain planning and optimizationtools have helped to improve stock availability whilereducing supply chain costs. Information ManagementSystems and Dashboards help provide visibility across thesupply chain.
All key financial processes are carried out through fullyIT-enabled Shared Service Centres. This has helped usimprove service levels to stakeholders, while ensuringcontrols and improving productivity.
Your Company is in the midst of a significant initiative of
adopting SAP based transaction systems. This will help createa robust and responsive IT capability that will be a foundationfor initiatives in the future. As part of this programme, wewould have significantly re-engineered and simplified ourbusiness processes, fully leveraging the power of IT.
Your Company continued to invest in IT infrastructure tosupport business applications. We now have a core virtualprivate network using MPLS technology, supplemented byhigh bandwidth VSATs for the remote locations. We arealso enhancing computing server infrastructure, especiallyto power the SAP initiatives.
In all these initiatives Information Security and a reliabledisaster recovery management have been ensured. We carryout regular exercises to identify vulnerabilities and plugthem systemically.
Your Company views IT as a strategic tool to enhancebusiness value and enable new ways of doing business.
14. SHARED SERVICES
Unilever India Shared Services Limited (previously known asIndigo Lever Shared Services Limited) was engaged by yourCompany to provide financial shared services in the areas ofSales Commercial, Manufacturing Commercial apart fromother IT enabled shared services for its Corporate Offices.
In addition the shared services model is also being extendedto Unilever companies in Australia, New Zealand, Malaysia,Singapore and the United Kingdom. Operations for Australiaand New Zealand were expanded with the addition ofAccounts Receivable processes. Project work was also carriedout for a number of Unilever companies in the Asian region.It also provides services to Unilever Companies in relationto the Operational Control Assessment and for compliancewith the provisions of the Sarbanes Oxley Act 2002.
15. FINANCE AND ACCOUNTS
Your Company delivered a strong performance in cashgeneration during the year driven by the businessperformance, enhanced capability of the supply chain andefficient collection system. In the context of a significantincrease in interest rates, your Company managed theinvestments prudently by deployment of cash surplus in abalanced portfolio of safe and liquid debt marketinstruments; returns earned were higher than marketbenchmarks.
The total amount of fixed deposits taken by the Companyas of December 31, 2005 was Nil. Deposits amounting toRs. 11.13 lakhs were unclaimed by depositors as atDecember 31, 2005.
In terms of the provisions of Investor Education andProtection Fund (awareness and protection of investor) Rules2001, Rs. 1,79.20 lakhs of unpaid/unclaimed dividends(including TOMCO, Pond's and Bestfoods, pursuant to theirmerger), interest on debentures and deposits weretransferred during the year to the Investor Education andProtection Fund.

2005
HINDUSTAN LEVER LIMITED
21
RONW, ROCE and EPS for the last five years
For the year ended31 December, 2001 2002 2003 2004 2005
RONW 53.9% 48.4% 82.8% 57.2% 61.1%
ROCE 62.4% 59.4% 60.2% 45.9% 68.7%
EPS of Re.1 7.46 8.04 8.05 5.44 6.40
Economic Value Added (EVA)
Economic Value Added for the last five years is given below :Rs. Crores
Years EVA Average EVA as % ofcapital employed capital employed
2001 1080 2816 38.4
2002 1236 3396 36.4
2003 1429 3780 37.8
2004 887 3704 23.9
2005 1014 2560 39.6
The above EVA has been computed under very conservativeassumptions. A detailed note on EVA is given inpage 80.
Segment-wise results
Hindustan Lever has identified seven business segments inline with the Accounting Standard on Segment Reporting(AS-17). These are : (i) Soaps and Detergents, (ii) PersonalProducts, (iii) Beverages, (iv) Foods, including Culinary andBranded Staples, (v) Ice Creams, (vi) Exports, and (vii) Others,including Chemicals and Agri-Products. The Table below givesthe audited financial results of these segments.Segment revenue, results and capital employed
Rs. CroresFor the year ended31 December, 2005 2004Segment Revenue (Sales plusIncome from Services)Soaps and Detergents 49,61.71 44,70.74Personal Products 29,51.88 24,72.24Beverages 12,77.44 11,94.55Foods 3,13.72 2,85.07Ice Creams 98.14 88.94Exports 13,47.80 12,49.02Others 2,50.47 3,00.15
Total 112,01.16 100,60.71
Less : Inter-segment revenue (7.27) (25.42)Net Sales/Income fromOperations 111,93.89 100,35.29a) Net Sales 110,60.55 99,26.95b) Service income from
operations 1,33.34 1,08.34
Segment Results (PBIT)Soaps and Detergents 6,83.69 7,75.06
Rs. CroresFor the year ended31 December, 2005 2004Personal Products 8,45.21 8,07.50Beverages 2,42.40 2,38.71Foods (16.10) (81.76)Ice creams 5.08 (4.69)Exports 49.06 39.62Others (27.68) (32.87)
Total 17,81.65 17,41.57
Less : Interest expense (19.19) (1,29.98)
Add : Unallocable income netof other unallocable expenses (1,57.99) (1,06.27)Total Profit (PBT) 16,04.47 15,05.32Capital employed in segments(Segment assets less liabilities)
Soaps and Detergents (63.33) 2,76.86Personal Products 2,27.80 2,91.72Beverages (62.07) (21.18)Foods (1.63) 13.10Ice Creams (9.43) (0.38)Exports 4,29.95 4,48.56Others 5.50 63.43
Total 5,26.79 10,72.11Add : Unallocable corporateAssets less Liabilities 17,78.84 10,20.60
Total Capital Employed inHindustan Lever Ltd. 23,05.63 20,92.71
Note : For greater detail, please see the segmentaccounts given in the financial statementsaccompanying the audited Profit and LossAccount and Balance Sheet.
Risk and Internal Adequacy
Hindustan Lever has a low debt equity ratio and is wellplaced to take care of its borrowings. Your Company is alarge net foreign exchange earner and the transactions aresuitably covered. There are no materially significantexchange rate risks associated with the Company.
The Company’s internal control systems are more thanadequate, and are routinely tested and certified by ourstatutory as well as internal auditors. Moreover, theCompany continuously upgrades these systems in line withbest international practices.
For a FMCG company like Hindustan Lever, economicgrowth has a direct impact on its performance. Our outlookfor the economy in 2006 is optimistic, and we expect aGDP growth of about 7-8% subject however to the vagariesof Monsoon and / or other unanticipated developments.Our plans for business development, revenue generationand profit growth factors in this GDP growth apart fromcontinued competitive pressuress both from international,local and regional competitors.

HINDUSTAN LEVER LIMITED
200522
Cautionary Statement
Statements in this Report, particularly those which relate toManagement Discussion and Analysis, describing theCompany’s objectives, projections, estimates andexpectations may constitute “forward looking statements’’within the meaning of applicable laws and regulations.Actual results might differ materially from those eitherexpressed or implied.
16. DIVIDEND
The Board of Directors at the meeting held on February 14,2006, recommended a final dividend of Rs. 2.50 per shareof Re. 1/- each for the year 2005, subject to approval of theshareholders. Together with the interim dividend of Rs. 2.50per share, paid on August 24, 2005, the total dividend forthe year works out to Rs. 5/- per share ofRe. 1/- each, amounting to Rs. 1,100.62 crores. DistributionTax both on the interim and final dividend is being borneby the Company.
17. DEPOSITORY SYSTEM
As the members are aware, your Company’s shares aretradable compulsorily in electronic form and your Companyhas established connectivity with both the depositories, i.e.National Securities Depository Limited (NSDL) and CentralDepository Services (India) Limited (CDSL). In view of thenumerous advantages offered by the Depository system,members are requested to avail of the facility ofdematerialization of the Company’s shares on either of theDepositories as aforesaid.
18. DIRECTORS
Mr. Douglas Baillie, Group Vice President and Head ofUnilever AMET (Africa, Middle East and Turkey), wasappointed as the Managing Director (MD) and ChiefExecutive Officer (CEO) of the Company effective fromMarch 1, 2006. Mr. Baillie will also be the Group VicePresident responsible for Unilever’s business in South Asia,which includes Sri Lanka, Pakistan and Bangladesh.
Mr. Douglas Baillie was appointed as an Additional Directorwith effect from March 1, 2006 by the Board at the meetingheld on February 14, 2006 of the Companies and Article111 of the Articles of Association to hold office till theconclusion of the ensuing Annual General Meeting of theCompany. The requisite notice, together with necessarydeposit has been received from members pursuant to Section257 of the Companies Act, 1956 proposingMr. Baillie as a Director of the Company at the ensuing AGM.
Mr. Arun Adhikari, the Managing Director of the HPCDivision of the Company resigned from the Board of theCompany with effect from March 1, 2006 and will beassuming responsibility as the Chairman of UnileverJapan.
The Board places on record its appreciation for thedistinguished service rendered by Mr. Adhikari in hiscapacity as the Managing Director of the HPC division ofthe Company and wishes him success in his futureendeavours.
In accordance with the Articles of Association of yourCompany, all other Directors of your Company exceptMr. S. Ravindranath, who as Managing Directors has a five-year term effective May 1, 2004, will retire at the ensuingAnnual General Meeting and being eligible offer themselvesfor re-election.
19. AUDITORS
M/s. Lovelock & Lewes, statutory auditors of the Company,retire and offer themselves for re-appointment as thestatutory auditor of the Company pursuant to Section 224of the Companies Act, 1956.
20. APPRECIATION
Your Directors wish to place on record their appreciationto employees at all levels for their hard work, dedicationand commitment. The enthusiasm and unstinting efforts ofthe employees have enabled the Company to remain at theforefront of the industry despite increased competition fromseveral existing and new players.
21. TRADE RELATIONS
The Board desires to place on record its appreciation forthe support and co-operation that the Company receivedfrom suppliers / redistribution stockists, retailers and othersassociated with the Company as its trading partners. TheCompany has always looked upon them as partners in itsprogress and has happily shared with them rewards ofgrowth. It will be the Company’s endeavour to build andnurture strong links with trade based on mutuality, respectand co-operation with each other and consistent withconsumer interest.
On behalf of the Board
Mumbai, Harish ManwaniApril 28, 2006 Chairman

2005
HINDUSTAN LEVER LIMITED
23
ANNEXURE TO THE DIRECTORS’ REPORT, 2005Disclosure pursuant to the provisions of Securities and Exchange Board of India
(Employee Stock Option Scheme and Employee Stock Purchase Scheme) Guidelines, 1999
Stock Option 2001 Stock Option 2002 Stock Option 2003 Stock Option 2004 Stock Option 2005a) Options granted 24,75,100 equity shares 32,33,601 equity shares of 42,76,090 equity shares 16,30,450 equity shares 15,47,700 equity shares
of Re. 1/- each valued at Re. 1/- each valued at of Re. 1/- each valued at of Re. 1/- each valued at of Re. 1/- each valued atRs. 53.82 crores Rs. 68.02 crores Rs. 58.16 crores Rs. 20.95 crores Rs. 20.44 crores
b) The pricing formula Closing market price as Closing market price as on Closing market price as on Average of highs and lows Closing market price,on the date of option the date of option grant - the date of option grant - for two week period prior to the date ofgrant - 24.07.2001 23.04.2002 24.04.2003 proceed the date of option meeting of the Board of
grant – 30.06.2004 Directors in which theoptions were granted –26.05.2005
Rs. 217.45 Rs. 210.35 Rs. 136.00 Rs. 128.47 Rs. 132.05c) Options vested Options vested after three Options vested after three NA since options not NA since options not NA since options not
years from date of grant years from date of grant exercisable before the exercisable before the exercisable before the(24.07.2001) (23.04.2002) expiry of three years from expiry of three years from expiry of three years
the grant of option the grant of option from the grant of option(24.04.2003) (30.06.2004) (27.05.2005)
d) Options exercised (as at Nil Nil NA NA NADecember 31, 2005)
e) The total number of NA NA NA NA NAshares arising as aresult of exerciseof option
f) Options lapsed (as at 3,00,700 equity shares of 3,70,696 equity shares of 4,24,100 equity shares of 1,22,100 equity shares of 13,200 equity shares ofDecember 31, 2005) Re. 1/- each Re. 1/- each Re. 1/- each Re. 1/- each Re. 1/- each
g) Variation of terms of NA NA NA NA NAoptions :
h) Money realised by NA NA NA NA NAexercise of options
i) Total number of 21,74,400 equity shares 28,62,905 equity shares 38,51,990 equity shares 15,08,350 equity shares 15,34,500 equity sharesoptions in force (as at of Re. 1/- each of Re. 1/- each of Re. 1/- each of Re. 1/- each of Re. 1/- eachDecember 31, 2005)
j) Employee wisedetails of optionsgranted to :i) Senior managerial — — — — Details in Appendix
personnel;ii) any other employee NA NA NA NA NA
who receives a grantin any one year ofoption amountingto 5% or more ofoption grantedduring that year;
iii) Identified NA NA NA NA NAemployees whowere grantedoption during anyone year, equal toor exceeding 1%of the issued capital(excludingoutstandingwarrants andconversions) of theCompany at thetime of grant.
k) Diluted Earnings Per NA NA NA NA NAShare (EPS) pursuant toissue of shares onexercise of optioncalculated inaccordance withAccounting Standard(AS) 20 ‘EarningsPer Share’.
l) i) Method of The Company hascalculation of calculated the employeeemployee compensation cost usingcompensation cost the intrinsic value method
of accounting to accountfor Options issued underthe “2001 HLL StockOption Plan”. The stock-based compensation costas per the intrinsic valuemethod for the year2005 is Nil.

HINDUSTAN LEVER LIMITED
200524
Disclosure pursuant to the provisions of Securities and Exchange Board of India(Employee Stock Option Scheme and Employee Stock Purchase Scheme) Guidelines, 1999 (Contd...)
Stock Option 2001 Stock Option 2002 Stock Option 2003 Stock Option 2004 Stock Option 2005ii) Difference between Rs. 6.73 crores
the employeecompensation costso computed at(i) above and theemployeecompensation costthat shall have beenrecognized if it hadused the fair valueof the Options
iii) The impact of this The effect of adopting thedifference on profits fair value method on theand on EPS of the net income and earningsCompany per share is presented
below :Net Income Rs. in lakhsAs reported 14,08.11Add : IntrinsicvalueCompensationcost NilLess :Fair valueCompensation cost 6.73(Black Scholes model)AdjustedNet Income 14,01.38Earnings Per Share (Rs.)(Basic and Diluted)- As reported 6.40- As adjusted 6.37
m) Weighted average NA NA NA NA NAexercise price andweighted average fairvalue
n) Fair value of Optionsbased on BlackScholes methodology(details available oncompany website)AssumptionsRisk free rate 6.75% 7.25%Expected life of options 7 years 7 yearsExpected Volatility (based on 28.56% 30.04%daily market closing pricefrom 3 years -2003 to 2005)Expected Dividends Rs. 5.00 per share Rs. 5.00 per shareClosing market price of Rs. 127.30 Rs. 138.20share on date of optiongrant.
Notes : (i) The Scheme has been discontinued by the Company from 2006.(ii) The Pricing Formula adopted by the Company for 'Employees Stock Option Plan' for the years 2001 to 2005, was based on the "Market Price" as defined in SEBI
(Employees Stock Option Scheme and Employee Purchase Scheme) Guidelines 1999, and Maximum number of options to be issued per employee in a fiscalyear did not exceed 0.01% of the outstanding issued share capital, as expressed in Clause 11 of the '2001 HLL STOCK OPTION PLAN' in the line with Clause6.2(h) of SEBI (Employee Stock Option Scheme and Employee Stock Purchase Scheme) Guideline 1999.
APPENDIXList of Senior Management Employees to whom Stock Options were granted pursuant to the “2001 HLL Stock Option Plan”
Name of the Manager Stock Options Granted 2005
Dhaval Buch 8,800Sanjay Dube 11,000Anoop K. Mathur 17,600Nitin Paranjpe 11,000S. Ravindranath 17,600M.K. Sharma 17,600D. Sundaram 17,600Arun Adhikari 17,600

2005
HINDUSTAN LEVER LIMITED
25
0
500
1000
1500
2000
2500
2005200420032002200120001999199819971996
Rs. C
rore
s
0
500
1000
1500
2000
2500
3000
3500
2005200420032002200120001999199819971996
Rs. C
rore
s
0
50
100
150
200
250
2005200420032002200120001999199819971996
Rs.
10000
20000
30000
40000
50000
1996
Rs. C
rore
s
1997 1998 1999 2000 2001 2002 2003 2004 2005
10-YEAR RECORD
Rs. Lakhs 1996 1997 1998 1999 2000 2001 2002 2003 2004 2005
Profit & Loss AccountSales* 7120,06 8342,75 10215,24 10917,69 11392,14 11781,30 10951,61 11096,02 10888,38 11975,53Other Income 118,08 183,87 244,74 318,98 345,07 381,79 384,54 459,83 318,83 304,79Interest (57,00) (33,89) (29,28) (22,39) (13,15) (7,74) (9,18) (66,76) (129,98) (19,19)Profit Before Taxation @ 605,25 850,25 1130,44 1387,94 1665,09 1943,37 2197,12 2244,95 1505,32 1604,47Profit After Taxation @ 412,70 580,25 837,44 1069,94 1310,09 1540,95 1731,32 1804,34 1199,28 1354,51EPS of Re. 1 (adjusted for bonus) 2.08 2.81 3.67 4.86 5.95 7.46 8.04 8.05 5.44 6.40DPS of Re. 1 (adjusted for bonus) 1.25 1.70 2.20 2.90 3.50 5.00 5.16 5.50 5.00 5.00
Balance SheetFixed Assets 721,71 794,09 1053,77 1087,17 1203,47 1320,06 1322,34 1369,47 1517,56 1483,53Investments 328,77 531,57 697,51 1006,11 1769,74 1635,93 2364,74 2574,93 2229,56 2014,20Net Deferred Tax — — — — — 246,48 269,92 267,44 226,00 220,14Net Current Assets 378,67 122,42 226,06 187,25 (373,38) (75,04) (239,83) (368,81) (409,30) (1355,31)
1429,15 1448,08 1977,34 2280,53 2599,83 3127,43 3717,17 3843,03 3563,82 2362,56
Share Capital 199,17 199,17 219,57 220,06 220,06 220,12 220,12 220,12 220,12 220,12Reserves & Surplus 792,36 1062,33 1493,46 1883,20 2268,16 2823,57 3438,75 1918,60 1872,59 2085,50Share Premium Suspense Accounts 177,57 — — — — — — — — —Loan Funds 260,05 186,58 264,31 177,27 111,61 83,74 58,30 1704,30 1471,11 56,94
1429,15 1448,08 1977,34 2280,53 2599,83 3127,43 3717,17 3843,03 3563,82 2362,56
@ Before Exceptional Items* Sales before Excise Duty Charged
HLL Share Price
1996 1997 1998 1999 2000 2001 2002 2003 2004 2005
HLL Share Price on BSE (Rs. per Share of Re. 1) * 80.70 138.35 166.35 225.00 206.35 223.65 181.75 204.70 143.50 197.25
Market Capitalisation (Rs. Crores) 16,073 27,555 36,525 49,513 45,409 49,231 40,008 45,059 31,587 43,419
Exports (Rs. Crores)** 921 1,152 1,664 1,803 1,934 1,845 1,411 1,416 1,459 1,461
Contribution to Exchequer (Rs. Crores) 1,398 1,640 2,062 2,341 2,524 2,478 2,609 2,999 2,694 2,638
Economic Value Addition (EVA) (Rs. Crores) 272 365 548 694 858 1,080 1,236 1,429 887 1,014
* Based on year-end closing prices quoted in the Bombay Stock Exchange, adjusted for bonus shares.** Includes exports made by subsidiaries.
Market Capitalisation
Exports Contribution to Exchequer
as at year endon BSE
as at year endon BSE

HINDUSTAN LEVER LIMITED
200526
The principles of Corporate Governance and Code of Business Principles are the cornerstones of your Company. Your Companybelieves these principles distinguish a well managed company from a not so well managed company. These principles ensuretransparency, integrity and accountability which are vital for the long and sustained growth of your Company.
Your Company has been practising these principles long before these were made mandatory for listed Companies. YourCompany has a matching representation of five independent directors on your Company’s Board to complement andsupplement four full time directors and the non-executive Chairman of the Board and thereby providing optimum mix ofprofessionalism, knowledge and experience.
Your Company’s endeavour has always been to engage persons of eminence as independent directors who can contributeto corporate strategy, provide an external perspective and be a source of challenge and evaluation wherever appropriate.Your Company has the good fortune of having two independent directors, Mr. D.S. Parekh and Mr. S. Ramadorai whosecontribution to the nation have been recognized by the country with the coveted public honour of Padma Bhushan bestowedon them for their contributions to trade and industry.
BOARD OF DIRECTORS
(a) Composition of the Board
During the year, Mr. Harish Manwani, President - Asia and Africa of Unilever was appointed as a Director on the Boardof HLL, with effect from April 29, 2005. He was elected as director at the Annual General Meeting of the Company heldon June 24, 2005.
Mr. M.S. Banga stepped down from the Board of the Company consequent to his appointment as President – Foods ofUnilever and therefore did not seek re-election as a Non-Executive Director at the said AGM. Board electedMr. Harish Manwani as the Non-Executive Chairman of the Company in succession to Mr. M.S. Banga with effect fromJuly 1, 2005.
Mr. Douglas Baillie was appointed as an additional director of the Company and assumed charge as Chief ExecutiveOfficer (CEO) and Managing Director of the Company with effect from March 1, 2006. Prior to this, Mr. Baillie wasGroup Vice President and head of Unilever AMET (Africa, Middle East and Turkey).
Mr. Douglas Baillie is a British national and brings with him enormous experience of working in the developed anddeveloping markets.
The National Management Committee, which was formed in May 2004, on Mr. Banga taking over as Non-ExecutiveChairman is replaced by the Management Committee chaired by Mr. Douglas Baillie, CEO.
Subject to the overall superintendence and control of the Board, the day to day management of the Company now vestsin a Management Committee headed by Mr. Douglas Baillie, CEO and MD with Mr. M. K. Sharma, Mr. D. Sundaram,Mr. S. Ravindranath, Mr. Anoop Mathur, Mr. Sanjay Dube, Mr. Nitin Paranjpe and Mr. Dhaval Buch as members.
(b) Number of Board meetings
Hindustan Lever held seven Board meetings during the year ended December 31, 2005. These were on February 11,2005; April 29, 2005; June 24, 2005; July 30, 2005; August 11, 2005; October 31, 2005 and December 15, 2005 andthe maximum interval between any two meetings was not more than 90 days.
(c) Directors’ attendance record and directorships heldSee Table 1 for details.Table 1 : Details about Hindustan Lever’s Board of Directors
Name of Director Position Board Board Whether Directorshipsmeetings meetings attended in otherheld during attended last AGM public limitedthe year during the companies
year incorporatedin India***
M.S. Banga* Non-Executive Chairman 7 2* Yes 1 (1)and Director
Harish Manwani** Non-Executive Chairman 7 4** Yes Niland Director
Douglas Baillie@ Chief Executive Officer and NA NA NA NAManaging Director
Corporate Governance

2005
HINDUSTAN LEVER LIMITED
27
Name of Director Position Board Board Whether Directorshipsmeetings meetings attended in otherheld during attended last AGM public limitedthe year during the companies
year incorporatedin India***
M.K. Sharma Executive Vice-Chairman 7 7 Yes 4 (2)and whole-time Director
D.S. Parekh Non-Executive and 7 7 Yes 16 (9)independent Director
V. Narayanan Non-Executive and 7 5 Yes 13 (10)independent Director
C.K. Prahalad Non-Executive and 7 4 Yes Nilindependent Director
A. Narayan Non-Executive and 7 7 Yes 2 (1)independent Director
S. Ramadorai Non-Executive and 7 6 Yes 10 (5)independent Director
D. Sundaram Whole-time Director 7 6 Yes 4 (1)(Finance & InformationTechnology)
Arun Adhikari@@ Managing Director 7 7 Yes 1(Home & Personal Care)
S. Ravindranath Managing Director (Foods) 7 7 Yes 1
Notes : * Ceased to be a Director and Non-Executive Chairman with effect from July 1, 2005.** Appointed as Director with effect from April 29, 2005 and nominated as Non-Executive Chairman with
effect from July 1, 2005.*** Figures in ( ) indicates listed companies and does not include alternate directorship.@ Member of the Board as on the date of this report – inducted with effect from March 1, 2006.@@ Ceased to be a Member of the Board as on the date of this report - resigned with effect from March 1, 2006.
Independent Director means a Director who, apart from receiving Director’s remuneration, does not have any other materialpecuniary relationship or transactions with the Company, its promoters, its management, or its subsidiaries, which in thejudgement of the Board may affect the independence of judgement of the Director.
None of the Directors is a member of more than ten Board-level committees or Chairman of more than five such committees,as required under Clause 49 of the listing agreement.
(d) Information supplied to the Board
Among others, this includes :* review of annual operating plans of businesses, capital budgets, updates,* quarterly results of the Company and its operating divisions or business segments,* minutes of meeting of audit committee and other committees,* information on recruitment and remuneration of senior officers just below the Board level,* materially important show cause, demand, prosecution and penalty notices,* fatal or serious accidents or dangerous occurrences,* any materially significant effluent or pollution problems,* any materially relevant default in financial obligations to and by the Company or substantial non-payment for
goods sold by the Company,
* any issue which involves possible public or product liability claims of a substantial nature,

HINDUSTAN LEVER LIMITED
200528
* details of any joint venture or collaboration agreement,
* transactions that involve substantial payment towards goodwill, brand equity or intellectual property,
* significant labour problems and their proposed solutions,
* significant development in the human resources and industrial relations fronts,
* sale of material nature, of investments, subsidiaries, assets, which is not in the normal course of business,
* quarterly details of foreign exchange exposure and the steps taken by management to limit the risks of adverseexchange rate movement and
* non-compliance of any regulatory or statutory provision or listing requirements as well as share holder servicessuch as non-payment of dividend and delays in share transfer.
The Board of Hindustan Lever is routinely presented with all information under the above heads whenever applicable andmaterially significant. These are submitted either as part of the agenda papers well in advance of the Board meetings or aretabled in the course of the Board meetings or are tabled before the appropriate Committees of the Board.
e) Materially significant related party transactions
There have been no materially significant related party transactions, pecuniary transaction or relationships betweenHindustan Lever and its Directors for the year ended December 31, 2005 that may have a potential conflict with theinterests of the Company at large.
f) Remuneration of Directors: sitting fees, salary, perquisites and commission
Table 2 gives the details of the remuneration package of Directors and their relationships with each other.
Table 2 : Remuneration paid or payable to Directors during the year 2005 Rupees
Name of Relationship Sitting Commission Salary Contribution Perquisites TotalDirector with other fees on profits to PF
Directors
M.S. Banga1 None NA – – – – –
Harish Manwani None NA – – – 1,54,000 1,54,000
M.K. Sharma None NA 83,06,688 41,53,344 14,95,200 30,04,110 1,69,59,342
D.S. Parekh None 2,60,000 5,00,000 @ NA NA NA 7,60,000
V. Narayanan None 1,60,000 5,00,000 @ NA NA NA 6,60,000
C.K. Prahalad None 1,60,000 5,00,000 @ NA NA NA 6,60,000
A. Narayan None 3,20,000 5,00,000 @ NA NA NA 8,20,000
S. Ramadorai None 2,20,000 5,00,000 @ NA NA NA 7,20,000
D.Sundaram None NA 77,83,776 38,91,888 14,01,084 9,25,937 1,40,02,685
Arun Adhikari None NA 64,74,996 36,99,996 12,21,000 3,32,676 1,17,28,668
S. Ravindranath None NA 64,74,996 36,99,996 12,21,000 13,78,151 1,27,74,143
1. Upto June 30, 2005.
@ The Commission for the year ended December 31, 2005 @ Rs. 5 Lakhs per annum will be paid to non-wholetime Directors, subject to deduction of tax after adoption of accounts by shareholders at the AnnualGeneral Meeting to be held on May 29, 2006.
- Payment of Remuneration to wholetime Directors excludes provisions for / contribution to employee retirement/postretirement and other employee benefits which are based on actuarial valuation done on an overall Company basis.
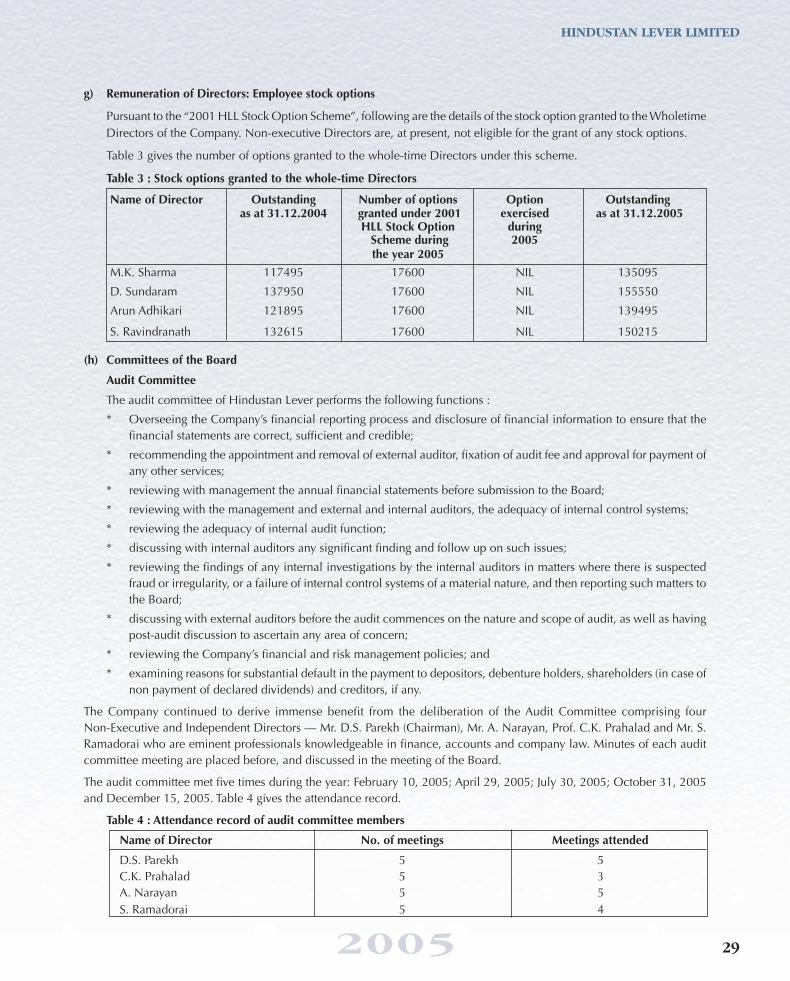
2005
HINDUSTAN LEVER LIMITED
29
g) Remuneration of Directors: Employee stock options
Pursuant to the “2001 HLL Stock Option Scheme”, following are the details of the stock option granted to the WholetimeDirectors of the Company. Non-executive Directors are, at present, not eligible for the grant of any stock options.
Table 3 gives the number of options granted to the whole-time Directors under this scheme.
Table 3 : Stock options granted to the whole-time Directors
Name of Director Outstanding Number of options Option Outstandingas at 31.12.2004 granted under 2001 exercised as at 31.12.2005
HLL Stock Option during Scheme during 2005the year 2005
M.K. Sharma 117495 17600 NIL 135095
D. Sundaram 137950 17600 NIL 155550
Arun Adhikari 121895 17600 NIL 139495
S. Ravindranath 132615 17600 NIL 150215
(h) Committees of the Board
Audit Committee
The audit committee of Hindustan Lever performs the following functions :
* Overseeing the Company’s financial reporting process and disclosure of financial information to ensure that thefinancial statements are correct, sufficient and credible;
* recommending the appointment and removal of external auditor, fixation of audit fee and approval for payment ofany other services;
* reviewing with management the annual financial statements before submission to the Board;
* reviewing with the management and external and internal auditors, the adequacy of internal control systems;
* reviewing the adequacy of internal audit function;
* discussing with internal auditors any significant finding and follow up on such issues;
* reviewing the findings of any internal investigations by the internal auditors in matters where there is suspectedfraud or irregularity, or a failure of internal control systems of a material nature, and then reporting such matters tothe Board;
* discussing with external auditors before the audit commences on the nature and scope of audit, as well as havingpost-audit discussion to ascertain any area of concern;
* reviewing the Company’s financial and risk management policies; and
* examining reasons for substantial default in the payment to depositors, debenture holders, shareholders (in case ofnon payment of declared dividends) and creditors, if any.
The Company continued to derive immense benefit from the deliberation of the Audit Committee comprising fourNon-Executive and Independent Directors — Mr. D.S. Parekh (Chairman), Mr. A. Narayan, Prof. C.K. Prahalad and Mr. S.Ramadorai who are eminent professionals knowledgeable in finance, accounts and company law. Minutes of each auditcommittee meeting are placed before, and discussed in the meeting of the Board.
The audit committee met five times during the year: February 10, 2005; April 29, 2005; July 30, 2005; October 31, 2005and December 15, 2005. Table 4 gives the attendance record.
Table 4 : Attendance record of audit committee members
Name of Director No. of meetings Meetings attended
D.S. Parekh 5 5C.K. Prahalad 5 3A. Narayan 5 5S. Ramadorai 5 4

HINDUSTAN LEVER LIMITED
200530
In addition to the areas noted above, Hindustan Lever’s audit committee looks into controls and security of the Company’scritical IT applications, the internal and control assurance audit reports of all major divisions and deviations from theCode of Business Principles, if any.
Remuneration and Compensation Committees
Hindustan Lever’s remuneration policy is based on three tenets: pay for responsibility, pay for performance and potential,and pay for growth. The Company’s remuneration committee is vested with all the necessary powers and authority toensure appropriate disclosure on the remuneration of whole time Directors and to deal with all elements of remunerationpackage of all such Directors. This includes details of fixed components and performance linked incentives includingstock options. Since the appointments of the wholetime Directors are by virtue of their employment with the Companyas management employees, their service contract, notice period and severance fee, if any, is governed by the managementremuneration policy of the Company.
As for the Non-wholetime Directors, their appointment is for the benefit of their professional expertise in their individualcapacity as independent professionals/Business Executives. Accordingly, the service contract, notice period and severancefees, if any, of the Company are not applicable to such Non-wholetime Directors. However, as a Company policy, uponattaining the age of 70 years, the Non-wholetime Directors seek retirement by not offering themselves for re-appointmentat the Annual General Meeting of the Company.
The committee consisting of four Non-executive and Independent Directors – Mr. V. Narayanan (Chairman), Prof. C.K.Prahalad, Mr. A. Narayan and Mr. S. Ramadorai met twice during the year: May 27, 2005 and October 31, 2005.
Table 5 gives the attendance record of the members of the remuneration committee.
Table 5 : Attendance record of Remuneration Committee members
Name of Director No. of meetings Meetings attended
V. Narayanan 2 2C.K. Prahalad 2 1A. Narayan 2 2S. Ramadorai 2 1
Consequent to resignation of Mr. M.S. Banga as a member of the compensation committee, Mr. Harish Manwani wasappointed as member of compensation committee to supplement the four Non-executive members of the remunerationcommittee, along with Mr. M.K. Sharma. The compensation committee administers the stock option plan of the Company.
Shareholder/Investor Grievances Committee
The Shareholder/Investor grievances committee specifically looks into redressing of shareholders’ and investors’complaints such as transfer of shares, non-receipt of shares, non-receipt of declared dividends and to ensure expeditiousshare transfer process. This committee comprising Mr. A. Narayan (Chairman, Independent Director), Mr. M.K. Sharma(Vice-Chairman and whole-time Director) and Mr. D. Sundaram (whole-time Director) met twice during the year:July 30, 2005 and December 15, 2005. Table 6 gives the attendance record.
Table 6 : Attendance record of investor grievances committee members
Name of Director No. of meetings Meetings attended
A. Narayan 2 2M.K. Sharma 2 2D. Sundaram 2 2
MANAGEMENT
a) Management Discussion and Analysis
The Directors' Report includes details of Management Discussion and Analysis of various businesses of the Company.

2005
HINDUSTAN LEVER LIMITED
31
b) Disclosures by management to the Board
All details relating to financial and commercial transactions where Directors may have a pecuniary interest are providedto the Board, and the interested Directors neither participate in the discussion, nor do they vote on such matters.
SHAREHOLDERS
a) Disclosures regarding appointment or re-appointment of Directors
According to the Articles of Association of Hindustan Lever, all Directors retire every year and, if eligible, offer themselvesfor re-election at every Annual General Meeting.
Mr. Douglas Baillie, who was appointed as an additional Director on February 14, 2006, to assume charge as ChiefExecutive Officer and Managing Director of the Company with effect from March 1, 2006, will offer himself forappointment by the shareholders of the Company at the forthcoming Annual General Meeting of the Company onMay 29, 2006.
Mr. Arun Adhikari has tendered his resignation to the Board on February 14, 2006 to be relieved of his responsibilitiesas the Managing Director of the HPC Division of the Company with effect from March 1, 2006.
All the other Directors are eligible and are offering themselves for re-election save and except Mr. S. Ravindranath,Managing Director – Foods who has been elected for a term of 5 years effective from May 1, 2004.
Given below are the abbreviated resumes of the Directors of Hindustan Lever.
* Harish Manwani (52) assumed charge as the Non-Executive Chairman of the Company with effect from July 1,2005. He is also President Asia & Africa and a part of the Unilever Executive (UEx), an 8 member team that runsUnilever’s operations worldwide.
Mr. Manwani joined HLL in 1976. He joined the Board of HLL in 1995, as Director responsible for the PersonalProducts business. In addition, he held regional responsibility as the Category Leader for Personal Products for thethen Central Asia & Middle East (CAME) Group.
In 2000, Mr. Manwani moved to the UK as Senior Vice President for the Global Hair Care & Oral Care Categories,and in early 2001 was appointed President Home & Personal Care (HPC), Latin America Business Group. He alsoserved as Chairman of Unilever’s Latin America Advisory Council. In 2004, he was appointed President and CEOof the HPC North America Business Group, and in April 2005 was elevated to the Unilever Executive as PresidentAsia & Africa.
He is an Honours graduate from Mumbai University and holds a Master's Degree in Management Studies. He hasalso attended the Advanced Management Program (AMP) at Harvard Business School.
* Douglas Baillie (50) Born and educated in Zimbabwe, Mr. Baillie graduated from the University of Natal with majors inbusiness finance, marketing and business administration and joined Unilever SA in 1978. His career over the years hasspanned various sales and marketing positions, culminating in a secondment to Lever Rexona in Australia in 1987.
On his return to South Africa in late 1988, he took up the position of Sales Director, which was followed by a spellas Marketing Director. Mr. Baillie moved to London in 1994 to Personal Products Co-ordination where he becamethe Regional Liaison Member for Africa, Middle East, Central and Eastern Europe and Turkey before moving to VicePresident, Home and Personal Care for the Africa Business Group. Mr. Baillie was appointed Managing DirectorLever Pond’s South Africa in 1997 and National Manager, Unilever South Africa, in May 2000. Whilst in thisposition Mr. Baillie served on several external Boards including the Advertising Standards Authority, the ConsumerGoods Council of South Africa and was a member of Presidential Big Business working group.
Prior to assuming responsibilities as the Chief Executive Officer (CEO) of Hindustan Lever Limited, Mr. Bailliewas Group Vice President and Head of Unilever AMET (Africa, Middle East and Turkey). Mr. Baillie is also theGroup Vice President responsible for Unilever’s business in South Asia, which includes Sri Lanka, Pakistan andBangladesh.
* M.K. Sharma (59) is the Vice Chairman and a whole-time Director of Hindustan Lever. After graduating in PoliticalScience, he completed his LL.B from the University of Lucknow. He then went on to do a Post-graduate Diplomain Personnel Management from the Department of Business Management, Delhi University, and a Diploma in
HINDUSTAN LEVER LIMITED
200532
Labour Law from the Indian Law Institute, Delhi. After working for six years with the DCM group, Mr. Sharmajoined Hindustan Lever in 1974 as the Legal Manager. He was inducted on the Board of the Company as Director(Legal and Secretarial) in August 1995, and has been the Vice Chairman since May 2000. He has also attended theAdvanced Management Program (AMP) at Harvard Business School.
* D.S. Parekh (61) is a B.Com and holds a FCA degree from England and Wales. Mr. Parekh has held senior positionsin Grindlays and Chase Manhattan. He is the Executive Chairman of Housing Development Finance CorporationLtd. Mr. Parekh joined the Board of Hindustan Lever in May 1997.
* V. Narayanan (68) is a M.Sc (Chem) from Madras University. He was the Chairman and Managing Director oferstwhile Pond’s (India) Ltd., and is presently the Chairman of the Academy of Management Excellence, an institutionengaged in management training. He joined the Board of Hindustan Lever in August 1987.
* C.K. Prahalad (64) is the Harvey C. Fruehauf Professor of Business Administration at the University of Michiganat Ann Arbor, USA. He received his Doctor of Business Administration from the Harvard Business School. Prof.Prahalad specialises in corporate strategy, and has authored several books and numerous articles in reputedjournals. His contribution to business strategy is globally recognised. He joined the Board of Hindustan Lever inApril 2000.
* S. Ramadorai (61) is the CEO of Tata Consultancy Services; Chairman of Tata Technologies Ltd. and Chairman ofCMC Ltd. Holder of a Bachelor degree in Physics from Delhi University; a Bachelor of Engineering degree inElectronics and Telecommunications from Indian Institute of Science, Bangalore; and a Master's degree in ComputerScience from the University of California, USA, Mr. Ramadorai took the Senior Executive Development Program atMIT’s Sloan School of Management in 1993. Mr. Ramadorai joined the Board of Hindustan Lever in May 2002.
* A. Narayan (54) joined ICI India as a management trainee in 1973 and grew through diverse functions and businessesbefore being appointed as Managing Director of ICI India in 1996. On completion of his term as ManagingDirector in ICI India, he was appointed as Non-Executive Chairman of ICI India. Just prior to this appointment heserved as a Corporate Planning Manager at the ICI Group Head Quarters in London. A B.Tech. from IIT Kanpur, healso has formal qualifications in law, multidisciplinary sciences and strategic management. He joined the Board ofHindustan Lever in 2001.
* D. Sundaram (53) joined Hindustan Lever in 1975 after qualifying as a cost accountant from ICWA. Havingworked in various capacities within the Company, he was seconded to Unilever, London for the period 1990-93.On his return to India, he was the financial member of the TOMCO Integration Team and then became the FinanceDirector of Brooke Bond Lipton India Ltd., in March 1994. After another round of secondment to Unilever, Londonas Senior Vice President Finance (Central Asia and Middle East Group) during 1996-99, he returned to HindustanLever in May 1999 to take up his current position as Director, Finance and IT. He has also attended the AdvancedManagement Program (AMP) at Harvard Business School.
* S. Ravindranath (59) has a Bachelors of Science degree in Maths and Statistics followed by a Masters in OperationsResearch and Fellowship of the Institute of Costs and Works Accountants of India. He joined Hindustan Lever inthe non-management cadre in 1975. He was promoted to the management cadre in 1979. Thereafter he has heldseveral positions - Management Accountant, Corporate Accountant and Commercial Manager – Personal Products.In 1992, he was appointed as General Manager – Commercial, Personal Products. He was later the Divisional VicePresident Commercial for Detergents since 1995. In 1999, he was appointed as Head – Beverages Profit Centre atBangalore and was then appointed as Executive Director Beverages in April 2000. Since May 1, 2004,Mr. Ravindranath is the Managing Director of the Foods Division.
Particulars of Directorships of other Companies and Memberships of other Committees are given in the Annexure hereto.
b) Communication to shareholders
Hindustan Lever has its own web-site and all vital information relating to the Company and its performance, includingquarterly results, official press releases and presentation to analysts are posted on the web-site. The Company’s web-siteaddress is www.hll.com.
The quarterly, half-yearly and annual results of the Company’s performance are published in leading newspapers suchas Times of India and Hindu Business Line.
c) Investor grievances
As mentioned earlier in this chapter, the Company has constituted a Shareholder/ Investors’ Grievances Committee forredressing shareholders’ and investors’ complaints. The status on complaints is reported to the Board of Directors.Mr. Ashok K. Gupta, Company Secretary, is the compliance officer.

2005
HINDUSTAN LEVER LIMITED
33
d) Share transfer
Effective July 16, 2004, the Investor servicing function, including share transfers so far conducted inhouse by HindustanLever’s Investor Service Department have been outsourced to Karvy Computershare Private Limited, to act as the ShareRegistrars of the Company.
e) Details of non-compliance
Company has been fully compliant with all matters relating to the capital market and the listing agreements.
f) General body meetings
Details of the last three annual general meetings are given in Table 7.
Table 7 : Date, time and venue of the last three AGMs
Financial year (ended) Date Time Venue
31st December, 2002 13th June, 2003 15.00 hrs Birla Matushri Sabhagar,Marine Lines, Mumbai 400 020.
31st December, 2003 29th June, 2004 15.00 hrs Birla Matushri Sabhagar,Marine Lines, Mumbai 400 020.
31st December, 2004 24th June, 2005 15.00 hrs Birla Matushri Sabhagar,Marine Lines, Mumbai 400 020.
g) Postal ballots
During the year 2005, pursuant to Section 192 A of the Companies Act 1956, the shareholders of the Company hadoverwhelmingly approved by means of Postal Ballot the following disposals, through an Ordinary Resolution.
(i) transfer by way of sale its tea plantation business in Assam, commonly known as the Doom Dooma Divisionto a wholly owned subsidiary of the Company;
(ii) transfer by way of sale its tea plantation business in Tamil Nadu, commonly known as the Tea Estates Divisionto a wholly owned subsidiary of the Company.
OTHER INFORMATION
— In line with the approval of the Government, royalty payable to Unilever PLC for the year 2005 @ 1% of qualifyingturnover of Rs. 6327.82 crores amounts to Rs. 63.28 crores.
AUDITOR’S CERTIFICATE ON CORPORATE GOVERNANCE
As required by Clause 49 of the Listing Agreement, the Auditor’s Certificate is given as an annexure to the Directors’ Report.
Particulars of Loans / Advances and Investment in its own shares by listed companies, their subsidiaries, associates, etc.,required to be disclosed in the annual accounts of the Company pursuant to Clause 32 of the Listing Agreement
Loans and Advances in the nature of loan to subsidiaries :
Rs. LakhsName of the Company Balance as at Maximum outstanding
31st December, 2005 during the yearModern Food Industries (India) Limited 27,80.00 27,80.00Pond’s Export Limited 39.98 39.98Unilever India Shared Services Limited(Previously known as Indigo Lever Shared Services Limited) 8,50.00 8,50.00
Hindustan Kwality Walls Limited 5,61.38 5,61.38Tea Estates India Limited 3,30.00 3,30.00Doom Dooma Tea Company Limited 1,50.00 2,00.00The Company has not made any loans and advances in the nature of loan to associates or loans and advances in the natureof loans where there is no repayment schedule or repayment beyond seven years or no interest or interest below Section372A of the Companies Act, 1956.Also there are no Loans and Advances in the nature of loans to firms/companies in which directors are interested.

HINDUSTAN LEVER LIMITED
200534
Other Directorships Other Committee Memberships
Name of the Director Name of the Company Position Name of the Company Committee Position
HARISH MANWANI NIL NIL –––––––––––––––––––––––––––––––NIL–––––––––––––––––––––––––––––––––DOUGLAS ANDERSONBAILLIE NIL NIL –––––––––––––––––––––––––––––––NIL–––––––––––––––––––––––––––––––––M. K. SHARMA ICICI Bank Limited Non-Executive ICICI Bank Limited – Audit Committee Member
Director – Business Strategy committee Member– Share Transfer & Investor
Grievances Chairman– Credit & Governance Committee Member– Fraud Monitoring Member
Unilever Nepal Limited DirectorUnilever India Exports Limited DirectorHind Lever Trust Limited Director
D. SUNDARAM Unilever India Shared Services Limited ChairmanSBI Capital Markets Ltd. Director SBI Capital Markets Ltd. Audit ChairmanQuest International India Limited DirectorUnilever India Exports Limited Director
S. RAVINDRANATH Unilever India Exports Limited Director –––––––––––––––––––––––––––––––NIL–––––––––––––––––––––––––––––––––Digital Securities Private Limited
ADITYA NARAYAN ICI India Limited Chairman –––––––––––––––––––––––––––––––NIL–––––––––––––––––––––––––––––––––Quest International India Limited Non-Executive
Director (Alternate)BHP Billiton Marketing Services India Director, PresidentPvt. Ltd. & CEO
V. NARAYANAN Pond’s Exports Limited Chairman MM Forgings Limited Audit Committee ChairmanMM Forgings Limited Chairman Glaxo Smithkline Audit Committee MemberUCAL Fuel Systems Limited Director Pharmaceuticals Limited Remuneration Committee MemberGlaxo SmithKline Director FAL Industries Limited Audit Committee MemberPharmaceuticals LimitedSamtel Colour Limited Director Tamil Nadu Newsprint & Audit Committee Chairman
Papers LimitedFAL Industries Limited Director Bata India Limited Audit Committee ChairmanRane Madras Limited Director UCAL Fuel Systems Ltd. Audit Committee ChairmanSamcor Glass Limited Director Sundaram Fasteners Ltd. Audit Committee MemberTamil Nadu Newsprint & Papers Limited DirectorLafarge India Private Limited DirectorFoster’s India Limited DirectorSundaram Fasteners Limited DirectorBata India Limited DirectorRane Holdings Limited Director
C. K. PRAHALAD NCR Corporation Director NCR Corporation Audit & Finance Committee MemberGovernance Committee Chairman
D. S. PAREKH Housing Development Finance Chairman Glaxo SmithKline Audit Committee ChairmanCorporation Ltd. Pharmaceuticals Ltd.Infrastructure Development and Mahindra & Mahindra Ltd. Audit Committee ChairmanFinance Co. Ltd. ChairmanGlaxo SmithKline Pharmaceuticals Ltd. Chairman Motor Industries Co. Ltd. Audit Committee Chairman
Siemens Limited Chairman Castrol India Ltd. Audit Committee ChairmanHDFC Asset Management Co. Ltd. Chairman The Indian Hotels Co. Ltd. Audit Committee MemberHDFC Standard Life Insurance Co. Ltd. Chairman Siemens Limited Audit Committee Member
Remuneration Committee MemberHDFC Chubb General Chairman Motor Industries Co. Ltd. Investor Grievances MemberInsurance Company Ltd.Mahindra and Mahindra Ltd. Director IDFC Limited. Remuneration Committee MemberHindustan Oil Exploration DirectorCorporation Ltd.Castrol India Ltd. DirectorThe Indian Hotels Co. Ltd. DirectorMotor Industries Co. Ltd. DirectorBorax Morarji Ltd. Alternate DirectorZodiac Clothing Co. Ltd. Alternate DirectorBharat Bijlee Ltd. Alternate DirectorExide Inds. Ltd. Alternate Director
S. RAMADORAI Tata Consultancy Services Limited Managing Director Tata Consultancy Services Shareholder/Investor MemberLimited Grievances Committee
Tata Technologies Limited Chairman Ethics & Compliance MemberCommittee
Tata Industries Limited Director Tata Technologies Limited Audit ChairmanTata Elxsi Limited Vice Chairman Remuneration ChairmanTCS Iberoamerica SA (Uruguay) Director Tata Elxsi (India) Ltd. Remuneration MemberTata Solutions Centre SA (Uruguay) Chairman Tata Elxsi (India) Ltd. Audit MemberWTI Advanced Technology Ltd. Director Nicholas Piramal India Limited Compensation MemberAviation Software Development Director VSNL Singapore Pte Ltd. Compensation ChairmanConsultancy India Ltd.Innova TV Inc. (USA) DirectorTata Teleservices Limited DirectorCMC Limited ChairmanNicholas Piramal India Limited DirectorTata Consultancy Services De Espana Director SA (Spain)Tata Consultancy Services Do Brasil DirectorSA (Brazil)Tata Consultancy Services Chile SA (Chile) DirectorConscripti (Pty) Limited (South Africa) DirectorTata Teleservices Limited DirectorVSNL Singapore Pte. Ltd. DirectorC-Edge Technologies Limited Director
ANNEXUREPARTICULARS OF DIRECTORSHIPS OF OTHER COMPANIES AND MEMBERSHIPS OF OTHER COMMITTEES

2005
HINDUSTAN LEVER LIMITED
35
ANNEXURE TO THE REPORT OF THE DIRECTORSCERTIFICATE FROM AUDITORS REGARDING COMPLIANCE OF CONDITIONS OF CORPORATE GOVERNANCE
To the Shareholders of Hindustan Lever Limited
We have examined the compliance of conditions of Corporate Governance by Hindustan Lever Limited, for the yearended 31st December, 2005 as stipulated in Clause 49 of the Listing Agreements of the said Company with the stockexchanges in India.
The compliance of conditions of Corporate Governance is the responsibility of the Company’s Management. Our examinationwas limited to procedures and implementation thereof, adopted by the Company for ensuring the compliance of the conditionsof Corporate Governance. It is neither an audit nor an expression of opinion on the financial statements of the Company.
In our opinion and to the best of our information and according to the explanations given to us, we certify that the Companyhas complied with the conditions of Corporate Governance as stipulated in the above mentioned Listing Agreements.
We state that in respect of investor grievances received during the year ended 31st December, 2005, no investor grievancesare pending for a period exceeding one month against the Company as per records maintained by the Company which arepresented to the Shareholders / Investors Grievance Committee.
We further state that such compliance is neither an assurance as to the future viability of the Company nor the efficiency oreffectiveness with which the management has conducted the affairs of the Company.
Sharmila A. KarvePartnerMembership No. 43229For and on behalf ofLOVELOCK & LEWESChartered Accountants
Mumbai : 28th April, 2006

HINDUSTAN LEVER LIMITED
36 2005
Annual General MeetingDate : 29 May 2006Venue : Birla Matushri Sabhagar, Marine Lines, Mumbai - 400 020Time : 15:00 hours
Financial Calendar
Financial year : 1 January to 31 December
For the year ended 31 December 2005, results were announced on:
– 29 April 2005 : First quarter
– 30 July 2005 : Half yearly
– 31 October 2005 : Third quarter
– 14 February 2006 : Fourth quarter and annual.
For the year ended 31 December 2006, results will be announced on :
– 28 April 2006 : First quarter
– 31 July 2006 : Half yearly
– 31 October 2006 : Third quarter
– 16 February 2007 : Fourth quarter and annual.
Book Closure
The book closure period for final dividend is from 3 May 2006 to 16 May 2006, inclusive of both days.
Dividend
An interim dividend of Rs. 2.50 per share aggregating in all to Rs. 551.17 crores was declared on 30 July 2005 and paid on24 August, 2005. A final dividend of Rs. 2.50 per share aggregating in all to Rs.551.21 crores was recommended on14 February, 2006 and subject to the approval of the shareholders at the Annual General Meeting will be paid on30 May, 2006.
Merger of Vashisti Detergents Limited (VDL) with Hindustan Lever Limited (HLL)
With all the requisite approvals having been obtained the Scheme of Arrangement (Scheme), involving Amalgamation ofVashisti Detergents Limited (VDL) with Hindustan Lever Limited (HLL) has become effective. Pursuant to the said Scheme,those VDL shareholders whose name appeared in the Register of Members as on Record Date would be eligible for 1 EquityShare of Re. 1/- of HLL for every 10 shares of Rs. 10/- each held in VDL and interim dividend @ Rs. 2.50/- per share declaredby HLL for the year 2005.
The Record Date was fixed as 31 March, 2006. The share certificates in respect of HLL shares allotted on 10 April, 2006have been despatched/credited, along with the relevant dividend warrant (and fractional entitlement if any) during the thirdweek of April, 2006.
In deference to the request received from many shareholders, the Company had decided to dispense with the requirementof the surrender of VDL share certificates and despatched all HLL share certificates without insisting on surrender of VDLshare certificates. In view of this, the corresponding VDL share certificates surrendered to the Company or still in possessionwith VDL Shareholders stand cancelled and is/are not valid.
Those members who have not received the share certificate / credit till 30 April 2006, may please contact :-
M/s. Karvy Computershare Pvt. Ltd.
Unit : Hindustan Lever Ltd.KARVY HOUSE, 46, Avenue – 4Street No. 1, Banjara HillsHyderabad – 500 034Tel. No.: 040-23420818Fax No.: [email protected]
Additional Information for Shareholders

HINDUSTAN LEVER LIMITED
372005
ECS (Electronic Clearing Service) / Mandates / Bank DetailsThe members may please note that ECS details contained in the BENPOS downloaded from the Depositories would bereckoned for payment of dividend. In order to avoid fraudulent encashment of dividend, please register either ECS ormandate or Bank details for payment of dividend.Listing
Till last year, the Company’s Shares were listed and traded on the stock exchanges at Ahmedabad, Bangalore, Chennai,Cochin, Delhi, Kolkata, Gauhati and Mumbai as well as National Stock Exchange of India Ltd.
Pursuant to the approval of the Members at the last AGM, the Company has delisted its shares from the Stock Exchanges asdetailed hereunder :
Name of the Stock Exchange Delisted w.e.f.
Bangalore Stock Exchange 16.09.2005Ahmedabad Stock Exchange 11.10.2005Delhi Stock Exchange 14.10.2005Gauhati Stock Exchange 23.03.2006Madras Stock Exchange 31.03.2006Cochin Stock Exchange Letter awaitedCalcutta Stock Exchange Letter awaited
Name of the Stock Exchange on which shares are listed Stock Code
Bombay Stock Exchange Limited, Mumbai 500696
National Stock Exchange of India Limited HINDLEVER
The ISIN Number of Hindustan Lever (or demat number) on both NSDL and CDSL is INE030A01027.
Stock Data
Tables 1 and 2 respectively give the monthly high and low prices and volumes of Hindustan Lever at The BombayStock Exchange Limited, Mumbai (BSE) and the National Stock Exchange of India Limited (NSE) for the year ended31 December 2005.
Table 1 : Monthly share price data and volumes, BSE
Month, 2005 High Low Volume
January 160.30 136.30 11,695,071
February 170.50 139.20 16,670,552
March 151.80 128.50 14,634,619
April 145.00 126.30 9,149,273
May 145.25 127.50 12,431,410
June 168.40 141.00 20,536,739
July 170.00 152.20 13,745,132
August 175.50 159.50 39,790,820
September 186.00 164.00 17,701,089
October 187.70 156.50 18,371,950
November 193.00 161.95 15,521,315
December 200.65 180.70 16,386,569
Note : High and low are in rupees per traded share. Volume is the total monthly volume of trade (in numbers) in HindustanLever shares on the BSE.

HINDUSTAN LEVER LIMITED
38 2005
Chart A : Plots Hindustan Lever’s share prices with the BSE Sensex for 2005
Capital appreciation of Hindustan Lever shares
How have long-term shareholders of HLL fared vis-à-vis the Sensex? Table 3 gives the closing share price on the first day oftrading for every calendar year since 1996 (adjusted to the face value of Re.1 per share). If someone bought a HindustanLever share on 1 January 1996 and held on to it until 2 January 2006, then that person will have enjoyed a capitalappreciation of almost 214 per cent. Compared to that, the BSE-Sensex would deliver 200 per cent.
Table 3 : Value appreciation for Hindustan Lever shareholders
Date of Purchase HLL share price HLL appreciation BSE Sensex Sensex appreciation
1-Jan-96 62.20 213.8% 3128 200.2%1-Jan-97 81.70 138.9% 3261 188.0%1-Jan-98 139.43 40.0% 3695 154.1%1-Jan-99 165.25 18.1% 3060 206.9%3-Jan-00 239.12 -18.4% 5375 74.7%1-Jan-01 200.00 -2.4% 3955 137.4%1-Jan-02 220.50 -11.5% 3246 189.3%1-Jan-03 181.65 7.5% 3390 177.0%1-Jan-04 212.60 -8.2% 5915 58.8%3-Jan-05 146.05 33.7% 6651 41.2%2-Jan-06 195.20 9390
Note : All comparisons are with respect to 2 January 2006 (the reference date).
Table 2 : Monthly share price data and volumes, NSE
Month, 2005 High Low Volume
January 160.10 136.10 38,267,177February 170.40 139.80 48,445,932March 151.70 129.10 44,063,274April 146.00 125.50 36,582,610May 159.90 127.40 42,923,928June 168.40 141.00 64,621,234July 172.00 152.10 43,104,171August 176.00 159.10 68,583,884September 186.90 163.50 55,279,117October 186.80 156.70 39,747,013November 193.00 152.55 50,351,242December 200.80 180.55 48,860,026
Note : High and low are in rupees per traded share. Volume is the total monthly volume of trade (in numbers) in HindustanLever shares on the NSE.
Sensex vs. Hindustan Lever
0
20
40
60
80
100
120
140
160
30-D
ec-0
516
-Dec
-05
1-D
ec-0
5
17-N
ov-0
51-
Nov
-05
17-O
ct-0
53-
Oct
-05
16-S
ep-0
5
1-Se
p-05
16-A
ug-0
5
1-A
ug-0
5
15-Ju
l-05
1-Ju
l-05
15-Ju
n-05
1-Ju
n-05
16-M
ay-0
5
2-M
ay-0
5
15-A
pr-0
51-
Apr
-05
15-M
ar-0
5
1-M
ar-0
5
15-F
eb-0
5
1-Fe
b-05
17-Ja
n-05
3-Ja
n-05
HLVR in EquitySensex Equity
Hindustan Lever Ltd.
Sensex
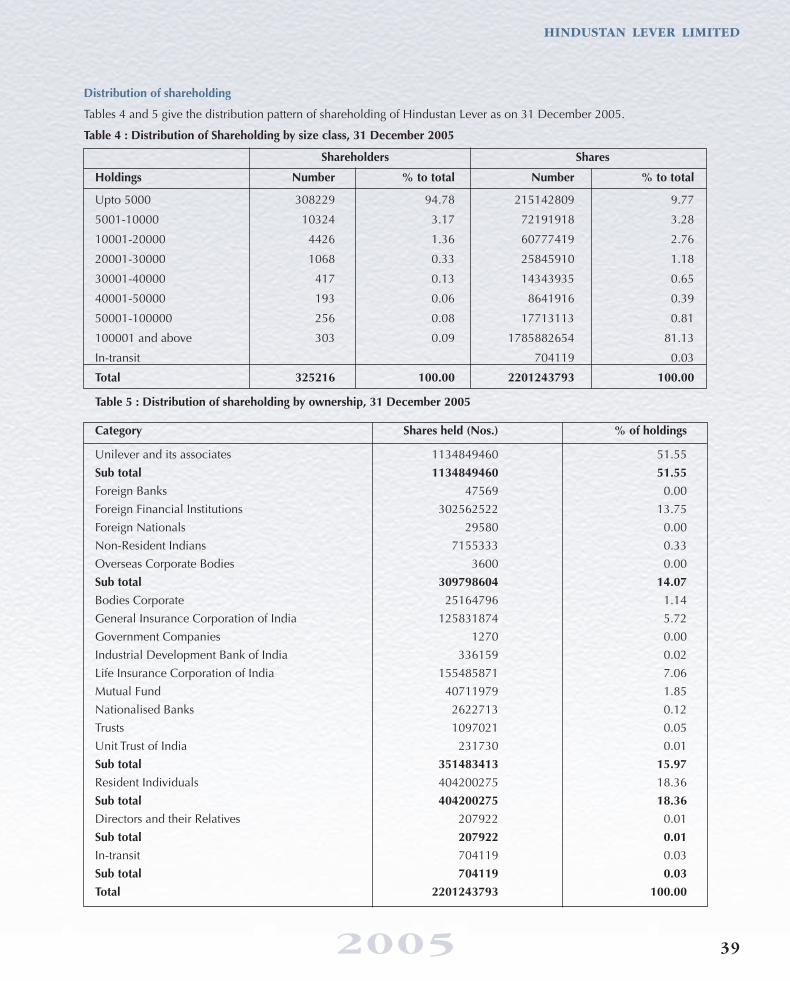
HINDUSTAN LEVER LIMITED
392005
Distribution of shareholding
Tables 4 and 5 give the distribution pattern of shareholding of Hindustan Lever as on 31 December 2005.
Table 4 : Distribution of Shareholding by size class, 31 December 2005
Shareholders Shares
Holdings Number % to total Number % to total
Upto 5000 308229 94.78 215142809 9.77
5001-10000 10324 3.17 72191918 3.28
10001-20000 4426 1.36 60777419 2.76
20001-30000 1068 0.33 25845910 1.18
30001-40000 417 0.13 14343935 0.65
40001-50000 193 0.06 8641916 0.39
50001-100000 256 0.08 17713113 0.81
100001 and above 303 0.09 1785882654 81.13
In-transit 704119 0.03
Total 325216 100.00 2201243793 100.00
Table 5 : Distribution of shareholding by ownership, 31 December 2005
Category Shares held (Nos.) % of holdings
Unilever and its associates 1134849460 51.55Sub total 1134849460 51.55Foreign Banks 47569 0.00Foreign Financial Institutions 302562522 13.75Foreign Nationals 29580 0.00Non-Resident Indians 7155333 0.33Overseas Corporate Bodies 3600 0.00Sub total 309798604 14.07Bodies Corporate 25164796 1.14General Insurance Corporation of India 125831874 5.72Government Companies 1270 0.00Industrial Development Bank of India 336159 0.02Life Insurance Corporation of India 155485871 7.06Mutual Fund 40711979 1.85Nationalised Banks 2622713 0.12Trusts 1097021 0.05Unit Trust of India 231730 0.01Sub total 351483413 15.97Resident Individuals 404200275 18.36Sub total 404200275 18.36Directors and their Relatives 207922 0.01Sub total 207922 0.01In-transit 704119 0.03Sub total 704119 0.03Total 2201243793 100.00

HINDUSTAN LEVER LIMITED
40 2005
Shares held in physical and dematerialised form
As on December 31, 2005, 42.88 per cent of Hindustan Lever’s shares were held in dematerialised form and the rest inphysical form. It needs to be said that Unilever and its affiliates own 51.55 per cent of the Company’s shares, which are heldin physical form. If these shares were to be excluded from the total number of shares, then dematerialised shares account for88.51 per cent of the remainder.
Outstanding GDRs/ADRs/Warrants/Convertible Instruments and their impact on equity
Not applicable for Hindustan Lever.
Details of public funding obtained in the last three years
Not applicable, as Hindustan Lever has not obtained any public funding in the last three years.
Mergers and acquisitions
Since the mid-1990s, Hindustan Lever’s growth has been both organic and through mergers and acquisitions. The details ofmergers from 1992 were published in the Annual Report and Accounts for the year 2002 as part of “Additional ShareholderInformation” and are available on the Company’s website www.hll.com.
Investor Services
With effect from July 16, 2004 all share transfers and related operations, so far conducted in-house by Hindustan Lever'sInvestor Service Department, have been now outsourced to Karvy Computershare Pvt. Ltd.
a) Address for Correspondence
All Correspondence relating to the shares of the Company should be forwarded to the below mentionedaddress of Karvy.
Karvy Computershare Private LimitedUnit : HINDUSTAN LEVER LIMITEDKarvy House : 46, Avenue 4, Street No. 1Banjara Hills, Hyderabad – 500 034.
Tel : +91-40-23420818 to 24Fax : +91-40-23420814E-mail : [email protected] : www.karvy.com
Please do not send any correspondence / documents to Investor Service Department at Belapur (CBD), Kolkata orChennai, as the Investor Service functions at these locations have been wound up.
The existing counter facility at the Registered Office of the Company will continue to be available to the shareholders.To allow us to service shareholders with greater speed and efficiency, the Company strongly recommends emailbased correspondence on all issues which do not require signature verifications for being processed.
Emails can be sent through the Companty's website www.hll.com
For any general assistance at the Registered Office, investors may call on :
Tel : 022-39832285 / 39832452 / 39832557
b) Website (www.hll.com)
On the website of the Company, more than 50 frequently asked questions on various topics related to transfers andtransmission of shares, dematerialization, nomination, change of address, loss of share certificates, dividend andsub-division of share certificates, have been put for the benefit of the shareholders. In addition, various downloadableforms required to be executed by the shareholders have also been included in the website. A special facility hasalso been provided for shareholders to send in their suggestions / grievances, which are immediately responded to.
c) Nomination in respect of shares held in physical form
The Companies Act, 1956 provides facility for making nominations by shareholders in respect of their holding ofshares and several shareholders have opted to avail of such facility. However, a large number of shareholders are yetto make nominations in respect of their holdings in physical form. Such nomination greatly facilitates transmission ofshares from the deceased shareholder to his/her nominee without having to go through the time consuming andcumbersome process of obtaining Succession Certificate/Probate of the Will. It would, therefore, be in the best interestof the shareholders holding shares in physical form as sole registered holders to make such nominations without anydelay. Nominations will have to be made in the prescribed form which could be obtained from Karvy Computershare

HINDUSTAN LEVER LIMITED
412005
Private Limited at the address mentioned above. The Nomination Form is also available on the Company’s website.It may be noted that for shares held in electronic form, the concerned shareholders have to register their nominationsdirectly with their respective depository participants.
d) Exchange of shares of Rs.10 with shares of Re.1
After the sub-division of Hindustan Lever’s shares of Rs.10 each into shares of Re.1 each, in the year 2000 theCompany sent circulars to all the shareholders holding share of the face value of Rs.10 in physical form to exchangethese share certificates of the face value of Re. 1 each.
Although a large number of such shareholders have done the exchange, there are still many who have not. They arerequested to forward their old share certificates of the shares of Rs.10 each (which are no longer tradeable) to KarvyComputershare Private Limited at the address stated above, along with a request letter signed by all holders.
e) Unclaimed dividends
Under the Companies Act, 1956, dividends that are unclaimed for a period of seven years statutorily get transferred tothe Investor Education and Protection Fund administered by the Central Government. Table 6 gives the dates ofdividend payment since 1998 and the corresponding dates when unclaimed dividends are due to be transferred tothe Central Government. Table 7 gives the unclaimed dividend amount since 1998. Table 8 gives the unclaimedinterest on bonus debentures and redemption amount of bonus debentures.
Table 6 : Due dates for transferring Unclaimed dividend to the Investor Education and Protection Fund
Year Dividend Type Date of payment Date of transfer1998 43F FINAL 21.05.1999 01.07.20061999 44I INTERIM 18.10.1999 28.11.20061999 44F FINAL 25.04.2000 05.06.20072000 45I INTERIM 19.10.2000 29.11.20072000 45F FINAL 22.06.2001 02.08.20082001 46I INTERIM 24.07.2001 22.08.20082001 46F FINAL 28.06.2002 27.07.20092002 47I INTERIM 21.08.2002 19.09.20092002 47F FINAL 16.06.2003 15.07.20102002 47S SPECIAL 08.07.2003 06.08.20102003 48I INTERIM 28.08.2003 26.09.20102003 48F FINAL 02.07.2004 04.08.20112004 49I INTERIM 27.08.2004 03.09.20112004 49F FINAL 27.06.2005 23.07.20122005 50I INTERIM 24.08.2005 28.08.2012
Table 7 : Unclaimed dividend amount as on 31 December 2005
No. of No. of % Amount of Dividend %Year Dividend Type warrants warrants Unclaimed dividend Unclaimed Unclaimed
issued unclaimed (Rs. Lakhs) (Rs. Lakhs)1998 43F FINAL 354211 16074 4.5 27227.00 161.77 0.6
1999 44I INTERIM 346323 16102 4.6 26348.00 147.39 0.6
1999 44F FINAL 353016 14982 4.2 37410.00 182.75 0.5
2000 45I INTERIM 374828 20529 5.5 33009.00 189.74 0.6
2000 45F FINAL 373306 17314 4.6 44012.00 219.82 0.5
2001 46I INTERIM 369667 17182 4.6 55015.00 245.88 0.4
2001 46F FINAL 352240 20152 5.7 55031.09 258.31 0.5
2002 47I INTERIM 370239 19703 5.3 55031.09 235.29 0.4

HINDUSTAN LEVER LIMITED
42 2005
No. of No. of % Amount of Dividend %Year Dividend Type warrants warrants Unclaimed dividend Unclaimed Unclaimed
issued unclaimed (Rs.) (Rs.)
2002 47F FINAL 375782 19646 5.2 58531.07 285.85 0.52002 47S SPECIAL 376369 25273 6.7 38851.95 254.31 0.72003 48I INTERIM 370088 19135 5.2 55031.09 249.01 0.52003 48F FINAL 358576 18274 5.1 66037.31 273.28 0.42004 49I INTERIM 375081 20232 5.4 55031.09 281.31 0.52004 49F FINAL 350630 22625 6.5 55031.22 219.67 0.42005 50I INTERIM 339914 26565 7.8 55031.22 267.04 0.5
Note : The above excludes information pertaining to the erstwhile Tata Oil Mills Company Limited, Brooke Bond LiptonIndia Limited and Pond's (India) Limited.
Table 8 : Unclaimed Interest/redemption amount against Bonus Debentures as on 31 December 2005
Redemption/ Month No. of No. of % Net Amount Redemption/ %Year Interest of warrants warrants unclaimed of Redemption Interest unclaimed
Payment issued unclaimed Interest unclaimed (Rs. Lakhs) (Rs. Lakhs)
2004 Interest July 2004 349823 22721 6.5 10692.44 66.64 0.6
2005 Interest Jan. 2005 346555 22841 6.6 5336.17 28.39 0.5
2005 Redemption Jan. 2005 346555 21207 6.1 132074.63 675.37 0.5
f) Number and nature of complaints regarding shares
Chart B shows the complaints over the last five years. Table 9 gives the data on complaints regarding shares during theyear ended 31 December 2005.
Chart B : Complaints
0
200
400
600
800
1000
1200
20052004200320022001
1063
708749
279350
Table 9 : Details of complaints regarding shares for the year 2005
Nature of complaint No. of complaints No. redressedNon-receipt of dividend 156 151
Non-receipt of shares lodged for Transfer 139 134
Others 55 55
Total 350 340
All the unresolved complaints were received in December 2005 and have been progressed further for resolution.
Reasons for increase in the Grievances1) Some of the grievances are relating to Major Corporate Action viz., Bonus Debentures Redemption effected to
3.6 lakhs holders on 1.1.2005. 2) Cluster of Corporate Activities during the year viz., Postal Ballot Communication in May 2005 and Court Convened
Meetings in July 2005 and October 2005 has enabled the investors to bring their grievances which were otherwisedormant for resolution.
3) Correspondence also generated on account of reminders forwarded across all the dormant transmission cases wherethe documentation was not complete for resolution.

2005
HINDUSTAN LEVER LIMITED
43
Basis for preparation of accountsThe accounts have been prepared to comply in all materialaspects with applicable accounting principles in India, theAccounting Standards issued by the Institute of CharteredAccountants of India and the relevant provisions of theCompanies Act, 1956.Revenue RecognitionSales are recognised when goods are supplied and arerecorded net of trade discounts, rebates, sales taxes andexcise duties (on goods manufactured and outsourced) butinclude, where applicable, export incentives such as dutydrawbacks and premiums on sale of import licences.It does not include inter-divisional transfers.Income from Property Development Activity is recognisedin terms of arrangements with developers, where applicable.Income from services rendered is booked based onagreements/arrangements with the concerned parties.Interest on investments is booked on a time proportion basistaking into account the amounts invested and the rate ofinterest.Dividend income on investments is accounted for whenthe right to receive the payment is established.ExpenditureExpenses are accounted for on accrual basis and provisionis made for all known losses and liabilities.Advertising expenses are charged against the profit of theyear to which the activities relate.Revenue expenditure on research and development ischarged against the profit of the year in which it is incurred.Capital expenditure on research and development is shownas an addition to fixed assets.Fixed AssetsFixed assets are stated at cost less accumulated depreciation.Depreciation is provided (except in the case of leaseholdland which is being amortised over the period of the lease)on the straight line method and at the rates and in themanner specified in Schedule XIV of the Companies Act,1956. However,- certain employee perquisite-related assets are
depreciated over four to six years, the period of theperquisite scheme.
- computers and related assets are depreciated over fouryears.
- certain assets of the cold chain are depreciated overfour/seven years and
- motor vehicles are depreciated over six years.Assets identified and evaluated technically as obsolete andheld for disposal are stated at their estimated net realisablevalues.Goodwill and other Intangible AssetsIntangible assets are stated at cost of acquisition lessaccumulated amortisation.Goodwill and other Intangible assets (except computersoftware) are amortised over the assets useful life notexceeding 10 years.Computer software is amortised over a period of 5 years onthe straight line method.Impairment of AssetsImpairment loss, if any, is provided to the extent, the carryingamount of assets exceeds their recoverable amount.Recoverable amount is higher of an asset's net selling priceand its value in use. Value in use is the present value ofestimated future cash flows expected to arise from thecontinuing use of an asset and from its disposal at the endof its useful life.
InvestmentsInvestments are classified into current and long terminvestments. Current investments are stated at the lower ofcost and fair value.Long-term investments are stated at cost. A provision fordiminution is made to recognise a decline, other thantemporary, in the value of long-term investments.InventoriesInventories are valued at the lower of cost, computed on aweighted average basis, and estimated net realisable value,after providing for cost of obsolescence and otheranticipated losses, wherever considered necessary.Finished goods and work-in-progress include costs ofconversion and other costs incurred in bringing theinventories to their present location and condition.Sundry Debtors and Loans and AdvancesSundry debtors and Loans and Advances are stated aftermaking adequate provisions for doubtful balances.ProvisionsA provision is recognised when there is a present obligationas a result of a past event, it is probable that an outflow ofresources will be required to settle the obligation and inrespect of which reliable estimate can be made. Provisionis not discounted to its present value and is determinedbased on the best estimate required to settle the obligationat the year end date. These are reviewed at each year enddate and adjusted to reflect the best current estimate.Retirement/Post Retirement BenefitsContributions to defined contribution schemes such asProvident Fund and Family Pension Fund are charged tothe profit and loss account as incurred. The Company alsoprovides for retirement/post-retirement benefits in the formof gratuity, pensions, leave encashment and medical. Suchbenefits are provided for based on valuations, as at thebalance sheet date, made by independent actuaries.Taxes on IncomeCurrent tax is determined as the amount of tax payable inrespect of taxable income for the period.Deferred tax is recognised, subject to the consideration ofprudence, on timing differences, being the differencebetween taxable income and accounting income thatoriginate in one period and are capable of reversal in oneor more subsequent periods. Deferred tax assets are notrecognised on unabsorbed depreciation and carry forwardof losses unless there is virtual certainty that sufficient futuretaxable income will be available against which suchdeferred tax assets can be realised.Foreign Currency TranslationsForeign currency transactions are accounted for at theexchange rates prevailing at the date of the transaction.Gains and losses resulting from the settlement of suchtransactions and from the translation of monetary assetsand liabilities denominated in foreign currencies arerecognised in the profit and loss account. Exchangedifferences relating to fixed assets are adjusted in the costof the asset.Segment ReportingThe accounting policies adopted for segment reporting arein line with the accounting policies of the Company withthe following additional policies for segment reporting :a) Inter segment revenue have been accounted for based
on the transaction price agreed to between segmentswhich is primarily market led.
b) Revenue and expenses have been identified tosegments on the basis of their relationship to theoperating activities of the segment.
Revenue and expenses, which relate to the enterprise as awhole and are not allocable to segments on a reasonablebasis, have been included under "Unallocated corporateexpenses".
Significant Accounting Policies
HLL_A-R 2k5 (43-67).PMD 27/04/2006, 12:06 AM43

HINDUSTAN LEVER LIMITED
200544
Figures in brackets represent deductions
2005 2004Notes Rs. lakhs Rs. lakhs
INCOME
Sales 1 11060,54.62 9926,94.64Other income 2 304,78.65 318,83.38
Total 11365,33.27 10245,78.02
EXPENDITURE
Operating expenses 3 - 5 (9,617,21.50) (8489,57.90)Depreciation (124,45.32) (120,89.94)Interest 6 (19,19.31) (129,98.43)
Total (9760,86.13) (8740,46.27)
PROFIT BEFORE TAXATION AND EXCEPTIONAL ITEMS 1604,47.14 1505,31.75
Taxation for the year – current tax 9 (223,00.00) (266,00.00)– deferred tax (41,00.00) (54,73.62)– fringe benefit tax (30,00.00) –
Taxation adjustments of previous years (net) 19 44,03.67 14,69.52
PROFIT AFTER TAXATION AND BEFORE EXCEPTIONAL ITEMS 1354,50.81 1199,27.65
Exceptional items (net of tax) 13 53,59.63 (1,93.28)
NET PROFIT 1408,10.44 1197,34.37Balance brought forward 644,79.91 818,60.74
Available for distribution 2052,90.35 2015,95.11
Dividends :
On equity shares :
Interim - Rs. 2.50 per share - declared on 30th July, 2005 (550,31.09) (550,31.09)
Final - Rs. 2.50 per share - proposed (550,31.09) (550,31.09)
Tax on distributed profits [includes differential Rs. 5,26.23 lakhson final dividend for 2004] (159,62.46) (145,53.02)
Transfer to General Reserve (142,00.00) (125,00.00)
Balance carried forward 650,65.71 644,79.91
Earnings Per Share (Rs.) - Basic & Diluted (Face value of Re.1 each) 17 6.40 5.44
Profit and Loss Account for the year ended 31st December, 2005
For notes, statements, additional information, segment Signatures to pages : 43, 44, 47 to 49,information, related party disclosures and accounting policies 63 to 66 and 68 to 76See pages: 43, 47 to 49, 63 to 66 and 68 to 76In terms of our report of even date
Sharmila A. KarvePartner M.K. Sharma Vice ChairmanMembership No. 43229 D. Sundaram Finance DirectorFor and on behalf of Raju Thomas Vice President - FinanceLOVELOCK & LEWES Ashok Gupta Company SecretaryChartered Accountants
Mumbai : 14th February, 2006 Mumbai : 14th February, 2006
HLL_A-R 2k5 (43-67).PMD 27/04/2006, 12:06 AM44

2005
HINDUSTAN LEVER LIMITED
45
Figures in brackets represent deductions
Schedule 2005 2004Rs. lakhs Rs. lakhs
SOURCES OF FUNDS
Shareholders’ fundsCapital 1 220,12.44 220,12.44Reserves and surplus 2 2085,50.16 1872,58.51
2305,62.60 2092,70.95
Loan fundsSecured loans 3 24,49.96 1453,05.78Unsecured loans 4 32,44.11 56,94.07 18,05.67 1471,11.45
2362,56.67 3563,82.40
APPLICATION OF FUNDS
Fixed assetsGross block 2375,11.02 2314,21.91Depreciation and impairment loss (989,61.28) (891,08.07)
Net block 5 1385,49.74 1423,13.84Capital work-in-progress 98,03.29 1483,53.03 94,42.22 1517,56.06
Investments 6 2014,19.84 2229,56.27
Deferred TaxDeferred Tax Assets 14 338,68.17 365,84.66Deferred Tax Liabilities 15 (118,53.71) 220,14.46 (139,84.61) 226,00.05
Current assets, loans and advances
Inventories 7 1321,76.91 1470,44.26Sundry debtors 8 522,82.85 489,26.97Cash and bank balances 9 355,03.19 698,04.80Other current assets 10 23,89.08 52,77.71Loans and advances 11 539,47.15 594,41.79
2762,99.18 3304,95.53
Current liabilities and provisions
Liabilities 12 (2959,42.98) (2590,79.14)Provisions 13 (1158,86.86) (1123,46.37)
(4118,29.84) (3714,25.51)
Net current assets (1355,30.66) (409,29.98)
2362,56.67 3563,82.40
Balance Sheet as at 31st December, 2005
For schedules, contingent liabilities, additional information, Signatures to pages : 43, 45, 50 to 62segment information, related party disclosures and 68 to 76and accounting policiesSee pages : 43, 50 to 62 and 68 to 76In terms of our report of even date
Sharmila A. KarvePartner M.K. Sharma Vice ChairmanMembership No. 43229 D. Sundaram Finance DirectorFor and on behalf of Raju Thomas Vice President - FinanceLOVELOCK & LEWES Ashok Gupta Company SecretaryChartered Accountants
Mumbai : 14th February, 2006 Mumbai : 14th February, 2006
HLL_A-R 2k5 (43-67).PMD 27/04/2006, 12:06 AM45

HINDUSTAN LEVER LIMITED
200546
2005 2004Rs. lakhs Rs. lakhs
A. Cash Flow from Operating Activities :Profit before taxation and exceptional items 1604,47.14 1505,31.75
Adjustments for :Depreciation 124,45.32 120,89.94Foreign exchange — (1.79)Loss / (Gain) on sale of fixed assets held for disposal — 21.64Surplus on disposal of investments (net) (27,79.27) (24,50.29)Provision / (reversal of provision) for diminution in value ofinvestments, net of cost over fair value of current investments (net) (1,10.94) (1,29.15)Deficit / (Surplus) on disposal of fixed assets (net) (4,65.73) 26,75.49Reversal of provision for losses on disposal of fixed assets (1,92.80) (37,09.74)Interest income (53,03.85) (93,53.73)Dividend income (71,46.33) (62,38.49)Interest expenditure 19,19.31 129,98.43
(16,34.29) 59,02.31Operating Profit before Working Capital Changes 1588,12.85 1564,34.06
Adjustments for :Trade and Other Receivables 33,83.25 120,58.50Inventories 147,62.64 (101,25.92)Trade Payables and Other Liabilities 329,37.26 (71,50.60)
510,83.15 (52,18.02)
Cash generated from operations 2098,96.00 1512,16.04Taxes paid (including fringe benefit tax) (net of refunds) (117,21.40) (164,40.98)Cash flow before exceptional items 1981,74.60 1347,75.06Compensation under voluntary separation schemes (9,29.72) (43,86.29)Amount paid for termination of sourcing arrangement (5,00.00) —Consideration received on sale of a long-term investment 50,68.51 —Payment made in respect of ice cream restructuring included in exceptional items — (2,28.75)Net Cash from Operating Activities A 2018,13.39 1301,60.02
B. Cash Flow from Investing Activities :Purchase of fixed assets (177,46.55) (323,77.55)Sale proceeds of Land included in exceptional items — 94,85.19Sale of fixed assets 26,06.39 35,49.11Capital Subsidy received 5.00 4.50Purchase of investments (7523,74.00) (8203,18.31)Sale of investments 7901,25.49 8546,64.78Consideration received on disposal of a subsidiary company 6.18 —Consideration received on sale of Functionalised Bio-polymers business 4,15.00 —Consideration received on transfer of Sewri Undertaking to Bon Limited 8,33.78 —Interest received 71,38.39 104,22.46Dividend received 76,06.68 60,73.89Net Cash used in Investing Activities B 386,16.36 315,04.07
C. Cash Flow from Financing Activities :Dividends paid (1099,99.08) (1208,67.58)Tax on distributed profits (154,36.22) (159,92.02)Interest paid (78,30.08) (123,27.02)Bank overdrafts, etc. (net) (4,35.88) 9,23.01Proceeds from borrowings 563,86.66 585,63.00Repayment of debentures (1320,74.63) —Repayments of borrowings (654,36.26) (828,05.00)
Net Cash used in Financing Activities C (2748,25.49) (1725,05.61)Net Increase / (Decrease) in Cash and Cash equivalents (A+B+C) (343,95.74) (108,41.52)
Cash and Cash equivalents as at 1st January 698,04.86 806,46.38(Opening Balance)Cash and Cash equivalents as at 1st January, 2005 of International Fisheres Limited, 28.73 —Merryweather Food Products Limited and Lipton India Exports LimitedCash and Cash equivalents as at 1st April, 2005 of Lever India Exports Limited 65.34 —and TOC Disinfectants LimitedCash and Cash equivalents as at 31st December 355,03.19 698,04.86(Closing Balance)
Cash Flow Statement for the year ended 31st December, 2005
For notes Signatures to pages : 46 and 67See page : 67In terms of our report of even date
Sharmila A. KarvePartner M.K. Sharma Vice ChairmanMembership No. 43229 D. Sundaram Finance DirectorFor and on behalf of Raju Thomas Vice President - FinanceLOVELOCK & LEWES Ashok Gupta Company SecretaryChartered AccountantsMumbai : 14th February, 2006 Mumbai : 14th February, 2006
HLL_A-R 2k5 (43-67).PMD 27/04/2006, 12:06 AM46

2005
HINDUSTAN LEVER LIMITED
47
2005 2004Rs. lakhs Rs. lakhs
INCOME
1. Sales 11975,52.67 10888,37.69Less : Excise duty (914,98.05) (961,43.05)
11060,54.62 9926,94.64
Sales include duty drawback and licence premium on exports 12,98.69 17,25.80
2. Other incomeIncome from services rendered 131,39.86 106,76.82Income from property development activity 1,93.91 1,57.96Interest income - bank and other accounts (gross) 25,52.28 42,44.67(Tax deducted at source Rs. 8,23.84 lakhs; 2004 - Rs.6,23.99 lakhs)Interest income - non trade (gross) (Note 7) 19,92.06 50,21.80(Tax deducted at source Rs. 86.61 lakhs; 2004 - Rs. 2,15.25 lakhs)Interest income - Subsidiary - long-term (gross) 7,59.51 87.26(Tax deducted at source Rs. 19.64 lakhs; 2004 - Rs. 17.94 lakhs)Dividend income - trade - long-term (gross) 10,45.80 11,20.30Dividend income - non trade - long-term (gross) — 11.10Dividend income - non trade - current (gross) 33,59.13 16,91.74Dividend income - Subsidiaries - long-term (gross) 27,41.40 34,15.35(Tax deducted at source Rs. 1,15.08 lakhs; 2004 - Rs. 23.02 lakhs)Surplus on disposal of investments (net) (Note 8) 27,79.27 24,50.29Surplus on fixed assets sold etc. (net) 4,65.73 —Miscellaneous income 14,49.70 30,06.09
304,78.65 318,83.38OPERATING EXPENSES3. Materials consumed and Purchase of goods
Raw materials consumed 3554,76.32 3126,57.94Packing materials consumed 945,33.97 758,23.96Purchase of goods 1613,90.77 1472,39.26
4. General expenditureSalaries, wages, bonus, etc. including compensation under voluntary separation schemes 517,53.90 505,97.47Contribution to provident and other funds 35,83.14 30,59.70Workmen and staff welfare expenses 37,94.55 38,27.17Processing charges 141,15.11 145,90.30Consumption of stores and spare parts 56,96.75 56,55.89Repairs and maintenance – Buildings 11,14.56 15,53.33
– Plant 50,66.95 47,69.53– Others 6,25.56 7,10.87
Power, light, fuel and water 168,74.42 164,77.04Rent (Note 16) 91,85.31 39,96.98Rates and taxes 148,04.49 131,92.55Insurance 7,64.14 8,41.81Advertising and sales promotion 1005,67.35 835,98.03Carriage and freight 573,79.69 494,80.22Agents’ commission and brokerage 5,82.26 6,87.13Provision / (write back) for doubtful debts and advances (net) (7,37.82) (11,16.08)Travelling and motor car expenses 122,15.66 116,25.60Deficit on fixed assets sold, scrapped, etc. (net) — 26,75.49Miscellaneous expenses (Note 12) 489,14.63 428,26.93Expenses shared by certain current and erstwhile subsidiary companies (7,92.38) (12,99.87)for use of common facilities
5. StocksOpening stocks : – Work-in-progress 45,62.72 58,04.28
– Processed chemicals 1,09.07 1,71.50– Finished goods 590,39.76 654,04.60
Adjustment to stocks :– As at 1st January, 2005 of Merryweather Food
Products Limited {Note 14(i)} 11.60 —– As at 1st April, 2005 Lever India Exports
Limited {Note 14(i)} 2,66.21 —– As at 1st April, 2005 TOC Disinfectants
Limited {Note 14(i)} 2,28.95 —Closing stocks : – Work-in-progress (26,29.71) (45,62.72)
– Processed chemicals (91.82) (1,09.07)– Finished goods (534,10.04) (590,39.76)
Excise Duty on Increase/(Decrease) of Finished goods (32,74.57) (21,82.18)
9617,21.50 8489,57.90
Notes to Profit and Loss Account
HLL_A-R 2k5 (43-67).PMD 27/04/2006, 12:06 AM47
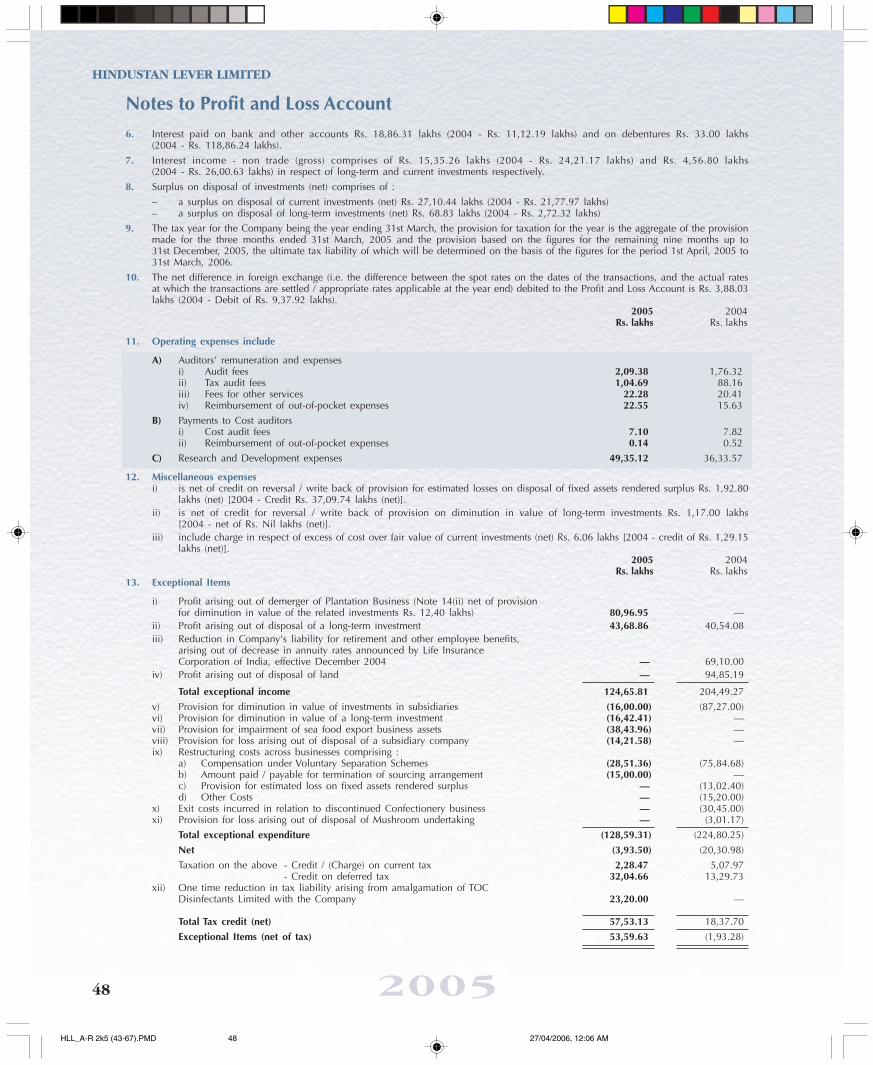
HINDUSTAN LEVER LIMITED
200548
Notes to Profit and Loss Account6. Interest paid on bank and other accounts Rs. 18,86.31 lakhs (2004 - Rs. 11,12.19 lakhs) and on debentures Rs. 33.00 lakhs
(2004 - Rs. 118,86.24 lakhs).7. Interest income - non trade (gross) comprises of Rs. 15,35.26 lakhs (2004 - Rs. 24,21.17 lakhs) and Rs. 4,56.80 lakhs
(2004 - Rs. 26,00.63 lakhs) in respect of long-term and current investments respectively.8. Surplus on disposal of investments (net) comprises of :
– a surplus on disposal of current investments (net) Rs. 27,10.44 lakhs (2004 - Rs. 21,77.97 lakhs)– a surplus on disposal of long-term investments (net) Rs. 68.83 lakhs (2004 - Rs. 2,72.32 lakhs)
9. The tax year for the Company being the year ending 31st March, the provision for taxation for the year is the aggregate of the provisionmade for the three months ended 31st March, 2005 and the provision based on the figures for the remaining nine months up to31st December, 2005, the ultimate tax liability of which will be determined on the basis of the figures for the period 1st April, 2005 to31st March, 2006.
10. The net difference in foreign exchange (i.e. the difference between the spot rates on the dates of the transactions, and the actual ratesat which the transactions are settled / appropriate rates applicable at the year end) debited to the Profit and Loss Account is Rs. 3,88.03lakhs (2004 - Debit of Rs. 9,37.92 lakhs).
2005 2004Rs. lakhs Rs. lakhs
11. Operating expenses include
A) Auditors’ remuneration and expensesi) Audit fees 2,09.38 1,76.32ii) Tax audit fees 1,04.69 88.16iii) Fees for other services 22.28 20.41iv) Reimbursement of out-of-pocket expenses 22.55 15.63
B) Payments to Cost auditorsi) Cost audit fees 7.10 7.82ii) Reimbursement of out-of-pocket expenses 0.14 0.52
C) Research and Development expenses 49,35.12 36,33.57
12. Miscellaneous expensesi) is net of credit on reversal / write back of provision for estimated losses on disposal of fixed assets rendered surplus Rs. 1,92.80
lakhs (net) [2004 - Credit Rs. 37,09.74 lakhs (net)].ii) is net of credit for reversal / write back of provision on diminution in value of long-term investments Rs. 1,17.00 lakhs
[2004 - net of Rs. Nil lakhs (net)].iii) include charge in respect of excess of cost over fair value of current investments (net) Rs. 6.06 lakhs [2004 - credit of Rs. 1,29.15
lakhs (net)].2005 2004
Rs. lakhs Rs. lakhs13. Exceptional Items
i) Profit arising out of demerger of Plantation Business (Note 14(ii) net of provisionfor diminution in value of the related investments Rs. 12,40 lakhs) 80,96.95 —
ii) Profit arising out of disposal of a long-term investment 43,68.86 40,54.08iii) Reduction in Company's liability for retirement and other employee benefits,
arising out of decrease in annuity rates announced by Life InsuranceCorporation of India, effective December 2004 — 69,10.00
iv) Profit arising out of disposal of land — 94,85.19
Total exceptional income 124,65.81 204,49.27v) Provision for diminution in value of investments in subsidiaries (16,00.00) (87,27.00)vi) Provision for diminution in value of a long-term investment (16,42.41) —vii) Provision for impairment of sea food export business assets (38,43.96) —viii) Provision for loss arising out of disposal of a subsidiary company (14,21.58) —ix) Restructuring costs across businesses comprising :
a) Compensation under Voluntary Separation Schemes (28,51.36) (75,84.68)b) Amount paid / payable for termination of sourcing arrangement (15,00.00) —c) Provision for estimated loss on fixed assets rendered surplus — (13,02.40)d) Other Costs — (15,20.00)
x) Exit costs incurred in relation to discontinued Confectionery business — (30,45.00)xi) Provision for loss arising out of disposal of Mushroom undertaking — (3,01.17)
Total exceptional expenditure (128,59.31) (224,80.25)Net (3,93.50) (20,30.98)Taxation on the above - Credit / (Charge) on current tax 2,28.47 5,07.97
- Credit on deferred tax 32,04.66 13,29.73xii) One time reduction in tax liability arising from amalgamation of TOC
Disinfectants Limited with the Company 23,20.00 —
Total Tax credit (net) 57,53.13 18,37.70Exceptional Items (net of tax) 53,59.63 (1,93.28)
HLL_A-R 2k5 (43-67).PMD 27/04/2006, 12:06 AM48

2005
HINDUSTAN LEVER LIMITED
49
Notes to Profit and Loss Account14. i) Pursuant to the Scheme of arrangement for amalgamation of the erstwhile subsidiaries, International Fisheries Limited, Lipton India
Exports Limited, and Merryweather Foods Products Limited with effect from 1st January, 2005; and Lever India Exports Limited andTOC Disinfectants Limited with effect from 1st April, 2005, as approved by the shareholders in the Court-convened meeting heldon 29th July, 2005 and subsequently sanctioned by the Honourable High Court of Bombay on 25th November, 2005, the assetsand liabilities of these subsidiaries were transferred to and vested in the Company with effect from the dates aforementioned. TheScheme has accordingly been given effect to in these accounts. The amalgamation has been accounted for under the pooling ofinterests method as prescribed by Accounting Standard (AS-14) issued by the Institute of Chartered Accountants of India. Accordingly,the assets, liabilities and other reserves of the erstwhile subsidiaries as at the aforementioned dates have been taken over at theirbook values, subject to adjustments made for the differences in the accounting policies between the Companies and / or as specifiedin the schemes. Refer note 2 on Schedule 1 to the Balance Sheet.
ii) Pursuant to the Scheme of arrangement for demerger of the Doom Dooma and TEI plantation divisions of the Company to itssubsidiaries with effect from 1st April, 2005, as approved by the shareholders in the Court-convened meeting held on 29th July,2005 and subsequently sanctioned by the Honourable High Court of Bombay on 7th October, 2005, the assets and liabilities ofthe divisions were transfered to the subsidiaries for a consideration in the form of equity shares, redeemable preference shares andsecured debt instruments. Profit arising from the demerger has been accounted for as exceptional item. (Refer note 13(i))
iii) The Company has transferred its Sewri Undertaking to Bon Limited, a wholly owned subsidiary company as a going concern at bookvalues with effect from 17th July, 2005.
iv) Functionalised Bio-polymers Business (FBP) was sold effective 1st September, 2005.
v) In view of the above, the current year’s figures are accordingly, not comparable to those of the previous year.
15. The cost of property development activity including movements in work-in-progress are as under :
2005 2004Rs. lakhs Rs. lakhs
Property Development Activity — Work-in-progress as at 1st January 46.09 65.09Add : Opening Work-in-progress of Lever India Exports Limited 2.38
Miscellaneous expenses 6.55 8.93 5.07
55.02 70.16Less : Property Development Activity — Work-in-progress as at 31st December 48.77 46.09
Cost of property sold / donated, included in miscellaneous expenses 6.25 24.07
16. Rent is net of write back of provision made in earlier years arising out of Supreme Court decision in respect of a legal disputeRs. Nil lakhs (2004 — Rs. 41,59.85 lakhs).
17. Earnings Per Share has been computed as under : 2005 2004
Net Profit (Rs. lakhs) 1408,10.44 1197,34.37Weighted average number of Equity shares outstanding 2,20,12,43,793 2,20,12,43,793Earnings Per Share (Rs.) — Basic and Diluted(Face value of Re.1 per share) 6.40 5.44
18. The Company’s significant leasing arrangements are in respect of operating leases for premises (residential, office, stores, godown, etc.)and computers. These leasing arrangements which are not non-cancellable range between 11 months and 10 years generally, or longer,and are usually renewable by mutual consent on mutually agreeable terms. The aggregate lease rentals payable are charged as Rent undernote 4 to profit and loss account.
19. Taxation adjustments of previous years include interest, etc.
20. During the year, the Company has utilised provision made in an earlier year for restructuring of the ice cream business as follows :
2005 2004Rs. lakhs Rs. lakhs
Fixed assets write off 40.55 —Raw / Packing materials — 0.61Other items — 2,28.14
40.55 2,28.75
21. For information on Joint Ventures refer Schedule 21 to the Balance Sheet.
22. Previous year’s figures have been regrouped/restated wherever necessary to conform to this year’s classification.
HLL_A-R 2k5 (43-67).PMD 22/04/2006, 7:48 PM49

HINDUSTAN LEVER LIMITED
200550
2005 2004Rs. lakhs Rs. lakhs
1. CAPITALAuthorised2,25,00,00,000 equity shares of Re. 1 each 225,00.00 225,00.00Issued and subscribed2,20,12,43,793 equity shares of Re. 1 each fully called and paid up 220,12.44 220,12.44Of the above shares(i) 1,13,48,49,460 Shares of Re. 1 each are held by Unilever PLC.,
the holding company, and its subsidiaries including79,48,06,750 shares of Re. 1 each held by Unilever PLC.
(ii) 79,19,31,203 Shares of Re. 1 each are allotted as fully paid up pursuantto a contract for a consideration other than cash
(iii) 1,31,68,54,620 Shares of Re. 1 each are allotted as fully paid up bonus shares byway of capitalisation of share premium and accumulated profits
220,12.44 220,12.44Notes :
1. The Company has granted share options under the Company’s Employees’ Stock Option Scheme and share options outstanding as at31st December, 2005 are 1,19,32,145 (2004 - 1,06,48,225). Of these 21,74,400 (2004 - 21,99,200) options have vested in 2004,28,62,905 (2004 - 29,15,285) have vested in 2005, 38,51,990 will vest in 2006 (2004 - 39,59,390), 15,08,350 in 2007 (2004 -15,74,350) and 15,34,500 in 2008 (2004 - Nil).
2. Pursuant to the Scheme of arrangement for amalgamation referred to in note 14(i) of the Profit and Loss account, 2,268 equityshares of Re. 1 each are due to be issued to the minority shareholders of International Fisheries Limited and TOC DisinfectantsLimited.
2. RESERVES AND SURPLUS Rs. lakhsAs at Adjustments As at
31st December, of Amalgamation Additions Deductions 31st December,2004 {Note 14(i)} 2005
CAPITAL RESERVESCapital Reserve 4,16.81 5.42 — — 4,22.23Capital Subsidy 3,29.43 — 5.00 — 3,34.43Capital Redemption Reserve 1,15.00 — — — 1,15.00Share Premium Account 263,26.13 — — — 263,26.13Revaluation Reserve 66.59 — — — 66.59Other Reserves (c) 2,51.05 — — — 2,51.05Employee Stock Options (d) 4,09.67 — 38.37 — 4,48.04Total Capital Reserves 279,14.68 5.42 43.37 — 279,63.47
REVENUE RESERVESExport Profit Reserve 12,21.95 — — — 12,21.95Development Allowance Reserve 26.72 — — — 26.72General Reserve 936,15.25 64,57.06 (a) 142,00.00 — 1142,72.31
Total Revenue Reserves 948,63.92 64,57.06 142,00.00 — 1155,20.98
PROFIT AND LOSS ACCOUNT BALANCE 644,79.91 — (a) 650,65.71 (b) (644,79.91) 650,65.71
TOTAL RESERVES – 31st December, 2005 1872,58.51 64,62.48 793,09.08 (644,79.91) 2085,50.16
TOTAL RESERVES – 31st December, 2004 1918,60.16 772,59.09 (818,60.74) 1872,58.51
(a) Transfer from profit and loss account.(b) Transfer to profit and loss account.(c) Not available for capitalisation / declaration of dividend / share valuation.(d) In respect of options granted under the Company's stock option scheme, in accordance with guidelines issued by Securities and Exchange
Board of India, the accounting value of options (based on market price of the share on the date of the grant of the option) is accountedas deferred employee compensation, which is amortised on a straight line basis over the vesting period. Consequently salaries, wages,bonus, etc. includes Rs. 38.37 lakhs (2004 - Rs. 2,03.80 lakhs) being amortisation of deferred employee compensation after adjustingfor reversals on account of options lapsed.
Employee Stock OptionsAs at As at
31st December, Additions Deductions 31st December,2004 2005
Employee Stock Options Outstanding 4,48.04 — — 4,48.04Less :- Deferred Employee Compensation (38.37) — 38.37 —
Employee Stock Options 4,09.67 — 38.37 4,48.04
Schedules to Balance Sheet
Rs. lakhs
HLL_A-R 2k5 (43-67).PMD 22/04/2006, 7:48 PM50

2005
HINDUSTAN LEVER LIMITED
51
2005 2004Rs. lakhs Rs. lakhs
3. SECURED LOANS9% Secured Redeemable Non Convertible Debentures of the face value of Rs. 6 each – 1320,74.63
Debentures held by :Directors - Rs. Nil (2004 - Rs. 6.21 lakhs)The Secretary - Rs. Nil (2004 - Rs. 0.08 lakh)
Loans and Advances from Banks :– Bank overdrafts 24,49.96 41,81.53
Secured by hypothecation of stocks, book debts, etc.– Export Packing Credit – 90,49.62
Secured by a pari passu charge on certain current assets
24,49.96 1453,05.78
4. UNSECURED LOANSShort-term loans and advances :From Banks– Overdrawn book balance on current account 28,69.05 13,67.45Other loans and advances
Other than from banks 3,75.06 4,38.22(repayable before 31st December, 2006 - Rs. 13.37 lakhs; 2005 - Rs. 4.46 lakhs)
32,44.11 18,05.67
Schedules to Balance Sheet
5. FIXED ASSETSRs. lakhs
GROSS BLOCK DEPRECIATION NET BLOCK
Cost/ Cost taken over Deductions/ Cost/ As at Depreciation taken Deductions/ As at As at As at Valuation as at consequent to Additions Transfers Valuation as at 31st over consequent Additions Transfers Impairment 31st 31st 31st31st December, amalagamation {d(ii)} 31st December, December, to amalgamation {d(ii)} for the year December, December, December,
2004 {d (i)} 2005 2004 {d(i)} (f) 2005 2005 2004
Land – Freehold 59,73.16 2,69.62 29.93 (7,17.35) 55,55.36 — — — — — — 55,55.36 59,73.16
– Leasehold 41,78.17 — 1,08.21 (8,07.43) 34,78.95 2,12.62 — 26.78 — — 2,39.40 32,39.55 39,65.55
Buildings (a) 569,66.16 8,33.21 33,76.94 (34,92.46) 576,83.85 96,62.50 1,03.26 14,52.20 (13,37.20) 11,44.08 110,24.84 466,59.01 473,03.66
Plant & machinery 1226,31.66 16,82.17 127,09.53 (67,31.34) 1302,92.02 468,70.19 5,28.25 91,44.44 (36,24.81) 21,33.51 550,51.58 752,40.44 757,61.47
Railway sidings 0.59 — — — 0.59 0.59 — — — — 0.59 — —
Furniture, fittings& office equipment 205,18.25 29.90 7,49.74 (20,60.63) 192,37.26 137,04.52 17.07 12,20.57 (16,84.01) 24.74 132,82.89 59,54.37 68,13.73
Trade Marks 165,49.11 — — — 165,49.11 163,49.10 — — — 2,00.01 165,49.11 — 2,00.01
Goodwill 6,34.15 5,48.14 — — 11,82.29 2,92.53 5,48.14 — — 3,41.62 11,82.29 — 3,41.62
Software — — 7,76.68 — 7,76.68 — — 1,55.33 — — 1,55.33 6,21.35 —
Motor vehicles 39,70.66 3.55 2,31.52 (14,50.82) 27,54.91 20,16.02 1.12 4,46.00 (9,87.89) — 14,75.25 12,79.66 19,54.64
Total – 2005 2314,21.91 33,66.59 179,82.55 (152,60.03) 2375,11.02 891,08.07 11,97.84 124,45.32 (76,33.91) 38,43.96 989,61.28 1385,49.74 1423,13.84
– 2004 2141,71.54 — 305,67.76 133,17.39 2314,21.91 846,08.96 — 120,89.94 (75,90.83) — 891,08.07 1423,13.84
NOTES : (a) Buildings include Rs. 2.52 lakhs (2004 - Rs. 2.53 lakhs) being the value of shares in co-operative housing societies.(b) The title deeds of immovable properties aggregating Rs. 43,36.32 lakhs (2004 - Rs. 38,66.44 lakhs), acquired on transfer of business / undertakings are in the process of being
transferred in the name of the Company.(c) Capital expenditure commitments - Rs. 30,30.89 lakhs (2004 - Rs. 28,65.74 lakhs).(d) (i) Taken over, pursuant to the Scheme of arrangement for Amalgamation of InternationaL Fisheries Limited, Lipton India Exports Limited, Merryweather Food Products Limited
effective 1st January, 2005 and TOC Disinfectants Limited, Lever India Exports Limited effective 1st April, 2005.(ii) Includes transfers, pursuant to the schemes of arrangement for demerger of Doom Dooma and TEI Plantation divisions to subsidiaries.
(e) Under the Gudalur Janmam Estates (Abolition and Conversion into Ryotwari) Act, 1969, the right and title to certain leasehold land may be altered at a later date, the natureand effect of which cannot be ascertained at present. However, appropriate steps have been taken to protect the Company’s interest.
(f) The impairment of sea food exports business assets is charged to exceptional items (refer note 13 (vii) of the Profit and Loss account).
HLL_A-R 2k5 (43-67).PMD 22/04/2006, 7:48 PM51

HINDUSTAN LEVER LIMITED
200552
Schedules to Balance Sheet2005 2004
Rs. lakhs Rs. lakhs6. INVESTMENTS
(Long-term, Unquoted, unless otherwise stated)
A. INVESTMENTS IN GOVERNMENT SECURITIES
7 Year National Savings Certificates - II Issue 1.05 1.05Government of India stock of the face value ofRs. 2,00.00 lakhs (2004 - Rs. 27,00.00 lakhs) 225.59 27,67.81(Current Investments) (quoted)Treasury Bills of the face value of Rs. 134,00.00 lakhs 128,59.77 168,46.35(2004 - Rs. 170,00.00 lakhs) (Current Investments)Treasury Bills of the face value of Rs. 20,00.00 lakhs — —(2004 - Nil) (Current Investments)[taken over (refer note 14(i)) and sold during the year]Treasury Bills of the face value of Rs. 17,76.00 lakhs — —(2004 - Nil) (Current Investments)[taken over (refer note 14(i)) and sold during the year]Certificates of Deposit of the face value ofRs. 160,00.00 lakhs (2004 - Rs. Nil ) (Current Investments) 155,81.43 —
TOTAL - A 286,67.84 196,15.21
B. INVESTMENTS IN SUBSIDIARY COMPANIES AT COSTSHARES AND DEBENTURES
Unilever India Exports Limited 25,10,000 Equity shares of Rs.10 each fully paid 2,51.00 2,51.00(formerly Indexport Limited)Levers Associated Trust Limited 50,000 Ordinary shares of Rs.10 each fully paid 5.00 5.00Levindra Trust Limited 50,000 Ordinary shares of Rs.10 each fully paid 5.00 5.00Hindlever Trust Limited 50,000 Ordinary shares of Rs.10 each fully paid 5.00 5.00Unilever Nepal Limited 7,36,560 Equity shares of Nepalese Rs.100 each fully paid 4,60.00 4,60.00(formerly Nepal Lever Limited)Lever India Exports Limited — (2004-30,000) Equity shares of Rs.100 each fully paid — 70.35
(Refer note 14(i))International Fisheries Limited — (2004-2,96,240) Equity shares of Rs.100 each fully paid — 2,94.73
(Refer note 14(i))Lipton India Exports Limited — (2004-4,80,000) Equity shares of Rs.100 each fully paid — 24.00
(Refer note 14(i))Bon Limited 10,45,000 (2004-50,000) Equity shares of Rs.10 each fully paid 10,00.00 5.00
(9,95,000 shares purchased during the year)Doom Dooma Tea Company Limited 5,00,000 (2004-12,000) Ordinary shares of Rs.100 each fully paid 5,00.00 12.00(formerly Davershola Tea Company Limited) (Refer note 14(ii))
10,00,000 (2004-Nil) Redeemable Preference shares of Rs.100/- each 10,00.00 —(Refer note 14(ii))
58,12,000 (2004-Nil) 6% p.a. Secured Debentures of Rs.100/- each 58,12.00 —(Yet to be issued) (Refer note 14(ii))
Tea Estates India Limited (formerly 50,00,000 (2004-50,000) Ordinary shares of Rs.10 each fully paid 5,00.00 5.00 Thiashola Tea Company Limited) (Refer note 14(ii))
10,00,000 (2004-Nil) 0.5% Redeemable Preference shares of Rs.100/- each 10,00.00 —(Refer note 14(ii))
55,05,000 (2004-Nil) 6% p.a. Secured Debentures of Rs.100/- each 55,05.00 —(Yet to be issued) (Refer note 14(ii))
Unilever India Shared Services Limited 5,000 Ordinary shares of Rs.100 each fully paid 4.41 4.41(formerly Indigo Lever Shared Services Limited)Merryweather Food Products Limited — (2004-4,96,000) Equity shares of Rs.100 each fully paid — 5,08.00
(Refer note 14(i))— (2004-3,50,000) 5% Cumulative Redeemable Preference
shares of Rs. 100 each fully paid (Refer note 14(i)) — 3,50.00Pond's Exports Limited 98,00,147 Equity shares of Rs.10 each fully paid 9,80.01 9,80.01Hindustan Kwality Walls Foods 50,000 Equity shares of Rs.10 each fully paid 5.00 —Private Limited (Purchased during the year)Modern Food Industries (India) Limited 1,47,550 Equity shares of Rs.1,000 each 157,41.46 157,41.46
2,500 Secured Non-Convertible Redeemable Seven Years Debentures 25,00.00 25,00.00Coupon Rate 3.50% p.a. for first 36 months and 14.50% p.a.for next 48 months
Rossell Industries Limited — Equity shares of Rs. 10 each fully paid — —[61,85,642 Equity shares taken over (refer note 14(i)) andsold during the year]
TOTAL - B 352,73.88 212,20.96
HLL_A-R 2k5 (43-67).PMD 22/04/2006, 7:48 PM52

2005
HINDUSTAN LEVER LIMITED
53
Schedules to Balance Sheet2005 2004
Rs. lakhs Rs. lakhs6. INVESTMENTS (Contd...)
(Long-term, Unquoted, unless otherwise stated)
C. TRADE INVESTMENTS AT COSTSHARES
Tata Chemicals Limited 1,19,32,000 (2004-1,42,32,000) Equity shares of Rs.10 each fully paid (quoted) 36,29.63 43,29.27(23,00,000 shares sold during the year)
Dugdha Sahakari Kraya-Vikraya Samiti Limited 50 Shares of Rs.100 each fully paid 0.05 0.05Hi Tech Surfactants Limited 58,400 Equity shares of Rs.10 each fully paid 5.87 5.87Aquagel Chemicals Private Limited 2,84,040 Equity shares of Rs.100 each fully paid 2,65.56 2,65.56
9,13,000 7% Cumulative Redeemable Preference Shares of Rs.100 each fully paid 9,13.00 9,13.00Super Bazar Co-op. Stores Limited 1,000 Equity shares of Rs.10 each fully paid 0.10 0.10Vashisti Detergents Limited 1,69,04,140 Equity shares of Rs.10 each fully paid (quoted) 29,40.00 29,40.00Kimberly Clark Lever Private Limited 3,62,50,000 Equity shares of Rs.10 each fully paid 36,25.00 36,25.00Snowman Frozen Foods Limited 38,32,000 Equity shares of Rs.10 each fully paid 5,01.71 5,01.71Coffee Futures India Exchange Limited 1 Equity share of Rs.10,000 each fully paid 0.10 0.10Quest International India Limited 14,11,200 Equity shares of Rs.100 each fully paid 68,02.41 68,02.41Goldfield Fragrances Private Limited 7,164 Equity shares of Rs.100 each fully paid 2.40 2.40
TOTAL - C 186,85.83 193,85.47
D. NON-TRADE INVESTMENTS AT COSTSHARES, DEBENTURES & BONDS
Emergents Genetics India Private Limited — (2004-73,12,500) Equity shares of Rs.10 each fully paid — 8,41.66(formerly Paras Extra Growth Seeds Limited) (Sold during the year)Comfund Financial Services India Limited 2,40,000 Equity shares of Rs.10 each fully paid 24.00 24.00Assam Bengal Cereals Limited 8,284 Equity shares of Rs.10 each fully paid 0.83 0.83The Bengal Chamber of Commerce & Industry 14 6 1/2% Non-redeemable Registered Debentures 0.17 0.17
(Face value Rs. 0.14 lakh)Woodlands Hospital and 1 5% Non-redeemable Registered Debenture stock 0.27 0.27Medical Research Centre Limited (Face value Rs. 0.27 lakh)
44 1/2% Debentures of Rs.100 each (Face value Rs.0.05 lakh : Cost Rs.100) — —Shillong Club Limited 56 5% Debentures of Rs.100 each (Cost Rs.Nil) — —The Nilgiri Co-operative Enterprises Limited 200 Shares of Rs.100 each fully paid 0.20 0.20Biotech Consortium India Limited 1,00,000 Equity shares of Rs.10 each fully paid 10.00 10.00Scooters India Limited 10,000 Equity shares of Rs.10 each fully paid (Quoted) 1.00 1.00Annamallais Ropeway Company Limited 1,150 Ordinary shares of Rs.100 each fully paid (Cost Rs.Nil) — —Saraswat Co-operative Bank Limited 1,000 Equity shares of Rs.10 each fully paid 0.10 0.10
1,005 Equity shares of Rs.10 each fully paid(Taken over) (Refer note 14(i)) 0.10 —
National Bank for Agriculture — (2004-34,690) 8% Capital Gains Bonds of Rs.10,000 each — 34,69.00and Rural Development (Redeemed during the year)
15,500 5.25% Capital Gains Bonds of Rs.10,000 each 15,50.00 15,50.0017,484 5.25% Capital Gains Bonds of Rs.10,000 each (Purchased during the year) 17,48.39 —9,250 5.50% Capital Gains Bonds of Rs.10,000 each 9,25.00 9,25.00
870 5.20% Capital Gains Bonds of Rs.10,000 each (Purchased during the year) 87.00 —72,000 5.40% Capital Gains Bonds of Rs.10,000 each (Purchased during the year) 72,00.00 —13,500 5.20% Capital Gains Bonds of Rs.10,000 each (Purchased during the year) 13,50.00 —2,000 5.42% Capital Gains Bonds of Rs.10,000 each (Purchased during the year) 2,00.00 —
National Highways Authority of India — (2004-1,31,250) 8% Capital Gains Bonds of Rs.10,000 each — 131,25.00(Redeemed during the year)
National Housing Bank 50,000 5.50% Capital Gains Bonds 2002 of Rs.10,000 each 50,00.00 50,00.003,075 5.10% Capital Gains Bonds 2002 of Rs.10,000 each 3,07.50 3,07.50
OTHERSUnit Trust of India 48,77,837 Units of Rs.100 each under the 6.75% Tax Free US 64 Bonds 50,04.54 50,04.54
(Current Investments) (Quoted)Prudential ICICI Mutual Fund 1,00,00,000 Units Prudential ICICI Fixed Maturity Plan - S 25 - Yearly Plan - 10,00.00 —
Dec 05 - Dividend (1,00,00,000 Units Purchased during the year)(Current Investments)
— Units Prudential ICICI Floating Rate Fund - Plan C - Dividend — —(3,92,26,806 Units Purchased, 6,58,806 Units cumulated,3,98,85,612 Units sold during the year) (Current Investments)
4,01,13,373 Units Prudential ICICI Floating Rate Fund - Plan D - Dividend(3,99,01,962 Units Purchased, 2,11,411 Units cumulated during 40,10.34 —the year) (Current Investments)
1,46,00,399 Units Prudential ICICI Long Term Plan - Dividend (1,42,63,301 15,25.48 —Units Purchased, 3,37,098 Units cumulated during the year)(Current Investments)
HLL_A-R 2k5 (43-67).PMD 22/04/2006, 7:48 PM53

HINDUSTAN LEVER LIMITED
200554
Schedules to Balance Sheet2005 2004
Rs. lakhs Rs. lakhs6. INVESTMENTS (Contd...)
(Long-term, Unquoted, unless otherwise stated)
— Units Prudential ICICI Liquid - Institutional Plus - Daily Dividend — —(27,50,70,667 Units Purchased, 56,491 Units cumulated,27,51,27,158 Units sold during the year) (Current Investments)
1,25,11,745 (2004 - 21,16,17,030) Units Prudential ICICI Liquid - Institutional 21,00.00 333,00.00Plus - Growth (1,25,11,745 Units Purchased, 21,16,17,030Units sold during the year) (Current Investments)
— (2004 - 4,28,41,680) Units Prudential ICICI Liquid - Institutional — 51,06.24Plus - Monthly Dividend (47,21,20,809 Units Purchased, 58,69,856Units cumulated, 52,08,32,345 Units sold during the year)(Current Investments)
— (2004 - 14,61,22,962) Units Prudential ICICI Liquid - Institutional — 173,31.25Plus - Weekly Dividend (44,31,97,864 Units Purchased, 10,11,242Units cumulated, 59,03,32,068 Units sold during the year)(Current Investments)
— Units Prudential ICICI Liquid - Super Institutional Plan - Daily — —Dividend (1,00,00,000 Units Purchased, 1,310 Units cumulated,1,00,01,310 Units sold during the year) (Current Investments)
9,37,20,115 Units Prudential ICICI Liquid - Super Institutional Plan - Monthly 93,73.60 —Dividend (10,33,16,458 Units Purchased, 3,61,238 Units cumulated,99,57,581 Units sold during the year) (Current Investments)
1,71,43,141 Units Prudential ICICI Liquid - Super Institutional Plan - Weekly 17,15.14 —Dividend (20,02,82,092 Units Purchased, 4,14,332 Units cumulated,18,35,53,283 Units sold during the year) (Current Investments)
78,12,927 Units Prudential ICICI Short Term Institutional Plan - Growth 10,00.12 —(78,12,927 Units Purchased during the year) (Current Investments)
2,30,41,603 Units Prudential ICICI Short Term Institutional Plan - Monthly 25,29.44 —Dividend (3,18,16,739 Units Purchased, 3,04,961 Units cumulated,90,80,097 Units sold during the year) (Current Investments)
2,66,00,000 Units Prudential ICICI Fixed Maturity Plan - S 25 - Yearly Plan - 26,60.00 —December 05 - Dividend (2,66,00,000 Units Purchased duringthe year) (Current Investments)
— Units Prudential ICICI Floating Rate Fund - Plan C - Dividend — —(74,83,985 Units Purchased, 2,00,399 Units cumulated, 76,84,384Units sold during the year) (Current Investments)
77,28,264 Units Prudential ICICI Floating Rate Fund - Plan D - Dividend 7,72.83 —(76,87,532 Units Purchased, 40,732 Units cumulated during theyear) (Current Investments)
— Units Prudential ICICI Liquid - Institutional Plus - Daily Dividend — —(1,04,62,811 Units Purchased, 4,189 Units - cumulated,1,04,67,000 Units sold during the year) (Current Investments)
— Units Prudential ICICI Liquid - Institutional Plus - Weekly Dividend — —(3,59,71,123 Units Purchased, 81,118 Units cumulated,3,60,52,241Units sold during the year) (Current Investments)
— Units Prudential ICICI Liquid - Super Institutional Plan - Daily — —Dividend (60,00,000 Units Purchased, 786 Units cumulated,60,00,786 Units sold during the year) (Current Investments)
1,69,72,713 Units Prudential ICICI Liquid - Super Institutional Plan - Monthly 16,97.56 —Dividend (1,99,97,204 Units Purchased, 65,421 Units cumulated,30,89,912 Units sold during the year) (Current Investments)
47,67,810 Units Prudential ICICI Liquid - Super Institutional Plan - Weekly 4,76.96 —Dividend (1,07,55,306 Units Purchased, 10,239 Units cumulated,59,97,735 Units sold during the year) (Current Investments)
— Units Prudential ICICI Liquid Plan - Institutional Plus - Monthly — —Dividend (48,39,151 taken over (refer note 14(i)), 1,57,65,254 unitspurchased, 4,07,061 cumulated, 2,10,11,466 sold during the year)(Current Investments)
DSP Merrill Lynch Mutual Fund 1,50,00,000 Units DSP Merrill Lynch Fixed Term Plan - Series 1 - Dividend 15,00.00 —(1,50,00,000 Units Purchased during the year) (Current Investments)
3,00,00,000 Units DSP Merrill Lynch Fixed Term Plan - Series 1A - Dividend 30,00.00 —(3,00,00,000 Units Purchased during the year) (Current Investments)
— Units DSP Merrill Lynch Floating Rate Fund - Weekly Dividend — —(99,79,234 Units Purchased, 1,01,230 Units cumulated,1,00,80,464 Units sold during the year) (Current Investments)
— Units DSP Merrill Lynch Liquidity Fund - Dividend (4,43,32,678 — —Units Purchased, 97,239 Units cumulated, 4,44,29,917 Units soldduring the year) (Current Investments)
HLL_A-R 2k5 (43-67).PMD 22/04/2006, 7:48 PM54

2005
HINDUSTAN LEVER LIMITED
55
Schedules to Balance Sheet2005 2004
Rs. lakhs Rs. lakhs6. INVESTMENTS (Contd...)
(Long-term, Unquoted, unless otherwise stated)— Units DSP Merrill Lynch Liquidity Fund - Daily Dividend — —
(49,95,005 Units Purchased, 633 Units cumulated, 49,95,638 Units sold during the year) (Current Investments)
— Units DSP Merrill Lynch Liquidity Fund - Institutional Plan - Daily — —Dividend (2,39,953 Units Purchased, 256 Units cumulated,2,40,209 Units sold during the year) (Current Investments)
2,42,965 Units DSP Merrill Lynch Liquidity Fund - Institutional Plan - Weekly 24,30.53 —Dividend (6,40,983 Units Purchased, 1,664 Units cumulated,3,99,682 Units sold during the year) (Current Investments)
Standard Chartered Mutual Fund — (2004-2,70,80,548) Units Grindlays Cash Fund - Institutional Plan - — 32,00.00Growth (2,70,80,548 Units sold during the year)(Current Investments)
— Units Grindlays Cash Fund - Plan C - Super Institutional Plan - — —Daily Dividend (74,75,00,000 Units Purchased, 2,34,353 Unitscumulated, 74,77,34,353 Units sold during the year)(Current Investments)
— (2004-4,54,46,466) Units Grindlays Cash Fund - Plan C - Super — 47,00.00Institutional Plan - Growth (4,54,46,466 Units sold during theyear) (Current Investments)
4,43,98,133 Units Grindlays Cash Fund - Plan C - Super Institutional Plan - 44,40.48 —Monthly Dividend (14,69,78,239 Units Purchased, 22,42,859Units cumulated, 10,48,22,965 Units sold during the year)(Current Investments)
1,08,76,476 (2004-14,49,83,087) Units Grindlays Cash Fund - Plan C - Super 10,87.65 144,98.30Institutional Plan - Weekly Dividend (65,92,82,335 UnitsPurchased, 12,44,738 Units cumulated, 79,46,33,684 Units soldduring the year) (Current Investments)
— Units Grindlays Floating Rate Fund - Institutional Plan - Long — —Term Plan - Monthly Dividend (1,99,39,733 Units Purchased,1,49,613 Units cumulated, 2,00,89,346 Units sold duringthe year) (Current Investments)
— Units Grindlays Floating Rate Fund - Short Term Plan - Plan C - — —Super Institutional Plan- Daily Dividend (8,60,00,000 UnitsPurchased, 12,043Units cumulated, 8,60,12,043 Units sold during the year)(Current Investments)
· 2,05,12,561 Units Grindlays Floating Rate Fund - Short Term Plan - Plan C - 20,54.33 —Super Institutional Plan - Monthly Dividend (2,00,48,933 UnitsPurchased, 4,63,628 Units cumulated during the year)(Current Investments)
— Units Grindlays Floating Rate Fund - Short Term Plan - Plan C - — —Super Institutional Plan - Weekly Dividend (2,59,82,912Units Purchased, 1,84,703 Units cumulated, 2,61,67,615 Unitssold during the year) (Current Investments)
— Units Grindlays Fixed Maturity Plan - 11 - Growth (1,50,00,000 — —Units Purchased, 1,50,00,000 Units sold during the year)(Current Investments)
2,00,00,000 Units Grindlays Fixed Maturity Plan - 17 - Dividend 20,00.00 —(2,00,00,000 Units Purchased during the year) (Current Investments)
— (2004-2,00,00,000) Units Grindlays Fixed Maturity Plan - AP - — 20,00.00Growth (2,00,00,000 Units sold during the year) (Current Investments)
1,50,00,000 Units Grindlays Fixed Maturity Plan - AP4 - Institutional Plan - 15,00.00 —Growth (1,50,00,000 Units Purchased during the year)(Current Investments)
2,62,19,239 Units Grindlays Short Term Institutional Plan - Short Term - Plan C - 26,24.55 —Super Institutional Plan - Monthly Dividend (2,59,37,260 UnitsPurchased, 2,81,979 Units cumulated during the year)(Current Investments)
— Units Grindlays Cash Fund - Plan C - Super Institutional Plan - — —Daily Dividend (50,00,000 Units Purchased, 586 Units cumulated,50,00,586 Units sold during the year) (Current Investments)
41,18,522 Units Grindlays Cash Fund - Plan C - Super Institutional Plan - 4,11.92 —Monthly Dividend (2,39,70,359 Units Purchased, 1,21,001 Unitscumulated, 1,99,72,838 Units sold during the year)(Current Investments)
HLL_A-R 2k5 (43-67).PMD 22/04/2006, 7:48 PM55

HINDUSTAN LEVER LIMITED
200556
2005 2004Rs. lakhs Rs. lakhs
6. INVESTMENTS (Contd...)(Long-term, Unquoted, unless otherwise stated)
Schedules to Balance Sheet
— Units Grindlays Cash Fund - Plan C - Super Institutional Plan - — —Weekly Dividend (38,00,951 taken over (refer note 14(i)),2,06,15,622 units purchased, 2,95,952 cumulated, 2,47,12,525sold during the year) (Current Investments)
HDFC Mutual Fund — Units HDFC Cash Mgmt Fund - Savings Plan - Daily Dividend — —(7,05,12,580 Units Purchased, 8,689 Units cumulated,7,05,21,269 Units sold during the year) (Current Investments)
— (2004 - 4,56,66,454) Units HDFC Cash Mgmt Fund - Savings Plan - — 60,00.00Growth (4,56,66,454 Units sold during the year)(Current Investments)
— Units HDFC Cash Mgmt Fund - Savings Plan - Weekly Dividend. — —(75,24,455 Units Purchased, 75,24,455 Units sold during the year)(Current Investments)
4,99,33,636 Units HDFC Cash Mgmt Fund - Savings Plus - Dividend 50,02.45 —(8,28,46,524) Units Purchased, 20,32,199 Units cumulated,3,49,45,087 Units sold during the year) (Current Investments)
— Units HDFC HIF - Short Term Plan - Dividend (47,34,894 Units — —Purchased, 32,682 Units cumulated, 47,67,576Units sold during the year) (Current Investments)
1 Units HDFC Liquid Fund - Premium Plus Plan - Weekly Dividend — —(73,78,562 Units Purchased, 64,847 Units cumulated, 74,43,408Units sold during the year) (Current Investments)
Birla Mutual Fund — (2004 - 89,09,684) Units Birla Bond Plus - Institutional Plan - Dividend — 9,26.64(89,09,684 Units sold during the year) (Current Investments)
— Units Birla Cash Plus - Institutional Premium Plan - Daily Dividend — —(15,66,94,048 Units Purchased 47,665 Units cumulated,15,67,41,713 Units sold during the year) (Current Investments)
— Units Birla Cash Plus - Institutional Premium Plan - Fortnightly — —Dividend (2,88,11,613 Units Purchased, 1,28,320 Units cumulated,2,89,39,933 Units sold during the year) (Current Investments)
5,49,71,920 Units Birla Cash Plus - Institutional Premium Plan - Monthly 54,99.06 —Dividend (5,39,63,683 Units Purchased, 10,08,237 Unitscumulated during the year) (Current Investments)
— Units Birla Cash Plus - Institutional Premium Plan - Weekly — —Dividend (16,39,14,823 Units Purchased, 4,41,671 Units cumulated,16,43,56,494 Units sold during the year) (Current Investments)
99,92,107 Units Birla Fixed Maturity Plan - Quarterly Series 2 - December 05 - 10,00.00 —Dividend (99,92,107 Units Purchased during the year)(Current Investments)
5,00,00,000 Units Birla Fixed Term Plan - Series A - Growth (5,00,00,000 50,00.00 —Units Purchased during the year) (Current Investments)
Deutsche Mutual Fund — Units Deutsche Floating Rate Fund - Monthly Dividend (97,80,679 — —Units Purchased, 97,80,679 Units sold during the year)(Current Investments)
— Units Deutsche Floating Rate Fund - Weekly Dividend (3,11,57,073 — —Units Purchased, 99,177 Units cumulated, 3,12,56,250 Units soldduring the year) (Current Investments)
1,00,00,000 Units Deutsche Fixed Term Fund - 389 Days - Growth (1,00,00,000 10,00.00 —Units Purchased during the year) (Current Investments)
54,81,837 Units Deutsche Fixed Term Fund - Series 4 - Growth (1,00,00,000 5,45.98 —Units Purchased, 45,18,163 Units sold during the year)(Current Investments)
— (2004 - 1,50,71,306) Units Deutsche Insta Cash Plus Fund - Growth — 16,00.00(1,50,71,306 Units sold during the year) (Current Investments)
— Units Deutsche Insta Cash Plus Fund - Institutional Plan - Daily — —Dividend (6,68,69,605 Units Purchased, 14,620 Units - cumulated,6,68,84,225 Units sold during the year) (Current Investments)
— Units Deutsche Insta Cash Plus Fund - Institutional Plan - Weekly — —Dividend (11,68,27,776 Units Purchased, 5,23,133 Units -cumulated, 11,73,50,909 Units sold during the year)(Current Investments)
— (2004 - 1,19,69,835) Units Deutsche Short Maturity Fund - Monthly — 12,11.11Dividend (43,990 Units cumulated, 1,20,13,825 Units sold duringthe year) (Current Investments)
— Units Deutsche Short Maturity Fund - Weekly Dividend (98,09,166 — —Units Purchased, 1,90,897 Units cumulated, 1,00,00,063Units sold during the year) (Current Investments)
HLL_A-R 2k5 (43-67).PMD 22/04/2006, 7:48 PM56

2005
HINDUSTAN LEVER LIMITED
57
Schedules to Balance Sheet 2005 2004Rs. lakhs Rs. lakhs
6. INVESTMENTS (Contd...)(Long-term, Unquoted, unless otherwise stated)
HSBC Mutual Fund — (2004 - 1,49,65,019) Units HSBC Cash Fund - Institutional Plan - — 16,00.00Growth (1,49,65,019 Units sold during the year) (Current Investments)
— Units HSBC Cash Fund - Institutional Plus - Daily Dividend — —(4,19,76,494 Units Purchased, 17,703 Units cumulated, 4,19,94,197Units sold during the year) (Current Investments)
2,51,73,398 (2004 - 19,25,63,707) Units HSBC Cash Fund - Institutional Plus - 25,19.43 192,63.49Monthly Dividend (16,36,25,243 Units Purchased, 8,57,539Units cumulated, 33,18,73,091 Units sold during the year)(Current Investments)
— (2004 - 7,50,02,767) Units HSBC Cash Fund - Institutional Plus - — 75,01.92Weekly Dividend (1,67,65,862 Units Purchased, 56,189Units cumulated, 9,18,24,818 Units sold during the year)(Current Investments)
1,80,44,571 Units HSBC Floating Rate Fund - Short Term Plan - Institutional 18,04.82 —Plus - Daily Dividend (1,79,96,401 Units Purchased, 48,170Units cumulated during the year) (Current Investments)
3,88,29,717 Units HSBC Floating Rate Fund - Short Term Plan - Institutional 38,85.07 —Plus - Monthly Dividend (3,86,76,366 Units Purchased, 1,53,351Units cumulated during the year) (Current Investments)
— Units HSBC Floating Rate Fund - Short Term Plan - Institutional Plan - — —Daily Dividend (3,09,59,134 Units Purchased, 28,466 Unitscumulated, 3,09,87,600 Units sold during the year)(Current Investments)
— Units HSBC Floating Rate Fund - Short Term Plan - Institutional Plan - — —Monthly Dividend (10,65,13,318 Units Purchased, 18,89,859Units cumulated, 10,84,03,177 Units sold during the year)(Current Investments)
— Units HSBC Floating Rate Fund - Short Term Plan - Institutional Plan - — —Weekly Dividend (1,99,64,065 Units Purchased, 65,425Units cumulated, 2,00,29,490 Units sold during the year)(Current Investments)
1,00,00,000 Units HSBC Fixed Term Scheme 1 - Growth (1,00,00,000 Units 9,96.51Purchased during the year) (Current Investments)
Principal Mutual Fund — (2004 - 2,39,38,564) Units PRINCIPAL Cash Mgmt. Fund — 25,00.00Liquid Option - Institutional Plan - Growth (2,39,38,564 Unitssold during the year) (Current Investments)
— Units PRINCIPAL Cash Mgmt. Fund Liquid Option - Institutional — —Premium Plan - Daily Dividend (9,39,93,741 Units Purchased,29,926 – Units cumulated, 9,40,23,667 Units sold during the year)(Current Investments)
— (2004 - 4,92,38,287) Units PRINCIPAL Cash Mgmt. Fund Liquid — 50,00.00Option - Institutional Premium Plan - Growth (4,92,38,287Units said during the year (Current Investments)
7,22,37,373 (2004 - 13,87,45,487) Units PRINCIPAL Cash Mgmt. Fund Liquid 72,26.70 138,78.74Option - Institutional Premium Plan - Monthly Dividend(25,26,40,497 Units Purchased, 41,91,497 Units cumulated,32,33,40,108 Units sold during the year) (Current Investments)
1,49,98,651 (2004 - 2,70,27,497) Units PRINCIPAL Cash Mgmt. Fund Liquid 15,00.00 27,02.82Option - Institutional Premium Plan - Weekly Dividend(26,51,91,645 Units Purchased, 7,64,930 Units cumulated,27,79,85,421 Units sold during the year) (Current Investments)
1,50,00,000 Units PRINCIPAL Deposit Fund - 371 days - March 05 - Growth 15,00.00 —(1,50,00,000 Units Purchased during the year) (Current Investments)
1,50,00,000 Units PRINCIPAL Deposit Fund - November 05 - 91 days - Dividend 15,00.00 —(1,50,00,000 Units Purchased during the year) (Current Investments)
— Units PRINCIPAL Floating Rate Fund - Fixed Maturity Plan - — —Institutional Plan - Weekly Dividend (99,93,080 Units Purchased,2,42,087 Units cumulated, 1,02,35,167 Units sold during the year)(Current Investments)
— Units PRINCIPAL Floating Rate Fund - Short Maturity Plan - — —Institutional Plan - Monthly Dividend (5,51,58,502 Units Purchased,5,32,401 Units cumulated, 5,56,90,903 Units sold during the year)(Current Investments)
— Units PRINCIPAL Floating Rate Fund - Short Maturity Plan - — —Institutional Plan - Weekly Dividend (5,49,85,157 Units Purchased,3,14,720 Units cumulated, 5,52,99,877 Units sold during the year)(Current Investments)
HLL_A-R 2k5 (43-67).PMD 22/04/2006, 7:48 PM57

HINDUSTAN LEVER LIMITED
200558
2005 2004Rs. lakhs Rs. lakhs
6. INVESTMENTS (Contd...)(Long-term, Unquoted, unless otherwise stated)
2,31,85,393 Units PRINCIPAL Income Fund - Short Term Plan - Institutional Plan - 25,32.80 —Weekly Dividend (2,28,70,821 Units Purchased, 3,14,572 Unitscumulated during the year) (Current Investments)
Franklin Templeton Investments — Units Templeton Floating Rate Income Fund ST - Dividend — —(8,38,31,858 Units Purchased, 4,08,265 Units cumulated,8,42,40,123 Units sold during the year) (Current Investments)
— Units Templeton India Treasury Management Account - Institutional — —Plan - Weekly Dividend (1,99,844 Units Purchased, 333 Unitscumulated, 2,00,177 Units sold during the year) (Current Investments)
— Units Templeton India Treasury Management Account - Super — —Institutional Plan - Daily Dividend (2,49,974 Units Purchased, 785Units cumulated, 2,50,759 Units sold during the year)(Current Investments)
— Units Templeton India Treasury Management Account - Super — —Institutional Plan - Weekly Dividend (2,50,595 Units Purchased,1,001 Units cumulated, 2,51,596 Units sold during the year)(Current Investments)
ABN AMRO Mutual Fund 7,79,70,636 Units ABN AMRO Cash Fund - Insti. Plus Plan - Monthly Dividend 77,97.80 —(7,71,36,583 Units Purchased, 8,34,053 Units cumulated during theyear) (Current Investments)
— Units ABN AMRO Cash Fund - Institutional Plan - Monthly Dividend — —(4,39,21,982) Units Purchased, 1,85,936 Units cumulated,4,41,07,918 Units sold during the year) (Current Investments)
SBI Mutual Fund — Units SBI Magnum Institutional Income - Savings Plan - Daily — —Dividend (4,78,44,506 Units Purchased, 31,514 Units cumulated,4,78,76,020 Units sold during the year) (Current Investments)
6,04,97,483 Units SBI Magnum Institutional Income Savings Plan - Ftly Dividend 60,87.80 —(5,96,64,937 Units Purchased, 8,32,546 Units cumulated during theyear) (Current Investments)
— Units SBI Magnum Institutional Income Savings Plan - Weekly — —Dividend (2,18,74,640 Units Purchased, 1,33,460 Units cumulated,2,20,08,100 Units sold during the year) (Current Investments)
TATA Mutual Fund 1,50,00,000 Units Tata Fixed Horizon Fund - Series 2 - Plan B - Growth 14,98.23 —(1,50,00,000 Units Purchased during the year) (Current Investments)
— Units Tata Liquid Fund - SHIP - Daily Dividend (89,727 Units — —Purchased, 143 Units cumulated, 89,870 Units sold during the year)(Current Investments)
1,79,417 Units Tata Liquid Fund - SHIP - Monthly Dividend (1,77,068 Units 20,28.17 —Purchased, 2,349 Units cumulated during the year)(Current Investments)
TOTAL - D 1322,44.85 1725,79.78TOTAL (A+B+C+D) 2148,72.40 2328,01.42
Provision for diminution in value of long-term investments (134,52.56) (98,45.15)TOTAL 2014,19.84 2229,56.27
Aggregate book value of investments Unquoted 1896,19.08 2079,13.65Listed but not quoted — 1.00Quoted - Market Value Rs. 364,81.40 lakhs 118,00.76 150,41.62(2004 - Rs. 342,22.71 lakhs)
TOTAL 2014,19.84 2229,56.27
Schedules to Balance Sheet
HLL_A-R 2k5 (43-67).PMD 21/04/2006, 12:57 AM58

2005
HINDUSTAN LEVER LIMITED
59
Schedules to Balance Sheet2005 2004
Rs. lakhs Rs. lakhs
7. INVENTORIES (at lower of cost and net realisable value)
Stores and spare parts, etc. 26,11.98 37,45.62Raw materials 652,79.67 698,58.14Packing materials 81,04.92 96,82.86Work-in-progress 26,29.71 45,62.72Processed chemicals 91.82 1,09.07Finished goods 534,10.04 590,39.76Property Development Activity - Work-in-progress 48.77 46.09(Refer Note 15 to Profit and Loss Account)
1321,76.91 1470,44.26
8. SUNDRY DEBTORS (unsecured)
Considered goodOver 6 months old 32,52.03 61,83.72Others 490,30.82 427,43.25
522,82.85 489,26.97
Considered doubtfulOver 6 months old 62,53.02 70,85.49Others — —
62,53.02 70,85.49
585,35.87 560,12.46
Less : Provision for doubtful debts (62,53.02) (70,85.49)
522,82.85 489,26.97
9. CASH AND BANK BALANCES
Cash on hand 96.30 1,11.61With Scheduled banks - on current accounts 102,80.69 101,86.65
- on deposit accounts 251,26.20 595,06.54(includes Rs. Nil lakhs as lien on bankdeposits for loan given to subsidaries;2004 - Rs. 55,00.00 lakhs)
355,03.19 698,04.80
10. OTHER CURRENT ASSETS
Income accrued on investments and deposits 20,69.08 39,03.62Dividends receivable from subsidiary companies — 4,60.35Fixed assets held for sale (at net book value or estimated 3,20.00 9,13.74net realisable value, whichever is lower)
23,89.08 52,77.71
11. LOANS AND ADVANCES
(Unsecured, considered good unless otherwise stated)Advances and loans to subsidiaries
Considered good (including Rs. 6,00.00 lakhs (2004 - 65,51.69 59,97.14Rs. 6,00.00 lakhs) secured by equitable mortgage onimmovable properties)Considered doubtful — 3,00.00
65,51.69 62,97.14
Less : Provision for doubtful advances — (3,00.00)
65,51.69 59,97.14
HLL_A-R 2k5 (43-67).PMD 22/04/2006, 7:50 PM59

HINDUSTAN LEVER LIMITED
200560
2005 2004Rs. lakhs Rs. lakhs
Advances recoverable in cash or in kind or for value to be 335,84.16 374,21.38received [including :-(i) Rs. 132,36.36 lakhs (2004 - Rs. 145,45.17 lakhs) not
due before 31st December, 2006;(ii) Rs. Nil lakhs (2004 - Rs. Nil lakhs) due from officers
of the Company - maximum amount due during theyear Rs. Nil lakhs (2004 - Rs. 30.28 lakhs);
(iii) Rs. 0.10 lakhs (2004 - Rs. 0.10 lakhs) due from the directorsof the Company - maximum amount due during the yearRs. 1,58.04 lakhs (2004 - Rs. 26.92 lakhs)]
Considered doubtful 36,37.16 29,72.97
372,21.32 403,94.35
Less : Provision for doubtful advances (36,37.16) (29,72.97)
335,84.16 374,21.38
Receivable from Emergent Genetics India Private Limited — 16,80.00(Formerly known as Paras Extra Growth Seeds Limited)
Deposits with Customs, Port Trust, Excise, etc. 138,11.30 143,43.27
539,47.15 594,41.79
12. LIABILITIES
Acceptances 560,64.90 447,38.31Sundry creditors (see Schedule 19)
Small Scale Industrial Undertakings 42,68.29 43,18.90Others 2302,28.54 1986,05.60
2344,96.83 2029,24.50Amounts due to Subsidiaries — 16.25Advances and progress payments - Property Development Activity 6.24 1,21.78Security advances 15,53.88 16,09.50Dividends declared pending payment / encashment 35,51.95 34,88.85Interest accrued but not due on loans 2,69.18 61,79.95
2959,42.98 * 2590,79.14*
* There is no amount due and outstanding to becredited to Investor Education and Protection Fund
13. PROVISIONSProvision for retirement / post retirement benefits and other employee benefits 469,51.20 446,83.16Proposed dividend 550,31.09 550,31.09Current taxation (provisions in excess of payments) including taxon distributed profits 65,86.12 57,40.47Fringe Benefit Taxation 8,77.00 —Miscellaneous provisions (Schedule 17) 64,41.45 68,91.65
1158,86.86 1123,46.37
14. DEFERRED TAX ASSETS
On employee separation and retirement 183,19.92 198,10.43On other timing differences 116,70.44 120,32.72On fiscal allowances on investments 5,29.68 2,65.00Other items 33,48.13 44,76.51
Note :Deferred tax assets taken over consequent to the scheme ofarrangement for amalgamation Rs. 4,58.83 lakhs (Refer note 14(i) toProfit and Loss account)
338,68.17 365,84.66
Schedules to Balance Sheet
HLL_A-R 2k5 (43-67).PMD 22/04/2006, 7:50 PM60

2005
HINDUSTAN LEVER LIMITED
61
2005 2004Rs. lakhs Rs. lakhs
15. DEFERRED TAX LIABILITIES
On fiscal allowances 118,53.71 139,84.61
Note :Deferred tax liabilties taken over consequent to the scheme ofarrangement for amagamation Rs. 1,49.08 lakhs (Refer note 14(i) toProfit and Loss account)
118,53.71 139,84.61
16. Certain demands for increased wages, etc. received from workmenhave been referred to adjudication. In the opinion of the Company’smanagement, the ultimate liability to the Company, if any, with respectto such demands would not have a material effect on the accounts.
17. PROVISIONS As at 1st Provision Amounts utilised/ As at 31stJanuary, made during reversed during December,
2005 the year * the year 2005Rs. lakhs Rs. lakhs Rs. lakhs Rs. lakhs
Miscellaneous provisions 68,91.64 14,42.63 (18,92.83) 64,41.44
* Includes the provision taken over by theCompany on amalgamation. Refer note 14(i) tothe Profit and Loss account.Future cash outflow in respect of the above isdeterminable only on accurrence of uncertain future events.
18. CONTINGENT LIABILITIES 2005 2004Rs. lakhs Rs. lakhs
(a) Claims made against Company not acknowledged as debtsIncome tax matters 238,40.62 235,06.55Sales tax matters-gross Rs. 213,05.91 lakhs 141,34.34 157,63.42(2004 - Rs. 248,60.50 lakhs) net of taxExcise and Customs duty matters-gross Rs. 59,89.77 lakhs 39,73.61 13,80.33(2004 - Rs. 21,76.92 lakhs) net of taxOther matters-gross Rs. 60.60 lakhs 40.20 5,60.38(2004 - Rs. 8,83.78 lakhs)
(b) Bills discounted but not matured — 10.28(c) Guarantees given to banks etc. in respect of third parties 48,44.57 64,20.16
Note : Future cash outflows in respect of (a) above are determinableonly on receipt of judgements/decisions pending with variousforums/authorities.
19. The names of small scale industries to whom the Company owes dues outstanding for more than 30 days at theBalance Sheet date, computed on unit-wise basis, are : Lihala Packaging (P) Limited, Sigma Pack, Southern PrimePack, Prime Pack, Mahantesh United, Kayeness Pvt. Ltd., Sai Carton Manufacturing Co., Classic Welding Products,Tristar Packaging, Ambal Packages, Dinesh Minerals, Sunbeam Minerals Industries, Jobland Enterprises, JanakChemicals Pvt. Ltd., Burhani Mineral & Grinding, Tirupati Chemicals, Essem Technologies Pvt. Ltd., Vimalachal Print& Pack Ltd., Guj, Amrita Industries, Kayen Print Process, Ksr Plastics, Mandagini Agencies, Heeshi Tubes, NithyaPackaging Pvt. Ltd., Sudarshan Mineral Industries, Emmbi Polyarns Pvt. Ltd., Creative Polypack Ltd., Kanpur, TrinityPolymers, Aranthangi Chemicals (P) Ltd., K. Maniklal & Co., Harison Chemicals, Advance Detergents Ltd., S.KayInc., S. Kushalchand & Co., Worth Pack Pvt. Ltd., Naga Limited, Triveni Chemicals, Aparna Paper Processing Ind.,Laxmi Agro Inudstrial, Chemex Dets, Oriclean Pvt. Limited, Guru Detergents, Prockage Soapery, Hitech Surfactants,Nirmala Dyechem and Mansa.The above information and that given in Schedule 12 - "Liabilities" regarding small scale industrial undertaking hasbeen determined to the extent such parties have been identified on the basis of information available with theCompany. This has been relied upon by the auditors.
Schedules to Balance Sheet
HLL_A-R 2k5 (43-67).PMD 22/04/2006, 7:50 PM61

HINDUSTAN LEVER LIMITED
200562
Schedules to Balance Sheet
20. Events subsequent to the Balance Sheet date :(i) The Scheme of arrangement for amalgamation of Vashisti Detergents Limited with the Company was approved
by the Honourable High Court of Bombay, the effect of which has not been given in the accounts.(ii) The Company has signed a share sale agreement to dispose of its investments in a subsidiary.
21. Interests in Joint Ventures :The Company’s interests, as a venturer, in jointly controlled entities (Incorporated Joint Ventures) are :
Name Country of Percentage of own- Percentage of own-Incorporation ership interest as at ership interest as at
31st December, 2005 31st December, 2004
Kimberly Clark Lever Private Limited India 50% 50%Quest International India Limited India 49% 49%
The Company’s interests in these Joint Ventures are reported as Long-term Investments (Schedule 6) and stated at cost.However, the Company’s share of each of the assets, liabilities, income and expenses, etc. (each without eliminationof, the effect of transactions between the Company and the joint venture) related to its interests in these joint ventures,based on financial information as certified by the Directors of the Joint Ventures, are :
As at 31st December, 2005 As at 31st December, 2004(Rs. lakhs) (Rs. lakhs)
I. ASSETS1. Fixed Assets 36,45.46 41,43.262. Investments 31,49.64 22,66.123. Current Assets, Loans and Advances
a) Inventories 13,79.33 10,62.40b) Sundry Debtors 10,79.06 8,36.51c) Cash and Bank Balances 39,84.03 33,56.56d) Other Current Assets 1,54.78 1,68.31e) Loans and Advances 15,75.88 9,33.56
II. LIABILITIES1. Secured Loans (1,25.19) —2. Deferred Tax Net (3,99.43) (5,53.26)3. Current Liabilities and Provisions
a) Liabilities (28,16.03) (22,72.88)b) Provisions (7,51.01) (3,13.12)
For the year ended For the year ended31st December, 2005 31st December, 2004
(Rs. lakhs) (Rs. lakhs)III. INCOME
1. Sales (net of excise duty) 108,75.82 92,71.522. Other Income 4,15.64 3,49.09
IV. EXPENSES1. Operating Expenses (91,65.88) (72,51.80)2. Depreciation (5,23.46) (7,01.60)3. Interest (1.21) (1.09)4. Provision for Taxation (including deferred taxation) (4,26.00) (5,31.55)
V. OTHER MATTERSContingent Liabilities — —
22. Previous year’s figures have been regrouped wherever necessary to conform to this year’s classification.
HLL_A-R 2k5 (43-67).PMD 22/04/2006, 7:50 PM62

2005
HINDUSTAN LEVER LIMITED
63
Statements forming part of the Profit and Loss Account1. Licensed/Installed annual capacities on single shift basis (unless otherwise stated)
Licensed Capacity Installed Capacity2005 2004 2005 2004
Tonnes Tonnes Tonnes TonnesScheduled :Processed triglycerides/hydrogenated oils/vanaspati 35,617 38,950 — 8,166Soaps 3,30,305 3,77,538 1,98,250 2,00,084Synthetic detergents 4,55,017 4,46,580 3,01,774 3,07,946Personal products (h) 2,15,352 2,50,898 79,612 74,175Glycerine 8,857 12,324 5,243 5,910Fabric softener 2,833 2,833 4,281 4,281Fatty acids 84,667 94,333 56,667 60,000Perfumery and cosmetic products (units) (d) 30,00,000 30,00,000 37,50,000 37,50,000Perfumery and cosmetic products 3,022 362 3,136 500Packet Tea below 1kg. and tea bags (d) 5,000 5,000 — —Instant Tea 1,500 650 1,200 1,200Frozen Surimi, Fresh and Frozen fish, Mollusees, etc. 25,125 41,481 25,125 40,096Ice-cream/Frozen desserts (Mln. Kgs.) (i) 22 22 13 8Non-scheduled :Packed Tea N.A. N.A. 1,93,138 2,82,003Packed Coffee N.A. N.A. 7,900 7,900Scourers (e) N.A. N.A. 23,467 6,800Refined Oils N.A. N.A. 1,070 1,070Cleaners N.A. N.A. 1,48,00,000 —
(a) N.A. - Not Applicable(b) Licensed capacities include registered capacities for activities existing prior to the Industries (Development and Regulation) Act, 1951, and
the Industrial Entrepreneurs Memorandum (IEM) filed with the Government and duly acknowledged by them under the Scheme of delicensingGovernment and duly acknowledged by them under the Scheme of delicensing notified by the Government but excludesnon-scheduled activities where IEMs have been filed in lieu of DGTD registrations.
(c) The installed capacities are as per certificate given by a Director on which the auditors have relied.(d) The capacity mentioned is annual capacity based on maximum utilisation of plant and machinery.(e) Scourers, being a non-scheduled activity, no industrial licence is required. However, under the Government Scheme of Single
point clearance for Kandla Free Trade Zone, a licence for 1,667 tonnes per annum has been granted.(f) Licensed and installed capacities for the year indicated above include those vested in the Company consequent to merger and
amalgamation various companies with the Company.(g) Packet tea being a non-scheduled activity no license or approval is required except for registration for statistical purposes. However
Government of India has issued one license for certain packet tea units treating them as a specimen of processed food industry.(h) Since the undertaking at Mumbai and Kolkata for manufacture of toilet preparations were in existence prior to the enactment of the
Industries (Development and Regulation) Act, 1951, the Company was only required to obtain a Registration Certificate and laterunder an amendment of the Act in 1975, to apply for endorsement of capacity on the same. The capacities disclosed herein, as isdone previously, are in accordance with the Company’s submissions to the Government relating to its installed and productivecapacities. The Government has during 1985, endorsed lower capacities aggregating 838 tonnes as against 3,005 tonnes claimedby the Company without a technical inspection of the Company’s installed capacities and ignoring certain Letters of Approval /Licences issued by the Government between 1951 and 1967. As provided under the law and the guidelines issued by the Government,the Company has represented to the Government and requested for a review of their decision based on techincal inspection andearlier letters of approvals / licences and that the endorsement be brought in line with the Company’s claims. Government responseis awaited.
(i) Ice creams and Frozen Desserts are alternate capacities.
2005 2004Tonnes Tonnes
2. ProductionProcessed triglycerides / hydrogenated oils / vanaspati 5,244** 2,841**Soaps 306,351** 294,461**Synthetic detergents 780,836** 708,438**Personal Products (‘000 nos.) 40,70,145 31,59,729Glycerine : Refined 4,408** 3,695**Fine chemicals — ** 309**Packed Tea 70,531** 64,272**Garden Tea 2,675 16,066Instant Tea 1,423 1,070Packed Coffee 13,241** 12,125**Functionalised biopolymers 4,885 8,799Processed Foods 22,148 24,448Canned and Processed Fruits and Vegetables 22,971** 16,414**Frozen Desserts (Million Ltrs.) 6 4
** Includes :(a) Third party processing :
Processed triglycerides / hydrogenated oils / vanaspati - 2,035 tonnes (2004 - Nil), Soaps - 7,026 tonnes (2004 - 16,626tonnes), Synthetic detergents - 356,108 tonnes (2004 - 347,328 tonnes), Glycerine - 2,756 tonnes (2004 - 304 tonnes),Fine Chemicals - Nil tonnes (2004 - 59 tonnes), Packed Tea - 4,623 tonnes (2004 - 3,225 tonnes), Packed Coffee - 1,485tonnes (2004 - 5,574 tonnes), Canned and Processed Fruits and Vegetables - 10,251 tonnes (2004 - 10,690 tonnes).
(b) Processing in leased units : Processed triglycerides / hydrogenated oil / vanaspati - 3,209 tonnes (2004 - 2,841 tonnes).
HLL_A-R 2k5 (43-67).PMD 22/04/2006, 7:50 PM63

HINDUSTAN LEVER LIMITED
200564
2005 2004Tonnes Rs. lakhs Tonnes Rs. lakhs
3. Sales (including exports)Soaps 3,71,681 2542,78.82 3,67,880 2380,91.54
1,698* 551*Synthetic detergents 10,27,677 2164,50.88 929,540 1872,62.23
2,216* 1,376*Personal Products (‘000 nos.) 92,80,290 2994,86.19 7,366,198 2459,94.34
34,471* 59,375*Garden Tea (d) 3,611 18,17.11 12,348 67,82.36
388* 3,763*Tea 1,08,419 1422,91.38 97,202 1347,17.16Coffee 26,685 377,85.94 26,519 336,31.36Frozen Desserts & Ice Creams (Million Ltrs.) 15 97,03.38 11 87,74.26Processed triglycerides/hydrogenated oils/vanaspati 50,213 199,92.59 44,561 183,65.50Canned and Processed Fruits and Vegetables 29,697 173,94.29 26,187 146,15.75Branded Staple Foods (a) 2,76,213 167,77.38 2,79,030 161,44.15Speciality Chemicals (b) 14,045 51,64.41 14,983 58,94.09
1,329* 1,778*Others (c) 849,12.25 824,21.90
11060,54.62 9926,94.64
Notes :(a) Branded staple foods includes wheat flour, iodised salt and rice in consumer packs.(b) Speciality Chemicals comprises Glycerine, Fine Chemicals, Mixtures of Odoriferous substances, Functionalised biopolymers,
Perfumery compounds, Flavouring essences and Oleo chemicals.(c) Others includes Scourers, Marine products, Agri commodities, Leather, Footwear, Garments, Carpets etc.(d) Excludes stocks transferred on demerger of Doom Dooma and TEI Plantation Division to separate subsidiaries.* Figures denote quantities used for captive consumption/reprocessing/sales promotion.
Statements forming part of the Profit and Loss Account
2005 2004 2003Tonnes Rs. lakhs Tonnes Rs. lakhs Tonnes Rs. lakhs
4. Closing stocks (includingprocessed chemicals)
Processed triglycerides/ 1,720 8,30.25 3,681 14,70.76 2,067 7,26.67hydrogenated oils/vanaspatiSoaps 26,747 139,96.23 27,777 150,51.48 35,474 178,65.01Synthetic detergents 45,156 104,87.78 48,214 106,74.04 46,948 103,59.40Personal Products (‘000 nos.) 11,06,333 154,46.18 9,49,162 215,79.08 13,57,223 245,04.78Fine Chemicals – – 3 4.57 118 3,14.13Tea 5,225 38,78.16 4,447 36,67.76 4,858 33,34.99Coffee 1,164 15,83.09 841 10,00.04 950 10,56.53Functionalised biopolymers 112 27.34 182 55.55 178 36.45Others 72,52.83 56,45.55 73,78.14
535,01.86 591,48.83 655,76.10
Notes :In addition :(i) Stocks on 1st January, 2005 of Merryweather Food Products Limited taken over consequent to the scheme of arrangement
for amalgamation : Others Rs. 11.60 lakhs.(ii) Stocks on 1st April, 2005 of Lever India Exports Limited and TOC Disinfectants Limited taken over consequent to the scheme
of arrangement for amalgamation : Personal products (‘000 Nos.) 2,677; Rs. 2,55.25 lakhs, Others Rs. 2,28.95 lakhs.(iii) Stocks on 31st March, 2005 of Doom Dooma and TEI plantation divisions transferred to subsidiaries consequent to the
Scheme of Demerger : Others Rs. 6,69.67 lakhs.2005 2004
Tonnes Rs. lakhs Tonnes Rs. lakhs5. Raw materials consumed @
Oils, fats and rosins 2,45,443 688,18.86 2,06,302 577,14.97Chemicals and perfumes 10,66,362 1582,73.50 9,38,831 1309,50.09Tea and Green Leaf * 1,10,008 650,46.92 1,66,939 664,57.99Coffee 25,704 168,27.65 25,292 120,94.86Others 465,09.39 454,40.03
3554,76.32 3126,57.94
* Includes Green Leaf plucked / purchased and consumed.@ Relates to the Company’s main products and principal raw materials.
HLL_A-R 2k5 (43-67).PMD 22/04/2006, 7:50 PM64
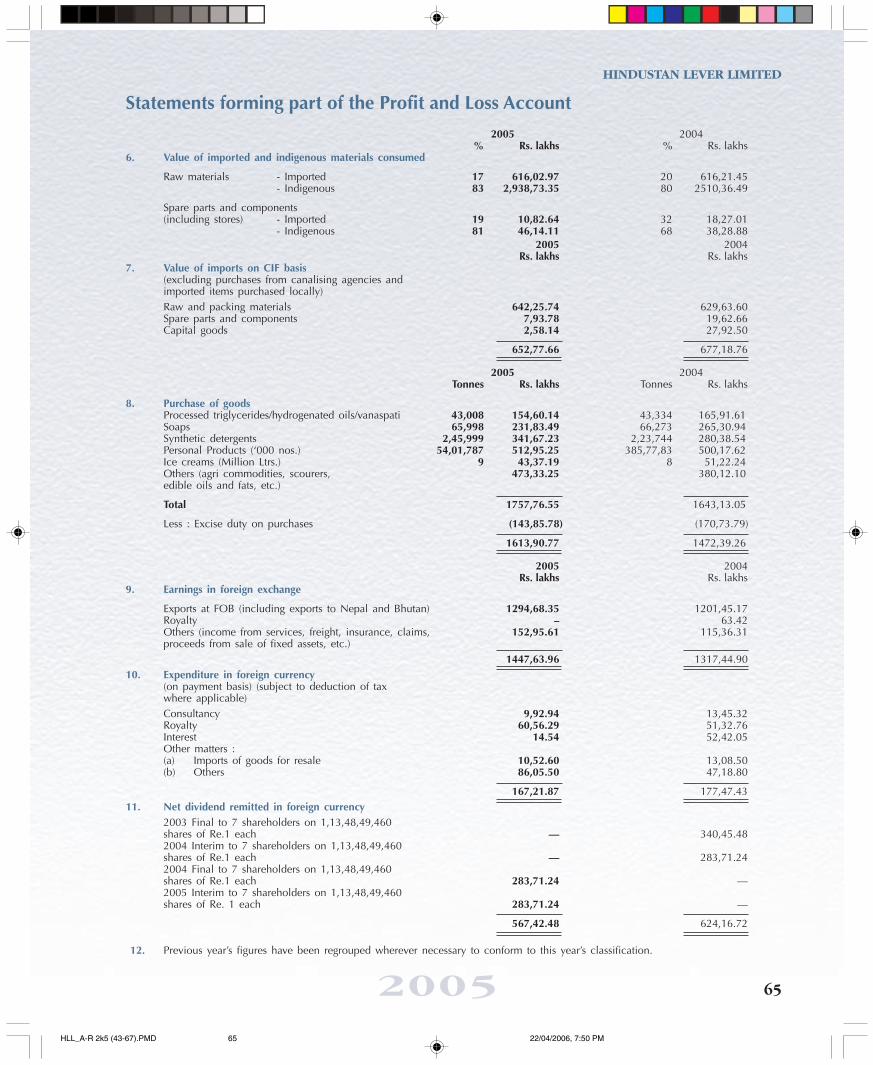
2005
HINDUSTAN LEVER LIMITED
65
Statements forming part of the Profit and Loss Account2005 2004
% Rs. lakhs % Rs. lakhs6. Value of imported and indigenous materials consumed
Raw materials - Imported 17 616,02.97 20 616,21.45- Indigenous 83 2,938,73.35 80 2510,36.49
Spare parts and components(including stores) - Imported 19 10,82.64 32 18,27.01
- Indigenous 81 46,14.11 68 38,28.882005 2004
Rs. lakhs Rs. lakhs7. Value of imports on CIF basis
(excluding purchases from canalising agencies andimported items purchased locally)Raw and packing materials 642,25.74 629,63.60Spare parts and components 7,93.78 19,62.66Capital goods 2,58.14 27,92.50
652,77.66 677,18.76
2005 2004Tonnes Rs. lakhs Tonnes Rs. lakhs
8. Purchase of goodsProcessed triglycerides/hydrogenated oils/vanaspati 43,008 154,60.14 43,334 165,91.61Soaps 65,998 231,83.49 66,273 265,30.94Synthetic detergents 2,45,999 341,67.23 2,23,744 280,38.54Personal Products (‘000 nos.) 54,01,787 512,95.25 385,77,83 500,17.62Ice creams (Million Ltrs.) 9 43,37.19 8 51,22.24Others (agri commodities, scourers, 473,33.25 380,12.10edible oils and fats, etc.)
Total 1757,76.55 1643,13.05
Less : Excise duty on purchases (143,85.78) (170,73.79)
1613,90.77 1472,39.26
2005 2004Rs. lakhs Rs. lakhs
9. Earnings in foreign exchange
Exports at FOB (including exports to Nepal and Bhutan) 1294,68.35 1201,45.17Royalty – 63.42Others (income from services, freight, insurance, claims, 152,95.61 115,36.31proceeds from sale of fixed assets, etc.)
1447,63.96 1317,44.9010. Expenditure in foreign currency
(on payment basis) (subject to deduction of taxwhere applicable)Consultancy 9,92.94 13,45.32Royalty 60,56.29 51,32.76Interest 14.54 52,42.05Other matters :(a) Imports of goods for resale 10,52.60 13,08.50(b) Others 86,05.50 47,18.80
167,21.87 177,47.4311. Net dividend remitted in foreign currency
2003 Final to 7 shareholders on 1,13,48,49,460shares of Re.1 each — 340,45.482004 Interim to 7 shareholders on 1,13,48,49,460shares of Re.1 each — 283,71.242004 Final to 7 shareholders on 1,13,48,49,460shares of Re.1 each 283,71.24 —2005 Interim to 7 shareholders on 1,13,48,49,460shares of Re. 1 each 283,71.24 —
567,42.48 624,16.72
12. Previous year’s figures have been regrouped wherever necessary to conform to this year’s classification.
HLL_A-R 2k5 (43-67).PMD 22/04/2006, 7:50 PM65

HINDUSTAN LEVER LIMITED
200566
2005 2004Rs. lakhs Rs. lakhs
13. Directors’ remunerationSalaries 1,54.45 1,70.92Performance Linked Bonus / Commission to Wholetime Directors 2,90.40 3,29.50Commission to Non-Wholetime Directors 25.00 25.00Contribution to provident fund 53.38 55.37Other perquisites* 57.95 71.24
5,81.18 6,52.03
* The stock options granted by the Company were at market price and not at a discount. But consequent to theScheme of Arrangement between the Company and its members for issue of bonus debentures, the value of stockoptions outstanding were reduced by Rs. 8.76 per option. In accordance with the guidelines issued by Securitiesand Exchange Board of India, and also as a conservative accounting policy, the accounting value of options arisingout of the reduction of Rs. 8.76 per option is being amortised over the vesting period. Accordingly perquisitesinclude amortisation of Employee Stock Options amounting to Rs.1.45 lakhs (2004 : Rs. 15.55 lakhs).Note :Provisions for contribution to employee retirement / post retirement and other employee benefits which are basedon actuarial valuations done on an overall company basis are excluded above.Computation of net profits in accordance with Section 198 of theCompanies Act, 1956 and the commission payable to directors
2005 2004Rs. lakhs Rs. lakhs
Net Profit after taxation 1408,10.44 1197,34.37Add :Depreciation (as per accounts) 124,45.32 120,89.94Directors’ remuneration 5,81.18 6,52.03Directors’ fees 11.20 8.60Provision / (write back) for doubtful debts andadvances (net) (7,37.82) (11,16.08)Book deficit / (surplus) on fixed assets sold,scrapped, etc. (net) (4,65.73) 26,75.49Surplus on disposal of investments (net) (27,79.27) (24,50.29)Provision for diminution in value ofinvestment in subsidiaries 16,00.00 87,27.00Provision for loss arising out of disposal of asubsidiary company 14,21.58 —Provision / (write back) for diminution in value ofInvestments and excess of cost over fair valueof current investments (net), includedin miscellaneous expenses 6.06 (1,29.15)Provision for diminution in value of long-term investments 16,42.41 —Provision for impairment of sea food exportsbusiness assets (including goodwill and trademark) 38,43.96 —Provision for loss arising out of disposal of mushroomundertaking, included in exceptional items — 3,01.17Provision / (write back) for estimated losses ondisposal of fixed assets, included inmiscellaneous expenses and exceptional items — (24,07.34)Profit arising on disposal of land — (94,85.19)Profit arising on disposal of a long-term investment (43,68.86) (40,54.08)Profit arising out of demerger of plantation business (80,96.95) —Taxation for the year (after considering exceptional items) 192,43.20 287,66.40
243,46.28 335,78.501651,56.72 1533,12.87
Less :Depreciation under Section 350 132,77.36 125,18.18Deficit / (Surplus) on disposal of fixed assets (net)under Section 349 (14,61.36) 48,96.07
118,16.00 174,14.25
Net profit for Section 198 of the Companies Act, 1956 1533,40.72 1358,98.62
Commission to Non-Wholetime Directors at 1% 15,33.41 13,58.99Commission to Wholetime Directors 76,67.04 56,66.97Commission payable for the year 3,15.40 3,54.50
Statements forming part of the Profit and Loss Account
HLL_A-R 2k5 (43-67).PMD 22/04/2006, 7:50 PM66

2005
HINDUSTAN LEVER LIMITED
67
2005 2004Rs. lakhs Rs. lakhs
1. Cash and cash equivalents include :Cash and bank balances 355,03.19 698,04.80Unrealised loss / (gain) on foreign currency cash andcash equivalents — 0.06Total cash and cash equivalents 355,03.19 698,04.86
2. During the year, the Company demerged its Doom Dooma and TEI plantation divisions to its fully owned subsidiaries, for a considerationof Rs. 143,00.00 lakhs received in the form of equity shares and debentures. (Refer note 14(ii) to Profit and Loss Account)
3. Cash and Cash equivalents includes Rs. Nil lakhs lien on bank deposits for loans availed by subsidiaries; 2004 - Rs. 55,00.00 lakhs
4. Figures in brackets indicate Cash Outgo.
5. In view of note 2 above and note 14(i) to the Profit and Loss Account, the current year's figures are not comparable with that of theprevious year.
6. The cash flow statement has been prepared in accordance with the requirements of Accounting Standard - 3 "Cash Flow Statement" issuedby the Institute of Chartered Accountants of India.
7. The previous year's figures have been regrouped / restated wherever necessary to conform to this year's classification.
Notes to the Cash Flow Statement for the year ended 31st December, 2005
HLL_A-R 2k5 (43-67).PMD 22/04/2006, 7:50 PM67

HINDUSTAN LEVER LIMITED
200568
Segment Information for the Year Ended 31st December, 2005Information about Primary Business Segments
2005 2004Rs. lakhs Rs. lakhs
REVENUE External Intersegment Total External Intersegment Total
Soaps and Detergents 4961,70.51 4961,70.51 4470,74.07 4470,74.07Personal Products 2951,87.31 2951,87.31 2472,24.43 2472,24.43Beverages 1277,44.74 1277,44.74 1194,55.06 1194,55.06Foods 313,71.52 313,71.52 285,07.01 285,07.01Ice Creams 98,14.67 98,14.67 88,94.24 88,94.24Exports 1347,79.94 1347,79.94 1249,01.54 1249,01.54Other Operations 243,19.70 7,26.56 250,46.26 274,73.07 25,41.95 300,15.02Total Segment 11193,88.39 7,26.56 11201,14.95 10035,29.42 25,41.95 10060,71.37
Eliminations (7,26.56) (25,41.95)
Total Revenue (see note 3 toSegment Information) 11193,88.39 10035,29.42
RESULT
Soaps and Detergents 683,68.79 775,06.18Personal Products 845,20.85 807,50.24Beverages 242,40.46 238,70.75Foods (16,10.18) (81,76.35)Ice Creams 5,07.67 (4,69.15)Exports 49,06.05 39,61.76Other Operations (27,68.31) (32,86.06)Total Segment 1781,65.33 1741,57.37Total Consolidated 1781,65.33 1741,57.37Un-allocated expenditure net ofun-allocated income (310,22.28) (287,98.85)Operating Profit 1471,43.05 1453,58.52Interest expenses (19,19.31) (129,98.43)Interest / dividend income andsurplus on disposal of investments 152,23.39 181,71.66(net of provision / write back for dimunition in long-terminvestments and mark down of current investment)
Taxation for the year (including adjustments of previous years) (249,96.32) (306,04.10)
Profit after taxation and 1354,50.81 1199,27.65before exceptional itemsExceptional items - income andexpenditure (Segment)
Soaps and Detergents (19,51.95) (26,03.17)Personal Products — (39,35.15)Beverages — (18,56.48)Foods — 93,97.54Ice Creams (15,00.00) —Exports (38,43.96) —Other Operations 93,36.95 (44,35.42)
20,41.04 (34,32.68)Exceptional items – income and expenditure
(Unallocated / Corporate) (24,34.54) 14,01.70Tax credit (net) 57,53.13 18,37.70
Net Profit 1408,10.44 1197,34.37

2005
HINDUSTAN LEVER LIMITED
69
Segment Information for the Year Ended 31st December, 2005Information about Primary Business Segments
Segment Assets Segment LiabilitiesOther Information Rs. lakhs Rs. lakhs
2005 2004 2005 2004Soaps and Detergents 1470,25.23 1484,88.24 (1533,58.64) (1208,02.48)Personal Products 701,18.12 783,99.86 (473,37.94) (492,27.44)Beverages 402,04.77 421,18.02 (464,12.00) (442,36.18)Foods 111,31.47 110,23.61 (112,94.08) (97,13.06)Ice Creams 73,53.56 64,65.03 (82,96.27) (65,03.30)Exports 647,60.36 628,71.63 (217,65.68) (180,15.41)Other Operations 39,26.70 132,07.03 (33,76.56) (68,64.52)
Total 3445,20.21 3625,73.42 (2918,41.17) (2553,62.39)
Unallocated Corporate Assets / Liabilities 3154,20.00 3792,19.10 (1375,36.45) (2771,59.18)
Total Assets / Liabilities 6599,40.21 7417,92.52 (4293,77.62) (5325,21.57)
Non – Cash ExpensesCapital Expenditure Depreciation other than Depreciation
Year 2005 Year 2004 Year 2005 Year 2004 Year 2005 Year 2004
Soaps and Detergents 73,69.31 134,98.63 54,15.23 52,30.15 3,96.33 4,34.13Personal Products 29,14.61 134,48.39 21,78.70 16,29.88 3,48.93 12,30.24Beverages 4,40.15 7,45.85 6,14.34 6,06.85 1,13.01 3,71.94Foods 1,99.26 1,16.56 1,70.19 1,89.15 31.19 2,84.37Ice Creams 1,77.50 85.46 6,32.96 6,23.08 14.47 42.75Exports 16,52.80 22,04.47 11,68.00 13,92.20 34,08.10 4,96.13Other Operations 10.84 2,53.90 4,34.00 6,28.67 91.78 52.70

HINDUSTAN LEVER LIMITED
200570
2005 2004Rs. lakhs Rs. lakhs
Revenue by Geographical Market
India 9735,96.13 8705,02.64Outside India 1457,92.26 1330,26.78
Total 11193,88.39 10035,29.42
Additions to Fixed Assets and Intangible Assets
India 127,64.47 303,53.26Outside India — —
Total 127,64.47 303,53.26
Carrying Amount of Segment Assets
India 3429,28.23 3607,47.95Outside India 15,91.98 18,25.47
Total 3445,20.21 3625,73.42
Notes :1. Business Segments
The Company has considered business segment as the primary segment for disclosure. The products included ineach of the reported domestic business segments are as follows :• Soaps and Detergents include soaps, detergent bars, detergent powders, detergent liquids, scourers, etc.• Personal Products include products in the categories of Oral Care, Skin Care (excluding soaps), Hair Care,
Deodorants, Talcum Powder, Colour Cosmetics, etc.• Beverages include tea and coffee.• Foods include Oils and Fats, Branded Staples (Atta, Salt, etc.), Culinary Products (tomato based products, fruit
based products, soups, etc.)• Ice Creams include Ice Creams and Frozen Desserts.• Others include Plantations, Chemicals, Agri seeds, Property Development, Water business, Ayush services etc.Segment Revenue relating to each of the above domestic business segments includes Income from Services provided,where applicable. In addition, the Company’s Exports business segment includes sales of Marine Products, LeatherProducts, Castor, etc. as well as sales of Soaps and Detergents, Personal Products, Beverages and Foods, etc. bythe Exports Division.The above business segments have been identified considering :a) the nature of products and servicesb) the differing risks and returnsc) the organisation structure, andd) the internal financial reporting systemsPlantation business is excluded from Other segment pursuant to the Scheme of arrangement for demerger of theDoom Dooma and TEI plantation divisions of the Company to its subsidiaries with effect from 1st April, 2005.Assets and Liabilities also includes assets and liabilities of merged subsidiries pursuant to the scheme of amalgamation.(Refer note 14(i) to the Profit and Loss account).Non cash expenses of export segment includes impairment of fixed assets.(Refer note 13(vii) to the Profit and Loss account).
2. Geographical SegmentsThe geographical segments considered for disclosure are as follows :• Sales within India includes sales to customers located within India.• Sales outside India includes sales to customers located outside India.
2005 2004Rs. lakhs Rs. lakhs
3. Revenue compriseSales 11060,54.62 9926,94.64Income from services rendered(included in Other Income) 131,39.86 106,76.82Income from property development activity(included in Other Income) 1,93.91 1,57.96
11193,88.39 10035,29.42
4. Previous year’s figures have been regrouped wherever necessary to conform to this year’s classification.
Segment Information for the Year Ended 31st December, 2005Information about Secondary Business Segments

2005
HINDUSTAN LEVER LIMITED
71
Related Party DisclosuresA. Enterprises where control exists
(i) Holding Company :Unilever PLC
(ii) Subsidiaries :Lipton India Exports Ltd. (upto 31st December, 2004)[Refer Note 14(i) of Notes to Profit and Loss Account]Unilever India Exports Limited (formerly Indexport Ltd.)Bon Ltd.Unilever Nepal Limited (formerly Nepal Lever Ltd.)Lever India Exports Ltd. (upto 31st March, 2005) [ReferNote 14(i) of Notes to Profit and Loss Account]Merryweather Food Products Ltd. (upto31st December, 2004) [Refer Note 14(i) of Notes toProfit and Loss Account]International Fisheries Ltd. (upto 31st December,2004) [Refer Note 14(i) of Notes to Profit and LossAccount]Modern Food Industries (India) Ltd.Doom Dooma Tea Company Limited (formerlyDaverashola Tea Company Ltd.)Pond's Exports Ltd.Tea Estates India Limited (formerly Thiashola TeaCompany Ltd.)Unilever India Shared Services Limited (formerlyIndigo Lever Shared Services Ltd.)Rossell Industries Ltd. (upto April, 2005)TOC Disinfectants Limited (upto 31st March, 2005)[Refer Note 14(i) of Notes to Profit and Loss Account]Modern Food and Nutrition Industries Ltd.Levers Associated Trust Ltd.Levindra Trust Ltd.Hindlever Trust Ltd.Hindustan Kwality Walls Foods Private Limited (from16th March, 2005)
B. Other Related Parties with whom the Company hadtransactions, etc.(i) Fellow Subsidiaries :
Brooke Bond Assam Estates Ltd.Brooke Bond Group Ltd.Brooke Bond South India Estates Ltd.Lever Faberge UKUnilever U.K. Central Resources Ltd.Unilever Overseas Holdings Ltd.Unilever Australia Ltd.Lever Brothers Bangladesh Ltd.Unilever CanadaUnilever Cote d'IvoireUnilever Ghana Ltd.Unilever Kenya Ltd.Unilever New Zealand Ltd.Lever Brothers Pakistan Ltd.Unilever Singapore Pte Ltd.Unilever Foods Espana, S.A - Division FrigoUnilever South Africa (Pty.) Ltd.Unilever Ceylon Ltd.Unilever Overseas Holdings AGLever Brothers West Indies Ltd.Unilever Research Laboratory, Port SunlightUnilever Research Laboratory, Colworth HouseBB Kenya GroupUnilever N.V.Unilever Overseas Holdings B.V.Unilever Brasil Ltda.Lever Chile S.A.Unilex Cameroon S.A.Unilever France S.A.Unilever International ParisUnilever Deutschland GmbHLever Faberge Deutschland GmbHUnilever Hong Kong Ltd.BBL Japan K.K.Nippon Lever K.K.
Fellow Subsidiaries : (Contd.)Sagit SPA, ItalyUnilever EthiopiaUnilever Philippines (Prc), Inc.PT Unilever Indonesia TBKUnilever Thai Trading Ltd.Unilever Sanayi ve Ticaret Turk A.S.Unilever Home & Personal Care USALever Egypt SAELipton Division, CanadaLever Arabia Ltd.Lever Brothers Nigeria Ltd.Lipton Soft Drinks (Ireland)Lever IsraelElida P/S, VietnamUnilever CR, Czech RepublicUnilever PolskaLever International Marine Supplies (LIMS) BVUnilever Gulf Free Zone Establishment, ArabiaUnilever (China) LimitedUnilever South Central EuropeUnilever Baltic LLCUnilever Levant, LebanonUnilever Tuketim Urunleri Sat Pazarlama Ticaret A.S.Unilever Best Foods, VietnamUnilever SNG, RussiaUnilever Taiwan Ltd.Unilever UkraineUnilever Tuketim Mersin Serbest Bolge Subesi, TurkeyTowells Lever LLC, ArabiaBinzagr Lever Limited, ArabiaHind Lever Chemicals Ltd. (Also an Associate)(Upto 31st May, 2004)Unilever Industries Private LimitedDigital Securities Private LimitedLever Faberge FranceUnilever Tanzania Ltd.Unilever Cambodia Ltd.Lever Faberge BelgiumUnilever Maghreb Export SA, TunisiaUnilever UK & CN Holdings, UKLipton Ltd. - UKUnilever (Malaysia) Holdings Sdn BerhadLever Ponds Division, CanadaEuropalma International Insurance Services B.V.Lipton US GroupLever Faberge Italia SPAUnilever United States Inc.Hefei Lever Detergents Co. Ltd., ChinaUnilever KoreaUnilever VietnamUnilever Canada - FoodsUnilever AlgeriaUnilever NigeriaLipton Ltd. (Head Office) / Lipton Tea Supply Ltd.Unilever Market Development SALipton Kenya Brooke BondUnilever Schweiz GmbH HPCUnilever AlgerieUnilever Magyarorszag KftSociete Des Produits Chimquies du NigerUnilever Czech RepublicBahrain Technical & Trading Co. W.L.LUnilever Bestfoods Benelux B.V. NetherlandsBestfoods-GermanyBestfoods Nordic AS (Denmark)Unilever Bestfoods - IrelandFrozen Fish International GmbH, GermanyUnilever NigeriaUnilever RussiaLever Brothers ZimbabweUnilever South East Africa Zamibia

HINDUSTAN LEVER LIMITED
200572
Other Related parties with whom the Company had transaction etc.
(ii) Joint Ventures : Kimberly Clark Lever Pvt. Ltd.Quest International India Ltd.
(iii) Associate : Vashisti Detergents Ltd.(iv) Key Management Personnel : M.S. Banga (upto June, 2005)
H. Manwani (from April, 2005)M.K. SharmaA.S. AbhiramanA. AdhikariS.K. Dhall (upto March, 2005)G. Kapur (upto July, 2004)A.K. MathurJ.H. Mehta (upto March, 2005)S. RavindranathD. SehgalD. SundaramA. Weijburg (upto April, 2004)
(v) Employees’ Benefit Plans wherethere is significant influence : Hindustan Lever Gratuity Fund
The Union Provident FundThe Hind Lever Provident FundThe Hind Lever Pension FundHindustan Lever Limited Employees Superannuation Fund
Disclosure of transactions between the Company and Related Parties and the status of outstanding balances as on31st December, 2005
2005 2004Rs. lakhs Rs. lakhs
(i) Holding Company : Dividend paid 397,40.34 437,14.37Royalty paid 62,11.45 51,09.69Interest on 9% Debentures 11.94 42,91.96Income from services rendered 121,21.33 88,25.03Outstanding balances :
- Receivables at the year end 6,91.75 9,80.83- Debenture Interest payable – 21,51.69- 9% Debentures – 476,88.41
(ii) Subsidiaries * : Sale of finished goods / raw materials etc. 43,72.47 42,03.24Sale of fixed assets 4,78.13 —Sale of investments 17,59.42 85,49.74Interest received on sale of investments — 1,40.45Royalty received 58.99 4,24.18Expenses shared by subsidiary companies 7,86.38 12,93.87Dividend received 27,41.40 34,15.35Interest received 10,03.47 4,37.67Processing charges received — 29.92Rent received 83.30 61.80Processing charges paid 5,40.51 18.48Purchase of Fixed Assets 2,17.60 0.92Purchase of goods 16,51.15 51,27.46Purchase of investments 17,48.39 112,17.94Interest paid on purchase of investments — 1,68.23Rent paid 26.59 –Investment in equity shares 10,00.00 9,60.01Deposits - Outstanding receivable at the year end 16,57.00 16,57.00Advances and loans :
- Receivables at the year end 17,68.00 59,97.14- Payables at the year end 2,15.67 16.25- Provision on receivables — 3,00.00- Inter corporate deposits :
- Advanced during the year 38,71.38 14,00.00- Repayments during the year 4,00.00 71,70.01
* For transactions with subsidiaries relating to Mergers and Demergers refer Notes 14(i) and 14(ii)of Notes to the Profit and Loss Account.

2005
HINDUSTAN LEVER LIMITED
73
Disclosure of transactions between the Company and Related Parties and the status of outstanding balances as on31st December, 2005 (Contd...)
2005 2004Rs. lakhs Rs. lakhs
(iii) Fellow Subsidiaries : Sale of finished goods / raw materials etc. 653,67.54 527,35.99Sale of fixed assets — 4.50Sale of investments — 185,93.97Interest received on sale of investments — 4,44.08Royalty received — 63.42Rent received 1,10.00 1,10.00Income from services rendered 9,08.53 17,11.87Expenses shared by a fellow subsidiary 6.00 6.00Processing charges paid — 18,72.92Purchase of goods 48,18.84 70,55.93Purchase of investments — 169,88.85Interest paid on purchase of investments — 3,54.53Dividend paid 170,02.14 187,02.35Royalty paid 1,71.77 1,55.00Interest on 9% Debentures 5.11 18,36.239% Debentures Outstanding — 204,02.56Advances and loans :
- Receivables 159,95.05 132,79.09- Payables 8,57.42 12,62.01- Debenture interest payable — 9,20.56
(iv) Joint Ventures : Purchase of goods 121,41.28 97,61.40Sale of finished goods / raw materials etc. — 2.96Other income 1,43.86 1,66.86Advances and loans :
- Receivables — 20.59- Payables 86.11 59.95
(v) Associate : Processing charges paid 9,00.46 14,60.85Outstanding Payable at the year end — 7.11Outstanding receivable at the year end 19.27 —Sale of goods 4,83.50 3,97.57Purchase of goods 14,71.47 5,66.12
(vi) Key ManagementPersonnel : Remuneration 8,45.83 12,40.69
Rent Paid 59.07 64.79Dividend Paid 9.24 8.49Interest on 9% Debentures 0.01 0.709% Debentures Outstanding — 7.47Debenture Interest Payable — 0.34Loans - Outstanding at the year end 0.10 0.10
- Advanced during the year — —- Repayments (including interest) during the year — 27.20
(vii) Employees’ Benefit Planswhere there is significantinfluence : Contributions during the year 24,64.81 39,85.07
Outstanding payables at the year end 1,02.35 —Outstanding receivables at the year end 6,56.85 16,94.59

HINDUSTAN LEVER LIMITED
200574
Disclosure in respect of transactions which are more than 10% of the total transactions of the same type with related partiesduring the year.
2005 2004Rs. lakhs Rs. lakhs
Sale of finished goods / raw materials etc.Unilever Gulf Free Zone Establishment 279,88.53 216,53.94
Sale of fixed assetsLever Brothers Bangladesh Ltd. — 4.50Bon Limited 3,93.63 —
Sale of investmentsLever India Exports Ltd. 17,59.42 67,44.67Hind Lever Chemicals Ltd. — 173,90.05
Interest received on sale of investmentsUnilever India Exports Limited (formerly Indexport Ltd.) — 59.30Lever India Exports Ltd. — 77.19Hind Lever Chemicals Ltd. — 4,04.47
Royalty receivedUnilever India Exports Limited (formerly Indexport Ltd.) 58.99 4,24.18Lever Egypt SAE — 63.42
Expenses shared by subsidiary companies / fellow subsidiary companiesUnilever India Exports Limited (formerly Indexport Ltd.) 6,62.77 10,34.46Pond's Exports Ltd. 99.11 —
Dividend receivedLever India Exports Ltd. 9,00.00 29,55.00Unilever Nepal Limited (formerly Nepal Lever Ltd.) 18,41.40 4,60.35
Interest receivedModern Food Industries (India) Ltd. 3,77.27 1,93.67Rossell Industries Ltd. — 1,34.25Pond's Exports Ltd. — 70.72Doom Dooma Tea Company Limited (formerly Daverashola Tea Company Ltd.) 2,63.17 —Tea Estates India Limited (formerly Thiashola Tea Company Ltd.) 2,50.03 —
Processing charges receivedUnilever India Exports Limited (formerly Indexport Ltd.) — 29.92
Rent receivedUnilever Industries Pvt. Ltd. 1,10.00 1,10.00Unilever India Exports Limited (formerly Indexport Ltd.) 54.00 54.00Bon Limited 28.55 —
Processing charges paidBon Limited 5,24.27 —Vashisti Detergents Ltd. 9,00.46 14,60.85Hind Lever Chemicals Ltd. — 18,72.92
Purchase of fixed assetsDoom Dooma Tea Company Limited (formerly Daverashola Tea Company Ltd.) 2,17.60 —Merryweather Food Products Ltd. — 0.92
Purchase of goodsTOC Disinfectants Ltd. — 23,12.53Kimberly Clark Lever Pvt. Ltd. 106,36.34 81,75.28Lipton Ltd. 25,59.66 28,08.59
Purchase of investmentsLever India Exports Ltd. — 72,30.23Tea Estates India Limited (formerly Thiashola Tea Company Ltd.) 17,48.39 —Hind Lever Chemicals Ltd. — 133,64.05Unilever Industries Pvt. Ltd. — 29,58.31
Interest paid on purchase of investmentsHind Lever Chemicals Ltd. — 3,16.65Lever India Exports Ltd. — 1,11.95
Rent paidM.S. Banga 9.46 18.92M.K. Sharma 22.50 22.50Bon Limited 26.59 —
Investment in equity sharesPond’s Exports Ltd. — 9,60.01Bon Limited 9,95.00 —
Disclosure of transactions between the Company and Related Parties and the status of outstanding balances as on31st December, 2005 (Contd...)

2005
HINDUSTAN LEVER LIMITED
75
Disclosure of transactions between the Company and Related Parties and the status of outstanding balances as on31st December, 2005 (Contd...)
2005 2004Rs. lakhs Rs. lakhs
Deposits outstanding receivable at the year endUnilever India Exports Limited (formerly Indexport Ltd.) 16,57.00 16,57.00
Repayments (including interest) during the yearM.K. Sharma — 26.92
Inter corporate deposits - advanced during the yearModern Food Industries (India) Ltd. 23,80.00 8,00.00Hindustan Kwality Walls Foods Private Limited 5,61.38 —Unilever India Exports Limited (formerly Indexport Ltd.) — 2,00.00Indigo Lever Shared Services Ltd. — 4,00.00
Inter corporate deposits - repayments during the yearModern Food Industries (India) Ltd. 2,00.00 57,60.00Doom Dooma Tea Company Limited (formerly Daverashola Tea Company Ltd.) 2,00.00 —Pond's Exports Ltd. — 9,60.01
Other incomeKimberly Clark Lever Pvt. Ltd. 1,43.86 1,66.86
Dividend paidUnilever PLC 397,40.34 437,14.37
Royalty paidUnilever PLC 62,11.45 51,09.69
Interest on 9% DebenturesUnilever PLC 11.94 42,91.96
9% Debentures outstandingUnilever PLC — 476,88.41
Outstanding balances - payables at the year endLever Faberge Deutschland GmbH — 2,06.12Lipton Ltd. 3,55.71 3,49.46Unilever U.K. Central Resources Ltd. 1,36.10 2,08.03Unilever India Exports Limited (formely Indexport Ltd.) 1,97.35 —Digital Securities Private Limited 1,61.19 —Unilever N.V. — 2,02.82
Outstanding balances - receivables at the year endUnilever Gulf Free Zone Establishment 55,13.59 42,33.23
Outstanding balances - provision on receivablesInternational Fisheries Ltd. — 3,00.00
Income from services renderedUnilever PLC 121,21.33 88,25.03Unilever Industries Pvt. Ltd. — 15,45.98
Outstanding balances - debenture interest payableUnilever PLC — 21,51.69
RemunerationM.K. Sharma 1,69.59 1,64.01A. Adhikari 1,17.29 1,31.41S. Ravindranath 1,27.74 1,41.61D. Sundaram 1,40.03 1,41.18D. Sehgal 88.97 —
Contributions during the yearThe Union Provident Fund 4,57.02 5,52.70Hindustan Lever Gratuity Fund — 10,14.97The Hind Lever Pension Fund 10,48.98 12,53.61Hind Lever Provident Fund 9,58.81 10,23.44
Disclosure in respect of transactions which are more than 10% of the total transactions of the same type with related partiesduring the year.

HINDUSTAN LEVER LIMITED
200576
IV. PERFORMANCE OF COMPANY(AMOUNT IN RS. THOUSANDS)Turnover (Total Income) 113653327Total Expenditure (97608613)Profit/(Loss) Before Tax and Exceptional Items 16044714Profit/(Loss) After Tax and Exceptional Items 14081044Earnings Per Share (in Rs.) 6.40Dividend Rate (%) 500
V. GENERIC NAMES OF THREE PRINCIPAL PRODUCTS/SERVICES OFTHE COMPANY (AS PER MONETARY TERMS)Item Code No. (ITC Code) 34.01Product Description SOAP
Item Code No. (ITC Code) 34.02Product Description DETERGENTS
Item Code No. (ITC Code) 09.02Product Description TEA
1. We have audited the attached Balance Sheet of HindustanLever Limited as at 31st December, 2005 and the relatedProfit and Loss Account and Cash Flow Statement for theyear ended on that date annexed thereto, which we havesigned under reference to this report. These financialstatements are the responsibility of the Company’smanagement. Our responsibility is to express an opinionon these financial statements based on our audit.
2. We conducted our audit in accordance with the auditingstandards generally accepted in India. Those Standardsrequire that we plan and perform the audit to obtainreasonable assurance about whether the financialstatements are free of material misstatement. An auditincludes examining, on a test basis, evidence supportingthe amounts and disclosures in the financial statements.An audit also includes assessing the accounting principlesused and significant estimates made by management, aswell as evaluating the overall financial statementpresentation. We believe that our audit provides areasonable basis for our opinion.
3. As required by the Companies (Auditor’s Report) Order,2003 as amended by Companies (Auditor’s Report)(Amendment) Order, 2004 (together ‘the Order’), issuedby the Central Government of India in terms of sub-section(4A) of Section 227 of ‘The Companies Act, 1956’ of India(the ‘Act’) and on the basis of such checks of the booksand records of the Company as we considered appropriateand according to the information and explanations givento us, we give in the Annexure a statement on the mattersspecified in paragraphs 4 and 5 of the said Order.
4. Further to our comments in the Annexure referred to inparagraph 3 above, we report that:(a) We have obtained all the information and
explanations, which to the best of our knowledge andbelief were necessary for the purposes of our audit;
(b) In our opinion, proper books of account as requiredby law have been kept by the Company so far asappears from our examination of those books;
Statement Pursuant to Part IV of the Companies Act, 1956Balance Sheet Abstract and Company’s General Business Profile
Auditors’ Report to the Members of Hindustan Lever Limited
I. REGISTRATION DETAILSRegistration No. 11-2030State Code 11Balance Sheet Date 31.12.2005
II. CAPITAL RAISED DURING THE YEAR(AMOUNT IN RS. THOUSANDS)Public Issue NILRights Issue NILBonus Issue NILPrivate Placement NIL
III. POSITION OF MOBILISATION AND DEPLOYMENT OF FUNDS(AMOUNT IN RS. THOUSANDS)Total Liabilities 65994022Total Assets 65994022SOURCES OF FUNDSPaid-up Capital 2201244Reserves and Surplus 20855016Secured Loans 244996Unsecured Loans 324411APPLICATION OF FUNDSNet Fixed Assets 14835303Investments 20141984Net Current Assets (13553066)Deferred Tax 2201446Miscellaneous Expenditure NILAccumulated Losses NIL
(c) The Balance Sheet, Profit and Loss Account and CashFlow Statement dealt with by this report are inagreement with the books of account;
(d) In our opinion, the Balance Sheet, Profit and LossAccount and Cash Flow Statement dealt with by thisreport comply with the accounting standards referredto in sub-section (3C) of Section 211 of the Act;
(e) On the basis of written representations received fromthe directors, as on 31st December, 2005, and takenon record by the Board of Directors, none of thedirectors is disqualified as on 31st December, 2005from being appointed as a director in terms of clause(g) of sub-section (1) of Section 274 of the Act;
(f) In our opinion and to the best of our information andaccording to the explanations given to us, the saidfinancial statements together with the notes thereonand attached thereto give in the prescribed mannerthe information required by the Act and give a trueand fair view in conformity with the accountingprinciples generally accepted in India:(i) in the case of the Balance Sheet, of the state of
affairs of the Company as at 31st December,2005;
(ii) in the case of the Profit and Loss Account, ofthe profit for the year ended on that date; and
(iii) in the case of the Cash Flow Statement, of thecash flows for the year ended on that date.
Sharmila A. KarvePartnerMembership No. 43229For and on behalf ofLOVELOCK & LEWESChartered Accountants
Mumbai, 14th February, 2006

2005
HINDUSTAN LEVER LIMITED
77
Annexure to Auditors’ Report[Referred to in paragraph 3 of the Auditors’ Report of even date to the members of Hindustan Lever Limited on theFinancial Statements for the year ended 31st December, 2005]
1. (a) The Company is maintaining proper records showing full particulars including quantitative details and situationof fixed assets.
(b) Fixed assets are physically verified by the management according to a phased programme designed to cover allthe locations once in two years, which in our opinion, is reasonable having regard to the size of the Companyand the nature of its assets. Pursuant to the programme, fixed assets at certain locations were physically verifiedby the management during the year and no material discrepancies between the book records and the physicalinventory have been noticed.
(c) In our opinion and according to the information and explanations given to us, a substantial part of fixed assetshas not been disposed off by the Company during the year.
2. (a) Inventory (excluding stocks with third parties) has been physically verified by the management during the year.In respect of inventory lying with third parties, these have substantially been confirmed by them. In our opinion,the frequency of verification is reasonable.
(b) In our opinion, the procedures of physical verification of inventory followed by the management are reasonableand adequate in relation to the size of the Company and the nature of its business.
(c) On the basis of our examination of the inventory records, in our opinion, the Company is maintaining properrecords of inventory. The discrepancies noticed on physical verification of inventory as compared to bookrecords were not material.
3. The Company has neither granted nor taken any loans, secured or unsecured, to/from companies, firms or otherparties covered in the register maintained under Section 301 of the Act. Consequently, clauses (iii)(b), (iii)(c), (iii)(d),(iii)(f) and (iii)(g) of paragraph 4 of the Order are not applicable.
4. In our opinion and according to the information and explanations given to us, having regard to the explanation thatcertain items purchased are of special nature for which suitable alternative sources do not exist for obtaining comparativequotations, there is an adequate internal control system commensurate with the size of the Company and the natureof its business, for the purchase of inventory and fixed assets and for the sale of goods and services. Further, on thebasis of our examination of the books and records of the Company carried out in accordance with the auditingstandards generally accepted in India and according to the information and explanations given to us, we have neithercome across nor have been informed of any continuing failure to correct major weaknesses in the aforesaid internalcontrol system.
5. (a) In our opinion and according to the information and explanations given to us, the particulars of contracts orarrangements referred to in Section 301 of the Act have been entered in the register required to be maintainedunder that section.
(b) In our opinion and according to the information and explanations given to us, there are no transactions made inpursuance of such contracts or arrangements and exceeding Rs. five lakhs in respect of any party during theyear, which have been made at prices which are not reasonable having regard to the prevailing market prices atthe relevant time.
6. In our opinion and according to the information and explanations given to us, the Company has complied with thedirectives issued by the Reserve Bank of India, the provisions of Sections 58A and 58AA or any other relevant provisionsof the Act and the Companies (Acceptance of Deposits) Rules, 1975 with regard to the deposits accepted from thepublic. According to the information and explanations given to us, no order has been passed by the Company LawBoard or National Company Law Tribunal or Reserve Bank of India or any Court or any other Tribunal on the Companyin respect of the aforesaid deposits.
7. In our opinion, the Company has an internal audit system commensurate with its size and nature of its business.
8. We have broadly reviewed the books of account maintained by the Company in respect of products where, pursuantto the Rules made by the Central Government of India, the maintenance of cost records has been prescribed underclause (d) of sub-section (1) of Section 209 of the Act and are of the opinion that prima facie, the prescribed accounts

HINDUSTAN LEVER LIMITED
200578
and records have been made and maintained. We have not, however, made a detailed examination of the recordswith a view to determine whether they are accurate or complete.
9. (a) According to the information and explanations given to us and the records of the Company examined by us, inour opinion, the Company is generally regular in depositing undisputed statutory dues including providentfund, investor education and protection fund, employees’ state insurance, income-tax, sales tax, wealth tax,service tax, customs duty, excise duty, cess and other material statutory dues as applicable with the appropriateauthorities.
(b) According to the information and explanations given to us and the records of the Company examined by us,there are no dues of wealth tax, service tax and cess which have not been deposited on account of any dispute.The particulars of excise duty, sales tax, customs duty and income-tax as at 31st December, 2005 which havenot been deposited on account of a dispute are as follows:
Name of the statute Nature of dues Amount under Periods to which Forum where thedispute not yet the amount relates dispute is pendingdepositedRs. Lakhs
The Central Excise Excise duty including 41,78.61 1991 to 2005 Appellate Authority –Act, 1944 interest and penalty, upto Commissioner’s
as applicable level21,25.97 1983 to 1986 Tribunal
1989 to 19911994 to 2001
61.38 1989 High Court22.54 1979 to 1983 Supreme Court
Central Sales Tax Act Sales tax including 74,32.01 1983 to 2005 Appellate Authority –and Local Sales Tax interest and penalty, upto Commissioner’sActs (including as applicable levelworks contract)
39,25.95 1982 to 2003 Tribunal49,38.72 1976, 1977 High Courts
1982 to 19851988 to 19951997 to 2005
1,86.63 1999 to 2004 Supreme Court
Customs Act, 1962 Customs duty 7,32.46 1992 to 2001 Appellate Authority –including interest upto Commissioner’sand penalty, as levelapplicable
7.44 1994 Tribunal
Income-tax Act,1961 Income tax including 4,38.79 1979-80 Appellate Authority –interest and penalty, 1995-96 upto Commissioner’sas applicable level
1,07.59 1985-86 Tribunal1991-92
31.55 1988-89 High Court
10. The Company has no accumulated losses as at 31st December, 2005 and has not incurred any cash losses in thefinancial year ended on that date or in the immediately preceding financial year.
11. According to the records of the Company examined by us and the information and explanations given to us, theCompany has not defaulted in repayment of dues to any financial institution or bank or debenture holders as at thebalance sheet date.
12. The Company has not granted any loans and advances on the basis of security by way of pledge of shares, debenturesand other securities.

2005
HINDUSTAN LEVER LIMITED
79
13. The provisions of any special statute applicable to chit fund / nidhi / mutual benefit fund / societies are not applicableto the Company.
14. In our opinion, the Company is not a dealer or trader in shares, securities, debentures and other investments.
15. In our opinion and according to the information and explanations given to us, the terms and conditions of theguarantees given by the Company, for loans taken by others from banks or financial institutions during the year, arenot prejudicial to the interest of the Company.
16. In our opinion, and according to the information and explanations given to us, on an overall basis, the term loanshave been applied for the purposes for which they were obtained.
17. On the basis of an overall examination of the balance sheet of the Company, in our opinion and according to theinformation and explanations given to us, there are no funds raised on a short-term basis which have been used forlong-term investment.
18. The Company has not made any preferential allotment of shares to parties and companies covered in the registermaintained under Section 301 of the Act during the year.
19. During the year, the Company redeemed the 9% secured redeemable bonus debentures of Rs. 6 each amounting toRs. 1320,74.63 lakhs which were issued in 2003 pursuant to the Scheme of Arrangement between the Company andits members. There are no debentures outstanding as at the year-end.
20. The Company has not raised any money by public issue during the year.
21. During the course of our examination of the books and records of the Company, carried out in accordance with thegenerally accepted auditing practices in India, and according to the information and explanations given to us, wehave neither come across any instance of material fraud on or by the Company, noticed or reported during the year,nor have we been informed of such case by the management.
Sharmila A. KarvePartnerMembership No. 43229
For and on behalf ofLOVELOCK & LEWESChartered Accountants
Mumbai : 14th February, 2006
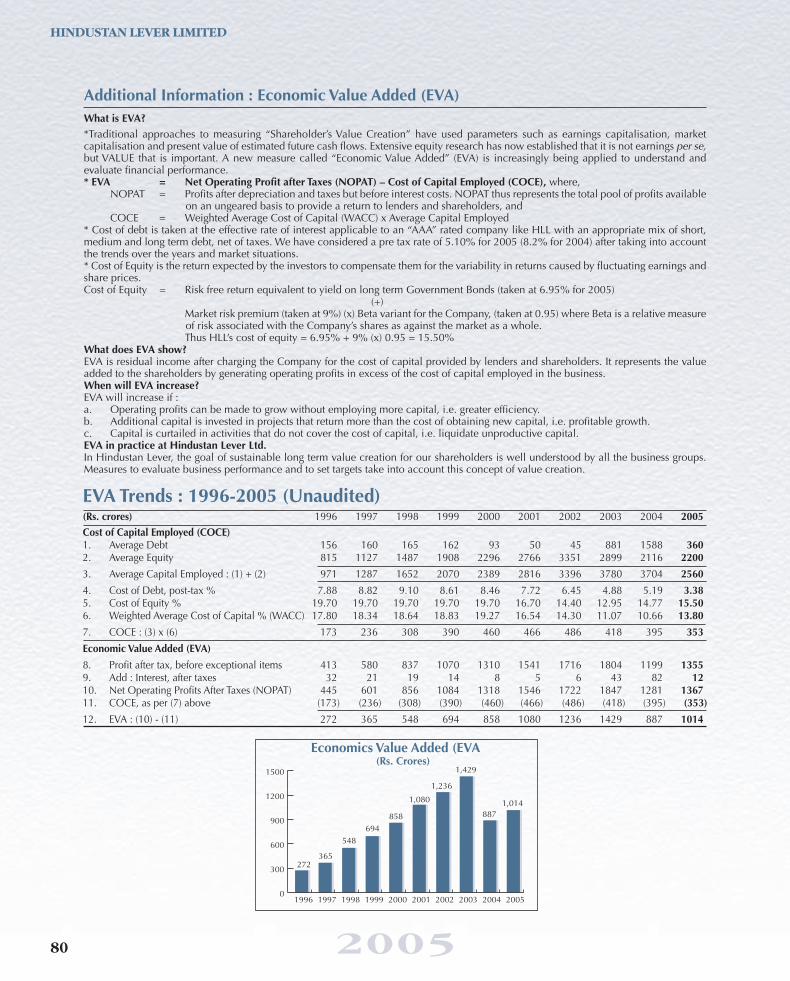
HINDUSTAN LEVER LIMITED
200580
0
300
600
900
1200
1500
2005200420032002200120001999199819971996
272365
548694
858
1,080
1,236
1,429
8871,014
Economics Value Added (EVA(Rs. Crores)
What is EVA?*Traditional approaches to measuring “Shareholder’s Value Creation” have used parameters such as earnings capitalisation, marketcapitalisation and present value of estimated future cash flows. Extensive equity research has now established that it is not earnings per se,but VALUE that is important. A new measure called “Economic Value Added” (EVA) is increasingly being applied to understand andevaluate financial performance.* EVA = Net Operating Profit after Taxes (NOPAT) – Cost of Capital Employed (COCE), where,
NOPAT = Profits after depreciation and taxes but before interest costs. NOPAT thus represents the total pool of profits availableon an ungeared basis to provide a return to lenders and shareholders, and
COCE = Weighted Average Cost of Capital (WACC) x Average Capital Employed* Cost of debt is taken at the effective rate of interest applicable to an “AAA” rated company like HLL with an appropriate mix of short,medium and long term debt, net of taxes. We have considered a pre tax rate of 5.10% for 2005 (8.2% for 2004) after taking into accountthe trends over the years and market situations.* Cost of Equity is the return expected by the investors to compensate them for the variability in returns caused by fluctuating earnings andshare prices.Cost of Equity = Risk free return equivalent to yield on long term Government Bonds (taken at 6.95% for 2005)
(+)Market risk premium (taken at 9%) (x) Beta variant for the Company, (taken at 0.95) where Beta is a relative measureof risk associated with the Company’s shares as against the market as a whole.Thus HLL’s cost of equity = 6.95% + 9% (x) 0.95 = 15.50%
What does EVA show?EVA is residual income after charging the Company for the cost of capital provided by lenders and shareholders. It represents the valueadded to the shareholders by generating operating profits in excess of the cost of capital employed in the business.When will EVA increase?EVA will increase if :a. Operating profits can be made to grow without employing more capital, i.e. greater efficiency.b. Additional capital is invested in projects that return more than the cost of obtaining new capital, i.e. profitable growth.c. Capital is curtailed in activities that do not cover the cost of capital, i.e. liquidate unproductive capital.EVA in practice at Hindustan Lever Ltd.In Hindustan Lever, the goal of sustainable long term value creation for our shareholders is well understood by all the business groups.Measures to evaluate business performance and to set targets take into account this concept of value creation.
EVA Trends : 1996-2005 (Unaudited)(Rs. crores) 1996 1997 1998 1999 2000 2001 2002 2003 2004 2005Cost of Capital Employed (COCE)1. Average Debt 156 160 165 162 93 50 45 881 1588 3602. Average Equity 815 1127 1487 1908 2296 2766 3351 2899 2116 22003. Average Capital Employed : (1) + (2) 971 1287 1652 2070 2389 2816 3396 3780 3704 25604. Cost of Debt, post-tax % 7.88 8.82 9.10 8.61 8.46 7.72 6.45 4.88 5.19 3.385. Cost of Equity % 19.70 19.70 19.70 19.70 19.70 16.70 14.40 12.95 14.77 15.506. Weighted Average Cost of Capital % (WACC) 17.80 18.34 18.64 18.83 19.27 16.54 14.30 11.07 10.66 13.807. COCE : (3) x (6) 173 236 308 390 460 466 486 418 395 353Economic Value Added (EVA)8. Profit after tax, before exceptional items 413 580 837 1070 1310 1541 1716 1804 1199 13559. Add : Interest, after taxes 32 21 19 14 8 5 6 43 82 1210. Net Operating Profits After Taxes (NOPAT) 445 601 856 1084 1318 1546 1722 1847 1281 136711. COCE, as per (7) above (173) (236) (308) (390) (460) (466) (486) (418) (395) (353)12. EVA : (10) - (11) 272 365 548 694 858 1080 1236 1429 887 1014
Additional Information : Economic Value Added (EVA)

2005 81
HINDUSTAN LEVER LIMITED (CONSOLIDATED)
Basis for preparation of accountsThe accounts have been prepared to comply in all materialaspects with applicable accounting principles in India and theAccounting Standards issued by the Institute of CharteredAccountants of India.Revenue RecognitionSales are recognised when goods are supplied and are recorded netof trade discounts, rebates, sales taxes and excise duties (on goodsmanufactured and outsourced) but include, where applicable, exportincentives such as duty drawbacks and premiums on sale of importlicences. It does not include inter-divisional transfers.Income from Property Development Activity is recognised in termsof arrangements with developers, where applicable.Incomes from services rendered are booked based on agreements/arrangements with the concerned parties.Interest on investments are booked on a time proportion basis takinginto account the amounts invested and the rate of interest.Dividend incomes on investments are accounted for when the rightto receive the payment is established.ExpenditureExpenses are accounted for on accrual basis and provision is madefor all known losses and liabilities. Advertising expenses are chargedagainst the profit of the year to which the activities relate.Revenue expenditure on research and development is chargedagainst the profit of the year in which it is incurred. Capitalexpenditure on research and development is shown as an additionto fixed assets.Goodwill and other Intangible AssetsIntangible assets are stated at cost of acquisition less accumulatedamorisation. Goodwill and other Intagible assets (except computersoftware) are amortised over the assets useful life not exceeding 10years. Computer software is amortised over a period of 5 years onthe straight line method.Goodwill arising on consolidation in accordance with AS-21 isamortised over 4 years at quarterly rests commencing from thequarter of recognition of goodwill.Impairment of AssetsImpairment loss, if any, is provided to the extent, the carrying amountof assets exceeds their recoverable amount. Recoverable amount ishigher of an assets's net selling price and its value in use. Value inuse is the present value of estimated future cash flows expected toarise from the continuing use of an asset and from its disposal at theend of its useful life.Fixed AssetsFixed assets are stated at cost less depreciation except in the case ofcertain Land and Development, Building and Plant and Machineryof certain plantation businesses, where it is shown at revaluedamount. In Tea/Coffee estates, the cost of extension planting ofcultivable land including cost of development is capitalised.Depreciation is provided (except in the case of leasehold land whichis being amortised over the period of the lease) on the Straight LineMethod (SLM) and at the rates and in the manner specified inSchedule XIV of the Companies Act, 1956. However,- certain employee perquisite-related assets are depreciated over
four to six years, the period of the perquisite scheme- computers and related assets are depreciated over four years- certain assets of the cold chain are depreciated over four/seven
years- motor vehicles are depreciated over six years and- assets of certain subsidaries are depreciated on the Written Down
Value Method (WDV). The difference between the SLM basisand WDV basis is not significant.
Assets identified and evaluated technically as obsolete and held fordisposal are stated at their estimated net realisable values.
InvestmentsInvestments are classified into current and long-term investments.Current investments are stated at the lower of cost and fair value.Long-term investments, other than in Associates, are stated at cost.A provision for diminution is made to recognise a decline, otherthan temporary, in the value of long-term investments. Investmentsin Associates are accounted for using the equity method.Interests in Joint VenturesInterests in Jointly controlled entities (Incorporated Joint Ventures)are accounted for using proportionate consolidation method.InventoriesInventories are valued at the lower of cost, computed on a weightedaverage basis, and estimated net realisable value, after providingfor cost of obsolescence and other anticipated losses, whereverconsidered necessary. Finished goods and work-in-progress includecosts of conversion and other costs incurred in bringing theinventories to their present location and condition.Sundry Debtors and Loans and AdvancesSundry debtors and Loans and Advances are stated after makingadequate provisions for doubtful balances.ProvisionsA provisions is recognised when there is a present obligation as aresult of a past event, it is probable that an outflow of resources willbe required to settle the obligation and in respect of which reliableestimate can be made. Provision is not discounted to its presentvalue and is determined based on the best estimate required to settlethe obligation at the year end date. These are reviewed at each yearend date and adjusted to reflect the best current estimate.Retirement/Post Retirement BenefitsContributions to defined contribution schemes such as ProvidentFund and Family Pension Fund are charged to the profit and lossaccount as incurred. The Companies also provide retirement / post-retirement benefits in the form of gratuity, pensions, leaveencashment and medical. Such benefits are provided for based onvaluations, as at the balance sheet date, made by independentactuaries.Taxes on IncomeCurrent tax is determined as the amount of tax payable in respect oftaxable income for the period.Deferred tax is recognised, subject to the consideration of prudence,on timing differences, being the difference between taxable incomeand accounting income that originate in one period and are capableof reversal in one or more subsequent periods. Deferred tax assetsare not recognised on unabsorbed depreciation and carry forwardof losses unless there is virtual certainty that sufficient future taxableincome will be available against which such deferred tax assets canbe realised.Foreign Currency TranslationsForeign currency transactions are accounted at the exchange ratesprevailing at the date of the transaction. Gains and losses resultingfrom the settlement of such transactions and from the translation ofmonetary assets and liabilities denominated in foreign currenciesare recognised in the profit and loss account. Exchange differencesrelating to fixed assets are adjusted in the cost of the asset.Segment ReportingThe accounting policies adopted for segment reporting are in linewith the accounting policies adopted in consolidated financialstatements with the following additional policies being consideredfor segment reporting:a) Inter segment revenue has been accounted for based on the
transaction price agreed to between segments which isprimarily market led.
b) Revenue and expenses have been identified to segments onthe basis of their relationship to the operating activities of thesegment. Revenue and expenses, which relate to the enterpriseas a whole and are not allocable to segments on a reasonablebasis, have been included under “Unallocated corporateexpenses”.
Significant Accounting Policies

200582
HINDUSTAN LEVER LIMITED (CONSOLIDATED)
Figures in brackets represent deductions
2005 2004Notes Rs. lakhs Rs. lakhs
INCOMESales 1 11565,82.60 10598,20.01Other income 2 313,37.87 303,61.07Total 11879,20.47 10901,81.08
EXPENDITUREOperating expenses 3-5 (10129,46.14) (9108,06.71)Depreciation (138,37.52) (195,67.95)Interest 6 (24,20.56) (136,24.94)Total (10292,04.22) (9439,99.60)
PROFIT BEFORE TAXATION, EXCEPTIONAL ITEMSAND SHARE OF ASSOCIATES' PROFIT 1587,16.25 1461,81.48Taxation for the year - current tax 9 (237,61.44) (284,23.66)
- fringe benefit tax (31,34.29) —- deferred tax (41,39.52) (51,06.50)- adjustments of previous years (net) 20 46,01.60 13,99.33
PROFIT AFTER TAXATION, BEFORE EXCEPTIONAL ITEMS ANDSHARE OF ASSOCIATES' PROFIT 1322,82.60 1140,50.65Exceptional items (net of tax) 13 37,39.84 60,80.71PROFIT AFTER EXCEPTIONAL ITEMS ANDBEFORE SHARE OF ASSOCIATES' PROFIT 1360,22.44 1201,31.36Share of Associates' net profit (1,64.22) 4,89.32PROFIT BEFORE MINORITY INTERESTS 1358,58.22 1206,20.68Minority Interests (2,65.71) 2,19.26NET PROFIT 1355,92.51 1208,39.94Balance brought forward 498,44.62 670,46.49Available for distribution 1854,37.13 1878,86.43Dividends :On equity shares :Interim - Rs. 2.50 per share - declared on 30th July, 2005 (550,31.09) (550,31.09)Final - Rs. 2.50 per share proposed (550,31.09) (550,31.09)Tax on distributed profits (2005 - includes differential Rs. 5,26.23 lakhson final dividend for 2004) (159,62.46) (150,54.63)Transfer to General Reserve (142,00.00) (129,25.00)
Balance carried forward 452,12.49 498,44.62
Earnings Per Share (Rs.) - Basic & Diluted (Face value of Re.1 each) 17 6.16 5.49
For notes, statements, additional information, segment information, Signatures to pages : 81, 82, 85, 86related party disclosures and accounting policies and 99 to 105See pages : 81, 85, 86 and 99 to 105
In terms of our report of even date
Sharmila A. KarvePartnerMembership No. 43229
For and on behalf ofLOVELOCK & LEWESChartered Accountants
Mumbai : 14th February, 2006 Mumbai : 14th February, 2006
M.K. Sharma Vice ChairmanD. Sundaram Finance DirectorRaju Thomas Vice President - FinanceAshok Gupta Company Secretary
Profit and Loss Account for the year ended 31st December, 2005

2005 83
HINDUSTAN LEVER LIMITED (CONSOLIDATED)
Figures in brackets represent deductions
2005 2004Schedule Rs. lakhs Rs. lakhs
SOURCES OF FUNDSShareholders’ fundsCapital 1 220,12.44 220,12.44Reserves and surplus 2 1949,36.38 1917,89.29
2169,48.82 2138,01.73Minority Interests 3,93.49 10,65.30Loan fundsSecured loans 3 41,23.02 1467,38.09Unsecured loans 4 77,41.78 136,87.32
118,64.80 1604,25.41
2292,07.11 3752,92.44APPLICATION OF FUNDS
Fixed assetsGross block 2705,06.97 2825,15.48Depreciation and impairment loss (1191,81.67) (1219,55.92)Net block 5 1513,25.30 1605,59.56Capital work-in-progress 107,25.32 1620,50.62 104,08.76 1709,68.32
Investments 6 1821,60.30 2200,15.28Deferred TaxDeferred Tax Assets 7 338,27.75 374,79.47Deferred Tax Liabilities 8 (128,71.82) 209,55.93 (147,70.98) 227,08.49
Current assets, loans and advancesInventories 9 1391,76.60 1558,82.76Sundry debtors 10 579,65.96 569,40.98Cash and bank balances 11 419,84.64 781,52.79Other current assets 12 20,35.96 51,04.60Loans and advances 13 497,79.76 567,27.64
2909,42.92 3528,08.77Current liabilities and provisionsLiabilities 14 (3081,30.30) (2746,08.99)Provisions 15 (1187,72.36) (1165,99.43)
(4269,02.66) (3912,08.42)
Net current assets (1359,59.74) (383,99.65)
2292,07.11 3752,92.44
Balance Sheet as at 31st December, 2005
For schedules, contingent liabilities, additional information, segment Signatures to pages : 81, 83, 87 to 97information, related party disclosures and accounting policies and 99 to 105See pages : 81, 87 to 97 and 99 to 105
In terms of our report of even date
Sharmila A. KarvePartnerMembership No. 43229
For and on behalf ofLOVELOCK & LEWESChartered Accountants
Mumbai : 14th February, 2006 Mumbai : 14th February, 2006
M.K. Sharma Vice ChairmanD. Sundaram Finance DirectorRaju Thomas Vice President - FinanceAshok Gupta Company Secretary

200584
HINDUSTAN LEVER LIMITED (CONSOLIDATED)
Cash Flow Statement for the year ended 31st December, 20052005 2004
Rs. lakhs Rs. lakhsA. Cash Flow from Operating Activities :
Profit before taxation and exceptional items 1587,16.25 1461,81.48Adjustments for :Depreciation 138,37.52 195,67.95Foreign Exchange — (1.60)Loss/(Gain) on sale of fixed assets held for disposal — (18.96)Surplus on disposal of investments (net) (28,01.91) (24,87.72)Provision / (Reversal of provision) for diminution in value of (1,10.46) (1,22.13)investments and excess of cost over fair value ofcurrent investments (net)Deficit/(Surplus) on fixed assets sold, scrapped, etc. (net) (4,71.85) 24,44.59Reversal of provision for losses on disposal of fixed assets (1,92.80) (37,09.74)Interest income (48,44.63) (96,55.60)Dividend income (54,10.86) (29,97.94)Interest expenditure 24,20.56 136,24.94
24,25.57 166,43.79
Operating Profit before Working Capital Changes 1611,41.82 1628,25.27Adjustments for :Trade and Other Receivables 55,86.86 32,52.96Inventories 165,63.49 (81,52.19)Trade Payables and Other Liabilities 354,88.34 (55,57.37)
576,38.69 (104,56.60)
Cash generated from operations 2187,80.51 1523,68.67Taxes paid (including fringe benefit tax) (net of refunds) (193,47.34) (251,01.93)
Cash flow before exceptional items 1994,33.17 1272,66.74Compensation under Voluntary Separation Schemes (30,61.07) (43,86.29)Amount Paid for termination of sourcing agreement (5,00.00) —Consideration received on sale of a long-term investment 50,68.51 —Payment made in respect of ice cream restructuring included in exceptional items — (2,28.75)
Net Cash from Operating Activities A 2009,40.61 1226,51.70
B. Cash Flow from Investing Activities :Purchase of fixed assets (241,28.40) (338,49.27)Sale proceeds of land included in exceptional items 16,20.00 94,85.19Sale of fixed assets 159,28.56 45,58.30Capital subsidy received 5.00 4.50Purchase of investments (7717,70.37) (8545,22.53)Sale of investments 8102,02.96 8873,32.65Consideration received on disposal of a subsidiary company 44,46.18 —Consideration received on sale of Functionalised Bio-polymers business 4,15.00 —Interest received 73,19.51 107,24.31Dividend received 54,10.86 29,97.94
Net Cash used in Investing Activities B 494,49.30 267,31.09
C. Cash Flow from Financing Activities :Dividends paid (1100,15.32) (1209,67.97)Tax on distributed profits (154,36.23) (163,23.78)Interest paid (81,69.51) (131,54.07)Bank overdrafts (net) (2,67.34) 17,60.90Proceeds from borrowings 569,93.15 781,09.25Repayment of debentures (1320,74.63) —Repayments of borrowings (775,88.63) (898,95.60)
Net Cash used in Financing Activities C (2865,58.50) (1604,71.27)
Net Increase / (Decrease) in Cash and Cash equivalents....... (A+B+C) (361,68.59) (110,88.48)Cash and Cash equivalents as at 1st January 781,53.23 892,41.71(Opening Balance)Cash and Cash equivalents as at 31st December 419,84.64 781,53.23(Closing Balance)
For Notes Signatures to pages : 84 and 98See page : 98In terms of our report of even dateSharmila A. KarvePartnerMembership No. 43229
For and on behalf ofLOVELOCK & LEWESChartered AccountantsMumbai : 14th February, 2006 Mumbai : 14th February, 2006
M. K. Sharma Vice ChairmanD. Sundaram Finance DirectorRaju Thomas Vice President - FinanceAshok Gupta Company Secretary

2005 85
HINDUSTAN LEVER LIMITED (CONSOLIDATED)
2005 2004Rs. lakhs Rs. lakhs
INCOME1. Sales 12375,73.52 11475,30.42
Less : Excise duty (918,66.74) (969,81.93)11457,06.78 10505,48.49
Share of Joint Ventures - Schedule 20 (b) 108,75.82 92,71.5211565,82.60 10598,20.01
Sales include duty drawback and licence premium on exports 19,61.66 17,25.802. Other income
Income from services rendered 153,70.25 116,35.75Income from property development activity 1,93.91 2,98.71Interest income – bank and other accounts (gross) 24,19.02 40,51.06Interest income – non trade (gross) (Note 7) 20,72.63 53,26.06Dividend income – trade - long-term (gross) 19,45.80 11,20.30Dividend income – non trade - long-term (gross) 96.93 27.89Dividend income – non trade - current (gross) 33,59.13 18,47.35Surplus on disposal of investments (net) (Note 8) 28,01.91 24,87.72Surplus on fixed assets sold etc. 6,03.16 —Miscellaneous income 20,59.49 32,17.14
309,22.23 300,11.98Share of Joint Ventures - Schedule 20 (b) 4,15.64 3,49.09
313,37.87 303,61.07OPERATING EXPENSES3. Materials consumed and Purchase of goods
Raw materials consumed 3712,23.70 3351,35.55Packing materials consumed 983,63.93 832,13.24Purchase of goods 1590,34.02 1485,66.64
4. General expenditureSalaries, wages, bonus, etc. including compensation under voluntary separation schemes 593,41.62 562,79.20Contribution to provident and other funds 46,21.63 38,17.80Workmen and staff welfare expenses 45,51.32 43,83.51Processing charges 153,46.51 166,22.58Consumption of stores and spare parts 65,45.62 62,09.79Repairs and maintenance - Buildings 13,46.32 18,05.94
- Plant 55,96.72 51,88.02- Others 7,98.74 7,62.29
Power, light, fuel and water 190,28.82 179,85.81Rent (Note 16) 95,97.15 42,89.29Rates and taxes 153,08.38 135,20.43Insurance 8,10.07 8,85.52Advertising and sales promotion 1027,98.28 867,07.65Carriage and freight 590,41.29 520,14.26Agents’ commission and brokerage 9,01.37 12,07.92Provision / (write back) for doubtful debts and advances (net) (6,04.93) (10,69.01)Travelling and motor car expenses 132,67.44 122,55.16Deficit on fixed assets sold, scrapped, etc. 1,31.31 24,28.47Miscellaneous expenses (Note 12) 511,43.50 452,78.98
5. StocksOpening stocks : - Work-in-progress 48,95.90 62,12.57
- Processed chemicals 1,09.07 1,71.50- Finished goods 623,88.02 693,32.69
Adjustment to stocks :- As at 18th June, 2004, of Mushroom business — (82.86)
Closing stocks : - Work-in-progress (30,98.02) (48,95.90)- Processed chemicals (91.82) (1,09.07)- Finished goods (552,56.60) (623,88.02)
Excise Duty on Increase / (Decrease) of Finished goods (33,59.10) (21,75.04)10037,80.26 9035,54.91
Share of Joint Ventures - Schedule 20 (b) 91,65.88 72,51.8010129,46.14 9108,06.71
6. Interest paid on bank and other accounts Rs. 23,86.35 lakhs (2004 - Rs. 17,37.61 lakhs), on debentures Rs. 33.00 lakhs (2004 - Rs. 118,86.24 lakhs)and the Share of Joint Ventures Rs. 1.21 lakhs (2004 - Rs. 1.09 lakhs).
7. Interest income - non trade (gross) comprises of Rs. 16,15.83 lakhs (2004 - Rs. 25,63.91 lakhs) and Rs. 4,56.80 lakhs (2004 - Rs. 27,62.15 lakhs) inrespect of long-term and current investments respectively.
8. Surplus on disposal of investments (net) comprises of :- a surplus on disposal of current investments (net) Rs. 27,33.08 lakhs (2004 - Rs. 22,15.40 lakhs)- a surplus on disposal of long term investments (net) Rs. 68.83 lakhs (2004 - Rs. 2,72.32 lakhs)
9. The tax year for the companies incorporated in India being the year ending 31st March, the provision for taxation for the year of these companies isthe aggregate of the provision made for the three months ended 31st March, 2005 and the provision based on the figures for the remaining ninemonths up to 31st December, 2005, the ultimate tax liability of which will be determined on the basis of the figures for the period 1st April, 2005 to31st March, 2006. The tax year for Unilever Nepal Limited (formerly known as Nepal Lever Limited) is the year ending 15th July.
10. The net difference in foreign exchange (i.e. the difference between the spot rates on the dates of the transactions, and the actual rates at which thetransactions are settled/appropriate rates applicable at the year end) debited to the Profit and Loss Account is Rs. 4,75.64 lakhs (2004 - debit ofRs. 8,74.39 lakhs).
11. Operating expenses includeResearch and Development expenses 49,72.65 37,11.34
Notes to Profit and Loss Account

200586
HINDUSTAN LEVER LIMITED (CONSOLIDATED)
Notes to Profit and Loss Account2005 2004
Rs. lakhs Rs. lakhs12. Miscellaneous expenses :
i) is net of credit on reversal / write back of provision for estimated losses on disposal offixed assets rendered surplus Rs. 1,92.80 lakhs (net) (2004 - credit of Rs. 37,09.74 lakhs).
ii) is net of credit on reversal / write back of provision on diminution in value of long-terminvestment Rs. 1,17.00 lakhs (2004 - net charge of Rs. 7.02 lakhs)
iii) include charge in respect of excess of cost over fair value of current investments(net) Rs. 6.54 lakhs [2004 - credit of Rs. 1,29.54 lakhs (net)]
13. Exceptional Itemsi) Profit arising out of diposal of land 15,90.00 94,85.19ii) Profit arising out of disposal of a long-term investment 29,04.44 21,37.34iii) Profit arising out of disposal of a subsidiary company 46,34.29 —iv) Reduction in Hindustan Lever Limited‘s liability for retirement and other employee benefits,
arising out of decrease in annuity rates announced by Life Insurance Corporation of India,effective December 2004 — 69,10.00Total exceptional income 91,28.73 185,32.53
v) Provision for impairment of sea food export business assets (38,43.96) —vi) Restructuring costs across businesses comprising :
a) Provision for estimated loss on fixed assets rendered surplus — (18,38.67)b) Compensation under Voluntary Separation Schemes (49,80.36) (75,84.68)c) Amount paid / payable for termination of sourcing arrangement (15,00.00) —d) Other costs — (15,20.00)
vii) Exit costs incurred in relation to discontinued Confectionery business — (30,45.00)viii) Provision for loss arising out of disposal of Mushroom undertaking — (3,01.17)
Total exceptional expenditure (103,24.32) (142,89.52)Net (11,95.59) 42,43.01Taxation on the above - Credit / (Charge) on current tax 2,28.47 5,07.97
- Credit on deferred tax 23,86.96 13,29.73One time reduction in tax liability arising from amalgamation ofTOC Disinfectants Limited with the Company 23,20.00 —Total tax credit (net) 49,35.43 18,37.70Exceptional items (net of tax) 37,39.84 60,80.71
14. i) Functionalised Bio-polymers Business (FBP) was sold by Hindustan Lever Limited effective 1st September, 2005.ii) Hindustan Lever Limited has transferred the equity shares held in Rossell Industries Limited, to a third party during the year, by virtue of a
share purchase agreement.iii) In view of the above, the current year’s figures are accordingly, not comparable to those of the previous year.
15. The cost of property development activity including movements in work-in-progress are as under :Property Development Activity – Work-in-progress as at 1st January 48.47 88.07Add : Miscellaneous expenses 6.55 5.07
55.02 93.14Less : Property Development Activity – Work-in-progress as at 31st December 48.77 48.47Cost of property sold, included in miscellaneous expenses 6.25 44.67
16. Rent is net of write back of provision made in earlier years arising out of Supreme Court decision in respect of a legal dispute Rs. Nil lakhs(2004 - Rs. 41,59.85 lakhs).
17. Earnings Per Share has been computed as under :Net Profit (Rs. lakhs) 1355,92.51 1208,39.94Weighted average number of Equity shares outstanding 2,20,12,43,793 2,20,12,43,793Earnings Per Share (Rs.) - Basic and Diluted (Face value of Re.1 per share) 6.16 5.49
18. The significant leasing arrangements of the Companies in the Group are in respect of operating leases for premises (residential, office, stores, godownetc.) and computers. These leasing arrangements which are not non-cancellable range between 11 months and 10 years generally, or longer, and areusually renewable by mutual consent on mutually agreeable terms. The aggregate lease rentals payable are charged as Rent under note 4 to profit andloss account.
19. The Consolidated Financial Statements have been prepared in accordance with Accounting Standard 21 (AS 21) - “Consolidated Financial Statements”,Accounting Standard 23 (AS 23) - “Accounting for Investments in Associates in Consolidated Financial Statements” and Accounting Standard 27(AS 27) - “Financial Reporting of Interest in Joint Ventures”, issued by the Institute of Chartered Accountants of India. Refer Schedule 20 to the BalanceSheet.
20. Taxation adjustments of previous years include interest, etc.21. During the year, Hindustan Lever Limited has utilised provision made in an earlier year for restructuring of the ice cream business as follows :
2005 2004Rs. lakhs Rs. lakhs
Fixed assets write off 40.55 —Raw/Packing materials — 0.61Other items — 2,28.14
40.55 2,28.75
22. The previous year’s figures have been regrouped / restated wherever necessary to conform to this year’s classification.

2005 87
HINDUSTAN LEVER LIMITED (CONSOLIDATED)
2005 2004Rs. lakhs Rs. lakhs
1. CAPITALAuthorised2,25,00,00,000 equity shares of Re. 1 each 225,00.00 225,00.00Issued and subscribed2,20,12,43,793 equity shares of Re. 1 each fully called and paid up 220,12.44 220,12.44Of the above shares(i) 1,13,48,49,460 Shares of Re. 1 each are held by Unilever PLC., the holding
company, and its subsidiaries including 79,48,06,750 sharesof Re. 1 each held by Unilever PLC.
(ii) 79,19,31,203 Shares of Re. 1 each are allotted as fully paid up pursuant to acontract for a consideration other than cash.
(iii) 1,31,68,54,620 Shares of Re. 1 each are allotted as fully paid up bonus sharesby way of capitalisation of share premium and accumulated profits.
220,12.44 220,12.44
Notes :1. Hindustan Lever Ltd. has granted share options under the Company’s Employees’ Stock Option Scheme and share options
outstanding as at 31st December, 2005 are 1,19,32,145 (2004 - 1,06,48,225). Of these 21,74,400 (2004 - 21,99,200) optionshave vested in 2004, 28,62,905 (2004 - 29,15,285) have vested in 2005, 38,51,990 will vest in 2006 (2004 - 39,59,390),15,08,350 in 2007 (2004 - 15,74,350) and 15,34,500 in 2008 (2004 - Nil).
2. 2,268 equity shares of Re. 1 each are due to be issued to the minority shareholders of International Fisheries Limited and TOCDisinfectants Limited, which merged with Hindustan Lever Ltd. during the year.
Rs. lakhs
2. RESERVES AND SURPLUS As at As at31st December, Additions Deductions 31st December,
2004 2005CAPITAL RESERVESCapital Reserve 4,24.34 — — 4,24.34Capital Subsidy 3,30.66 5.00 — 3,35.66Capital Redemption Reserve 1,15.00 — — 1,15.00Share Premium Account 263,26.13 — — 263,26.13Revaluation Reserve 27,65.11 — (e) (26,98.52) 66.59Other Reserves (c) 2,51.05 — — 2,51.05Employee Stock Options (d) 4,09.67 38.37 — 4,48.04Total Capital Reserves 306,21.96 43.37 (26,98.52) 279,66.81REVENUE RESERVESExport Profit Reserve 12,26.40 — — 12,26.40Development Allowance Reserve 26.72 — — 26.72General Reserve 1100,69.59 (a) 142,00.00 (f) (37,65.63) 1205,03.96Total Revenue Reserves 1113,22.71 142,00.00 (37,65.63) 1217,57.08PROFIT AND LOSS ACCOUNT BALANCE 498,44.62 (a) 452,12.49 (b) (498,44.62) 452,12.49TOTAL RESERVES - 31st December, 2005 1917,89.29 594,55.86 (563,08.77) (g) 1949,36.38TOTAL RESERVES - 31st December, 2004 1955,89.31 630,48.80 (668,48.82) (g) 1917,89.29(a) Transfer from profit and loss account(b) Transfer to profit and loss account(c) Not available for capitalisation / declaration of dividend / share valuation.(d) In respect of options granted under the Company’s stock option scheme, in accordance with guidelines issued by Securities and
Exchange Board of India, the accounting value of options (based on market price of the share on the date of the grant of the option)is accounted as deferred employee compensation, which is amortised on a straight line basis over the vesting period. Consequentlysalaries, wages, bonus, etc. includes Rs.38.37 lakhs (2004 - Rs. 2,03.80 lakhs) being amortisation of deferred employee compensationafter adjusting for reversals on account of options lapsed.
Rs. lakhsEmployee Stock Options As at As at
31st December, Additions Deductions 31st December,2004 2005
Employee Stock Options Outstanding 4,48.04 — — 4,48.04Less : Deferred Employee Compensation (38.37) — 38.37 —Employee Stock Options 4,09.67 — 38.37 4,48.04
(e) Represents deduction on disposal of a subsidiary.
(f) Includes deduction on disposal of a subsidiary and reversal of goodwill on consolidation, pertaining to a subsidiary, on its amalgamationwith Hindustan Lever Ltd.
(g) Including share of Joint Ventures Rs. 21,26.11 lakhs (2004 - Rs. 9,51.20 lakhs).
Schedules to Balance Sheet

200588
HINDUSTAN LEVER LIMITED (CONSOLIDATED)
3. SECURED LOANS 2005 2004Rs. lakhs Rs. lakhs
9% Secured Redeemable Non-Convertible Debentures of the face value of Rs.6 each — 1320,74.63Debentures held by :Directors of Hindustan Lever Limited - Rs. Nil lakhs (2004 - Rs. 6.21 lakhs)The Secretary of Hindustan Lever Limited - Rs. Nil lakhs (2004 - Rs. 0.08 lakh)
A — 1320,74.63Loans and Advances from Banks :- Bank overdrafts 27,59.04 43,69.18
Secured by hypothecation of stocks, book debts, etc.- Export Packing Credit 12,38.79 102,94.28
Secured by a pari passu charge on certain current assets.B 39,97.83 146,63.46
Total (A+B) 39,97.83 1467,38.09
Share of Joint Ventures - Schedule 20 (b) 1,25.19 —41,23.02 1467,38.09
4. UNSECURED LOANSShort- term loans & advances :From Banks- Export Packing Credit 28,69.05 —- Overdrawn book balance on current account 97.67 17,49.10- Term Loan 44,00.00 60,00.00Other loans and advances- Other than from Banks 3,75.06 59,38.22(repayable before 31st December, 2005 - Rs. 13.37 lakhs; 2004 - Rs. 4.46 lakhs)
77,41.78 136,87.32Share of Joint Ventures - Schedule 20 (b) — —
77,41.78 136,87.32
Schedules to Balance Sheet
5. FIXED ASSETSRs. lakhs
GROSS BLOCK DEPRECIATION NET BLOCK
Cost/ Deductions/ Cost/ As at Adjustments Deductions/ Impairment As at As at As at Valuation as at Additions Transfers Valuation 31st Additions during the Transfers Loss for the 31st 31st 31st31st December, as at December, year year December, December, December,
2004 31st 2004 (c) 2005 2005 2004December,
2005
Goodwill on consolidation 237,25.63 — (92,20.86) 145,04.77 230,45.04 1,85.18 4,95.41 (92,20.86) — 145,04.77 — 6,80.59Land - Freehold 64,67.75 29.93 (7,29.29) 57,68.39 — — — — — — 57,68.39 64,67.75
- Leasehold 86,97.88 1,08.21 (52,71.67) 35,34.42 2,29.81 27.57 — — — 2,57.38 32,77.04 84,68.07Buildings 650,15.14 48,56.25 (70,86.91) 627,84.48 125,24.63 16,05.51 — (31,41.51) 11,44.08 121,32.71 506,51.77 524,90.51Railway sidings 0.59 — — 0.59 0.59 — — — — 0.59 — —Plant & machinery 1292,75.86 165,58.70 (93,97.13) 1364,37.43 506,49.52 94,85.65 — (51,43.44) 21,33.51 571,25.24 793,12.19 786,26.34Furniture, fittings 212,25.32 11,43.52 (22,18.92) 201,49.92 141,26.54 13,33.08 — (17,73.90) 24.74 137,10.46 64,39.46 70,98.78& office equipmentTrademarks 165,49.11 — — 165,49.11 163,49.10 — — — 2,00.01 165,49.11 — 2,00.01Goodwill 6,34.15 71.16 — 7,05.31 2,92.53 13.34 — — 3,41.62 6,47.49 57.82 3,41.62Software — 7,76.68 — 7,76.68 — 1,55.34 — — — 1,55.34 6,21.34 —Motor vehicles 44,48.82 5,50.05 (18,57.13) 31,41.74 23,91.46 5,08.39 — (13,13.49) — 15,86.36 15,55.38 20,57.36Total 2760,40.25 240,94.50 (357,81.91) 2643,52.84 1196,09.22 133,14.06 4,95.41 (205,93.20) 38,43.96 1166,69.45 1476,83.39 1564,31.03Share of Joint Ventures 64,75.23 3,37.59 (6,58.69) 61,54.13 23,46.70 5,23.46 — (3,57.94) — 25,12.22 36,41.91 41,28.53Schedule -20 (b)Total - 2005 2825,15.48 244,32.09 (364,40.60) 2705,06.97 1219,55.92 138,37.52 4,95.41 (209,51.14) 38,43.96 1191,81.67 1513,25.30 1605,59.56Total - 2004 2675,89.23 318,05.62 (168,79.37) 2825,15.48 1117,94.77 196,49.23 — (94,88.08) — 1219,55.92 1605,59.56
NOTES :a) Capital expenditure commitments - Rs. 32,59.82 lakhs (2004 - Rs. 31,17.96 lakhs)b) The title deeds of immovable properties aggregating Rs. 43,81.22 lakhs (2004 - Rs. 39,11.84 lakhs), acquired on transfer of businesses / undertakings are in the process of being transferred in the name of
the respective Companies.c) The impairment of sea food exports business assets is charged to exceptional items (refer note 13 (v) of the Profit and Loss Account).

2005 89
HINDUSTAN LEVER LIMITED (CONSOLIDATED)
Schedules to Balance Sheet2005 2004
Rs. lakhs Rs. lakhs6. INVESTMENTS
(Long-term, Unquoted, unless otherwise stated)A. INVESTMENTS IN GOVERNMENT SECURITIES
7 Year National Savings Certificates - II Issue 1.14 1.1412 Year Post Office National Defence Certificates — 0.12Government of India stock of the face value of Rs. 2,03.24 lakhs 2,28.83 27,71.05(2004 - Rs. 27,03.24 lakhs) (Current Investments) (quoted)Government Stocks/Bonds(Quoted) 4,98.53 4,98.53Treasury Bills of the face value of Rs. 134,00.00 lakhs 128,59.77 203,05.19(2004 - Rs. 205,00.00 lakhs) (Current Investments)Treasury Bills of the face value of Rs. 20,00.00 lakhs — —(2004 - Nil) (Current Investments)[taken over (refer note 14(i)) and sold during the year]Treasury Bills of the face value of Rs. 17,76.00 lakhs — —(2004 - Nil) (Current Investments)[taken over (refer note 14(i)) and sold during the year]Certificates of Deposit of the face value of Rs. 160,00.00 lakhs 155,81.43 —(2004 - Rs. Nil ) (Current Investments)Share of Joint Ventures - Schedule - 20(b) 0.12 0.12
TOTAL - A 291,69.82 235,76.15
B. TRADE INVESTMENTS AT COST - SHARESIn AssociatesVashisti Detergents Limited 1,69,04,140 Equity shares of Rs.10 each fully paid (quoted)
Cost of acquisition (including goodwill ofRs. 7,19.66 lakhs) 29,40.00 29,40.00Add : Group Share of Profit/(losses) upto 31.12.05 (80.60) 28,59.40 83.62 30,23.62
In Other CompaniesTata Chemicals Limited 1,19,32,000 (2004-1,42,32,000) Equity shares of Rs.10 112,53.15 134,22.29
each fully paid (quoted) (23,00,000shares sold during the year)
Dugdha Sahakari Kraya-Vikraya Samiti Limited 50 Shares of Rs.100 each fully paid 0.05 0.05Hi Tech Surfactants Limited 58,400 Equity shares of Rs.10 each fully paid 5.87 5.87Aquagel Chemicals Private Limited 2,84,040 Equity shares of Rs.100 each fully paid 2,65.56 2,65.56
9,13,000 7% Cumulative Redeemable Preference Sharesof Rs.100 each fully paid 9,13.00 9,13.00
Super Bazar Co-op. Stores Limited 1,000 Equity shares of Rs.10 each fully paid 0.10 0.10Snowman Frozen Foods Limited 38,32,000 Equity shares of Rs.10 each fully paid 5,01.71 5,01.71S.C.Johnson Products Private Limited 11,04,000 Equity shares of Rs.5 each fully paid 7.02 7.02Coffee Futures India Exchange Limited 1 Equity share of Rs.10,000 each fully paid 0.10 0.10Goldfield Fragrances Private Limited 7,164 Equity shares of Rs.100 each fully paid 2.40 2.40ABC Tea Workers Welfare Services 13,926 Equity shares of Rs.10 each fully paid — 1.39Project India Blend Limited 1,00,000 Equity shares of Rs.10 each fully paid — 10.00Share of Joint Ventures- Schedule - 20(b) 62.52 12.00
TOTAL - B 158,70.88 181,65.11
C. NON-TRADE INVESTMENTS AT COSTSHARES, DEBENTURES & BONDS
Emergents Genetics India Private Limited (2004-7,312,500) Equity shares of Rs. 10 each fully paid — 8,41.66(formerly Paras Extra Growth Seeds Limited) (Sold during the year)Comfund Financial Services India Limited 2,40,000 Equity shares of Rs. 10 each fully paid 24.00 24.00Assam Bengal Cereals Limited 8,284 Equity shares of Rs. 10 each fully paid 0.83 0.83The Bengal Chamber of Commerce 14 6 1/2% Non-redeemable Registered Debentures 0.17 0.17& Industry (Face value Rs. 0.14 lakhs)Woodlands Hospital and 1 5% Non-redeemable Registered Debenture stock 0.27 0.27Medical Research Centre Limited (Face value Rs. 0.27 lakhs)
44 1/2% Debentures of Rs.100 each — —(Face value Rs. 0.05 lakhs : Cost Rs. 100)
Shillong Club Limited 56 5% Debentures of Rs. 100 each (Cost Rs. Nil) — —The Nilgiri Co-operative Enterprises Limited 200 Shares of Rs.100 each fully paid 0.20 0.20Biotech Consortium India Limited 1,00,000 Equity shares of Rs. 10 each fully paid 10.00 10.00Scooters India Limited 10,000 Equity shares of Rs. 10 each fully paid (Quoted) 1.00 1.00Annamallais Ropeway Company Limited 1,150 Ordinary shares of Rs. 100 each fully paid (Cost Rs. Nil) — —Saraswat Co-operative Bank Limited 1,000 Equity shares of Rs. 10 each fully paid 0.10 0.10
1,005 Equity shares of Rs. 10 each fully paid (Refer note 14(i)) 0.10 0.10National Bank for Agriculture (2004-52,530) 8% Capital Gains Bonds of Rs.10,000 each — 52,53.00and Rural Development (Redeemed during the year)
15,500 5.25% Capital Gains Bonds of Rs. 10,000 each 15,50.00 15,50.0017,484 5.25% Capital Gains Bonds of Rs. 10,000 each 17,48.39 —
(Purchased during the year)9,250 5.50% Capital Gains Bonds of Rs. 10,000 each 9,25.00 9,25.00
870 5.20% Capital Gains Bonds of Rs. 10,000 each 87.00 —(Purchased during the year)
72,000 5.40% Capital Gains Bonds of Rs. 10,000 each 72,00.00 —(Purchased during the year)
13,500 5.20% Capital Gains Bonds of Rs. 10,000 each 13,50.00 —(Purchased during the year)

200590
HINDUSTAN LEVER LIMITED (CONSOLIDATED)
2,000 5.42% Capital Gains Bonds of Rs.10,000 each 2,00.00 —(Purchased during the year)
National Highways Authority of India (2004-131,250) 8% Capital Gains Bonds of Rs.10,000 each — 131,25.00(Redeemed during the year)
National Housing Bank 50,000 5.50% Capital Gains Bonds 2002 of Rs.10,000 each 50,00.00 50,00.003,075 5.10% Capital Gains Bonds 2002 of Rs.10,000 each 3,07.50 3,07.50
OTHERSUnit Trust of India 48,77,837 Units of Rs.100 each under the 6.75% Tax Free US 64 Bonds 50,04.54 50,04.54
(Current Investments) (Quoted)5,000 Master Gain '92 units of Rs.10 each 0.50 0.50
Prudential ICICI Mutual Fund 1,00,00,000 Units Prudential ICICI Fixed Maturity Plan - S 25 - Yearly Plan - 10,00.00 —December 05 - Dividend (1,00,00,000 Units Purchased duringthe year) (Current Investments)
— Units Prudential ICICI Floating Rate Fund - Plan C - Dividend (5,41,94,775 — —Units Purchased, 10,59,603 Units cumulated, 5,52,54,378Units sold during the year) (Current Investments)
5,55,69,900 Units Prudential ICICI Floating Rate Fund - Plan D - Dividend 55,56.99 —(5,52,77,029 Units Purchased, 2,92,871 Unitscumulated during the year) (Current Investments)
1,46,00,399 Units Prudential ICICI Long Term Plan - Dividend (1,42,63,301 Units 15,25.48 —Purchased, 3,37,098 Units cumulated during the year)(Current Investments)Units Prudential ICICI Liquid - Institutional Plus - Daily Dividend — —(29,50,25,947 Units Purchased, 65,844 Units cumulated,29,50,91,791 Units sold during the year) (Current Investments)
1,25,11,745 (2004 - 21,16,17,030) (Units Prudential ICICI Liquid - Institutional Plus - 21,00.00 333,00.00Growth (1,25,11,745 Units Purchased, 21,16,17,030 Units soldduring the year) (Current Investments)
— (2004 - 4,28,41,680) (Units Prudential ICICI Liquid - Institutional Plus - — 51,06.24Monthly Dividend (47,21,20,809 Units Purchased, 5,869,856Units cumulated, 52,08,32,345 Units sold during the year)(Current Investments)
— (2004 - 15,18,90,040) (Units Prudential ICICI Liquid - Institutional Plus - — 180,17.78Weekly Dividend (51,24,00,983 Units Purchased, 16,17,341Units cumulated, 66,59,08,364 Units sold during the year)(Current Investments)
— Units Prudential ICICI Liquid - Super Institutional Plan - Daily Dividend — —(1,64,00,000 Units Purchased, 2,543 Units cumulated,1,64,02,543 Units sold during the year) (Current Investments)
9,82,52,700 Units Prudential ICICI Liquid - Super Institutional Plan - Monthly Dividend 98,27.41 —(10,78,31,573 Units Purchased, 3,78,709 Units cumulated, 99,57,582Units sold during the year) (Current Investments)
17,35,27,281 Units Prudential ICICI Liquid - Super Institutional Plan - Weekly Dividend 17,53.58 —(20,86,44,401 Units Purchased, 4,33,669 Units cumulated, 19,15,50,789Units sold during the year) (Current Investments)
78,12,927 Units Prudential ICICI Short Term Institutional Plan - Growth (78,12,927 10,00.12 —Units Purchased during the year) (Current Investments)
2,30,41,603 Units Prudential ICICI Short Term Institutional Plan - Monthly Dividend 25,29.44 —(3,18,16,739 Units Purchased, 3,04,961 Units cumulated, 90,80,097Units sold during the year) (Current Investments)
2,66,00,000 Units Prudential ICICI Fixed Maturity Plan - S 25 - Yearly Plan - December 05 - 26,60.00 —Dividend (2,66,00,000 Units Purchased during the year)(Current Investments)Units Prudential ICICI Floating Rate Fund - Plan C - Dividend (74,83,985 — —Units Purchased, 2,00,399 Units cumulated, 76,84,384 Units soldduring the year) (Current Investments)
77,28,264 Units Prudential ICICI Floating Rate Fund - Plan D - Dividend (76,87,532 7,71.83 —Units Purchased, 40,732 Units cumulated during the year)(Current Investments)Units Prudential ICICI Liquid - Institutional Plus - Daily Dividend — —(23,288,191 Units Purchased, 8,095 Units cumulated,2,32,96,286 Units sold during the year) (Current Investments)Units Prudential ICICI Liquid - Institutional Plus - Weekly Dividend — —(3,95,97,652 Units Purchased, 83,945 Units cumulated,3,96,81,597 Units sold during the year) (Current Investments)
1,69,72,713 Units Prudential ICICI Liquid - Super Institutional Plan - Monthly Dividend 16,97.56 —(1,99,97,204 Units Purchased, 65,421 Units cumulated,30,89,912 Units sold during the year) (Current Investments)
47,67,810 Units Prudential ICICI Liquid - Super Institutional Plan - Weekly Dividend 4,76.96 —(1,07,55,306 Units Purchased, 10,239 Units cumulated,59,97,735 Units sold during the year) (Current Investments)(2004 - 81,00,373) Units of Prudential ICICI Institutional Liquid — 9,66.18Plan-Growth (1,04,83,780 units purchased, 1,91,754 unitscumulated ,1,87,75,907 units sold during the year)(Current Investments)
Schedules to Balance Sheet2005 2004
Rs. lakhs Rs. lakhs6. INVESTMENTS (Contd...)
(Long-term, Unquoted, unless otherwise stated)

2005 91
HINDUSTAN LEVER LIMITED (CONSOLIDATED)
DSP Merrill Lynch Mutual Fund 1,50,00,000 Units DSP Merrill Lynch Fixed Term Plan - Series 1 - Dividend 15,00.00 —(15,000,000 Units Purchased during the year) (Current Investments)
3,00,00,000 Units DSP Merrill Lynch Fixed Term Plan - Series 1A - Dividend 30,00.00 —(3,00,00,000 Units Purchased during the year)(Current Investments)Units DSP Merrill Lynch Floating Rate Fund - Weekly Dividend — —(99,79,234 Units Purchased, 1,01,230 Units cumulated,1,00,80,464 Units sold during the year) (Current Investments)Units DSP Merrill Lynch Liquidity Fund - Dividend (4,43,32,678 Units — —Purchased, 97,239 Units cumulated, 4,44,29,917 Units soldduring the year) (Current Investments)Units DSP Merrill Lynch Liquidity Fund - Daily Dividend (49,95,005 — —Units Purchased, 633 Units cumulated, 49,95,638 Unitssold during the year) (Current Investments)Units DSP Merrill Lynch Liquidity Fund - Institutional Plan - Daily Dividend — —(2,39,953 Units Purchased, 256 Units cumulated,2,40,209 Units sold during the year) (Current Investments)
2,42,965 Units DSP Merrill Lynch Liquidity Fund - Institutional Plan - Weekly Dividend 24,30.53 —(6,40,983 Units Purchased, 1,664 Units cumulated, 3,99,682 Units soldduring the year) (Current Investments)
Standard Chartered Mutual Fund (2004-3,08,81,499) (Units Grindlays Cash Fund - Institutional Plan - — 35,80.10Growth (2,06,15,621 Units purchased, 2,95,952 Unitscumulated, 5,17,93,071 units sold during the year)(Current Investments)Units Grindlays Cash Fund - Plan C - Super Institutional Plan - Daily — —Dividend (74,75,00,000 Units Purchased, 2,34,353Units cumulated, 74,77,34,353 Units sold during the year)(Current Investments)(2004 - 4,54,46,466 ) (Units Grindlays Cash Fund - Plan C — 47,00.00 - Super Institutional Plan - Growth (4,54,46,466 Units sold during theyear) (Current Investments)
4,43,98,133 Units Grindlays Cash Fund - Plan C - Super Institutional Plan - Monthly 44,40.48 —Dividend (14,69,78,239 Units Purchased, 22,42,859Units cumulated, 10,48,22,965 Units sold during the year)(Current Investments)
1,08,76,476 (2004 -14,49,83,087) (Units Grindlays Cash Fund - Plan C - 10,87.65 144,98.30Super Institutional Plan - Weekly Dividend (65,92,82,335 Units Purchased,12,44,738 Units cumulated, 79,46,33,684 Units sold duringthe year) (Current Investments)Units Grindlays Floating Rate Fund - Institutional Plan - Long Term Plan - — —Monthly Dividend (1,99,39,733 Units Purchased, 1,49,613 Units cumulated,2,00,89,346 Units sold during the year) (Current Investments)Units Grindlays Floating Rate Fund - Short Term Plan - Plan C - Super — —Institutional Plan - Daily Dividend (8,60,00,000 Units Purchased, 12,043Units cumulated, 8,60,12,043 Units sold during the year)(Current Investments)
2,05,12,561 Units Grindlays Floating Rate Fund - Short Term Plan - Plan C - Super 20,54.33 —Institutional Plan - Monthly Dividend (2,00,48,933 Units Purchased,4,63,628 Units cumulated during the year) (Current Investments)Units Grindlays Floating Rate Fund - Short Term Plan - Plan C - Super — —Institutional Plan - Weekly Dividend (2,59,82,912 Units Purchased, 1,84,703Units cumulated, 2,61,67,615 Units sold during the year)(Current Investments)Units Grindlays Fixed Maturity Plan - 11 - Growth (1,50,00,000 Units — —Purchased, 1,50,00,000 Units sold during the year)(Current Investments)
2,00,00,000 Units Grindlays Fixed Maturity Plan - 17 - Dividend (2,00,00,000 Units 20,00.00 —Purchased during the year) (Current Investments)(2004-2,00,00,000 ) (Units Grindlays Fixed Maturity Plan - Annual Plan - — 20,00.00Growth(, 2,00,00,000 Units sold during the year) (Current Investments)
1,50,00,000 Units Grindlays Fixed Maturity Plan - Annual Plan 4 - Institutional Plan - 15,00.00 —Growth (1,50,00,000 Units Purchased during the year) (Current Investments)
2,62,19,239 Units Grindlays Super Saver Investment Fund - Short Term - Plan C - Super 26,24.55 —Institutional Plan - Monthly Dividend (2,59,37,260 Units Purchased, 2,81,979Units cumulated during the year) (Current Investments)Units Grindlays Cash Fund - Plan C - Super Institutional Plan - Daily — —Dividend (50,00,000 Units Purchased, 586 Units cumulated,50,00,586 Units sold during the year) (Current Investments)
41,18,522 Units Grindlays Cash Fund - Plan C - Super Institutional Plan - Monthly 4,11.92 —Dividend (2,39,70,359 Units Purchased, 1,21,001 Unitscumulated, 1,99,72,838 Units sold during the year)(Current Investments)Units Grindlays Cash Fund - Super Institutional Plan - Weekly Dividend — —(1,46,05,539 Units Purchased, 10,448) Units cumulated, 1,46,15,987 Unitssold during the year) (Current Investments)
Schedules to Balance Sheet2005 2004
Rs. lakhs Rs. lakhs6. INVESTMENTS (Contd...)
(Long-term, Unquoted, unless otherwise stated)

200592
HINDUSTAN LEVER LIMITED (CONSOLIDATED)
Units Grindlays Cash Fund - Weekly Dividend (7,84,612 — —Units Purchased, 380 Units cumulated, 7,84,992 Units soldduring the year) (Current Investments)Units Grindlays Cash Fund - Weekly Dividend (7,35,712Units Purchased, 6,610 Units cumulated, 7,42,322 Units soldduring the year) (Current Investments)
HDFC Mutual Fund Units HDFC Cash Management Fund - Savings Plan - Daily Dividend — —(7,05,12,580 Units Purchased, 8,689 Units cumulated,705,21,269 Units sold during the year) (Current Investments)(2004 - 4,56,66,454) (Units HDFC Cash Mgmt Fund - Savings — 60,00.00Plan - Growth (4,56,66,454 Units sold during the year)(Current Investments)Units HDFC Cash Management Fund - Savings Plan - WeeklyDividend — —(75,24,455 Units Purchased, 75,24,455 Units sold during theyear) (Current Investments)
4,99,33,636 Units HDFC Cash Management Fund - Savings Plus - Dividend 50,02.45 —(8,28,46,524 Units Purchased, 20,32,199 Units cumulated,3,49,45,087 Units sold during the year) (Current Investments)Units HDFC High Interest Fund - Short Term Plan - Dividend — —(47,34,894 Units Purchased, 32,682 Units cumulated, 47,67,576Units sold during the year) (Current Investments)
1 Units HDFC Liquid Fund - Premium Plus Plan - Weekly Dividend — —(73,78,562 Units Purchased, 64,847 Units cumulated,74,43,408 Units sold during the year) (Current Investments)
Birla Mutual Fund (2004-89,09,684) (Units Birla Bond Plus - Institutional Plan -Dividend — 9,26.64(89,09,684 Units sold during the year) (Current Investments)Units Birla Cash Plus - Institutional Premium Plan - Daily — —Dividend (15,66,94,048 Units Purchased, 47,665 Unitscumulated, 15,67,41,713 Units sold during the year)(Current Investments)Units Birla Cash Plus - Institutional Premium Plan - Fortnightly — —Dividend (2,88,11,613 Units Purchased, 1,28,320 Unitscumulated, 2,89,39,933 Units sold during the year)(Current Investments)
5,49,71,920 Units Birla Cash Plus - Institutional Premium Plan - Monthly 54,99.06 —Dividend (5,39,63,683 Units Purchased, 10,08,237 Unitscumulated during the year) (Current Investments)Units Birla Cash Plus - Institutional Premium Plan - Weekly — —Dividend (16,39,14,823 Units Purchased, 4,41,671 Unitscumulated, 16,43,56,494 Units sold during the year)(Current Investments)
99,92,107 Units Birla Fixed Maturity Plan - Quarterly Series 2 - December 05 - 10,00.00 —Dividend (99,92,107 Units Purchased during the year) (Current Investments)
5,00,00,000 Units Birla Fixed Term Plan - Series A - Growth (5,00,00,000 Units 50,00.00 —Purchased during the year) (Current Investments)
Deutsche Mutual Fund Units Deutsche Floating Rate Fund - Monthly Dividend (97,80,679 Units — —Purchased, 97,80,679 Units sold during the year)(Current Investments)Units Deutsche Floating Rate Fund - Weekly Dividend (3,11,57,073 Units — —Purchased, 99,177 Units cumulated, 3,12,56,250 Units soldduring the year) (Current Investments)
1,00,00,000 Units Deutsche Fixed Term Fund - 389 Days - Growth (1,00,00,000 Units 10,00.00 —Purchased during the year) (Current Investments)
54,81,837 Units Deutsche Fixed Term Fund - Series 4 - Growth (1,00,00,000 Units 5,45.98 —Purchased, 45,18,163 Units sold during the year)(Current Investments)(2004 -1,50,71,306) Units Deutsche Insta Cash Plus Fund - — 16,00.00Growth (1,50,71,306 Units sold during the year)(Current Investments)Units Deutsche Insta Cash Plus Fund - Institutional Plan - Daily Dividend — —(6,68,69,605 Units Purchased, 14,620 Units cumulated,6,68,84,225 Units sold during the year) (Current Investments)Units Deutsche Insta Cash Plus Fund - Institutional Plan - Weekly Dividend — —(11,68,27,776 Units Purchased, 5,23,133 Units cumulated,11,73,50,909 Units sold during the year) (Current Investments)(2004 -1,19,69,835) Units Deutsche Short Maturity Fund - — 12,11.11Monthly Dividend (43,990 Units cumulated, 1,20,13,825Units sold during the year) (Current Investments)Units Deutsche Short Maturity Fund - Weekly Dividend — —(98,09,166 Units Purchased, 1,90,897 Units cumulated,1,00,00,063 Units sold during the year) (Current Investments)
HSBC Mutual Fund (2004 -1,49,65,019) Units HSBC Cash Fund - Institutional Plan - Growth — 16,00.00(1,49,65,019 Units sold during the year) (Current Investments)Units HSBC Cash Fund - Institutional Plus - Daily Dividend — —(4,19,76,494 Units Purchased, 17,703 Units cumulated,4,19,94,197 Units sold during the year) (Current Investments)
2005 2004Rs. lakhs Rs. lakhs
6. INVESTMENTS (Contd...)(Long-term, Unquoted, unless otherwise stated)
Schedules to Balance Sheet

2005 93
HINDUSTAN LEVER LIMITED (CONSOLIDATED)
2,51,73,398 (2004-19,25,63,707) Units HSBC Cash Fund - Institutional 25,19.43 192,63.49Plus - Monthly Dividend (16,36,25,243 Units Purchased,8,57,539 Units cumulated, 33,18,73,091 Units sold duringthe year) (Current Investments)(2004 -7,50,02,767) (Units HSBC Cash Fund - Institutional Plus - — 75,01.92Weekly Dividend (1,67,65,862 Units Purchased, 56,189 Unitscumulated, 9,18,24,818 Units sold during the year)(Current Investments)
1,80,44,571 Units HSBC Floating Rate Fund - Short Term Plan - Institutional Plus - 18,04.82 —Daily Dividend (1,79,96,401 Units Purchased, 48,170 Units cumulatedduring the year) (Current Investments)
3,88,29,717 Units HSBC Floating Rate Fund - Short Term Plan - Institutional Plus - 38,85.07 —Monthly Dividend (3,86,76,366 Units Purchased, 1,53,351 Unitscumulated during the year) (Current Investments)Units HSBC Floating Rate Fund - Short Term Plan - Institutional Plan - — —Daily Dividend (3,09,59,134 Units Purchased, 28,466 Units cumulated,3,09,87,600 Units sold during the year) (Current Investments)Units HSBC Floating Rate Fund - Short Term Plan - Institutional Plan - — —Monthly Dividend (10,65,13,318 Units Purchased, 18,89,859 Unitscumulated, 10,84,03,177 Units sold during the year) (Current Investments)Units HSBC Floating Rate Fund - Short Term Plan - Institutional Plan - — — Weekly Dividend (1,99,64,065 Units Purchased, 65,425 Units cumulated,20,029,490 Units sold during the year) (Current Investments)
1,00,00,000 Units HSBC Fixed Term Scheme 1 - Growth (1,00,00,000 Units Purchased 9,96.51 —during the year) (Current Investments)
PRINCIPAL Mutual Fund (2004 -2,39,38,564) Units PRINCIPAL Cash Management Fund Liquid — 25,00.00Option - Institutional Plan - Growth (2,39,38,564 Units sold during the year)(Current Investments)Units PRINCIPAL Cash Management Fund Liquid Option - Institutional — —Premium Plan - Daily Dividend (9,39,93,741 Units Purchased, 29,926 Unitscumulated, 94,023,667 Units sold during the year) (Current Investments)(2004 - 4,92,38,287) Units PRINCIPAL Cash Management Fund Liquid 50,00.00Option - Institutional Premium Plan - Growth (4,92,38,287 Units soldduring the year) (Current Investments)
7,22,37,373 (2004 - 13,87,45,487) Units PRINCIPAL Cash Management Fund 72,26.70 138,78.74Liquid Option - Institutional Premium Plan - Monthly Dividend(25,26,40,497 Units Purchased, 41,91,497 Units cumulated, 32,33,40,108Units sold during the year) (Current Investments)
1,49,98,651 (2004, -2,70,27,497) (Units PRINCIPAL Cash Management Fund 15,00.00 27,02.82Liquid Option - Institutional Premium Plan - Weekly Dividend(26,51,91,645 Units Purchased, 7,64,930 Units cumulated,27,79,85,421 Units sold during the year) (Current Investments)
1,50,00,000 Units PRINCIPAL Deposit Fund - 371 days - March 05 - Growth 15,00.00 —(1,50,00,000 Units Purchased during the year) (Current Investments)
1,50,00,000 Units PRINCIPAL Deposit Fund - November 05 - 91 days - Dividend 15,00.00 —(1,50,00,000 Units Purchased during the year) (Current Investments)Units PRINCIPAL Floating Rate Fund - Fixed Maturity Plan - Institutional — —Plan - Weekly Dividend (99,93,080 Units Purchased, 2,42,087 Unitscumulated, 1,02,35,167 Units sold during the year) (Current Investments)Units PRINCIPAL Floating Rate Fund - Short Maturity Plan - Institutional — —Plan - Monthly Dividend (5,51,58,502 Units Purchased, 5,32,401 Unitscumulated, 5,56,90,903 Units sold during the year) (Current Investments)Units PRINCIPAL Floating Rate Fund - Short Maturity Plan - Institutional — —Plan - Weekly Dividend (5,49,85,157 Units Purchased, 3,14,720 Unitscumulated, 5,52,99,877 Units sold during the year) (Current Investments)
2,31,85,393 Units PRINCIPAL Income Fund - Short Term Plan - Institutional Plan - 25,32.80 —Weekly Dividend (2,28,70,821 Units Purchased, 3,14,572 Unitscumulated during the year) (Current Investments)
Franklin Templeton Investments Units Templeton Floating Rate Income Fund Short Term - Dividend — —(8,38,31,858 Units Purchased, 4,08,265 Units cumulated,8,42,40,123 Units sold during the year) (Current Investments)Units Templeton India TMA - Institutional Plan - Weekly Dividend (1,99,844 — —Units Purchased, 333 Units cumulated, 2,00,177 (Units soldduring the year) (Current Investments)Units Templeton India TMA - Super Institutional Plan - Daily Dividend — —(2,49,974 Units Purchased, 785 Units cumulated, 2,50,759 Unitssold during the year) (Current Investments)Units Templeton India TMA - Super Institutional Plan - Weekly Dividend — —(2,50,595 Units Purchased, 1,001 Units cumulated, 2,51,596 Units soldduring the year) (Current Investments)
ABN AMRO Mutual Fund 7,79,70,636 Units ABN AMRO Cash Fund - Institutional Plus Plan - Monthly Dividend 77,97.80 —(7,71,36,583 Units Purchased, 8,34,053 Units cumulated duringthe year) (Current Investments)Units ABN AMRO Cash Fund - Institutional Plan - Monthly Dividend — —
2005 2004Rs. lakhs Rs. lakhs
6. INVESTMENTS (Contd...)(Long-term, Unquoted, unless otherwise stated)
Schedules to Balance Sheet

200594
HINDUSTAN LEVER LIMITED (CONSOLIDATED)
(4,39,21,982 Units Purchased, 1,85,936 Units cumulated, 4,41,07,918Units sold during the year) (Current Investments)
SBI Mutual Fund Units SBI Magnum Institutional Income - Savings Plan - Daily — —Dividend (4,78,44,506 Units Purchased, 31,514 Units cumulated,4,78,76,020 Units sold during the year) (Current Investments)
6,04,97,483 Units SBI Magnum Institutional Income Savings Plan - Fortnightly 60,87.80 —Dividend (5,96,64,937 Units Purchased, 8,32,546Units cumulated during the year) (Current Investments)Units SBI Magnum Institutional Income Savings Plan - Weekly — —Dividend (2,18,74,640 Units Purchased, 1,33,460 Units cumulated,2,20,08,100 Units sold during the year) (Current Investments)
TATA Mutual Fund 1,50,00,000 Units Tata Fixed Horizon Fund - Series 2 - Plan B - Growth 14,98.23 —(1,50,00,000 Units Purchased during the year) (Current Investments)Units Tata Liquid Fund - SHIP - Daily Dividend (89,727 Units — —Purchased, 143 Units cumulated, 89,870 Units sold during theyear)(Current Investments)
1,79,417 Units Tata Liquid Fund - SHIP - Monthly Dividend 20,28.17 —(1,77,068 Units Purchased, 2,349 Units cumulatedduring the year) (Current Investments)
Share of Joint Ventures- Schedule - 20(b) 30,87.00 22,54.00TOTAL - C 1373,70.25 1786,51.19
TOTAL - (A+B+C) 1824,10.95 2203,92.45Provision for diminution in value of long-term investments (2,50.65) (3,77.17)
TOTAL 1821,60.30 2200,15.28Aggregate book value of investments Unquoted 1623,14.35 1952,94.25
Listed but not quoted — 1.00Quoted-Market Value Rs. 369,83.67 lakhs 198,45.95 247,20.03(2004 - Rs. 342,26.18 lakhs)
TOTAL 1821,60.30 2200,15.28
2005 2004Rs. lakhs Rs. lakhs
6. INVESTMENTS (Contd...)(Long-term, Unquoted, unless otherwise stated)
Schedules to Balance Sheet
2005 2004Rs. lakhs Rs. lakhs
7. DEFERRED TAX ASSETSOn Employee Separation and Retirement 183,19.92 198,39.34On Other Timing Differences 120,93.93 123,61.15On Fiscal Allowances on Investments 7,37.42 5,28.17Other Items 26,76.48 47,50.81
338,27.75 374,79.47
Share of Joint Ventures - schedule 20 (b) — —338,27.75 374,79.47
8. DEFERRED TAX LIABILITIESOn Fiscal Allowances on Fixed Assets (124,72.39) (142,17.72)
(124,72.39) (142,17.72)
Share of Joint Ventures - schedule 20 (b) (3,99.43) (5,53.26)
(128,71.82) (147,70.98)9. INVENTORIES
(at lower of cost and net realisable value)Stores and spare parts, etc. 30,81.53 42,13.14Raw materials 678,28.61 727,18.89Packing materials 83,91.92 104,46.87Work-in-progress 30,98.02 48,95.90Processed chemicals 91.82 1,09.07Finished goods 552,56.60 623,88.02Property Development Activity (Including Land Development rights) 48.77 48.47- Work-in-progress (Refer Note 15 to Profit and Loss Account)
1377,97.27 1548,20.36
Share of Joint Ventures - schedule 20 (b) 13,79.33 10,62.40
1391,76.60 1558,82.76

2005 95
HINDUSTAN LEVER LIMITED (CONSOLIDATED)
Schedules to Balance Sheet2005 2004
Rs. lakhs Rs. lakhs
10. SUNDRY DEBTORS (unsecured)
Considered goodOver 6 months old 51,28.17 67,92.65Others 517,58.73 493,11.82
568,86.90 561,04.47Considered doubtful
Over 6 months old 72,25.70 87,56.92Others 29.29 3.94
72,54.99 87,60.86641,41.89 648,65.33
Less : Provision for doubtful debts (72,54.99) (87,60.86)568,86.90 561,04.47
Share of Joint Ventures - schedule 20 (b) 10,79.06 8,36.51579,65.96 569,40.98
11. CASH AND BANK BALANCESCash on hand 1,46.92 1,71.27With Scheduled banks - on current accounts 115,30.08 141,74.41
- on deposit accounts 263,23.61 604,50.55380,00.61 747,96.23
Share of Joint Ventures - schedule 20 (b) 39,84.03 33,56.56
419,84.64 781,52.79
12. OTHER CURRENT ASSETSIncome accrued on investments 15,57.70 40,19.05Fixed assets held for sale (at net book value or estimated 3,23.48 9,17.24net realisable value, whichever is lower)
18,81.18 49,36.29Share of Joint Ventures - schedule 20 (b) 1,54.78 1,68.31
20,35.96 51,04.60
13. LOANS AND ADVANCES(Unsecured, considered good unless otherwise stated)Advances recoverable in cash or in kind or for value to be 341,65.92 388,86.57received [including :-(i) Rs. 132,36.36 lakhs (2004 - Rs. 145,45.17 lakhs)
not due before 31st December, 2006;Considered doubtful 38,84.26 29,83.32
380,50.18 418,69.89Less : Provision for doubtful advances (38,84.26) (29,83.32)
341,65.92 388,86.57Receivable from Emergent Genetics India Private Limited — 16,80.00(Formerly known as Paras Extra Growth Seeds Limited)Deposits with Customs, Port Trust, Excise, etc. 140,37.96 152,27.51
482,03.88 557,94.08Share of Joint Ventures - schedule 20 (b) 15,75.88 9,33.56
497,79.76 567,27.6414. LIABILITIES
Acceptances 561,20.72 454,05.68Sundry creditors (Schedule 18)
Small Scale Industrial Undertakings 44,05.92 44,07.94Others 2390,26.57 2110,03.40
2434,32.49 2154,11.34Advances and progress payments - Property Development Activity 6.24 1,40.11Security advances 17,20.71 16,42.78Dividends declared pending payment / encashment 35,51.95 35,05.09Interest accrued but not due on loans 4,82.16 62,31.11
3053,14.27 2723,36.11
Share of Joint Ventures - schedule 20 (b) 28,16.03 22,72.883081,30.30 2746,08.99

200596
HINDUSTAN LEVER LIMITED (CONSOLIDATED)
Schedules to Balance Sheet2005 2004
Rs. lakhs Rs. lakhs
15. PROVISIONSCurrent taxation (provisions in excess of payments) including tax on distributed profits 67,30.36 70,21.23Fringe Benefit Taxation 9,20.25 —Provision for retirement/post retirement benefits and other employee benefits 476,95.76 465,65.57Proposed dividend 550,31.09 550,31.09Other provisions (Schedule 21) 76,43.89 76,68.42
1180,21.35 1162,86.31
Share of Joint Ventures - schedule 20 (b) 7,51.01 3,13.12
1187,72.36 1165,99.43
16. Certain demands for increased wages, etc. received from workmen have been referred to adjudication. In the opinion of Hindustan LeverLimited’s management, the ultimate liability to the Company, if any, with respect to such demands would not have a material effect on theaccounts.
2005 2004Rs. lakhs Rs. lakhs
17. CONTINGENT LIABILITIES(a) Claims made against Companies not acknowledged as debts and
other mattersIncome-tax matters 238,45.58 236,24.54Sales tax matters-gross Rs. 233,36.01 lakhs(2004 - Rs. 319,93.24 lakhs) net of tax 154,81.31 203,37.04Excise and Customs duty matters-gross Rs. 60,78.80 lakhs(2004 - Rs. 23,79.38 lakhs) net of tax 40,32.68 15,08.71Other matters-gross Rs. 17,64.75 lakhs (2004 - Rs. 24,61.80 lakhs) 11,70.73 15,60.96
(b) Bills discounted but not matured — 10.28(c) Guarantees given to banks, etc. in respect of third parties 64,01.87 84,51.49
Share of Joint Ventures - schedule 20 (b) — —Note :Future cash outflows in respect of (a) above are determinable only on receipt of judgements/decisions pending with various forums/authorities.
18. The information given in Schedule 14 - “Liabilities” regarding Small Scale Industrial Undertakings has been determined to the extent suchparties have been identified on the basis of information available with the respective Companies. This has been relied upon by the auditors.
19. Events subsequent to the Balance Sheet date :(i) The Scheme of arrangement for amalgamation of Vashisti Detergents Limited with Hindustan Lever Ltd. was approved by the Honourable
High Court of Bombay, the effect of which has not been given in the accounts.(ii) Hindustan Lever Ltd. has signed a share sale agreement to dispose off its investments in a subsidiary.
20. The Consolidated Financial Statements have been prepared in accordance with Accounting Standard 21 (AS 21) - “Consolidated FinancialStatements”, Accounting Standard 23 (AS 23) - “Accounting for Investments in Associates in Consolidated Financial Statements” and AccountingStandard 27 (AS 27) - “Financial Reporting of Interest in Joint Ventures”, issued by the Institute of Chartered Accountants of India.
(a) The subsidiaries (which along with Hindustan Lever Limited, the parent, constitute the Group) considered in the consolidatedfinancial statements are :
Name of the Company Country of Incorporation % voting power held as % voting power held asat 31st December, 2005 at 31st December, 2004
Lipton India Exports Limited (Merged with HindustanLever Ltd. during the year) India — 100.00Unilever India Exports Limited(formerly known as Indexport Limited) India 100.00 100.00Bon Limited India 100.00 100.00Unilever Nepal Limited (formely known as Nepal Lever Ltd.) Nepal 80.00 80.00Lever India Exports Limited (Merged with HindustanLever Ltd. during the year) India — 100.00Merryweather Food Products Limited (Merged withHindustan Lever Ltd. during the year) India — 100.00International Fisheries Limited (Merged with HindustanLever Ltd. during the year) India — 99.98Hindustan Kwality Walls Foods Pvt. Ltd.(purchased during the year) India 100.00 —Modern Food Industries (India) Limited India 100.00 100.00Ponds Exports Limited India 100.00 100.00Doom Dooma Tea Company Ltd. (formerly known asDaverashola Tea Company Limited) India 100.00 100.00Tea Estates India Limited (formerly known as ThiasholaTea Company Limited) India 100.00 100.00Unilever India Shared Services Limited (formerly known asIndigo Lever Shared Services Limited) India 100.00 100.00Rossell Industries Limited (Shares held by Lipton India ExportsLimited) (upto April, 2005) (Refer 14(ii) of Notes to Profitand Loss Account India — 61.13

2005 97
HINDUSTAN LEVER LIMITED (CONSOLIDATED)
Schedules to Balance SheetName of the Company Country of Incorporation % voting power held as % voting power held as
at 31st December, 2005 at 31st December, 2004TOC Disinfectants Limited (Shares held by Lever IndiaExports Limited and Unilever India Exports Limited)(Merged with Hindustan Lever Ltd., during the year) India — 99.00Modern Food and Nutrition Industries Limited(Shares held by Modern Food Industries (India) Limited) India 100.00 100.00Levers Associated Trust Limited India 100.00 100.00Levindra Trust Limited India 100.00 100.00Hindlever Trust Limited India 100.00 100.00
(b) Interests in Joint VenturesThe Group’s interests, in jointly controlled entities (incorporated Joint Ventures) are :Name of the Company Country of Incorporation % of ownership interest % of ownership interest
as at 31st December, 2005 as at 31st December, 2004
Kimberly Clark Lever Private Limited India 50% 50%Quest International India Limited India 49% 49%The Financial Statements of the Joint Ventures are drawnupto 31st December.
As at As at 31st December, 2005 31st December, 2004
(Rs. Lakhs) (Rs. Lakhs)I. ASSETS
1. Fixed Assets (including Capital work-in-progress) 36,45.46 41,43.262. Investments 31,49.64 22,66.123. Deferred Tax - Net (3,99.43) (5,53.26)4. Current Assets, Loans and Advances
a) Inventories 13,79.33 10,62.40b) Sundry Debtors 10,79.06 8,36.51c) Cash and Bank Balances 39,84.03 33,56.56d) Other Current Assets 1,54.78 1,68.31e) Loans and Advances 15,75.88 9,33.56
II. LIABILITIES1. Shareholders' Funds - Reserves and Surplus (21,26.11) (9,51.20)2. Secured Loans (1,25.19) —3. Current Liabilities and Provisions
a) Liabilities (28,16.03) (22,72.88)b) Provisions (7,51.01) (3,13.12)
For the year ended For the year ended31st December, 2005 31st December, 2004
(Rs. Lakhs) (Rs. Lakhs)III. INCOME
1. Sales (net of excise duty) 108,75.82 92,71.522. Other Income 4,15.64 3,49.09
IV. EXPENSES1. Operating expenses (91,65.88) (72,51.80)2. Depreciation (5,23.46) (10,78.76)3. Interest (1.21) (1.09)4. Profit before Taxation 16,00.91 12,88.965. Provision for Taxation (including deferred taxation) (4,26.00) (4,21.33)6. Profit after Taxation before minority interests 11,74.91 8,67.637. Minority Interests — —8. Net Profit 11,74.91 8,67.63
V. OTHER MATTERS1. Contingent Liabilities — —2. Capital Commitments — —
The movement of the aggregate reserves of the joint ventures are as under :Reserves as at 1st January 9,51.20 83.57Add : Group share of Profits for the year 11,74.91 8,67.63Reserves as at 31st December 21,26.11 9,51.20(c) Investment in Associates
The Group’s Associates are :Name of the Company Country of Incorporation % of ownership interest % of ownership interest
as at 31st December, 2005 as at 31st December, 2004Vashisti Detergents Limited India 32.91% 32.91%The Financial Statements of the Associates are drawnupto 31st December.
21. PROVISIONSOther Provisions (Rs. Lakhs)As at 1st January, 2005 76,68.42Provision made during the year 19,40.65Amounts utilised / reversed during the year (19,65.18)As at 31st December, 2005 76,43.89Future cash outflow in respect of the above is determinable only on occurrence of uncertain future events.
22. Previous year’s figures have been regrouped wherever necessary to conform to this year’s classification.
200598
HINDUSTAN LEVER LIMITED (CONSOLIDATED)
2005 2004Rs. lakhs Rs. lakhs
1. Cash and cash equivalents include :Cash and bank balances 419,84.64 781,52.79Unrealised loss/(gain) on foreign currency cash andcash equivalents — 0.44
Total cash and cash equivalents 419,84.64 781,53.23
2. Cash and Cash equivalents includes Rs.Nil lakhs lien on bank deposits for loanavailed by subsidiaries; 2004 - Rs. 55,00 lakhs
3. Figures in brackets indicate cash outgo.
4. The cash flow statement has been prepared in accordance with the requirements of AccountingStandard 3 “Cash Flow Statements” issued by the Institute of Chartered Accountants of India.
5. The previous year’s figures have been regrouped/restated wherever necessary to conform to this year’s classification.
Notes to the Cash Flow Statement for the year ended 31st December, 2005
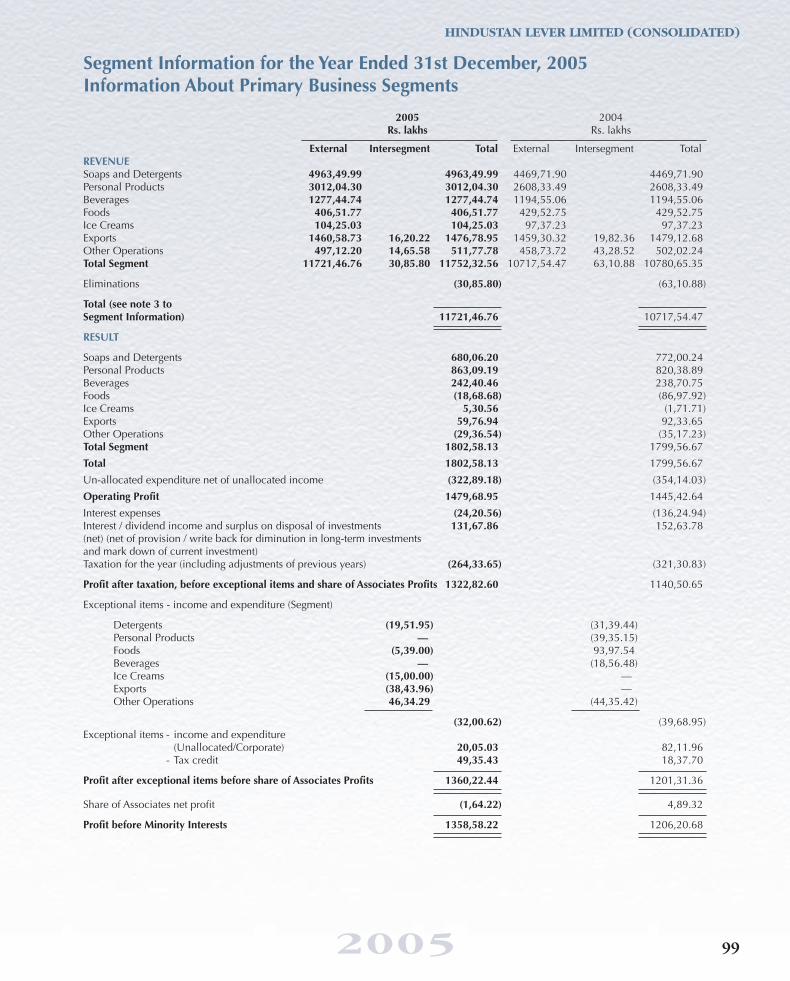
2005 99
HINDUSTAN LEVER LIMITED (CONSOLIDATED)
Segment Information for the Year Ended 31st December, 2005Information About Primary Business Segments
2005 2004Rs. lakhs Rs. lakhs
External Intersegment Total External Intersegment TotalREVENUESoaps and Detergents 4963,49.99 4963,49.99 4469,71.90 4469,71.90Personal Products 3012,04.30 3012,04.30 2608,33.49 2608,33.49Beverages 1277,44.74 1277,44.74 1194,55.06 1194,55.06Foods 406,51.77 406,51.77 429,52.75 429,52.75Ice Creams 104,25.03 104,25.03 97,37.23 97,37.23Exports 1460,58.73 16,20.22 1476,78.95 1459,30.32 19,82.36 1479,12.68Other Operations 497,12.20 14,65.58 511,77.78 458,73.72 43,28.52 502,02.24Total Segment 11721,46.76 30,85.80 11752,32.56 10717,54.47 63,10.88 10780,65.35
Eliminations (30,85.80) (63,10.88)
Total (see note 3 toSegment Information) 11721,46.76 10717,54.47
RESULT
Soaps and Detergents 680,06.20 772,00.24Personal Products 863,09.19 820,38.89Beverages 242,40.46 238,70.75Foods (18,68.68) (86,97.92)Ice Creams 5,30.56 (1,71.71)Exports 59,76.94 92,33.65Other Operations (29,36.54) (35,17.23)Total Segment 1802,58.13 1799,56.67Total 1802,58.13 1799,56.67Un-allocated expenditure net of unallocated income (322,89.18) (354,14.03)Operating Profit 1479,68.95 1445,42.64Interest expenses (24,20.56) (136,24.94)Interest / dividend income and surplus on disposal of investments 131,67.86 152,63.78(net) (net of provision / write back for diminution in long-term investmentsand mark down of current investment)Taxation for the year (including adjustments of previous years) (264,33.65) (321,30.83)
Profit after taxation, before exceptional items and share of Associates Profits 1322,82.60 1140,50.65
Exceptional items - income and expenditure (Segment)
Detergents (19,51.95) (31,39.44)Personal Products — (39,35.15)Foods (5,39.00) 93,97.54Beverages — (18,56.48)Ice Creams (15,00.00) —Exports (38,43.96) —Other Operations 46,34.29 (44,35.42)
(32,00.62) (39,68.95)Exceptional items - income and expenditure
(Unallocated/Corporate) 20,05.03 82,11.96- Tax credit 49,35.43 18,37.70
Profit after exceptional items before share of Associates Profits 1360,22.44 1201,31.36
Share of Associates net profit (1,64.22) 4,89.32
Profit before Minority Interests 1358,58.22 1206,20.68
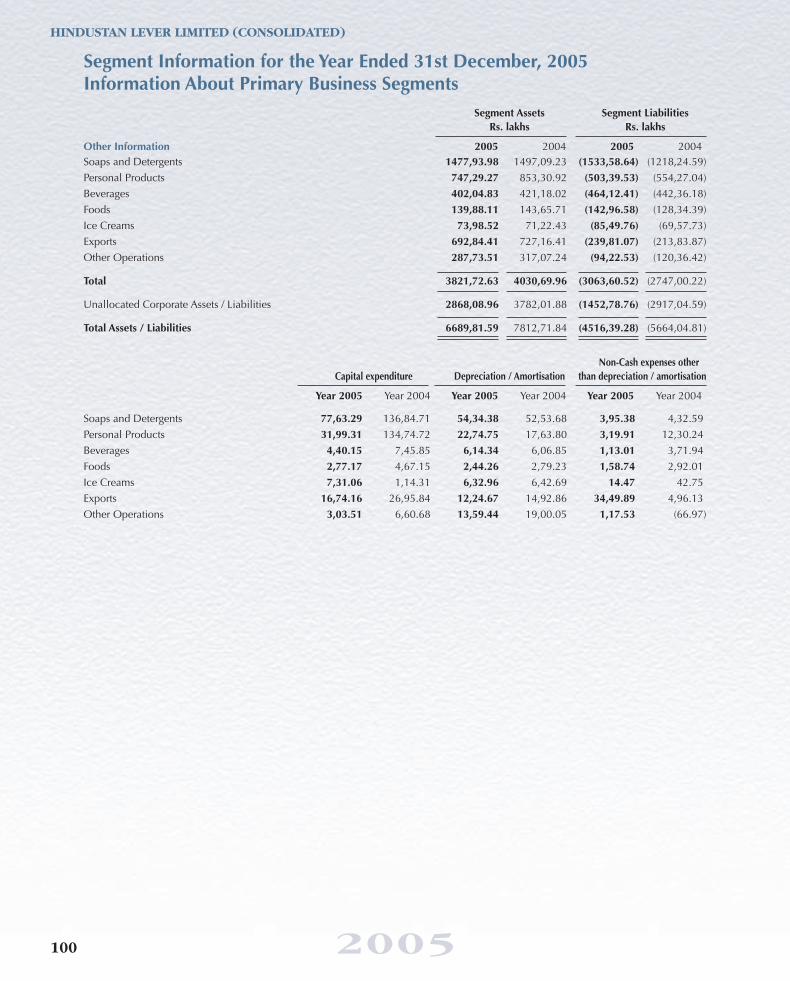
2005100
HINDUSTAN LEVER LIMITED (CONSOLIDATED)
Segment Information for the Year Ended 31st December, 2005Information About Primary Business Segments
Segment Assets Segment LiabilitiesRs. lakhs Rs. lakhs
Other Information 2005 2004 2005 2004Soaps and Detergents 1477,93.98 1497,09.23 (1533,58.64) (1218,24.59)Personal Products 747,29.27 853,30.92 (503,39.53) (554,27.04)Beverages 402,04.83 421,18.02 (464,12.41) (442,36.18)Foods 139,88.11 143,65.71 (142,96.58) (128,34.39)Ice Creams 73,98.52 71,22.43 (85,49.76) (69,57.73)Exports 692,84.41 727,16.41 (239,81.07) (213,83.87)Other Operations 287,73.51 317,07.24 (94,22.53) (120,36.42)
Total 3821,72.63 4030,69.96 (3063,60.52) (2747,00.22)
Unallocated Corporate Assets / Liabilities 2868,08.96 3782,01.88 (1452,78.76) (2917,04.59)
Total Assets / Liabilities 6689,81.59 7812,71.84 (4516,39.28) (5664,04.81)
Non-Cash expenses otherCapital expenditure Depreciation / Amortisation than depreciation / amortisation
Year 2005 Year 2004 Year 2005 Year 2004 Year 2005 Year 2004
Soaps and Detergents 77,63.29 136,84.71 54,34.38 52,53.68 3,95.38 4,32.59Personal Products 31,99.31 134,74.72 22,74.75 17,63.80 3,19.91 12,30.24Beverages 4,40.15 7,45.85 6,14.34 6,06.85 1,13.01 3,71.94Foods 2,77.17 4,67.15 2,44.26 2,79.23 1,58.74 2,92.01Ice Creams 7,31.06 1,14.31 6,32.96 6,42.69 14.47 42.75Exports 16,74.16 26,95.84 12,24.67 14,92.86 34,49.89 4,96.13Other Operations 3,03.51 6,60.68 13,59.44 19,00.05 1,17.53 (66.97)

2005 101
HINDUSTAN LEVER LIMITED (CONSOLIDATED)
Segment Information for the Year Ended 31st December, 2005Information About Secondary Business Segments
2005 2004Rs. lakhs Rs. lakhs
Revenue by Geographical MarketIndia 10017,96.95 9070,31.90
Outside India 1703,49.81 1647,22.57
Total 11721,46.76 10717,54.47
Additions to Fixed Assets and Intangible Assets
India 142,34.76 317,84.16
Outside India 1,53.89 59.10
Total 143,88.65 318,43.26
Carrying Amount of Segment Assets
India 3773,74.26 3976,24.20
Outside India 47,98.39 54,45.76
Total 3821,72.65 4030,69.96
Notes :1. Business Segments
The business segment has been considered as the primary segment for disclosure. The products included in each of the reporteddomestic business segments are as follows:• Soaps and Detergents include soaps, detergent bars, detergent powders, detergent liquids, scourers, etc.• Personal Products include products in the categories of Oral Care, Skin Care (excluding soaps), Hair Care, Deodorants,
Talcum Powder, Colour Cosmetics, etc.• Beverages include tea and coffee.• Foods include Oils and Fats, Branded Staples (Atta, Salt, etc.), Culinary Products (tomato based products, fruit based products,
soups, etc.), Wheat based products (Bread, Supplementary Nutritional Products, etc.).• Ice Creams include Ice Creams and Frozen Desserts.• Others include Plantations, Chemicals, Agri seeds, Property Development, Water business, Ayush services etc. and the operations
of Nepal Lever Limited, Nepal.Segment Revenue relating to each of the above domestic business segments includes Income from Services provided, where applicable.In addition, the Exports business segment includes sales of Marine Products, Leather Products, Castor, Mushrooms, etc. as well assales of Soaps and Detergents, Personal Products, Beverages and Foods, etc. by the Exports Division.The above business segments have been identified considering :a) the nature of products and servicesb) the differing risks and returnsc) the organisation structure, andd) the internal financial reporting systems.Non cash expenses of export segment includes impairment of fixed assets. (Refer note 13 (v) of the Profit and Loss account).
2. Geographical SegmentsThe geographical segments considered for disclosure are as follows :• Sales within India includes sales to customers located within India.• Sales outside India includes sales to customers located outside India.
2005 2004Rs. lakhs Rs. lakhs
3. Revenue compriseSales 11565,82.60 10598,20.01Income from services rendered (included in Other Income) 153,70.25 116,35.75Income from property development activity (included in Other Income) 1,93.91 2,98.71
Total 11721,46.76 10717,54.47
4. Previous year’s figures have been regrouped wherever necessary to conform to this year’s classification.

2005102
HINDUSTAN LEVER LIMITED (CONSOLIDATED)
Related Party DisclosuresA. Enterprises where control exists
(i) Holding Company :
Unilever PLC
B. Other Related Parties with whom the companies
in the Group had transactions, etc.
(i) Fellow Subsidiaries :
Brooke Bond Assam Estates Ltd.
Brooke Bond Group Ltd.
Brooke Bond South India Estates Ltd.
Lever Faberge UK
Unilever U.K. Central Resources Ltd.
Unilever Overseas Holdings Ltd.
Unilever Australia Ltd.
Lever Brothers Bangladesh Ltd.
Unilever Canada
Unilever Cote d’Ivoire
Unilever Ghana Ltd.
Unilever Kenya Ltd.
Unilever New Zealand Ltd.
Lever Brothers Pakistan Ltd.
Unilever Singapore Pte. Ltd.
Unilever Foods Espana, S.A - Division Frigo
Unilever South Africa (Pty.) Ltd.
Unilever Ceylon Ltd.
Unilever Overseas Holdings AG
Lever Brothers West Indies Ltd.
Unilever Research Laboratory, Port Sunlight
Unilever Research Laboratory, Colworth House
BB Kenya Group
Unilever N.V.
Unilever Overseas Holdings B.V.
Unilever Brasil Ltda.
Lever Chile S.A.
Unilex Cameroon S.A.
Unilever France S.A.
Unilever International Paris
Unilever Deutschland GmbH
Lever Faberge Deutschland GmbH
Unilever Hong Kong Ltd.
BBL Japan K.K.
Nippon Lever K.K.
Sagit SPA, Italy
Fellow Subsidiaries : (Contd...)
Unilever Ethiopia
Unilever Philippines (Prc), Inc.
PT Unilever Indonesia TBK
Unilever Thai Holdings Ltd.
Unilever Thai Trading Ltd.
Unilever Sanayi ve Ticaret Turk A. S.
Unilever Home & Personal Care USA
Lever Egypt SAE
Lipton Division, Canada
Lever Arabia Ltd.
Lever Brothers Nigeria Ltd.
Lipton Soft Drinks (Ireland)
Lever Israel
Elida P/S, Vietnam
Unilever CR, Czech Republic
Unilever Polska
Lever International Marine Supplies (LIMS) BV
Unilever Gulf Free Zone Establishment, Arabia
Unilever (China) Limited
Unilever South Central Europe
Unilever Baltic LLC
Unilever Levant, Lebanon
Unilever Tuketim Urunleri Sat Pazarlama Ticaret A.S.
Unilever Best Foods, Vietnam
Unilever SNG, Russia
Unilever Taiwan Ltd.
Unilever Ukraine
Unilever Tuketim Mersin Serbest Bolge Subesi, Turkey
Towells Lever LLC, Arabia
Binzagr Lever Limited, Arabia
Hind Lever Chemicals Ltd. (Also an Associate)(Upto 31st May, 2004)Unilever Industries Private Limited
Digital Securities Private Limited
Lever Faberge France
Unilever Tanzania Ltd.
Unilever Cambodia Ltd.
Lever Faberge Belgium
Unilever Maghreb Export SA, Tunisia
Unilever UK & CN Holdings, UK
Lipton Ltd. - UK
Unilever (Malaysia) Holdings Sdn. Berhad
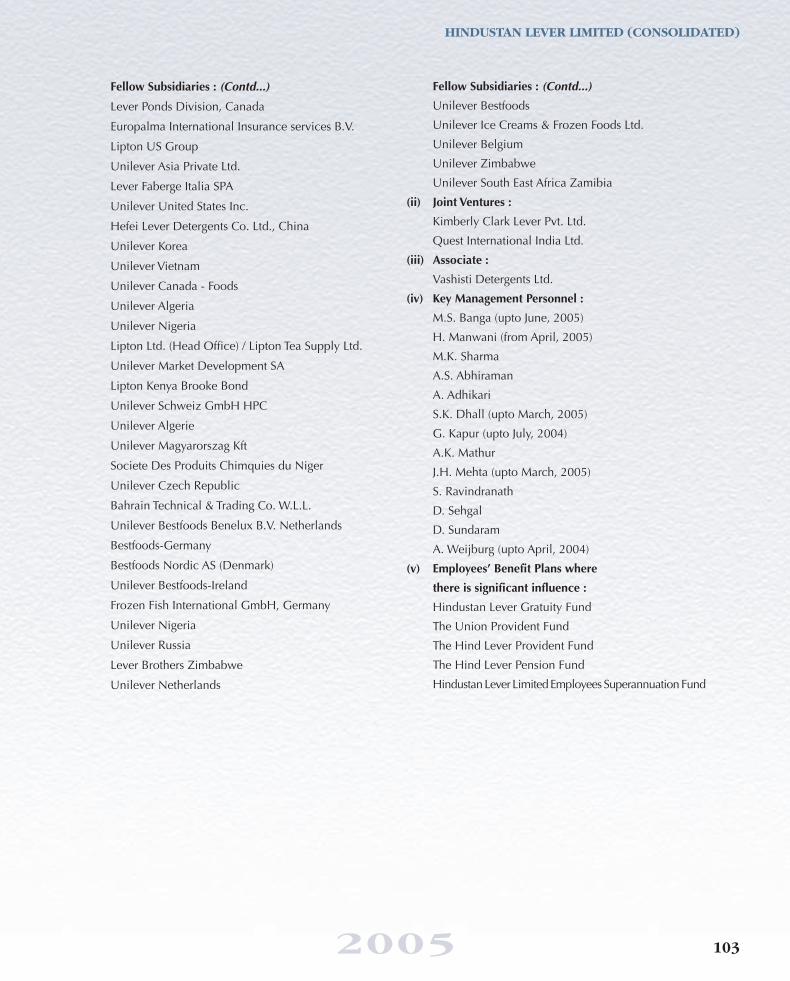
2005 103
HINDUSTAN LEVER LIMITED (CONSOLIDATED)
Fellow Subsidiaries : (Contd...)
Lever Ponds Division, Canada
Europalma International Insurance services B.V.
Lipton US Group
Unilever Asia Private Ltd.
Lever Faberge Italia SPA
Unilever United States Inc.
Hefei Lever Detergents Co. Ltd., China
Unilever Korea
Unilever Vietnam
Unilever Canada - Foods
Unilever Algeria
Unilever Nigeria
Lipton Ltd. (Head Office) / Lipton Tea Supply Ltd.
Unilever Market Development SA
Lipton Kenya Brooke Bond
Unilever Schweiz GmbH HPC
Unilever Algerie
Unilever Magyarorszag Kft
Societe Des Produits Chimquies du Niger
Unilever Czech Republic
Bahrain Technical & Trading Co. W.L.L.
Unilever Bestfoods Benelux B.V. Netherlands
Bestfoods-Germany
Bestfoods Nordic AS (Denmark)
Unilever Bestfoods-Ireland
Frozen Fish International GmbH, Germany
Unilever Nigeria
Unilever Russia
Lever Brothers Zimbabwe
Unilever Netherlands
Fellow Subsidiaries : (Contd...)
Unilever Bestfoods
Unilever Ice Creams & Frozen Foods Ltd.
Unilever Belgium
Unilever Zimbabwe
Unilever South East Africa Zamibia
(ii) Joint Ventures :
Kimberly Clark Lever Pvt. Ltd.
Quest International India Ltd.
(iii) Associate :
Vashisti Detergents Ltd.
(iv) Key Management Personnel :
M.S. Banga (upto June, 2005)
H. Manwani (from April, 2005)
M.K. Sharma
A.S. Abhiraman
A. Adhikari
S.K. Dhall (upto March, 2005)
G. Kapur (upto July, 2004)
A.K. Mathur
J.H. Mehta (upto March, 2005)
S. Ravindranath
D. Sehgal
D. Sundaram
A. Weijburg (upto April, 2004)
(v) Employees’ Benefit Plans where
there is significant influence :
Hindustan Lever Gratuity Fund
The Union Provident Fund
The Hind Lever Provident Fund
The Hind Lever Pension Fund
Hindustan Lever Limited Employees Superannuation Fund

2005104
HINDUSTAN LEVER LIMITED (CONSOLIDATED)
Related Party DisclosuresDisclosure of transactions between the Companies in the Group and Related parties and the status ofoutstanding balances as on 31st December, 2005
2005 2004Rs. lakhs Rs. lakhs
Holding Company : Dividend paid 397,40.34 437,14.37Royalty paid 62,11.45 51,09.69Interest on 9% Debentures 11.94 42,91.96Income from services rendered 121,21.33 88,25.03Outstanding balances :
- Receivables at the year end 6,91.75 9,80.83- Debenture Interest payable — 21,51.69- 9% Debentures — 476,88.41
Fellow Subsidiaries : Sale of finished goods / raw materials etc. 676,74.00 640,59.49Sale of fixed assets — 4.50Sale of investments — 185,93.97Interest received on sale of investments — 4,44.08Royalty received — 63.42Rent Received 1,10.00 1,10.00Income from services rendered 31,43.17 27,05.65Expenses shared by a fellow subsidiary 6.00 6.00Processing charges paid — 18,72.92Purchase of goods 48,18.84 70,55.93Purchase of investments — 169,88.85Interest paid on purchase of investments — 3,54.53Advertisement Expenditure — 10.74Dividend paid 170,02.14 187,02.35Royalty paid 1,71.77 1,55.00Interest on 9% Debentures 5.11 18,36.239% Debenture outstanding — 204,02.56Advances and loans :
- Receivables 166,39.98 168,92.34- Payables 8,57.42 14,75.40- Debenture interest payable — 9,20.56
Joint Ventures : Purchase of goods 121,41.28 97,61.40Sale of finished goods / raw materials etc. — 2.96Other income 1,43.86 1,66.86Advances and loans :
- Receivables — 22.59- Payables 86.11 59.95
Associate : Processing charges paid 9,00.46 14,60.85Outstanding payable at the year end — 7.11Outstanding receivable at the year end 19.27 —Sale of goods 4,83.50 3,97.57Purchase of goods 14,71.47 5,66.12
Key Management Personnel : Remuneration 8,45.83 12,40.69Rent paid 59.07 64.79Dividend paid 9.24 8.49Interest on 9% Debentures 0.01 0.709% Debentures outstanding — 7.47Debenture interest payable — 0.34Loans - Outstanding at the year end 0.10 0.10
- Advanced during the year — —- Repayments (including interest) during the year — 27.20
Employees’ Benefit Plans where : Contributions during the year 24,72.79 40,05.86there is significant influence Outstanding payables at the year end 89.63 —
Outstanding receivables at the year end 6,57.41 17,01.90

2005 105
HINDUSTAN LEVER LIMITED (CONSOLIDATED)
Disclosure in respect of transactions which are more than 10% of the total transactions of the same type with related parties during the year.
2005 2004Rs. lakhs Rs. lakhs
Sale of finished goods / raw materials etc.Unilever Gulf Free Zone Establishment 297,46.51 216,53.94
Sale of fixed assetsLever Brothers Bangladesh Ltd . — 4.50
Sale of investmentsHind Lever Chemicals Ltd. — 173,90.05
Interest received on sale of investmentsHind Lever Chemicals Ltd. — 4,04.47
Royalty receivedLever Egypt SAE — 63.42
Expenses shared by subsidiary Companies / fellow subsidiary companiesDigital Securities Private Limited 6.00 6.00
Rent receivedUnilever Industries Pvt. Ltd. 1,10.00 1,10.00
Processing charges paidVashisti Detergents Ltd. 9,00.46 14,60.85Hind Lever Chemicals Ltd. — 18,72.92
Purchase of goodsKimberly Clark Lever Pvt. Ltd. 106,36.34 81,75.28Lipton Ltd. 25,59.66 28,08.59Lever Faberge Deutschland GmbH — 19,44.65
Purchase of investmentsHind Lever Chemicals Ltd. — 133,64.05Unilever Industries Private Limited — 29,58.31
Interest paid on purchase of investmentsHind Lever Chemicals Ltd. — 3,16.65
Advertisement expenditureUnilever (Malaysia) Holdings Sdn Berhad — 10.74
Rent paidM.S. Banga 9.46 18.92H. Manwani 6.52 —M.K. Sharma 22.50 22.50S. Ravindranath 6.76 —
Repayments (including interest) during the yearM.K. Sharma — 26.92
Other incomeKimberly Clark Lever Pvt. Ltd. 1,43.86 1,66.86
Dividend paidUnilever PLC 397,40.34 437,14.37
Royalty paidUnilever PLC 62,11.45 51,09.69
Interest on 9% DebenturesUnilever PLC 11.94 42,91.96
9% Debentures outstandingUnilever PLC — 476,88.41
Outstanding balances - payables at the year endLever Faberge Deutschland GmbH — 2,06.12Lipton Ltd. 3,55.71 3,49.46Unilever U.K. Central Resources Ltd. 1,36.10 2,08.03Unilever Gulf Free Zone Establishment — 2,00.20Digital Securities Private Limited 1,61.19 —Unilever N.V. 1,13.64 2,02.82
Outstanding balances - receivables at the year endUnilever Gulf Free Zone Establishment 55,13.59 71,06.38
Income from services renderedUnilever PLC 121,21.33 88,25.03Unilever Industries Private Limited — 15,45.98
Outstanding balances - debenture interest payableUnilever PLC — 21,51.69
RemunerationM.K. Sharma 1,69.59 1,64.01A. Adhikari 1,17.29 1,31.41S. Ravindranath 1,27.74 1,41.61D. Sundaram 1,40.03 1,41.18D. Sehgal 88.97 —
Contributions during the yearThe Union Provident Fund 4,59.33 5,54.86Hindustan Lever Gratuity Fund — 10,14.97The Hind Lever Pension Fund 10,68.98 12,53.61Hind Lever Provident Fund 9,64.47 10,42.07

1. We have audited the attached consolidated Balance Sheet of Hindustan Lever Limited and its subsidiaries (the Group)as at 31st December, 2005 and the related consolidated Profit and Loss Account and consolidated Cash Flow Statementfor the year ended on that date annexed thereto, which we have signed under reference to this report. These consolidatedfinancial statements are the responsibility of the Company’s management and have been prepared by the managementon the basis of separate financial statements and other financial information regarding components. Our responsibilityis to express an opinion on these consolidated financial statements based on our audit.
2. We conducted our audit in accordance with the auditing standards generally accepted in India. Those Standardsrequire that we plan and perform the audit to obtain reasonable assurance about whether the financial statements arefree of material misstatement. An audit includes examining, on a test basis, evidence supporting the amounts anddisclosures in the financial statements. An audit also includes assessing the accounting principles used and significantestimates made by management, as well as evaluating the overall financial statement presentation. We believe thatour audit provides a reasonable basis for our opinion.
3. We did not audit the financial statements of a subsidiary and a joint venture whose financial statements reflect theGroup’s share of total assets of Rs. 122,80.55 lakhs as at 31st December, 2005 and the Group’s share of total revenuesof Rs. 153,35.61 lakhs and net cash outflows amounting to Rs. 10,57.18 lakhs for the year ended on that date asconsidered in the consolidated financial statements. These financial statements have been audited by other auditorswhose reports have been furnished to us, and our opinion, in so far as it relates to the amounts included in respect ofthis subsidiary and the joint venture, is based solely on the reports of the other auditors. The financial statements of theother joint venture whose financial statements reflect the Group’s share of total assets of Rs. 79,80.93 lakhs as at31st December, 2005 and the Group’s share of total revenues of Rs. 56,77.28 lakhs and net cash inflows amountingto Rs. 21.17 lakhs for the year ended on that date as considered in the consolidated financial statements and anassociate for the year ended 31st December, 2005 have been certified by their Directors, whose certificates have beenfurnished to us, and our opinion, in so far as it relates to amounts included in respect of the joint venture and theassociate, is based solely on these certificates.
4. We report that the consolidated financial statements have been prepared by the Company’s management in accordancewith the requirements of Accounting Standard 21 - Consolidated Financial Statements, Accounting Standard23 - Accounting for Investments in Associates in Consolidated Financial Statements and Accounting Standard27 - Financial Reporting of Interest in Joint Ventures issued by the Institute of Chartered Accountants of India.
5. Based on our audit and on consideration of the reports/certificates of other auditors/directors on separate financialstatements and on the other financial information of the components, in our opinion and to the best of our informationand according to the explanations given to us, the attached consolidated financial statements give a true and fair viewin conformity with the accounting principles generally accepted in India:
(i) in the case of the consolidated Balance Sheet, of the state of affairs of the Group as at 31st December, 2005;
(ii) in the case of the consolidated Profit and Loss Account, of the profit for the year ended on that date; and
(iii) in the case of the consolidated Cash Flow Statement, of the cash flows for the year ended on that date.
Sharmila A. KarvePartnerMembership No. 43229For and on behalf ofLOVELOCK & LEWESChartered Accountants
Mumbai : 14th February, 2006
Auditors’ Report to the Board of Directors of Hindustan Lever Limited
2005106
HINDUSTAN LEVER LIMITED (CONSOLIDATED)

2005
Stat
emen
t pur
suan
t to
Sect
ion
212
of th
e C
ompa
nies
Act
, 195
6
Nam
e of
the
Subs
idia
ry C
ompa
nyFi
nanc
ial
year
end
ing
of th
e Su
bsid
iary
Num
ber o
feq
uity
shar
eshe
ld
Exte
nt o
fho
ldin
gFo
r fin
anci
al y
ear o
f the
Sub
sidia
ryFo
r the
pre
viou
s fin
anci
al y
ears
sinc
eit
beca
me
a Su
bsid
iary
Prof
its/(l
osse
s) so
far i
tco
ncer
ns th
e m
embe
rs o
fth
e ho
ldin
g co
mpa
ny a
ndno
t dea
lt w
ith in
the
book
sof
acc
ount
of t
he h
oldi
ngco
mpa
ny (e
xcep
t to
the
exte
nt d
ealt
with
in c
ol. 6
)
Prof
its/(l
osse
s) so
far i
tco
ncer
ns th
e m
embe
rs o
fth
e ho
ldin
g co
mpa
ny a
ndde
alt w
ith in
the
book
sof
acc
ount
of t
he h
oldi
ngco
mpa
ny
Prof
its/(l
osse
s) so
far i
tco
ncer
ns th
e m
embe
rs o
fth
e ho
ldin
g co
mpa
ny a
ndno
t dea
lt w
ith in
the
book
sof
acc
ount
of t
he h
oldi
ngco
mpa
ny (e
xcep
t to
the
exte
nt d
ealt
with
in c
ol. 8
)(1
)(2
)(3
)(4
)(5
)
Rs. l
akhs
(6)
Rs. l
akhs
(7)
Rs. l
akhs
(8)
Rs. l
akhs
Chan
ges i
n Co
mpa
ny’s
inte
rest
in N
epal
Lev
er L
imite
d be
twee
n 16
th Ju
ly, 2
005
and
31st
Dec
embe
r, 20
05 :
NIL
Mat
eria
l cha
nges
bet
wee
n 16
th Ju
ly, 2
005
and
31st
Dec
embe
r, 20
05 in
resp
ect o
f the
fixe
d as
sets
of, i
nves
tmen
ts of
, mon
eys l
ent a
nd m
oney
s bor
row
ed (o
ther
than
mee
ting
curre
nt li
abili
ties)
by N
epal
Lev
er L
td. :
NIL
*Th
e Co
mpa
ny h
as so
ld it
s ent
ire h
oldi
ng in
thes
e co
mpa
nies
dur
ing
the
first
quar
ter o
f 200
6.**
All s
hare
s are
hel
d by
Mod
ern
Food
Indu
strie
s (In
dia)
Lim
ited.
Not
e : H
indu
stan
Leve
r Lim
ited
held
the
who
le o
f the
pai
d-up
cap
ital o
f Lev
ers A
ssoc
iate
d Tr
ust L
imite
d, L
evin
dra
Trus
t Lim
ited
and
Hin
dlev
er Tr
ust L
imite
d w
hich
wer
e no
n-pr
ofit
mak
ing
orga
nisa
tions
.
M. K
. Sha
rma
Vice
Cha
irman
D. S
unda
ram
Fina
nce
Dire
ctor
Raju
Tho
mas
Vice
Pre
siden
t - F
inan
ce
Asho
k G
upta
Com
pany
Sec
reta
ry
Mum
bai :
14t
h Fe
brua
ry, 2
006
Prof
its/(l
osse
s) so
far i
tco
ncer
ns th
e m
embe
rs o
fth
e ho
ldin
g co
mpa
ny a
ndde
alt w
ith in
the
book
sof
acc
ount
of t
he h
oldi
ngco
mpa
ny
Uni
leve
r Ind
ia E
xpor
ts Li
mite
d31
.12.
2005
25,1
0,00
010
0.00
%(5
,67.
89)
—91
,33.
2460
,86.
75(F
orm
erly
Inde
xpor
t Lim
ited)
Bon
Lim
ited
31.1
2.20
051,
00,0
0,00
010
0.00
%(5
,40.
55)
—6.
58—
Uni
leve
r Nep
al L
imite
d(F
orm
erly
Nep
al L
ever
Lim
ited)
- (N
epal
ese
Rs.)
15.0
7.20
057,
36,5
6080
.00%
15,1
3.60
29,4
6.24
53,4
0.37
29,0
8.82
(Ash
aad
31, 2
062)
- (In
dian
Rs.)
9,46
.00
18,4
1.40
33,3
7.73
18,1
7.45
Mod
ern
Food
Indu
strie
s (In
dia)
Lim
ited
31.1
2.20
051,
47,5
5010
0.00
%(1
5,05
.68)
—(7
9,37
.12)
—
Doo
m D
oom
a Te
a Co
mpa
ny L
imite
d*31
.12.
2005
5,00
,000
100.
00%
(6,1
1.73
)—
20.9
5—
(Form
erly D
avera
shola
Tea C
ompa
ny Li
mited
)
Pond
’s Ex
ports
Lim
ited
31.1
2.20
0598
,00,
147
100.
00%
90.4
8—
1,31
.66
—
Tea
Esta
tes I
ndia
Lim
ited*
31.1
2.20
0550
,00,
000
100.
00%
(8,6
8.10
)—
7.45
—(Fo
rmerl
y Thia
shola
Tea C
ompa
ny Li
mited
)
Uni
leve
r Ind
ia S
hare
d Se
rvic
es L
imite
d31
.12.
2005
5,00
010
0.00
%1,
40.3
6—
(3,3
0.69
)—
(Form
erly I
ndigo
Leve
r Sha
red Se
rvice
s Lim
ited)
Mod
ern
Food
and
Nut
ritio
n In
dustr
ies
Lim
ited*
*31
.12.
2005
50,0
0610
0.00
%(0
.11)
—(4
.99)
—
Hind
ustan
Kwa
lity W
alls F
oods
Priva
te Lim
ited
31.1
2.20
0550
,000
100.
00%
(19.
71)
——
—
107
HINDUSTAN LEVER LIMITED
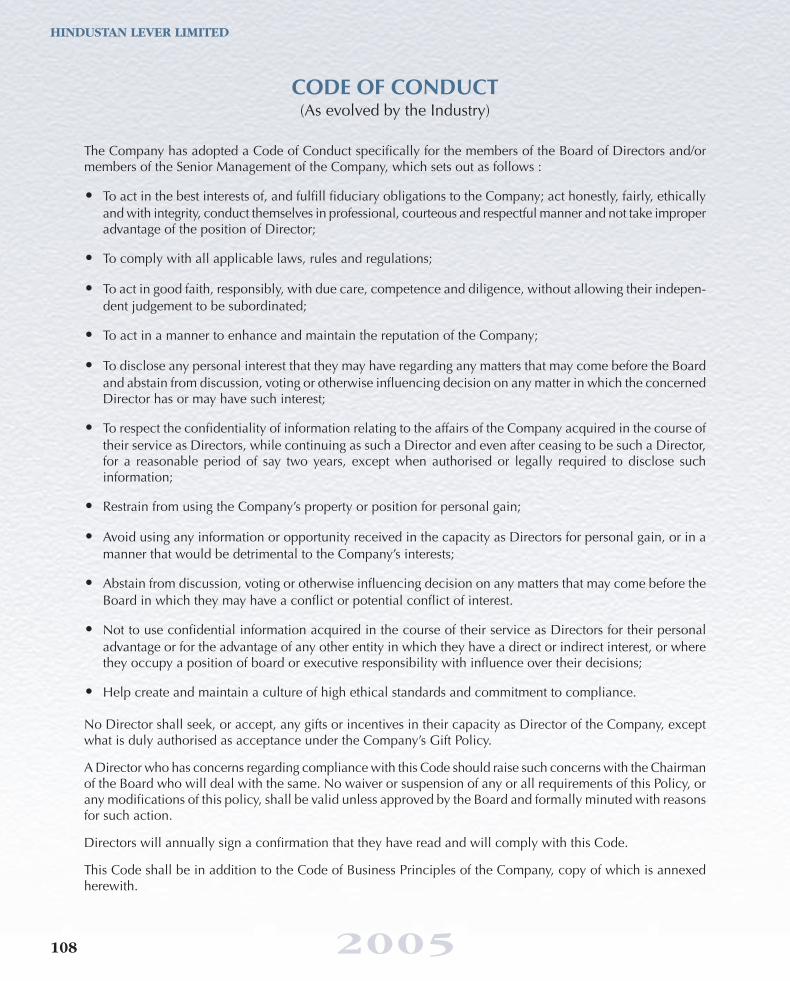
HINDUSTAN LEVER LIMITED
2005108
CODE OF CONDUCT(As evolved by the Industry)
The Company has adopted a Code of Conduct specifically for the members of the Board of Directors and/ormembers of the Senior Management of the Company, which sets out as follows :
• To act in the best interests of, and fulfill fiduciary obligations to the Company; act honestly, fairly, ethicallyand with integrity, conduct themselves in professional, courteous and respectful manner and not take improperadvantage of the position of Director;
• To comply with all applicable laws, rules and regulations;
• To act in good faith, responsibly, with due care, competence and diligence, without allowing their indepen-dent judgement to be subordinated;
• To act in a manner to enhance and maintain the reputation of the Company;
• To disclose any personal interest that they may have regarding any matters that may come before the Boardand abstain from discussion, voting or otherwise influencing decision on any matter in which the concernedDirector has or may have such interest;
• To respect the confidentiality of information relating to the affairs of the Company acquired in the course oftheir service as Directors, while continuing as such a Director and even after ceasing to be such a Director,for a reasonable period of say two years, except when authorised or legally required to disclose suchinformation;
• Restrain from using the Company’s property or position for personal gain;
• Avoid using any information or opportunity received in the capacity as Directors for personal gain, or in amanner that would be detrimental to the Company’s interests;
• Abstain from discussion, voting or otherwise influencing decision on any matters that may come before theBoard in which they may have a conflict or potential conflict of interest.
• Not to use confidential information acquired in the course of their service as Directors for their personaladvantage or for the advantage of any other entity in which they have a direct or indirect interest, or wherethey occupy a position of board or executive responsibility with influence over their decisions;
• Help create and maintain a culture of high ethical standards and commitment to compliance.
No Director shall seek, or accept, any gifts or incentives in their capacity as Director of the Company, exceptwhat is duly authorised as acceptance under the Company’s Gift Policy.
A Director who has concerns regarding compliance with this Code should raise such concerns with the Chairmanof the Board who will deal with the same. No waiver or suspension of any or all requirements of this Policy, orany modifications of this policy, shall be valid unless approved by the Board and formally minuted with reasonsfor such action.
Directors will annually sign a confirmation that they have read and will comply with this Code.
This Code shall be in addition to the Code of Business Principles of the Company, copy of which is annexedherewith.

Our principlesOur code of business principles describes the operational standards that everyone at Unilever follows, whereverthey are in the world. It also supports our approach to governance and corporate responsibility.
Code of business principles
Standard of ConductWe conduct our operations with honesty, integrity and openness, and with respect for the human rights andinterests of our employees. We shall similarly respect the legitimate interests of those with whom we haverelationships.
Obeying the LawUnilever companies and our employees are required to comply with the laws and regulations of the countriesin which we operate.
EmployeesUnilever is committed to diversity in a working environment where there is mutual trust and respect and whereeveryone feels responsible for the performance and reputation of our Company. We will recruit, employ andpromote employees on the sole basis of the qualifications and abilities needed for the work to be performed.We are committed to safe and healthy working conditions for all employees. We will not use any form offorced, compulsory or child labour. We are committed to working with employees to develop and enhanceeach individual’s skills and capabilities. We respect the dignity of the individual and the right of employees tofreedom of association. We will maintain good communication with employees through company basedinformation and consultation procedures.
ConsumersUnilever is committed to providing branded products and services which consistently offer value in terms ofprice and quality, and which are safe for their intended use. Products and services will be accurately andproperly labelled, advertised and communicated.
ShareholdersUnilever will conduct its operations in accordance with internationally accepted principles of good corporategovernance. We will provide timely, regular and reliable information on our activities, structure, financialsituation and performance to all shareholders.
Business PartnersUnilever is committed to establishing mutually beneficial relations with our suppliers, customers and businesspartners. In our business dealings we expect our partners to adhere to business principles consistent with ourown.
Community InvolvementUnilever strives to be a trusted corporate citizen and, as an integral part of society, to fulfill our responsibilitiesto the societies and communities in which we operate.
2005 109
HINDUSTAN LEVER LIMITED

Public ActivitiesUnilever companies are encouraged to promote and defend their legitimate business interests. Unilever willco-operate with governments and other organisations, both directly and through bodies such as trade associations,in the development of proposed legislation and other regulations which may affect legitimate business interests.Unilever neither supports political parties nor contributes to the funds of groups whose activities are calculatedto promote party interests.
The EnvironmentUnilever is committed to making continuous improvements in the management of our environmental impactand to the longer-term goal of developing a sustainable business. Unilever will work in partnership with othersto promote environmental care, increase understanding of environmental issues and disseminate good practice.
InnovationIn our scientific innovation to meet consumer needs we will respect the concerns of our consumers and ofsociety. We will work on the basis of sound science, applying rigorous standards of product safety.
CompetitionUnilever believes in vigorous yet fair competition and supports the development of appropriate competitionlaws. Unilever companies and employees will conduct their operations in accordance with the principles offair competition and all applicable regulations.
Business IntegrityUnilever does not give or receive, whether directly or indirectly, bribes or other improper advantages for businessor financial gain. No employee may offer, give or receive any gift or payment which is, or may be construed asbeing, a bribe. Any demand for, or offer of, a bribe must be rejected immediately and reported to management.Unilever accounting records and supporting documents must accurately describe and reflect the nature of theunderlying transactions. No undisclosed or unrecorded account, fund or asset will be established or maintained.
Conflicts of InterestsAll Unilever employees are expected to avoid personal activities and financial interests which could conflictwith their responsibilities to the Company. Unilever employees must not seek gain for themselves or othersthrough misuse of their positions.
Compliance - Monitoring - ReportingCompliance with these principles is an essential element in our business success. The Unilever board is responsiblefor ensuring these principles are communicated to, and understood and observed by, all employees. Day-to-dayresponsibility is delegated to the senior management of the regions and operating companies. They are responsiblefor implementing these principles, if necessary through more detailed guidance tailored to local needs. Assuranceof compliance is given and monitored each year. Compliance with the code is subject to review by the boardsupported by the audit committee of the board and the corporate risk committee. Any breaches of the code mustbe reported in accordance with the procedures specified by the joint secretaries. The board of Unilever will notcriticise management for any loss of business resulting from adherence to these principles and other mandatorypolicies and instructions. The board of Unilever expects employees to bring to their attention, or to that of seniormanagement, any breach or suspected breach of these principles. Provision has been made for employees to beable to report in confidence and no employee will suffer as a consequence of doing so.
In this code the expressions ‘Unilever’ and ‘Unilever companies’ are used for convenience and mean theUnilever Group of companies comprising Unilever N.V., Unilever PLC and their respective subsidiary companies.The board of Unilever means the directors of Unilever N.V. and Unilever PLC.
HINDUSTAN LEVER LIMITED
2005110

NOTES

NOTES

0
5
25
75
95
100
0
5
25
75
95
100
0
5
25
75
95
100
0
5
25
75
95
100
Macintosh HD:CURRENT JOBS:HLL_AR-2k5-067-13:HLL AR 2K5 Cover 1-4.psMacintosh HD:CURRENT JOBS:HLL_AR-2k5-067-13:HLL AR 2K5 Cover 1-4.cdrThursday, April 27, 2006 12:40:04 AM
Color profile: DisabledComposite Default screen

0
5
25
75
95
100
0
5
25
75
95
100
0
5
25
75
95
100
0
5
25
75
95
100
Macintosh HD:CURRENT JOBS:HLL_AR-2k5-067-13:HLL AR 2K5 Cover 1-4.psMacintosh HD:CURRENT JOBS:HLL_AR-2k5-067-13:HLL AR 2K5 Cover 1-4.cdrThursday, April 27, 2006 12:39:57 AM
Color profile: DisabledComposite Default screen


