Embed Size (px)
Citation preview

ANNUAL TRADE STATISTICS BULLETIN
2019
Namibia Statistics Agency
Namibia Statistics Agency
Namibia Statistics AgencyP.O. Box 2133, FGI House, Post Street Mall,Windhoek, Namibia
Tel: +264 61 431 3200Fax: +264 61 431 3253
Email: [email protected]

ii
Mission Statement
“Leveraging on partnerships and innovative technologies, to produce and disseminate relevant, quality, timely statistics and spatial data
that are fit-for-purpose in accordance with international standards and best practice”
Vision Statement
“Be a high performance institution in quality statistics delivery”
Core Values
Integrity
Excellent Performance
Accuracy
Team Work
Accountability
Transparency

iii
Preface
At a time of great uncertainty for Namibia’s bilateral and multilateral trade agreements, the role of trade
statistics takes on renewed significance. The government, traders, NGOs together with the Private Sector
need the latest trade data to make informed decisions and to determine the best direction of trade policy
for the people they represent. Since its establishment, the NSA has strived to meet this demand through
various publications. Therefore, this publication outlines the annual developments of Namibia’s trade
pattern in merchandise with the rest of the world during the year 2019 compared to 2018. As an addition
to this report, a separate document (excel file) with detailed tables is provided for more information.
In 2019, Namibia overall trade (total of exports and imports) amounted to N$203,019 million, slightly
lower (0.4%) than 2018 level of N$203,744 million. The exports revenue were N$91,766 million showing
a 1.5 percent decline from last year. While, the imports bill stood at N$111,253 million, an increase by 0.7
percent from N$110,620 million last year. Subsequently, the decline in exports and the increase in imports
resulted in a trade deficit of N$19,487 million, widening from its 2018 level of N$17, 496 million.
Namibia’s trade continues to be highly concentrated to a few countries and commodities. For our export
market, the ten leading trade partners (China, South Africa, Botswana, Belgium, Spain, Zambia, UAE, DRC,
Italy and the Netherlands) represented 80.7 percent of total exports. In terms of imports the ten leading
countries (South Africa, Zambia, China, Bulgaria, India, Botswana, USA, Peru, DRC and Chile) constituted
80.5 percent of total imports. This shows Namibia’s dependence on a few countries for its exports as well
as for meeting its import requirements. The commodities traded in 2019 were also concentrated to a few
commodities with the 10 leading export commodities accounting for 86.5 percent of total exports while
on the imports side the ten leading commodities represented 65.9 percent of total imports. Hence there
is a need for Namibia to diversify her export basket to mitigate the risks associated with the lack of
diversification.
In terms of the mode of transport that our traders used for transporting goods in and out of Namibia, the
seaborne was the most preferred mode of transport in 2019 for our exports accounting for 55.7 percent
of total exports ahead of airborne and road bound that represented 23.1 percent and 22.4 percent,
respectively. On the other hand, on the import side the road bound was the most preferred mode of
transport accounting for 63.3 percent of imports followed by seaborne with 32.4 percent and airborne
with 4.4 percent.

iv
Let me take this opportunity to thank all our stakeholders who made it possible for the production of this
report. I would also like to urge all our Traders and Clearing Agents to continue providing all the required
information when declaring their goods as this information is vital in the production of this report. In the
same vain I would like to urge our users of statistical information to send to us any comments that may
enhance statistical production and contribute to the improvement of this report.
Alex Shimuafeni
Statistician-General & CEO

v
Table of Contents List of tables ................................................................................................................................................. vi
List of Charts ................................................................................................................................................ vi
1. Revisions ........................................................................................................................................... 1
2. Key developments in 2019 ................................................................................................................ 2
2.1. Surplus by product group .............................................................................................................. 3
2.2. Deficit by product group ............................................................................................................... 4
2.3. Export destinations ....................................................................................................................... 5
2.4. Import destinations ....................................................................................................................... 6
3. Comparative analysis: 2019 and 2018 .............................................................................................. 7
3.1. Trade balance ................................................................................................................................ 7
3.2. Exports to key markets ................................................................................................................. 9
3.3. Imports from key markets .......................................................................................................... 10
3.4. Top export products .................................................................................................................... 12
3.5. Fish exports ................................................................................................................................. 14
3.6. Top re-exports products ............................................................................................................. 15
3.7. Top import products ................................................................................................................... 17
4. Trade by Economic Blocs ................................................................................................................ 20
4.1. Exports ........................................................................................................................................ 20
4.2. Imports ........................................................................................................................................ 22
5. Trade by mode of transport ............................................................................................................ 25
5.1. Exports ........................................................................................................................................ 25
5.2. Imports ........................................................................................................................................ 26
6. Conclusion ....................................................................................................................................... 28
List of Terms and Definitions ...................................................................................................................... 29
Acronyms .................................................................................................................................................... 30
vi
List of tables Table 1: Revisions for 2018 ........................................................................................................................... 1
List of Charts CHART 1. Trade flow and balance for 2019 .................................................................................................. 2
CHART 2: Product group with highest surpluses .......................................................................................... 3
CHART 3: Product groups with highest deficits ............................................................................................ 4
CHART 4: Export composition by country ..................................................................................................... 5
CHART 5: Import composition by country .................................................................................................... 6
CHART 6: Trade deficit; 2010 to 2019 ........................................................................................................... 7
CHART 7: Namibia’s trade balance by country in 2019 ................................................................................ 8
CHART 8: Key export destinations ................................................................................................................ 9
CHART 9: Key import destinations .............................................................................................................. 11
CHART 10: Top five export products ........................................................................................................... 13
CHART 11: Fish exports ............................................................................................................................... 14
CHART 12: Top five re-exports .................................................................................................................... 16
CHART 13: Top five imports ........................................................................................................................ 18
CHART 14: Export composition by regional grouping ................................................................................. 21
CHART 15: Import composition by regional grouping ................................................................................ 23
CHART 16: Export composition by transport mode .................................................................................... 25
CHART 17: Import composition by transport mode ................................................................................... 26

1
1. Revisions
Revisions are always necessary as certain data only becomes available after the reference period. The
table below presents revised data for the year 2018 comparing figures as at March 2019 report and the
current report.
Table 1: Revisions for 2018
Flow Value (N$ m)
As at March 2020 Report As at March 2019 Report Difference
Export 93,124 92,838 286
Import 110,620 110,219 401
Trade balance -17,496 -17,381 -115
Table 1 above shows that both trade flows were revised upwards from N$92,838 million to the current
level of N$93,124 million for exports and from the level of N$110,219 million to N$110,620 million for
imports. The revisions resulted in the deficit widening further by N$115 million (0.7%) to N$17,496 million
compared to its earlier level of N$17,381 million.
The current revisions on exports were mainly attributed to articles of Chapter 71 (precious stones and
metals) while revisions on imports stemmed from industrial machinery (Chapter 84), beverages (Chapter
22) and precious stones and metals (Chapter 71).

2
2. Key developments in 2019
In 2019, the value of total exports was estimated at N$91,766 million whereas overall imports stood at
N$111,253 million, resulting in a deficit of N$19,487 million as reflected in Chart 1.
CHART 1. Trade flow and balance for 2019
Namibia’s imports and exports for the year 2019 with the rest of the world (ROW) appears to be
concentrated only on a few product groups as reflected in Table 21. Like the year before, Namibia’s export
basket was mainly made up of minerals such as copper, precious stones and metals2; ores3 (Inc. uranium,
copper, zinc, lead etc.). The minerals are followed by fish, vessels, live animals, industrial machinery;
motor vehicles and parts; beverages and meat.
1 Apart from Table 1 contained in this document, an additional support document (excel file) is provided with more tables including table 19 and 20 that contains trade by commodity and partner 2019. 2 The product category precious stones and metals is composed of diamonds (80%), gold (18%) and other precious stones and jewelry (1%). 3The category of ores is made up of Uranium (83%), Zinc (13%), Ash and lead (2% each)
91,766
111,253
-19,487
(40,000)
(20,000)
-
20,000
40,000
60,000
80,000
100,000
120,000
Val
ue
(N$
m)
Export Import Trade balance

3
While, Namibia’s import basket was mainly dominated by commodities such as copper, oils and mineral
fuels; motor vehicles and parts; industrial machinery, ores and electrical machinery. Furthermore,
commodities under the category of precious stones and metals; vessels, articles of iron and steel; plastics
and pharmaceuticals were also in demand by the residents of Namibia during 2019.
Of interest to note is that a large amount of copper was recorded for both trade flows (exports and
imports) as most of the copper imported was re-exported.
2.1. Surplus by product group
CHART 2: Product group with highest surpluses
It is not uncommon for Namibia to record trade surpluses (a position where the export value of a product
group exceeds the value of imports of the same product group) in most commodities as shown in Chart
2. In 2019, Namibia recorded trade surpluses on commodities such as precious stones and metals, fish,
copper, ores, zinc and live animals. Other commodities including natural minerals and stones; meat, fruits
and nuts; and hides and skins also recorded surpluses (Chart 2).
-
2,000
4,000
6,000
8,000
10,000
12,000
14,000
16,000
18,000
Val
ue
(N$
M)

4
2.2. Deficit by product group
The chart below shows major commodity groups in which Namibia recorded trade deficits (a situation
where the value of imports exceeds that of exports) in 2019.
CHART 3: Product groups with highest deficits
Oils and mineral fuels recorded the highest trade deficit in 2019 followed by motor vehicles and parts;
industrial machinery, electrical machinery and; articles of iron or steel, most of which are capital goods
imported as factors or inputs into production. Moreover, the terms of trade in pharmaceuticals, plastics,
cereals and cosmetics also worsened during the period under review. As a non-oil producing country,
Namibia is entirely dependent on imports for all her fuel needs. Namibia’s small manufacturing base
makes her a net importer of manufactured product and capital goods, hence, the deficits shown in Chart
3.
-14,000
-12,000
-10,000
-8,000
-6,000
-4,000
-2,000
0
Val
ue
(N$
m)

5
2.3. Export destinations
This section presents an overview of Namibia’s top ten exports market by partner country. In 2019, the
top 10 destinations of Namibia’s products accounted for 80.7 percent of total exports, this implies that
Namibia has an opportunity to diversify its export market beyond the aforementioned countries.
CHART 4: Export composition by country
The chart above presents the contribution made by each country to the total value of the top ten export
destinations as well as the contribution of these countries to Namibia’s overall exports to the rest of the
world. China remained at the top of the chart as Namibia’s largest export partner in 2019, accounting for
25.9 percent of Namibia’s total exports while making up 32.1 percent of the top ten exports markets
ahead of South Africa which again had to settle for the second place, accounting for 17.2 percent of overall
exports. Botswana held steady in third place since last year, accounting for 10.1 percent of total exports.
Belgium claimed fourth place after it absorbed 7.5 percent of total exports while Spain claimed the fifth
place on the export chart accounting for 4.9 percent of total exports. As a percentage of total exports,
Zambia, United Arab Emirates and DRC contributed 3.9 percent, 3.5 percent and 3.0 percent, whereas
China RSABotswan
aBelgium Spain Zambia UAE DRC Italy
Netherlands
% of total 25.9% 17.2% 10.1% 7.5% 4.9% 3.9% 3.5% 3.0% 2.4% 2.3%
% of top 10 32.1% 21.3% 12.6% 9.3% 6.1% 4.8% 4.3% 3.7% 2.9% 2.9%
0.0%
5.0%
10.0%
15.0%
20.0%
25.0%
30.0%
35.0%
% of total % of top 10

6
Italy and Netherlands accounted for 2.3 percent and 2.4 percent of the total exports respectively (Chart
4).
2.4. Import destinations
Chart 5 reflects the top ten countries where Namibia imported most of its products during the period
under review. The chart further shows the contributions made by each country to the total of the top ten
countries as well as each country’s contributions to total imports. Over 60 percent of Namibia’s imports
were sourced from African countries, with South Africa and Zambia taking the lead. South Africa emerged
as the largest import market for the domestic economy, accounting for a lion’s market share of 45.3
percent of total imports and 56.0 percent of the top ten import destinations (Chart 5). Zambia claimed
second position on the import chart, accounting for 15.5 percent of the total imports and 19.2 percent of
the top ten import destinations. China occupied the third place, accounting for 4.0 percent of total imports
into the local economy. The remaining countries in the top ten importers each accounts for less than 4
percent to Namibia’s overall import (Chart 5).
CHART 5: Import composition by country
SouthAfrica
Zambia China Bulgaria IndiaBotswan
aUSA Peru DRC Chile
% of total 45.3% 15.5% 4.0% 3.2% 2.9% 2.5% 2.2% 1.7% 1.6% 1.4%
% of top 10 56.0% 19.2% 5.0% 4.0% 3.6% 3.1% 2.8% 2.2% 2.0% 1.4%
0.0%
10.0%
20.0%
30.0%
40.0%
50.0%
60.0%
% of total % of top 10

7
3. Comparative analysis: 2019 and 2018
3.1. Trade balance
Namibia’s merchandise total trade (export plus import) with the rest of the world stood at N$203,019
million, down by 0.4 percent when compared to N$203,744 million a year ago. Exports amounted to
N$91,766 million, weaker (1.5%) than its 2018 level of N$93,124 million. On the contrary, imports rose by
0.6 percent from its last year level of N$110,620 million to N$111,253 million. This result in Namibia
recording a trade deficit (measured as exports minus imports) of N$19,487 million in 2019. The current
trade deficit implies that the country spent N$19,487 million more on imported goods than the revenue
generated from goods exported.
CHART 6: Trade deficit; 2010 to 2019
Considering the period from 2010 to 2019, Namibia has continuously been recording a trade deficit (Chart
6). The deficit has been on an upward trajectory, rising (worsening) steadily since 2010 reaching its highest
level of N$41,058 million in 2015. In contrast, a decreasing trend was further observed from 2016,
reaching N$17,496 million in 2018 before rising again in 2019 by 11.4 percent to N$19,487 million. A
-3,842-5,147
-11,859
-16,550
-28,551
-41,058
-27,051
-23,831
-17,496-19,487
-
0.10
0.20
0.30
0.40
0.50
0.60
0.70
0.80
0.90
1.00
-45,000
-40,000
-35,000
-30,000
-25,000
-20,000
-15,000
-10,000
-5,000
0
2010 2011 2012 2013 2014 2015 2016 2017 2018 2019
▼25.0% ▲34.0%▲130.4%▲39.6% ▲72.5% ▲43.8% ▼34.1% ▼11.9% ▼26.6% ▲11.4%
EX/I
M
Val
ue
(N$
m)
8
similar trend is observed when the trade deficit is measured as a ratio of export to import, represented
by a line graph on Chart 6. Namibia’s persistent trade deficits is mainly due to the importation of high
valued manufactured commodities and machineries while exporting mostly low valued primary goods.
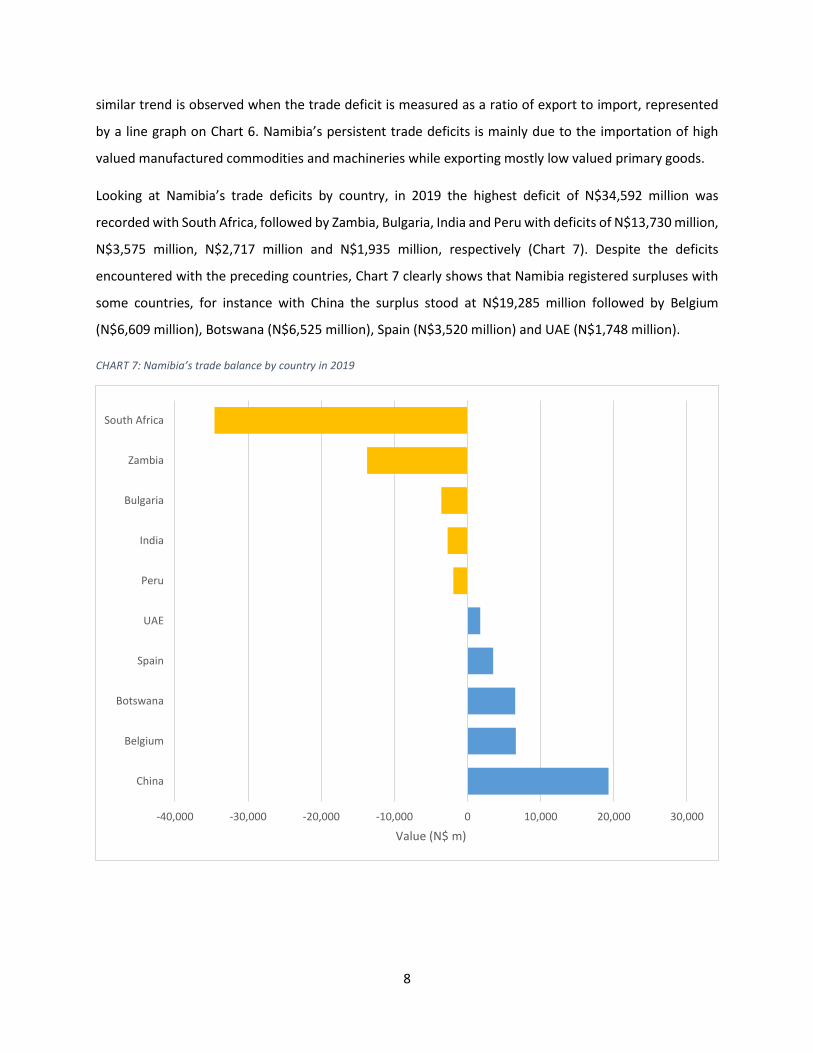
Looking at Namibia’s trade deficits by country, in 2019 the highest deficit of N$34,592 million was
recorded with South Africa, followed by Zambia, Bulgaria, India and Peru with deficits of N$13,730 million,
N$3,575 million, N$2,717 million and N$1,935 million, respectively (Chart 7). Despite the deficits
encountered with the preceding countries, Chart 7 clearly shows that Namibia registered surpluses with
some countries, for instance with China the surplus stood at N$19,285 million followed by Belgium
(N$6,609 million), Botswana (N$6,525 million), Spain (N$3,520 million) and UAE (N$1,748 million).
CHART 7: Namibia’s trade balance by country in 2019
-40,000 -30,000 -20,000 -10,000 0 10,000 20,000 30,000
China
Belgium
Botswana
Spain
UAE
Peru
India
Bulgaria
Zambia
South Africa
Value (N$ m)

9
3.2. Exports to key markets
Namibia’s export market was mostly composed of the following countries: China, South Africa, Botswana,
Belgium, Spain, Zambia, UAE, DRC, Italy and the Netherlands (Chart 8). This group of ten countries
absorbed N$74,055 million (80.7%) of the total (N$91,766 million) exports, subsequently raising the level
of exports to this group of countries by 11.8 percent ahead of its 2018 level of N$66,268 million.
China remained at the top of the chart as the leading export market for the Namibian products with
N$23,756 million of exports destined to that country, representing 25.9 percent of the total exports. South
Africa claimed the second spot on the chart absorbing N$15,788 million worth of goods exported,
representing 17.2 percent of the total exports. Botswana held steady in third place, absorbing N$9,308
million of exports (10.1% of exports), while, Belgium and Spain’s accounted for 7.5 percent (N$6,879
million) and 4.9 percent (N$4,495 million) of total export, respectively.
CHART 8: Key export destinations
The notable rise in exports to this group of ten countries was due to substantial growth in foreign demand
for domestic commodities by these countries with exception of Belgium and Italy (Chart 8). On a country
-
5,000
10,000
15,000
20,000
25,000
Ch
ina
Sou
th A
fric
a
Bo
tsw
ana
Bel
giu
m
Spai
n
Zam
bia
UA
E
DR
C
Ital
y
Ne
the
rlan
ds
▲44.7% ▲5.7% ▲0.6% ▼26.3% ▲16.1% ▲1.5% ▲32.8% ▲32.4% ▼28.1% ▲49.7%
Val
ue
(N$
m)
2019 2018
10
level when compared to 2018, exports to the Netherlands grew the largest with 49.7 percent ahead of
China (44.7%), UAE (32.8%), DRC (32.4%) and Spain (16.1%). Further increases were observed in the value
of exports to Zambia and Botswana which rose by 1.5 percent and 0.6 percent, respectively.
The increase in exports to the Netherlands in 2019 compared to 2018 was mainly due the demand for
wood (342.8%), meat (60.7%, fish (42.8%) and copper (40%), whereas the increase in exports to China
was mainly led by minerals such as copper (49.6%) and uranium ores (43%). Additionally, a new market
for meat products was established in China which absorbed meat worth N$157 million contributing to the
overall growth of exports to that country. For the United Arab Emirates, zinc (92.9%), fruits and nuts
(92.5%) and; precious stones and metals (27.9%) were the leading contributors to the growth in exports,
while, chemical products (35.8%) and fish (19.8%) attributed to the increase in exports to the Democratic
Republic of Congo.
As indicated earlier, Italy and Belgium absorptions of exports from Namibia declined in 2019 with the
former registering a decline of 28.1 percent while exports to the later dropped by 26.3 percent. The
decline in exports to Italy was mostly reflected in ores falling by 48.3 percent, hides and skin by 41.9
percent, copper by 37.5 percent and zinc by 37.0 percent. The main contributors to the decline in export
to Belgium came from copper and tobacco which dropped by 44.8 percent and 35.2 percent, respectively.
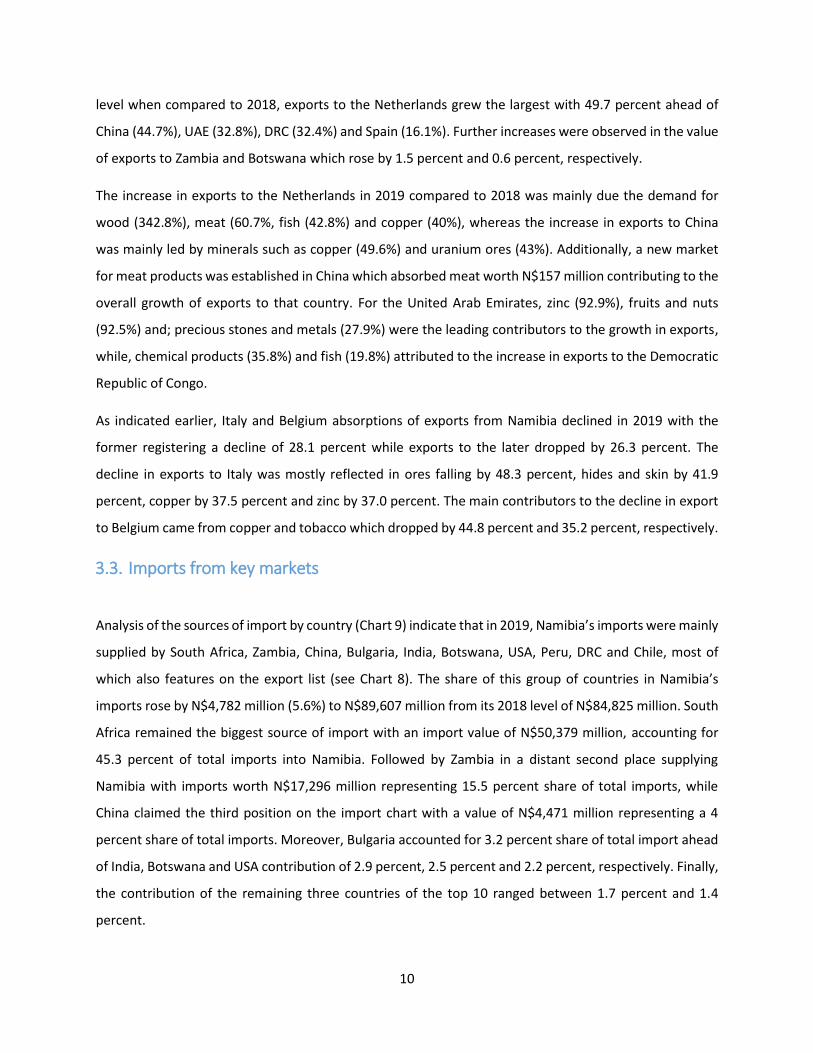
3.3. Imports from key markets
Analysis of the sources of import by country (Chart 9) indicate that in 2019, Namibia’s imports were mainly
supplied by South Africa, Zambia, China, Bulgaria, India, Botswana, USA, Peru, DRC and Chile, most of
which also features on the export list (see Chart 8). The share of this group of countries in Namibia’s
imports rose by N$4,782 million (5.6%) to N$89,607 million from its 2018 level of N$84,825 million. South
Africa remained the biggest source of import with an import value of N$50,379 million, accounting for
45.3 percent of total imports into Namibia. Followed by Zambia in a distant second place supplying
Namibia with imports worth N$17,296 million representing 15.5 percent share of total imports, while
China claimed the third position on the import chart with a value of N$4,471 million representing a 4
percent share of total imports. Moreover, Bulgaria accounted for 3.2 percent share of total import ahead
of India, Botswana and USA contribution of 2.9 percent, 2.5 percent and 2.2 percent, respectively. Finally,
the contribution of the remaining three countries of the top 10 ranged between 1.7 percent and 1.4
percent.

11
The increase in imports from this group of countries was largely attributed to the strengthening of
domestic demand of imports from mostly DRC, Chile, India, Bulgaria, Peru, USA and Zambia. Imports from
these countries grew substantially while imports from South Africa only grew by 2 percent (Chart 9). DRC
accounted for the largest growth of imports into Namibia with 1184.4 percent as imports of copper from
that country jumped to N$1,703 million compared to its 2018 level of N$138 million. The growth of 68.5
percent from India was attributed to oils and mineral fuels which rose by more than double (105.9%) to
N$2,400 million after recording N$1,166 million a year ago. Furthermore, the growth experienced in
imports from Bulgaria and Peru was due to a common commodity-copper ore. Import of this product from
Bulgaria rose by 30.7 percent to N$3,570 million compared to the level of N$2,730 million a year ago while
import of the same commodity from Peru it jumped to N$1,931 million, representing 22 percent growth
compared to the level of N$1,584 million a year earlier. Moreover, from the USA the growth came from
machinery (industrial and electrical) which recorded a growth of 50.7 percent while chemical products
recorded a growth of 45.1%. On the other hand, animal feeds, copper as well as small amounts of ores
(copper) were responsible for the growth in imports from Zambia.
CHART 9: Key import destinations
Despite the positive growth in imports observed from most of the countries indicated in Chart 9, Botswana
and China recorded negative growth with the former recording the largest decline of 38.4 percent to
-
10,000
20,000
30,000
40,000
50,000
60,000
SouthAfrica
Zambia China Bulgaria India Botswana USA Peru DRC Chile
▲2.0% ▲10.2% ▼29.8% ▲30.5% ▲68.5% ▼38.4% ▲11.8% ▲22.2% ▲1184.4%▲580.6%
Val
ue
(N$
m)
2019 2018
12
N$2,783 million compared N$4,515 million registered in 2018. The declined registered by Botswana was
mainly reflected in the precious stones and metals (45%) and vehicles (43.7%). Similarly, China
experienced a decline of N$1,895 million representing a 29.8 percent drop to N$4,471 million compared
to N$6,366 million reported a year ago. The decline was mostly reflected in machinery (industrial and
electrical) that fell by 42.6 percent to N$1,432 million from its level of N$2,493 million last year. In
addition, article of iron or steel contracted by 39.7 percent to N$408 million from N$677 million recorded
last year.
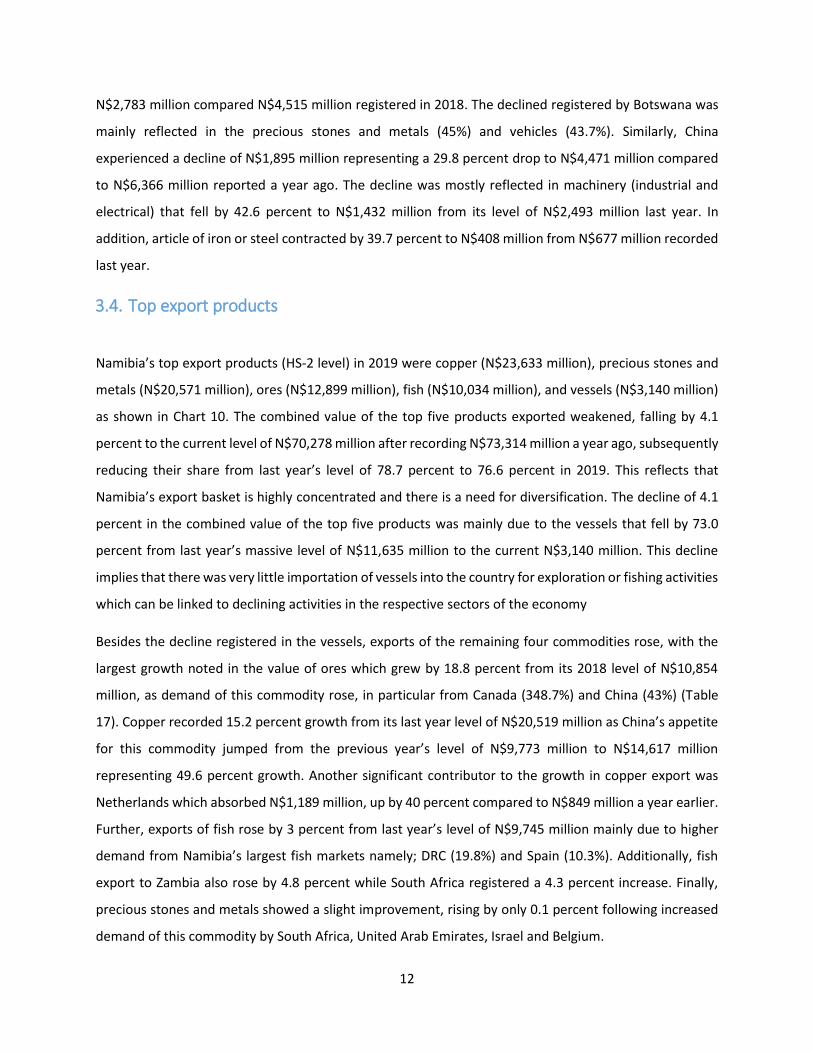
3.4. Top export products
Namibia’s top export products (HS-2 level) in 2019 were copper (N$23,633 million), precious stones and
metals (N$20,571 million), ores (N$12,899 million), fish (N$10,034 million), and vessels (N$3,140 million)
as shown in Chart 10. The combined value of the top five products exported weakened, falling by 4.1
percent to the current level of N$70,278 million after recording N$73,314 million a year ago, subsequently
reducing their share from last year’s level of 78.7 percent to 76.6 percent in 2019. This reflects that
Namibia’s export basket is highly concentrated and there is a need for diversification. The decline of 4.1
percent in the combined value of the top five products was mainly due to the vessels that fell by 73.0
percent from last year’s massive level of N$11,635 million to the current N$3,140 million. This decline
implies that there was very little importation of vessels into the country for exploration or fishing activities
which can be linked to declining activities in the respective sectors of the economy
Besides the decline registered in the vessels, exports of the remaining four commodities rose, with the
largest growth noted in the value of ores which grew by 18.8 percent from its 2018 level of N$10,854
million, as demand of this commodity rose, in particular from Canada (348.7%) and China (43%) (Table
17). Copper recorded 15.2 percent growth from its last year level of N$20,519 million as China’s appetite
for this commodity jumped from the previous year’s level of N$9,773 million to N$14,617 million
representing 49.6 percent growth. Another significant contributor to the growth in copper export was
Netherlands which absorbed N$1,189 million, up by 40 percent compared to N$849 million a year earlier.
Further, exports of fish rose by 3 percent from last year’s level of N$9,745 million mainly due to higher
demand from Namibia’s largest fish markets namely; DRC (19.8%) and Spain (10.3%). Additionally, fish
export to Zambia also rose by 4.8 percent while South Africa registered a 4.3 percent increase. Finally,
precious stones and metals showed a slight improvement, rising by only 0.1 percent following increased
demand of this commodity by South Africa, United Arab Emirates, Israel and Belgium.

13
CHART 10: Top five export products
Apart from the changes in ranking on the export list the commodity composition did not change as the
same commodities dominated the export list a year ago. Copper moved one space up to claim the first
spot as the largest export commodity by value ahead of precious stones and metals which moved one
place down to occupy the second position. Ores moved up one place to claim the third spot on the export
list while fish also improved in ranking when it moved up one place to the fourth position. Vessels lost its
ranking and moved down two places to occupy the fifth position.
-
5,000
10,000
15,000
20,000
25,000
74:Copper 71:Precious Stones &Metals
26:Ores 03:Fish 89:Vessels & Boats
▲15.2% ▲0.1% ▲18.8% ▲3.0% ▼73.0%
Val
ue
(N$
m)
2019 2018

14
3.5. Fish exports
Fish remained among the top five leading export commodities in 2019, hence making it the country’s
number one food item export revenue earner besides minerals and vessels. On average, Namibia’s export
of fish stood at N$7,509 million over the period 2010 to 2019, reaching an all-time high of N$10,034
million in 2019 and a record low of N$5,148 million, below average in 2011 (Table 10).
Analysis of the fish export for the period 2010 to 2019 (Chart 11) indicates variances in the trend starting
with consecutive declines of 3.2 percent in 2010 and 2 percent in 2011, but then turned to an upward
trend from 2012 reaching up to N$7,120 million in 2014 before declining by a 0.3 percent to N$7,098
million in 2015. The trend picked up again registering the largest growth of 24.6 percent to N$8,841 million
of exports in 2016 and rising further by 1.6 percent to N$8,982 million, 8.5 percent to N$9,745 million and
3 percent to N$10,034 million in 2017, 2018 and 2019, respectively.
CHART 11: Fish exports
The largest contributor to the increase in fish export is Spain (Namibia’s number one importer of fish)
importing fish worth N$3,928 million in 2019 compared to N$3,560 million a year ago ahead of South
Africa which claimed the second position after absorbing N$1,558 million worth of domestic fish
compared to the level of N$1,494 million a year ago (Table 17). DRC clenched the third spot as the
country’s export destination for fish after importing fish to the tune of N$1,161 million from an amount
of N$970 million imported in the previous year. Finally, Zambia also remained an important destination
-
2,000
4,000
6,000
8,000
10,000
12,000
2010 2011 2012 2013 2014 2015 2016 2017 2018 2019
▼3.2% ▼2.0% ▲12.2% ▲22.8% ▲0.4% ▼0.3% ▲24.6% ▲1.6% ▲8.5% ▲3.0%
Val
ue
(N$
m)
Export Import
15
for domestic fish as it absorbed N$1,119 million worth of fish compared to its last year level of N$1,068
million.
3.6. Top re-exports products
Namibia is increasingly becoming an important logistics hub in the region due to its geographical location,
this is evident in the large amount of re-exported commodities that stood at N$40,573 million, a
contraction of 9.2 percent when compared to N$44,674 million recorded in 2018.
The composition of the re-exports is mainly made up by a few minerals (copper and; precious stones and
metals) and capital goods including; vessels, motor vehicles and parts and; industrial machinery (Chart
12). The value of these top five commodities combined amounted to N$34,593 million in 2019 which is
11.0 percent lower than the 2018 level of N$38,877 million, subsequently, the combined share of these
commodities dropped to 85.3 percent from last year’s level of 87.0 percent. Most of the decline came
from vessels whose value fell to N$3,135 million from the value of N$11,633 million recorded a year earlier
representing a decline of 73 percent as reflected in Chart 12.
16
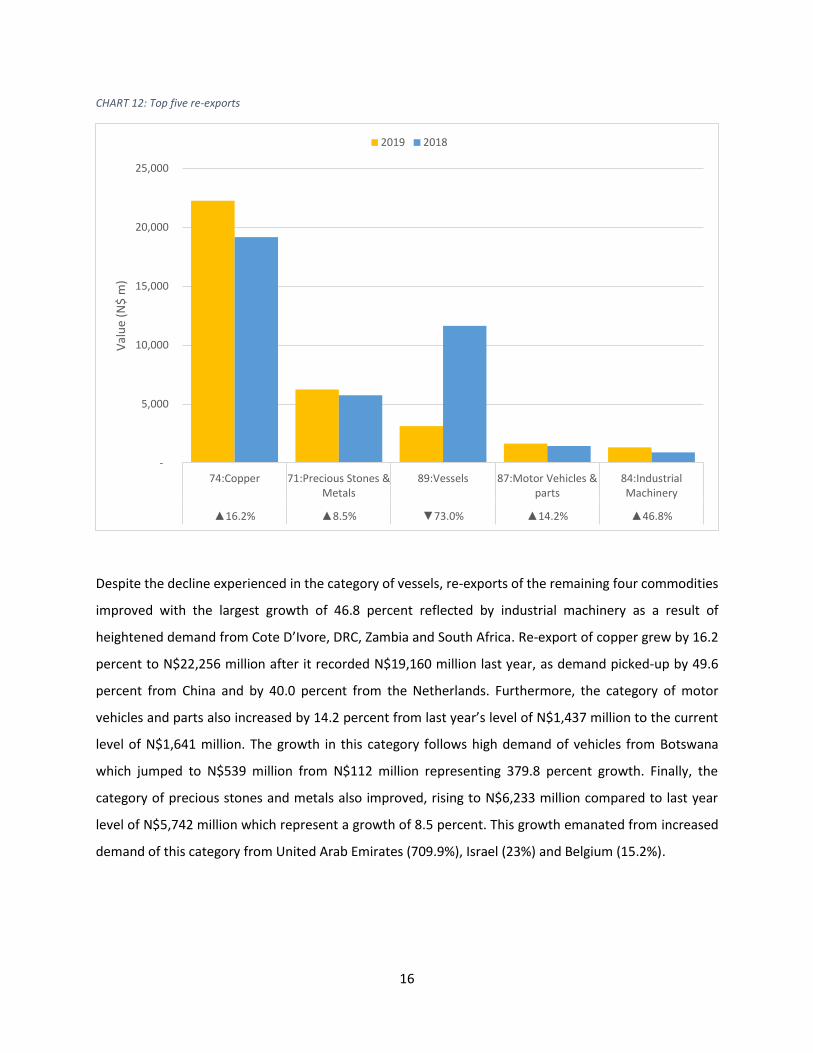
CHART 12: Top five re-exports
Despite the decline experienced in the category of vessels, re-exports of the remaining four commodities
improved with the largest growth of 46.8 percent reflected by industrial machinery as a result of
heightened demand from Cote D’Ivore, DRC, Zambia and South Africa. Re-export of copper grew by 16.2
percent to N$22,256 million after it recorded N$19,160 million last year, as demand picked-up by 49.6
percent from China and by 40.0 percent from the Netherlands. Furthermore, the category of motor
vehicles and parts also increased by 14.2 percent from last year’s level of N$1,437 million to the current
level of N$1,641 million. The growth in this category follows high demand of vehicles from Botswana
which jumped to N$539 million from N$112 million representing 379.8 percent growth. Finally, the
category of precious stones and metals also improved, rising to N$6,233 million compared to last year
level of N$5,742 million which represent a growth of 8.5 percent. This growth emanated from increased
demand of this category from United Arab Emirates (709.9%), Israel (23%) and Belgium (15.2%).
-
5,000
10,000
15,000
20,000
25,000
74:Copper 71:Precious Stones &Metals
89:Vessels 87:Motor Vehicles &parts
84:IndustrialMachinery
▲16.2% ▲8.5% ▼73.0% ▲14.2% ▲46.8%
Val
ue
(N$
m)
2019 2018

17
3.7. Top import products
Namibia’s commodity composition of imports remained pretty much the same as last year in the period
under review. In 2019, Namibia’s top five commodities that were imported were copper, oils and mineral
fuels; motor vehicles and parts, industrial machinery and metal ores (Chart 13). Among these
commodities, copper accounted for the largest share of total imports (16.5%) reflecting an increase of
19.5 percent from its 2018 level of 13.9 percent. Followed by the category of oils and mineral fuels at 12.3
percent, an increase from its 2018 level of 10.5 percent. Motor vehicles and parts maintained its 2017
rate of 7.2 percent. On the other hand, industrial machinery accounted for 7.2 percent of the total imports
into the country with just a slight decrease of 0.2 percentage point. Finally, the contribution of ores to
total imports was recorded at 7.0 percent higher than its last year contribution of 4.4 percent.
The value of imports for these commodities combined rose to N$55,776 million compared to its previous
year level of N$48,114 million subsequently rising their combined contribution to total imports from 43.5
percent last year to the current share of 50.1 percent.

18
CHART 13: Top five imports
The improved growth from the top five imported commodities was mainly pronounced in the value of
ores which rose by 59.3 percent to N$7,768 million compared to N$4,877 million recorded in the
preceding year. This is mainly due to domestic demand of this commodity from Chile (661.2%), Bulgaria
(30.7%) and Peru (22%). Small amounts of ores also came from Zambia (2.6%) and South Africa (2.5%).
Next was copper with a growth of 19.5 percent to N$18,380 million from N$15,384 million in the
preceding year. Increased demand of copper was met by strong supply of this commodity from DRC
(1138.3%) and Zambia (9.5%). Additionally, oils and mineral fuels claimed third place in terms of growth
(17.0%), jumping to N$13,365 million from its 2018 level of N$11,658 million while motor vehicles and
parts only grew moderately by 0.6 percent from its 2018 level of N$7,957 million to the current level of
N$8,008 million. The growth in oils and mineral fuels follows increased domestic demand of this
commodity, mostly from India (105.9%) and South Africa (34.7%). The growth experienced in motor
vehicles and parts was mostly noted from France and Japan.
Apart from the growth resulting from four out of the top five commodities, Chart 13 shows that imports
of industrial machinery declined, falling by 3.1 percent to the level of N$7,984 million compared to its
-
2,000
4,000
6,000
8,000
10,000
12,000
14,000
16,000
18,000
20,000
74:Copper 27:Oils & Mineralfuels
87:Motor Vehicles &parts
84:IndustrialMachinery
26:Ores
▲19.5% ▲17.0% ▲0.6% ▼3.1% ▲59.3%
Val
ue
(N$
m)
2019 2018

19
2018 figure of N$8,239 million, owing to weakening domestic demand for machinery sourced from China
and South Africa which dropped by 38.5 percent and 0.9 percent, respectively (Table 16). Moreover,
importation of commodities beside the top five major import commodities declined.
20
4. Trade by Economic Blocs
4.1. Exports
During the period under review, Namibia mostly exported to SACU, BRIC, the EU, SADC (excl SACU),
COMESA and EFTA (Chart 14). This group composition did not change much except for the EU that
dropped in ranking while SACU improved. SACU moved one place up to reclaim first position on the export
list from the EU as Namibia’s largest export market in 2019. Exports to SACU rose from its 2018 level of
N$24,195 million to the current N$25,133 million representing an increase of 3.9 percent. Subsequently,
SACU absorbed the largest share of the country’s export, up to 27.4 percent from 26.0 percent recorded
last year. Most of the exports to SACU were spread among two countries namely; South Africa (N$15,788
million) and Botswana (N$9,308 million).
Exports to the BRIC4 group rose to N$24,366 million after it recorded N$17,134 million last year
representing a strong growth of 42.2 percent, subsequently moving BRIC one place up to claim the second
spot on the export chart. Similarly, BRIC’s absorbed the second largest share (26.6%) of the total export,
jumping 8.2 percentage points higher than its 2018 rate of 18.4 percent. The distribution of exports to
this group was mostly skewed towards one country, China which absorbed 97.5 percent or N$23,756
million of total exports compared to its last year level of N$16,418 million while the remaining three
members combined absorbed N$610 million (2.5%).
Exports to the EU weakened during the period under review, falling from the last year level of N$20,319
million to N$28,855 million subsequently depressing its market share from its last year level of 31.0
percent of total exports to 22.1 percent. This resulted in the EU losing its last year lead as the largest
export market and moved two places down to third place. Exports to this region was clustered around six
4 BRIC in this analysis constitutes Brazil, Russia, India and China. South Africa is excluded from the group hence the name BRIC instead of “BRICS”.

21
countries (Belgium, Spain, Italy, Netherlands, France and Germany) which contributed a combined share
of 46.8 percent of all exports to the EU. Meanwhile, the latest downturn in exports to the EU came from
France (43.6%), Italy (28.1%) and Belgium (26.3%).
CHART 14: Export composition by regional grouping
Next was the SADC (excl SACU) region which remain steady in fourth position on the export chart as last
year, absorbing N$8,515 million of total exports, after recording N$7,047 million a year ago representing
an increase of 20.8 percent (Chart 14). Additionally, the contribution of this region to the country’s overall
exports stood at 9.3 percent up from its 2018 level of 7.6 percent. Zambia, DRC and Mauritius were the
largest contributors to the country’s total exports to that market, with respective market shares of 41.9
percent, 32.3 percent and 10.8 percent. Zambia’s share declined from its 2018 level of 49.8 percent while
DRC and Mauritius’s share improved from their last year levels of 29.5 percent and 0.3 percent
respectively.
In 2019, COMESA absorbed 8.4 percent of the Namibia’s total exports, up from its last year rate of 6.5
percent, as exports to this region rose by 28.2 percent from its 2018 amount of N$6,035 million to the
-
5,000
10,000
15,000
20,000
25,000
30,000
35,000
SACU BRIC EU SADC (excl SACU) COMESA EFTA
▲3.9% ▲42.2% ▼29.6% ▲20.8% ▲28.2% ▼61.1%
Val
ue(
N$
m)
2019 2018

22
current amount of N$7,735 million. Meanwhile, exports to EFTA dropped by 61.1 percent from its level
of N$928 million last year compared to the current N$361 million, subsequently impacting its market
share which dropped to 0.4 percent from its last year level of 1 percent.
4.2. Imports
Namibia’s imports by bloc mirror that of its exports and was mostly comprised of the following regions:
SACU, COMESA, SADC (excl SACU), EU, BRIC, and EFTA as shown in Chart 15. SACU remained at the top of
the list as the country’s largest source of imports, albeit imports from SACU weakened, falling by N$653
million (1.2%) from its last year level of N$54,195 million to the current value of N$53,542 million.
However, SACU’s contribution to the country’s total import remained strong at 48.1 percent, a contraction
from its 2018 rate of 49.0 percent (Table 12). South Africa and Botswana had the largest market shares in
Namibia’s total imports from SACU, with 94.1 percent and 5.2 percent of imports, respectively. South
Africa’s share improved from its 2018 level of 91.1 percent while that of Botswana dropped from 8.3
percent last year. Moreover, most of the contraction in imports from SACU was reflected in Botswana
(38.4%) and Lesotho (52.3%).

23
CHART 15: Import composition by regional grouping
COMESA moved up one place to claim the second position on the import chart following increased
domestic demand for commodities from this market which rose by 14.8 percent (N$2,553 million) from
2018 level of N$17,230 million to the current level of N$19,783 million. Subsequently, the share of imports
from this region followed suit, increasing by 2.2 percentage points to 17.8 percent from its last year rate
of 15.6 percent. Zambia is by far the largest contributor to the country’s share of imports from COMESA,
with 87.4 percent of total imports into Namibia coming from Zambia, down from its 2018 level of 91.1
percent. Next was DRC which accounted for a mere 9.1 percent of imports from COMESA.
The SADC (excl SACU) region was ranked third, moving down one place on the import chart. Despite its
ranking, import from this region grew, rising to its current level of N$19,586 million from its level of
N$17,349 million last year representing an increase of 12.9 percent. Furthermore, Namibia absorbed 17.6
percent of its overall requirements from this region up from its 2018 level of 15.7 percent. Zambia had
the largest share of imports from the SADC (excl SACU), with 88.3 percent of imports from that group of
countries coming from Zambia alone, but it showed a decline of 2.2 percentage points from its last year
level of 90.5 percent. DRC contributed 9.2 percent of total imports from SADC (excl SACU), it improved
from its 2018 level of 0.8 percent.
-
10,000
20,000
30,000
40,000
50,000
60,000
SACU COMESA SADC (excl SACU) EU BRIC EFTA
▼1.2% ▲14.8% ▲12.9% ▲8.9% ▼6.3% ▲248.5%
Val
ue(
N$
)
2019 2018

24
Imports from the EU rose by 8.9 percent to N$11,732 million from its last year level of N$10,776 million,
moving the EU one place up the import chart. Subsequently, the share of imports from this region
improved from its 2018 rate of 9.7 percent to 10.5 percent. Imports from the EU were mostly sourced
from Bulgaria (30.5%), Germany (10.9%), Italy (10.8%) and UK (8.8%) while Spain and the Netherlands
each accounted for 8.3 percent of total imports from the EU. The share of imports from Bulgaria, Germany,
Italy and the Netherlands showed an increase from their last year levels of 25.4 percent, 10.5 percent, 4.4
percent, 4.1 percent whereas from Spain and UK, the shares declined from last year’s levels of 13 percent
and 24.7 percent, respectively.
The BRIC and EFTA also played their role in supporting Namibia’s import requirements. During the period
under review, imports from the BRIC market contracted by 6.3%, falling to N$8,336 million after
registering N$8,894 million last year, bringing the share of imports from this region down from its 2018
level of 8 percent to 7.5 percent. On the other hand, imports from the EFTA group of countries rose by
248.5% to N$1,903 million compared to its 2018 level of N$546 million. Subsequently, leading to a higher
share of 1.7 percent of imports compared to last year rate of 0.5 percent. The share of imports from the
BRIC region was mainly concentrated between two countries namely; China (53.6%) and India (39.3%).

25
5. Trade by mode of transport
The mode of transport here refers to the means of transporting goods in and out of Namibia.
5.1. Exports
In 2019, Namibia saw large amounts of goods exported by means of seaborne, thus maintaining its
position as the most preferred means of transport (Chart 16). Year on year, goods exported by seaborne
lost momentum in 2019 to register N$51,083 million, this figure showed a contraction of 7.3 percent when
compared to an amount of N$55,124 million recorded in the previous year. The seaborne exports mostly
composed of minerals (copper 43.5% and uranium ores 24.1%) and 14.1 percent of fish.
Airborne exports showed a slight improvement of 0.6 percent to register N$21,228 million after it
recorded N$21,091 million a year earlier, hence reclaiming its second position as the most used means of
transporting exports out of the country. The share of airborne exports to total exports rose from its 2018
level of 22.6 percent to 23.1 percent (Table 13) mostly as a result of precious stones and metals that
constituted the lion’s share (96.8%) of airborne exports.
CHART 16: Export composition by transport mode
51,083
21,228 20,597
55,124
21,091 22,365
-
10,000
20,000
30,000
40,000
50,000
60,000
Sea Air Road
▼7.3% ▲0.6% ▼7.9%
Val
ue(
N$
m)
2019 2018

26
Further, the road bound exports recorded the poorest growth, with the total value of road bound exports
contracting by 7.9 percent to register N$20,597 million from its 2018 level of N$22,365 million, as a result,
the share of road bound exports followed suit, dropping by 1.6 percentage points to 22.4 percent from its
last year level of 24.0 percent. Fish had the largest share in road bound exports with 12.8 percent followed
by live animals (10.3%), vehicles and parts (7.3%) and beverages (6.8%).
5.2. Imports
The majority of commodities imported into Namibia were road bound (Chart 17), hence the value of road
bound imports gained a bit of momentum, rising by 0.5 percent to register N$70,475 million after it
recorded N$70,129 million in the preceding year. Further, the share of road bound imports slowed slightly,
from its 2018 level of 63.4 percent to its current rate of 63.3 percent (Table 14). Copper was the largest
contributor to road bound import accounting for 26.1 percent of total imports, it was followed by
machinery (industrial and electrical) at 11.9 percent and vehicles and parts at 9.8 percent.
CHART 17: Import composition by transport mode
Sea transport was also critical in the country’s imports after it ranked second from road, but this rate
decreased in 2019 as shown in Chart 17, falling by 9.3 percent from its 2018 level of N$39,761 million to
70,475
36,077
4,935
70,129
39,761
5,350
-
10,000
20,000
30,000
40,000
50,000
60,000
70,000
80,000
Road Sea Air
▲0.5% ▼9.3% ▼7.8%
Val
ue(
N$
m)
2019 2018

27
N$36,077 million. Moreover, the share of seaborne imports deteriorated from its last year level of 35.9
percent to the current rate of 32.4 percent. Mineral fuel and oils had the largest share in seaborne imports
with 34.2 percent followed by ores (copper) at 20.1 percent.
The value of airborne imports amounted to N$4,935 million in 2019 compared to its previous year level
of N$5,350 million which translates to a decline of 7.8 percent (Chart 17). Airborne imports contributed
the least share to total imports with only 4.4 percent down from its 2018 level of 4.8 percent. Similar to
exports, precious stones and metals appears to be the largest contributor to airborne imports.

28
6. Conclusion
During the period of review, Namibia’s overall trade (total of exports and imports) amounted to
N$203,019 million. Exports stood at N$91,766 million, down by 1.5 percent (N$1,358 million) from its
previous level whereas imports were at N$111,253 million, up by 0.6 percent (N$633 million) from 2018.
Thus, Namibia’s trade balance with the rest of the world amounted to a deficit of N$19,487 million in
2019, widening by a further 11.4 percent compared to its 2018 level of N$17,496 million.
Namibia’s top export products (2-digit HS) in 2019 were copper (N$23,633 million), precious stones and
metal (N$20,571 million); ores (N$12,899 million), fish (N$10,034 million) and vessels (N$3,140 million).
On the supply side, the imports were mostly composed of the following products copper (N$18,380
million), oils and mineral fuels (N$13,635 million), motor vehicles and parts (N$8,008 million), industrial
machinery (N$7,984 million) as well as ores (N$7,768 million).
Namibia’s leading export market in 2019 was China (N$23,756 million), South Africa (N$15,788 million),
Botswana (N$9,308 million), Belgium (N$6,879 million), and Spain (N$4,495 million). These countries
absorbed a combined 65.6 percent of the value of all commodities exported by Namibia, down from its
2018 level of 57.8 percent. In terms of imports the domestic economy heavily relied on South Africa
(N$50,379 million), Zambia (N$17,296 million), China (N$4,471 million), Bulgaria (N$3,576 million) and
India (N$3,275 million) for about 71 percent of its total import needs compared to 68.8 percent last year.
In terms of the regional groupings, the country’s export composition was distributed to the following
regions: SACU (27.4%), BRIC (26.6%), EU (22.1%), SADC (excl SACU) (9.3%) and COMESA (8.4%). The
composition of imports was as follows SACU at 48.1 percent followed by COMESA (17.8%), SADC (excl
SACU) (17.6%), the EU (10.5%) and BRIC (7.5%).
Majority of commodities exported by Namibia in 2019 used seaborne as mode of transport which had the
largest share (55.7%) in exports ahead of airborne and road bound whose contribution stood at 23.1
percent and 22.4 percent respectively. By contrast, road bound transport had the largest share in imports,
accounting for a staggering 63.3 percent of total imports into Namibia while seaborne and airborne
accounted for 32.4 percent and 4.4 percent respectively.
29
List of Terms and Definitions Cost Insurance and freight (CIF): The transaction value of the goods, the value of services
performed to deliver goods to the border of the exporting
country and the value of the services performed to deliver the
goods from the border of the exporting country to the border of
the importing country.
Export Processing Zone (EPZ): An Export Processing Zone (EPZ) is a Customs area where one is
allowed to import machinery, equipment and material for the
manufacture of export goods under security, without payment of
duty. The imported goods are subject to customs control at
importation, through the manufacturing process, to the time of
sale/export, or duty payment for home consumption.
Free on board (FOB): The transaction value of the goods and the value of services
performed to deliver goods to the border of the exporting
country
Re-export: The export of foreign goods previously imported from the ROW
Trade Balance: The commercial balance or net exports (sometimes symbolized
as NX), is the difference between the monetary value of exports
and imports of output in an economy over a certain period.
Trade Deficit: Is an economic measure of a negative trade balance in which a
country's imports exceeds its exports.
Trade Surplus: Is an economic measure of a positive trade balance in which a
country's exports exceeds its imports.

30
Acronyms USA United States of America
UAE United Arab Emirates
CIF Cost Insurance and Freight
FOB Free on Board
BRIC Brazil, Russia, India and China
COMESA Common Market for Eastern and Southern Africa
DRC Democratic Republic of Congo
EAC East African Community
EFTA European Free Trade Association
EPZ Export Processing Zone
EU European Union
SACU Southern African Customs Union
SADC Southern African Development Community
HS Harmonized Commodity Description and Coding System